Embed Size (px)
DESCRIPTION
1. MECKLENBURG COUNTY PARK AND RECREATION DEPARTMENT 2-YEAR CAPITAL IMPROVEMENT PROGRAM PRIORITIES . Citizen’s Capital Budget Advisory Committee Presentation - PowerPoint PPT Presentation
Citation preview
MECKLENBURG COUNTY PARK AND RECREATION DEPARTMENT
2-YEAR CAPITAL IMPROVEMENT PROGRAM PRIORITIES
Citizen’s Capital Budget Advisory Committee Presentation February 21, 2007
James R. Garges W. Lee Jones, AIA Director Capital Planning Services Park and Recreation Dept. Park and Recreation Dept.
1
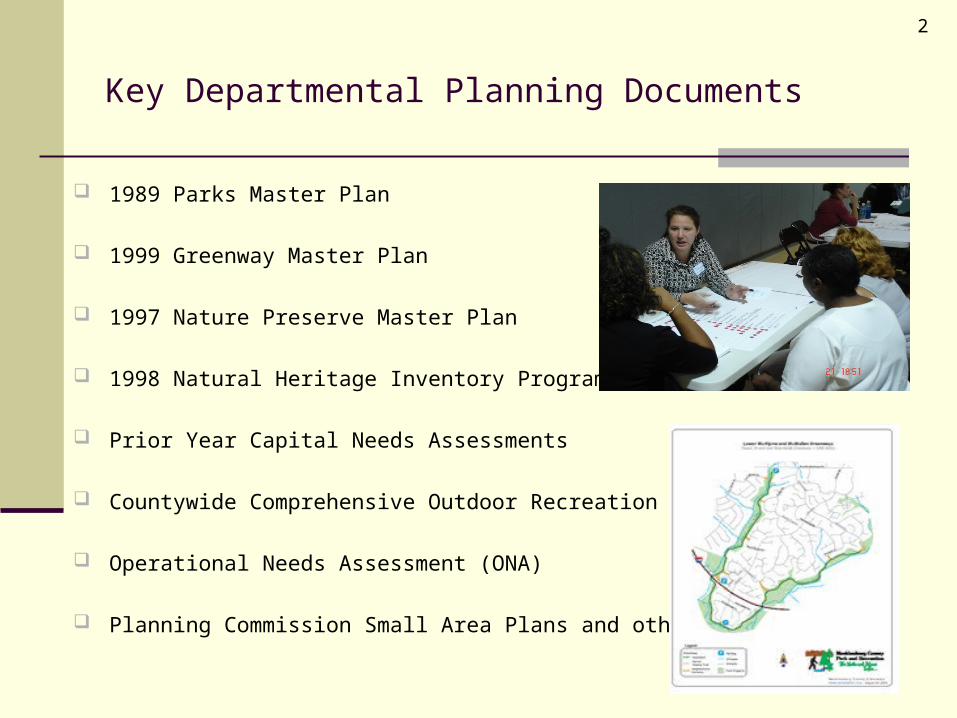
Key Departmental Planning Documents
1989 Parks Master Plan
1999 Greenway Master Plan
1997 Nature Preserve Master Plan
1998 Natural Heritage Inventory Program
Prior Year Capital Needs Assessments
Countywide Comprehensive Outdoor Recreation Plan (CCORP)
Operational Needs Assessment (ONA)
Planning Commission Small Area Plans and other references
2
2006 County-wide Comprehensive Outdoor Recreation Plan (CCORP) Conclusions
2006 Deficit: 7,866 acres of “developed” amenities
2015 Deficit: 10,957 acres of “developed” amenities
The County currently has a deficit of every outdoor recreational amenity. Since demand for outdoor recreation amenities is inextricably linked to population, no action will result in these deficits being significantly larger in 2015.
Parkland in Meck. Co. = 5.1% of all land, compared to the national average of 8.8% for cities of similar size and density.
3
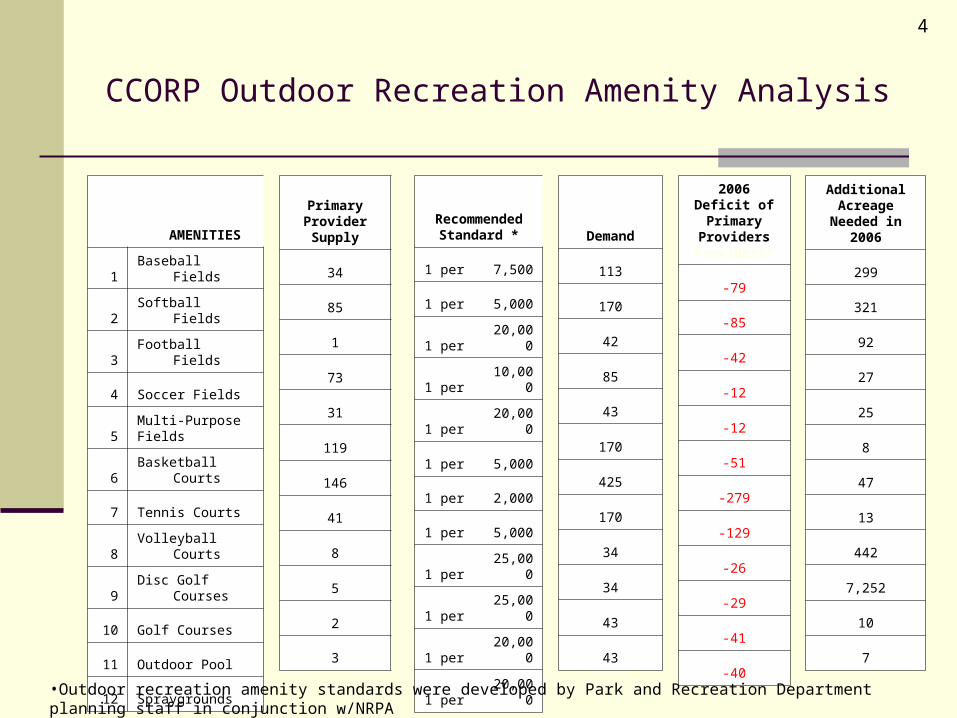
CCORP Outdoor Recreation Amenity Analysis
AMENITIES
1 Baseball Fields
2 Softball Fields
3 Football Fields
4 Soccer Fields
5Multi-PurposeFields
6 Basketball Courts
7 Tennis Courts
8 Volleyball Courts
9 Disc Golf Courses
10 Golf Courses
11 Outdoor Pool
12 Spraygrounds
PrimaryProviderSupply
34
85
1
73
31
119
146
41
8
5
2
3
RecommendedStandard *
1 per 7,500
1 per 5,000
1 per 20,000
1 per 10,000
1 per 20,000
1 per 5,000
1 per 2,000
1 per 5,000
1 per 25,000
1 per 25,000
1 per 20,000
1 per 20,000
Demand
113
170
42
85
43
170
425
170
34
34
43
43
2006 Deficit of Primary
Providers Providers*
-79
-85
-42
-12
-12
-51
-279
-129
-26
-29
-41
-40
Additional Acreage
Needed in 2006
299
321
92
27
25
8
47
13
442
7,252
10
7
4
•Outdoor recreation amenity standards were developed by Park and Recreation Department planning staff in conjunction w/NRPA •and NCSU-Rec. Resources Services recommendations. They do not include nature preserve or greenway facilities/amenities.
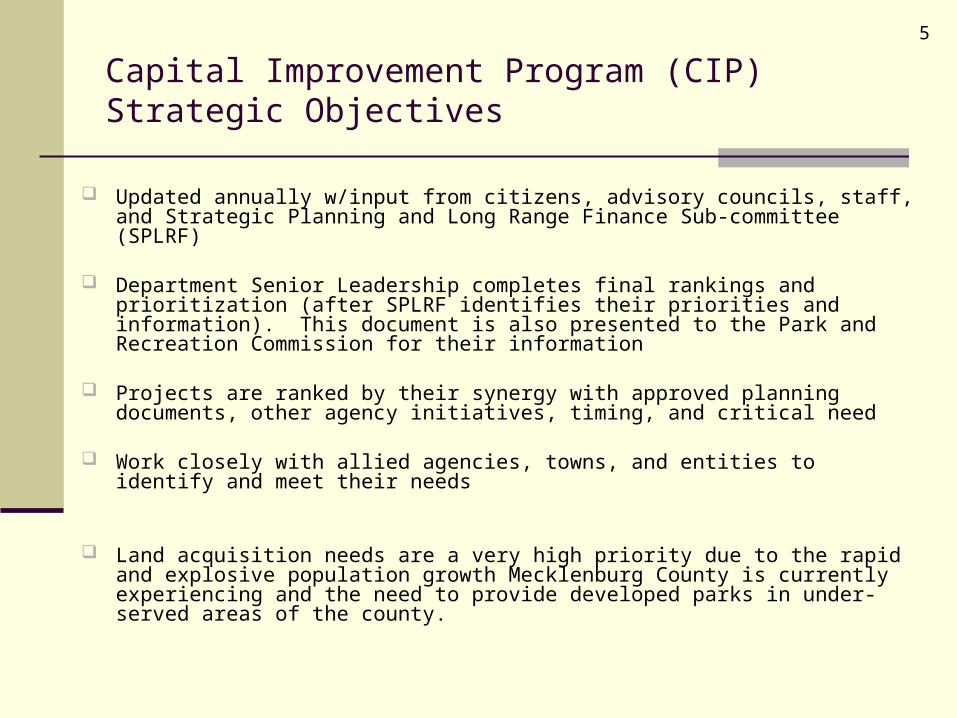
Capital Improvement Program (CIP)Strategic Objectives
Updated annually w/input from citizens, advisory councils, staff, and Strategic Planning and Long Range Finance Sub-committee (SPLRF)
Department Senior Leadership completes final rankings and prioritization (after SPLRF identifies their priorities and information). This document is also presented to the Park and Recreation Commission for their information
Projects are ranked by their synergy with approved planning documents, other agency initiatives, timing, and critical need
Work closely with allied agencies, towns, and entities to identify and meet their needs
Land acquisition needs are a very high priority due to the rapid and explosive population growth Mecklenburg County is currently experiencing and the need to provide developed parks in under-served areas of the county.
5
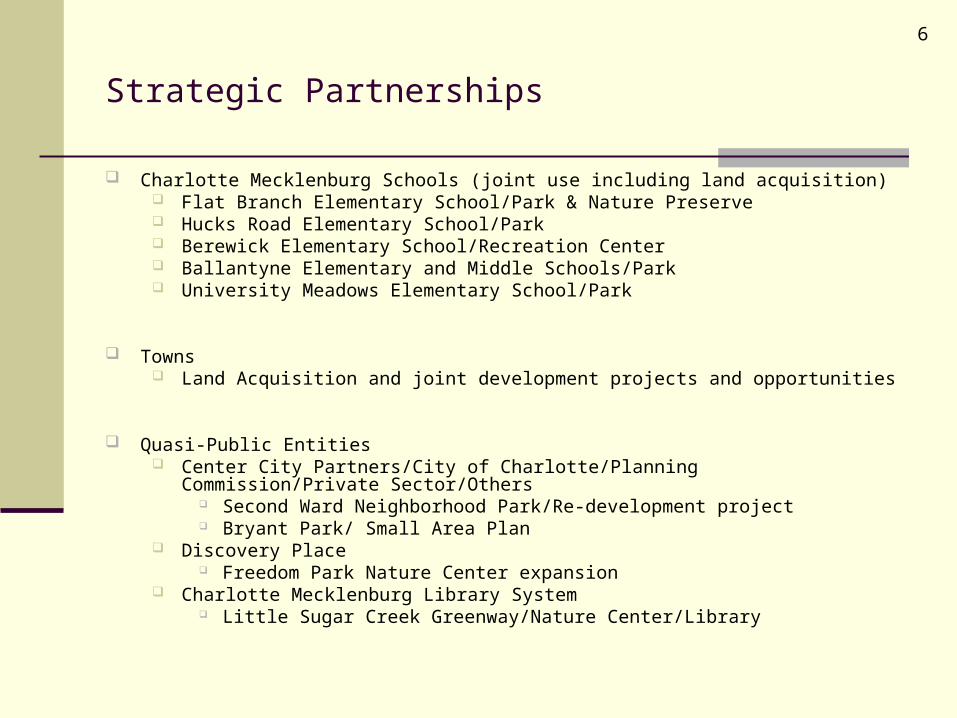
Strategic Partnerships
Charlotte Mecklenburg Schools (joint use including land acquisition) Flat Branch Elementary School/Park & Nature Preserve Hucks Road Elementary School/Park Berewick Elementary School/Recreation Center Ballantyne Elementary and Middle Schools/Park University Meadows Elementary School/Park
Towns Land Acquisition and joint development projects and opportunities
Quasi-Public Entities Center City Partners/City of Charlotte/Planning Commission/Private Sector/Others
Second Ward Neighborhood Park/Re-development project Bryant Park/ Small Area Plan
Discovery Place Freedom Park Nature Center expansion
Charlotte Mecklenburg Library System Little Sugar Creek Greenway/Nature Center/Library
6
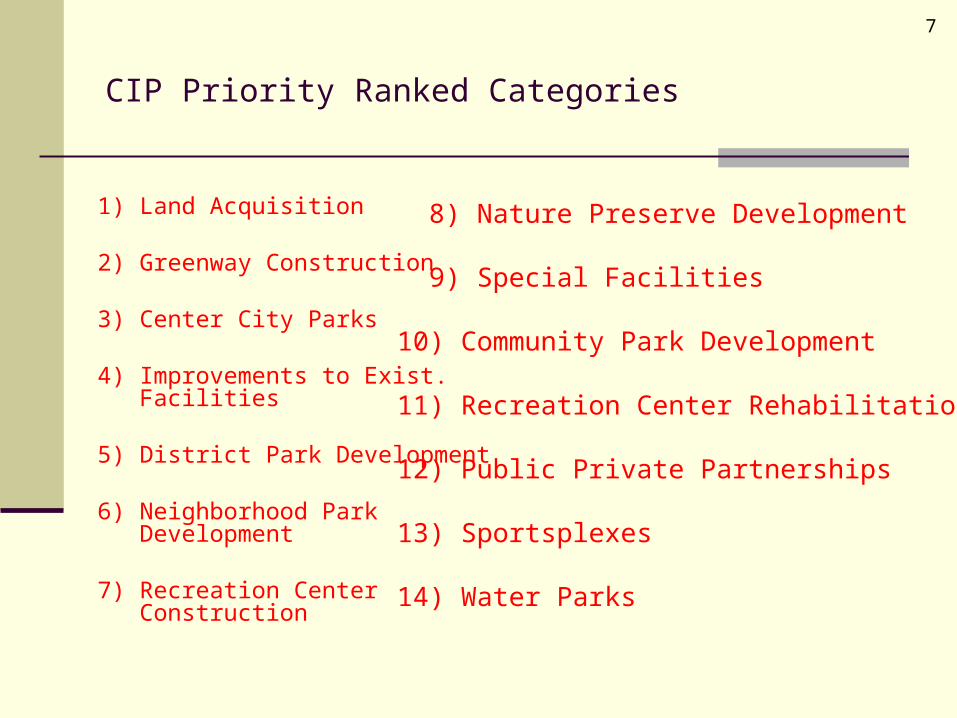
CIP Priority Ranked Categories
1) Land Acquisition
2) Greenway Construction
3) Center City Parks
4) Improvements to Exist. Facilities
5) District Park Development
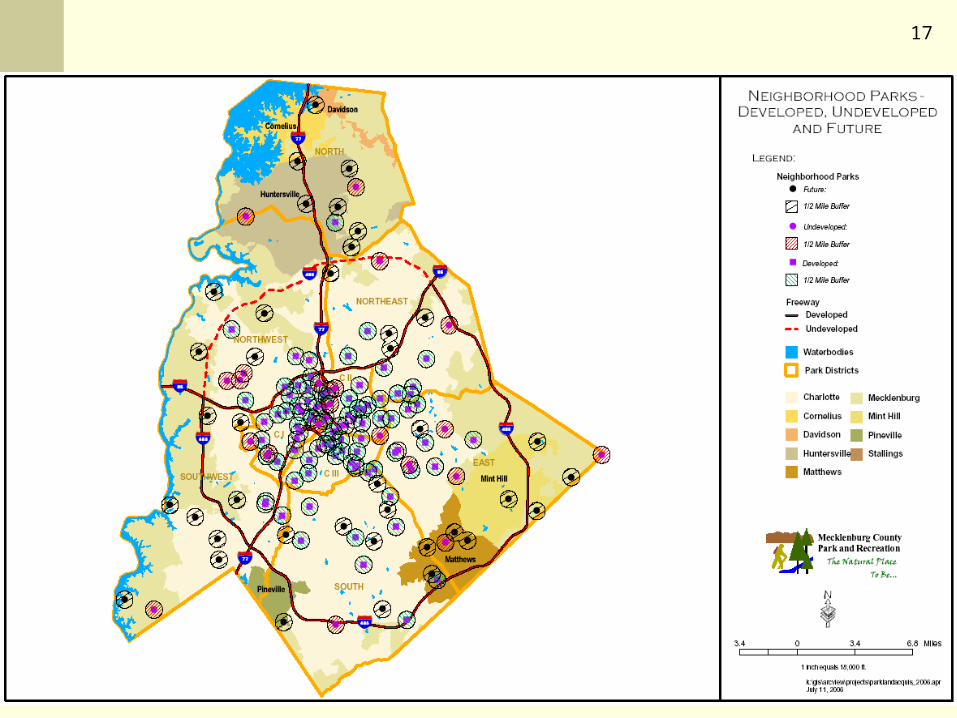
6) Neighborhood Park Development
7) Recreation Center Construction
8) Nature Preserve Development
9) Special Facilities
10) Community Park Development
11) Recreation Center Rehabilitation
12) Public Private Partnerships
13) Sportsplexes
14) Water Parks
7
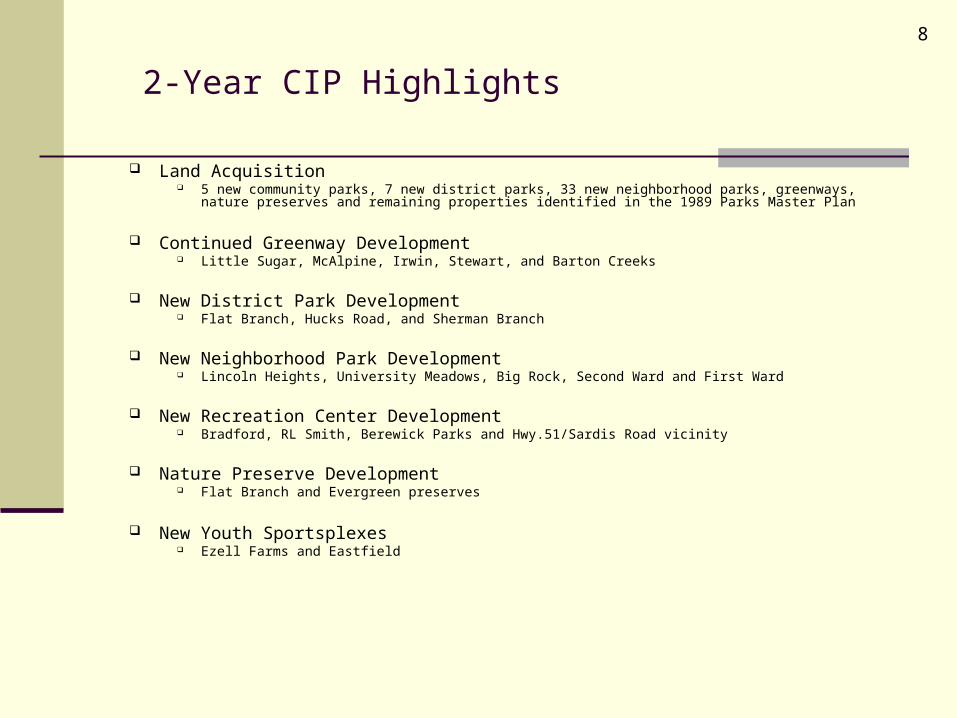
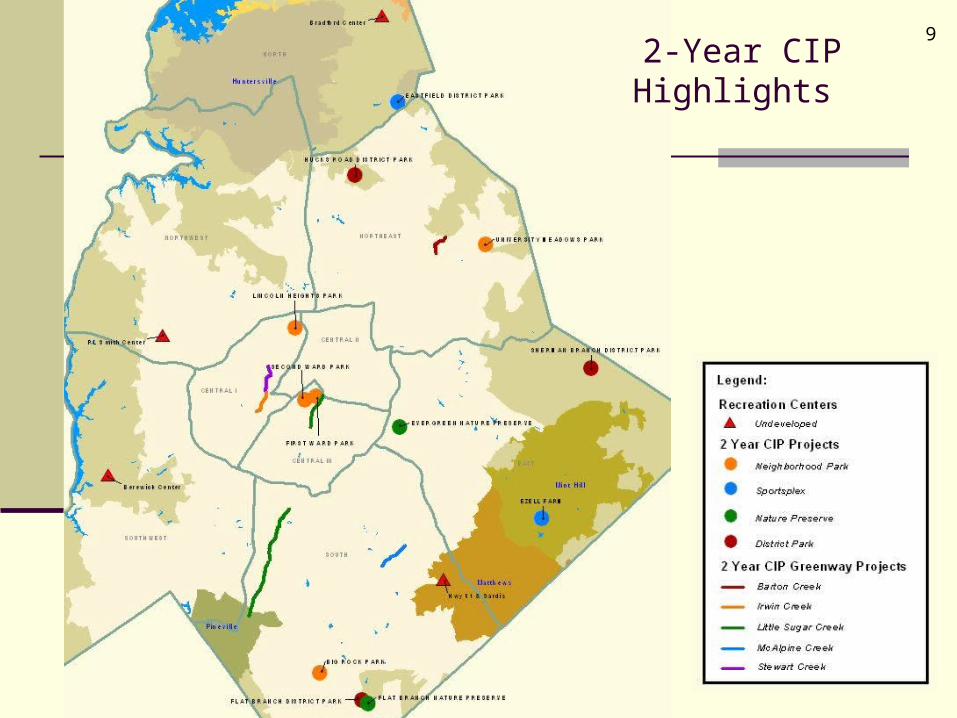
2-Year CIP Highlights
Land Acquisition 5 new community parks, 7 new district parks, 33 new neighborhood parks, greenways, nature preserves and remaining
properties identified in the 1989 Parks Master Plan
Continued Greenway Development Little Sugar, McAlpine, Irwin, Stewart, and Barton Creeks
New District Park Development Flat Branch, Hucks Road, and Sherman Branch
New Neighborhood Park Development Lincoln Heights, University Meadows, Big Rock, Second Ward and First Ward
New Recreation Center Development Bradford, RL Smith, Berewick Parks and Hwy.51/Sardis Road vicinity
Nature Preserve Development Flat Branch and Evergreen preserves
New Youth Sportsplexes Ezell Farms and Eastfield
8
9
2-Year CIP Highlights
10
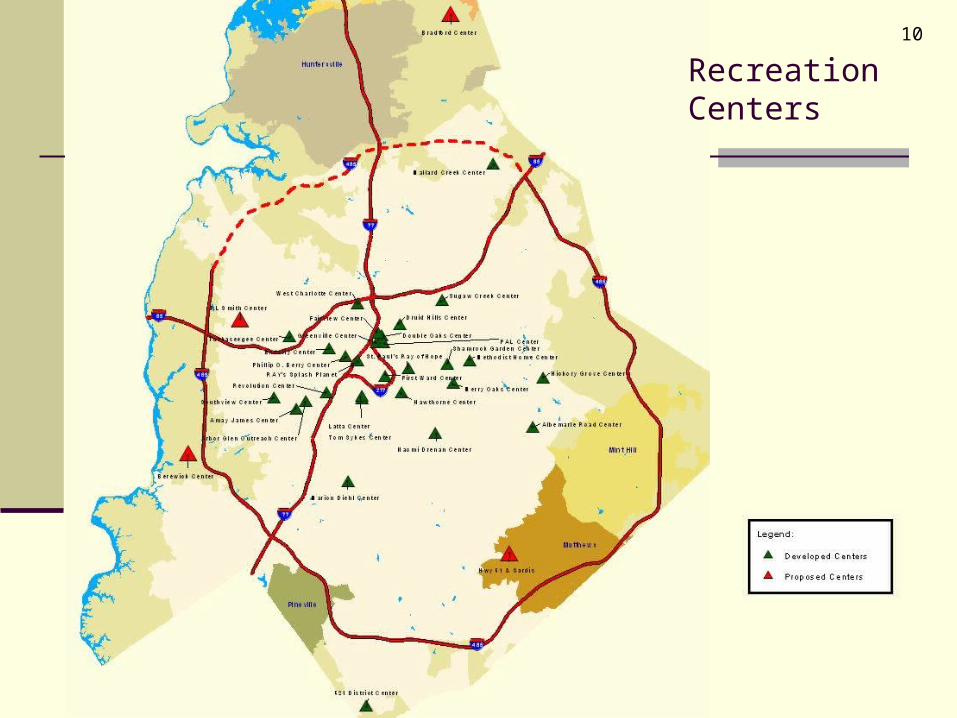
Recreation Centers
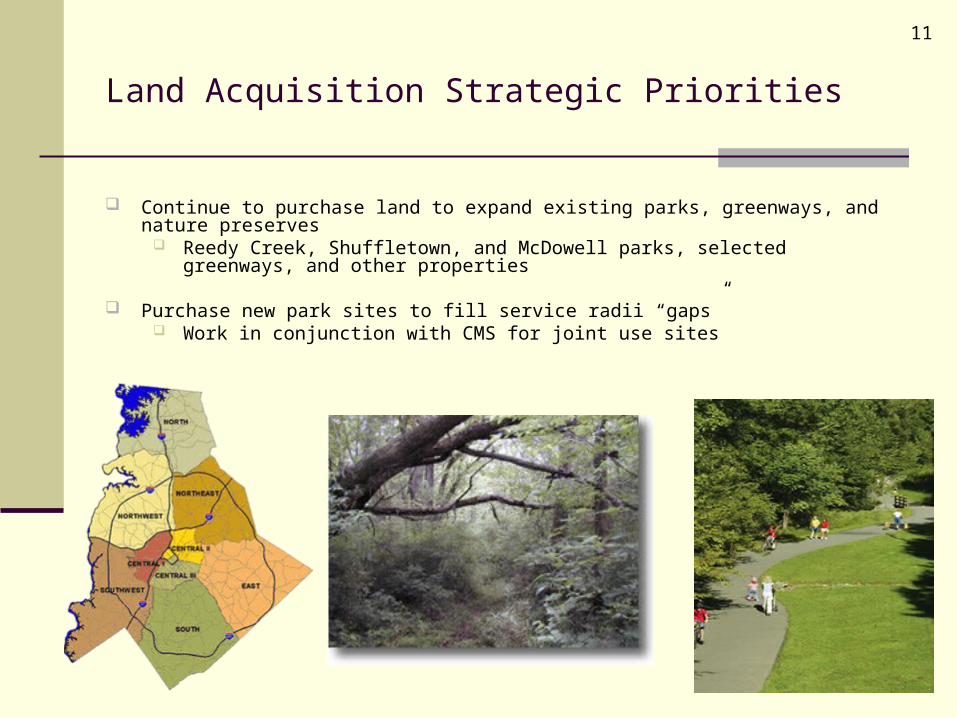
Land Acquisition Strategic Priorities
Continue to purchase land to expand existing parks, greenways, and nature preserves Reedy Creek, Shuffletown, and McDowell parks, selected greenways, and other properties
Purchase new park sites to fill service radii “gaps” Work in conjunction with CMS for joint use sites
11
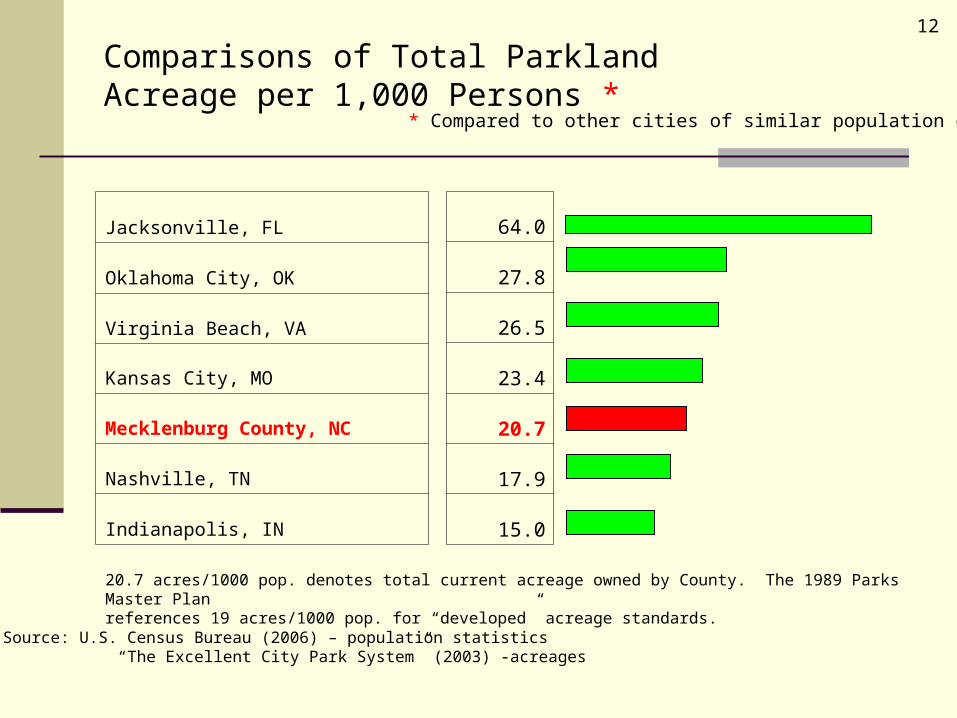
Comparisons of Total Parkland Acreage per 1,000 Persons *
Jacksonville, FL
Oklahoma City, OK
Virginia Beach, VA
Kansas City, MO
Mecklenburg County, NC
Nashville, TN
Indianapolis, IN
64.0
27.8
26.5
23.4
20.7
17.9
15.0
Source: U.S. Census Bureau (2006) – population statistics “The Excellent City Park System” (2003) -acreages
* Compared to other cities of similar population density
12
20.7 acres/1000 pop. denotes total current acreage owned by County. The 1989 Parks Master Plan references 19 acres/1000 pop. for “developed” acreage standards.
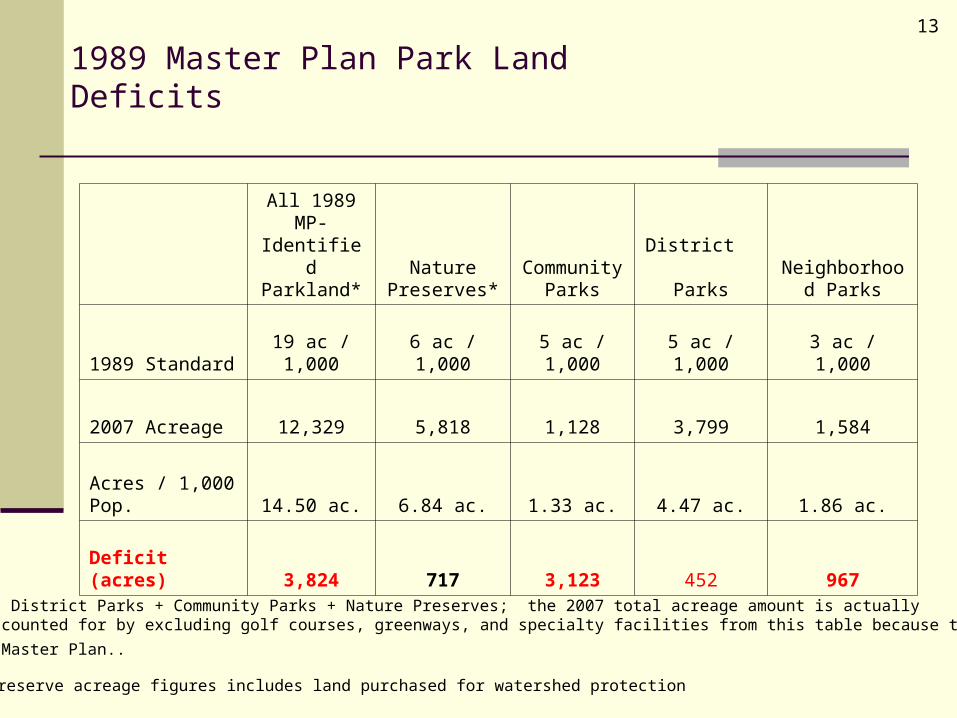
1989 Master Plan Park Land Deficits
•All Parkland = Neighborhood Parks + District Parks + Community Parks + Nature Preserves; the 2007 total acreage amount is actually 17,613 acres - the difference is accounted for by excluding golf courses, greenways, and specialty facilities from this table because they
were not denoted in the 1989 Parks Master Plan..
All 1989 MP-Identified Parkland*
Nature Preserves*
Community Parks
District Parks
Neighborhood Parks
1989 Standard 19 ac / 1,000 6 ac / 1,000 5 ac / 1,000 5 ac / 1,000 3 ac / 1,000
2007 Acreage 12,329 5,818 1,128 3,799 1,584
Acres / 1,000 Pop. 14.50 ac. 6.84 ac. 1.33 ac. 4.47 ac. 1.86 ac.
Deficit (acres) 3,824 717 3,123 452 967
13
*Nature Preserve acreage figures includes land purchased for watershed protection
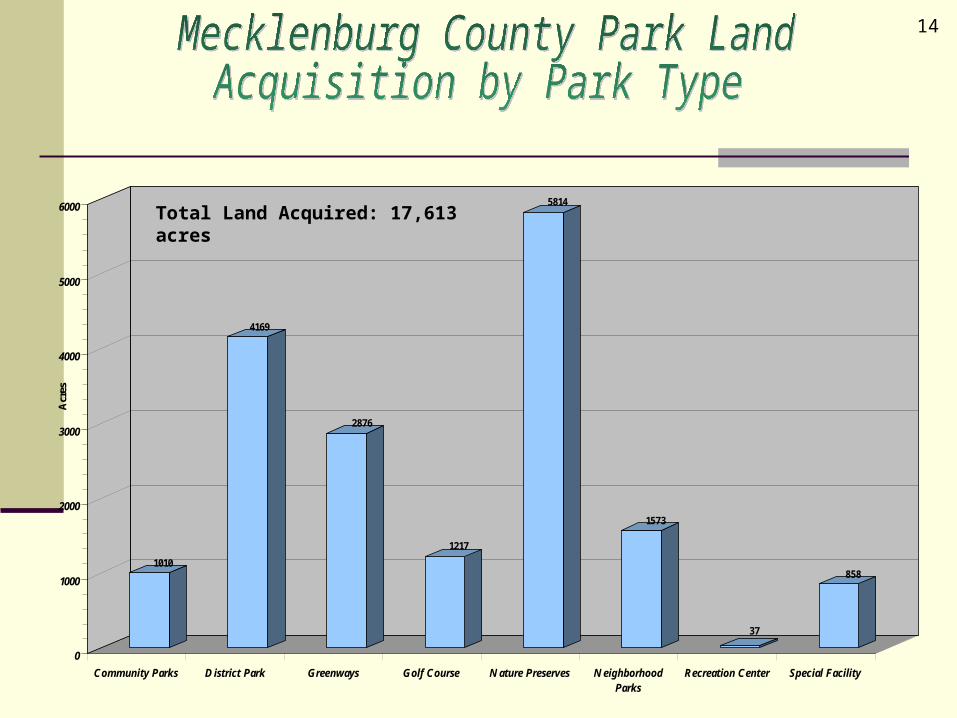
1010
4169
2876
1217
5814
1573
37
858
0
1000
2000
3000
4000
5000
6000
Acres
Community Parks District Park Greenways Golf Course Nature Preserves NeighborhoodParks
Recreation Center Special Facility
Total Land Acquired: 17,613 acres
14
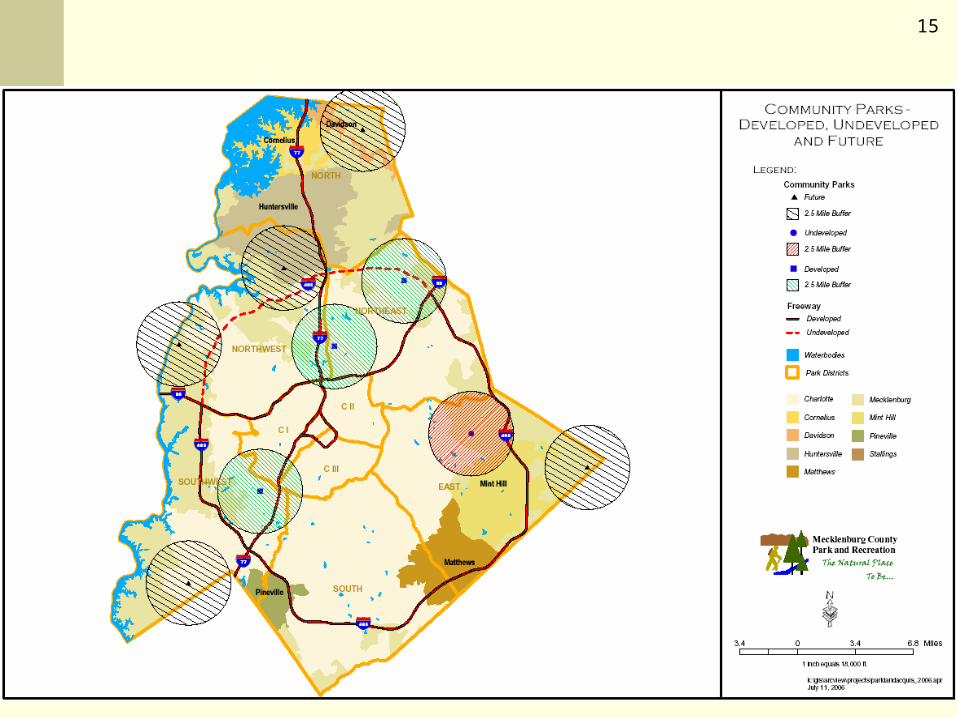
15
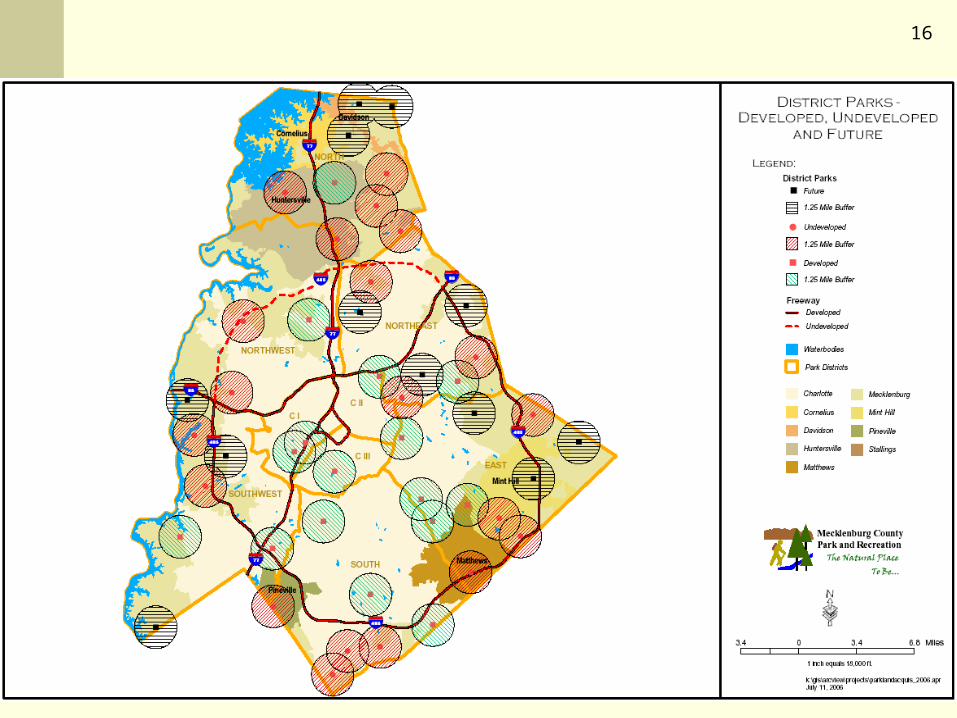
16
17
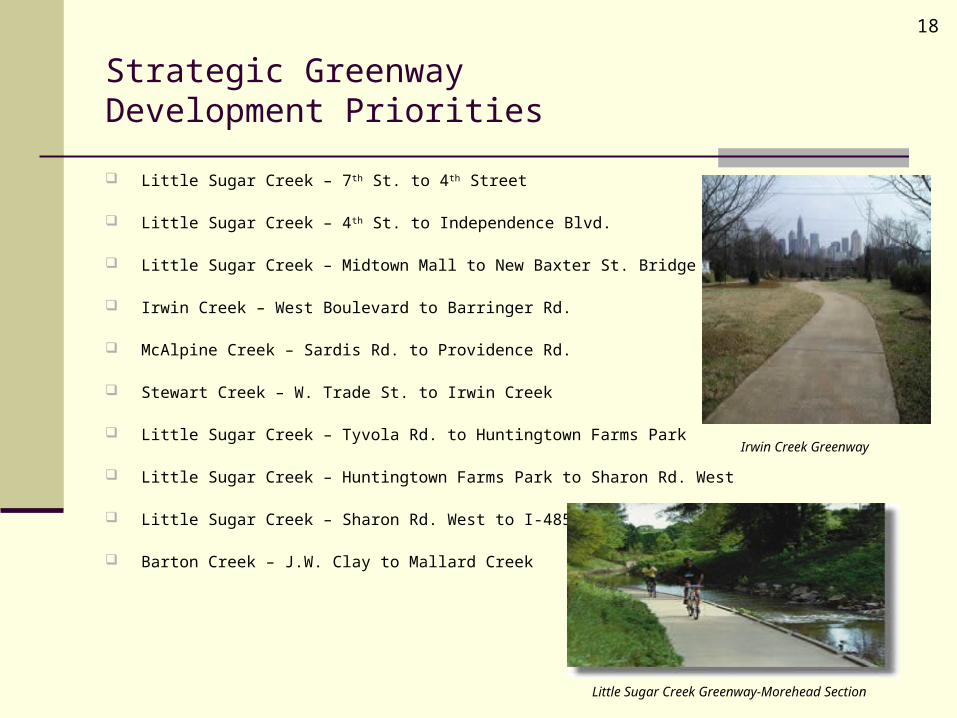
Strategic Greenway Development Priorities
Little Sugar Creek – 7th St. to 4th Street
Little Sugar Creek – 4th St. to Independence Blvd.
Little Sugar Creek – Midtown Mall to New Baxter St. Bridge
Irwin Creek – West Boulevard to Barringer Rd.
McAlpine Creek – Sardis Rd. to Providence Rd.
Stewart Creek – W. Trade St. to Irwin Creek
Little Sugar Creek – Tyvola Rd. to Huntingtown Farms Park
Little Sugar Creek – Huntingtown Farms Park to Sharon Rd. West
Little Sugar Creek – Sharon Rd. West to I-485
Barton Creek – J.W. Clay to Mallard Creek
Irwin Creek Greenway
Little Sugar Creek Greenway-Morehead Section
18
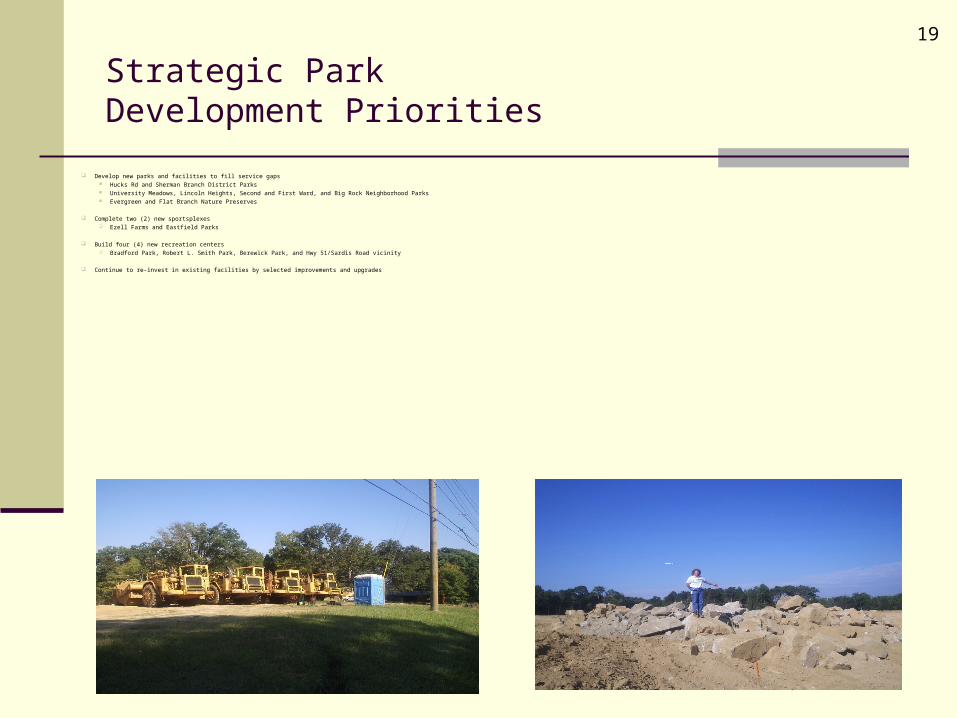
Strategic ParkDevelopment Priorities
Develop new parks and facilities to fill service gaps Hucks Rd and Sherman Branch District Parks University Meadows, Lincoln Heights, Second and First Ward, and Big Rock Neighborhood Parks Evergreen and Flat Branch Nature Preserves
Complete two (2) new sportsplexes Ezell Farms and Eastfield Parks
Build four (4) new recreation centers Bradford Park, Robert L. Smith Park, Berewick Park, and Hwy 51/Sardis Road vicinity
Continue to re-invest in existing facilities by selected improvements and upgrades
19
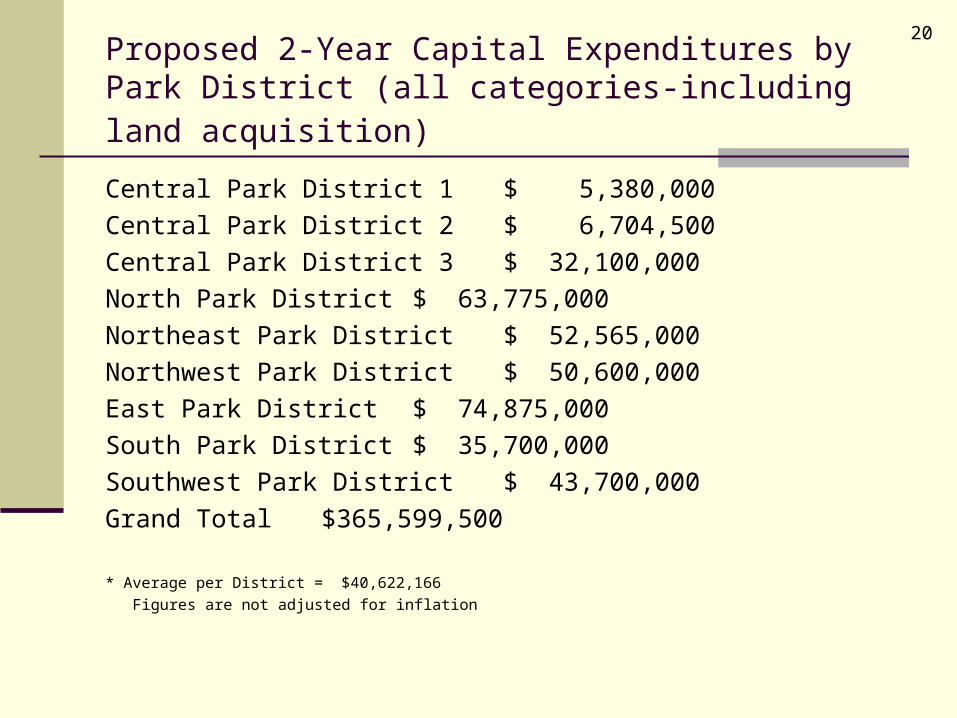
Proposed 2-Year Capital Expenditures by Park District (all categories-including land acquisition)
Central Park District 1 $ 5,380,000
Central Park District 2 $ 6,704,500
Central Park District 3 $ 32,100,000
North Park District $ 63,775,000
Northeast Park District $ 52,565,000
Northwest Park District $ 50,600,000
East Park District $ 74,875,000
South Park District $ 35,700,000
Southwest Park District $ 43,700,000
Grand Total $365,599,500
* Average per District = $40,622,166
Figures are not adjusted for inflation
20
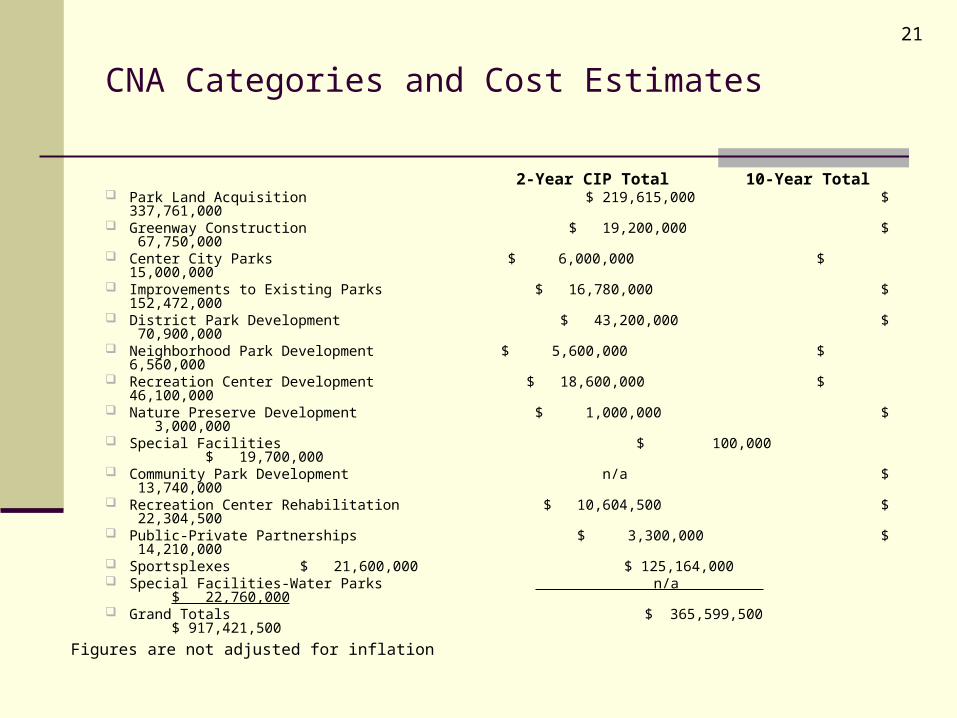
CNA Categories and Cost Estimates
2-Year CIP Total 10-Year Total Park Land Acquisition $ 219,615,000 $ 337,761,000 Greenway Construction $ 19,200,000 $ 67,750,000 Center City Parks $ 6,000,000 $ 15,000,000 Improvements to Existing Parks $ 16,780,000 $ 152,472,000 District Park Development $ 43,200,000 $ 70,900,000 Neighborhood Park Development $ 5,600,000 $ 6,560,000
Recreation Center Development $ 18,600,000 $ 46,100,000 Nature Preserve Development $ 1,000,000 $ 3,000,000 Special Facilities $ 100,000 $ 19,700,000 Community Park Development n/a $ 13,740,000
Recreation Center Rehabilitation $ 10,604,500 $ 22,304,500 Public-Private Partnerships $ 3,300,000 $ 14,210,000 Sportsplexes $ 21,600,000 $ 125,164,000 Special Facilities-Water Parks n/a $ 22,760,000 Grand Totals $ 365,599,500 $ 917,421,500
21
Figures are not adjusted for inflation
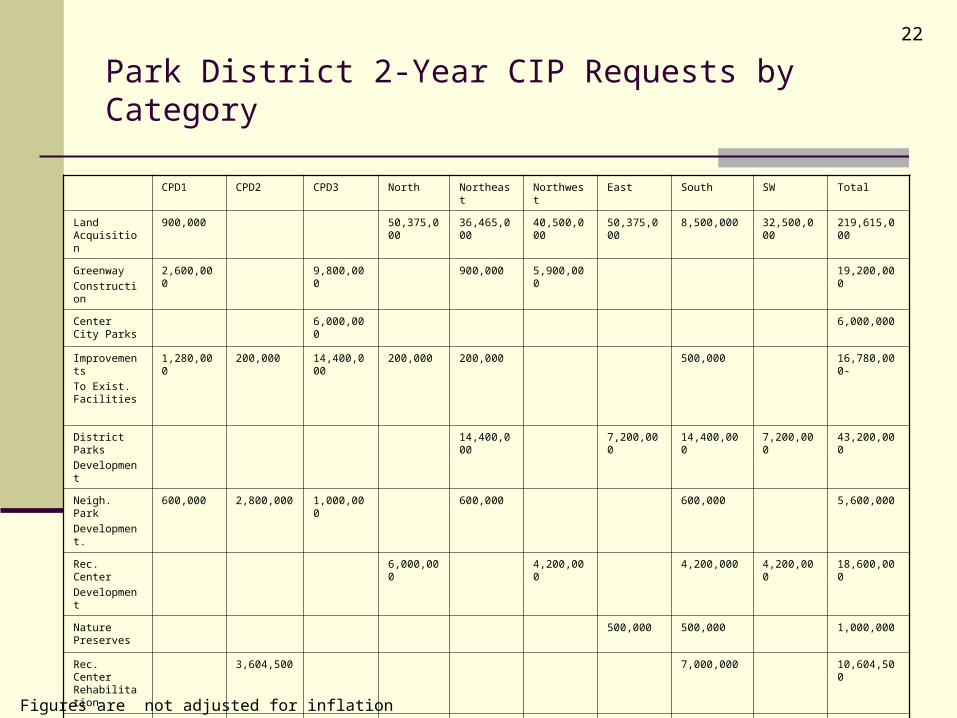
Park District 2-Year CIP Requests by Category
CPD1 CPD2 CPD3 North Northeast Northwest East South SW Total
Land Acquisition
900,000 50,375,000 36,465,000 40,500,000 50,375,000 8,500,000 32,500,000 219,615,000
Greenway
Construction
2,600,000 9,800,000 900,000 5,900,000 19,200,000
Center City Parks
6,000,000 6,000,000
Improvements
To Exist. Facilities
1,280,000 200,000 14,400,000 200,000 200,000 500,000 16,780,000-
District Parks
Development
14,400,000 7,200,000 14,400,000 7,200,000 43,200,000
Neigh. Park
Development.
600,000 2,800,000 1,000,000 600,000 600,000 5,600,000
Rec. Center
Development
6,000,000 4,200,000 4,200,000 4,200,000 18,600,000
Nature Preserves
500,000 500,000 1,000,000
Rec. Center Rehabilitation
3,604,500 7,000,000 10,604,500
Partnerships 900,000 2,400,000 3,300,000
Sportsplexes
Special Facilities 100,000
7,200,000 14,400,000 21,600,000
100,000
Totals 5,380,000 6,704,500 32,100,000 63,775,000 52,565,000 50,600,000 74,875,000 35,700,000 43,900,000 365,599,500
22
Figures are not adjusted for inflation