Embed Size (px)
Citation preview
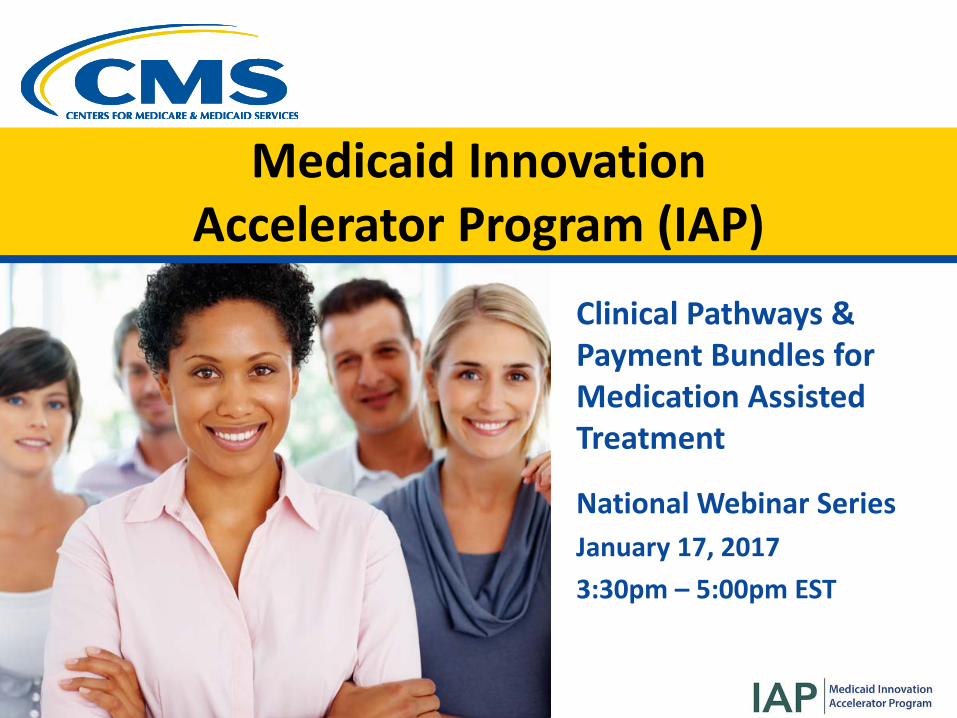
Medicaid Innovation Accelerator Program (IAP)
Clinical Pathways & Payment Bundles for Medication Assisted Treatment
National Webinar SeriesJanuary 17, 20173:30pm – 5:00pm EST
2
Logistics
• Please mute your line & do not put the line on hold • Use the chat box on your screen to ask a question or leave
comment– Note: chat box will not be seen if you are in “full screen” mode– Please also exit out of “full screen” mode to participate in
polling questions• When spreadsheets are shared “full screen” mode is recommended• Moderated Q&A will be held periodically throughout the webinar
– Please submit your questions via the chat box• Please complete the evaluation in the pop-up box after the webinar
to help us continue to improve your experience
3
Welcome and Overview
• Tyler Sadwith• Medicaid Innovation
Accelerator Program SUD Lead, Health Insurance Specialist, Disabled and Elderly Health Programs Group, CMS
4
Purpose & Learning Objectives
• States will discuss key clinical elements & planning strategies for implementing medication-assisted treatment (MAT)
• States will explore components of bundled rate models for MAT & learn how to adapt these prototypes for use
• Introduction to Clinical Pathways & Payment Bundles for MAT
• State Experience: Vermont• State Experience: Massachusetts
– Discussion Break
• In-Depth Look at Clinical Pathway & Payment Bundle Models– Discussion Break
• Wrap Up & Resources
Agenda
5
• The Medicaid Innovation Accelerator Program (IAP) is providing these clinical pathway and rate model tools as general resources to support states’ discussion and planning around MAT services and payments. The services and payment methodologies described herein are not approved or endorsed by CMS.
• For regular state plan coverage under Medicaid, each proposed service must meet the requirements of a benefit under Section 1905(a) of the Social Security Act, must set forth any limitations on amount, duration and scope of the service, describe provider qualifications and must include a reimbursement methodology. In addition, all state plan amendments must meet requirements for comparability, statewideness and free choice of provider.
Note to State Medicaid Agencies
6
7
Speaker (1/5)
• Mady Chalk, PhD, MSW• Senior Policy Advisor,
Treatment Research Institute
8
Speaker (2/5)
• John Brooklyn, MD• Assistant Professor, Family
Medicine & Psychiatry, University of Vermont, College of Medicine
• Medical Director, Chittenden Clinic; BBHS Vermont
9
Speaker (3/5)
• Anthony Folland• Clinical Services Manager and Opioid Treatment
Authority Director, Alcohol and Drug Abuse Programs, Department of Health, Vermont
10
Speaker (4/5)
• Colleen LaBelle, MSN, RN-BC CARN
• Program Director, State Office-Based Addiction Treatment. Nurse Manager, Office-Based Addiction Treatment, Boston Medical Center
11
Speaker (5/5)
• Susan Parker, CPA, MT• Executive Vice President
and Founder, Parker Dennison & Associates
12
Facilitator
• Colette Croze, MSW• Private consultant, Croze
Consulting
13
Mady Chalk, PhD, MSW, Senior Policy Advisor, Treatment Research Institute
Colette Croze, MSW, Private Consultant, CrozeConsulting
Introduction to Clinical Pathways & Payment Bundles for Medication Assisted Treatment
14
Context
• Medications have become an important component in the treatment of opioid use disorders
• A request was made by a participating state in the IAP for tools to aid in the development of bundled services & rates for MAT
• Goal: To align clinical services & waivered physicians to improve quality of care & accountability, thereby requiring a description of the clinical pathway (service components) necessary for implementation
15
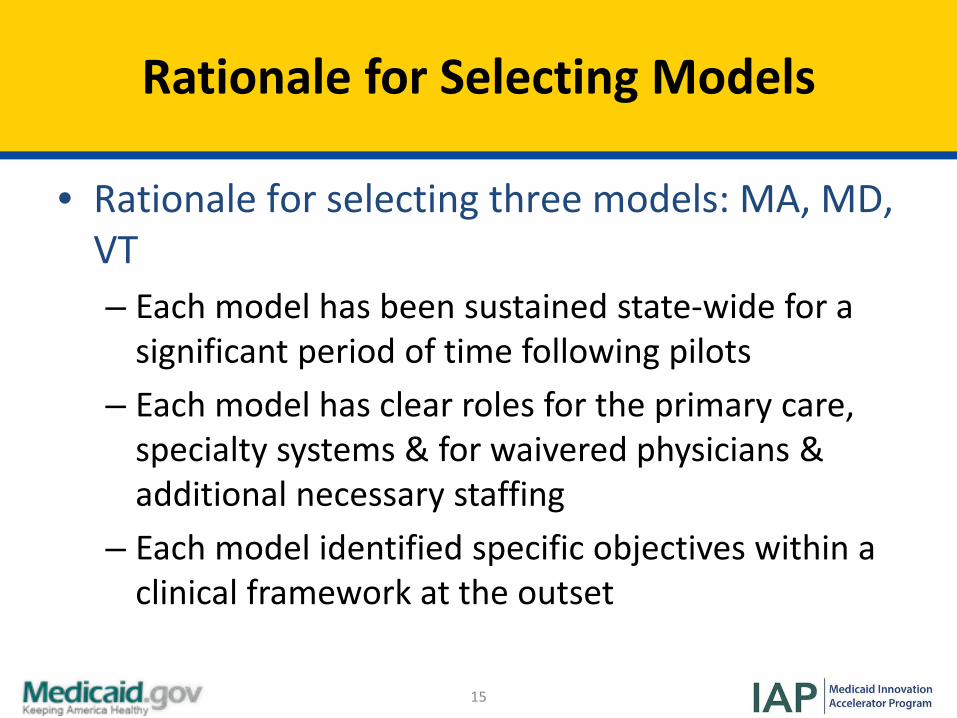
Rationale for Selecting Models
• Rationale for selecting three models: MA, MD, VT – Each model has been sustained state-wide for a
significant period of time following pilots– Each model has clear roles for the primary care,
specialty systems & for waivered physicians & additional necessary staffing
– Each model identified specific objectives within a clinical framework at the outset
16
State Experience: Vermont
John Brooklyn, MD, Assistant Professor of Family Medicine & Psychiatry, University of Vermont; Medical Director, Chittenden Clinic, BBHS Vermont
Anthony Folland, Clinical Services Manager & Opioid Treatment Authority Director, Alcohol & Drug Abuse Programs, Vermont Department of Health
17
Impetus for Developing Hub & Spoke: Policy Goals
• For beneficiaries with opioid addiction at risk of developing another SUD and with co-occurring mental health issues in opioid treatment program (OTP) & office-based opioid treatment (OBOT) settings– Improve access to addictions treatment – Integrate health & addictions care for Health Home
beneficiaries– Better use of specialty addictions programs & general
medical settings– Improve health outcomes, promote stable recovery
18
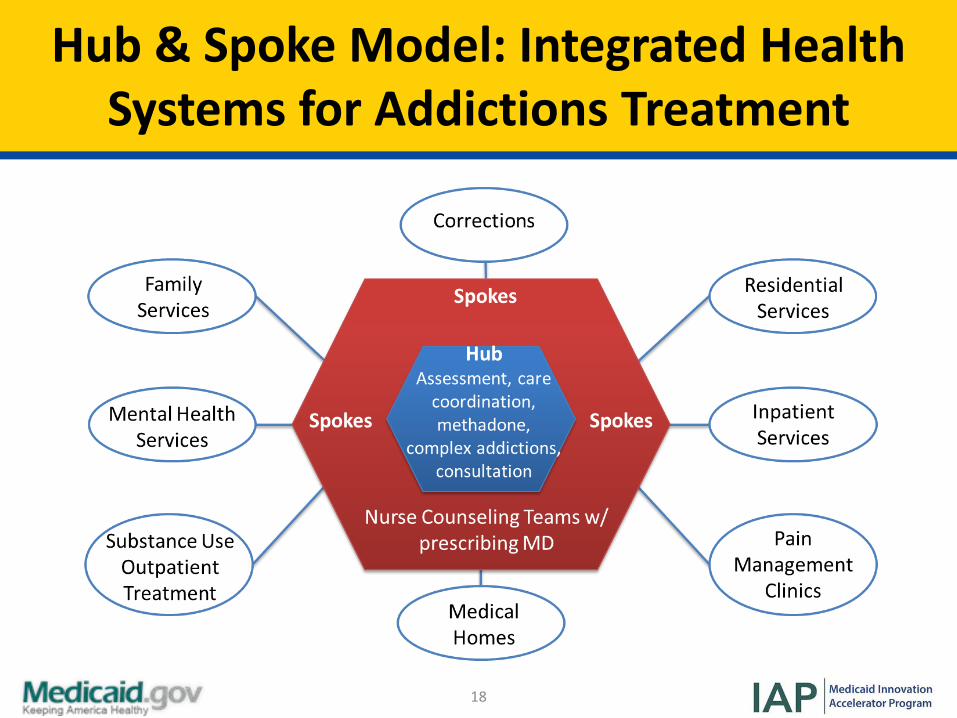
Hub & Spoke Model: Integrated Health Systems for Addictions Treatment
19
Spokes:Overview & Practice Setting
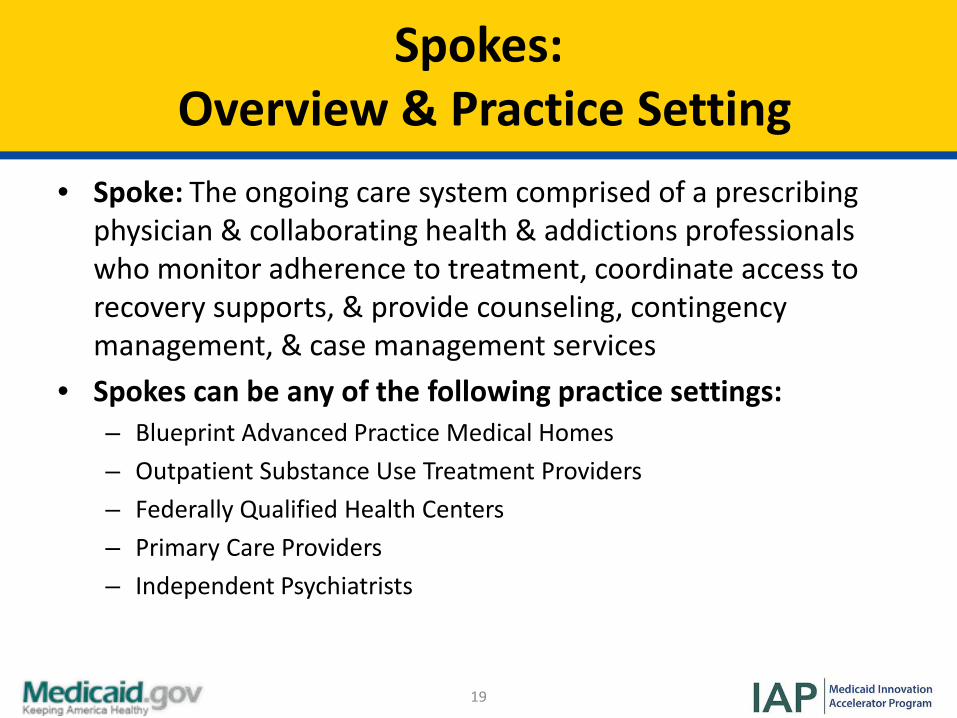
• Spoke: The ongoing care system comprised of a prescribing physician & collaborating health & addictions professionals who monitor adherence to treatment, coordinate access to recovery supports, & provide counseling, contingency management, & case management services
• Spokes can be any of the following practice settings:– Blueprint Advanced Practice Medical Homes– Outpatient Substance Use Treatment Providers– Federally Qualified Health Centers– Primary Care Providers– Independent Psychiatrists
20
Spokes:Staffing & Payment Model
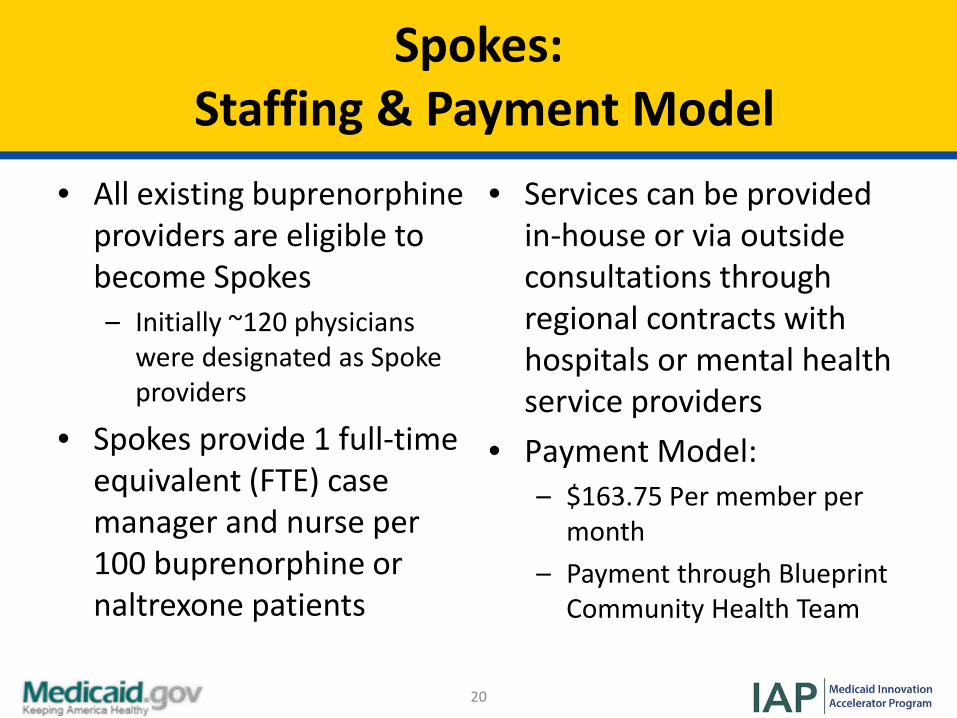
• All existing buprenorphine providers are eligible to become Spokes– Initially ~120 physicians
were designated as Spoke providers
• Spokes provide 1 full-time equivalent (FTE) case manager and nurse per 100 buprenorphine or naltrexone patients
• Services can be provided in-house or via outside consultations through regional contracts with hospitals or mental health service providers
• Payment Model:– $163.75 Per member per
month– Payment through Blueprint
Community Health Team
21
Determining Intensity of Care
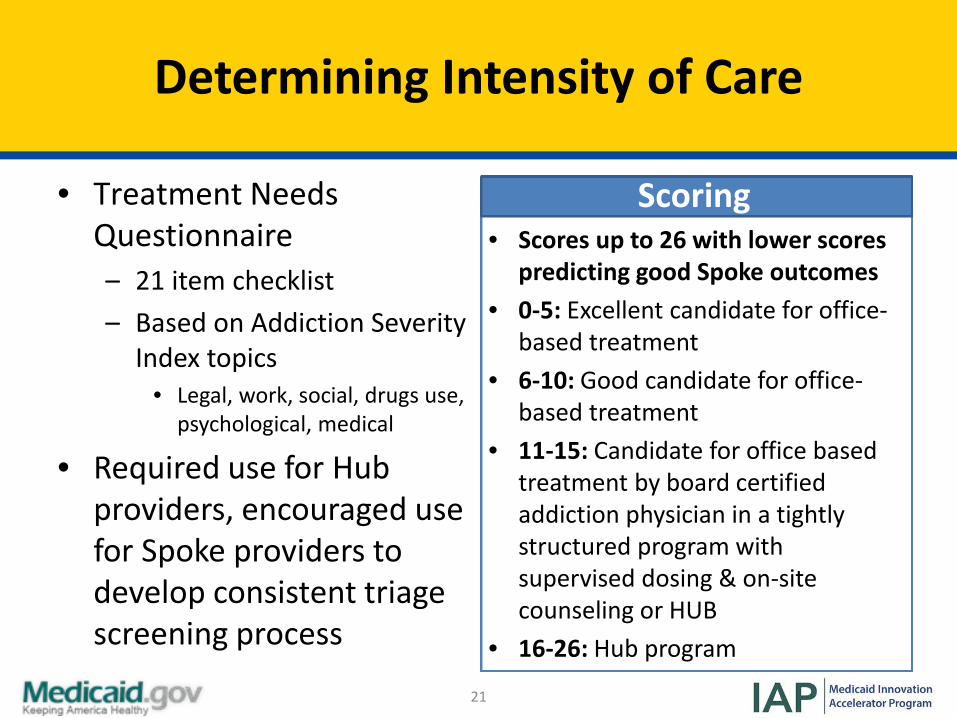
• Treatment Needs Questionnaire– 21 item checklist– Based on Addiction Severity
Index topics• Legal, work, social, drugs use,
psychological, medical
• Required use for Hub providers, encouraged use for Spoke providers to develop consistent triage screening process
Scoring• Scores up to 26 with lower scores
predicting good Spoke outcomes• 0-5: Excellent candidate for office-
based treatment• 6-10: Good candidate for office-
based treatment• 11-15: Candidate for office based
treatment by board certified addiction physician in a tightly structured program with supervised dosing & on-site counseling or HUB
• 16-26: Hub program
22
Office-Based Opioid Treatment (OBOT)Stability Index
• Developed by Dartmouth College to quickly assess stability of patients in OBOT settings
• Provides a common understanding of stability for physician practices & their teams
• Recommendations for frequency of visits are based upon patient stability– Weekly or monthly visits
23
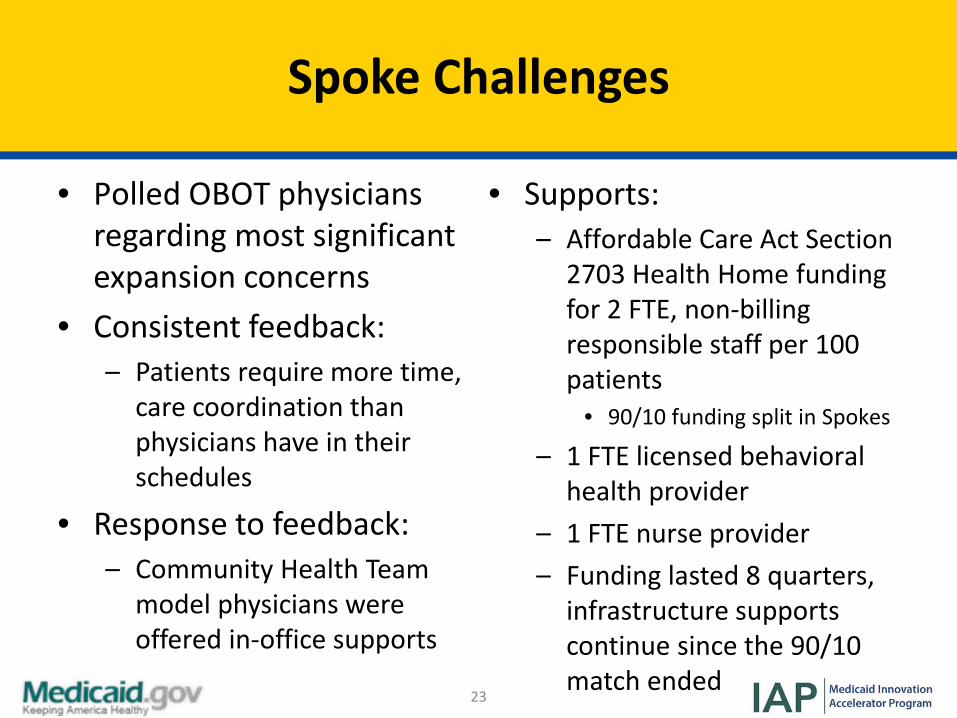
Spoke Challenges
• Polled OBOT physicians regarding most significant expansion concerns
• Consistent feedback:– Patients require more time,
care coordination than physicians have in their schedules
• Response to feedback:– Community Health Team
model physicians were offered in-office supports
• Supports:– Affordable Care Act Section
2703 Health Home funding for 2 FTE, non-billing responsible staff per 100 patients
• 90/10 funding split in Spokes
– 1 FTE licensed behavioral health provider
– 1 FTE nurse provider– Funding lasted 8 quarters,
infrastructure supports continue since the 90/10 match ended
24
Successes: Increase in Waivered Physicians
• FTE nurse & licensed behavioral health clinicians deployed to support over 80 settings
• Over 2600 Medicaid patients in OBOT providers• Increased number of physicians becoming waivered
since implementation of infrastructure MAT Team staffing– Increased numbers of physicians becoming waivered for 100
patients – Physician feedback to infrastructure supports is overwhelmingly
positive
25
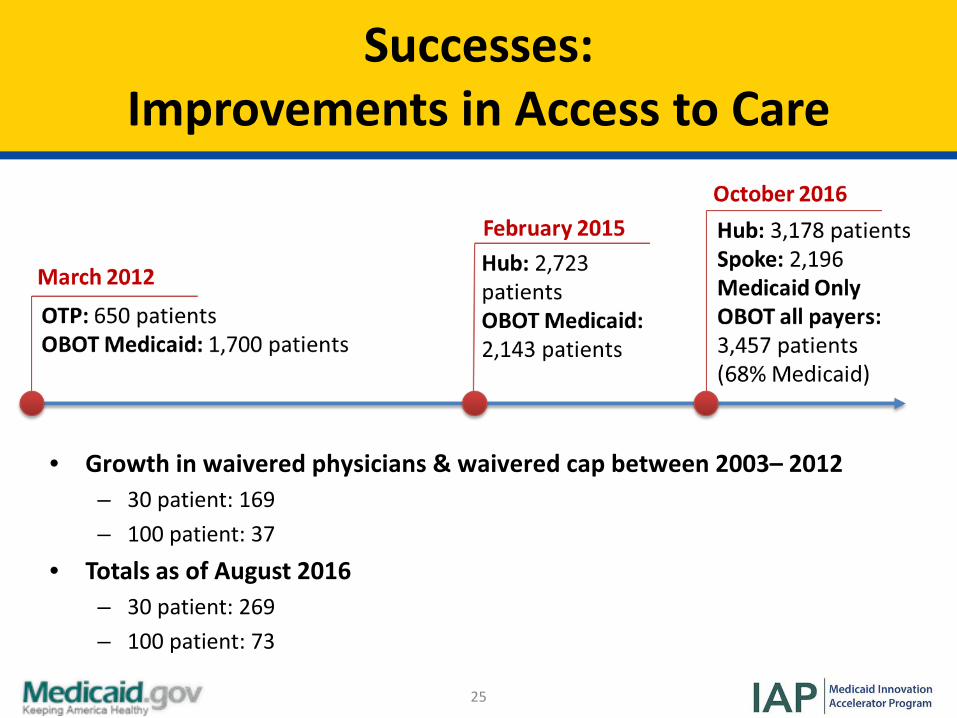
Successes: Improvements in Access to Care
• Growth in waivered physicians & waivered cap between 2003 – 2012– 30 patient: 169– 100 patient: 37
• Totals as of August 2016– 30 patient: 269– 100 patient: 73
26
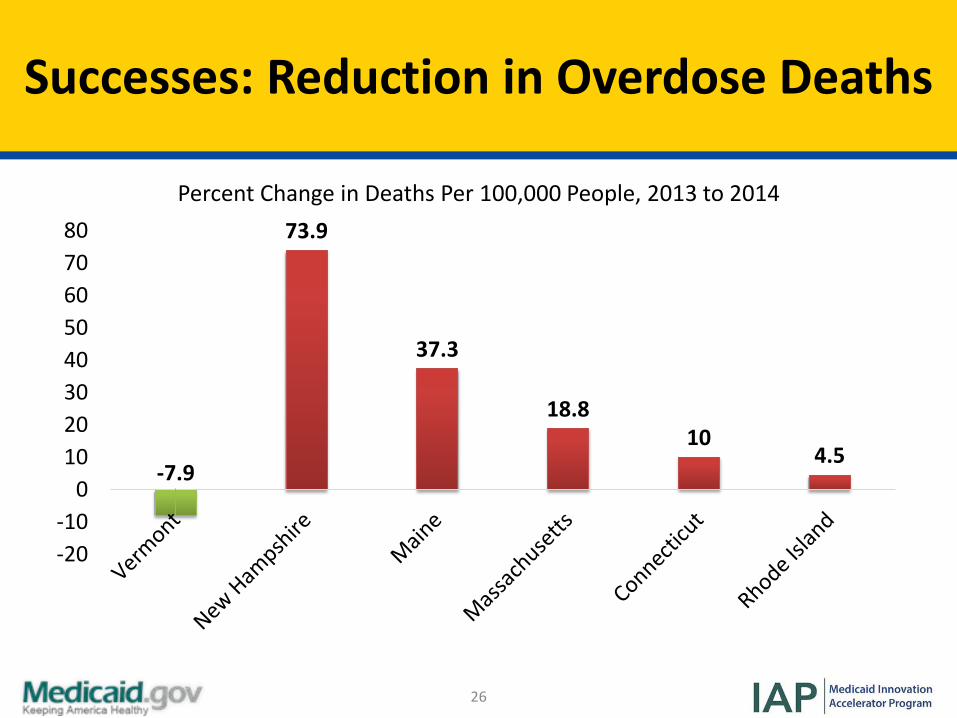
Successes: Reduction in Overdose Deaths
-7.9
73.9
37.3
18.810
4.5
-20-10
01020304050607080
Percent Change in Deaths Per 100,000 People, 2013 to 2014
27
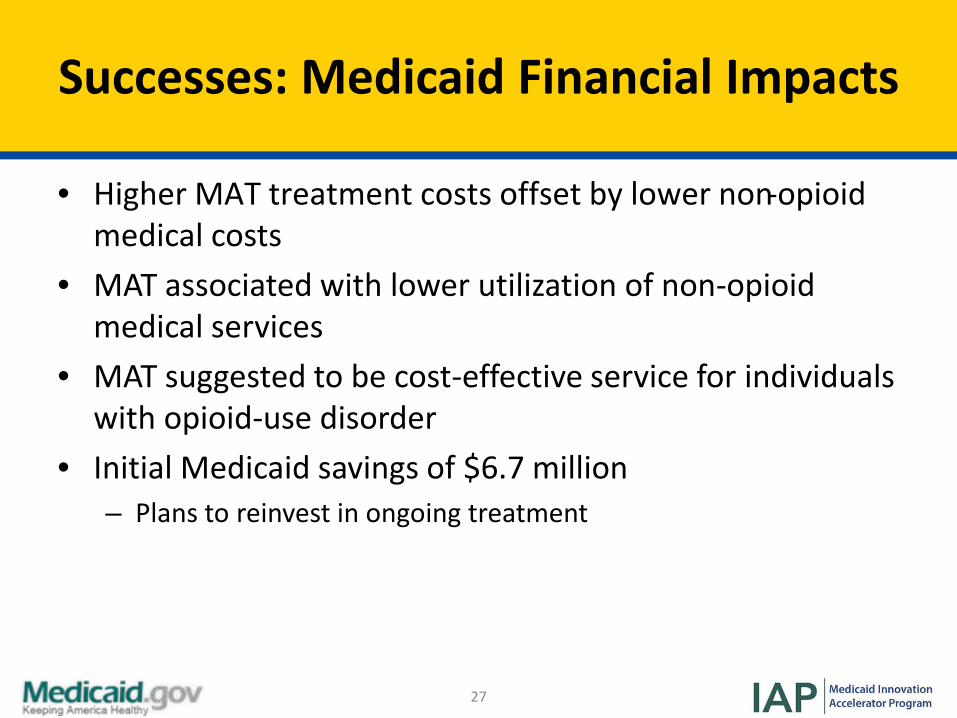
Successes: Medicaid Financial Impacts
• Higher MAT treatment costs offset by lower non-opioid medical costs
• MAT associated with lower utilization of non-opioid medical services
• MAT suggested to be cost-effective service for individuals with opioid-use disorder
• Initial Medicaid savings of $6.7 million– Plans to reinvest in ongoing treatment
28
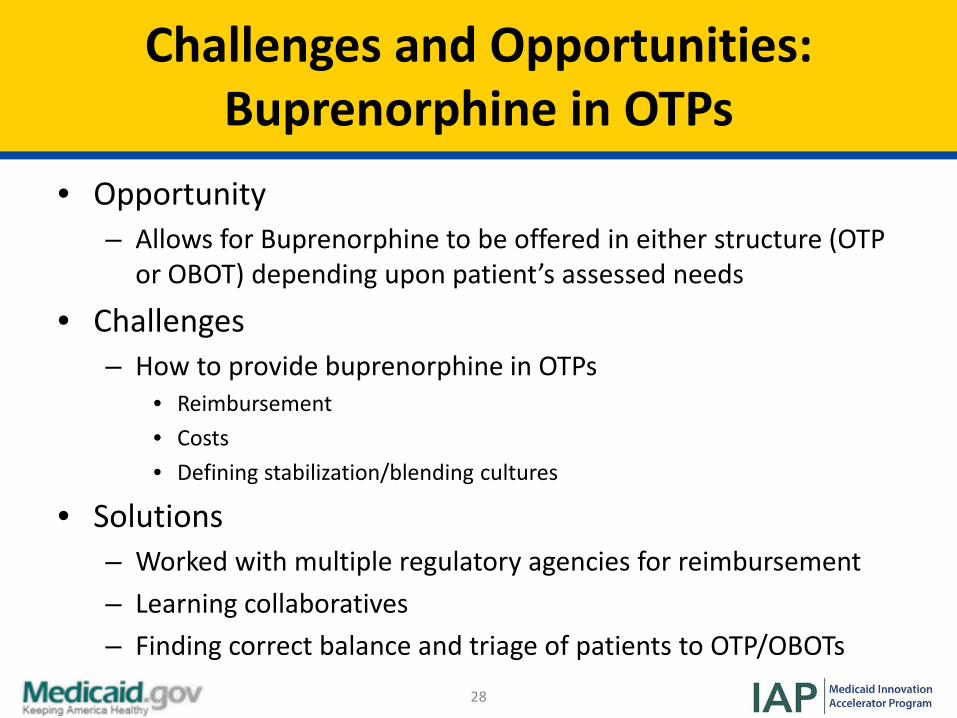
Challenges and Opportunities: Buprenorphine in OTPs
• Opportunity– Allows for Buprenorphine to be offered in either structure (OTP
or OBOT) depending upon patient’s assessed needs
• Challenges– How to provide buprenorphine in OTPs
• Reimbursement• Costs• Defining stabilization/blending cultures
• Solutions– Worked with multiple regulatory agencies for reimbursement– Learning collaboratives – Finding correct balance and triage of patients to OTP/OBOTs
29
Polling Question (1/2)
• Which of the following represents the greatest challenge to your state’s ability to increase access to MAT?– (1) Financing / reimbursement– (2) Infrastructure– (3) Number of waivered physicians– (4) Culture– (5) Not a high priority for state– (6) Other challenges
30
Colleen LaBelle, MSN, RN-BC, CARNProgram Director, State Office-Based Addiction Treatment, Nurse Manager, Boston Medical Center Office-Based Addiction Treatment
State Experience: Massachusetts
31
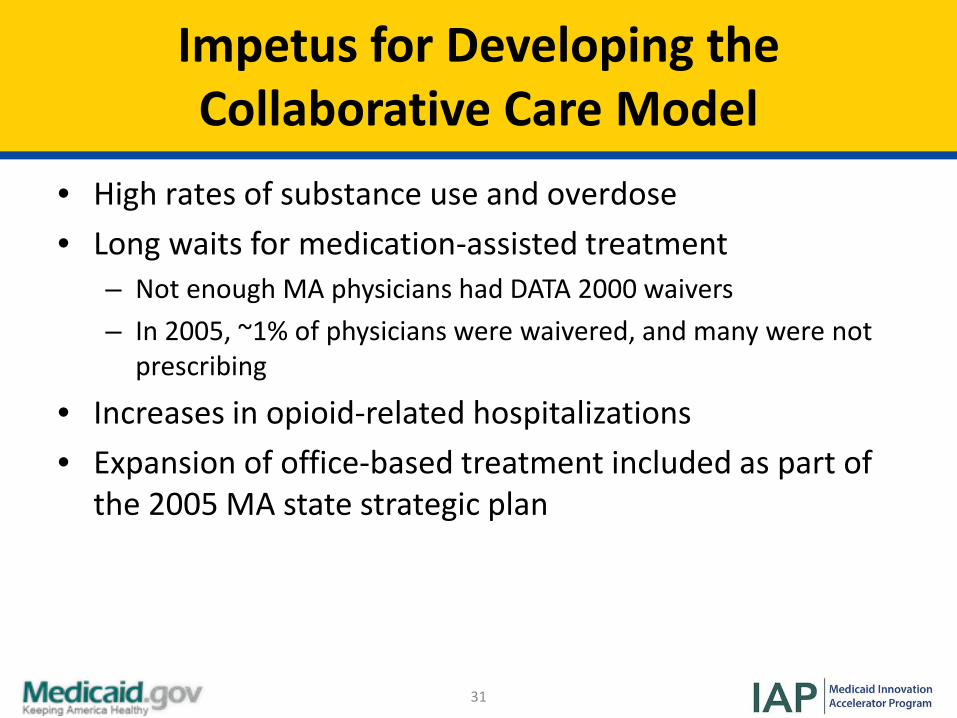
Impetus for Developing the Collaborative Care Model
• High rates of substance use and overdose• Long waits for medication-assisted treatment
– Not enough MA physicians had DATA 2000 waivers– In 2005, ~1% of physicians were waivered, and many were not
prescribing
• Increases in opioid-related hospitalizations • Expansion of office-based treatment included as part of
the 2005 MA state strategic plan
32
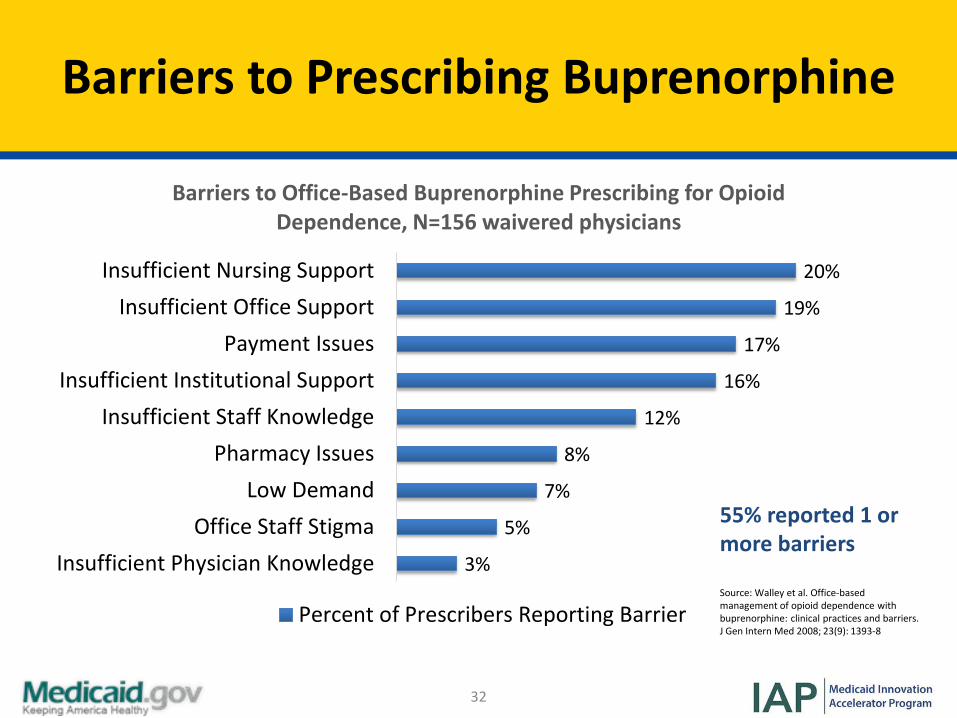
Barriers to Prescribing Buprenorphine
20%
19%
17%
16%
12%
8%
7%
5%
3%
Insufficient Nursing SupportInsufficient Office Support
Payment IssuesInsufficient Institutional Support
Insufficient Staff KnowledgePharmacy Issues
Low DemandOffice Staff Stigma
Insufficient Physician Knowledge
Barriers to Office-Based Buprenorphine Prescribing for Opioid Dependence, N=156 waivered physicians
Percent of Prescribers Reporting Barrier
55% reported 1 or more barriers
Source: Walley et al. Office-based management of opioid dependence with buprenorphine: clinical practices and barriers.J Gen Intern Med 2008; 23(9): 1393-8
33
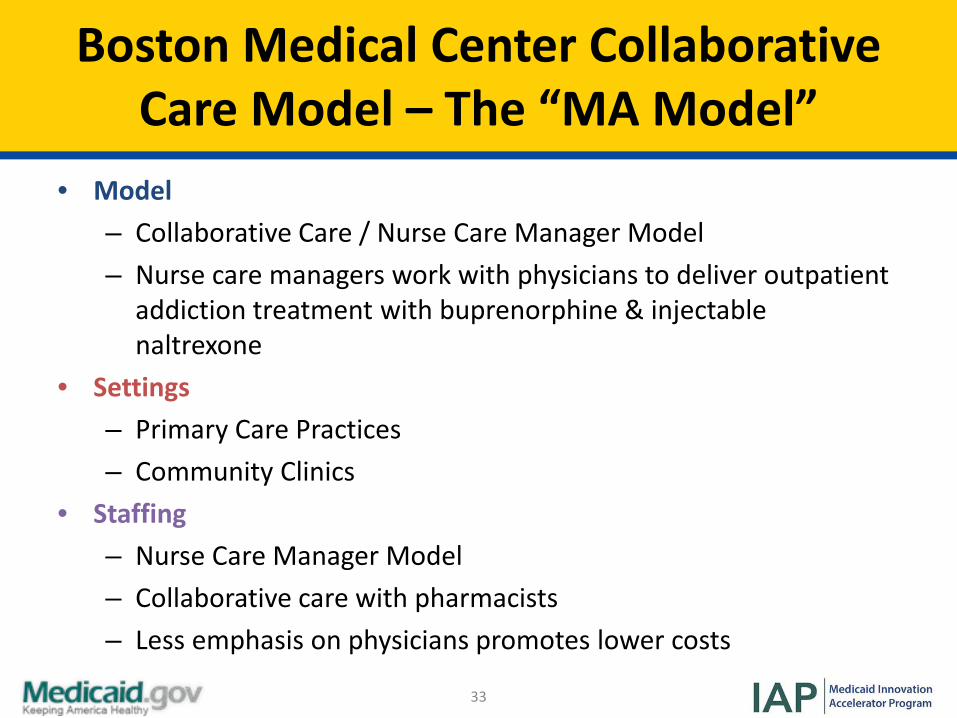
Boston Medical Center Collaborative Care Model – The “MA Model”
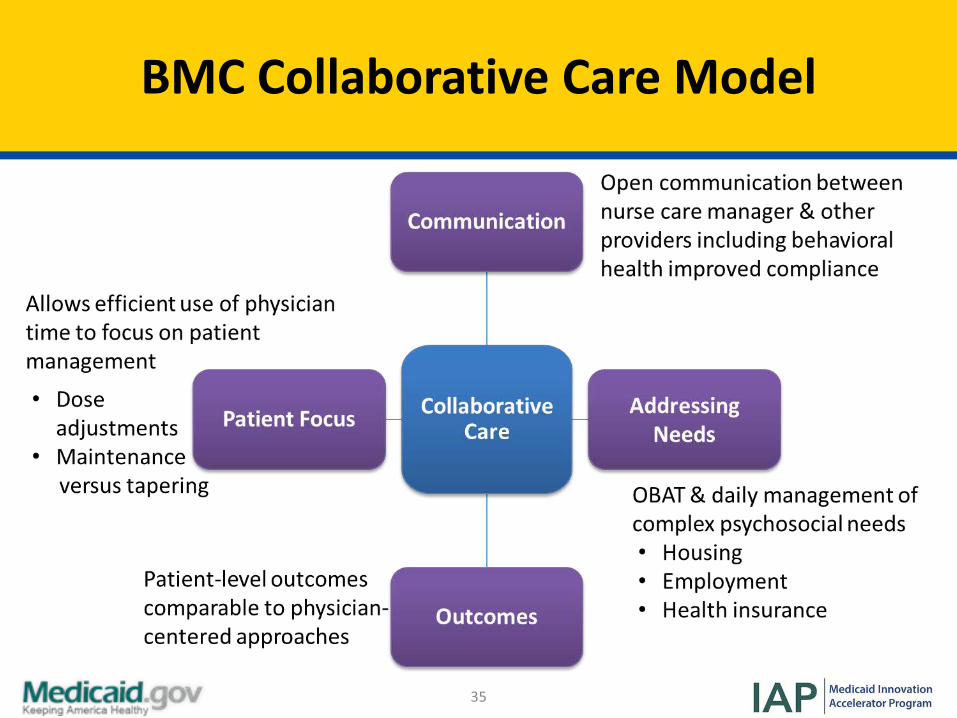
• Model– Collaborative Care / Nurse Care Manager Model– Nurse care managers work with physicians to deliver outpatient
addiction treatment with buprenorphine & injectable naltrexone
• Settings– Primary Care Practices– Community Clinics
• Staffing– Nurse Care Manager Model– Collaborative care with pharmacists– Less emphasis on physicians promotes lower costs
34
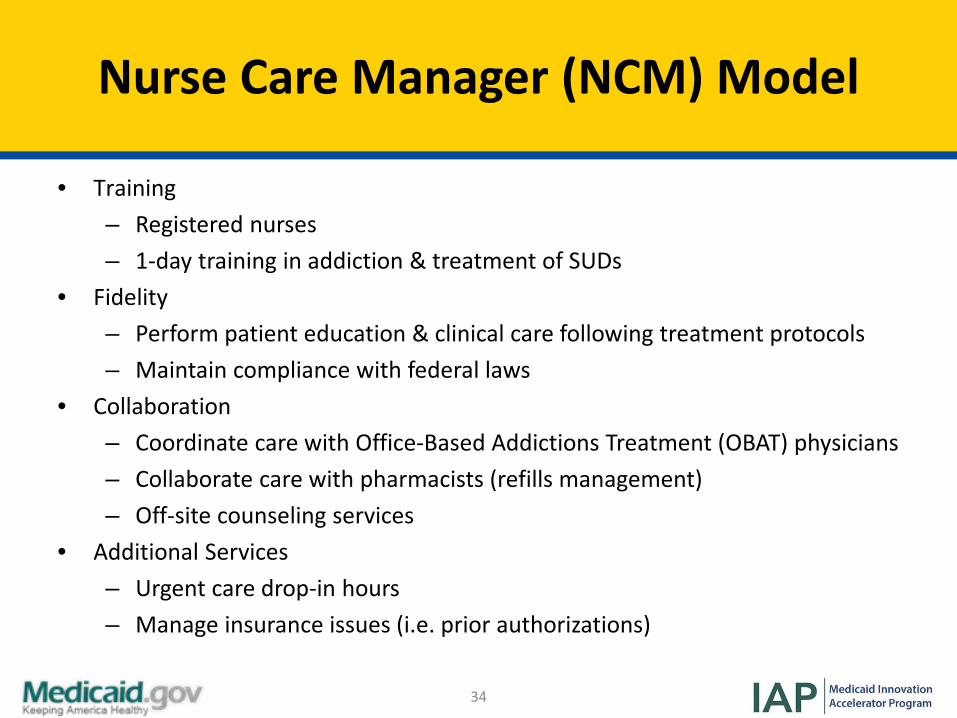
Nurse Care Manager (NCM) Model
• Training– Registered nurses– 1-day training in addiction & treatment of SUDs
• Fidelity– Perform patient education & clinical care following treatment protocols – Maintain compliance with federal laws
• Collaboration– Coordinate care with Office-Based Addictions Treatment (OBAT) physicians – Collaborate care with pharmacists (refills management)– Off-site counseling services
• Additional Services– Urgent care drop-in hours– Manage insurance issues (i.e. prior authorizations)
35
BMC Collaborative Care Model
36
Expansion of OBAT Model to MA Community Clinics
• 2007: State Technical Assistance Treatment Expansion OBAT Program was created to expand BMC model to community clinics across MA
• Program started with 14 CHCs, BMC now provides capacity building to >30 community health providers
37
OBAT Goals with Community Clinics
Access (Expand treatment & access to buprenorphine)• Increase the number of waivered MDs• Increase the number of individuals treated for opioid
addiction• Integrate addiction treatment into primary care settings
Delivery (Effective delivery model for buprenorphine services)
• Modeled after BMC’s Nurse Care Manager programSustainability (Post-program funding)
• Develop a long-term viable funding plan• Collect & analyze outcomes data
38
Technical Assistance & Training for Practices & Clinics (1/2)
• Training– RNs & MAs complete 1-day buprenorphine
training
• Site Visits– Conducted w/ RN, MDs, team members– Trainings in addiction MAT, stigma, management,
start-up
• Quarterly Meetings– Educational, networking, support
39
Technical Assistance & Training for Practices & Clinics (2/2)
• Support for RNs, Waivered MDs– Navigate prior authorization, insurance, DEA– Leaving providers/practice closures– Patient issues
• Facilitating Listserv for Addiction Providers– Relevant articles, resources, group discussion– Regulations, reimbursement, jobs
40
Successes in Community Clinics
• Nurse Care Model housed in community health centers has– Expanded treatment
• Between 2007-2013, 14 community health centers successfully initiated OBAT
• Physician’s “waivered” increased by 375%, from 24 to 114• Serving more than 10,000 patients since 2007. Annual admission of OBOT
patients to community health centers increased from 178 to 1,210.• Treatment available in patients’ communities
– Developed a sustainable reimbursement model• Federally Qualified Health Centers (FQHCs)• Insurance
– Implemented best practices as the standard of care
41
Successes in Community Clinics CONT’D
• Nurse Care Model housed in community health centers has– Improved health outcomes
• Retention in care: 65.2% of OBOT patients enrolled in FY 2013/2014 remained in treatment ≥ 10 months
• Decreased mortality• Lower cost to Medicaid for those on buprenorphine versus those not in
care
42
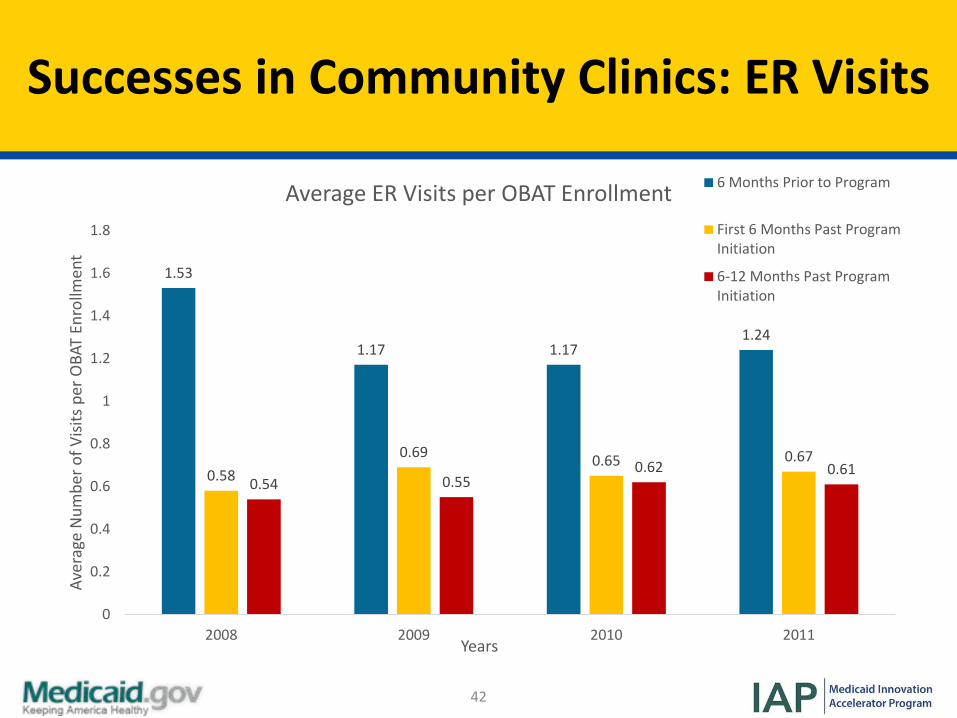
Successes in Community Clinics: ER Visits
1.53
1.17 1.171.24
0.580.69 0.65 0.67
0.54 0.550.62 0.61
0
0.2
0.4
0.6
0.8
1
1.2
1.4
1.6
1.8
2008 2009 2010 2011
Aver
age
Num
ber o
f Visi
ts p
er O
BAT
Enro
llmen
t
Years
Average ER Visits per OBAT Enrollment 6 Months Prior to Program
First 6 Months Past ProgramInitiation
6-12 Months Past ProgramInitiation
43
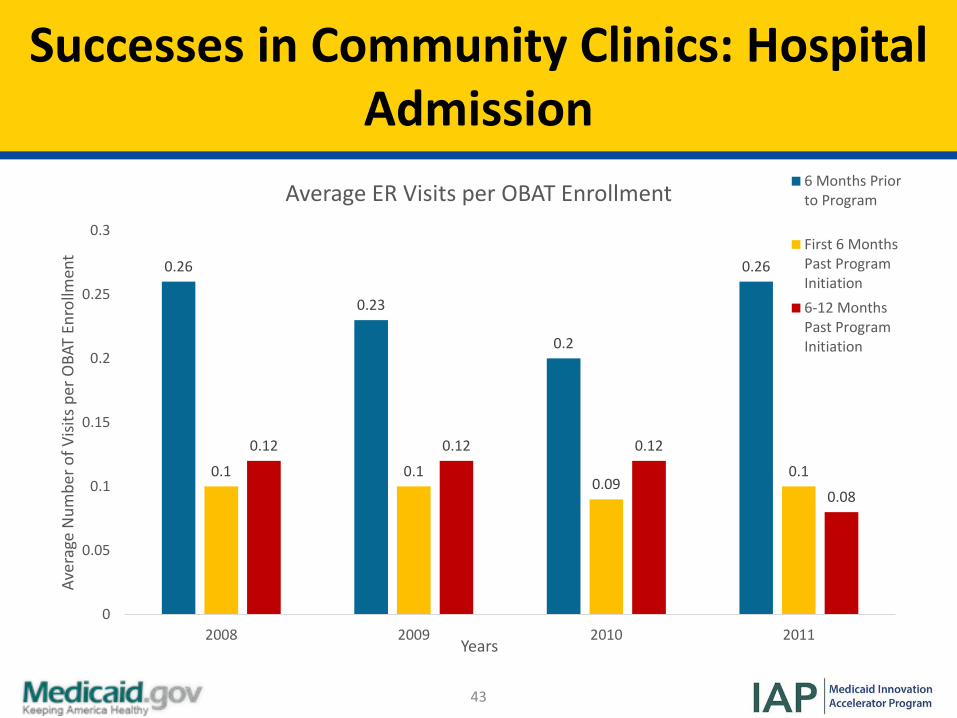
Successes in Community Clinics: Hospital Admission
0.26
0.23
0.2
0.26
0.1 0.10.09
0.1
0.12 0.12 0.12
0.08
0
0.05
0.1
0.15
0.2
0.25
0.3
2008 2009 2010 2011
Aver
age
Num
ber o
f Visi
ts p
er O
BAT
Enro
llmen
t
Years
Average ER Visits per OBAT Enrollment 6 Months Priorto Program
First 6 MonthsPast ProgramInitiation6-12 MonthsPast ProgramInitiation
44
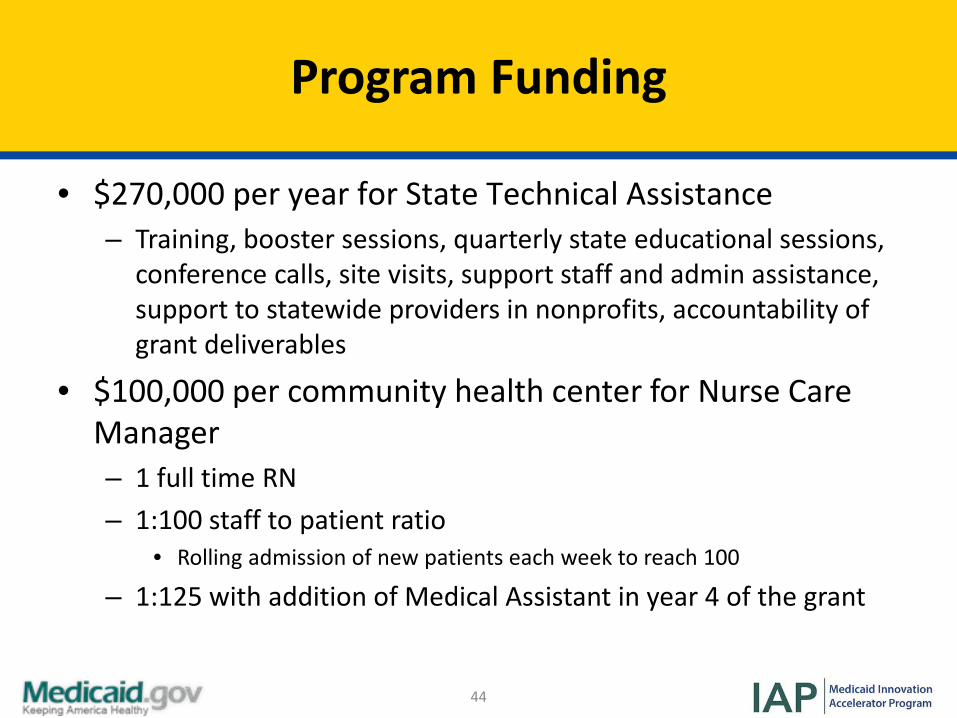
Program Funding
• $270,000 per year for State Technical Assistance– Training, booster sessions, quarterly state educational sessions,
conference calls, site visits, support staff and admin assistance, support to statewide providers in nonprofits, accountability of grant deliverables
• $100,000 per community health center for Nurse Care Manager– 1 full time RN– 1:100 staff to patient ratio
• Rolling admission of new patients each week to reach 100
– 1:125 with addition of Medical Assistant in year 4 of the grant
45
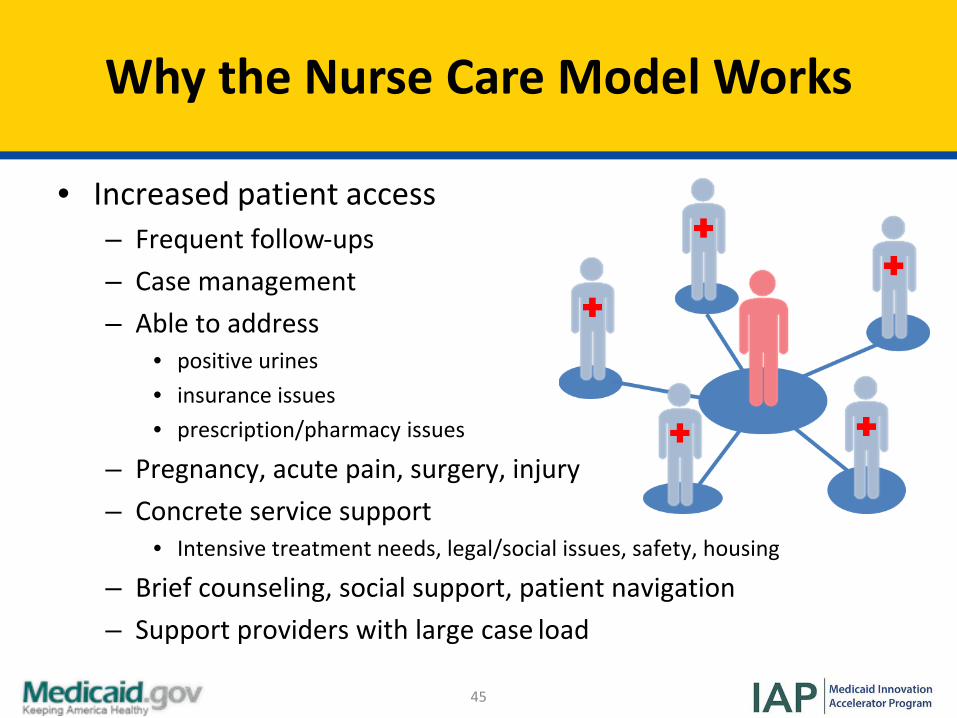
• Increased patient access– Frequent follow-ups– Case management– Able to address
• positive urines• insurance issues• prescription/pharmacy issues
– Pregnancy, acute pain, surgery, injury– Concrete service support
• Intensive treatment needs, legal/social issues, safety, housing
– Brief counseling, social support, patient navigation– Support providers with large case load
Why the Nurse Care Model Works
46
Polling Question (2/2)
• Does your state Medicaid program provide any of the following services to support MAT providers? Select all that apply. – Training programs – 1:1 technical assistance– Comprehensive MAT benefit design– Learning collaboratives– Infrastructure funding– Other

Discussion & Questions (1/2)
47
48
In-Depth Look at Clinical Pathway & Payment Bundle ModelsMady Chalk, PhD, MSW, Senior Policy Advisor, Treatment Research InstituteSusan Parker, Executive Vice President and Founder, Parker Dennison & AssociatesColette Croze, MSW, Private Consultant, CrozeConsulting
48
49
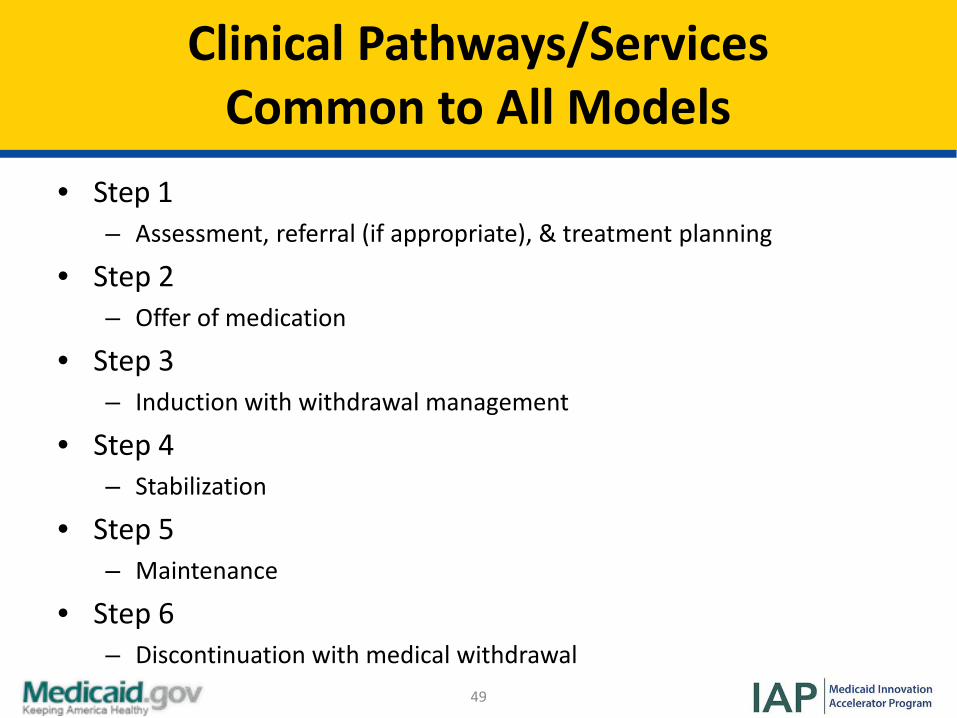
Clinical Pathways/Services Common to All Models
• Step 1– Assessment, referral (if appropriate), & treatment planning
• Step 2– Offer of medication
• Step 3– Induction with withdrawal management
• Step 4– Stabilization
• Step 5– Maintenance
• Step 6– Discontinuation with medical withdrawal
50
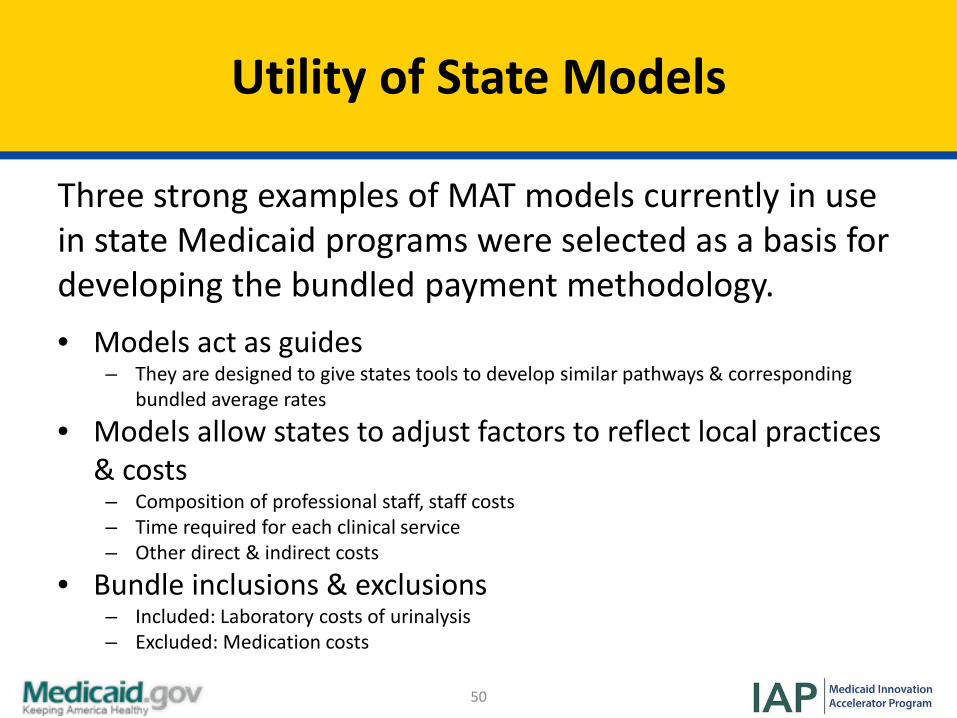
Utility of State Models
Three strong examples of MAT models currently in use in state Medicaid programs were selected as a basis for developing the bundled payment methodology. • Models act as guides
– They are designed to give states tools to develop similar pathways & corresponding bundled average rates
• Models allow states to adjust factors to reflect local practices & costs
– Composition of professional staff, staff costs– Time required for each clinical service– Other direct & indirect costs
• Bundle inclusions & exclusions– Included: Laboratory costs of urinalysis– Excluded: Medication costs
51
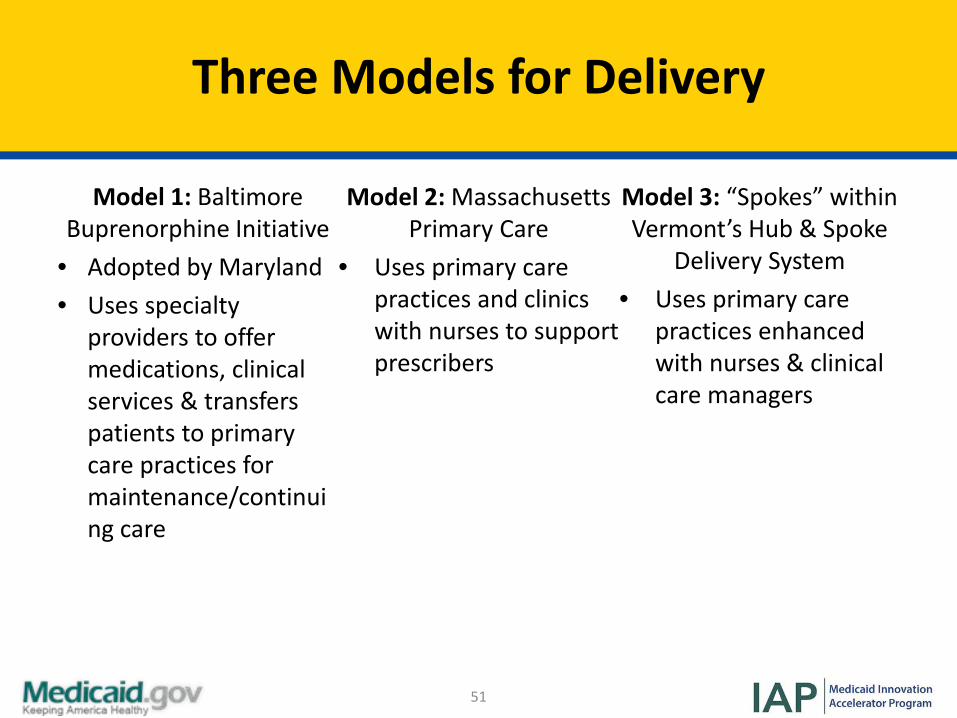
Three Models for Delivery
Model 1: Baltimore Buprenorphine Initiative
• Adopted by Maryland• Uses specialty
providers to offer medications, clinical services & transfers patients to primary care practices for maintenance/continuing care
Model 2: Massachusetts Primary Care
• Uses primary care practices and clinics with nurses to support prescribers
Model 3: “Spokes” within Vermont’s Hub & Spoke
Delivery System• Uses primary care
practices enhanced with nurses & clinical care managers
52
Resources Required in All Models
• Staffing– DATA 2000-waivered physicians– Nurses: registered nurses, nurse care managers– Substance use disorder counselors
• Sites– Specialty outpatient treatment programs for substance use
disorders– Outpatient primary care practices– Primary care practices or clinics
53
Rate Model: Overview
• Model calculates total cost for provider services, including urinalysis– Model excludes pharmacy costs– Allows users to tailor to local provider costs & required professionals
• Model crosswalks to the steps & assumptions in the clinical pathway:– The time span included in rate for each bundle is tied to underlying steps in
the pathway– Monthly rates allow some phases to continue indefinitely depending on client
choices & needs (i.e. maintenance)• Overview of Excel model:
– Designed for user input in gray shaded cells– Estimates used to populate model to yield approximate rates– Two sheets:
• Assumptions for state specific costs• Rate for Clinical Model calculates rate based on clinical pathway and
assumptions
54
Rate Model: Assumptions for State-Specific Costs
• Calculates personnel costs per billable hour based on:– Salaries and productivity rates by type of professional– Average weeks of work after paid time off– Payroll tax and fringe benefit rate (combined)
• Other direct program costs (as % of personnel)• General administrative and overhead rate (as % of total
personnel & other direct program costs)• Urinalysis• Average group size per staff
– Formula in cell below calculates the average amount of staff time per client per hour of group (e.g. 1/9=0.1111 or .1111 hour of staff time per client per group)
55
Rate Model: Clinical Model Sheet
Top Section - Summarizes the rates & length of time for each phase in the clinical pathway
Lower Section - Follows the clinical pathway & details:• Percentage of clients each step applies to (typically 100% of clients)• Staff time required for each step (in hours)• Composition of professionals for each activity (average % by type of credential)• Brings staff costs/billable hour from Assumptions sheet• Applies the other direct program percentage to the subtotal of personnel costs• Applies general administration and overhead percentage to total direct costs• Yields total cost for each step in clinical pathway• Average hourly costs (column K in VT model) shows the cost for the corresponding
activity with the percentages of each type staff• Allows reasonableness check
• Staff check totals is a review tool to ensure staff %s total 100% (column M in VT model)
56
Logistics Check
We are now going to walk through a state model. Please reference the clinical pathway and rate model resource document relative Vermont to follow along
with the audio recording.
57
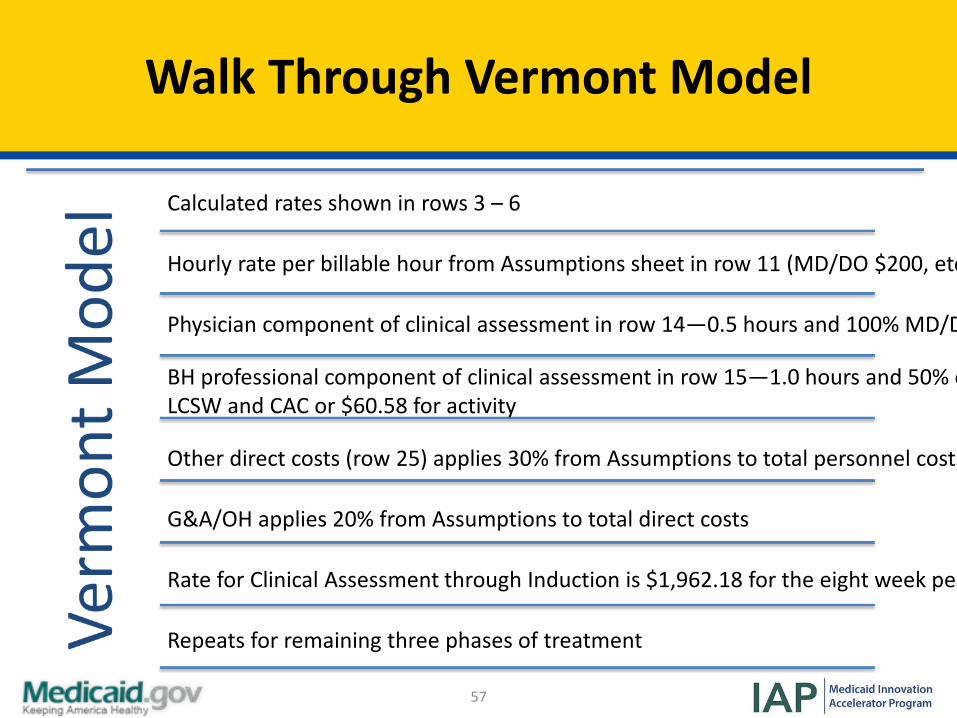
Walk Through Vermont Model
Calculated rates shown in rows 3 – 6
Hourly rate per billable hour from Assumptions sheet in row 11 (MD/DO $200, etc
Physician component of clinical assessment in row 14—0.5 hours and 100% MD/D
BH professional component of clinical assessment in row 15—1.0 hours and 50% e LCSW and CAC or $60.58 for activity
Other direct costs (row 25) applies 30% from Assumptions to total personnel costs
G&A/OH applies 20% from Assumptions to total direct costs
Rate for Clinical Assessment through Induction is $1,962.18 for the eight week pe
Repeats for remaining three phases of treatment
58
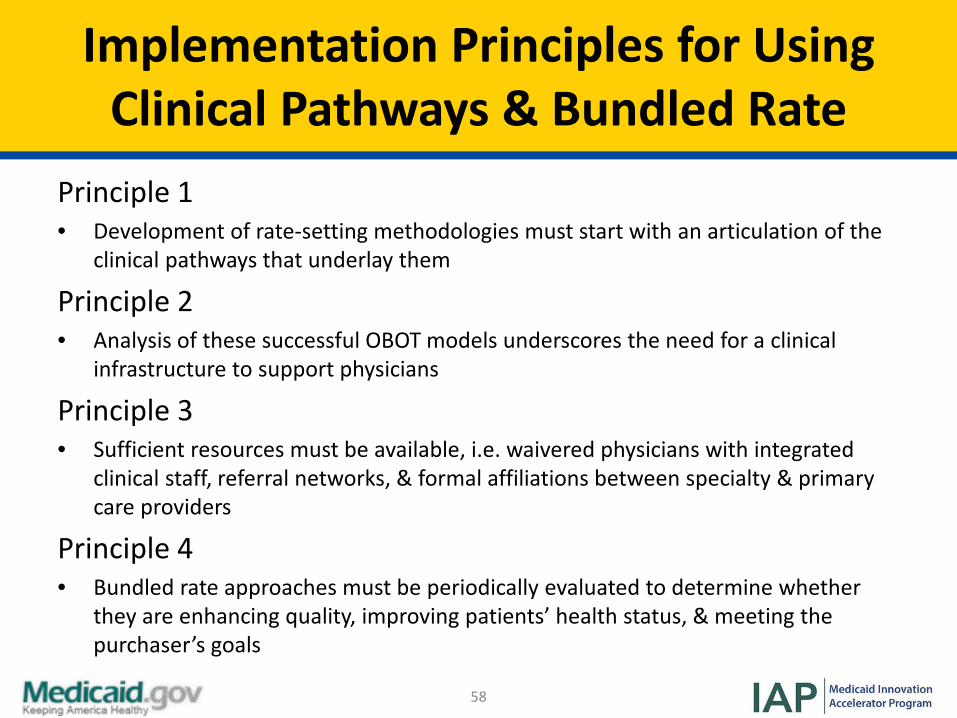
Implementation Principles for Using Clinical Pathways & Bundled Rate
Principle 1• Development of rate-setting methodologies must start with an articulation of the
clinical pathways that underlay them
Principle 2• Analysis of these successful OBOT models underscores the need for a clinical
infrastructure to support physicians
Principle 3• Sufficient resources must be available, i.e. waivered physicians with integrated
clinical staff, referral networks, & formal affiliations between specialty & primary care providers
Principle 4• Bundled rate approaches must be periodically evaluated to determine whether
they are enhancing quality, improving patients’ health status, & meeting the purchaser’s goals
59
Implementation Questions to Consider
• What triggers the bundled payment?• Which practitioner/organization receives the bundled
reimbursement?• What documentation of service provision is required?• What metrics will be used to evaluate improvements in
quality resulting from the use of the bundled payments?
60
Webinar Summary: Key Take Away Points
• Most of the key elements of each model are similar
• Rates are created for stages of treatment within the clinical pathway
• There is flexibility in provider types for assessment & maintenance
• Initiation of MAT in the specialty system requires an additional step in the clinical pathway

Discussion & Questions (2/2)
61
62
Resources
• American Society of Addiction Medicine (ASAM) National Practice Guideline for the Use of Medications in the Treatment of Addiction Involving Opioid Use, ASAM– http://www.asam.org/docs/default-source/practice-
support/guidelines-and-consensus-docs/asam-national-practice-guideline-supplement.pdf?sfvrsn=24
• Informational Bulletin: Medication Assisted Treatment for Substance Use Disorders, Centers for Medicaid and CHIP Services– https://www.medicaid.gov/Federal-Policy-
Guidance/downloads/CIB-07-11-2014.pdf
63
Resources CONT’D
• Medication-Assisted Treatment Models of Care for Opioid Use Disorder in Primary Care Settings, AHRQ– https://www.effectivehealthcare.ahrq.gov/ehc/products/636/2
350/opioid-use-disorder-report-161123.pdf
• Treatment Needs Questionnaire.– Developed by Sigmon, SC & Brooklyn JR (2015) for Vermont– Included as a PDF in the reminder email yesterday
• Office-Based Opioid Treatment Stability Index. – Tool utilized by Vermont– Included as a PDF in the reminder email yesterday
64
State Speaker Contact Information
• John Brooklyn, MD, University of Vermont– [email protected], 802-864-6309
• Anthony Folland, VT Department of Health– [email protected], 802-652-4141
• Colleen Labelle, MSN, RN-BC CARN, Boston Medical Center– [email protected], 617-797-6712
65
Speaker Contact Information
• Colette Croze, MSW, Croze Consulting – [email protected], 302-378-7555
• Mady Chalk, PhD, MSW, Treatment Research Institute– [email protected], 202-425-0433
• Susan Parker, CPA, MT, Parker Dennison & Associates– [email protected], 480-419-4147
66
Thank You!
Thank you for joining us for this National Dissemination Webinar!
Please complete the evaluation form following this presentation.