Embed Size (px)
Citation preview
1 of 5 Preparing to teach motion graphs June 2016 © MEI
MEI Conference 2016
Preparing to teach motion
graphs
Sharon Tripconey [email protected]
2 of 5 Preparing to teach motion graphs June 2016 © MEI
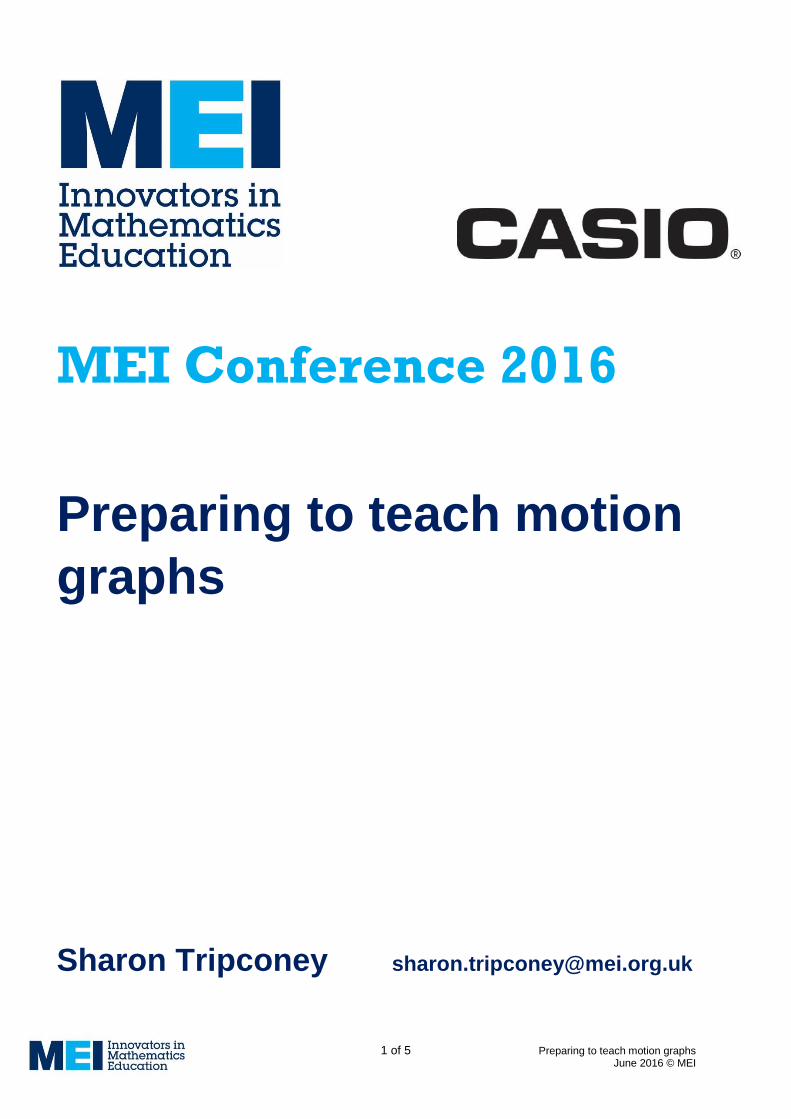
Kinematics content extracts for reformed Mathematics A level from Sept 2017
Extracts taken from ‘Mathematics AS and A level content’ (2014), DfE.
www.gov.uk/government/publications/gce-as-and-a-level-mathematics
Note that bold text within [square brackets] is AS content.
P Quantities and units in mechanics
Ref Content description
P1 [Understand and use fundamental quantities and units in the S.I. system: length, time, mass]
[Understand and use derived quantities and units: velocity, acceleration, force, weight], moment
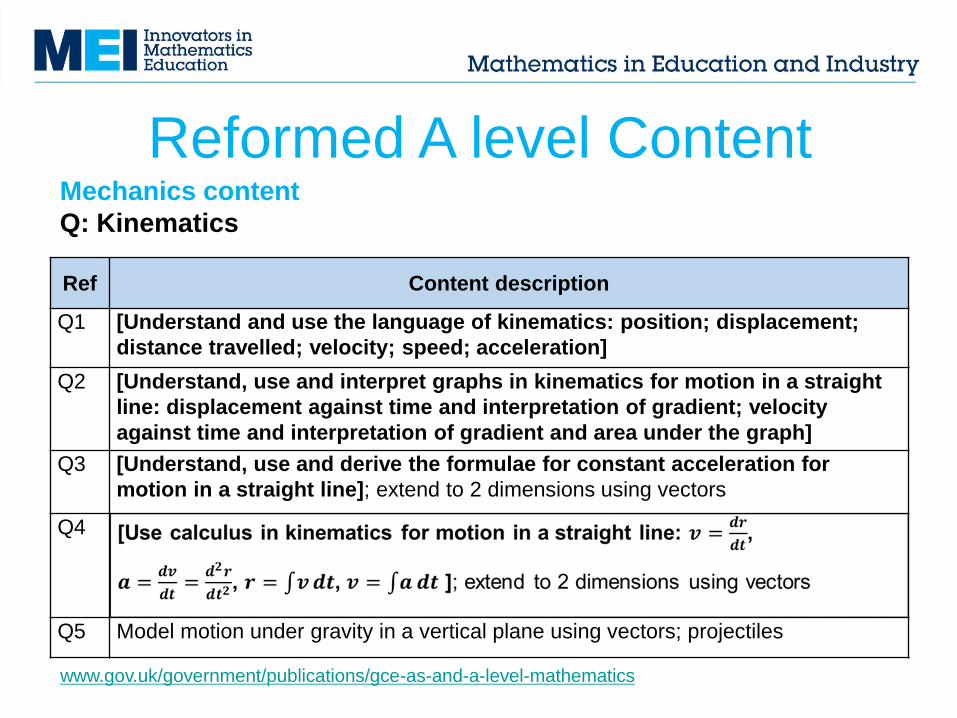
Q: Kinematics
Ref Content description
Q1 [Understand and use the language of kinematics: position; displacement; distance travelled; velocity; speed; acceleration]
Q2 [Understand, use and interpret graphs in kinematics for motion in a straight line: displacement against time and interpretation of gradient; velocity against time and interpretation of gradient and area under the graph]
Q3 [Understand, use and derive the formulae for constant acceleration for motion in a straight line]; extend to 2 dimensions using vectors
Q4 [Use calculus in kinematics for motion in a straight line: 𝒗 =𝒅𝒓
𝒅𝒕,
𝒂 =𝒅𝒗
𝒅𝒕=
𝒅𝟐𝒓
𝒅𝒕𝟐, 𝒓 = ∫𝒗𝒅𝒕, 𝒗 = ∫𝒂𝒅𝒕 ]; extend to 2 dimensions using vectors
Q5 Model motion under gravity in a vertical plane using vectors; projectiles
3 of 5 Preparing to teach motion graphs June 2016 © MEI
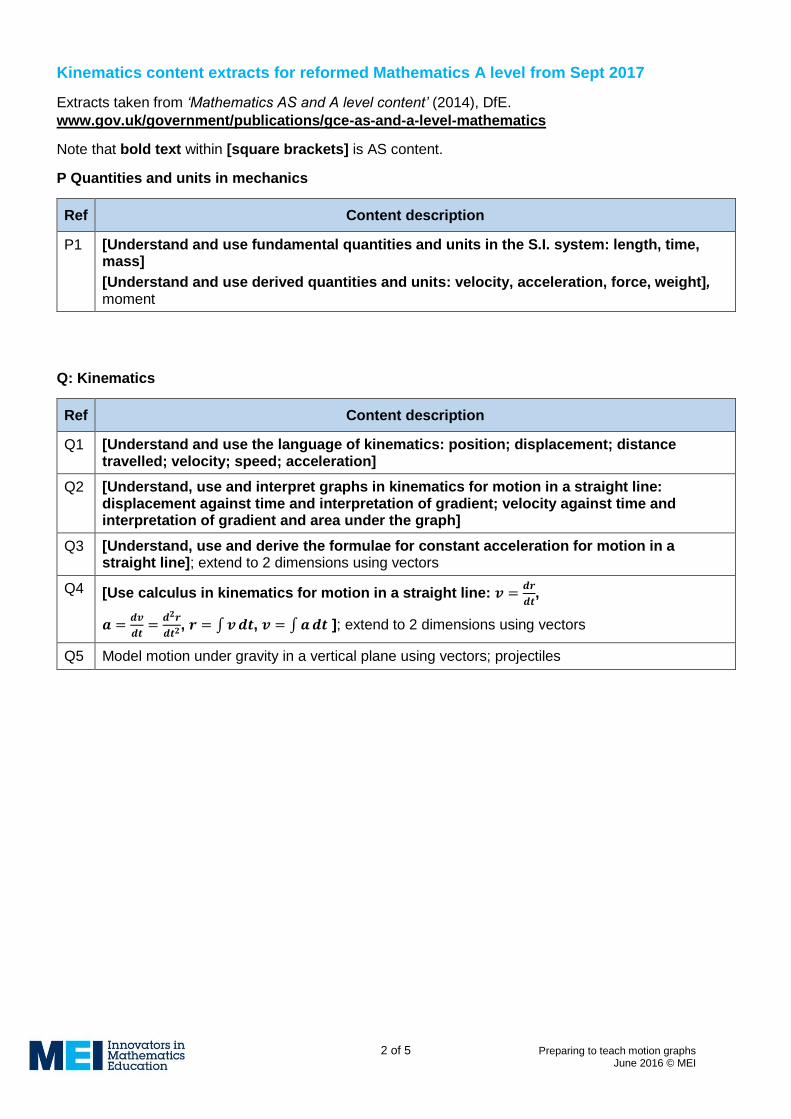
time 0
velo
city
0
time
dis
pla
cem
en
t
4 of 5 Preparing to teach motion graphs June 2016 © MEI
5 of 5 Preparing to teach motion graphs June 2016 © MEI
Some useful links:
Moving man:
https://phet.colorado.edu/en/simulation/moving-man
Traffic graphs (GeoGebra):
http://www.geogebra.org/m/2832353
MEI’s M4 magazine, Issue 49:
http://mei.org.uk/files/pdf/Sept-Oct-2015-1.pdf
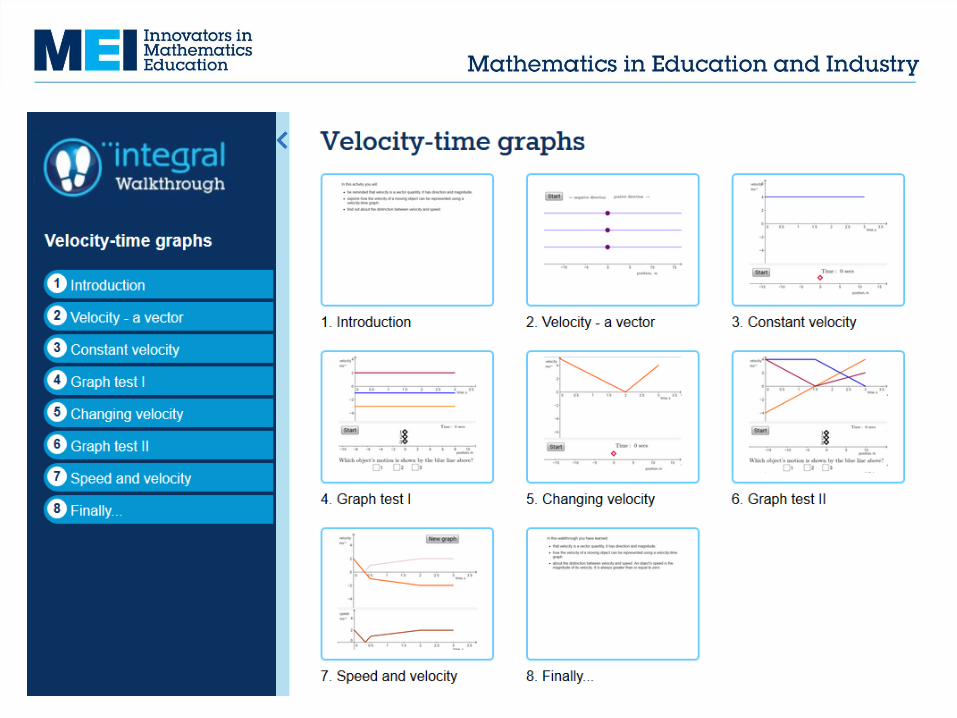
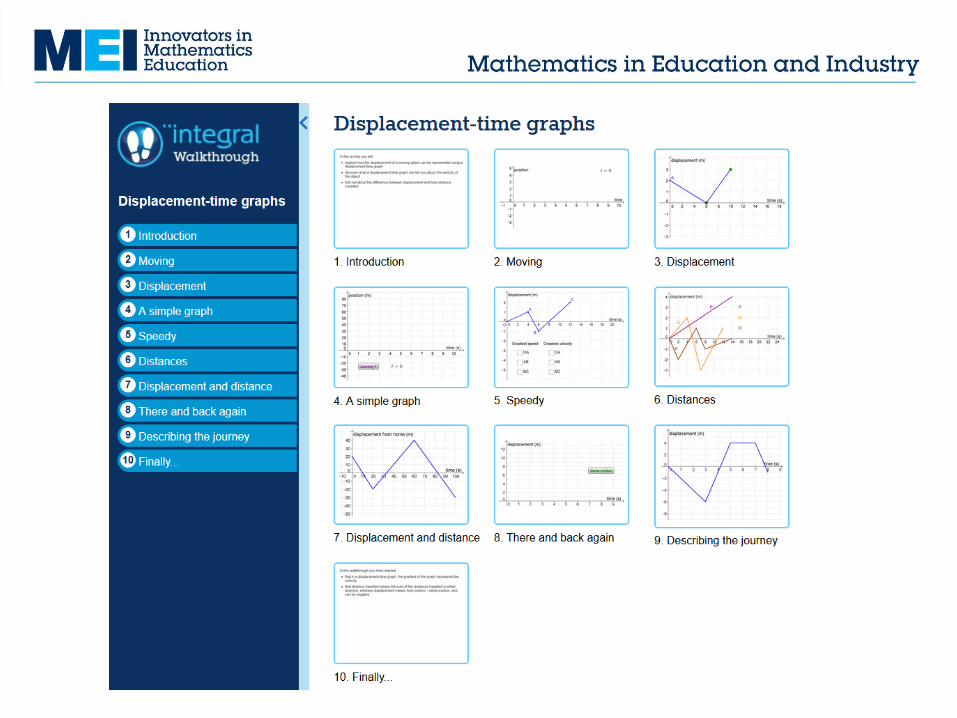
Integral resources **NEW** Walkthroughs:
http://integralmaths.org/walkthroughs/index.php?wt=vel_time_graphs
http://integralmaths.org/walkthroughs/?wt=vuat
http://integralmaths.org/walkthroughs/?wt=disp_const_acc
http://integralmaths.org/walkthroughs/index.php?wt=disp_time_graphs
Information and professional development:
http://www.mei.org.uk/2017-pd
http://www.furthermaths.org.uk/teaching-mechanics
http://www.mei.org.uk/files/pdf/mechanics-get-set-course-outline.pdf

Preparing to teach motion
graphs
Sharon Tripconey
Session descriptionThis session is one of four designed to help teachers prepare for teaching
mechanics topics in the new A level from 2017.
‘Preparing to teach motion graphs’ will cover some of the basic subject
content, links to GCSE and other A level topics, as well as exploring ideas
and approaches for teaching this topic. The session will demonstrate how
simple practical classroom activities can provide a stimulus for students to
develop their understanding of motion graphs.
This session is particularly suitable for teachers who have not previously
taught any mechanics.
position
distance travelled
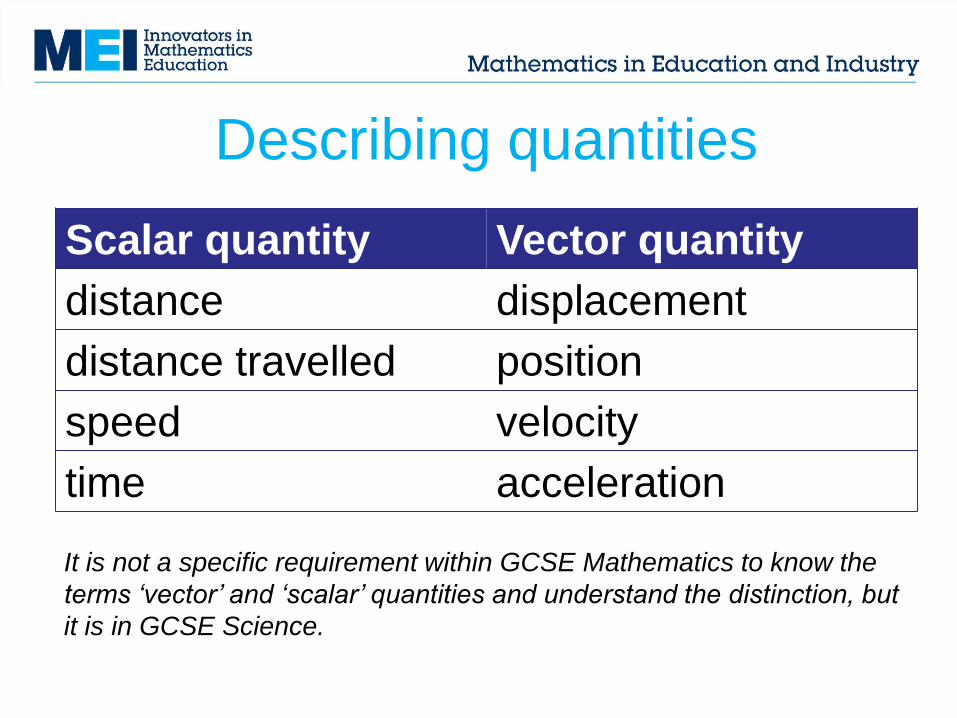
Describing quantities
Scalar quantity Vector quantity
distance displacement
distance travelled position
speed velocity
time acceleration
It is not a specific requirement within GCSE Mathematics to know the
terms ‘vector’ and ‘scalar’ quantities and understand the distinction, but
it is in GCSE Science.
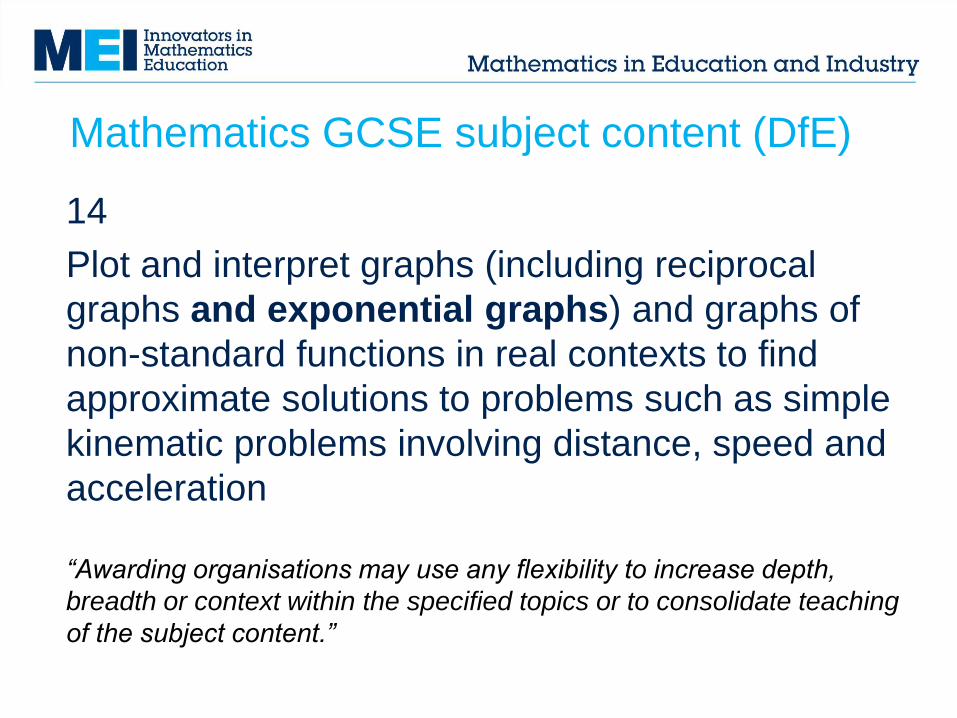
Mathematics GCSE subject content (DfE)
14
Plot and interpret graphs (including reciprocal
graphs and exponential graphs) and graphs of
non-standard functions in real contexts to find
approximate solutions to problems such as simple
kinematic problems involving distance, speed and
acceleration
“Awarding organisations may use any flexibility to increase depth,
breadth or context within the specified topics or to consolidate teaching
of the subject content.”
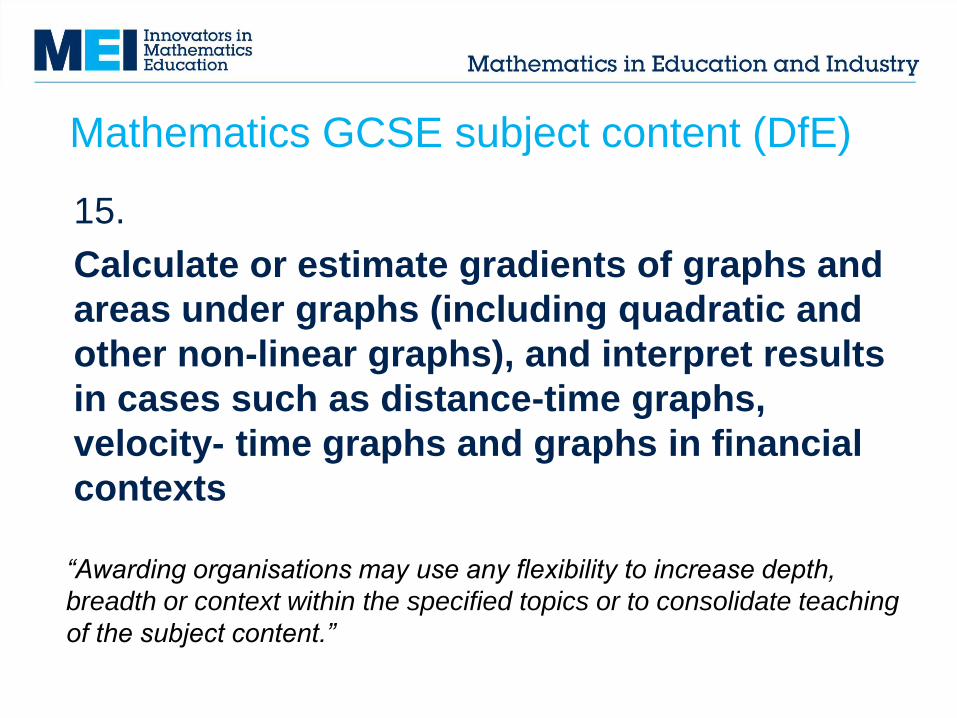
15.
Calculate or estimate gradients of graphs and
areas under graphs (including quadratic and
other non-linear graphs), and interpret results
in cases such as distance-time graphs,
velocity- time graphs and graphs in financial
contexts
“Awarding organisations may use any flexibility to increase depth,
breadth or context within the specified topics or to consolidate teaching
of the subject content.”
Mathematics GCSE subject content (DfE)
Ref Content description
Q1 [Understand and use the language of kinematics: position; displacement;
distance travelled; velocity; speed; acceleration]
Q2 [Understand, use and interpret graphs in kinematics for motion in a straight
line: displacement against time and interpretation of gradient; velocity
against time and interpretation of gradient and area under the graph]
Q3 [Understand, use and derive the formulae for constant acceleration for
motion in a straight line]; extend to 2 dimensions using vectors
Q4
Q5 Model motion under gravity in a vertical plane using vectors; projectiles
Mechanics content
Q: Kinematics
Reformed A level Content
www.gov.uk/government/publications/gce-as-and-a-level-mathematics
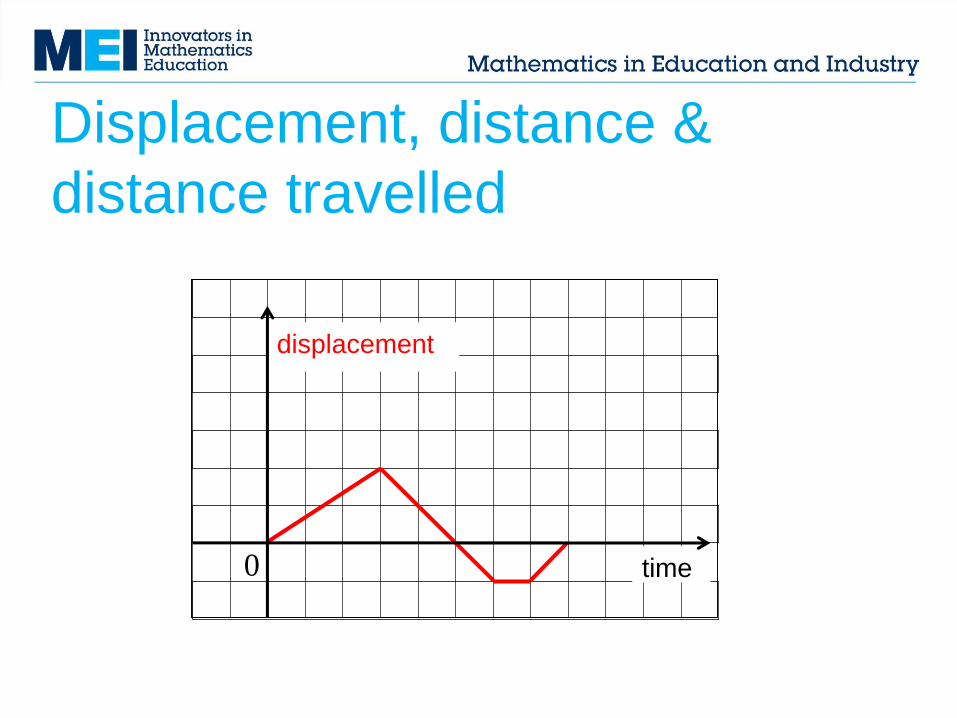
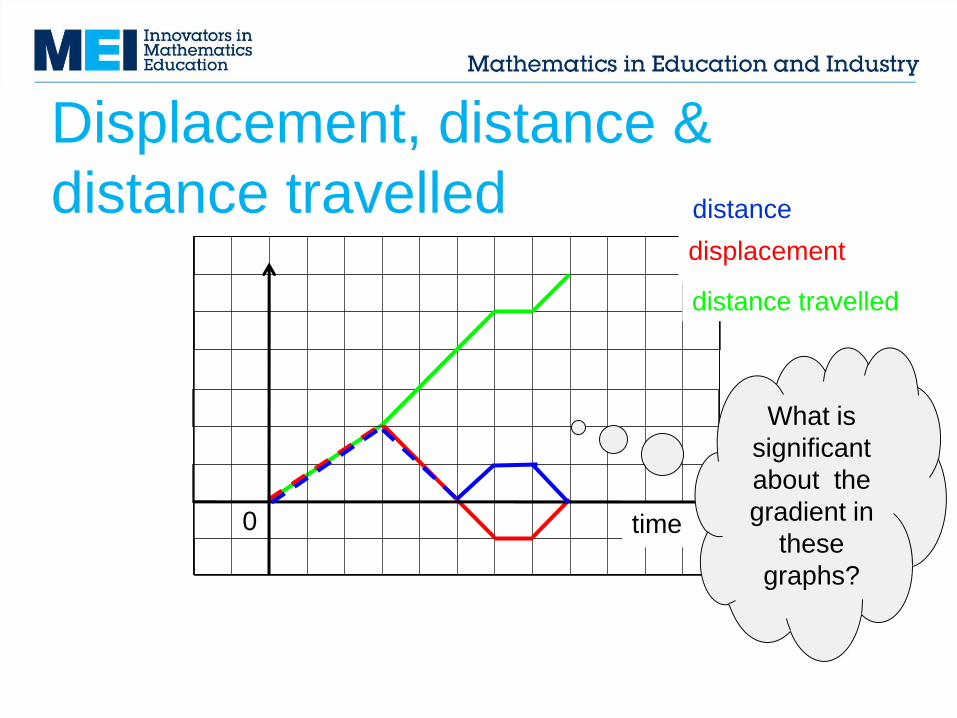
Displacement, distance &
distance travelled
time0
displacement
time
displacement
distance travelled
0
What is
significant
about the
gradient in
these
graphs?
distance
Displacement, distance &
distance travelled
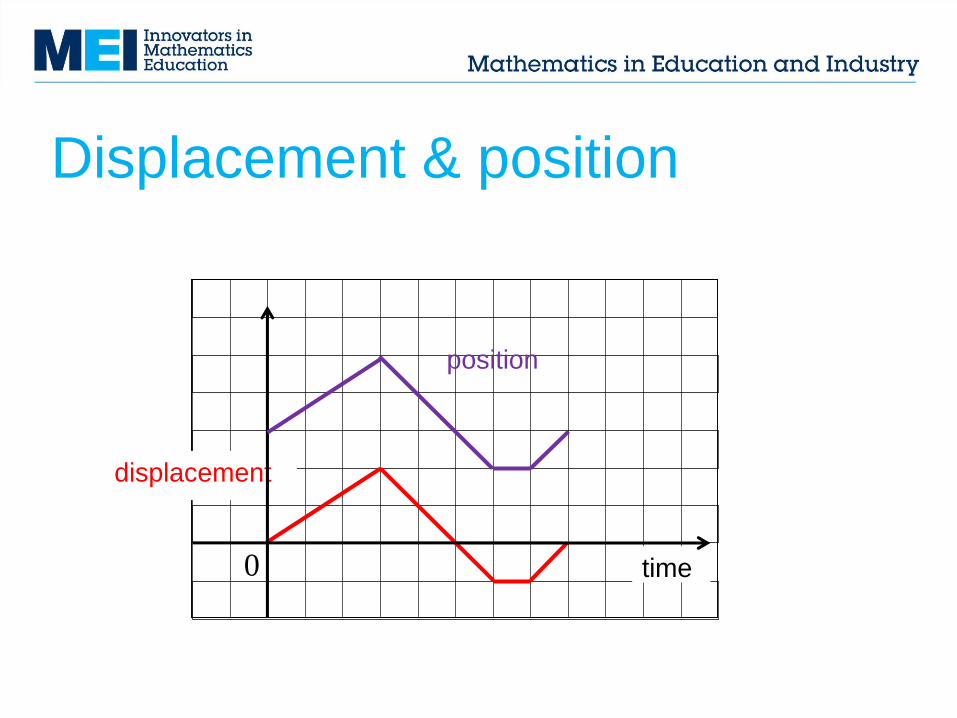
Displacement & position
time0
displacement
position
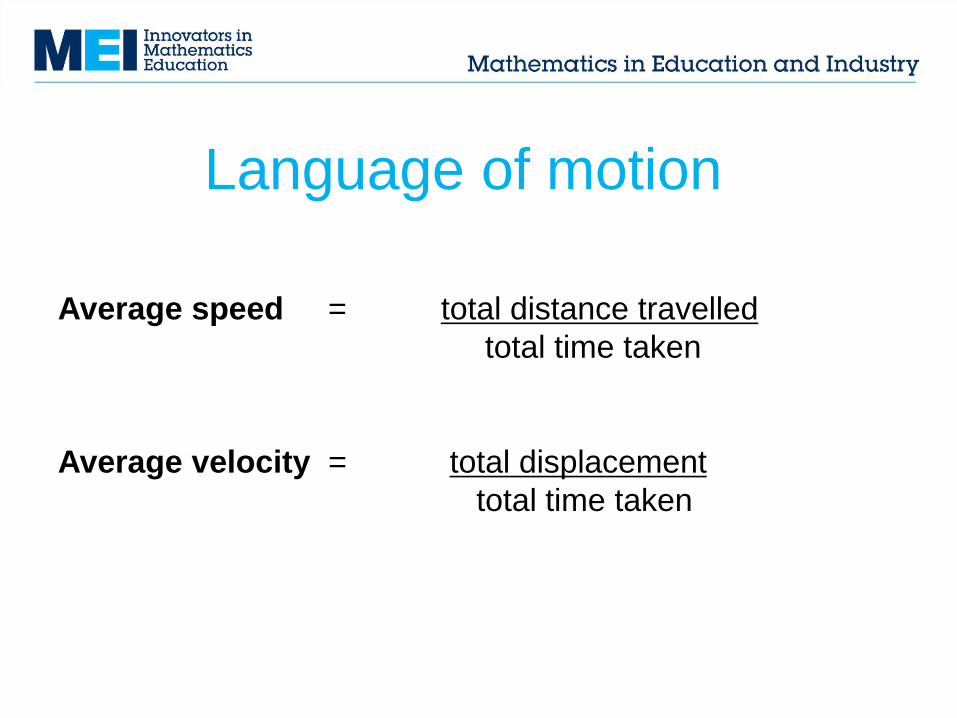
Language of motion
Average speed = total distance travelled
total time taken
Average velocity = total displacement
total time taken
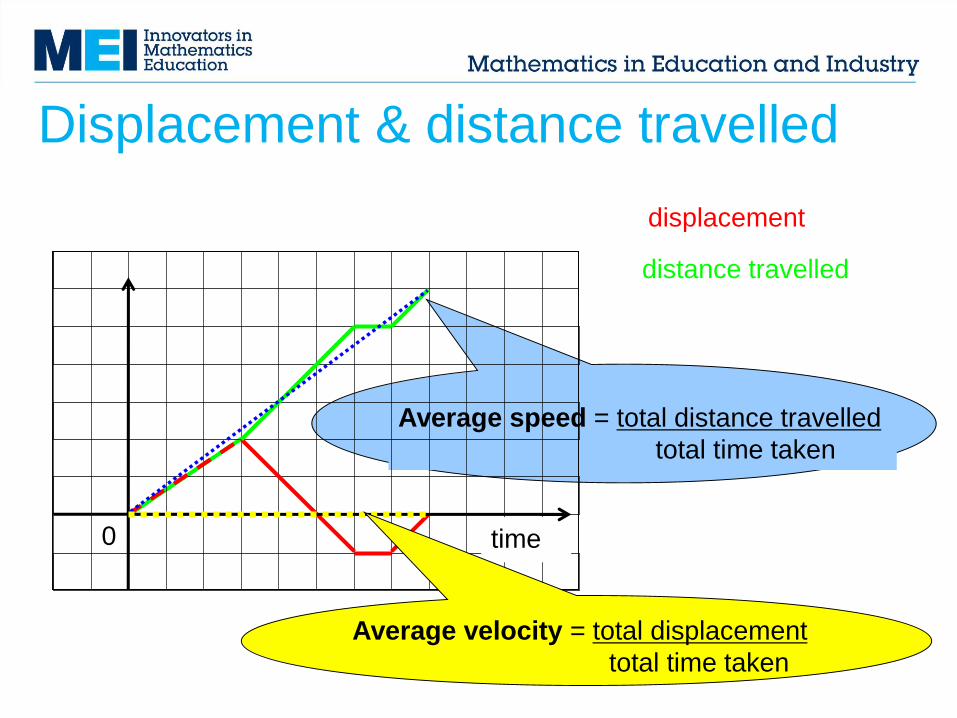
Displacement & distance travelled
Average speed = total distance travelled
total time taken
time
displacement
distance travelled
0
Average velocity = total displacement
total time taken
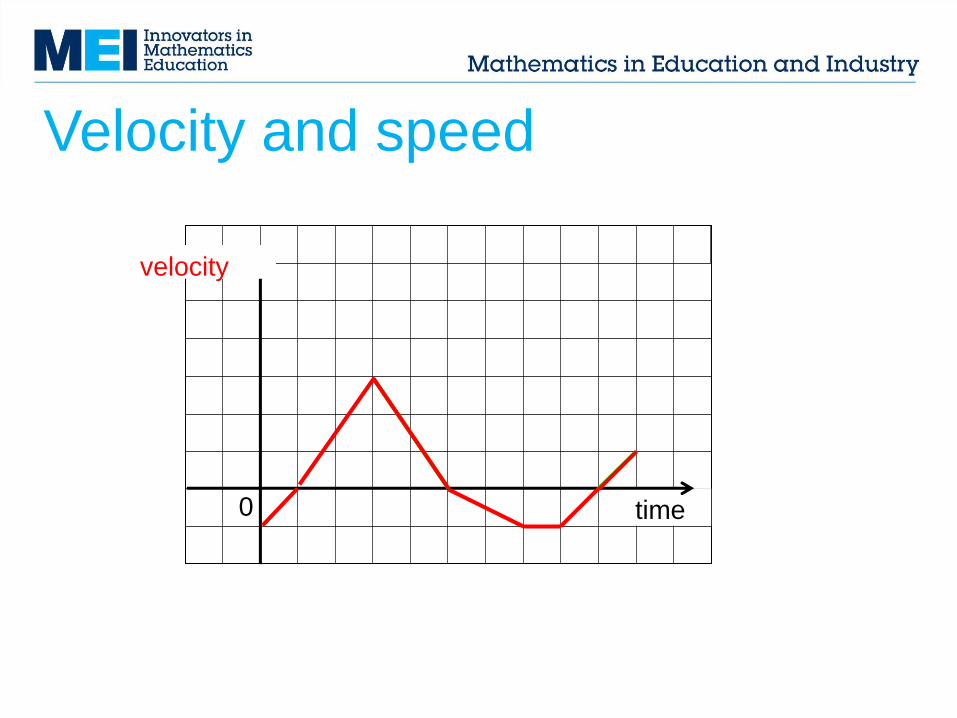
Velocity and speed
time
velocity
0
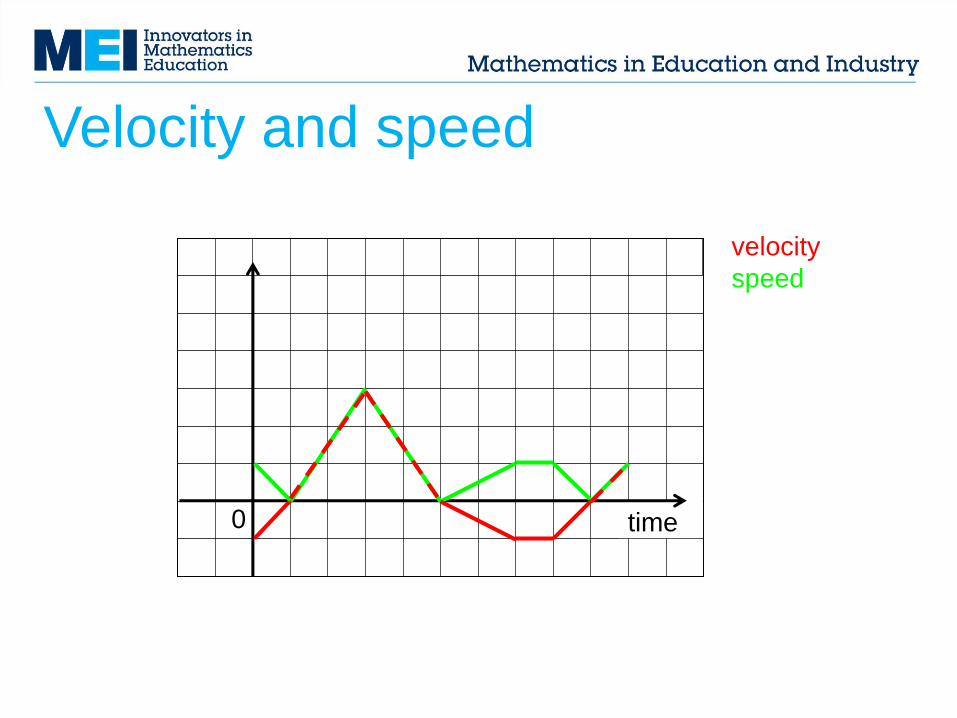
Velocity and speed
time
velocity
speed
0
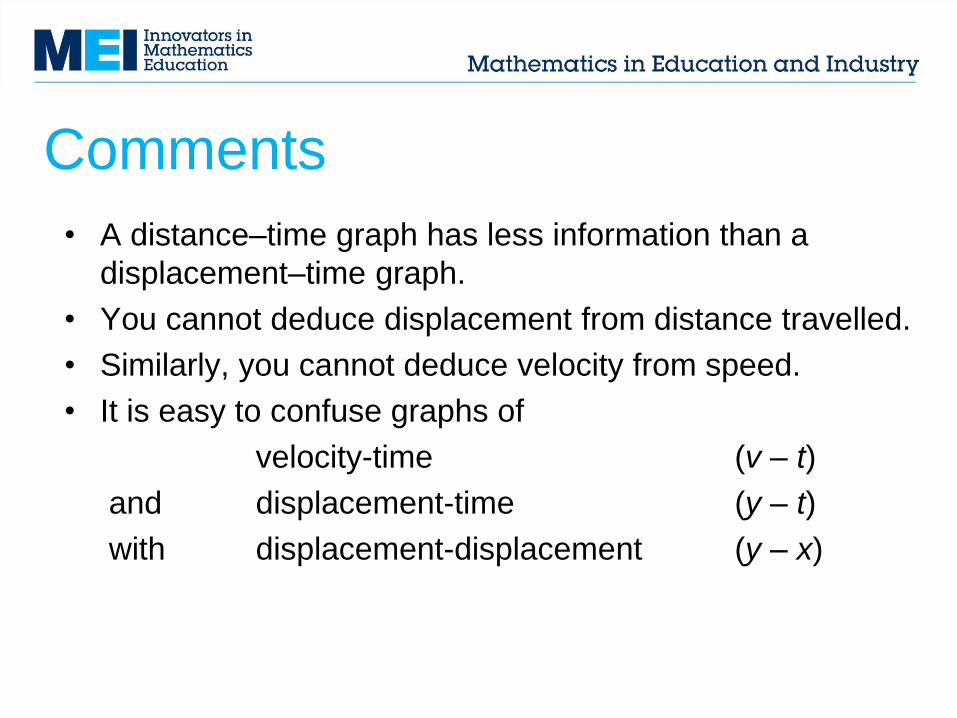
Comments
• A distance–time graph has less information than a
displacement–time graph.
• You cannot deduce displacement from distance travelled.
• Similarly, you cannot deduce velocity from speed.
• It is easy to confuse graphs of
velocity-time (v – t)
and displacement-time (y – t)
with displacement-displacement (y – x)
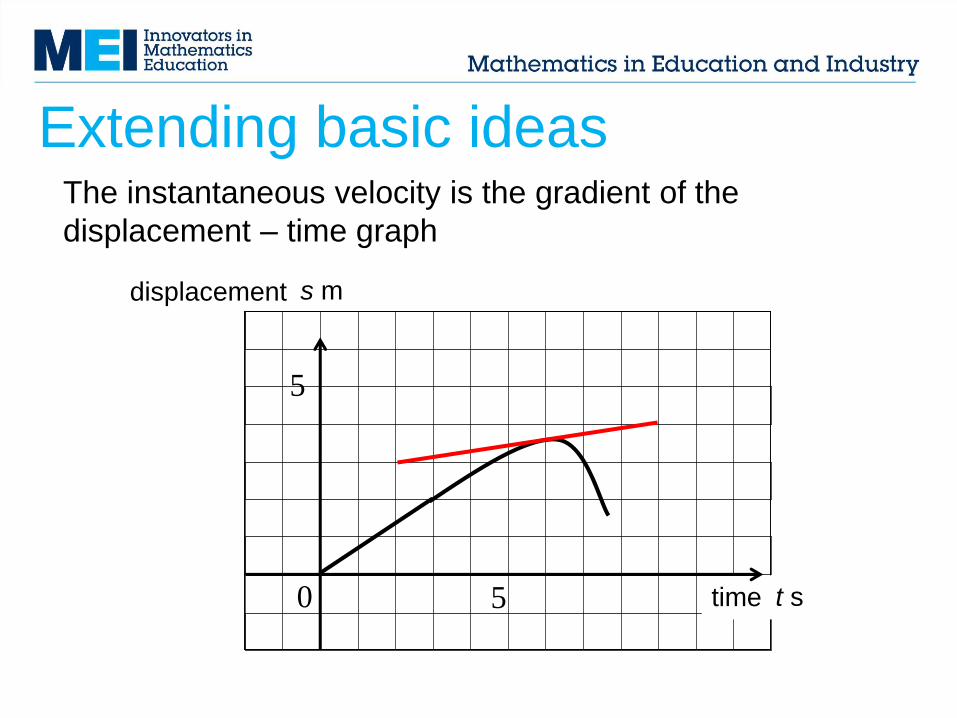
Extending basic ideasThe instantaneous velocity is the gradient of the
displacement – time graph
time 0
displacement
5
5 t s
s m
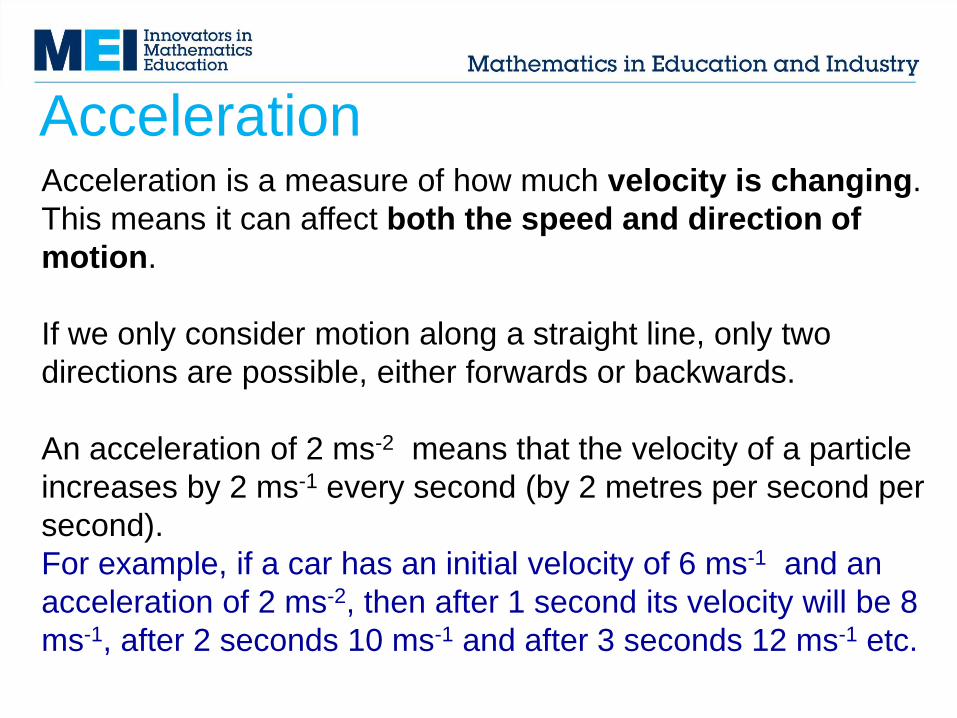
Acceleration is a measure of how much velocity is changing.
This means it can affect both the speed and direction of
motion.
If we only consider motion along a straight line, only two
directions are possible, either forwards or backwards.
An acceleration of 2 ms-2 means that the velocity of a particle
increases by 2 ms-1 every second (by 2 metres per second per
second).
For example, if a car has an initial velocity of 6 ms-1 and an
acceleration of 2 ms-2, then after 1 second its velocity will be 8
ms-1, after 2 seconds 10 ms-1 and after 3 seconds 12 ms-1 etc.
Acceleration
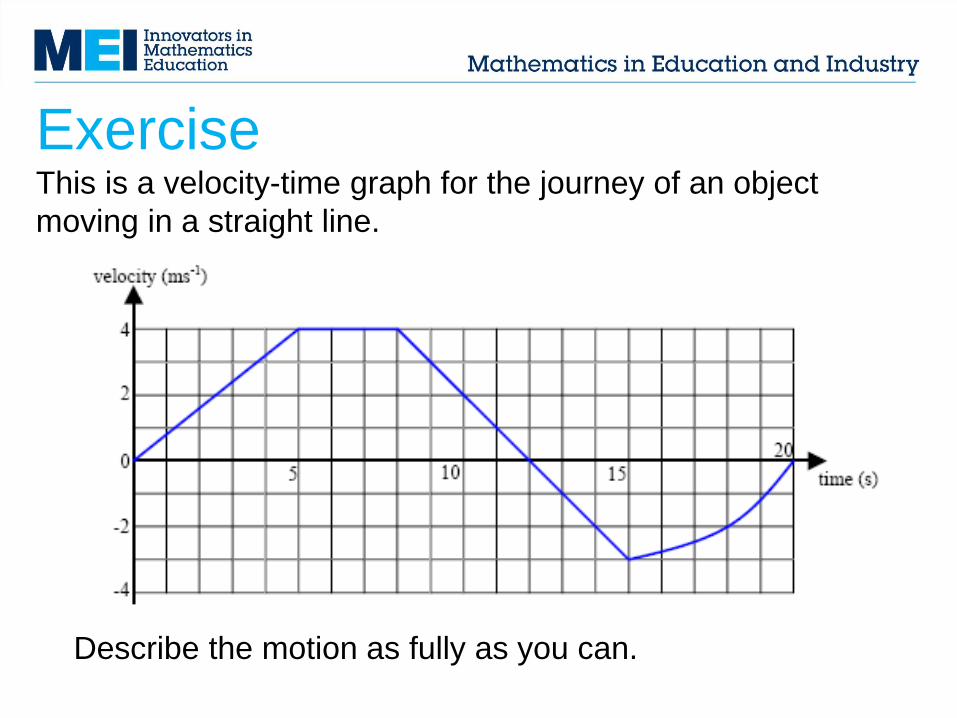
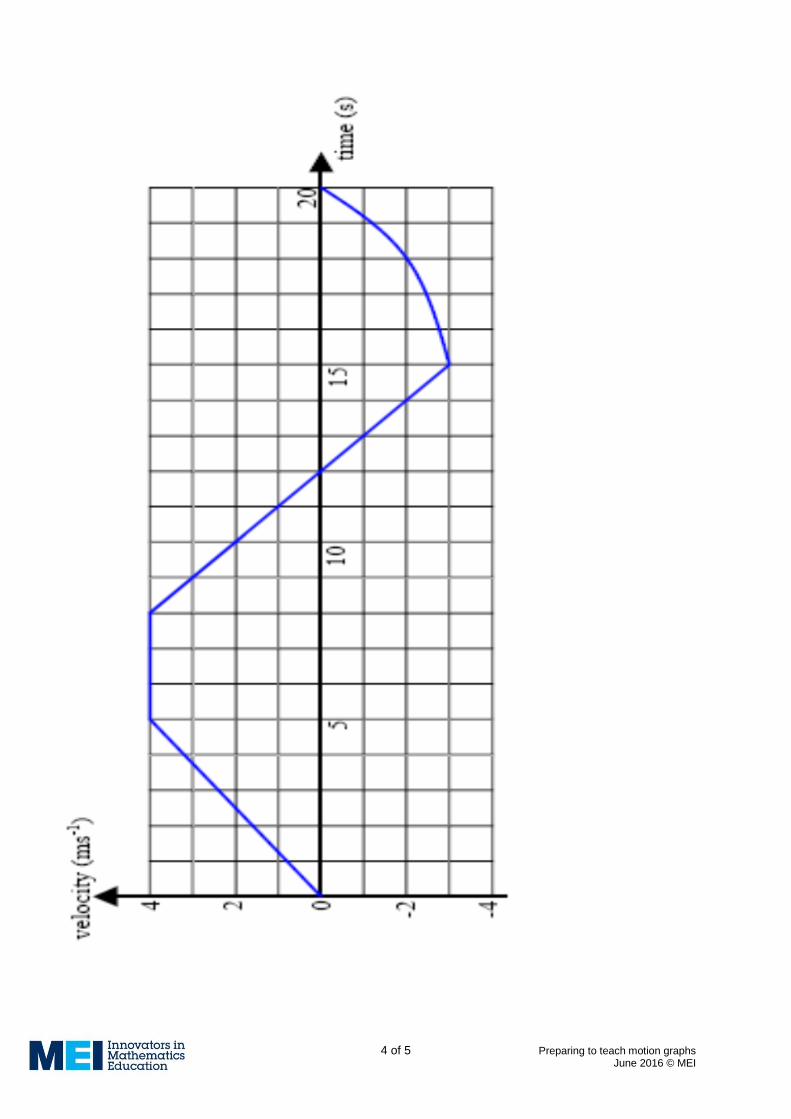
Describe the motion as fully as you can.
Exercise This is a velocity-time graph for the journey of an object
moving in a straight line.
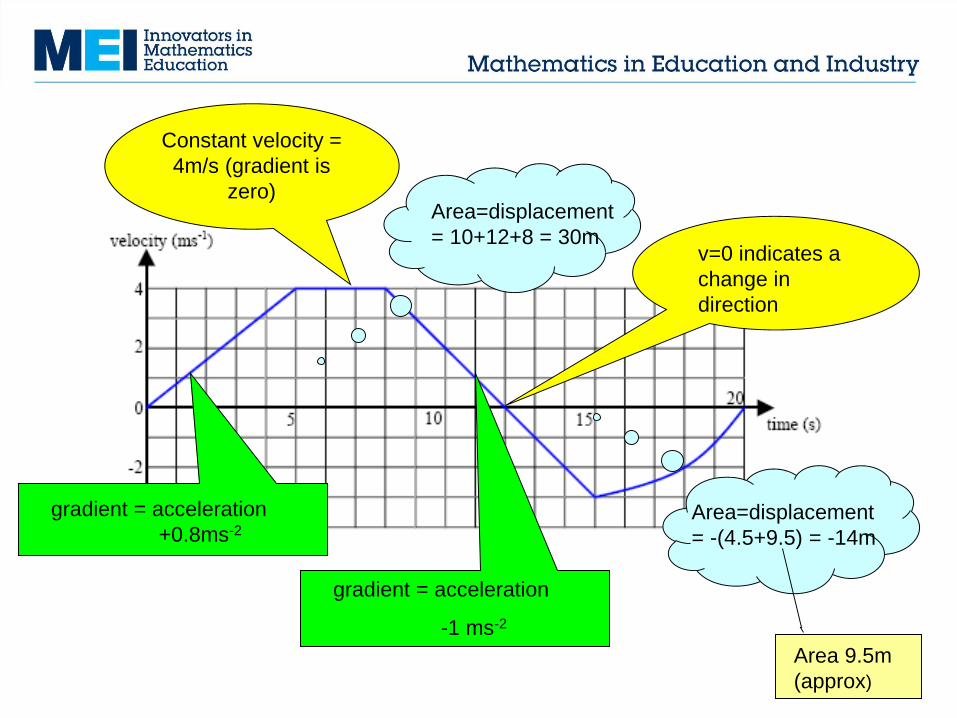
gradient = acceleration
+0.8ms-2
gradient = acceleration
-1 ms-2
Area=displacement
= -(4.5+9.5) = -14m
Area 9.5m
(approx)
Constant velocity =
4m/s (gradient is
zero)Area=displacement
= 10+12+8 = 30mv=0 indicates a
change in
direction
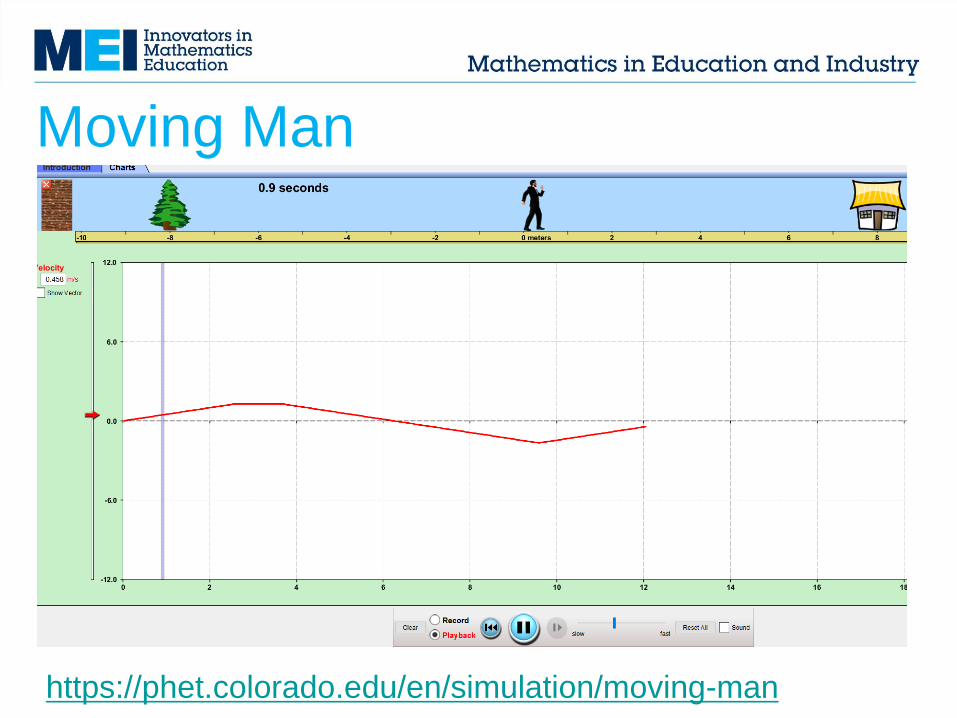
Moving Man
https://phet.colorado.edu/en/simulation/moving-man
If a particle has a negative acceleration but a positive
velocity, then it will slow down to a stop and then move in
the opposite direction, with its speed steadily increasing.
Take care with the word deceleration. It is probably better
not to use it! Use negative accelerations instead.
Take care that the units of acceleration are ms-2. This is
usually read as ‘metres per second squared’, or sometimes
as ‘metres per second per second’.
Accelerations can be found using the gradients of
velocity-time graphs.
Acceleration
Key features of velocity-time
graphs
• GRADIENT represents acceleration
• AREA UNDER GRAPH represents displacement
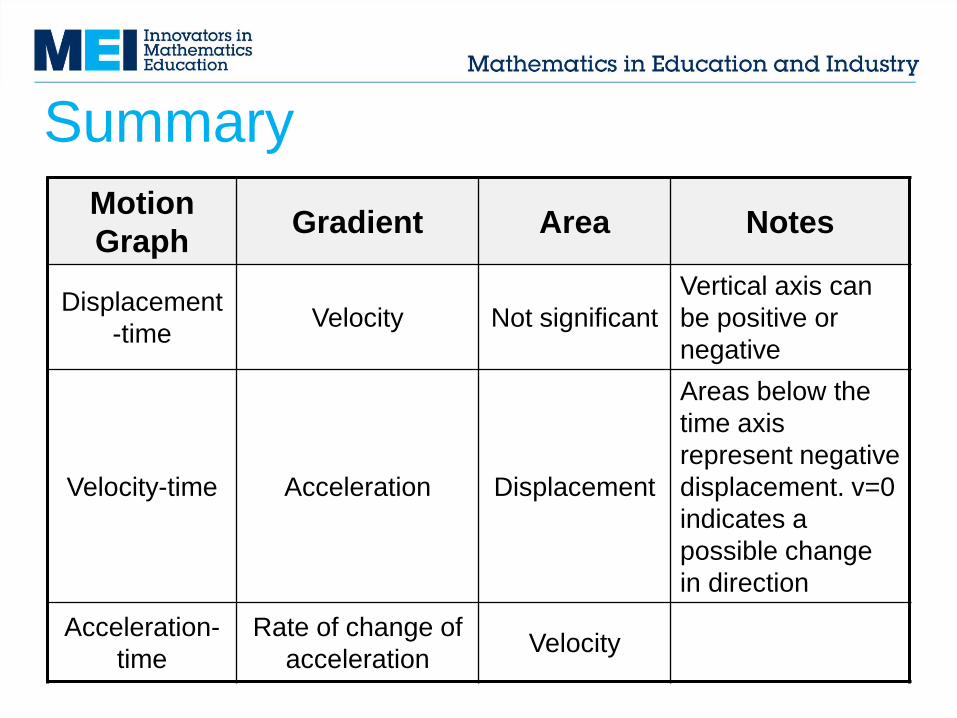
Summary
Motion
GraphGradient Area Notes
Displacement
-timeVelocity Not significant
Vertical axis can
be positive or
negative
Velocity-time Acceleration Displacement
Areas below the
time axis
represent negative
displacement. v=0
indicates a
possible change
in direction
Acceleration-
time
Rate of change of
accelerationVelocity

About MEI
• Registered charity committed to improving
mathematics education
• Independent UK curriculum development body
• We offer continuing professional development
courses, provide specialist tuition for students
and work with industry to enhance mathematical
skills in the workplace
• We also pioneer the development of innovative
teaching and learning resources


![Mechanics - Mathematics in Education and Industrymei.org.uk/files/conference17/Session-E3A.pdf · 2018-04-04 · against time and interpretation of gradient and area under the graph]](https://img.pdfslide.net/doc/110x75/5b1ad1677f8b9a37258e13b2/mechanics-mathematics-in-education-and-2018-04-04-against-time-and-interpretation.jpg)