Embed Size (px)
Citation preview
RESEARCH
Key Facts
Total available industrial
space fell by 8.1% over the
past quarter to 943,277m2.
Prime net face rents
increased by 1.6% per
annum to average $79/m2.
Industrial sales in the 12
months to June 2017
totalled $813.3 million, 67%
ahead of the long term
average.
Average industrial land
values (ex. City Fringe) for
small and medium sized lots
increased by 8.2% and 6.6%
respectively in the past year.
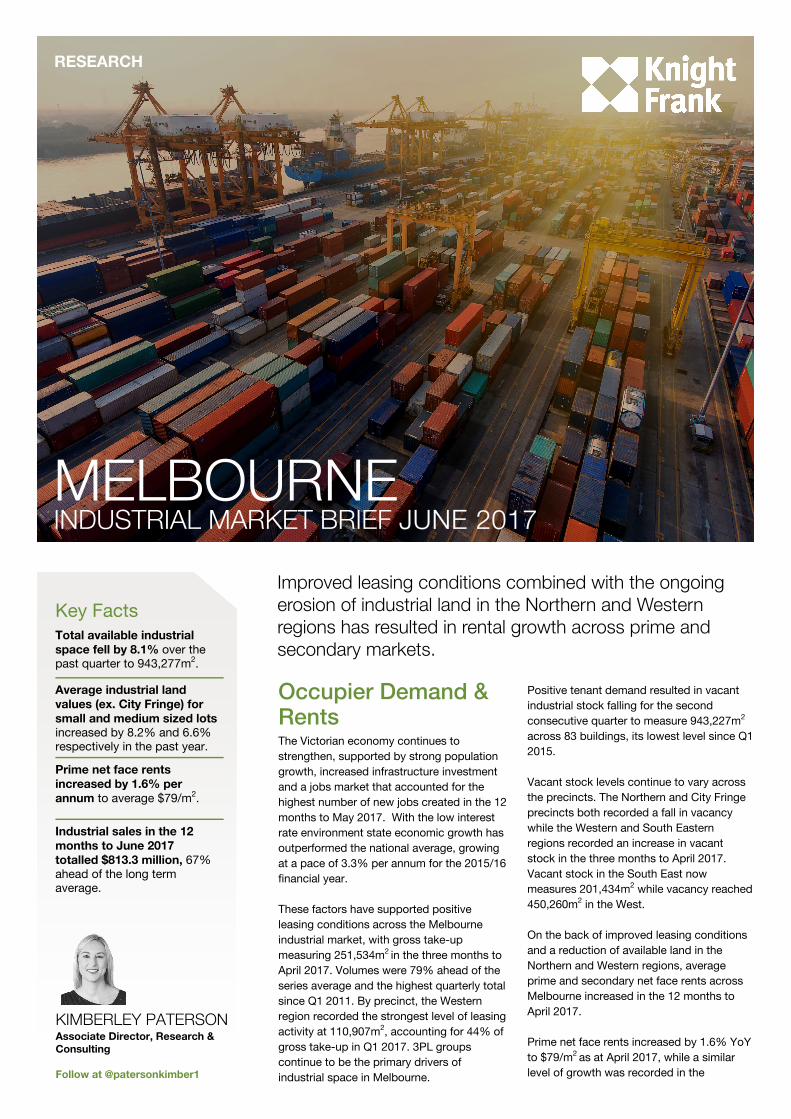
Improved leasing conditions combined with the ongoing erosion of industrial land in the Northern and Western regions has resulted in rental growth across prime and secondary markets.
Occupier Demand & Rents The Victorian economy continues to
strengthen, supported by strong population
growth, increased infrastructure investment
and a jobs market that accounted for the
highest number of new jobs created in the 12
months to May 2017. With the low interest
rate environment state economic growth has
outperformed the national average, growing
at a pace of 3.3% per annum for the 2015/16
financial year.
These factors have supported positive
leasing conditions across the Melbourne
industrial market, with gross take-up
measuring 251,534m2 in the three months to
April 2017. Volumes were 79% ahead of the
series average and the highest quarterly total
since Q1 2011. By precinct, the Western
region recorded the strongest level of leasing
activity at 110,907m2, accounting for 44% of
gross take-up in Q1 2017. 3PL groups
continue to be the primary drivers of
industrial space in Melbourne.
Positive tenant demand resulted in vacant
industrial stock falling for the second
consecutive quarter to measure 943,227m2
across 83 buildings, its lowest level since Q1
2015.
Vacant stock levels continue to vary across
the precincts. The Northern and City Fringe
precincts both recorded a fall in vacancy
while the Western and South Eastern
regions recorded an increase in vacant
stock in the three months to April 2017.
Vacant stock in the South East now
measures 201,434m2 while vacancy reached
450,260m2 in the West.
On the back of improved leasing conditions
and a reduction of available land in the
Northern and Western regions, average
prime and secondary net face rents across
Melbourne increased in the 12 months to
April 2017.
Prime net face rents increased by 1.6% YoY
to $79/m2 as at April 2017, while a similar
level of growth was recorded in the
MELBOURNE INDUSTRIAL MARKET BRIEF JUNE 2017
KIMBERLEY PATERSON Associate Director, Research &
Consulting
Follow at @patersonkimber1
2
Shop’s (37,700m2) purpose built facilities
at West Industry Park, Truganina and
Drystone Industrial Estate, Laverton North
respectively.
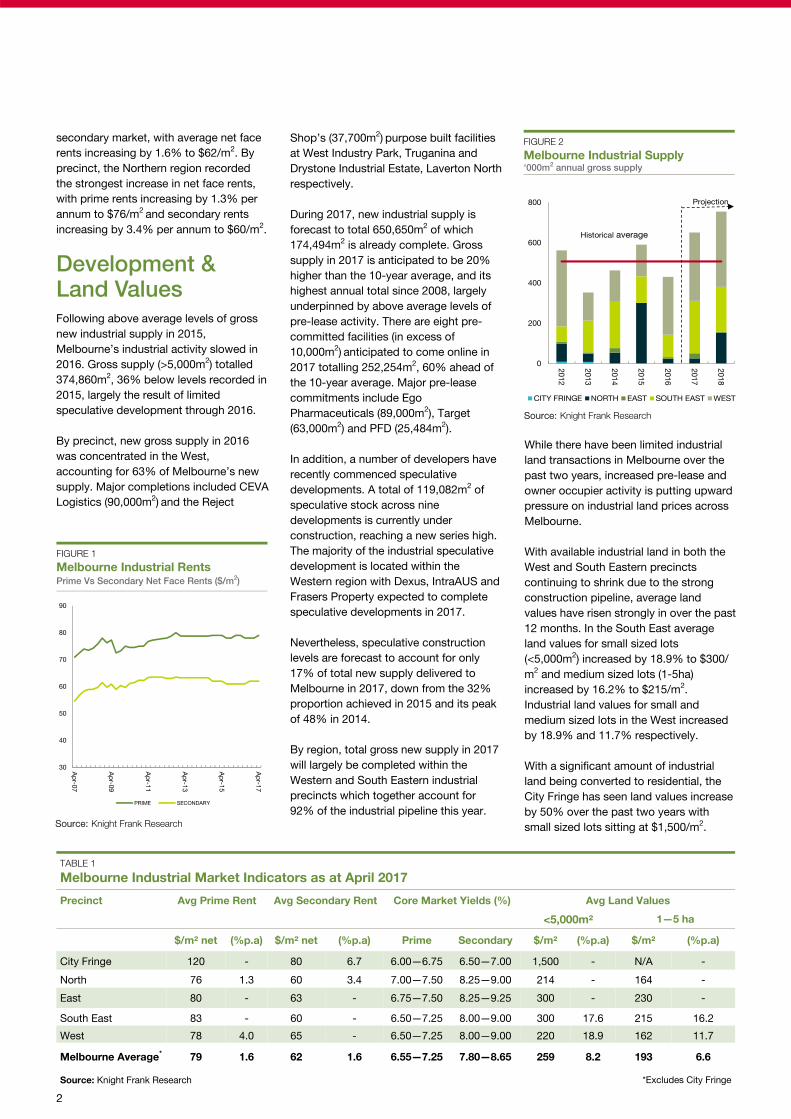
During 2017, new industrial supply is
forecast to total 650,650m2 of which
174,494m2 is already complete. Gross
supply in 2017 is anticipated to be 20%
higher than the 10-year average, and its
highest annual total since 2008, largely
underpinned by above average levels of
pre-lease activity. There are eight pre-
committed facilities (in excess of
10,000m2) anticipated to come online in
2017 totalling 252,254m2, 60% ahead of
the 10-year average. Major pre-lease
commitments include Ego
Pharmaceuticals (89,000m2), Target
(63,000m2) and PFD (25,484m
2).
In addition, a number of developers have
recently commenced speculative
developments. A total of 119,082m2 of
speculative stock across nine
developments is currently under
construction, reaching a new series high.
The majority of the industrial speculative
development is located within the
Western region with Dexus, IntraAUS and
Frasers Property expected to complete
speculative developments in 2017.
Nevertheless, speculative construction
levels are forecast to account for only
17% of total new supply delivered to
Melbourne in 2017, down from the 32%
proportion achieved in 2015 and its peak
of 48% in 2014.
By region, total gross new supply in 2017
will largely be completed within the
Western and South Eastern industrial
precincts which together account for
92% of the industrial pipeline this year.
While there have been limited industrial
land transactions in Melbourne over the
past two years, increased pre-lease and
owner occupier activity is putting upward
pressure on industrial land prices across
Melbourne.
With available industrial land in both the
West and South Eastern precincts
continuing to shrink due to the strong
construction pipeline, average land
values have risen strongly in over the past
12 months. In the South East average
land values for small sized lots
(<5,000m2) increased by 18.9% to $300/
m2 and medium sized lots (1-5ha)
increased by 16.2% to $215/m2.
Industrial land values for small and
medium sized lots in the West increased
by 18.9% and 11.7% respectively.
With a significant amount of industrial
land being converted to residential, the
City Fringe has seen land values increase
by 50% over the past two years with
small sized lots sitting at $1,500/m2.
FIGURE 2
Melbourne Industrial Supply ‘000m
2 annual gross supply
secondary market, with average net face
rents increasing by 1.6% to $62/m2. By
precinct, the Northern region recorded
the strongest increase in net face rents,
with prime rents increasing by 1.3% per
annum to $76/m2 and secondary rents
increasing by 3.4% per annum to $60/m2.
Development & Land Values Following above average levels of gross
new industrial supply in 2015,
Melbourne’s industrial activity slowed in
2016. Gross supply (>5,000m2) totalled
374,860m2, 36% below levels recorded in
2015, largely the result of limited
speculative development through 2016.
By precinct, new gross supply in 2016
was concentrated in the West,
accounting for 63% of Melbourne’s new
supply. Major completions included CEVA
Logistics (90,000m2) and the Reject
TABLE 1
Melbourne Industrial Market Indicators as at April 2017
Precinct Avg Prime Rent Avg Secondary Rent Core Market Yields (%) Avg Land Values
<5,000m² 1—5 ha
$/m² net (%p.a) $/m² net (%p.a) Prime Secondary $/m² (%p.a) $/m² (%p.a)
City Fringe 120 - 80 6.7 6.00—6.75 6.50—7.00 1,500 - N/A -
North 76 1.3 60 3.4 7.00—7.50 8.25—9.00 214 - 164 -
East 80 - 63 - 6.75—7.50 8.25—9.25 300 - 230 -
South East 83 - 60 - 6.50—7.25 8.00—9.00 300 17.6 215 16.2
West 78 4.0 65 - 6.50—7.25 8.00—9.00 220 18.9 162 11.7
Melbourne Average* 79 1.6 62 1.6 6.55—7.25 7.80—8.65 259 8.2 193 6.6
Source: Knight Frank Research *Excludes City Fringe
FIGURE 1
Melbourne Industrial Rents Prime Vs Secondary Net Face Rents ($/m
2)
Source: Knight Frank Research
Source: Knight Frank Research
30
40
50
60
70
80
90
Ap
r-07
Ap
r-09
Ap
r-11
Ap
r-13
Ap
r-15
Ap
r-17
PRIME SECONDARY
0
200
400
600
800
2012
2013
2014
2015
2016
2017
2018
CITY FRINGE NORTH EAST SOUTH EAST WEST
Historical average
Projection
3
RESEARCH MELBOURNE INDUSTRIAL BRIEF JUNE 2017
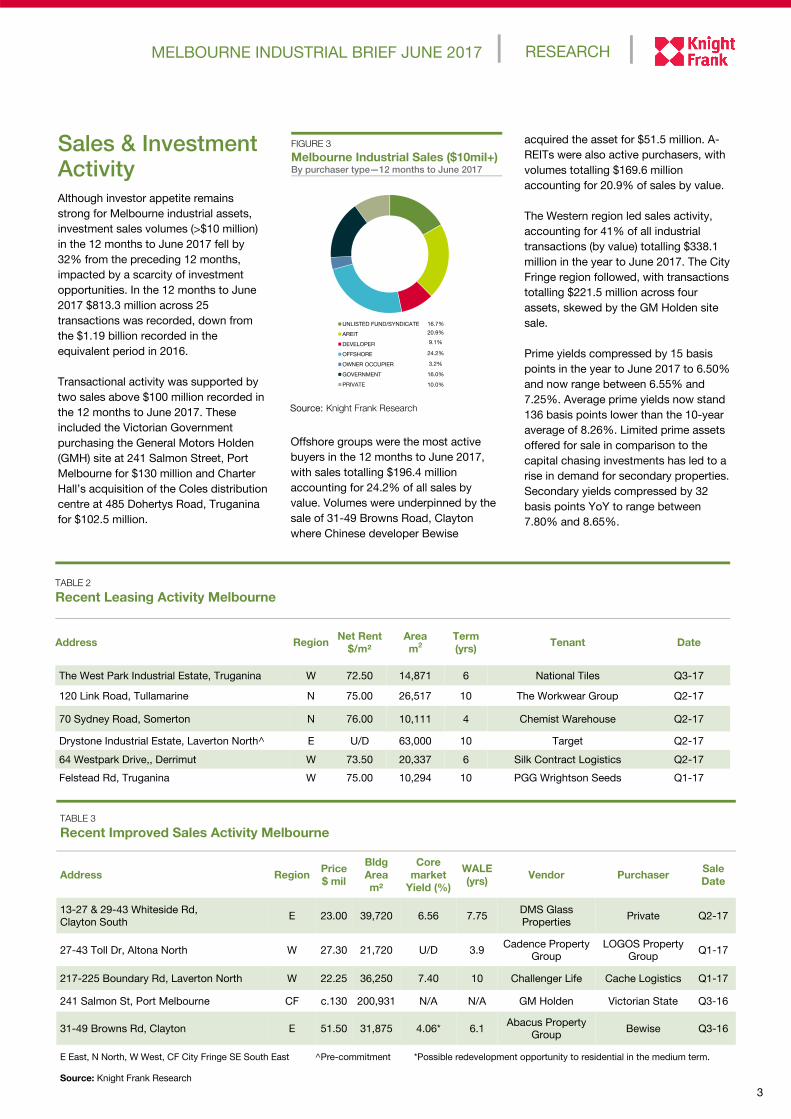
Sales & Investment Activity Although investor appetite remains
strong for Melbourne industrial assets,
investment sales volumes (>$10 million)
in the 12 months to June 2017 fell by
32% from the preceding 12 months,
impacted by a scarcity of investment
opportunities. In the 12 months to June
2017 $813.3 million across 25
transactions was recorded, down from
the $1.19 billion recorded in the
equivalent period in 2016.
Transactional activity was supported by
two sales above $100 million recorded in
the 12 months to June 2017. These
included the Victorian Government
purchasing the General Motors Holden
(GMH) site at 241 Salmon Street, Port
Melbourne for $130 million and Charter
Hall’s acquisition of the Coles distribution
centre at 485 Dohertys Road, Truganina
for $102.5 million.
Offshore groups were the most active
buyers in the 12 months to June 2017,
with sales totalling $196.4 million
accounting for 24.2% of all sales by
value. Volumes were underpinned by the
sale of 31-49 Browns Road, Clayton
where Chinese developer Bewise
TABLE 2
Recent Leasing Activity Melbourne
Address Region Net Rent
$/m²
Area
m2
Term
(yrs) Tenant Date
The West Park Industrial Estate, Truganina W 72.50 14,871 6 National Tiles Q3-17
120 Link Road, Tullamarine N 75.00 26,517 10 The Workwear Group Q2-17
70 Sydney Road, Somerton N 76.00 10,111 4 Chemist Warehouse Q2-17
Drystone Industrial Estate, Laverton North^ E U/D 63,000 10 Target Q2-17
Felstead Rd, Truganina W 75.00 10,294 10 PGG Wrightson Seeds Q1-17
64 Westpark Drive,, Derrimut W 73.50 20,337 6 Silk Contract Logistics Q2-17
TABLE 3
Recent Improved Sales Activity Melbourne
Address Region Price
$ mil
Bldg
Area
m²
Core
market
Yield (%)
WALE
(yrs) Vendor Purchaser
Sale
Date
13-27 & 29-43 Whiteside Rd,
Clayton South E 23.00 39,720 6.56 7.75
DMS Glass
Properties Private Q2-17
27-43 Toll Dr, Altona North W 27.30 21,720 U/D 3.9 Cadence Property
Group
LOGOS Property
Group Q1-17
217-225 Boundary Rd, Laverton North W 22.25 36,250 7.40 10 Challenger Life Cache Logistics Q1-17
241 Salmon St, Port Melbourne CF c.130 200,931 N/A N/A GM Holden Victorian State Q3-16
31-49 Browns Rd, Clayton E 51.50 31,875 4.06* 6.1 Abacus Property
Group Bewise Q3-16
Source: Knight Frank Research
E East, N North, W West, CF City Fringe SE South East ^Pre-commitment *Possible redevelopment opportunity to residential in the medium term.
FIGURE 3
Melbourne Industrial Sales ($10mil+) By purchaser type—12 months to June 2017
Source: Knight Frank Research
acquired the asset for $51.5 million. A-
REITs were also active purchasers, with
volumes totalling $169.6 million
accounting for 20.9% of sales by value.
The Western region led sales activity,
accounting for 41% of all industrial
transactions (by value) totalling $338.1
million in the year to June 2017. The City
Fringe region followed, with transactions
totalling $221.5 million across four
assets, skewed by the GM Holden site
sale.
Prime yields compressed by 15 basis
points in the year to June 2017 to 6.50%
and now range between 6.55% and
7.25%. Average prime yields now stand
136 basis points lower than the 10-year
average of 8.26%. Limited prime assets
offered for sale in comparison to the
capital chasing investments has led to a
rise in demand for secondary properties.
Secondary yields compressed by 32
basis points YoY to range between
7.80% and 8.65%.
UNLISTED FUND/SYNDICATE
AREIT
DEVELOPER
OFFSHORE
OWNER OCCUPIER
GOVERNMENT
PRIVATE
16.7%
20.9%
9.1%
24.2%
3.2%
16.0%
10.0%
Knight Frank Research provides strategic
advice, consultancy services and
forecasting to a wide range of clients
worldwide including developers,
investors, funding organisations,
corporate institutions and the public
sector. All our clients recognise the need
for expert independent advice customised
to their specific needs.
RECENT MARKET-LEADING RESEARCH PUBLICATIONS
Melbourne CBD
Retail Market Brief
June 2017
Australia
Infrastructure Insight
June 2017
The Wealth Report
2017
Knight Frank Research Reports are available at KnightFrank.com.au/Research
Sydney Industrial
Market Brief
May 2017
RESEARCH
Kimberley Paterson Associate Director, Victoria
+61 3 9604 4608
[email protected] VICTORIA
James Templeton Managing Director, Victoria
+61 3 9604 4724
INDUSTRIAL
Gab Pascuzzi Senior Director, Head of Division
Victoria
+61 3 9604 4649
Ben Hackworthy Director, Business Space
+61 3 9604 4731
Adrian Garvey Director In Charge
Eastern Office Industrial
+61 3 8545 8616
VALUATIONS
Michael Schuh Joint Managing Director—Victoria
+61 3 9604 4726
Outlook The positive outlook for the Victorian
economy is expected to sustain strong
leasing conditions over the next 12
months, with state GDP forecast to be
above the 10-year average at 2.8% in
2017. While vacancy levels appear to have
reached their peak, rental growth over the
next 12 months is likely to remain
relatively modest as a result of backfill
vacancies continuing to come to the
market.
There are currently a number of major
transport infrastructure projects under
construction across Melbourne. The
Victorian Government recently announced
they will partner with Transurban in the
$5.5 billion West Gate Tunnel Project
which includes the Monash Freeway
upgrade and access improvements for
Webb Dock, improving access and
reducing travel time to the Port of
Melbourne. Construction is expected to
commence in 2018 and will complete in
2022.
Furthermore, the recently announced
public-private partnership to invest $1.8
billion in improving nearly 700 kilometres
of arterial routes throughout the Western
suburban region will further strengthen
industrial supply in the West. Construction
is expected to commence throughout
2017 and due to be completed in 2022.
The relatively deep pool of unsatisfied
capital will continue to maintain the high
level of demand for investment
opportunities in 2017. Domestic investors
will face strong competition from offshore
groups actively seeking opportunities to
grow their presence in the Australian
industrial market.
With strong investment appetite from both
domestic and offshore purchasers,
coupled with limited industrial properties
offered for sale, there is further scope for
yield compression over the next 12
months in both prime and secondary
markets.
Definitions: Prime: Asset with modern design, good condition & utility with an office component 10-30%. Located in an established industrial precinct with good access. Secondary: Asset with an older design, in reasonable/poor condition, inferior to prime stock, with an office component between 10-20%. Core Market Yield: The percentage return/yield analysed with the assessed fully leased market income is divided by the adopted value/price which has been adjusted to account for property specific issues (ie rental reversions, rental downtime for imminent expiries, capital expenditure, current vacancies, incentives etc).
For the latest news, views and analysisof the commercial property market, visitknightfrankblog.com/commercial-briefing/
COMMERCIAL BRIEFING
Important Notice
© Knight Frank Australia Pty Ltd 2017 – This report is published for general information only and not to be relied upon in
any way. Although high standards have been used in the preparation of the information, analysis, views and projections
presented in this report, no responsibility or liability whatsoever can be accepted by Knight Frank Australia Pty Ltd for
any loss or damage resultant from any use of, reliance on or reference to the contents of this document. As a general
report, this material does not necessarily represent the view of Knight Frank Australia Pty Ltd in relation to particular
properties or projects. Reproduction of this report in whole or in part is not allowed without prior written approval of
Knight Frank Australia Pty Ltd to the form and content within which it appears.