Embed Size (px)
Citation preview

H E A L T H W E A L T H C A R E E R
M E R C E R ’ S 2 0 1 6C O M P E N S AT I O N P L A N N I N GS E M I N ARD O I N G M O R E W I T H L E S S
Vancouver
SEPTEMBER 2015

© MERCER 2015 1
T O D AY ’ S P R E S E N T E R S
H E L M U TP A S T R I C K
A I L S AF O R S G R E N
G R A H A MD O D D
T O D AY ’ S P R E S E N T E R S
© MERCER 2015 2
T O D AY ’ S D I S C U S S I O N
ECONOMICOUTLOOK
01HIGHLIGHTSFROM THE
SURVEY
02INSIDE
EMPLOYEES’MINDS
03

Economic Outlook
Mercer 2016 CompensationPlanning Seminar – Vancouver
September 15, 2015
Helmut PastrickChief EconomistCentral 1 Credit Union
|
Economics
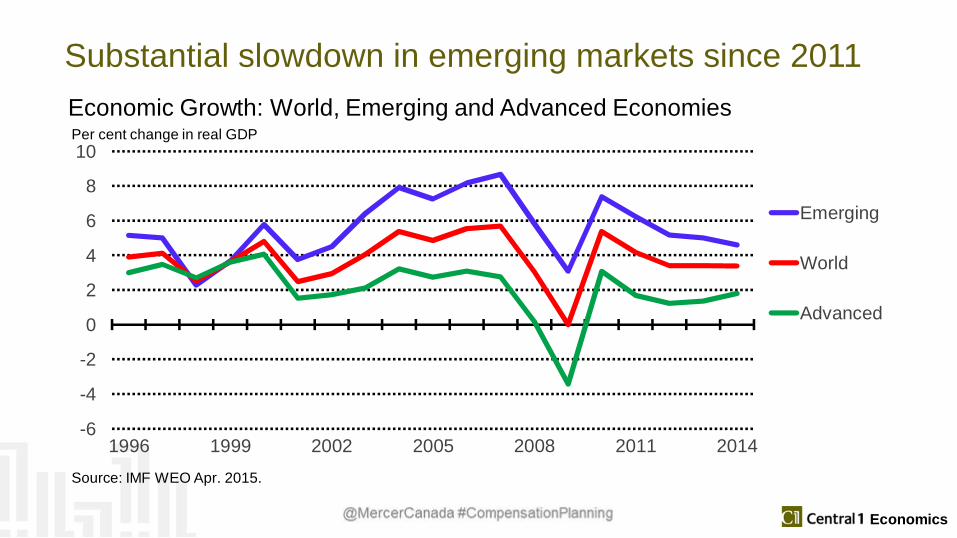
Substantial slowdown in emerging markets since 2011
-6
-4
-2
0
2
4
6
8
10
1996 1999 2002 2005 2008 2011 2014
Emerging
World
Advanced
Per cent change in real GDP
Source: IMF WEO Apr. 2015.
Economic Growth: World, Emerging and Advanced Economies
|
Economics
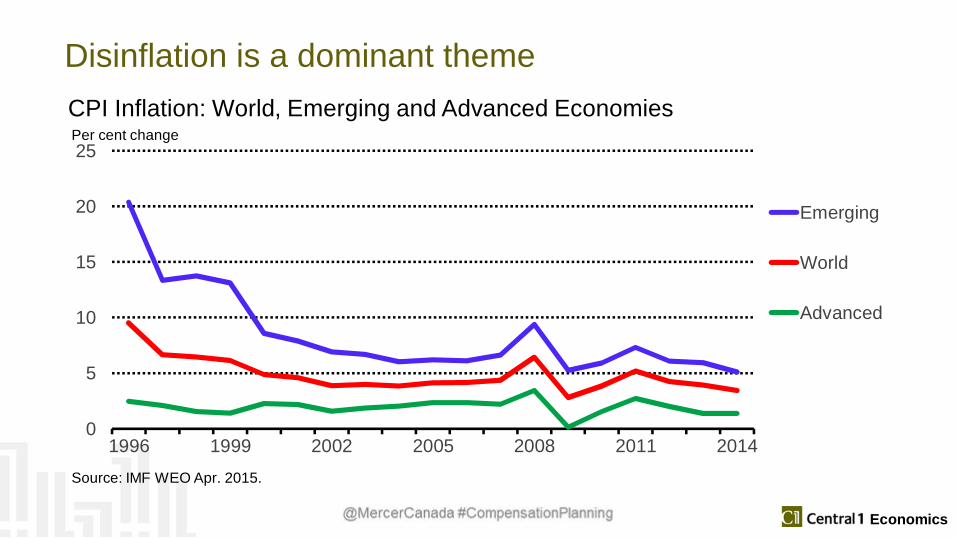
Disinflation is a dominant theme
0
5
10
15
20
25
1996 1999 2002 2005 2008 2011 2014
Emerging
World
Advanced
Per cent change
Source: IMF WEO Apr. 2015.
CPI Inflation: World, Emerging and Advanced Economies
|
Economics
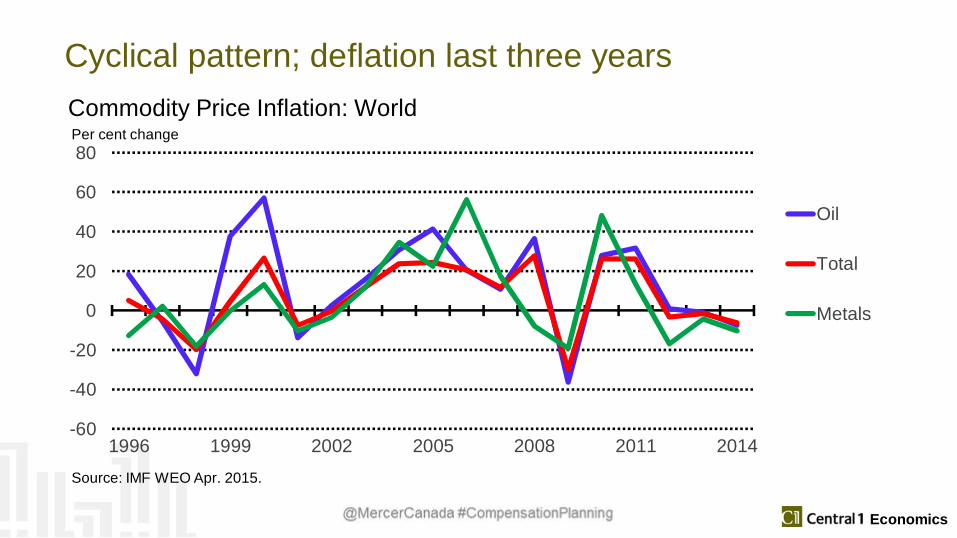
Cyclical pattern; deflation last three years
-60
-40
-20
0
20
40
60
80
1996 1999 2002 2005 2008 2011 2014
Oil
Total
Metals
Per cent change
Source: IMF WEO Apr. 2015.
Commodity Price Inflation: World
|
Economics
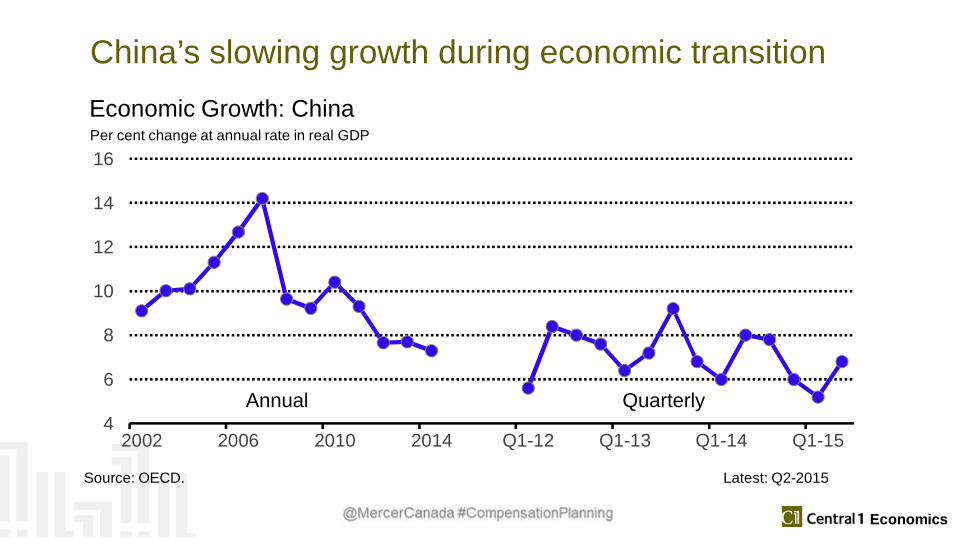
China’s slowing growth during economic transition
4
6
8
10
12
14
16
2002 2006 2010 2014 Q1-12 Q1-13 Q1-14 Q1-15
Per cent change at annual rate in real GDP
Source: OECD. Latest: Q2-2015
Economic Growth: China
Annual Quarterly
|
Economics
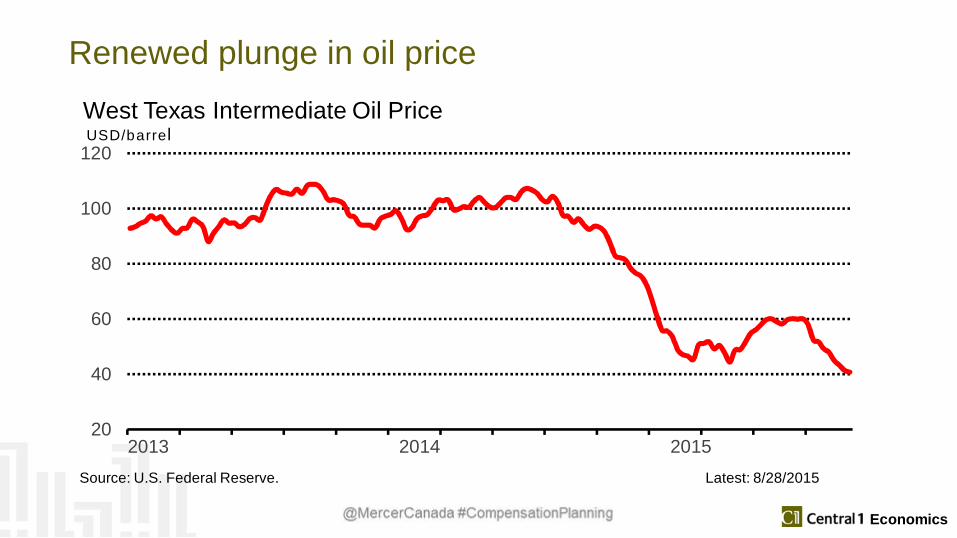
Renewed plunge in oil price
20
40
60
80
100
120
2013 2014 2015
West Texas Intermediate Oil PriceUSD/barrel
Source: U.S. Federal Reserve. Latest: 8/28/2015
|
Economics
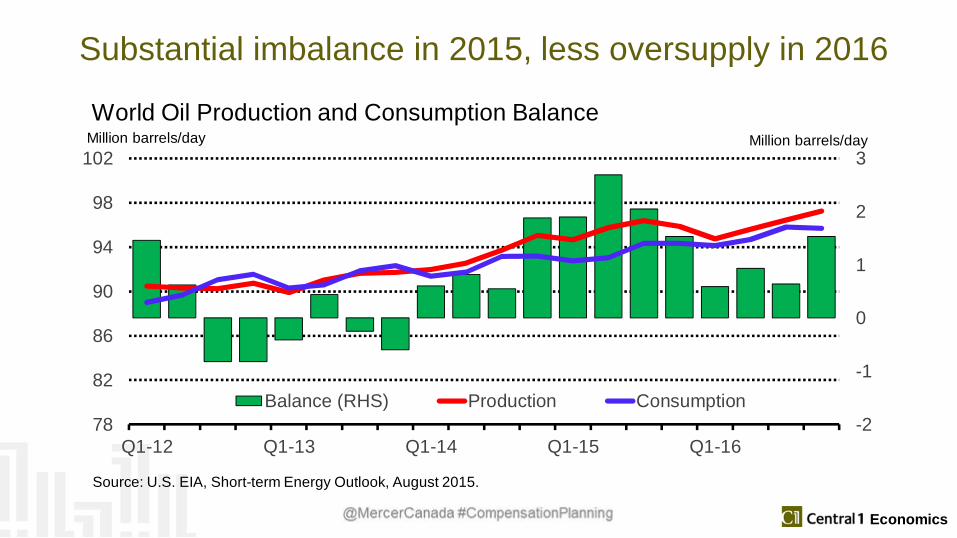
Substantial imbalance in 2015, less oversupply in 2016
-2
-1
0
1
2
3
78
82
86
90
94
98
102
Q1-12 Q1-13 Q1-14 Q1-15 Q1-16
Balance (RHS) Production Consumption
Million barrels/dayWorld Oil Production and Consumption Balance
Million barrels/day
Source: U.S. EIA, Short-term Energy Outlook, August 2015.
|
Economics
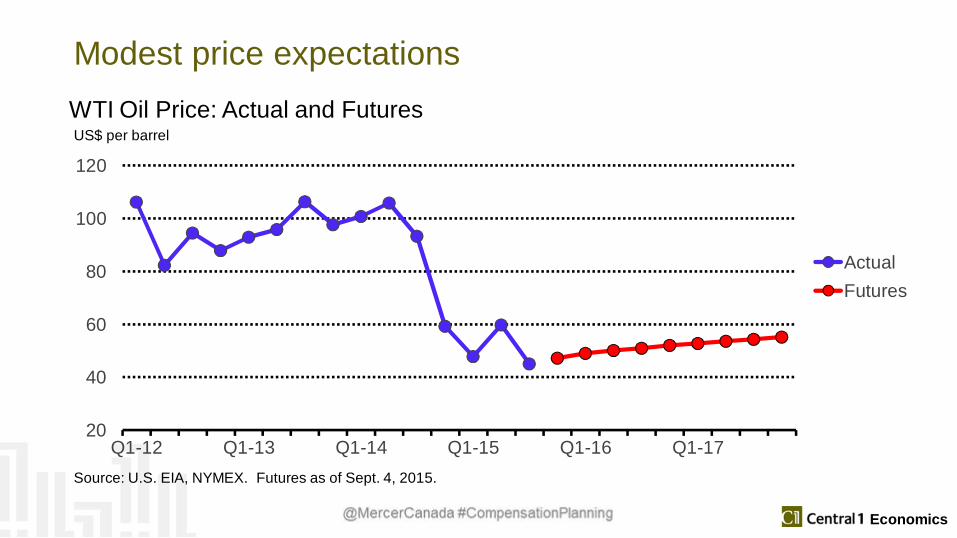
Modest price expectations
20
40
60
80
100
120
Q1-12 Q1-13 Q1-14 Q1-15 Q1-16 Q1-17
ActualFutures
US$ per barrel
Source: U.S. EIA, NYMEX. Futures as of Sept. 4, 2015.
WTI Oil Price: Actual and Futures
|
Economics
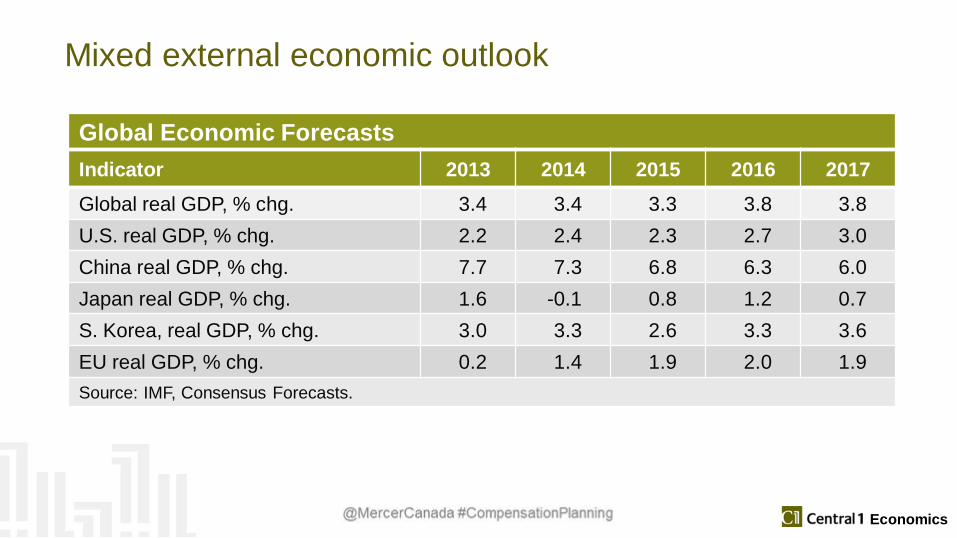
Global Economic ForecastsIndicator 2013 2014 2015 2016 2017Global real GDP, % chg. 3.4 3.4 3.3 3.8 3.8U.S. real GDP, % chg. 2.2 2.4 2.3 2.7 3.0China real GDP, % chg. 7.7 7.3 6.8 6.3 6.0Japan real GDP, % chg. 1.6 -0.1 0.8 1.2 0.7S. Korea, real GDP, % chg. 3.0 3.3 2.6 3.3 3.6EU real GDP, % chg. 0.2 1.4 1.9 2.0 1.9Source: IMF, Consensus Forecasts.
Mixed external economic outlook
|
Economics
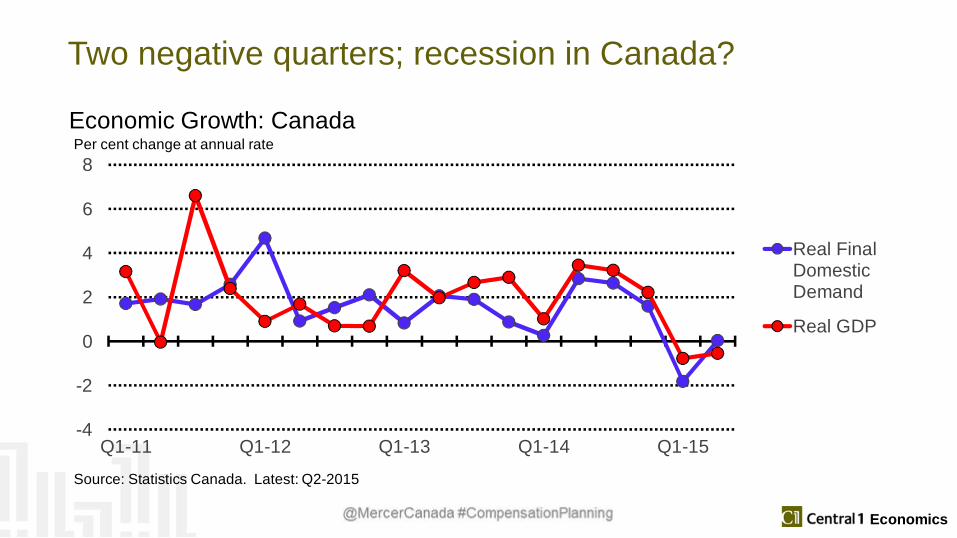
Two negative quarters; recession in Canada?
-4
-2
0
2
4
6
8
Q1-11 Q1-12 Q1-13 Q1-14 Q1-15
Real FinalDomesticDemand
Real GDP
Per cent change at annual rate
Source: Statistics Canada. Latest: Q2-2015
Economic Growth: Canada
|
Economics
Recession criteria:
• The National Bureau of Economic Research in the U.S. defines arecession as “a significant decline in activity spread across theeconomy, lasting more than a few months”
• Three conditions need to be met: duration, depth, and breadth.
|
Economics
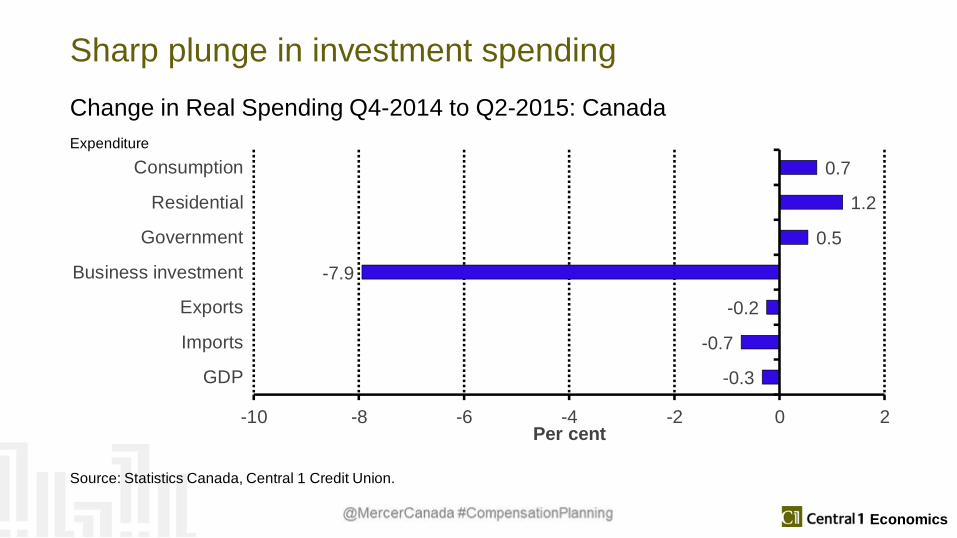
Sharp plunge in investment spending
-0.3
-0.7
-0.2
-7.9
0.5
1.2
0.7
-10 -8 -6 -4 -2 0 2
GDP
Imports
Exports
Business investment
Government
Residential
Consumption
Per cent
Expenditure
Source: Statistics Canada, Central 1 Credit Union.
Change in Real Spending Q4-2014 to Q2-2015: Canada
|
Economics
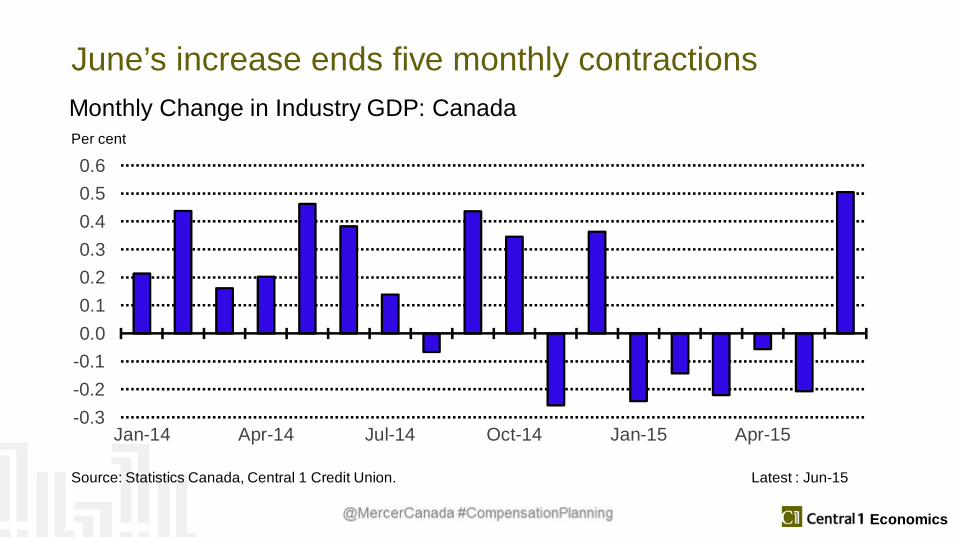
June’s increase ends five monthly contractions
-0.3-0.2-0.10.00.10.20.30.40.50.6
Jan-14 Apr-14 Jul-14 Oct-14 Jan-15 Apr-15
Per cent
Source: Statistics Canada, Central 1 Credit Union. Latest : Jun-15
Monthly Change in Industry GDP: Canada
|
Economics
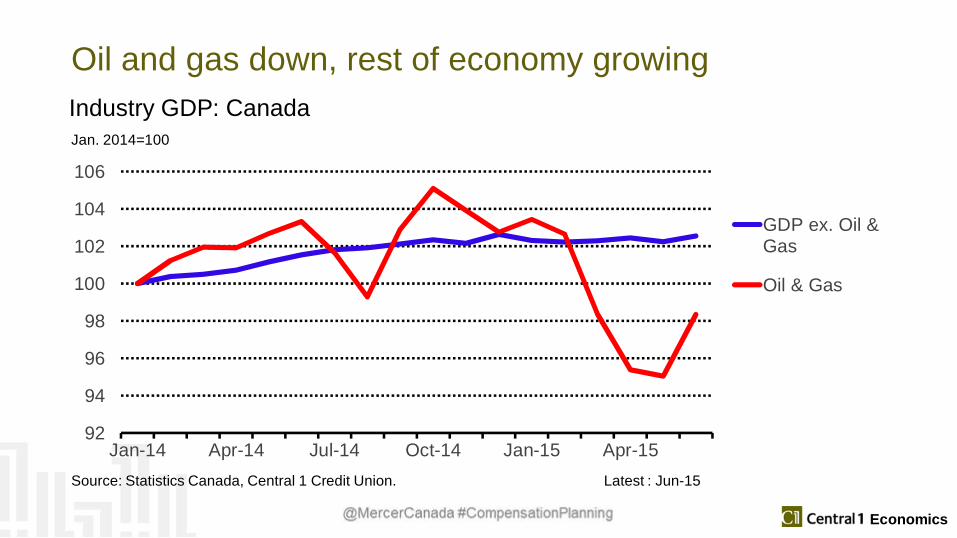
Oil and gas down, rest of economy growing
92
94
96
98
100
102
104
106
Jan-14 Apr-14 Jul-14 Oct-14 Jan-15 Apr-15
GDP ex. Oil &Gas
Oil & Gas
Jan. 2014=100
Source: Statistics Canada, Central 1 Credit Union. Latest : Jun-15
Industry GDP: Canada
|
Economics
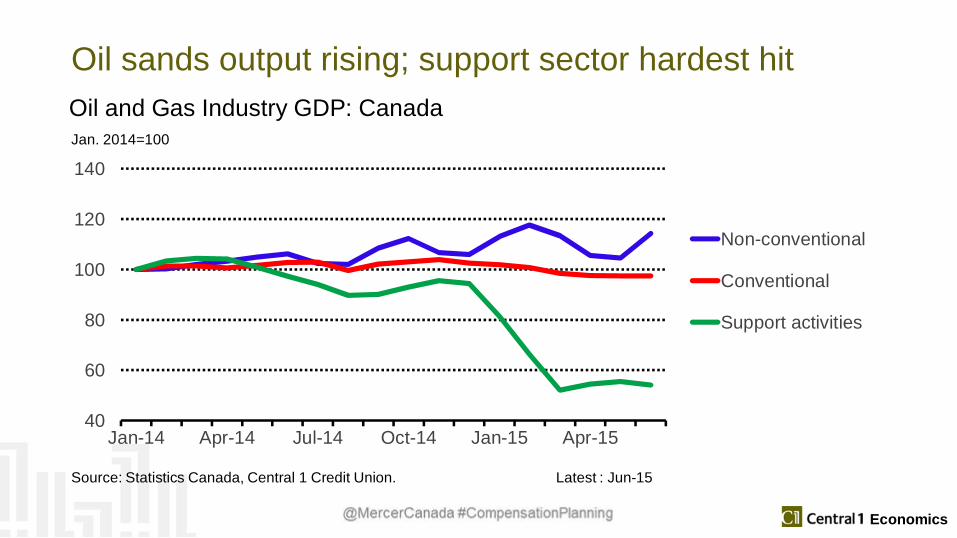
Oil sands output rising; support sector hardest hit
40
60
80
100
120
140
Jan-14 Apr-14 Jul-14 Oct-14 Jan-15 Apr-15
Non-conventional
Conventional
Support activities
Jan. 2014=100
Source: Statistics Canada, Central 1 Credit Union. Latest : Jun-15
Oil and Gas Industry GDP: Canada
|
Economics
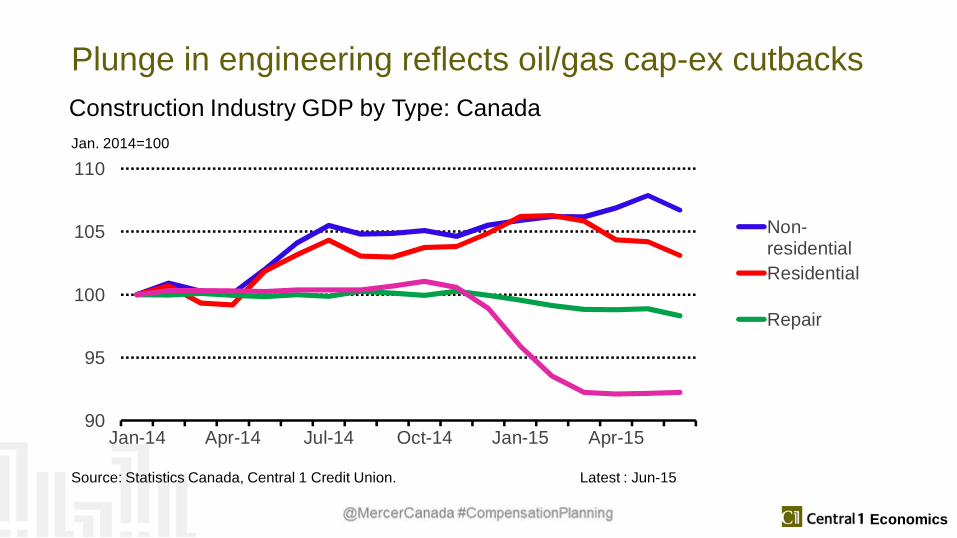
Plunge in engineering reflects oil/gas cap-ex cutbacks
90
95
100
105
110
Jan-14 Apr-14 Jul-14 Oct-14 Jan-15 Apr-15
Non-residentialResidential
Repair
Jan. 2014=100
Source: Statistics Canada, Central 1 Credit Union. Latest : Jun-15
Construction Industry GDP by Type: Canada
|
Economics
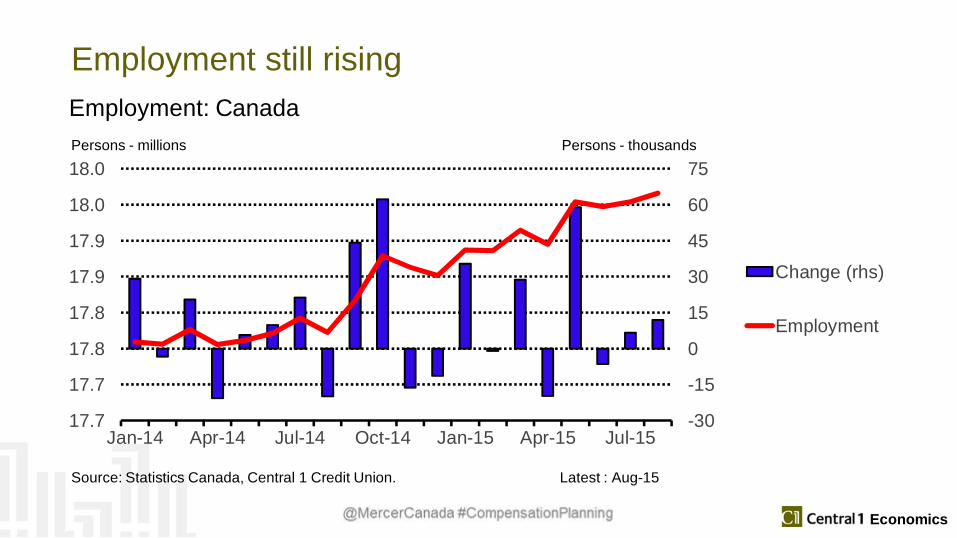
Employment still rising
-30
-15
0
15
30
45
60
75
17.7
17.7
17.8
17.8
17.9
17.9
18.0
18.0
Jan-14 Apr-14 Jul-14 Oct-14 Jan-15 Apr-15 Jul-15
Change (rhs)
Employment
Persons - millions Persons - thousands
Source: Statistics Canada, Central 1 Credit Union. Latest : Aug-15
Employment: Canada
|
Economics
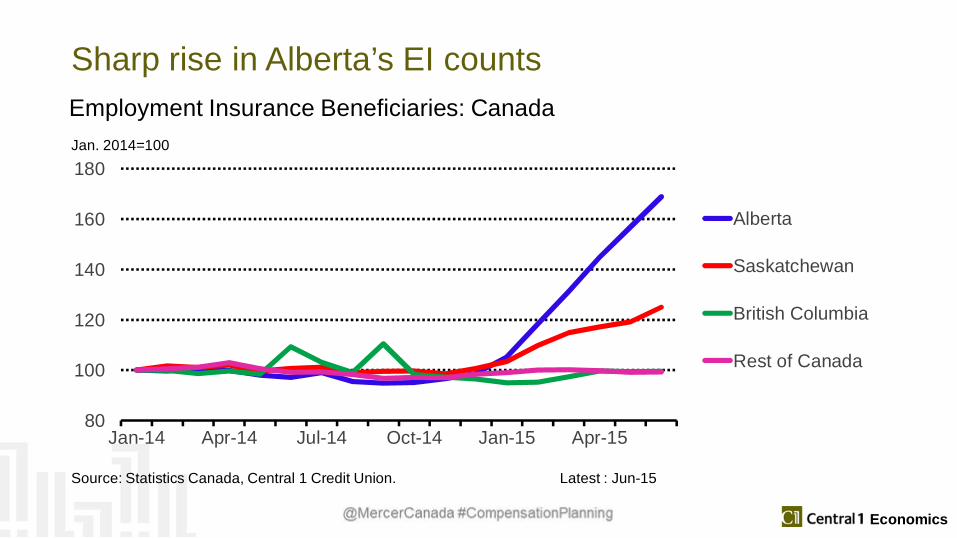
Sharp rise in Alberta’s EI counts
80
100
120
140
160
180
Jan-14 Apr-14 Jul-14 Oct-14 Jan-15 Apr-15
Alberta
Saskatchewan
British Columbia
Rest of Canada
Jan. 2014=100
Source: Statistics Canada, Central 1 Credit Union. Latest : Jun-15
Employment Insurance Beneficiaries: Canada
|
Economics
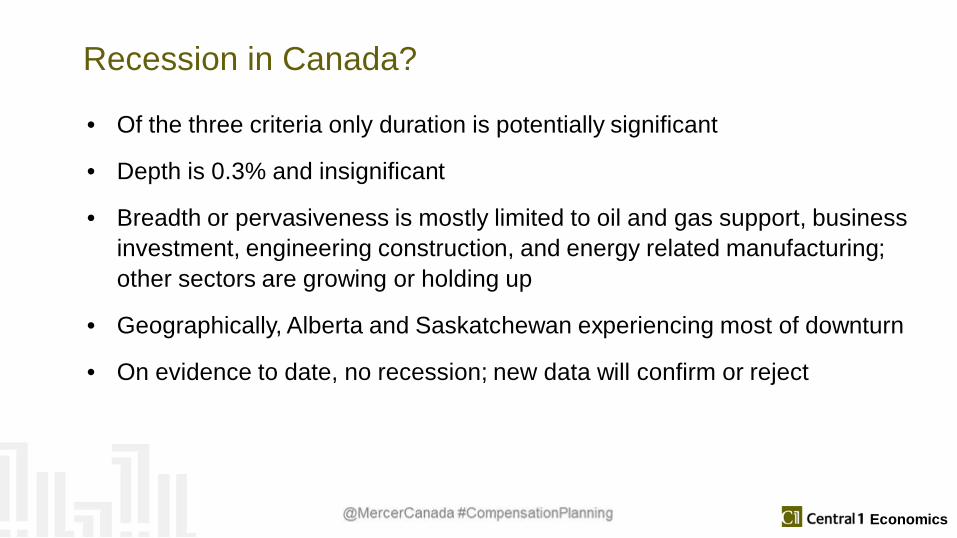
Recession in Canada?
• Of the three criteria only duration is potentially significant
• Depth is 0.3% and insignificant
• Breadth or pervasiveness is mostly limited to oil and gas support, businessinvestment, engineering construction, and energy related manufacturing;other sectors are growing or holding up
• Geographically, Alberta and Saskatchewan experiencing most of downturn
• On evidence to date, no recession; new data will confirm or reject
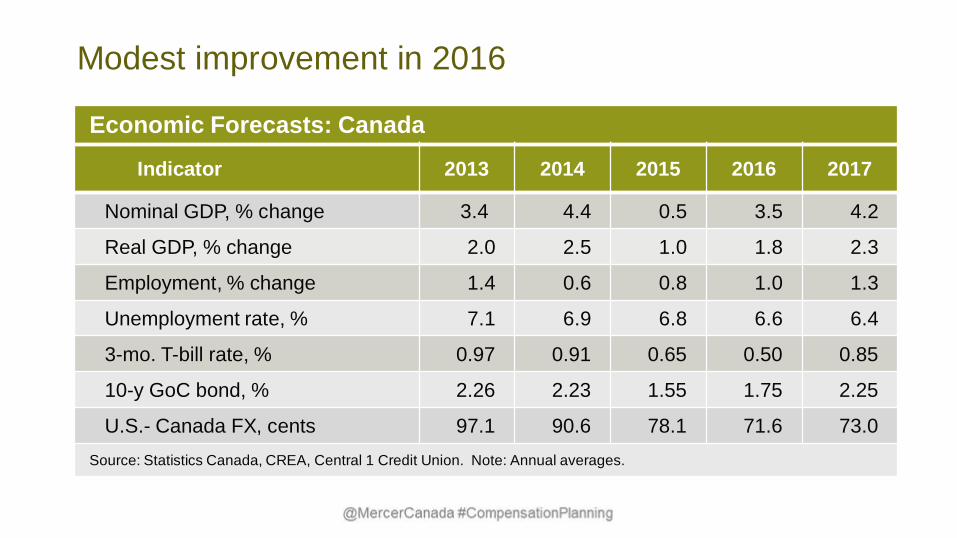
Modest improvement in 2016
Economic Forecasts: Canada
Indicator 2013 2014 2015 2016 2017
Nominal GDP, % change 3.4 4.4 0.5 3.5 4.2
Real GDP, % change 2.0 2.5 1.0 1.8 2.3
Employment, % change 1.4 0.6 0.8 1.0 1.3
Unemployment rate, % 7.1 6.9 6.8 6.6 6.4
3-mo. T-bill rate, % 0.97 0.91 0.65 0.50 0.85
10-y GoC bond, % 2.26 2.23 1.55 1.75 2.25
U.S.- Canada FX, cents 97.1 90.6 78.1 71.6 73.0Source: Statistics Canada, CREA, Central 1 Credit Union. Note: Annual averages.
|
Economics
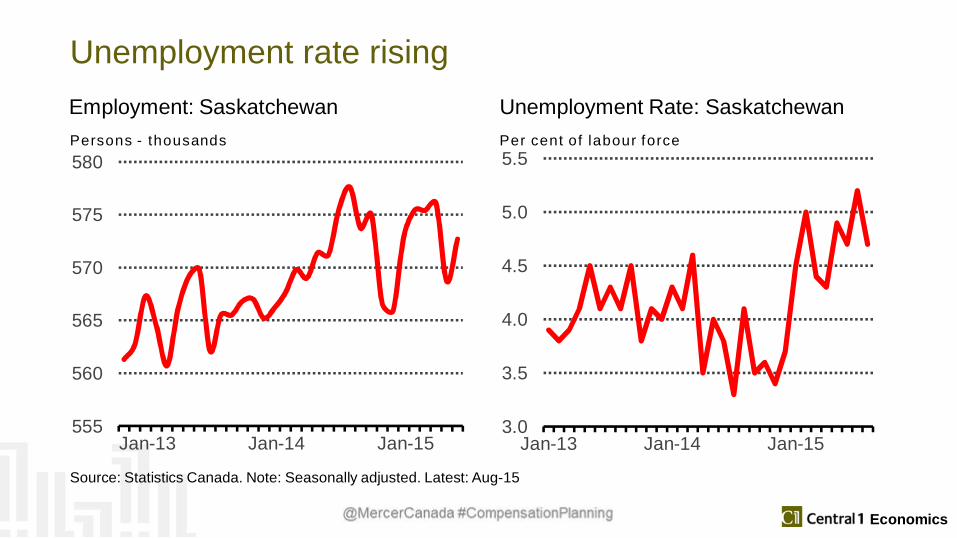
Unemployment rate rising
555
560
565
570
575
580
Jan-13 Jan-14 Jan-15
Persons - thousands
Employment: Saskatchewan
3.0
3.5
4.0
4.5
5.0
5.5
Jan-13 Jan-14 Jan-15
Per cent of labour force
Unemployment Rate: Saskatchewan
Source: Statistics Canada. Note: Seasonally adjusted. Latest: Aug-15
|
Economics
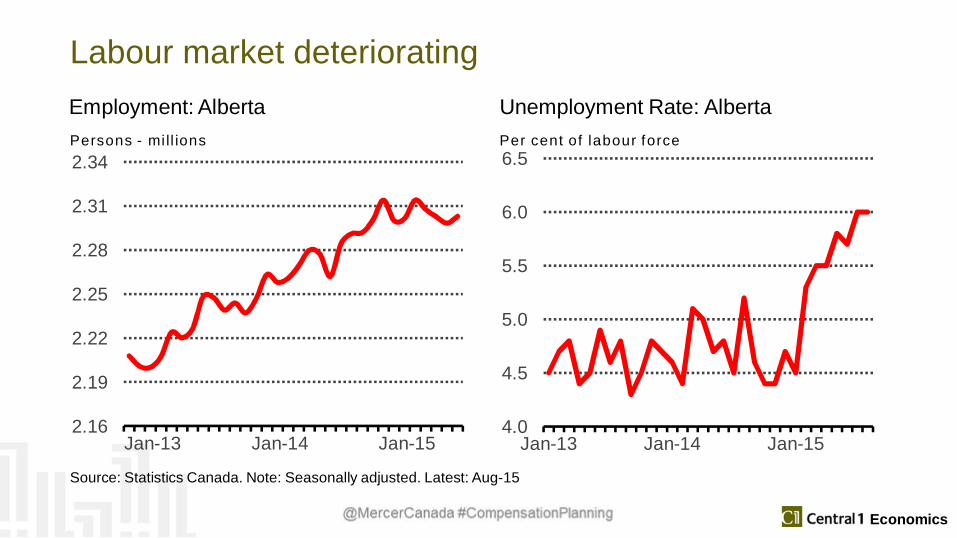
Labour market deteriorating
2.16
2.19
2.22
2.25
2.28
2.31
2.34
Jan-13 Jan-14 Jan-15
Persons - mi ll ions
Employment: Alberta
4.0
4.5
5.0
5.5
6.0
6.5
Jan-13 Jan-14 Jan-15
Per cent of labour force
Unemployment Rate: Alberta
Source: Statistics Canada. Note: Seasonally adjusted. Latest: Aug-15
|
Economics
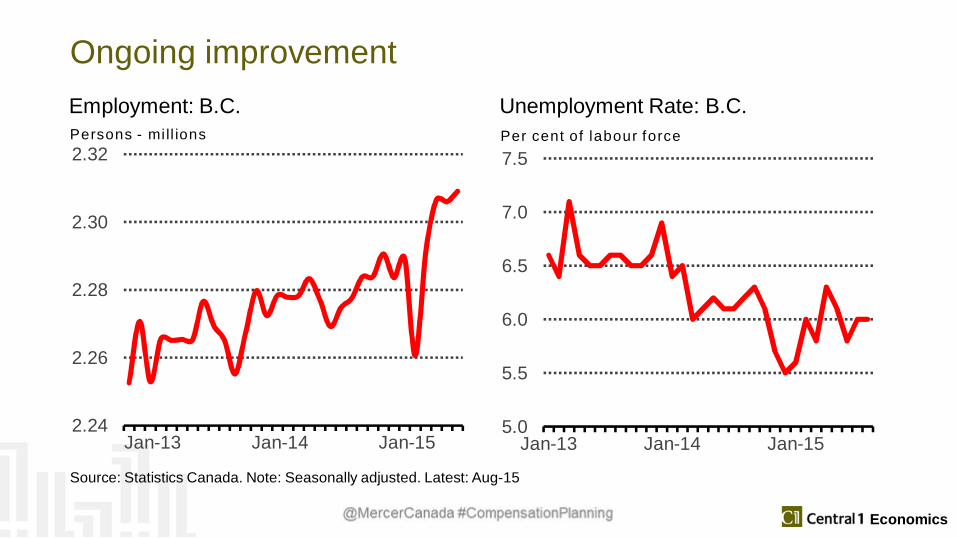
Ongoing improvement
2.24
2.26
2.28
2.30
2.32
Jan-13 Jan-14 Jan-15
Persons - mi ll ions
Employment: B.C.
5.0
5.5
6.0
6.5
7.0
7.5
Jan-13 Jan-14 Jan-15
Per cent of labour force
Unemployment Rate: B.C.
Source: Statistics Canada. Note: Seasonally adjusted. Latest: Aug-15
|
Economics
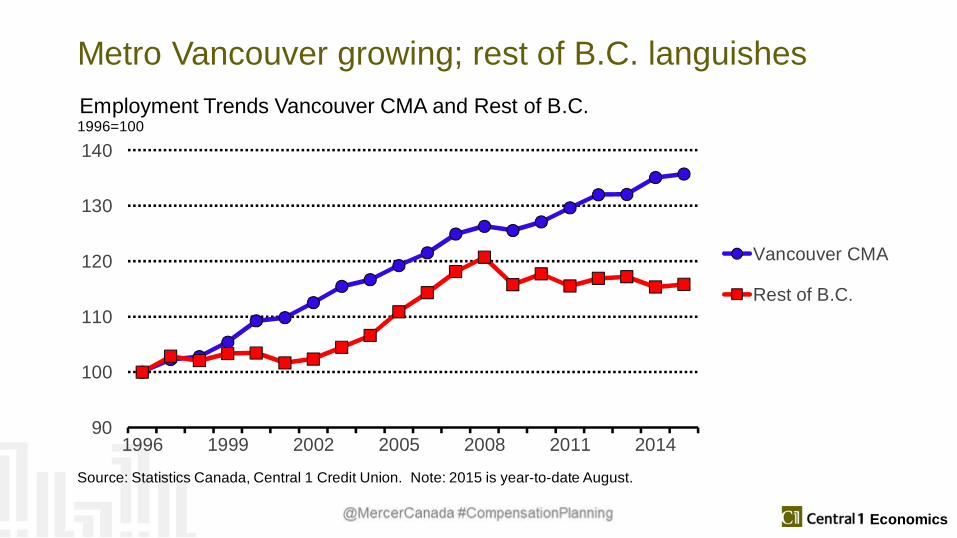
Metro Vancouver growing; rest of B.C. languishes
90
100
110
120
130
140
1996 1999 2002 2005 2008 2011 2014
Vancouver CMA
Rest of B.C.
1996=100
Source: Statistics Canada, Central 1 Credit Union. Note: 2015 is year-to-date August.
Employment Trends Vancouver CMA and Rest of B.C.
|
Economics
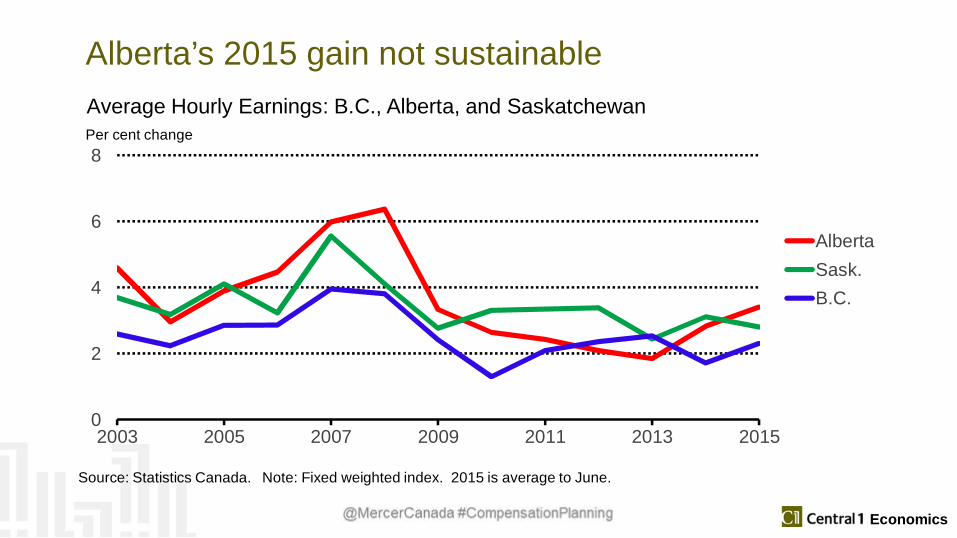
Alberta’s 2015 gain not sustainable
0
2
4
6
8
2003 2005 2007 2009 2011 2013 2015
AlbertaSask.B.C.
Per cent change
Source: Statistics Canada. Note: Fixed weighted index. 2015 is average to June.
Average Hourly Earnings: B.C., Alberta, and Saskatchewan
|
Economics
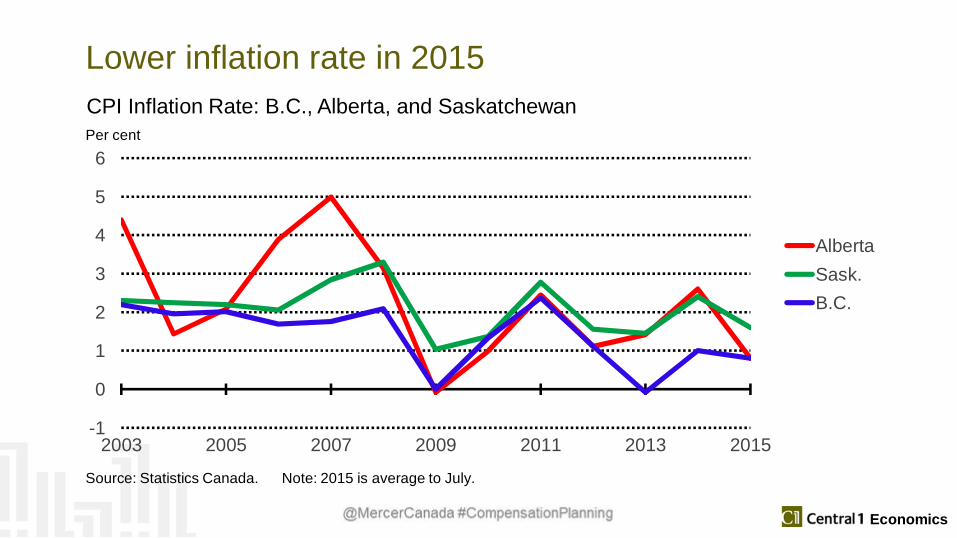
Lower inflation rate in 2015
-1
0
1
2
3
4
5
6
2003 2005 2007 2009 2011 2013 2015
AlbertaSask.B.C.
Per cent
Source: Statistics Canada. Note: 2015 is average to July.
CPI Inflation Rate: B.C., Alberta, and Saskatchewan
|
Economics
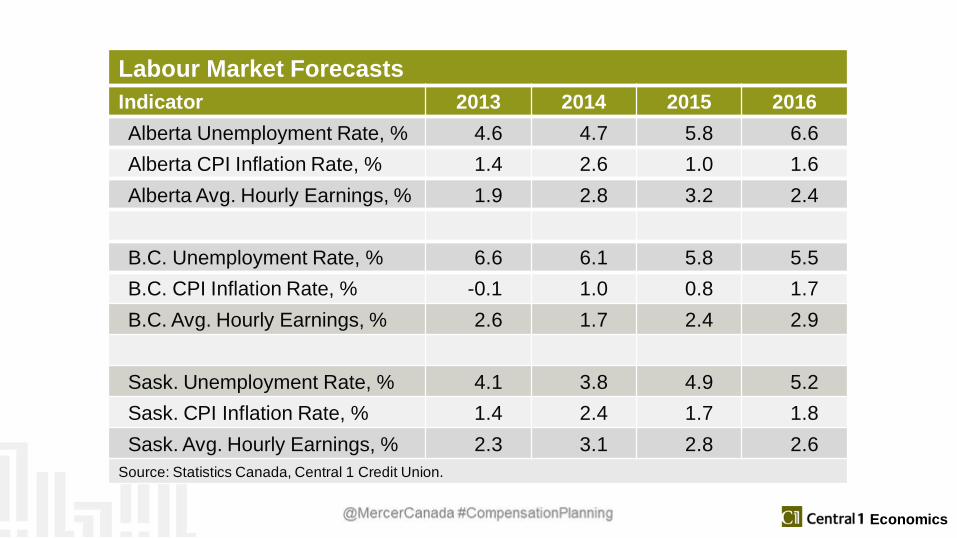
Labour Market ForecastsIndicator 2013 2014 2015 2016Alberta Unemployment Rate, % 4.6 4.7 5.8 6.6Alberta CPI Inflation Rate, % 1.4 2.6 1.0 1.6Alberta Avg. Hourly Earnings, % 1.9 2.8 3.2 2.4
B.C. Unemployment Rate, % 6.6 6.1 5.8 5.5B.C. CPI Inflation Rate, % -0.1 1.0 0.8 1.7B.C. Avg. Hourly Earnings, % 2.6 1.7 2.4 2.9
Sask. Unemployment Rate, % 4.1 3.8 4.9 5.2Sask. CPI Inflation Rate, % 1.4 2.4 1.7 1.8Sask. Avg. Hourly Earnings, % 2.3 3.1 2.8 2.6
Source: Statistics Canada, Central 1 Credit Union.

Thank you

© MERCER 2015 31© MERCER 2015 31
HIGHLIGHTSFROM THE SURVEY

© MERCER 2015 32
M E R C E R R E S E A R C H
© MERCER 2015 33
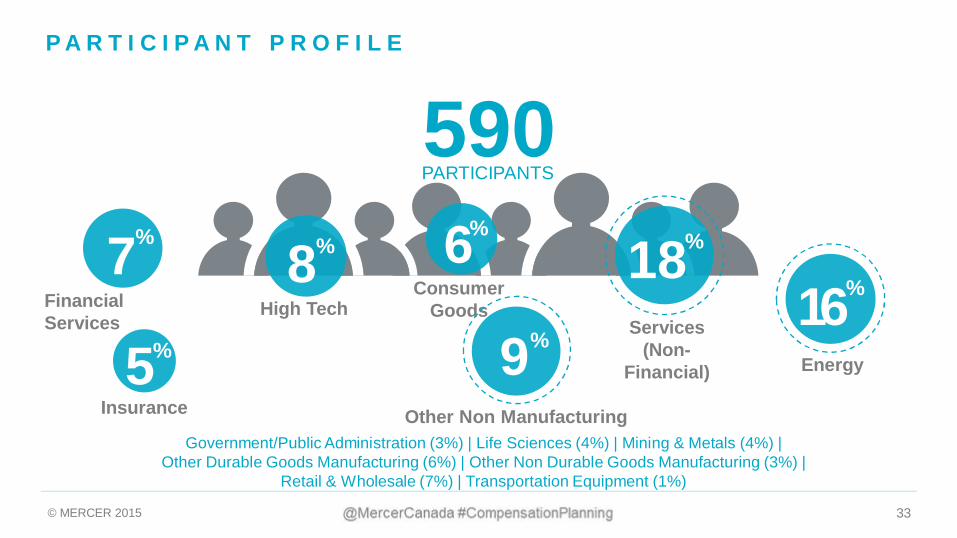
P A R T I C I P A N T P R O F I L E
590PARTICIPANTS
18%
Services(Non-
Financial)
1 %6Energy
%7FinancialServices
%8High Tech
%6Consumer
Goods
%5Insurance
%9Other Non Manufacturing
Government/Public Administration (3%) | Life Sciences (4%) | Mining & Metals (4%) |Other Durable Goods Manufacturing (6%) | Other Non Durable Goods Manufacturing (3%) |
Retail & Wholesale (7%) | Transportation Equipment (1%)
© MERCER 2015 34
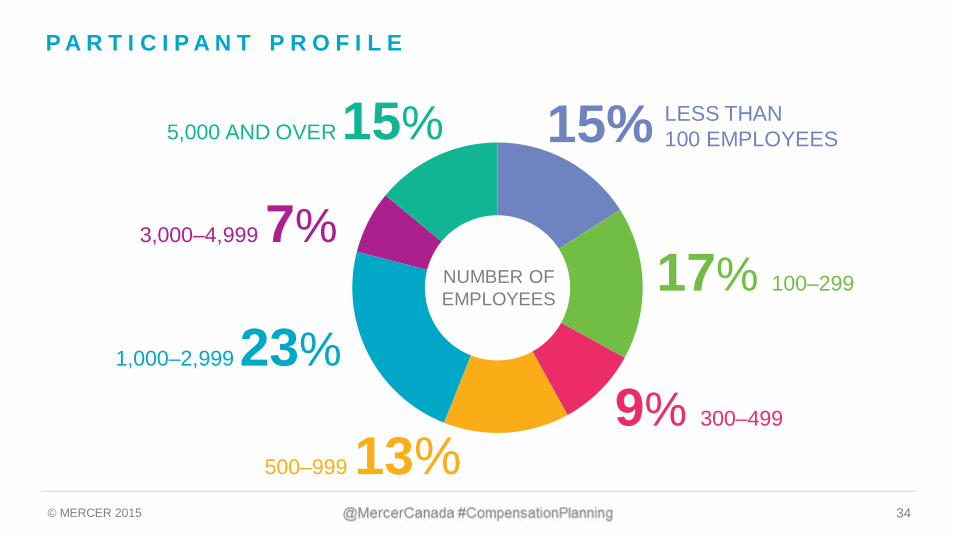
P A R T I C I P A N T P R O F I L E
5,000 AND OVER 15%
3,000–4,999 7%
1,000–2,999 23%
500–999 13%
17% 100–299
9% 300–499
NUMBER OFEMPLOYEES
LESS THAN100 EMPLOYEES15%

© MERCER 2015 35
E M P L O Y E R S R E M A I N C A U T I O U S –S A L A R Y B U D G E T S R E M A I N S T E A D Y
YEAR ALLEMPLOYEES EXEC MGMT PROFESSIONAL CLERICAL OPERATIONAL
2016 2.8% 2.8% 2.8% 2.8% 2.7% 2.7%
CANADA (ALL INDUSTRIES, ALL LOCATIONS, EXCLUDING ZEROS)
2015 (ACTUAL) 2.8% 2.8% 2.8% 2.8% 2.7% 2.7%
2014 (ACTUAL) 3.0% 3.2% 3.1% 3.0% 3.0% 2.9%
2013 (ACTUAL) 3.2% 3.4% 3.3% 3.1% 3.2% 3.0%
2012 (ACTUAL) 3.2% 3.2% 3.3% 3.2% 3.2% 3.1%
© MERCER 2015 36
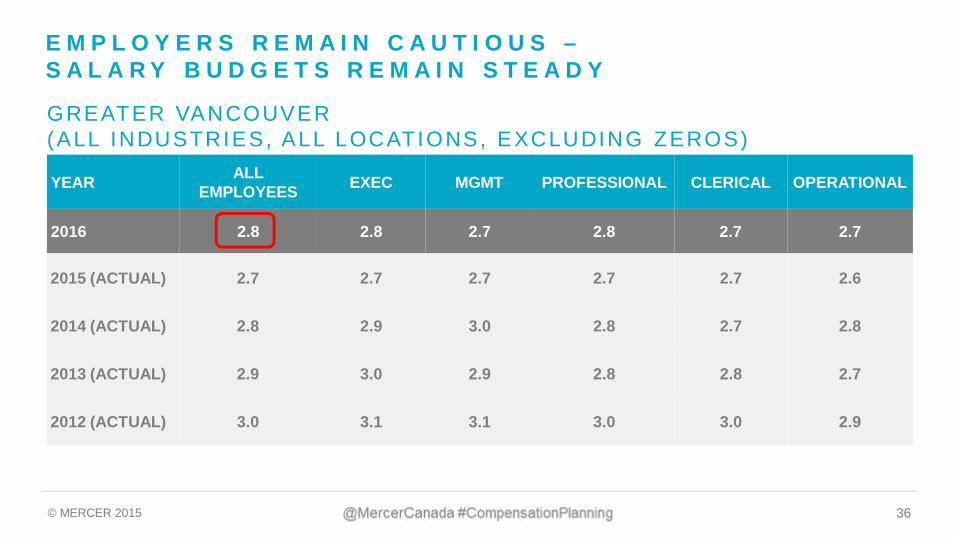
E M P L O Y E R S R E M A I N C A U T I O U S –S A L A R Y B U D G E T S R E M A I N S T E A D Y
YEAR ALLEMPLOYEES EXEC MGMT PROFESSIONAL CLERICAL OPERATIONAL
2016 2.8 2.8 2.7 2.8 2.7 2.7
GREATER VANCOUVER(ALL INDUSTRIES, ALL LOCATIONS, EXCLUDING ZEROS)
2015 (ACTUAL) 2.7 2.7 2.7 2.7 2.7 2.6
2014 (ACTUAL) 2.8 2.9 3.0 2.8 2.7 2.8
2013 (ACTUAL) 2.9 3.0 2.9 2.8 2.8 2.7
2012 (ACTUAL) 3.0 3.1 3.1 3.0 3.0 2.9
© MERCER 2015 37
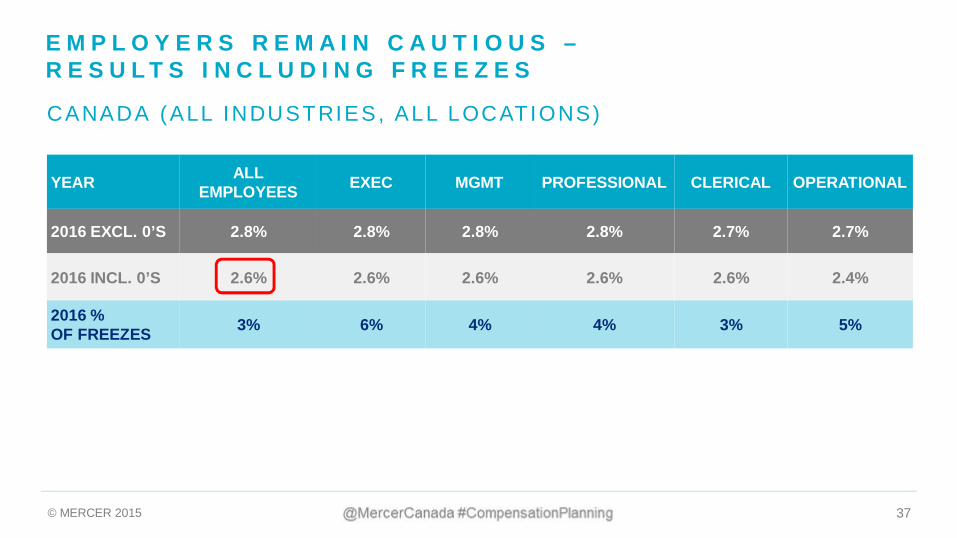
E M P L O Y E R S R E M A I N C A U T I O U S –R E S U L T S I N C L U D I N G F R E E Z E S
YEAR ALLEMPLOYEES EXEC MGMT PROFESSIONAL CLERICAL OPERATIONAL
2016 EXCL. 0’S 2.8% 2.8% 2.8% 2.8% 2.7% 2.7%
2016 INCL. 0’S 2.6% 2.6% 2.6% 2.6% 2.6% 2.4%
2016 %OF FREEZES 3% 6% 4% 4% 3% 5%
CANADA (ALL INDUSTRIES, ALL LOCATIONS)
© MERCER 2015 38
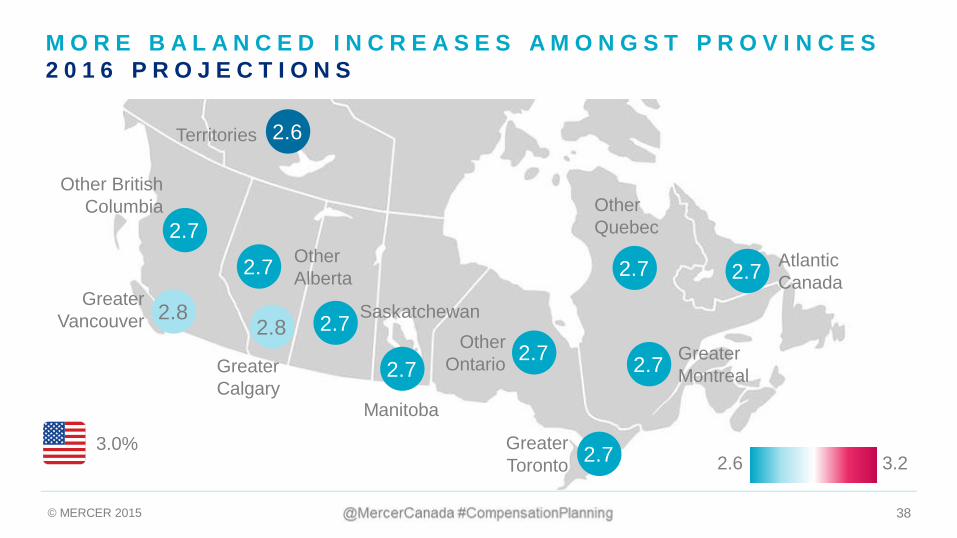
M O R E B A L A N C E D I N C R E A S E S A M O N G S T P R O V I N C E S2 0 1 6 P R O J E C T I O N S
OtherAlberta
GreaterCalgary
SaskatchewanGreater
Vancouver
Manitoba
GreaterMontreal
OtherQuebec
OtherOntario
Other BritishColumbia
GreaterToronto
AtlanticCanada
Territories
2.8
2.7
2.72.8
2.7 2.7
2.7
2.7
2.6
2.7
2.7
2.7
3.22.63.0%
© MERCER 2015 39
0
1
2
3
4
5
6
7
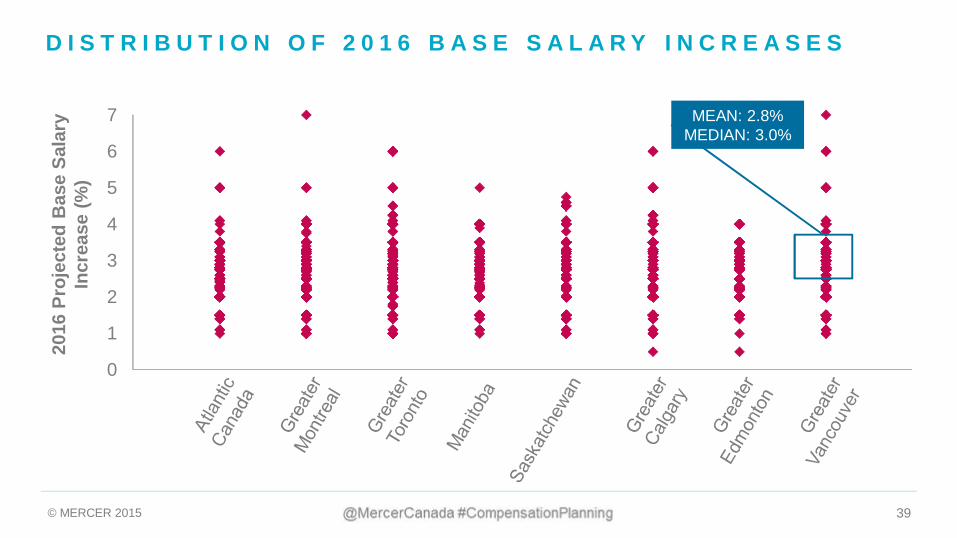
D I S T R I B U T I O N O F 2 0 1 6 B A S E S A L A R Y I N C R E A S E S20
16Pr
ojec
ted
Bas
eSa
lary
Incr
ease
(%)
MEAN: 2.8%MEDIAN: 3.0%
© MERCER 2015 40
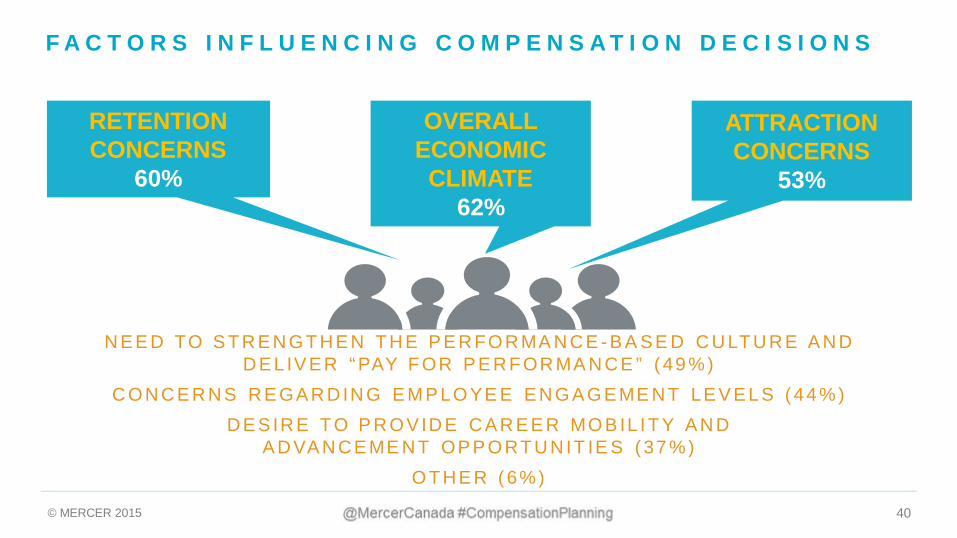
F A C T O R S I N F L U E N C I N G C O M P E N S A T I O N D E C I S I O N S
RETENTIONCONCERNS
60%
OVERALLECONOMIC
CLIMATE62%
ATTRACTIONCONCERNS
53%
N E E D TO S T R E N G T H E N T H E P E R FO R MA N C E - B A S E D C U LT U R E A N DD E L IV E R “ PAY F OR P E R F OR MA N C E ” ( 49 % )
C O N C E R N S R E GA R D IN G E M P LO YE E E N G A G E ME N T LE V E L S ( 44 % )D E S IR E T O P R O V ID E C A R E E R MO B IL I T Y A N D
A D VA N C E ME N T OP P O RT U N IT IE S ( 37 % )O T H E R ( 6% )
© MERCER 2015 41
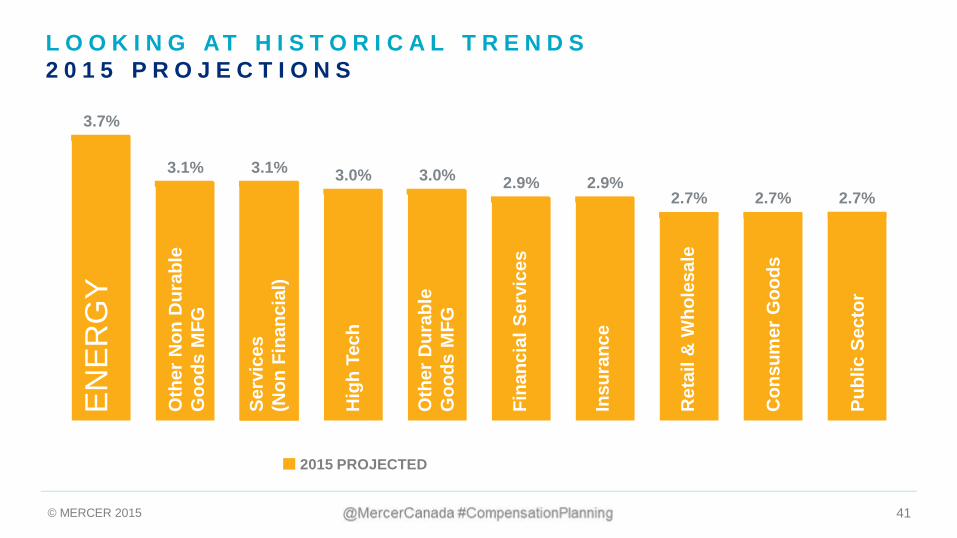
3.7%
3.1% 3.1% 3.0% 3.0% 2.9% 2.9%2.7% 2.7% 2.7%
L O O K I N G AT H I S T O R I C A L T R E N D S2 0 1 5 P R O J E C T I O N S
EN
ER
GY
Oth
erN
onD
urab
leG
oods
MFG
Serv
ices
(Non
Fina
ncia
l)
Hig
hTe
ch
Insu
ranc
e
Con
sum
erG
oods
Ret
ail&
Who
lesa
le
Publ
icSe
ctor
Oth
erD
urab
leG
oods
MFG
Fina
ncia
lSer
vice
s
2015 PROJECTED
© MERCER 2015 42
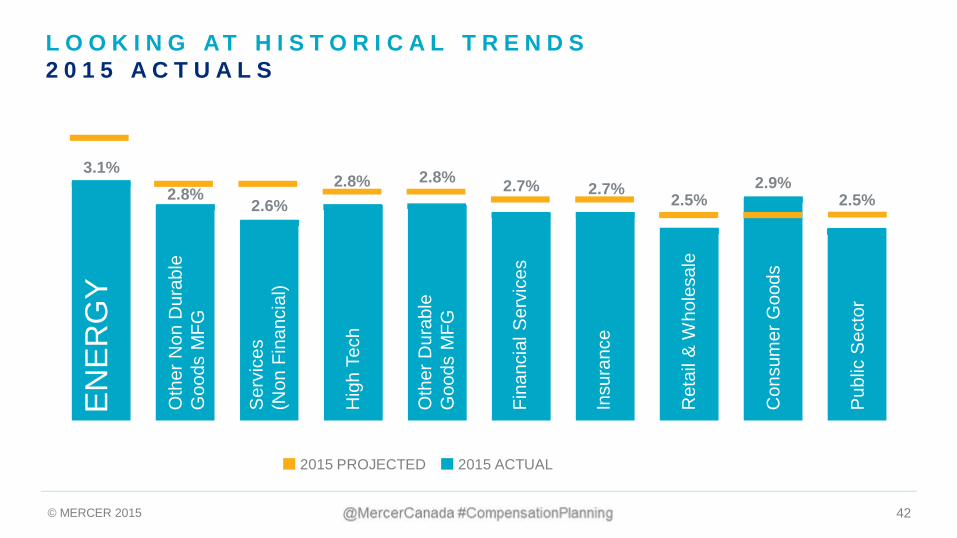
3.1%2.8%
2.6%2.8% 2.8% 2.7% 2.7%
2.5%2.9%
2.5%
L O O K I N G AT H I S T O R I C A L T R E N D S2 0 1 5 A C T U A L S
2015 PROJECTED 2015 ACTUAL
EN
ER
GY
Oth
erN
onD
urab
leG
oods
MFG
Ser
vice
s(N
onFi
nanc
ial)
Hig
hTe
ch
Insu
ranc
e
Con
sum
erG
oods
Ret
ail&
Who
lesa
le
Pub
licS
ecto
r
Oth
erD
urab
leG
oods
MFG
Fina
ncia
lSer
vice
s
© MERCER 2015 43
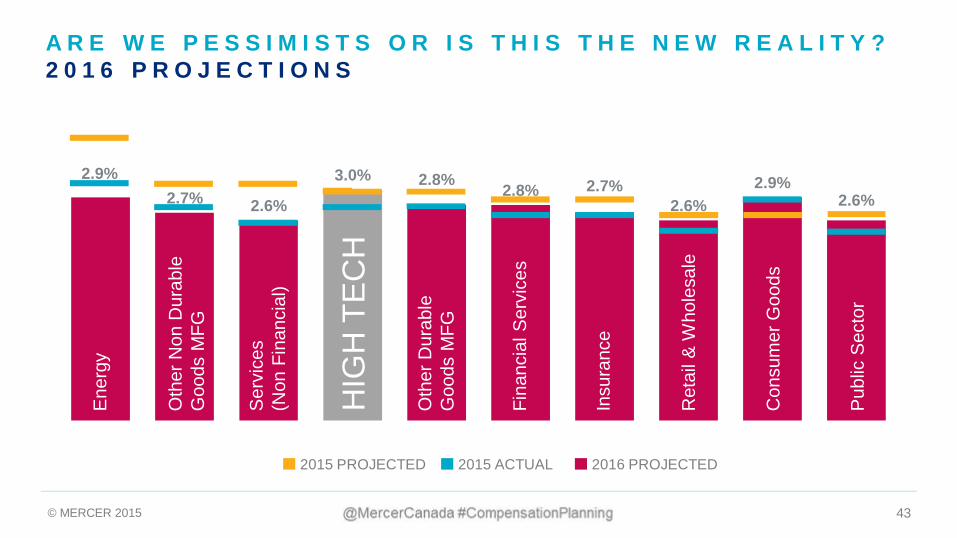
2.9%2.7% 2.6%
3.0% 2.8% 2.8% 2.7%2.6%
2.9%2.6%
A R E W E P E S S I M I S T S O R I S T H I S T H E N E W R E A L I T Y ?2 0 1 6 P R O J E C T I O N S
2015 PROJECTED 2016 PROJECTED2015 ACTUAL
Ene
rgy
Oth
erN
onD
urab
leG
oods
MFG
Ser
vice
s(N
onFi
nanc
ial)
HIG
HTE
CH
Insu
ranc
e
Con
sum
erG
oods
Ret
ail&
Who
lesa
le
Pub
licS
ecto
r
Oth
erD
urab
leG
oods
MFG
Fina
ncia
lSer
vice
s
© MERCER 2015 44
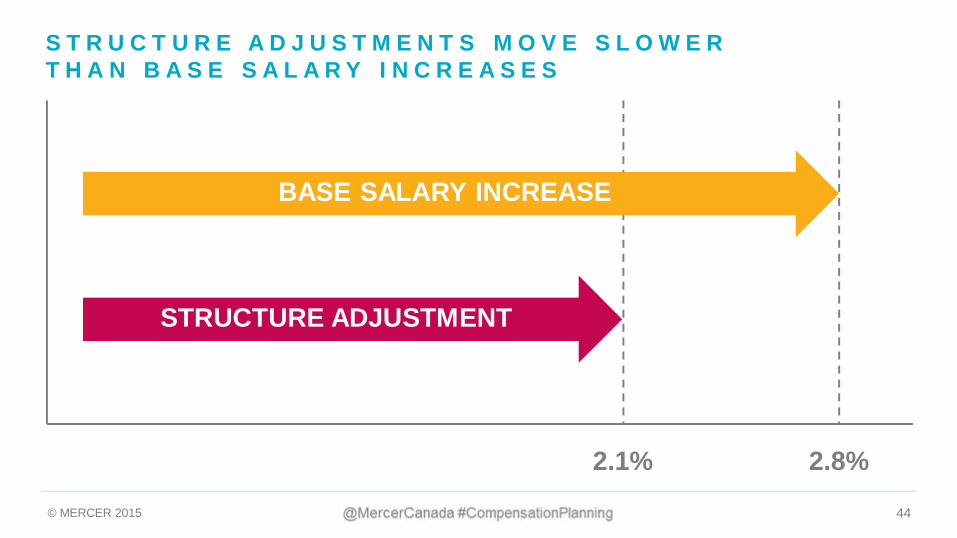
S T R U C T U R E A D J U S T M E N T S M O V E S L O W E RT H A N B A S E S A L A R Y I N C R E A S E S
BASE SALARY INCREASE
STRUCTURE ADJUSTMENT
2.1% 2.8%
© MERCER 2015 45
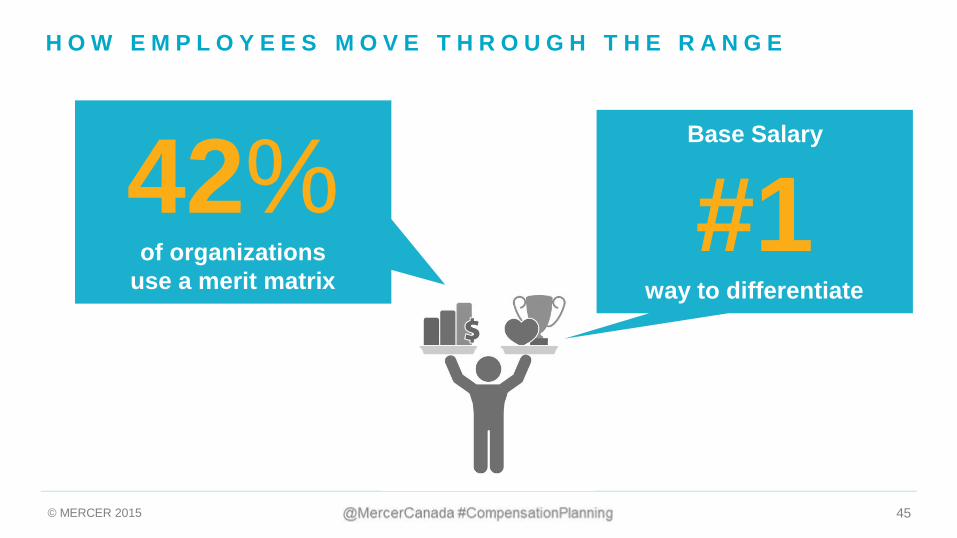
H O W E M P L O Y E E S M O V E T H R O U G H T H E R A N G E
42%of organizations
use a merit matrix
Base Salary
#1way to differentiate
© MERCER 2015 46
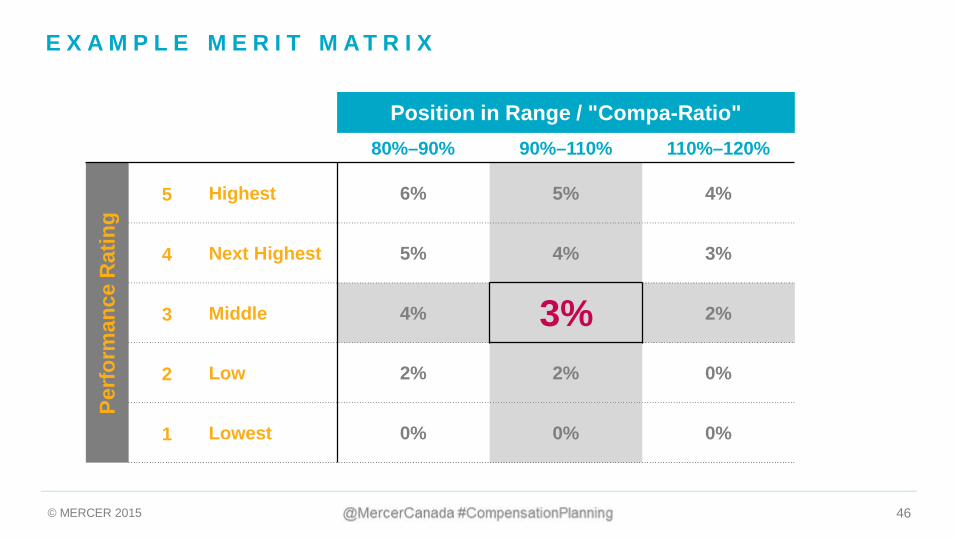
E X A M P L E M E R I T M A T R I X
Position in Range / "Compa-Ratio"80%–90% 90%–110% 110%–120%
Perf
orm
ance
Rat
ing
5 Highest 6% 5% 4%
4 Next Highest 5% 4% 3%
3 Middle 4% 3% 2%
2 Low 2% 2% 0%
1 Lowest 0% 0% 0%
© MERCER 2015 47
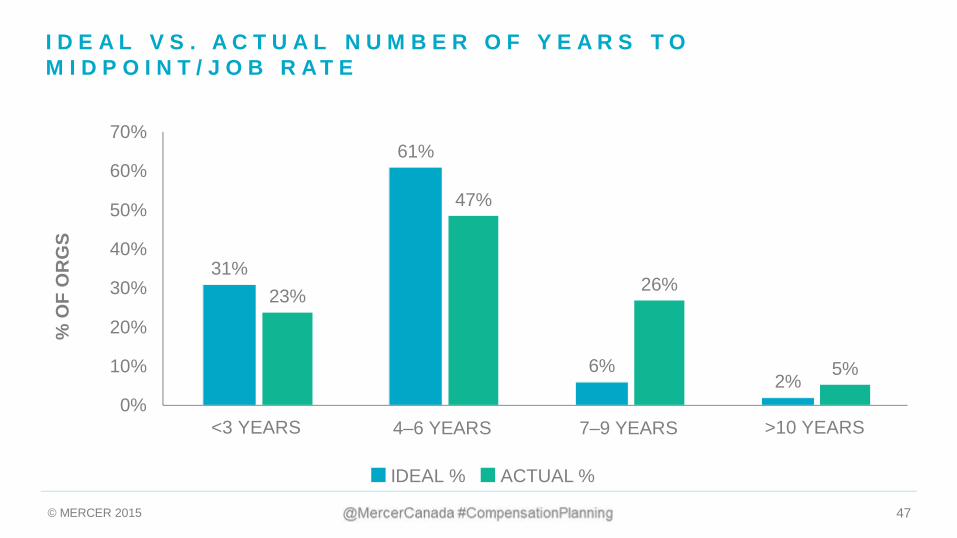
I D E A L V S . A C T U A L N U M B E R O F Y E A R S T OM I D P O I N T / J O B R A T E
31%
61%
6%2%
0%
10%
20%
30%
40%
50%
60%
70%
<3 YEARS 4–6 YEARS 7–9 YEARS >10 YEARS
%O
FO
RG
S
IDEAL %
23%
47%
26%
5%
ACTUAL %
© MERCER 2015 48
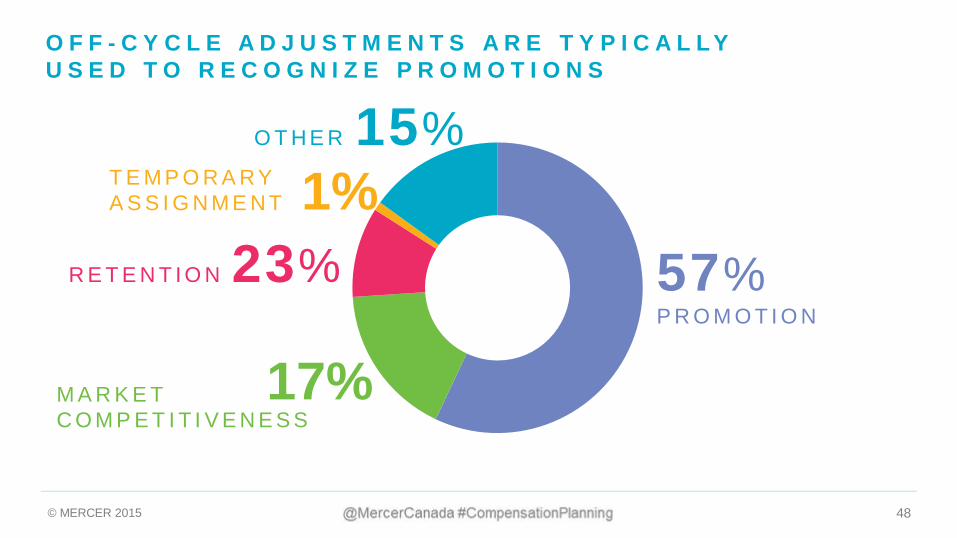
1%
17%
T E M P O R A R YA S S I G N M E N T
O F F - C Y C L E A D J U S T M E N T S A R E T Y P I C A L L YU S E D T O R E C O G N I Z E P R O M O T I O N S
O T H E R 15%
R E T E N T I O N 23%
M A R K E TC O M P E T I T I V E N E S S
57%P R O M O T I O N

© MERCER 2015 49© MERCER 2015 49
INS IDE EMPLO YEES’ MINDS
© MERCER 2015 50
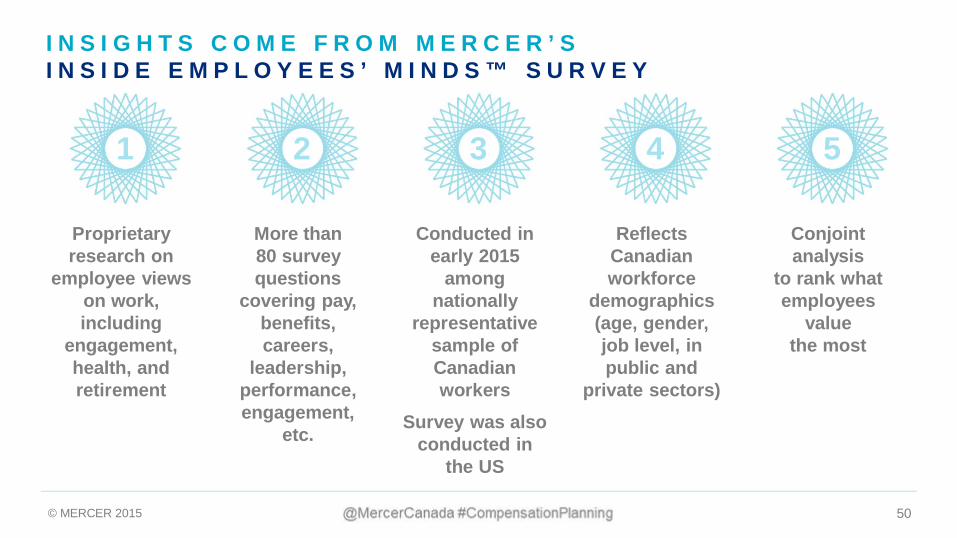
Proprietaryresearch on
employee viewson work,including
engagement,health, andretirement
More than80 surveyquestions
covering pay,benefits,careers,
leadership,performance,engagement,
etc.
Conducted inearly 2015
amongnationally
representativesample ofCanadianworkers
Survey was alsoconducted in
the US
ReflectsCanadianworkforce
demographics(age, gender,job level, inpublic and
private sectors)
Conjointanalysis
to rank whatemployees
valuethe most
1 2 3 4 5
I N S I G H T S C O M E F R O M M E R C E R ’ SI N S I D E E M P L O Y E E S ’ M I N D S ™ S U R V E Y
© MERCER 2015 51
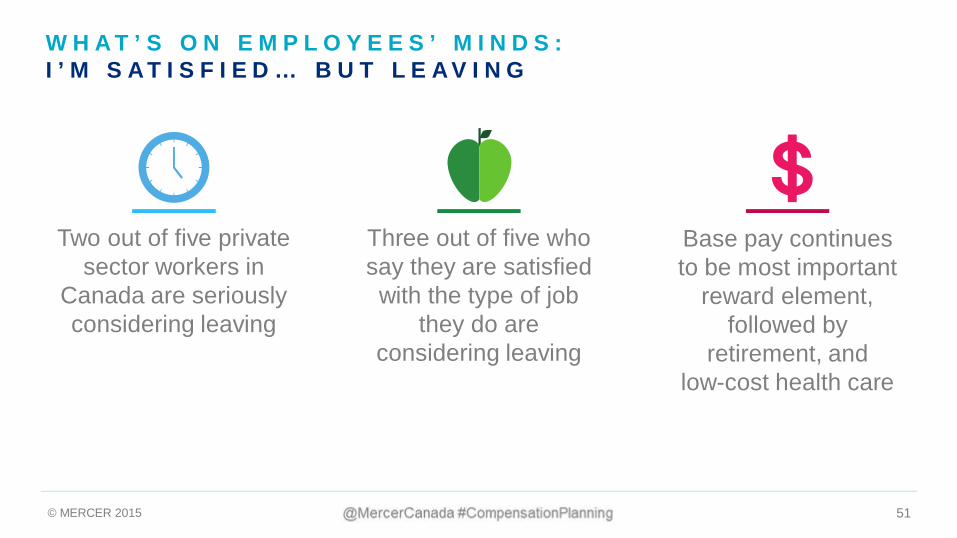
Two out of five privatesector workers in
Canada are seriouslyconsidering leaving
Base pay continuesto be most important
reward element,followed by
retirement, andlow-cost health care
W H A T ’ S O N E M P L O Y E E S ’ M I N D S :I ’ M S A T I S F I E D … B U T L E A V I N G
Three out of five whosay they are satisfiedwith the type of job
they do areconsidering leaving
© MERCER 2015 52
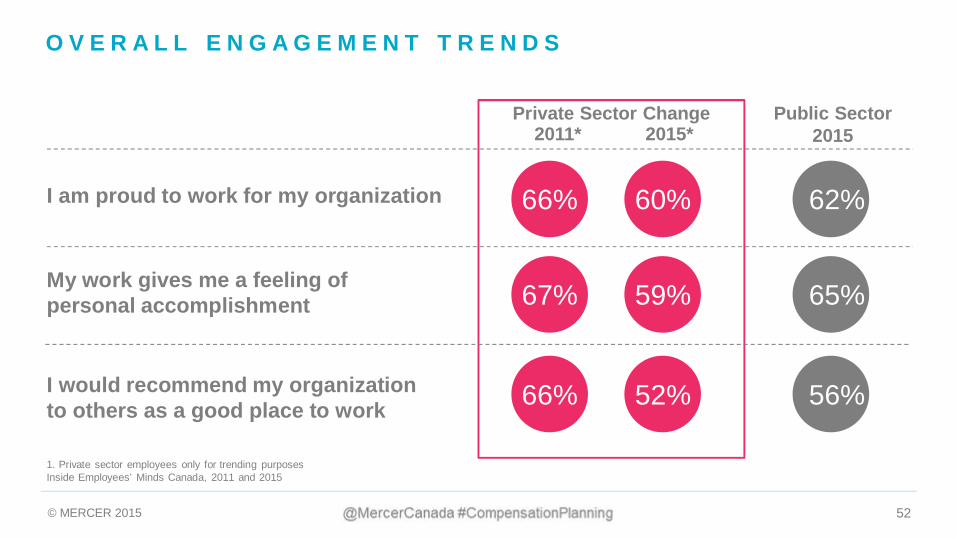
59%67% 65%My work gives me a feeling ofpersonal accomplishment
52%66% 56%I would recommend my organizationto others as a good place to work
1. Private sector employees only for trending purposesInside Employees’ Minds Canada, 2011 and 2015
2011* 2015*
I am proud to work for my organization 60%66% 62%
Private Sector Change Public Sector2015
O V E R A L L E N G A G E M E N T T R E N D S
© MERCER 2015 53
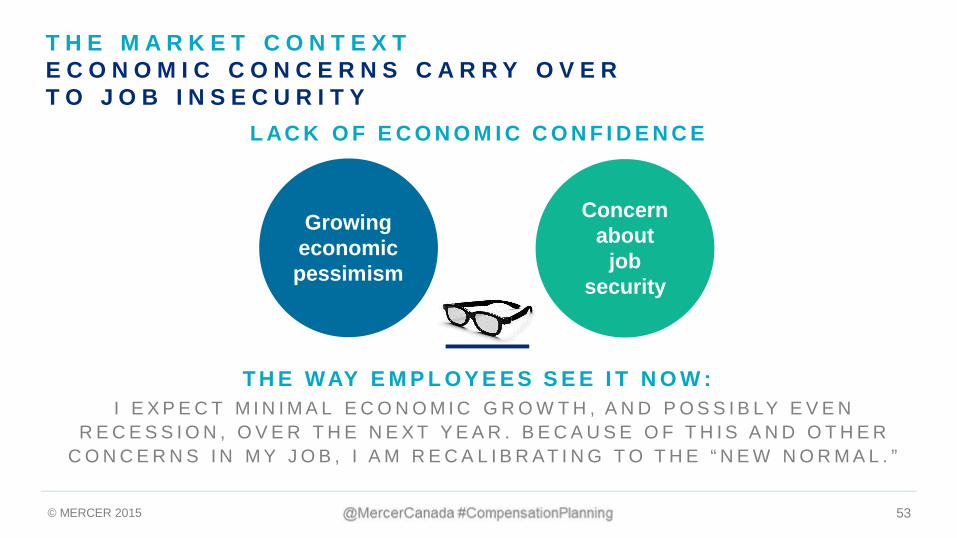
I E X P E C T M I N I M A L E C O N O M I C G R O W T H , A N D P O S S I B LY E V E NR E C E S S I O N , O V E R T H E N E X T Y E A R . B E C A U S E O F T H I S A N D O T H E R
C O N C E R N S I N M Y J O B , I A M R E C A L I B R AT I N G T O T H E “ N E W N O R M A L . ”
T H E WAY E M P L O Y E E S S E E I T N O W :
L AC K O F E C O N O M I C C O N F I D E N C E
Concernabout
jobsecurity
Growingeconomicpessimism
T H E M A R K E T C O N T E X TE C O N O M I C C O N C E R N S C A R R Y O V E RT O J O B I N S E C U R I T Y
© MERCER 2015 54
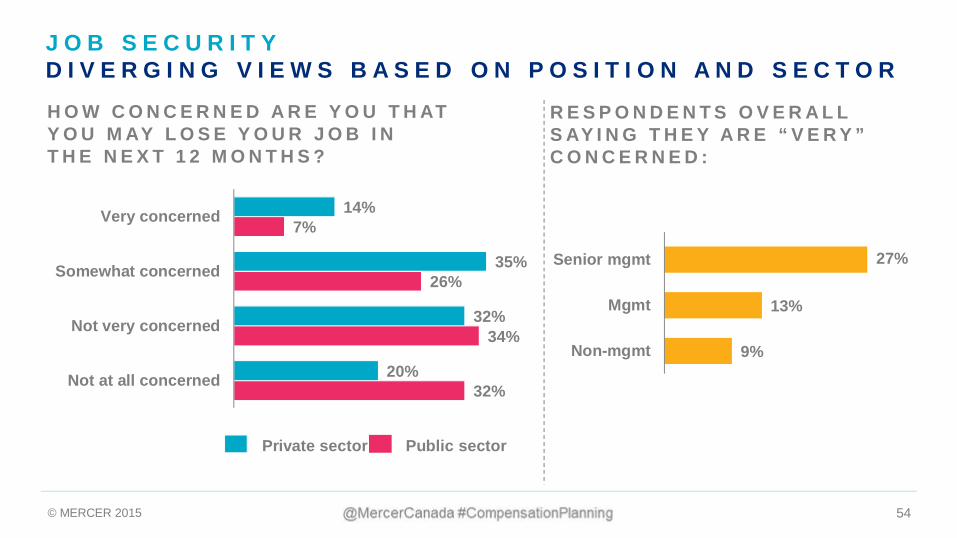
H O W C O N C E R N E D A R E Y O U T H ATY O U M AY L O S E Y O U R J O B I NT H E N E X T 1 2 M O N T H S ?
Private sector Public sector
32%
34%
26%
7%
20%
32%
35%
14%
Not at all concerned
Not very concerned
Somewhat concerned
Very concerned
R E S P O N D E N T S O V E R A L LS AY I N G T H E Y A R E “ V E R Y ”C O N C E R N E D :
9%
13%
27%
Non-mgmt
Mgmt
Senior mgmt
J O B S E C U R I T YD I V E R G I N G V I E W S B A S E D O N P O S I T I O N A N D S E C T O R
© MERCER 2015 55
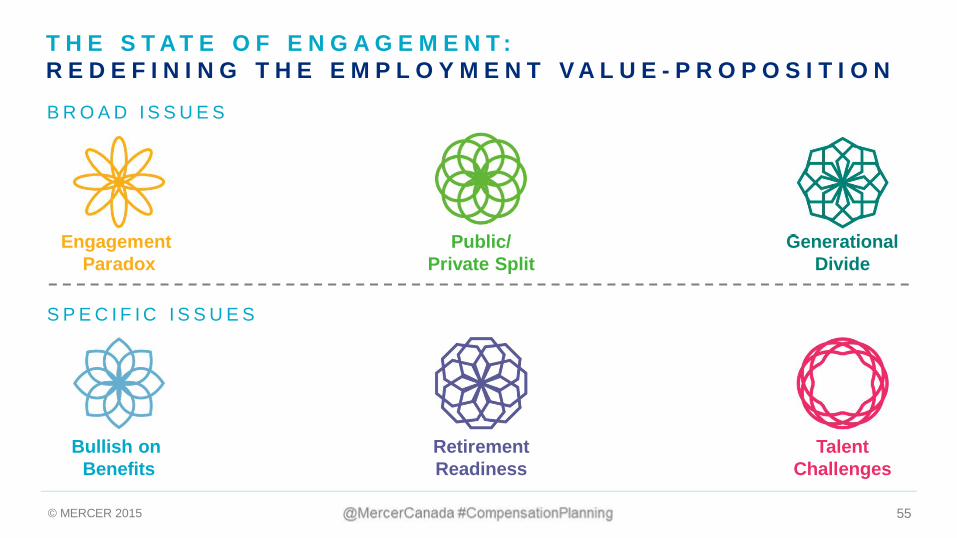
B R O A D I S S U E S
S P E C I F I C I S S U E S
EngagementParadox
Public/Private Split
GenerationalDivide
Bullish onBenefits
RetirementReadiness
TalentChallenges
T H E S T A T E O F E N G A G E M E N T :R E D E F I N I N G T H E E M P L O Y M E N T V A L U E - P R O P O S I T I O N
© MERCER 2015 56
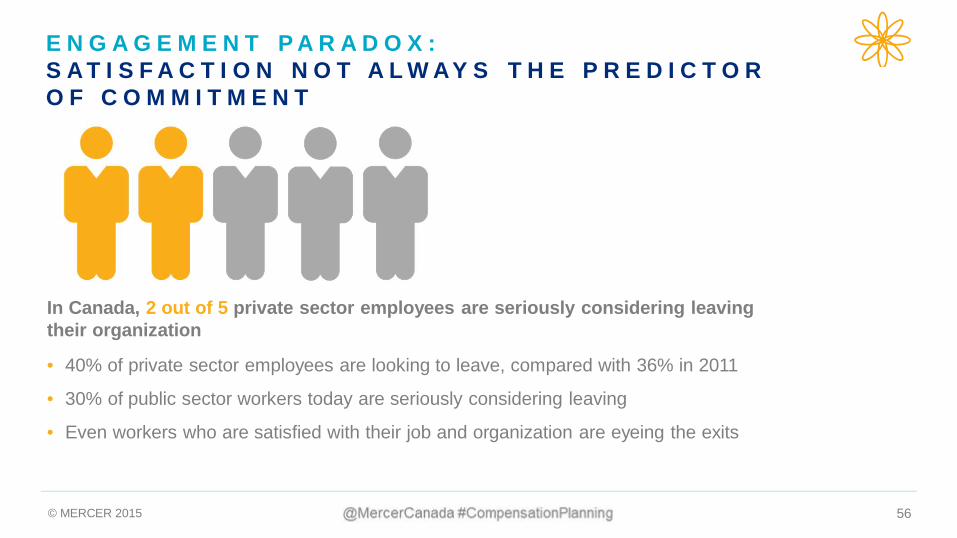
In Canada, 2 out of 5 private sector employees are seriously considering leavingtheir organization
• 40% of private sector employees are looking to leave, compared with 36% in 2011
• 30% of public sector workers today are seriously considering leaving
• Even workers who are satisfied with their job and organization are eyeing the exits
E N G A G E M E N T P A R A D O X :S A T I S F A C T I O N N O T A L W AY S T H E P R E D I C T O RO F C O M M I T M E N T
© MERCER 2015 57
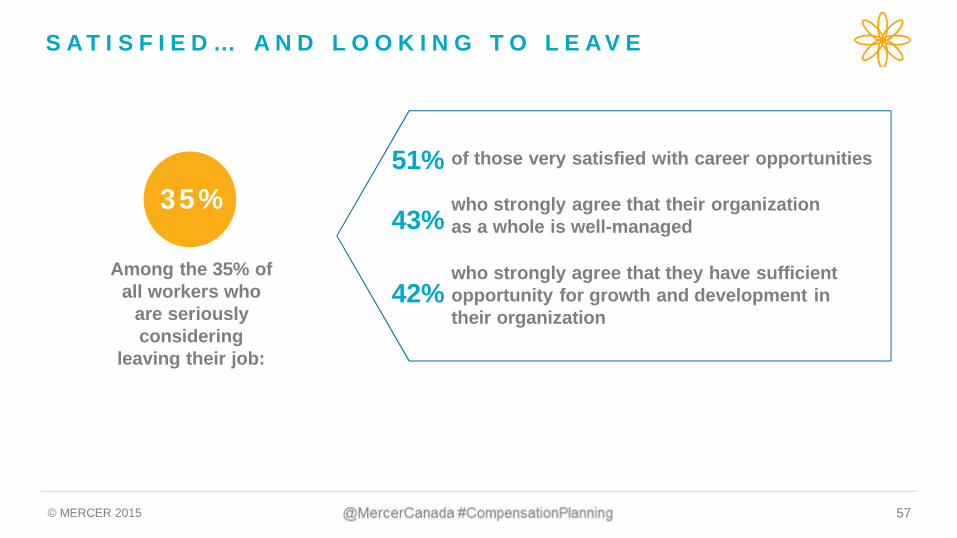
S A T I S F I E D … A N D L O O K I N G T O L E A V E
Among the 35% ofall workers who
are seriouslyconsidering
leaving their job:
35%of those very satisfied with career opportunities
who strongly agree that they have sufficientopportunity for growth and development intheir organization
who strongly agree that their organizationas a whole is well-managed
51%
43%
42%
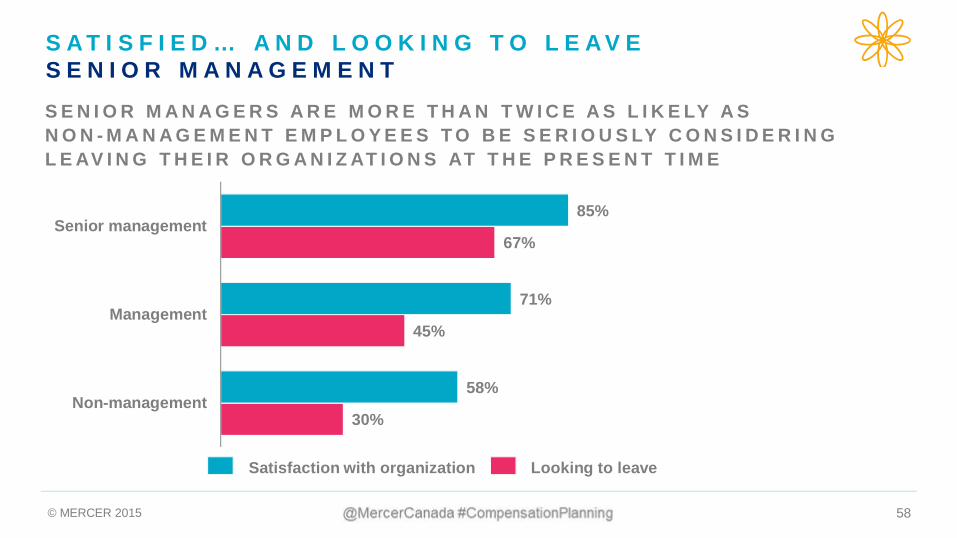
© MERCER 2015 58
30%
45%
67%
58%
71%
85%
Non-management
Management
Senior management
Satisfaction with organization Looking to leave
S E N I O R M A N A G E R S A R E M O R E T H A N T W I C E A S L I K E LY A SN O N - M A N A G E M E N T E M P L O Y E E S T O B E S E R I O U S LY C O N S I D E R I N GL E AV I N G T H E I R O R G A N I Z AT I O N S AT T H E P R E S E N T T I M E
S A T I S F I E D … A N D L O O K I N G T O L E A V ES E N I O R M A N A G E M E N T
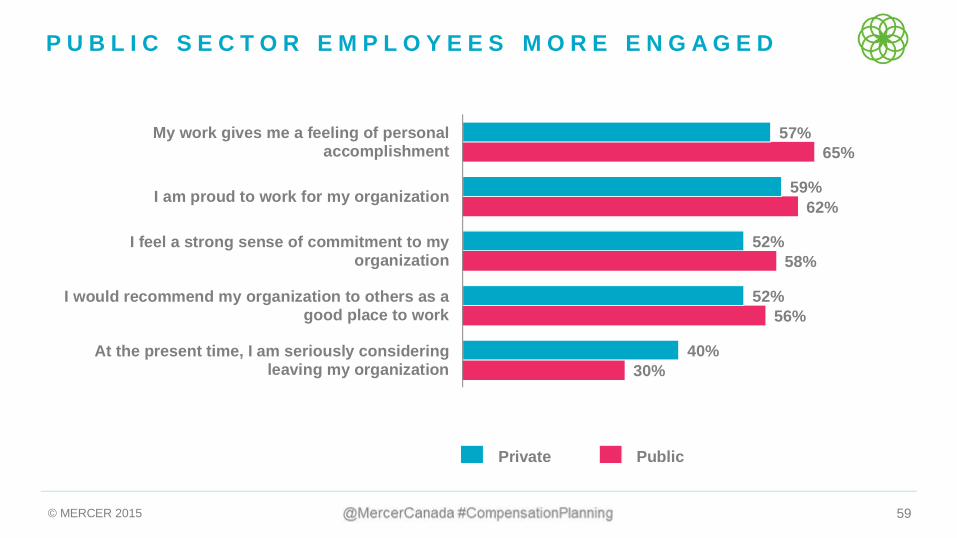
© MERCER 2015 59
30%
56%
58%
62%
65%
40%
52%
52%
59%
57%
At the present time, I am seriously consideringleaving my organization
I would recommend my organization to others as agood place to work
I feel a strong sense of commitment to myorganization
I am proud to work for my organization
My work gives me a feeling of personalaccomplishment
Private Public
P U B L I C S E C T O R E M P L O Y E E S M O R E E N G A G E D
© MERCER 2015 60
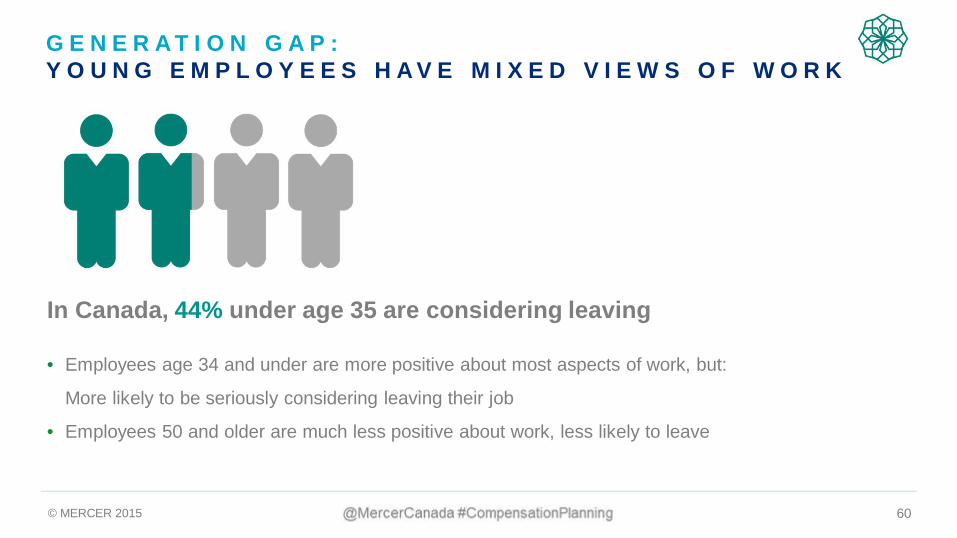
G E N E R A T I O N G A P :Y O U N G E M P L O Y E E S H A V E M I X E D V I E W S O F W O R K
In Canada, 44% under age 35 are considering leaving
• Employees age 34 and under are more positive about most aspects of work, but:
• More likely to be seriously considering leaving their job
• Employees 50 and older are much less positive about work, less likely to leave
© MERCER 2015 61
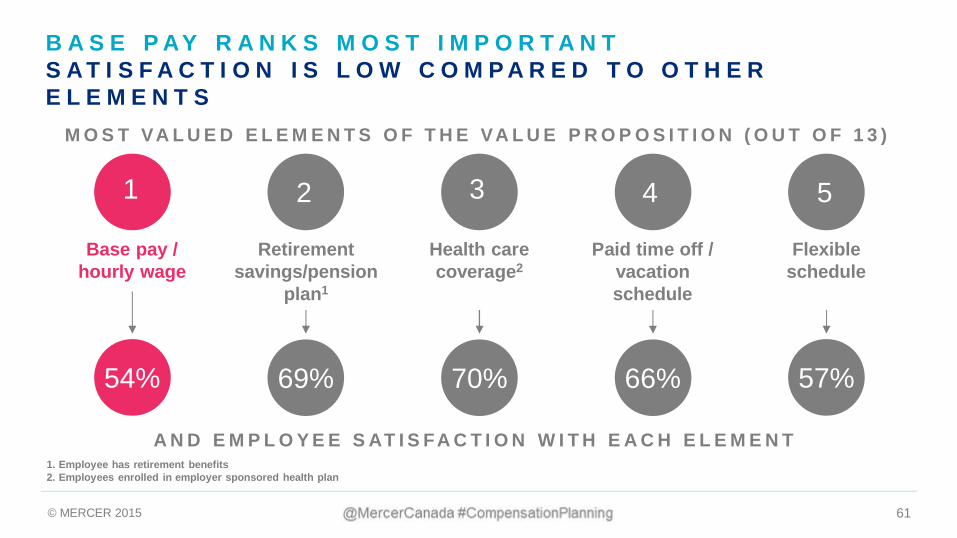
M O S T VA L U E D E L E M E N T S O F T H E VA L U E P R O P O S I T I O N ( O U T O F 1 3 )
A N D E M P L O Y E E S AT I S FA C T I O N W I T H E A C H E L E M E N T
2
Retirementsavings/pension
plan1
69%
3
Health carecoverage2
70%
4
Paid time off /vacationschedule
66%
5
Flexibleschedule
57%
1
Base pay /hourly wage
54%
B A S E P AY R A N K S M O S T I M P O R T A N TS A T I S F A C T I O N I S L O W C O M P A R E D T O O T H E RE L E M E N T S
1. Employee has retirement benefits2. Employees enrolled in employer sponsored health plan
© MERCER 2015 62
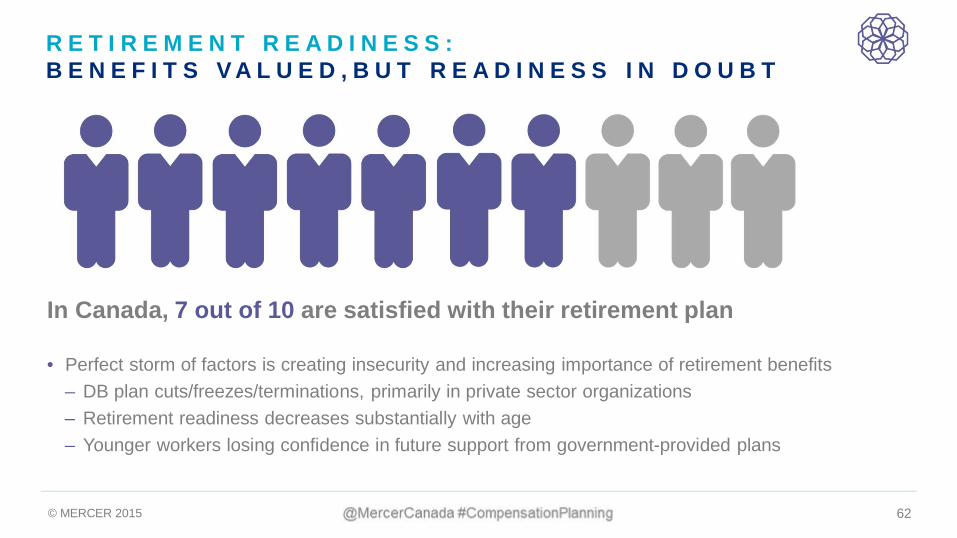
R E T I R E M E N T R E A D I N E S S :B E N E F I T S V A L U E D , B U T R E A D I N E S S I N D O U B T
In Canada, 7 out of 10 are satisfied with their retirement plan
• Perfect storm of factors is creating insecurity and increasing importance of retirement benefits– DB plan cuts/freezes/terminations, primarily in private sector organizations– Retirement readiness decreases substantially with age– Younger workers losing confidence in future support from government-provided plans
© MERCER 2015 63
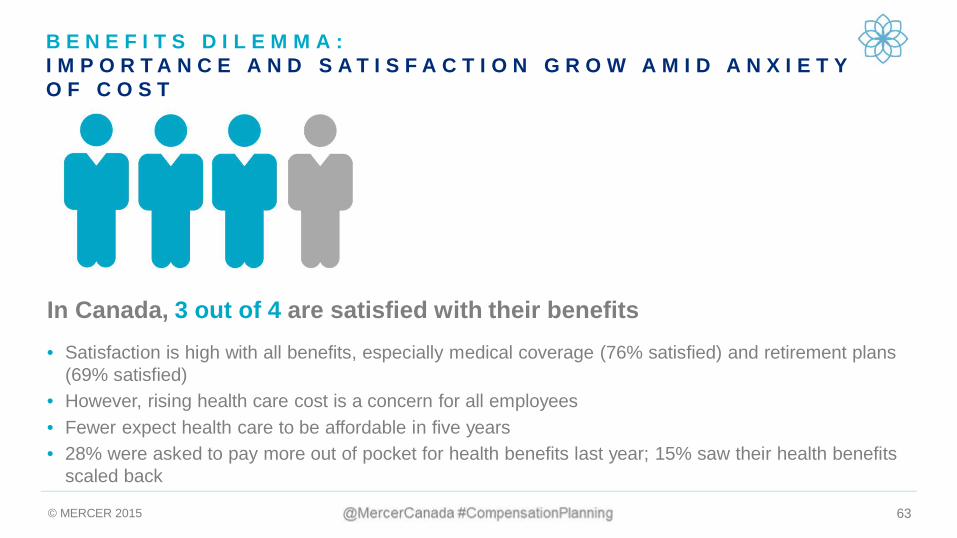
B E N E F I T S D I L E M M A :I M P O R T A N C E A N D S A T I S F A C T I O N G R O W A M I D A N X I E T YO F C O S T
In Canada, 3 out of 4 are satisfied with their benefits• Satisfaction is high with all benefits, especially medical coverage (76% satisfied) and retirement plans
(69% satisfied)• However, rising health care cost is a concern for all employees• Fewer expect health care to be affordable in five years• 28% were asked to pay more out of pocket for health benefits last year; 15% saw their health benefits
scaled back
© MERCER 2015 64
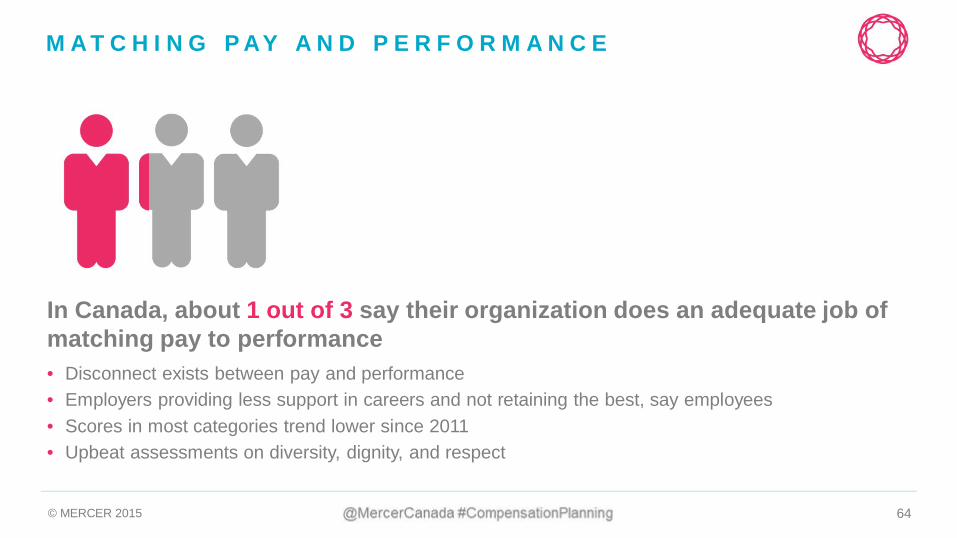
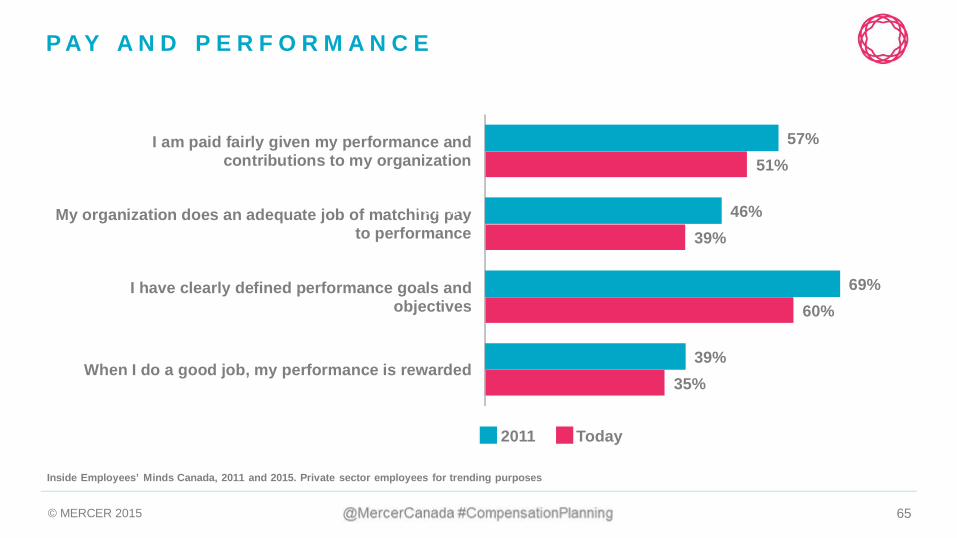
M A T C H I N G P AY A N D P E R F O R M A N C E
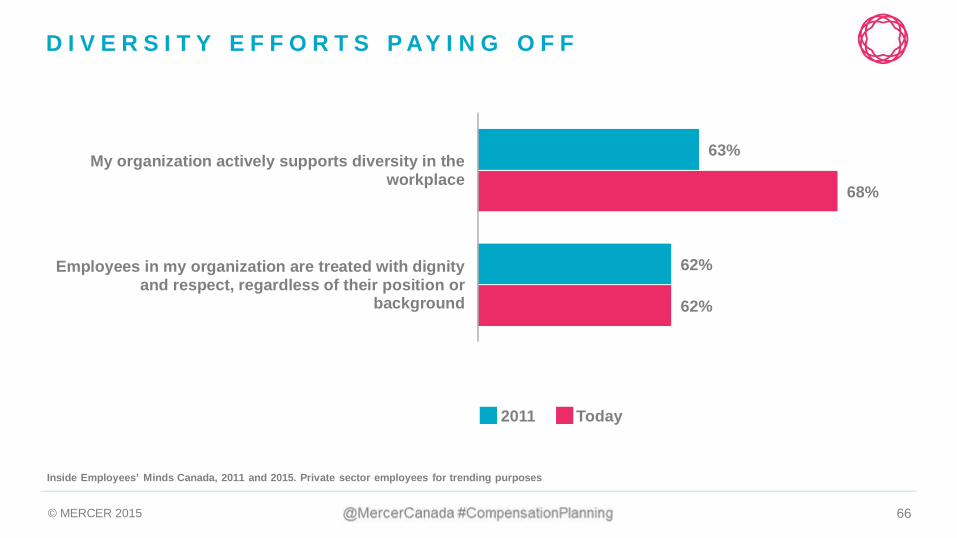
In Canada, about 1 out of 3 say their organization does an adequate job ofmatching pay to performance• Disconnect exists between pay and performance• Employers providing less support in careers and not retaining the best, say employees• Scores in most categories trend lower since 2011• Upbeat assessments on diversity, dignity, and respect
© MERCER 2015 65
35%
60%
39%
51%
39%
69%
46%
57%
When I do a good job, my performance is rewarded
I have clearly defined performance goals andobjectives
My organization does an adequate job of matching payto performance
I am paid fairly given my performance andcontributions to my organization
2011
TODAY
P AY A N D P E R F O R M A N C E
Inside Employees’ Minds Canada, 2011 and 2015. Private sector employees for trending purposes
2011 Today
© MERCER 2015 66
D I V E R S I T Y E F F O R T S P AY I N G O F F
62%
68%
62%
63%
Employees in my organization are treated with dignityand respect, regardless of their position or
background
My organization actively supports diversity in theworkplace
Inside Employees’ Minds Canada, 2011 and 2015. Private sector employees for trending purposes
2011 Today

© MERCER 2015 67
W H A T ’ S N E X T
STAY TUNED
© MERCER 2015 68
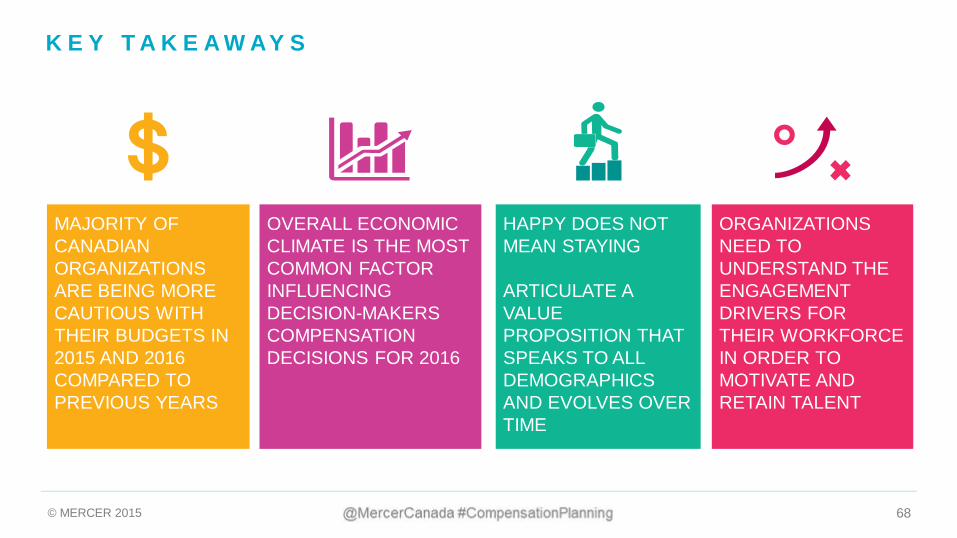
K E Y T A K E A W AY S
MAJORITY OFCANADIANORGANIZATIONSARE BEING MORECAUTIOUS WITHTHEIR BUDGETS IN2015 AND 2016COMPARED TOPREVIOUS YEARS
OVERALL ECONOMICCLIMATE IS THE MOSTCOMMON FACTORINFLUENCINGDECISION-MAKERSCOMPENSATIONDECISIONS FOR 2016
HAPPY DOES NOTMEAN STAYING
ARTICULATE AVALUEPROPOSITION THATSPEAKS TO ALLDEMOGRAPHICSAND EVOLVES OVERTIME
ORGANIZATIONSNEED TOUNDERSTAND THEENGAGEMENTDRIVERS FORTHEIR WORKFORCEIN ORDER TOMOTIVATE ANDRETAIN TALENT

© MERCER 2015 69
Q U E S T I O N S F R O M T H E A U D I E N C E
Ailsa ForsgrenPartner
Western Canada Talent Leader
604 609 [email protected]
Graham DoddPartner
North American Regional PracticeLeader, Talent Strategies
604 609 [email protected]