Embed Size (px)
Citation preview
Mesocyclone Detection Algorithm Neural Network (MDA NN)
Briefing for the TAC
Arthur Witt, NSSL
ObjectiveObjective
Measure the skill of the MDA NN vsMDA and TDAUse County Warning Scoring methodology instead of time-window scoring
Original MDA NNOriginal MDA NN
Found errors in the data used to train the original NNDeveloped a new NN instead of correcting the original NN
New MDA NNNew MDA NN
Uses fewer input parameters than the original NNDeveloped on a larger data set than the original NNDesigned to minimize over-fitting of the training data
New MDA NNNew MDA NN
Like the original NN, has both radar-only and radar + near-storm environment (NSE) componentsLike the original NN, predicts the probability of tornadoUnlike the original NN, wasn't developed to predict the probability of severe wind
County Warning ScoringCounty Warning Scoring
An automated algorithm scoring system using simulated county warningsMethodology is similar to that used by the NWS to determine severe weather warning performance
Scoring algorithm outputScoring algorithm output
Output scored indirectly via simulated warningsSimulated warnings are issued based on categorical output or bythresholding a parameterPerformance measures are calculated from simulated warnings and ground-truth verification
Procedure for issuing a warningProcedure for issuing a warning
Select a warning parameter
Select a warning threshold
Set duration time for warnings
Procedure for issuing a warningProcedure for issuing a warning
For each volume scan:• Check if parameter ≥ warning threshold• If yes, and storm not in county already
being warned• Calculate areal coverage of warning• Use “default warning polygon” criteria
from AWIPS WarnGen program
Polygon criteriaPolygon criteria
2 miles upstream and 6 miles either side of locationWidens out by a factor of 0.012 for each mile along the pathLength determined from motion vector and duration of warning
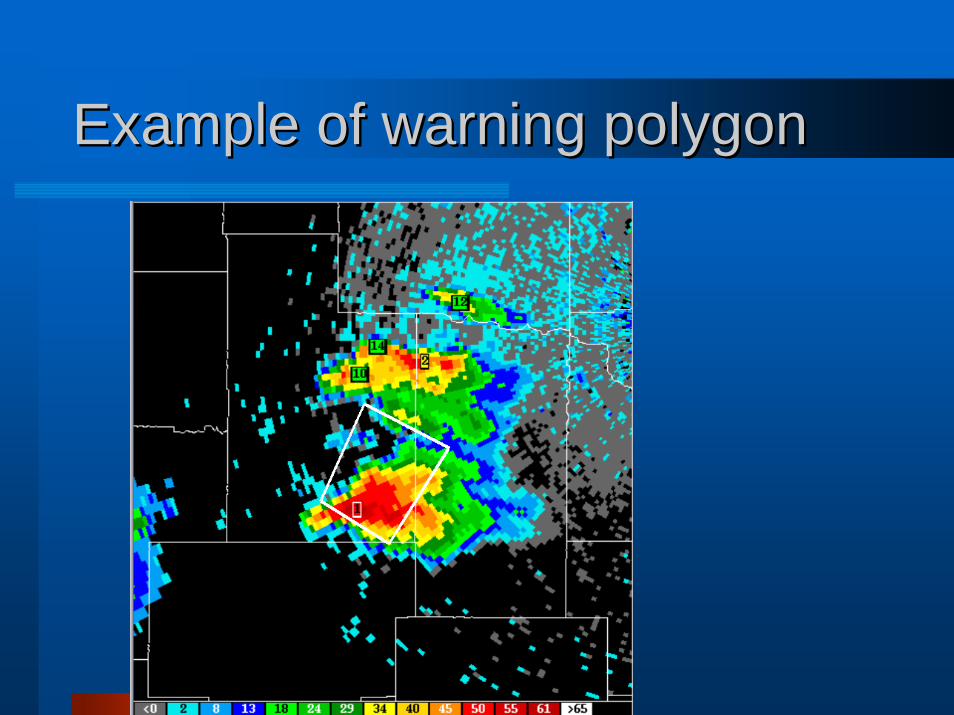
Example of warning polygonExample of warning polygon
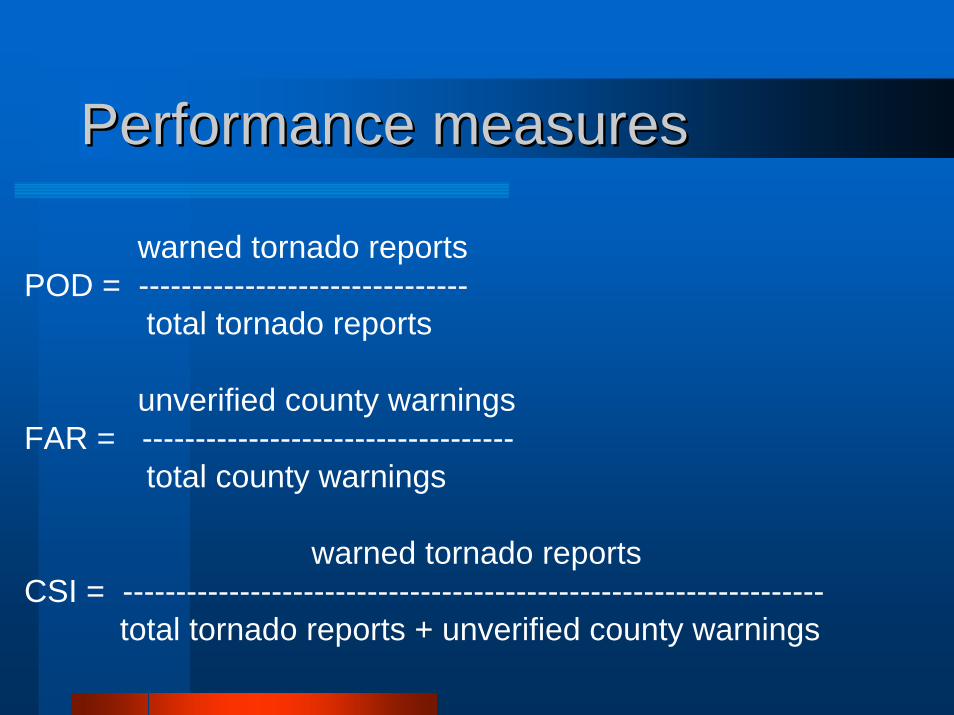
Performance measuresPerformance measures
warned tornado reportsPOD = -------------------------------
total tornado reports
unverified county warningsFAR = -----------------------------------
total county warnings
warned tornado reportsCSI = ------------------------------------------------------------------
total tornado reports + unverified county warnings
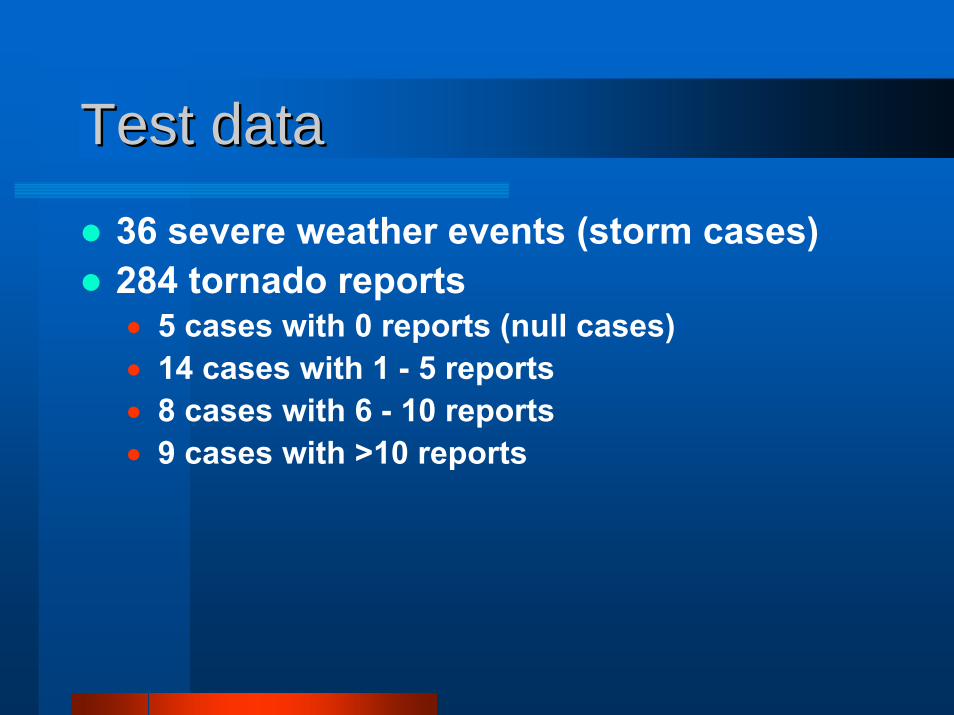
Test dataTest data
36 severe weather events (storm cases)284 tornado reports• 5 cases with 0 reports (null cases)• 14 cases with 1 - 5 reports• 8 cases with 6 - 10 reports• 9 cases with >10 reports
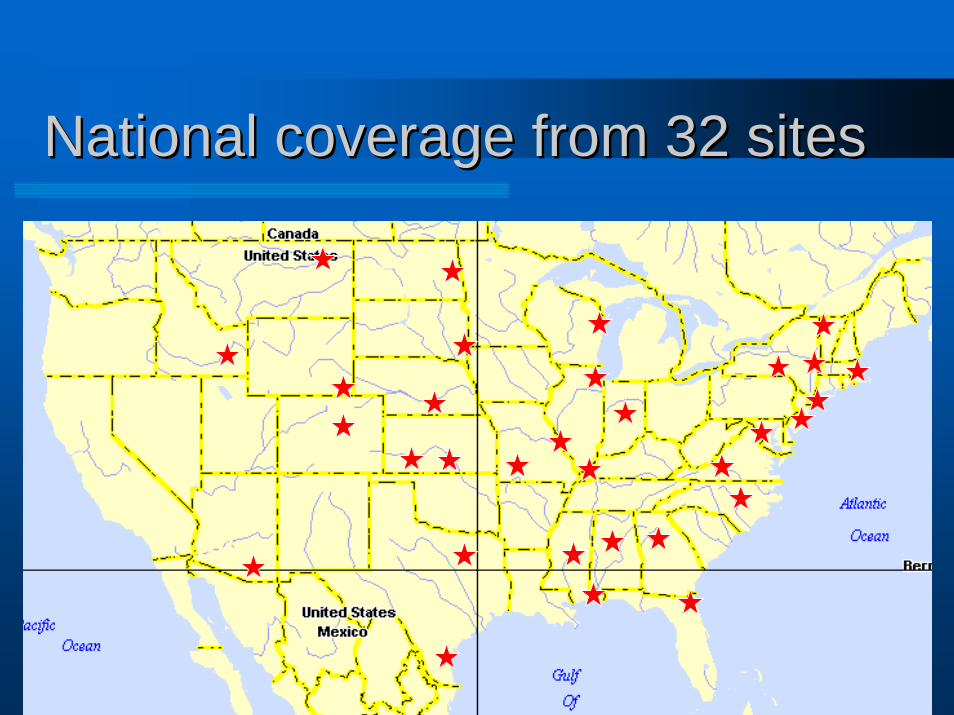
National coverage from 32 sitesNational coverage from 32 sites
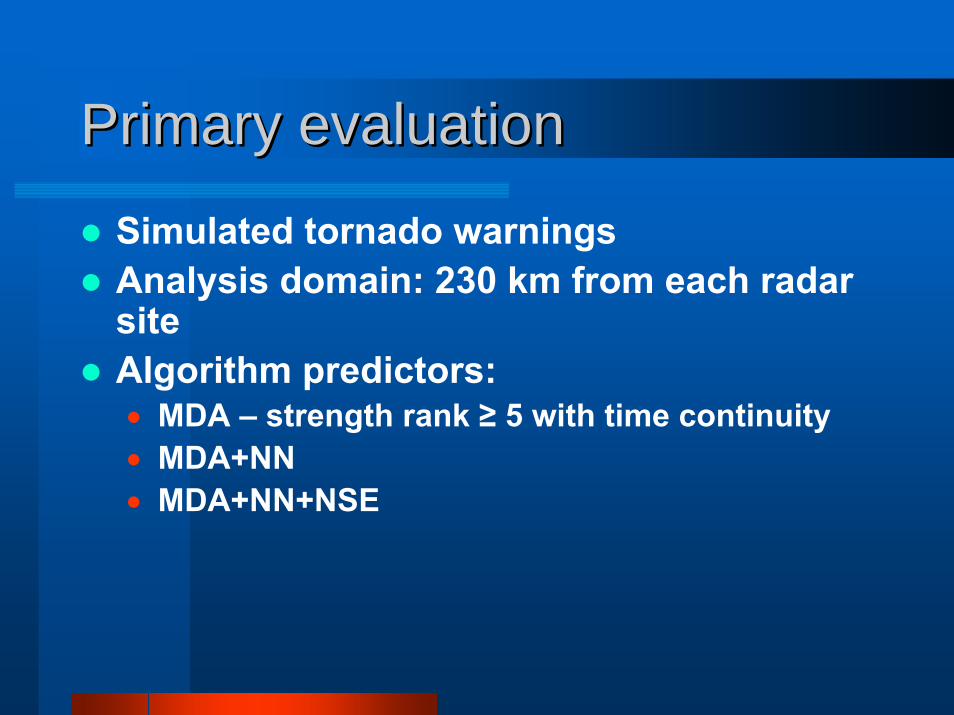
Primary evaluationPrimary evaluation
Simulated tornado warningsAnalysis domain: 230 km from each radar siteAlgorithm predictors:• MDA – strength rank ≥ 5 with time continuity• MDA+NN• MDA+NN+NSE
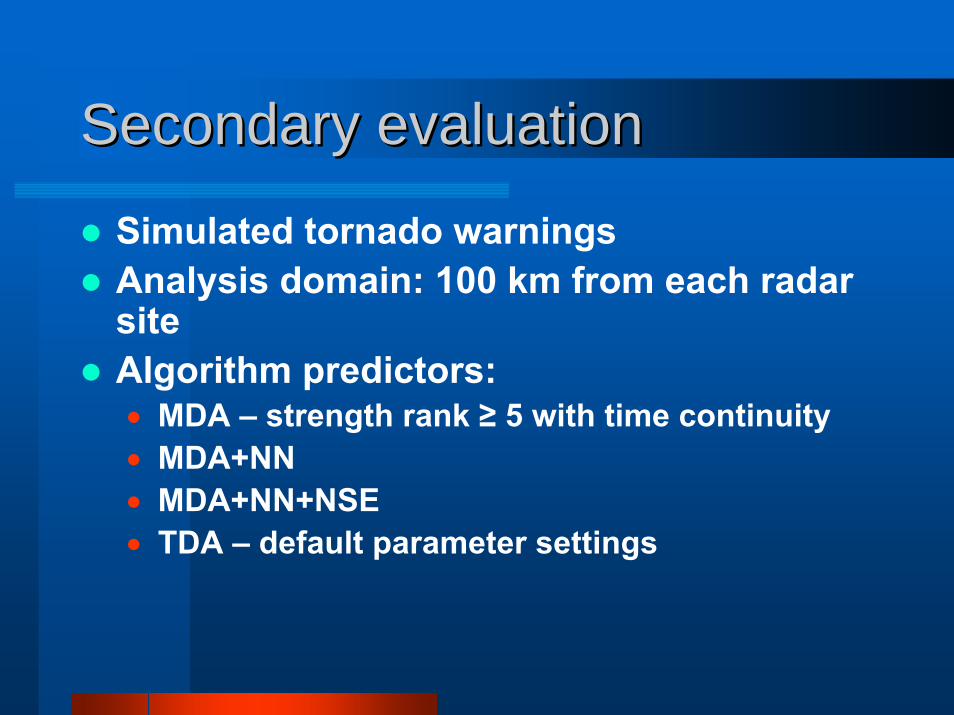
Secondary evaluationSecondary evaluation
Simulated tornado warningsAnalysis domain: 100 km from each radar siteAlgorithm predictors:• MDA – strength rank ≥ 5 with time continuity• MDA+NN• MDA+NN+NSE• TDA – default parameter settings
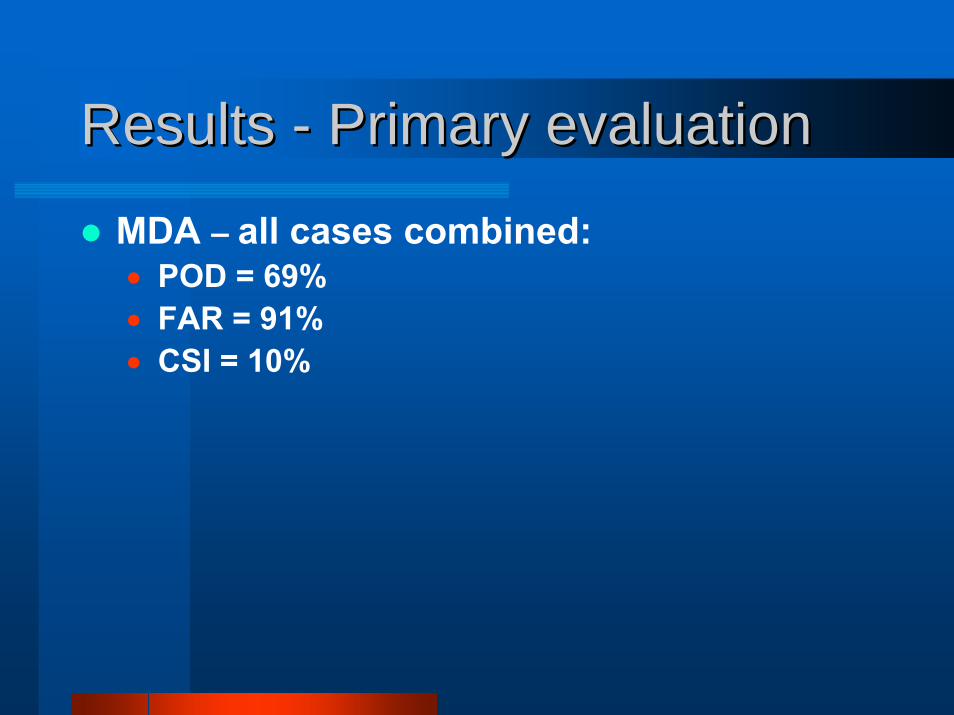
Results Results -- Primary evaluationPrimary evaluation
MDA – all cases combined:• POD = 69%• FAR = 91%• CSI = 10%
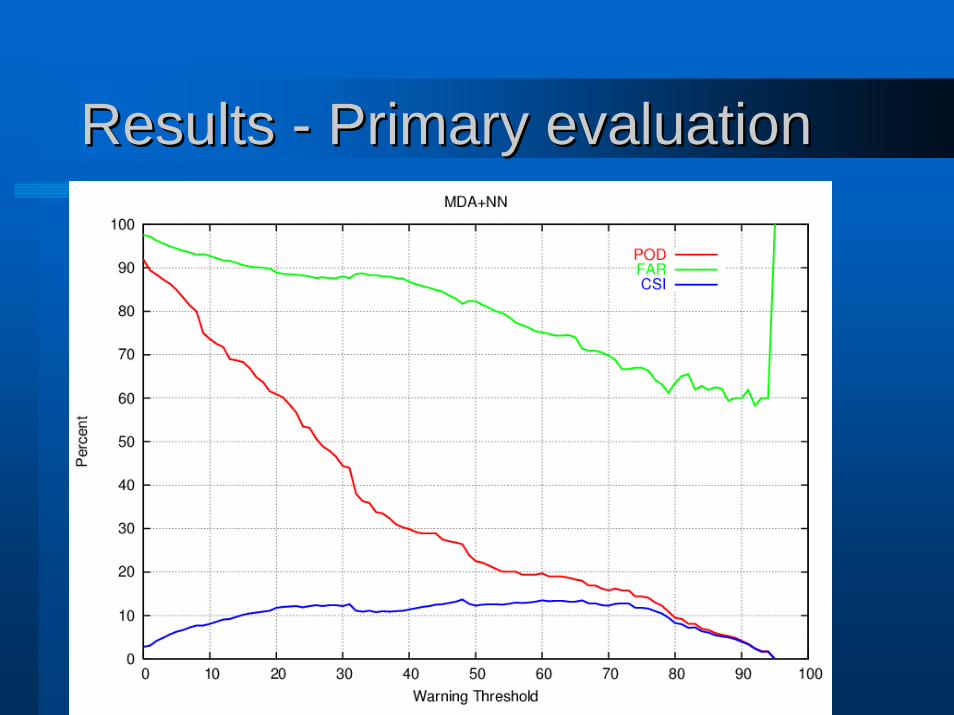
Results Results -- Primary evaluationPrimary evaluation
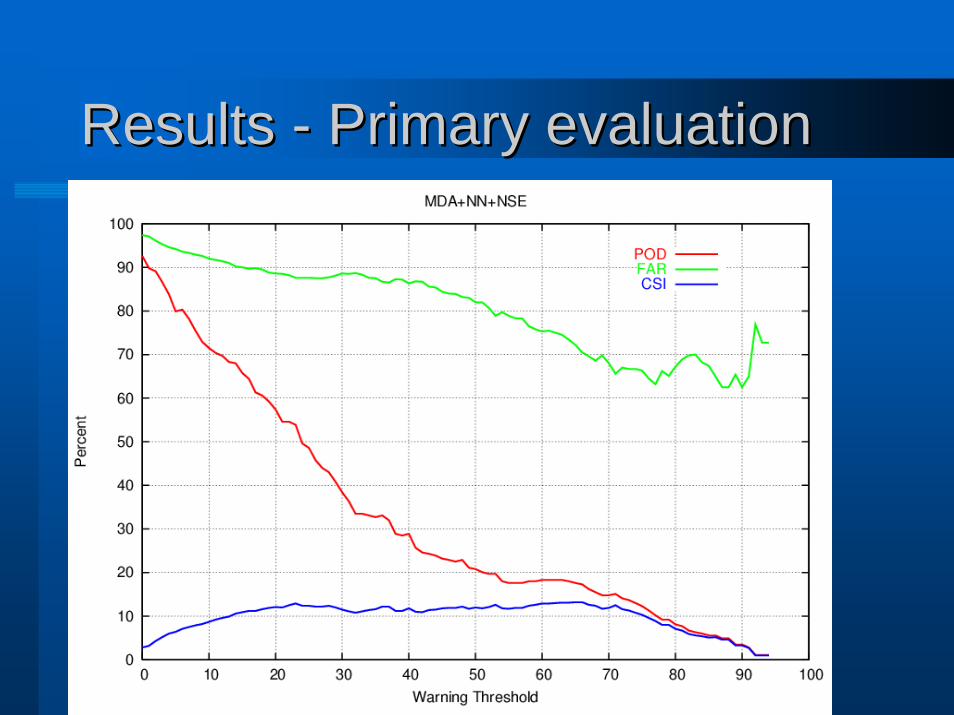
Results Results -- Primary evaluationPrimary evaluation
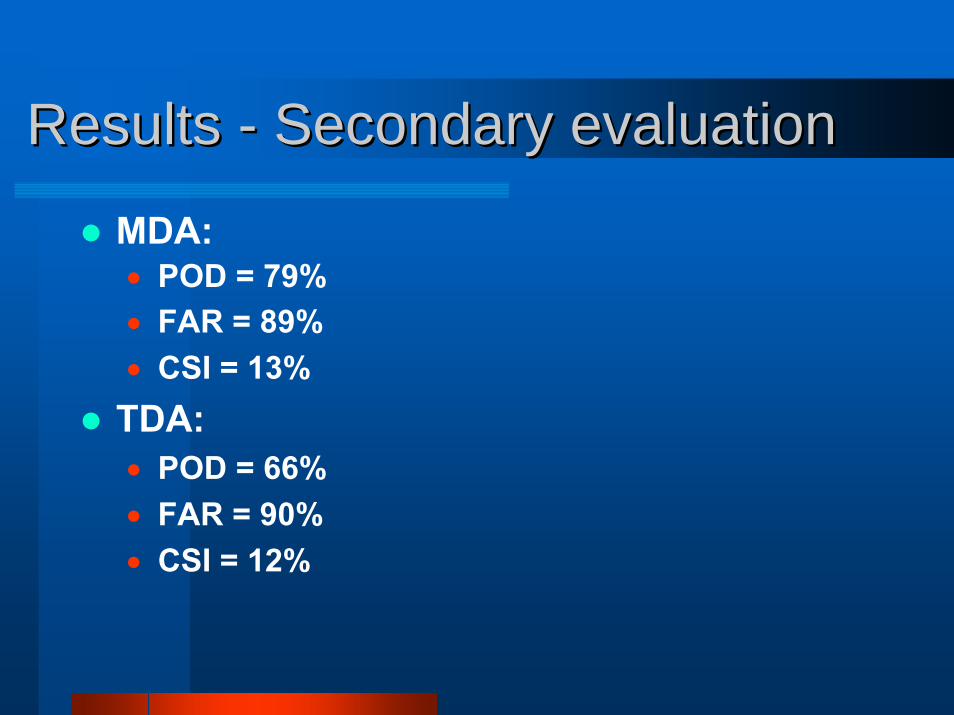
Results Results -- Secondary evaluationSecondary evaluation
MDA:• POD = 79%• FAR = 89%• CSI = 13%
TDA:• POD = 66%• FAR = 90%• CSI = 12%

Results Results -- Secondary evaluationSecondary evaluation
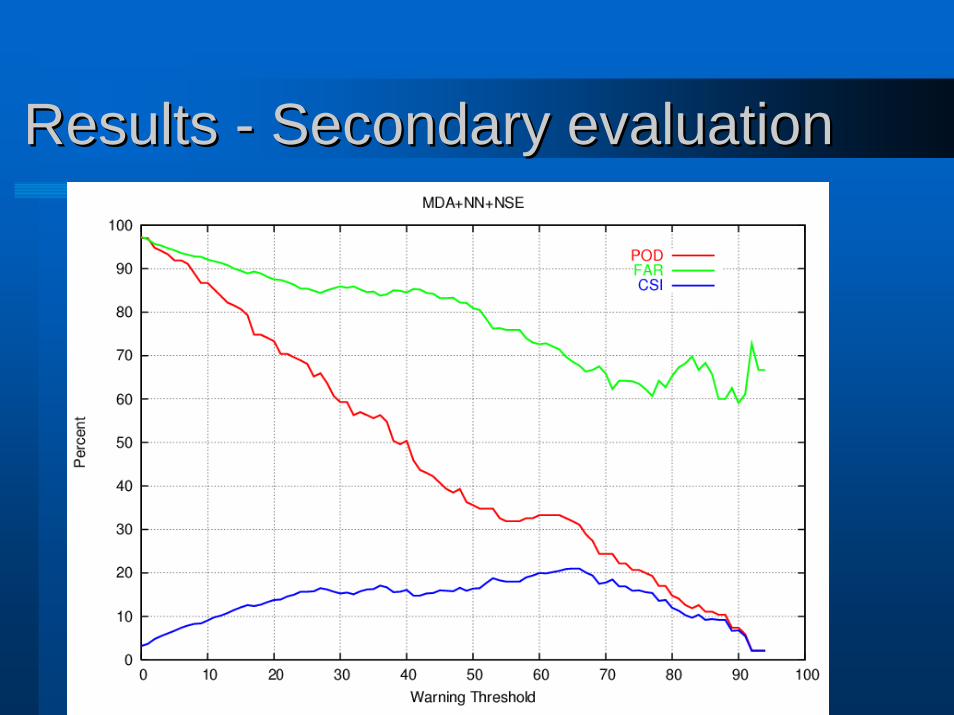
Results Results -- Secondary evaluationSecondary evaluation
ConclusionsConclusions
Primary results – only small improvement in skillSecondary results – somewhat greater improvement in skill, but only at higher warning thresholdsNo improvement in skill when NSE data is included
NonNon--performance NN Issuesperformance NN Issues
Consolidates many parameters into a single probability-based forecast of tornadoUseful “screening tool” in active severe weather situationsProbabilities provide a measure of confidence and are easier to use and understand than many algorithm parameters
NonNon--performance NN Issuesperformance NN Issues
Acts like a “black box” – many forecasters don't like thisWith increasing emphasis on analysing base data, NN output may be ignoredIf character of input data changes, it may be necessary to retrain the NN
RecommendationRecommendation
There is insufficient evidence to support this particular NN being added to the operational WSR-88D system at this time