Embed Size (px)
Citation preview
ORIGINAL ARTICLE
Metabolic Correlates of the Ictal-Interictal Continuum: FDG-PETDuring Continuous EEG
Aaron F. Struck1 • M. Brandon Westover1 • Lance T. Hall2 • Gina M. Deck1 •
Andrew J. Cole1 • Eric S. Rosenthal1
Published online: 11 May 2016
� Springer Science+Business Media New York 2016
Abstract
Background Ictal-interictal continuum (IIC) continuous
EEG (cEEG) patterns including periodic discharges and
rhythmic delta activity are associated with poor outcome
and in the appropriate clinical context, IIC patterns may
represent ‘‘electroclinical’’ status epilepticus (SE). To
clarify the significance of IIC patterns and their relation-
ship to ‘‘electrographic’’ SE, we investigated FDG-PET
imaging as a complementary metabolic biomarker of SE
among patients with IIC patterns.
Methods A single-center prospective clinical database was
ascertained for patients undergoing FDG-PET during
cEEG. Following MRI-PET co-registration, the maximum
standardized uptake value in cortical and subcortical
regions was compared to contralateral homologous and
cerebellar regions. Consensus cEEG review and clinical
rating of etiology and treatment response were performed
retrospectively with blinding. Electrographic SE was
classified as discrete seizures without interictal recovery or
>3-Hz rhythmic IIC patterns. Electroclinical SE was
classified as IIC patterns with electrographic and clinical
response to anticonvulsants; clonic activity; or persistent
post-ictal encephalopathy.
Results Eighteen hospitalized subjects underwent FDG-
PET during contemporaneous IIC patterns attributed to
structural lesions (44 %), neuroinflammatory/neuroinfec-
tious disease (39 %), or epilepsy (11 %). FDG-PET
hypermetabolism was common (61 %) and predicted
electrographic or electroclinical SE (sensitivity 79 %
[95 % CI 53–93 %] and specificity 100 % [95 % CI
51–100 %]; p = 0.01). Excluding electrographic SE,
hypermetabolism also predicted electroclinical SE (sensi-
tivity 80 % [95 % CI 44–94 %] and specificity 100 %
[95 % CI 51–100 %]; p = 0.01).
Conclusions In hospitalized patients with IIC EEG pat-
terns, FDG-PET hypermetabolism is common and is a
candidate metabolic biomarker of electrographic SE or
electroclinical SE.
Keywords FDG-PET � EEG � Status epilepticus �Ictal-interictal continuum
Introduction
Continuous electroencephalography (cEEG) commonly
identifies periodic and rhythmic patterns on the ictal-in-
terictal continuum (IIC) in patients with neurologic injury
[1]. IIC patterns are associated with poor neurologic out-
come [2–4], even in the absence of electrographic status
epilepticus (SE). The significance of these patterns in
relation to cerebral dysfunction and neurologic injury
remains unclear [5].
Electrographic SE represents the transition from an
indeterminate EEG pattern, that is, an IIC pattern, to a
definitively ictal pattern and electrographic SE is associ-
ated with significant morbidity and mortality [6, 7].
However, IIC patterns without definite electrographic sta-
tus epilepticus on scalp EEG are often observed in relation
to clonic movements, encephalopathy following status
epilepticus [8] or synchronized with depth seizures in the
setting of coma [9]. As a result, IIC patterns are often
& Aaron F. Struck
1 Department of Neurology, Massachusetts General Hospital
(MGH), 55 Fruit Street, Wang 735, Boston, MA 02114, USA
2 Department of Radiology, University of Wisconsin, Madison,
WI, USA
123
Neurocrit Care (2016) 24:324–331
DOI 10.1007/s12028-016-0245-y
managed as electroclinical SE in the appropriate clinical
context, and may respond to anti-epileptic drugs (AEDs).
Measurements of metabolism in patients with IIC pat-
terns may offer information complementary to and distinct
from EEG activity. 18F-Fluorodeoxyglucose positron
emission tomography (FDG-PET) represents an opportu-
nity to further characterize the metabolic impact of IIC
patterns potentially signifying neuronal injury or metabolic
stress that might guide treatment. FDG-PET measures
glucose uptake and commonly demonstrates hyperme-
tabolism during seizures and status epilepticus [10–15],
whileAQ infarcted cerebral tissue manifests reduced glu-
cose uptake. Most cerebral metabolic activity (80–85 %) is
related to propagation of action potentials and restoring
post-synaptic ion fluxes primarily related to glutamate,
making metabolism a fairly direct measure of neuronal
activity [16]. There have only been single case reports
demonstrating FDG-PET metabolic changes corresponding
to IIC patterns [10, 17–19]. We therefore investigated
FDG-PET cerebral metabolism as a candidate biomarker
for electrographic SE or electroclinical SE among patients
with IIC patterns.
Methods
Subjects
After local institutional review board approval, a single-
center prospective clinical EEG database was queried for
inpatients between 2005 and 2014 undergoing cEEG and
cerebral FDG-PET. Inclusion criteria included FDG-PET
imaging available for analysis, raw structural imaging
available for anatomic co-registration, cEEG performed
immediately prior to and immediately after FDG-PET
imaging, and presence of IIC patterns: periodic discharges
(PD), rhythmic delta activity (RDA), spike-wave activity
(SW), or electrographic SE on cEEG at the time of PET
injection. We excluded patients undergoing FDG-PET for
elective characterization of chronic epilepsy.
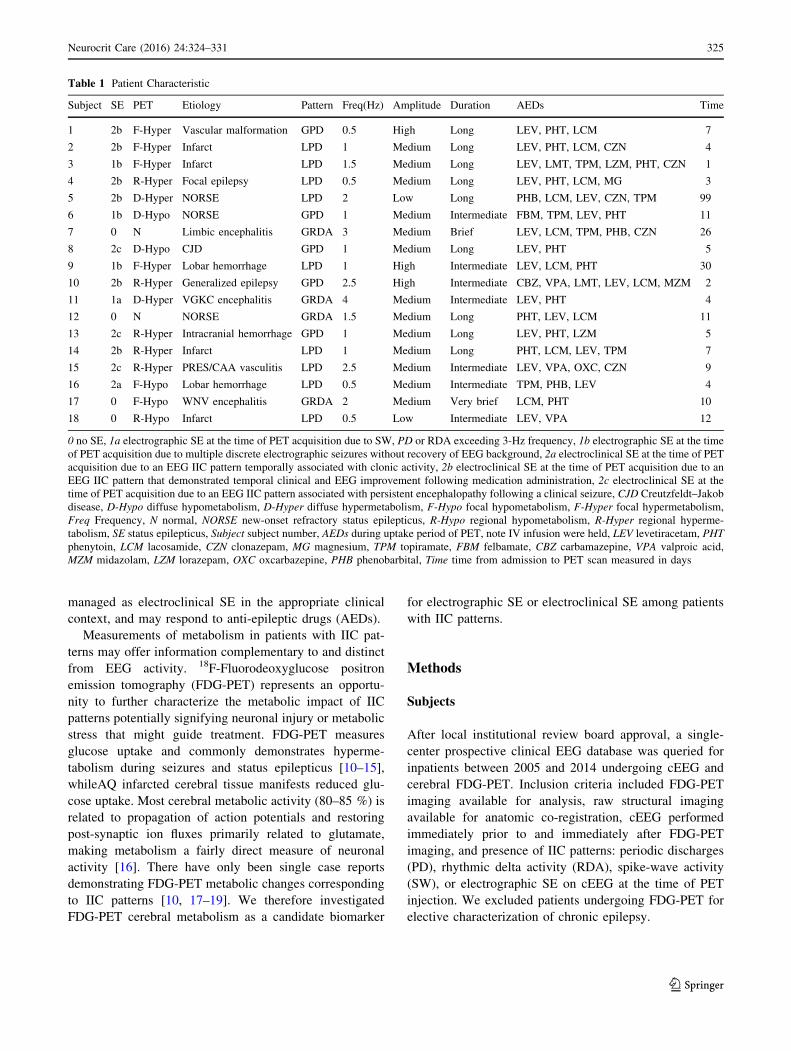
Table 1 Patient Characteristic
Subject SE PET Etiology Pattern Freq(Hz) Amplitude Duration AEDs Time
1 2b F-Hyper Vascular malformation GPD 0.5 High Long LEV, PHT, LCM 7
2 2b F-Hyper Infarct LPD 1 Medium Long LEV, PHT, LCM, CZN 4
3 1b F-Hyper Infarct LPD 1.5 Medium Long LEV, LMT, TPM, LZM, PHT, CZN 1
4 2b R-Hyper Focal epilepsy LPD 0.5 Medium Long LEV, PHT, LCM, MG 3
5 2b D-Hyper NORSE LPD 2 Low Long PHB, LCM, LEV, CZN, TPM 99
6 1b D-Hypo NORSE GPD 1 Medium Intermediate FBM, TPM, LEV, PHT 11
7 0 N Limbic encephalitis GRDA 3 Medium Brief LEV, LCM, TPM, PHB, CZN 26
8 2c D-Hypo CJD GPD 1 Medium Long LEV, PHT 5
9 1b F-Hyper Lobar hemorrhage LPD 1 High Intermediate LEV, LCM, PHT 30
10 2b R-Hyper Generalized epilepsy GPD 2.5 High Intermediate CBZ, VPA, LMT, LEV, LCM, MZM 2
11 1a D-Hyper VGKC encephalitis GRDA 4 Medium Intermediate LEV, PHT 4
12 0 N NORSE GRDA 1.5 Medium Long PHT, LEV, LCM 11
13 2c R-Hyper Intracranial hemorrhage GPD 1 Medium Long LEV, PHT, LZM 5
14 2b R-Hyper Infarct LPD 1 Medium Long PHT, LCM, LEV, TPM 7
15 2c R-Hyper PRES/CAA vasculitis LPD 2.5 Medium Intermediate LEV, VPA, OXC, CZN 9
16 2a F-Hypo Lobar hemorrhage LPD 0.5 Medium Intermediate TPM, PHB, LEV 4
17 0 F-Hypo WNV encephalitis GRDA 2 Medium Very brief LCM, PHT 10
18 0 R-Hypo Infarct LPD 0.5 Low Intermediate LEV, VPA 12
0 no SE, 1a electrographic SE at the time of PET acquisition due to SW, PD or RDA exceeding 3-Hz frequency, 1b electrographic SE at the time
of PET acquisition due to multiple discrete electrographic seizures without recovery of EEG background, 2a electroclinical SE at the time of PET
acquisition due to an EEG IIC pattern temporally associated with clonic activity, 2b electroclinical SE at the time of PET acquisition due to an
EEG IIC pattern that demonstrated temporal clinical and EEG improvement following medication administration, 2c electroclinical SE at the
time of PET acquisition due to an EEG IIC pattern associated with persistent encephalopathy following a clinical seizure, CJD Creutzfeldt–Jakob
disease, D-Hypo diffuse hypometabolism, D-Hyper diffuse hypermetabolism, F-Hypo focal hypometabolism, F-Hyper focal hypermetabolism,
Freq Frequency, N normal, NORSE new-onset refractory status epilepticus, R-Hypo regional hypometabolism, R-Hyper regional hyperme-
tabolism, SE status epilepticus, Subject subject number, AEDs during uptake period of PET, note IV infusion were held, LEV levetiracetam, PHT
phenytoin, LCM lacosamide, CZN clonazepam, MG magnesium, TPM topiramate, FBM felbamate, CBZ carbamazepine, VPA valproic acid,
MZM midazolam, LZM lorazepam, OXC oxcarbazepine, PHB phenobarbital, Time time from admission to PET scan measured in days
Neurocrit Care (2016) 24:324–331 325
123
FDG-PET Acquisition
PET imaging was performed under standard protocol,
45 min after injection of 5.0 mCi of FDG, and acquired on
an ECAT HR+ scanner (Siemens/CTI, Knoxville, TN). A
15.5-cm field of view was acquired with sixty-three planes
simultaneously in 3D mode. For attenuation correction a
transmission scan with a 68Ge source was used. Recon-
struction was performed using a maximum likelihood
algorithm. Images had approximately 4.6-mm resolution at
full width at half maximum.
PET Interpretation
An investigator blinded to the cEEG results used a semi-
quantitative method to define the degree and extent of FDG-
PET uptake. This analysis was performed blinded to the initial
‘‘clinical’’ interpretation of the PET. PET was co-registered to
T1 MRI. A 10 % color gradation [blue (hypo), green, yellow,
red (hyper)] with cerebellum set to yellow, was used to
highlight areas of abnormality. The maximum standardized
uptake value (SUVmax) was measured regionally in the mesial
temporal, basal ganglia, and thalamic regions, and neo-cortex
(rated over frontal, temporal, parietal, and occipital regions).
The SUVmax was calculated as the voxel of highest SUV for a
specified region. The SUV has been described as a ratio of
radioactivity per a voxel expressed as a concentration
(megaBecquerel per kilogram) divided by injected dose of
radiation per kilogram of body mass [20]. Lack of arterial
blood sampling prevented direct quantification of glucose
metabolism. Because acute neurologic injury limited the
utility of healthy subjects as a reference standard, we pre-
specified that a 20 % relative difference in SUVmax (rSUVmax)
compared with an internal control to ascertain differences in
FDG uptake [21]. For focal abnormalities a contralateral
homologous region was used to calculate the reference
rSUVmax. Regions with altered metabolism were also com-
pared to the total cerebellar SUVmax. If bilateral changes were
ascertained on visual inspection, the contralateral reference
was not available and we accordingly employed a threshold of
50 % increase of SUVmax relative to cerebellum, (a 99 %
confidence interval assuming a normal distribution and with a
0.2 standard deviation) [22, 23]. Hypermetabolism and
hypometabolism were classified as focal (present in a single
region), regional (extending to subcortical or adjacent
regions), or 3 diffuse (bilateral).
EEG Review
ACNS terminology-certified [1] clinical neurophysiologists
blinded to clinical and PET data rated cEEG for discrete
seizures, periodic discharges including modifiers frequency,
location, amplitude, superimposed fast frequencies, rhyth-
mic activity, sharp activity, and triphasic morphology.
Discrepancies were resolved by consensus.
Determination of Status Epilepticus
No gold standard external to EEG exists to determine if a
patient is in SE. We operationally differentiated
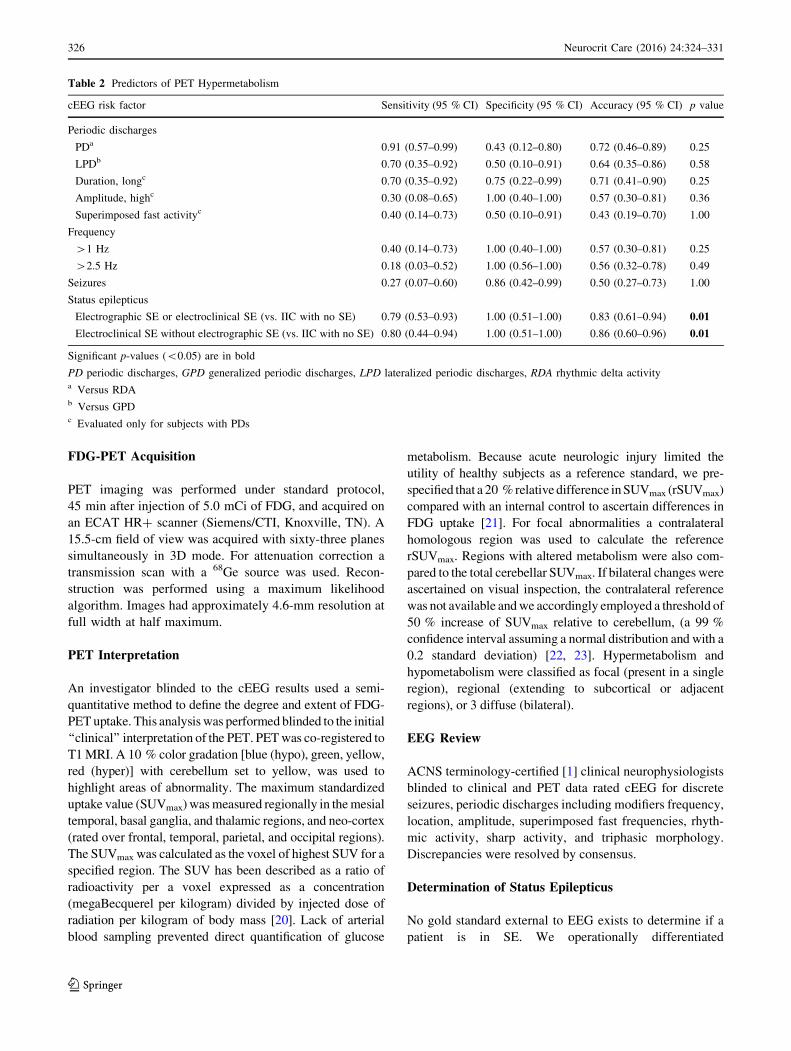
Table 2 Predictors of PET Hypermetabolism
cEEG risk factor Sensitivity (95 % CI) Specificity (95 % CI) Accuracy (95 % CI) p value
Periodic discharges
PDa 0.91 (0.57–0.99) 0.43 (0.12–0.80) 0.72 (0.46–0.89) 0.25
LPDb 0.70 (0.35–0.92) 0.50 (0.10–0.91) 0.64 (0.35–0.86) 0.58
Duration, longc 0.70 (0.35–0.92) 0.75 (0.22–0.99) 0.71 (0.41–0.90) 0.25
Amplitude, highc 0.30 (0.08–0.65) 1.00 (0.40–1.00) 0.57 (0.30–0.81) 0.36
Superimposed fast activityc 0.40 (0.14–0.73) 0.50 (0.10–0.91) 0.43 (0.19–0.70) 1.00
Frequency
>1 Hz 0.40 (0.14–0.73) 1.00 (0.40–1.00) 0.57 (0.30–0.81) 0.25
>2.5 Hz 0.18 (0.03–0.52) 1.00 (0.56–1.00) 0.56 (0.32–0.78) 0.49
Seizures 0.27 (0.07–0.60) 0.86 (0.42–0.99) 0.50 (0.27–0.73) 1.00
Status epilepticus
Electrographic SE or electroclinical SE (vs. IIC with no SE) 0.79 (0.53–0.93) 1.00 (0.51–1.00) 0.83 (0.61–0.94) 0.01
Electroclinical SE without electrographic SE (vs. IIC with no SE) 0.80 (0.44–0.94) 1.00 (0.51–1.00) 0.86 (0.60–0.96) 0.01
Significant p-values (<0.05) are in bold
PD periodic discharges, GPD generalized periodic discharges, LPD lateralized periodic discharges, RDA rhythmic delta activitya Versus RDAb Versus GPDc Evaluated only for subjects with PDs
326 Neurocrit Care (2016) 24:324–331
123
electrographic SE from electroclinical SE using pre-spec-
ified published definitions. [24, 25]. We accordingly
defined electrographic SE as meeting any of the following
criteria: (1a) a pattern of >3-Hz spike-wave, periodic
discharges, or rhythmic activity or (1b) discrete electro-
graphic seizures meeting Young criteria [25] without
recovery of EEG background. We similarly defined elec-
troclinical SE as meeting any of the following published
criteria: (2a) an IIC pattern temporally associated with
clonic activity; (2b) an IIC pattern associated with both
clinical and EEG improvement following AED; or (2c) an
IIC pattern following a single seizure in association with
persistent encephalopathy [24, 25]. Clinical records were
assessed by a neurologist blinded to cEEG and PET results
for disease etiology and response to AED treatment.
Statistical Analysis
Categorical variables were analyzed for significance
using Fisher-exact test. 95 % confidence intervals for
proportions were generated using Wilson test with
continuity correction [26]. Statistical analyses were per-
formed using MATLAB 2013B (Natick, MA) and R
3.1.3 (The R Foundation for Statistical Computing; http://
www.R-project.org.
Results
Patient Characteristics
Between 2005 and 2014, 18 inpatients met the selection
criteria (mean age 56.6; range 14–83). All patients were on
AEDs at the time of FDG-PET scanning Table 1 details
patient, cEEG, and imaging characteristics, including
determination of electrographic SE, electroclinical SE, or
IIC patterns without SE. FDG-PET was hypermetabolic in
11 (61 %), hypometabolic in 5 (28 %) and normal in 2
(11 %) patients. Final diagnoses included structural lesions
(n = 8; 44 %: of which 6 are ischemic or hemorrhagic
strokes, 1 developmental venous anomaly, 1 mechanical
injury), neuroinflammatory/neuroinfectious illness (n = 7;
39 %), decompensated epilepsy (n = 2), and Creutzfeldt–
Jakob disease (CJD) (n = 1).
Relation of cEEG Patterns to PET Findings
Among IIC subjects, FDG-PET predicted SE (electro-
graphic or electroclinical,) with 79 % sensitivity (95 % CI
53–93 %) and 100 % specificity (95 % CI 51–100 %);
Fisher-exact p = 0.01. For the cohort of subjects without
electrographic SE, FDG-PET predicted electroclinical SE
with 80 % sensitivity (95 % CI 44–94 %) and 100 %
specificity (95 % CI 51–100 %); Fisher-exact p = 0.01.
cEEG FDG-PET metabolism was assessed for its
dependence on pre-specified candidate variables (Table 2).
Certain cEEG features suggested high specificity for
hypermetabolism (>1-Hz or high-amplitude PDs) or high
sensitivity (PDs versus RDA) with insufficient statistical
power to achieve significance.
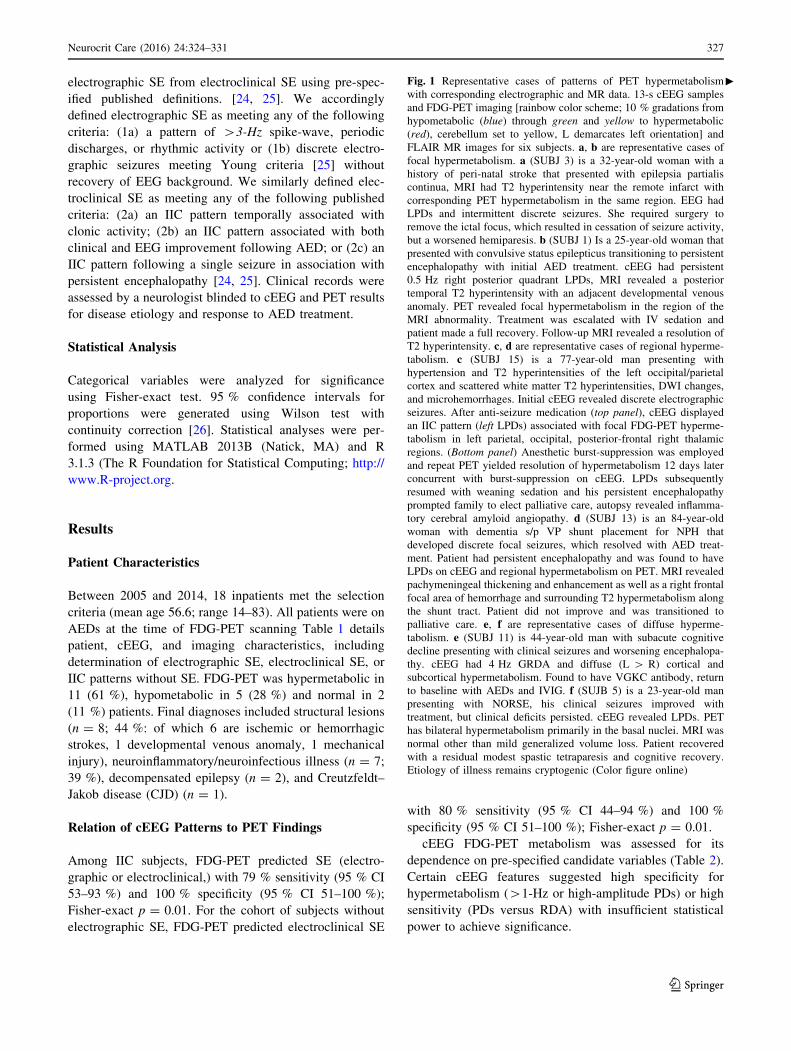
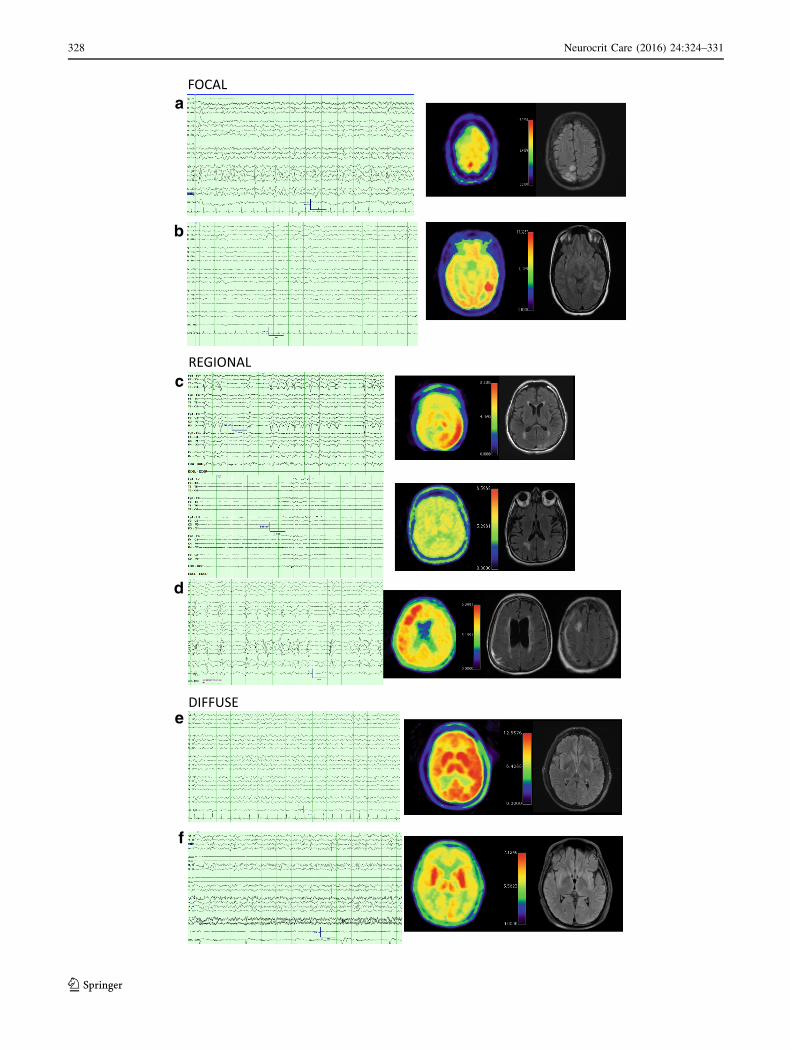
cFig. 1 Representative cases of patterns of PET hypermetabolism
with corresponding electrographic and MR data. 13-s cEEG samples
and FDG-PET imaging [rainbow color scheme; 10 % gradations from
hypometabolic (blue) through green and yellow to hypermetabolic
(red), cerebellum set to yellow, L demarcates left orientation] and
FLAIR MR images for six subjects. a, b are representative cases of
focal hypermetabolism. a (SUBJ 3) is a 32-year-old woman with a
history of peri-natal stroke that presented with epilepsia partialis
continua, MRI had T2 hyperintensity near the remote infarct with
corresponding PET hypermetabolism in the same region. EEG had
LPDs and intermittent discrete seizures. She required surgery to
remove the ictal focus, which resulted in cessation of seizure activity,
but a worsened hemiparesis. b (SUBJ 1) Is a 25-year-old woman that
presented with convulsive status epilepticus transitioning to persistent
encephalopathy with initial AED treatment. cEEG had persistent
0.5 Hz right posterior quadrant LPDs, MRI revealed a posterior
temporal T2 hyperintensity with an adjacent developmental venous
anomaly. PET revealed focal hypermetabolism in the region of the
MRI abnormality. Treatment was escalated with IV sedation and
patient made a full recovery. Follow-up MRI revealed a resolution of
T2 hyperintensity. c, d are representative cases of regional hyperme-
tabolism. c (SUBJ 15) is a 77-year-old man presenting with
hypertension and T2 hyperintensities of the left occipital/parietal
cortex and scattered white matter T2 hyperintensities, DWI changes,
and microhemorrhages. Initial cEEG revealed discrete electrographic
seizures. After anti-seizure medication (top panel), cEEG displayed
an IIC pattern (left LPDs) associated with focal FDG-PET hyperme-
tabolism in left parietal, occipital, posterior-frontal right thalamic
regions. (Bottom panel) Anesthetic burst-suppression was employed
and repeat PET yielded resolution of hypermetabolism 12 days later
concurrent with burst-suppression on cEEG. LPDs subsequently
resumed with weaning sedation and his persistent encephalopathy
prompted family to elect palliative care, autopsy revealed inflamma-
tory cerebral amyloid angiopathy. d (SUBJ 13) is an 84-year-old
woman with dementia s/p VP shunt placement for NPH that
developed discrete focal seizures, which resolved with AED treat-
ment. Patient had persistent encephalopathy and was found to have
LPDs on cEEG and regional hypermetabolism on PET. MRI revealed
pachymeningeal thickening and enhancement as well as a right frontal
focal area of hemorrhage and surrounding T2 hypermetabolism along
the shunt tract. Patient did not improve and was transitioned to
palliative care. e, f are representative cases of diffuse hyperme-
tabolism. e (SUBJ 11) is 44-year-old man with subacute cognitive
decline presenting with clinical seizures and worsening encephalopa-
thy. cEEG had 4 Hz GRDA and diffuse (L > R) cortical and
subcortical hypermetabolism. Found to have VGKC antibody, return
to baseline with AEDs and IVIG. f (SUJB 5) is a 23-year-old man
presenting with NORSE, his clinical seizures improved with
treatment, but clinical deficits persisted. cEEG revealed LPDs. PET
has bilateral hypermetabolism primarily in the basal nuclei. MRI was
normal other than mild generalized volume loss. Patient recovered
with a residual modest spastic tetraparesis and cognitive recovery.
Etiology of illness remains cryptogenic (Color figure online)
Neurocrit Care (2016) 24:324–331 327
123
a
b
c
d
e
f
FOCAL
REGIONAL
DIFFUSE
328 Neurocrit Care (2016) 24:324–331
123
FDG-PET was insensitive to electrographic or electro-
clinical SE in three patients. One patient had right parietal
hypometabolism despite electroclinical SE diagnosed as
epilepsia partialis continua (EPC) from a remote right
parietal infarct with left facial twitching, 0.5-Hz right
LPDs, and no evident electrographic seizures. A second
patient diagnosed with CJD had diffuse hypometabolism
with ‘‘electroclinical SE’’ diagnosed as a suspected clinical
seizure followed by persistent encephalopathy and 1-Hz
GPDs. The third patient had NORSE of unknown etiology
and diffuse hypometabolism despite electrographic SE
diagnosed as discrete electrographic seizures with inter-
vening 1-Hz GPDs.
Patterns of Metabolism
Three patterns of hypermetabolism were assessed: focal,
regional, and diffuse. Figure 1 shows representative PETs
of six subjects, two from each of hypermetabolism with the
associated MR and EEG. Two subjects had diffuse
hypermetabolism defined as regions of hypermetabolism in
both hemispheres. Both presented with NORSE, one with
LPDs and the other with 4-Hz GRDA. Five subjects had
regional hypermetabolism, two with GPDs the others with
LPDs. Subjects with regional hypermetabolism had pre-
existing focal epilepsy (2), a structural lesion (2), or vas-
culitis (1). Four subjects had focal hypermetabolism all
related to underlying structural lesion. Three had LPDs and
the other had GPDs.
Five subjects had hypometabolism. In two patients,
hypometabolism was diffuse (CJD, NORSE). The other
three had regional or focal hypometabolism, two related to
structural lesions and one with encephalitis.
Discussion
In this study, FDG-PET cerebral hypermetabolism similar
to that described in cases of SE [5, 13, 18] was significantly
more common among patients with IIC patterns fulfilling
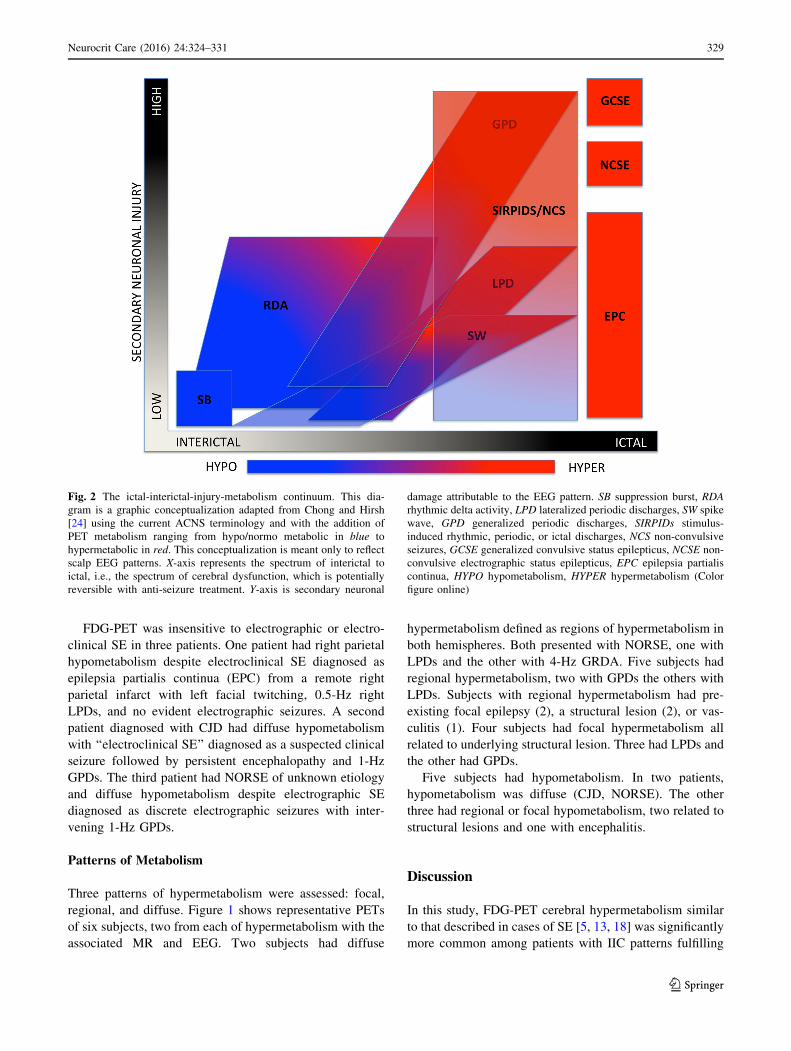
Fig. 2 The ictal-interictal-injury-metabolism continuum. This dia-
gram is a graphic conceptualization adapted from Chong and Hirsh
[24] using the current ACNS terminology and with the addition of
PET metabolism ranging from hypo/normo metabolic in blue to
hypermetabolic in red. This conceptualization is meant only to reflect
scalp EEG patterns. X-axis represents the spectrum of interictal to
ictal, i.e., the spectrum of cerebral dysfunction, which is potentially
reversible with anti-seizure treatment. Y-axis is secondary neuronal
damage attributable to the EEG pattern. SB suppression burst, RDA
rhythmic delta activity, LPD lateralized periodic discharges, SW spike
wave, GPD generalized periodic discharges, SIRPIDs stimulus-
induced rhythmic, periodic, or ictal discharges, NCS non-convulsive
seizures, GCSE generalized convulsive status epilepticus, NCSE non-
convulsive electrographic status epilepticus, EPC epilepsia partialis
continua, HYPO hypometabolism, HYPER hypermetabolism (Color
figure online)
Neurocrit Care (2016) 24:324–331 329
123
published criteria for electrographic SE or electroclinical
SE than among patients with IIC patterns alone.
Although this cohort is the largest described with con-
comitant cEEG IIC patterns and concurrent FDG-PET,
sample size (n = 18) limited conclusions about specific
cEEG features. Additionally, FDG-PET was performed
only in complicated cases with high clinical suspicion for
SE this represents a referral bias. FDG-PET is not routinely
performed in patients with critical neurologic illness for
other reasons limiting the ability to generate a relevant set
of control subjects. A prospective study of PET neu-
roimaging may more systematically identify IIC features
(e.g., frequency, amplitude) most predictive of hyperme-
tabolism. Additionally, it was difficult to gage the clinical
response to AED therapy; clinical response was reviewed
retrospectively and FDG-PET findings may have con-
founded the indication for further anti-seizure medications.
Potential limitations of FDG-PET imaging include
spatial averaging from 5-mm resolution limits [20, 27] and
temporal averaging during the 45-min uptake period.
Examples in our cohort of these limitations may have
included focal EPC dominated by surrounding hypometa-
bolism (subject 16) and discrete seizures with intervening
GPDs (subject 6). Technical advances with PET-MR and
quantitative PET with arterial input function estimations
have the potential to reduce the concerns with spatial and
time averaging. A potential source of false positives is a
hypermetabolic process independent of ictal activity such
as encephalitis. Notably, we did not find FDG-PET
hypermetabolism in any our cohort among seven subjects
with neuroinflammatory/neuroinfectious disease; all were
correctly classified except one false negative.
Conclusion
SE and the IIC represent a spectrum of neurophysiologic
dysfunction. Some IIC patterns are associated with AED-
responsive reversible cerebral dysfunction due to deep-
seated or undetected ictal zones or ‘‘burned out’’ SE with
persistently altered metabolism. Here, we demonstrate that
the metabolic effect of IIC in patients with suspected SE
without definite electrographic features is similar to the
metabolic features of electrographic SE and is not routinely
explained by neuroinflammatory or neuroinfectious disease
alone. Figure 2 is our adaptation of a diagram describing
the IIC initially put forth by Chong and Hirsch [24]. This
diagram helps conceptualize the role of metabolism in
evaluating SE and the IIC. This study reinforces prior work
which raises the possibility of ancillary biomarkers for SE
and develops the concept of ‘‘electro-metabolic’’ status
epilepticus. We put forth FDG-PET as another candidate
radiologic biomarker of status epilepticus.
Compliance with Ethical Standards
Disclosures Aaron F Struck, MD: Dr. Struck reports no disclosures.
M. Brandon Westover, MD PhD: Dr. Westover receives funding from
NIH-NINDS (K23 NS090900), the Rappaport Foundation, and the
Andrew David Heitman Neuroendovascular Research Fund. Lance
Hall, MD: receives research funding from, R01 CA158800-01 (NIH/
NCI), R21 CA198392-01 (NIH/NCI), Merck/GE Healthcare. Gina M
Deck, MD: Dr. Deck reports no disclosures. Andrew J Cole, MD: Dr.
Cole reports no disclosures. Eric S. Rosenthal, MD: Dr. Rosenthal
receives research support from an institutional contract with SAGE
Therapeutics, and Grant funding from the Andrew David Heitman
Neuroendovascular Research Foundation, NIBIB (5U54EB007954-
04), NINDS (5U10NS080369-02), and the U.S. Army Medical
Research and Materiel Command (W81XWH-08-2-0154).
References
1. Hirsch LJ, LaRoche SM, Gaspard N, et al. American Clinical
Neurophysiology Society’s standardized critical care EEG ter-
minology: 2012 version. J Clin Neurophysiol. 2013;30:1–27.
2. Orta DS, Chiappa KH, Quiroz AZ, Costello DJ, Cole AJ. Prog-
nostic implications of periodic epileptiform discharges. Arch
Neurol. 2009;66:985–91.
3. Walsh JM, Brenner RP. Periodic lateralized epileptiform dis-
charges–long-term outcome in adults. Epilepsia. 1987;28:533–6.
4. Claassen J, Jette N, Chum F, et al. Electrographic seizures and
periodic discharges after intracerebral hemorrhage. Neurology.
2007;69:1356–65.
5. Claassen J. How I treat patients with EEG patterns on the ictal-
interictal continuum in the neuro ICU. Neurocrit Care.
2009;11:437–44.
6. Coeytaux A, Jallon P, Galobardes B, Morabia A. Incidence of
status epilepticus in French-speaking Switzerland: (EPISTAR).
Neurology. 2000;55:693–7.
7. Knake S, Rosenow F, Vescovi M, et al. Incidence of status
epilepticus in adults in Germany: a prospective, population-based
study. Epilepsia. 2001;42:714–8.
8. Treiman DM, Walton NY, Kendrick C. A progressive sequence
of electroencephalographic changes during generalized convul-
sive status epilepticus. Epilepsy Res. 1990;5:49–60.
9. Claassen J, Perotte A, Albers D, et al. Nonconvulsive seizures
after subarachnoid hemorrhage: multimodal detection and out-
comes. Ann Neurol. 2013;74:53–64.
10. Hajek M, Antonini A, Leenders KL, Wieser HG. Epilepsia par-
tialis continua studied by PET. Epilepsy Res. 1991;9:44–8.
11. Engel J Jr, Kuhl DE, Phelps ME. Patterns of human local cerebral
glucose metabolism during epileptic seizures. Science. 1982;
218:64–6.
12. Meltzer CC, Adelson PD, Brenner RP, et al. Planned ictal FDG
PET imaging for localization of extratemporal epileptic foci.
Epilepsia. 2000;41:193–200.
13. Stayman A, Abou-Khalil B. FDG-PET in the diagnosis of com-
plex partial status epilepticus originating from the frontal lobe.
Epilepsy Behav. 2011;20:721–4.
14. Siclari F, Prior JO, Rossetti AO. Ictal cerebral positron emission
tomography (PET) in focal status epilepticus. Epilepsy Res.
2013;105:356–61.
15. Chugani HT, Shewmon DA, Khanna S, Phelps ME. Interictal and
postictal focal hypermetabolism on positron emission tomogra-
phy. Pediatr Neurol. 1993;9:10–5.
16. Raichle ME, Gusnard DA. Appraising the brain’s energy budget.
Proc Natl Acad Sci USA. 2002;99:10237–9.
330 Neurocrit Care (2016) 24:324–331
123
17. Franck G, Sadzot B, Salmon E. et al [Study of cerebral meta-
bolism and blood flow in partial complex epilepsy and status
epilepticus in man using positron emission tomography]. Rev
Electroencephalogr Neurophysiol Clin. 1986;16:199–216.
18. Handforth A, Cheng JT, Mandelkern MA, Treiman DM. Mark-
edly increased mesiotemporal lobe metabolism in a case with
PLEDs: further evidence that PLEDs are a manifestation of
partial status epilepticus. Epilepsia. 1994;35:876–81.
19. Kim HY, Kim JY, Kim GU, Han HJ, Shin DI. Alien hand syn-
drome after epilepsia partialis continua: FDG PET and MRI
studies. Epilepsy Behav. 2012;23:71–3.
20. Granov AM, Titutin LA, Schwarz T. Positron emission tomog-
raphy. Berlin: Springer; 2008.
21. Kinahan PE, Fletcher JW. Positron emission tomography-com-
puted tomography standardized uptake values in clinical practice
and assessing response to therapy. Semin Ultrasound CT MR.
2010;31:496–505.
22. Hikima A, Mochizuki H, Oriuchi N, Endo K, Morikawa A.
Semiquantitative analysis of interictal glucose metabolism
between generalized epilepsy and localization related epilepsy.
Ann Nucl Med. 2004;18:579–84.
23. Ng S, Villemagne VL, Berlangieri S, et al. Visual assessment
versus quantitative assessment of 11C-PIB PET and 18F-FDG
PET for detection of Alzheimer’s disease. J Nucl Med.
2007;48:547–52.
24. Chong DJ, Hirsch LJ. Which EEG patterns warrant treatment in
the critically ill? Reviewing the evidence for treatment of peri-
odic epileptiform discharges and related patterns. J Clin
Neurophysiol. 2005;22:79–91.
25. Young GB, Jordan KG, Doig GS. An assessment of nonconvul-
sive seizures in the intensive care unit using continuous EEG
monitoring: an investigation of variables associated with mor-
tality. Neurology. 1996;47:83–9.
26. Newcombe RG. Two-sided confidence intervals for the single
proportion: comparison of seven methods. Stat Med. 1998;17:
857–72.
27. Moses WW. Fundamental limits of spatial resolution in PET.
Nucl Instrum Methods Phys Res A. 2011;648(Supplement 1):
S236–40.
Neurocrit Care (2016) 24:324–331 331
123