Embed Size (px)
Citation preview
National Aeronautics and Space Administration
Meteorology: An Educator’s Resourcefor Inquiry-Based Learning for Grades 5-9
Dr. Joseph D. Exline Dr. Arlene S. Levine Dr. Joel S. Levine www.nasa.gov NP-2006-08-97-LaRC

Meteorology: An Educator’s Resourcefor Inquiry-Based Learning for Grades 5-9
Dr. Joseph D. ExlineDr. Arlene S. LevineDr. Joel S. Levine

ii
Contents
How to Use This Guide ................................................................................................................................. v
Acknowledgements ....................................................................................................................................... vi
Chapter 1: Introduction An Historical Look .................................................................................................................................. 1Equipment and Supplies .......................................................................................................................... 2Development of the Learning Philosophy to Science Education ............................................................... 2Levels of Inquiry in Activities ................................................................................................................. 3
Chapter 2: Weather and Climate The Structure of the Atmosphere ............................................................................................................. 5The Chemical Composition of the Atmosphere ........................................................................................ 6Instruments to Measure Weather ............................................................................................................. 6Solar Radiation, the Greenhouse Effect and the Temperature of the Earth ............................................... 7Solar Heating and Atmospheric Motion ................................................................................................... 8Cyclones and Anticyclones ...................................................................................................................... 8Variations in Surface Atmospheric Pressure ............................................................................................ 9Air Masses and Fronts ............................................................................................................................. 9General Circulation of the Atmosphere .................................................................................................... 10The Water Cycle and Clouds ................................................................................................................... 12
Chapter 3: Surface Color and Effect of Temperature Change.......................................................................... 15
Chapter 4: Angle of Light Rays and Surface Distribution .............................................................................. 19
Chapter 5: Barometer Basics ......................................................................................................................... 23
Chapter 6: Constructing a Barometer ............................................................................................................. 27
Chapter 7: Does Air Have Weight? ............................................................................................................... 31
Chapter 8: Can You Show That the Temperature of Air Has an Effect on Its Weightand Its Direction of Vertical Movement? ................................................................................................. 35
Chapter 9: Are Cold Liquids More Dense Than Warm Liquids? .................................................................... 39
Chapter 10: Does Air Contain Water Vapor? ................................................................................................. 43
Chapter 11: A Sling Psychrometer and Relative Humidity ............................................................................ 47
Meteorology Activities for Grades 5-9 i NP-2006-08-97-LaRC
Chapter 12: How Clouds Form —Understanding the Basic Principles of Precipitation .................................... 51
Chapter 13: Tornado in a Box ......................................................................................................................... 55
Is There a Relationship Between Surface Heating (Temperature)and the Formation of a Low-Pressure System? .......................................................................................... 56
Is There a Relationship Between Surface Heating (Temperature)and the Formation of and Duration of a Low-Pressure System? ................................................................. 59
Is There a Relationship Between Surface Heating (Temperature) and the Duration ofa Low-Pressure System Based Upon Different Amounts of Water? ........................................................... 62
Develop a Testable Question and Design an Investigation That WillProvide Valid Information Regarding Factors That Affect the Formationand Duration of a Model Cloud Using the TIB Apparatus: ........................................................................ 65
Chapter 14: Design Challenge: What Factors Determine the Comfort Level of Air? ........................................ 69
Chapter 15: Bringing More Meaning to Weather Predicting:the Weather Station and “Reading” the Sky Help Put It All Together ........................................................ 71
Chapter 16: Predicting Weather by Connecting the Basic Cloud TypesWith Information Collected from the Weather Station ............................................................................... 77
References ...................................................................................................................................................... 81
Meteorology Activities for Grades 5-9 ii NP-2006-08-97-LaRC
Appendices
I Suggestions for Maximizing the Use of Learner-Designed Activities....................................................85
II Selected Weather Adages .....................................................................................................................89
III The Scientific Habits of Mind and Conceptual Themes Addressed in This Publication .........................91
IV Science and Technology National Science Education Standards Addressed in This Publication............93
V Web Sites for Enhancing the Understanding of Weather.......................................................................95
VI Constructing Equipment ..................................................................................................................... 103How to Build a Flashlight Holder ................................................................................................. 103How to Build a Tornado in a Box ................................................................................................. 105
VII Additional Activities .......................................................................................................................... 107Cloud Wheel................................................................................................................................. 109The Mysterious Snake .................................................................................................................. 113How Often Should I Measure the Weather? .................................................................................. 115
VIII Beaufort Scale of Wind Speed ............................................................................................................ 121
IX The Saffir-Simpson Hurricane Scale................................................................................................... 125
X The Fujita Scale for Tornado Damage ................................................................................................ 129
XI Bookmarks ........................................................................................................................................ 131
About the Authors.......................................................................................................................................... 133
Meteorology Activities for Grades 5-9 iii NP-2006-08-97-LaRC

Meteorology Activities for Grades 5-9 iv NP-2006-08-97-LaRC
How to Use This Guide
Meteorology: An Educator’s Resource for Inquiry-Based Learning for Grades 5-9 is written as a supplement to existing Earth and space science curricula for grades 5-9. The guide may be used in both formal and informal educational settings as well as at home. It should be used in conjunction with lectures, discussions, textbooks and other teaching material. This guide is not intended to be a complete course in meteorology; rather, its function is to assist educators in instilling excitement in learning about meteorology by permitting the learner to take increasing responsibility for his/her learning. The learner should experience “how we arrive at what we know,” rather than memorizing what we know. This publication was developed to enhance the understanding of inquiry-based learning from the educator/teacher’s perspective as well as from the learner’s perspective. Inquiry-based learning has many levels. In general, inexperienced learners and younger learners will require more guidance than more-experienced and older learners who are better equipped to take responsibility for their learning. There are four levels of inquiry defined in this publication, confirmation-verification, structured inquiry, guided inquiry and open inquiry. The levels will be further defined and explained in the introductory chapter.
The guide is structured to include a short review of some principles of meteorology and facts so that they may be readily available to the educator. The Weather and Climate chapter (Chapter 2) is not intended to be used as an all-inclusive textbook, but rather an educator’s guide to some of the phenomena explored in this publication. Many activities offered in this guide build upon each other and use the inquiry in the previous activity to assist in the activity that follows. Thus, this publication enhances the understanding of meteorology by beginning with basic and essential parameters of weather and then moving through mind-engaging interactions with complex meteorological systems. The “Think About This!,” “Probing Further,” and “Examining Results” sections are provided as examples to the educators; they may be used to stimulate the students to organize their thoughts in a particular direction. Educators may use their own creativity in stimulating student inquiry. Further educator information concerning these sections can be found in Appendix I: Suggestions For Maximizing The Use of Learner-Designed Activities.
The learner is encouraged to build and/or test a variety of weather instruments to better understand the basic factors involved in weather phenomena. The weather instruments are then brought together to form a weather station. Collecting weather information combined with existing information about cloud systems allows the learner to apply the knowledge to predict weather systems. Supplementary information and activities, which are not inquiry-based, but deemed useful by the authors, are included in the appendices, including career information Web sites in Appendix V.
An interactive video game, entitled “The Hurricane Hunters,” is the second part of this project. Nightlight Studios and the authors of this guide developed the game, which should be the culminating experience in learning about meteorology as the learner has the opportunity to better understand the dynamics of hurricanes.
Meteorology Activities for Grades 5-9 v NP-2006-08-97-LaRC
Acknowledgements
The authors thank John Pickle for his contribution in Appendix VII: How Often Should I Measure the Weather?; Erik Salna, of Hurricane Warning’s Disaster Survival House, for his contribution to Appendix IX; and Ron Gird and Dennis Cain of the NOAA National Weather Service for their support and contributions to this guide.
We gratefully acknowledge Dr. Tina Cartwright, West Virginia State Climatologist, Marshall University; Bethany Gordel, Gene Pike Middle School, Justin, Texas; and Carol Laird, Long Beach Island Grade School, Ship Bottom, New Jersey, for their reviews and constructive comments on an early draft of this publication, as well as the comments and reviews from the unnamed reviewers for the NASA product reviews; Denise M. Stefula, Science Systems & Applications, NASA Langley Research Center, for technical editing; and Richard E. Davis of the Systems Engineering Directorate, NASA Langley Research Center, for detailed review and refinements incorporated in the final version of this document.
We thank Dr. Lelia Vann, Director of the Science Directorate at NASA Langley Research Center and Dr. Ming-Ying Wei, Program Manager for the Science Mission Directorate, NASA Headquarters, for their continuing support and enthusiasm for this project.
The authors are very grateful to Anne C. Rhodes, NCI Information Systems, NASA Langley Research Center, for outstanding work and meticulous care in the graphical design, editing and general organization of this guide.
Dr. Joseph D. Exline
Dr. Arlene S. Levine*
Dr. Joel S. Levine
* Telephone: 757-864-3318 E-mail: [email protected]
Meteorology Activities for Grades 5-9 vi NP-2006-08-97-LaRC
Chapter 1. Introduction
An Historical Look
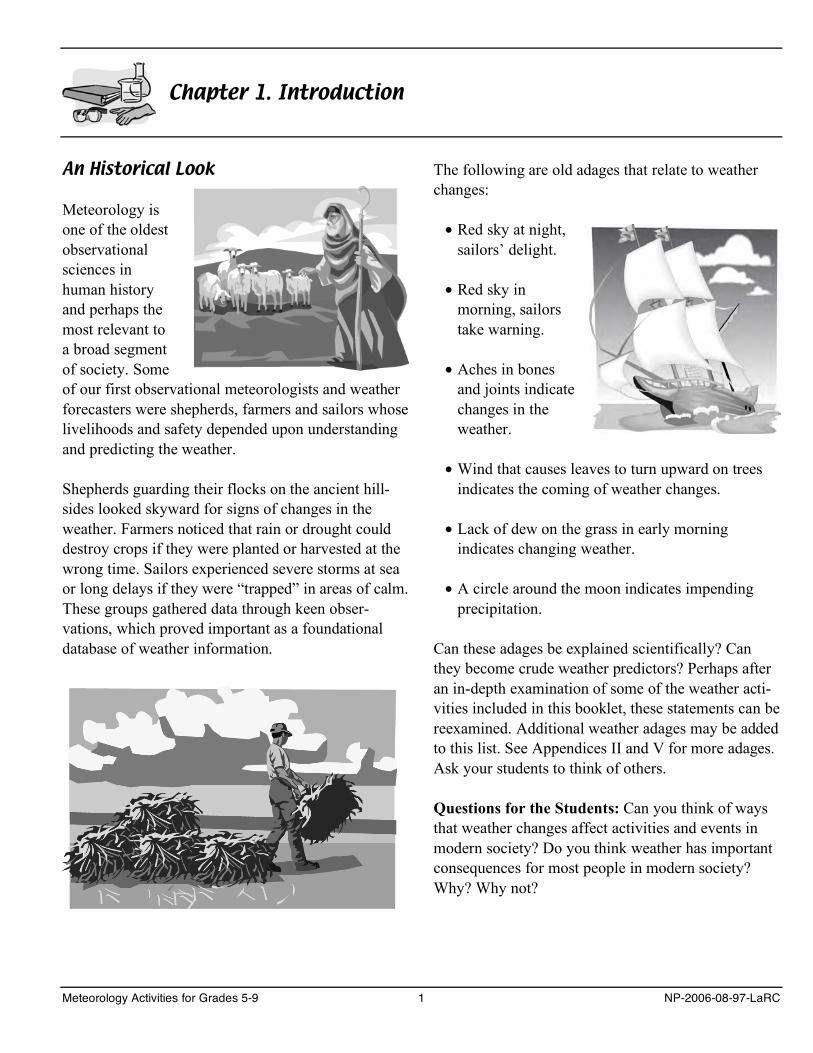
Meteorology is one of the oldest observational sciences in human history and perhaps the most relevant to a broad segment of society. Some of our first observational meteorologists and weather forecasters were shepherds, farmers and sailors whose livelihoods and safety depended upon understanding and predicting the weather.
Shepherds guarding their flocks on the ancient hill-sides looked skyward for signs of changes in the weather. Farmers noticed that rain or drought could destroy crops if they were planted or harvested at the wrong time. Sailors experienced severe storms at sea or long delays if they were “trapped” in areas of calm. These groups gathered data through keen obser-vations, which proved important as a foundational database of weather information.
The following are old adages that relate to weather changes:
•Red sky at night,sailors’ delight.
•Red sky in morning, sailorstake warning.
•Aches in bonesand joints indicatechanges in theweather.
•Wind that causes leaves to turn upward on trees indicates the coming of weather changes.
•Lack of dew on the grass in early morningindicates changing weather.
•A circle around the moon indicates impending precipitation.
Can these adages be explained scientifically? Can they become crude weather predictors? Perhaps after an in-depth examination of some of the weather acti-vities included in this booklet, these statements can be reexamined. Additional weather adages may be added to this list. See Appendices II and V for more adages. Ask your students to think of others.
Questions for the Students: Can you think of ways that weather changes affect activities and events in modern society? Do you think weather has important consequences for most people in modern society? Why? Why not?
Meteorology Activities for Grades 5-9 1 NP-2006-08-97-LaRC
Equipment and Supplies Necessary To Conduct the Activities
We understand that many schools may not have the supplies and equipment necessary to conduct costly meteorology experiments and activities, so this publi-cation focuses on activities using common materials people can find in the home or in local stores. It is im-portant to note that we have included only one way to construct instruments; the educator may have alterna-tive methods, which may work as efficiently and are less costly. The authors make these instrument con-struction suggestions as a starting point for educators. Staff members who work in well-equipped schools may substitute commercially available equipment and supplies. However, there are pedagogical advantages to constructing the equipment. Constructing the equipment may lead to a better understanding of the phenomenon measured and how the equipment works. The “Materials Needed” suggestions are based on the activity; quantities required would depend upon how the students are grouped for conducting activities.
It is extremely important that teachers advise students about safety considerations when conducting science activities. Educators must exert judgment as to the maturity level required for the students to carry out some of the activities independently. As an example, can the students, wearing protective heatproof gloves and safety glasses, handle the boiling water, or should the educator handle the water with the students at a safe distance? The same question applies to the sling psychrometer, Are the students mature enough to sling the psychrometer, or should the educator sling it at a safe distance from the students?
Development of the Learning Philosophy to Science Education
For science education to have meaning for all stu-dents, there should be a strong focus on the essential elements of inquiry learning, which are described in the National Science Education Standards (NSES) and the American Association for the Advancement of Science (AAAS) Benchmarks. Using these docu-ments as a foundation, the Council of State Science Supervisors (CS3), through the CS3/NASA NLIST Initiative, developed an operational definition of Science as Inquiry (www.nlistinquiryscience.com).
The operational definition of science as inquiry pro-mulgated by the CS3/NASA NLIST Initiative con-sists of these essential elements: (1) conceptual con-text for science content; (2) relevant and important science content; (3) information-processing skills; and (4) the scientific habits of mind (approaches). These essential elements should become the focus of material development. They enhance the relevancy and applicability of science knowledge.
•Learning set in a broad context (concepts) can enable deeper understanding and enhance the transfer of knowledge to new and different situ-ations (Appendix III).
•Content then becomes a building block for con-structing and comprehending important concepts.
•Skill development becomes the means forcontinuing the generation of new knowledge.
•Habits of mind (approaches) employed by experts and nurtured in learners can ensure the integrity of the discipline and provide a valid world view from the perspective of science (Appendix III).
These essential elements, brought together holisti-cally in a learning environment, make science both relevant and applicable for all learners. Furthermore, this approach enables the development of skills and approaches needed to continue lifelong learning.
Meteorology Activities for Grades 5-9 2 NP-2006-08-97-LaRC
The skills scientists use and the scientific approach, which are the foundation of generating a body of scientific knowledge, are often overlooked in science education. Science education is still taught and learned as a history lesson —with a focus on “this is what we know.” If educators emphasize “how we know,” students will develop skills and acquire scientific attitudes that yield a valid scientific view of the world and the ability to use these skills as a life-long way of resolving problems. Many activities used to teach science are mindless “hands on” lessons and do not engage a “minds on” response. Capable stu-dents can see the activity outcomes without going through the procedures and are not challenged. Many educators think inquiry learning takes place only through student activities. Teacher demonstrations, classroom discussions, and even lectures can en-courage the development of the essential elements of inquiry if the focus is on “how we come about knowing” rather than on “this is what we know.”
Scientists approach the generation of knowledge differently than the way schools provide learners access to this knowledge. Experts start with obser-vations, pose questions, and at some point frame a context for these questions. Depending upon the discipline, they apply the ground rules or approaches to a particular discipline. Experts make “wrong turns” or reach “dead ends” and often must rework ap-proaches to get resolutions to questions. Using these skills and applying the ground rules of the discipline enables experts to improve the learners’ abilities to resolve problems. With this emphasis on learning, the student develops a more valid view of the scientific process and can better see the world through the lens of a particular discipline.
AN IMPORTANT NOTE: For teachers who need a more traditional correlation with the national stan-dards and benchmarks that put greater emphasis upon content correlation, see Appendix IV. This type of correlation does not negate the important educational approach outlined previously but helps to illustrate that this publication’s approach considers the de-mands on teachers in current classrooms.
Levels of Inquiry in Activities
Just as children move through a series of stages when learning to walk, programs designed for science edu-cation should consider important developmental stages in moving learners toward taking charge of their own learning. The programs should have effec-tive experiences that will enable learners to move from receivers of information to pursuers of know-ledge. Young learners and less-experienced learners need more direction and “hand holding,” but as they mature and increase their abilities, they need more sophisticated challenges. There should be a gradual shift in the help given students as they move to the upper levels of schooling, even during the later stages in a course.
There are four levels of activities that can be classi-fied according to levels of inquiry potential. While any of these inquiry levels can be appropriate for all levels of learners, it is expected that the more-structured learning experiences lie at lower grade levels and the more open-ended and less-structured ones predominate as students approach high school graduation. The following classification is modified from the work of Herron (1971) and his efforts to develop a simple, practical rubric for assessing the degree to which activities promote student inquiry. Based partly on the writings of Schwab (1964), Herron describes four levels of inquiry. The subse-quent classification is a slight modification in look-ing at a teacher-centered approach versus a shift toward a more learner-centered approach.
Meteorology Activities for Grades 5-9 3 NP-2006-08-97-LaRC
Throughout this publication the learner will have the opportunity to experience activities that represent each of the four levels. Furthermore, these activities will be specifically identified as to the predominant inquiry level of the particular activity. This identifi-cation will assist the educator in better understanding inquiry levels and how to select or develop more activities that address these various inquiry levels.
(1) Confirmation-verification. Students confirm or verify a concept through both a prescribed question and procedure; the results are known in advance. The value of this level of activity is in introducing students, who have had very little or no experiencein performing science activities, to the general steps in the design of investigations.
(2) Structured inquiry. Students investigate a teacher-presented testable question through a pre-scribed procedure. The results of the investigation are not known in advance, and students generalize relationships by using the outcomes of the activity. The value of this level of activity is to challenge the learner to examine the data and to come to a valid conclusion based upon these data. It also gives the learner further experience with the concept of a “testable” question and investigative design structure.
(3) Guided inquiry. Students investigate a teacher-presented question using their own procedures forconducting the activity. The value of this level of activity is in challenging learners to design theprocedure that will produce appropriate data to validly resolve the question. Further, the learner has an additional opportunity to learn from the teacher-presented testable question.
(4) Open inquiry. Students investigate a topic-related question that they have formulated. They are respon-sible for defining a manageable question(s), designing procedures to collect, record, and evaluate data, and draw interpretations, inferences, and conclusions. In this level of activity, the student benefits from learn-ing how to design a testable question and also todesign a procedure to generate the data necessary to appropriately resolve the question. The teacher en-sures that the student addresses the concepts being studied by framing a context in a broad nontestablestatement, such as, “Investigate an aspect about whatcauses air movement within Earth’s atmosphere.” It isthen necessary for the learner to carve out a piece orpieces of this statement that can be tested.
NOTE: It should be understood that any of these inquiry levels of activities can provide educationalbenefit. However, it is important to challenge the learner to take more responsibility for his/her learning. After working through these activities with students, the teacher will also have a betterunderstanding of ways to modify these levels of activities to suit the needs of various learners.
Meteorology Activities for Grades 5-9 4 NP-2006-08-97-LaRC
Chapter 2. Weather and Climate
The Structure of the Atmosphere
Surrounding the Earth is a gaseous envelope or atmosphere, held in place by the planet’s gravitational attraction. The Earth’s atmosphere is a complex dynamical, physical, and chemical system. Dyna-mic processes cover a large range of scales from the microscopic-scale dynamics of evaporation, condensation, cloud formation and precipi-tation, to small-scale, localized vertical and horizontal wind motions, to medium-scale cyclones, anticyclones, hurricanes, typhoons, tornadoes, thunderstorms, fronts, etc., to the large-scale general circulation of the atmosphere.
Physical processes in the atmosphere include the transfer of incoming solar radiation through the atmosphere to the surface, the heating of the surface, the emission of outgoing infrared radiation, the absorption of infrared radiation by atmospheric gases, the evaporation of water, the condensation of atmos-pheric water vapor into clouds, and precipitation. Chemical processes include the transformation and production of atmospheric gases, such as atmospheric ozone, via chemical reactions involving many dozens of gases in the atmosphere.
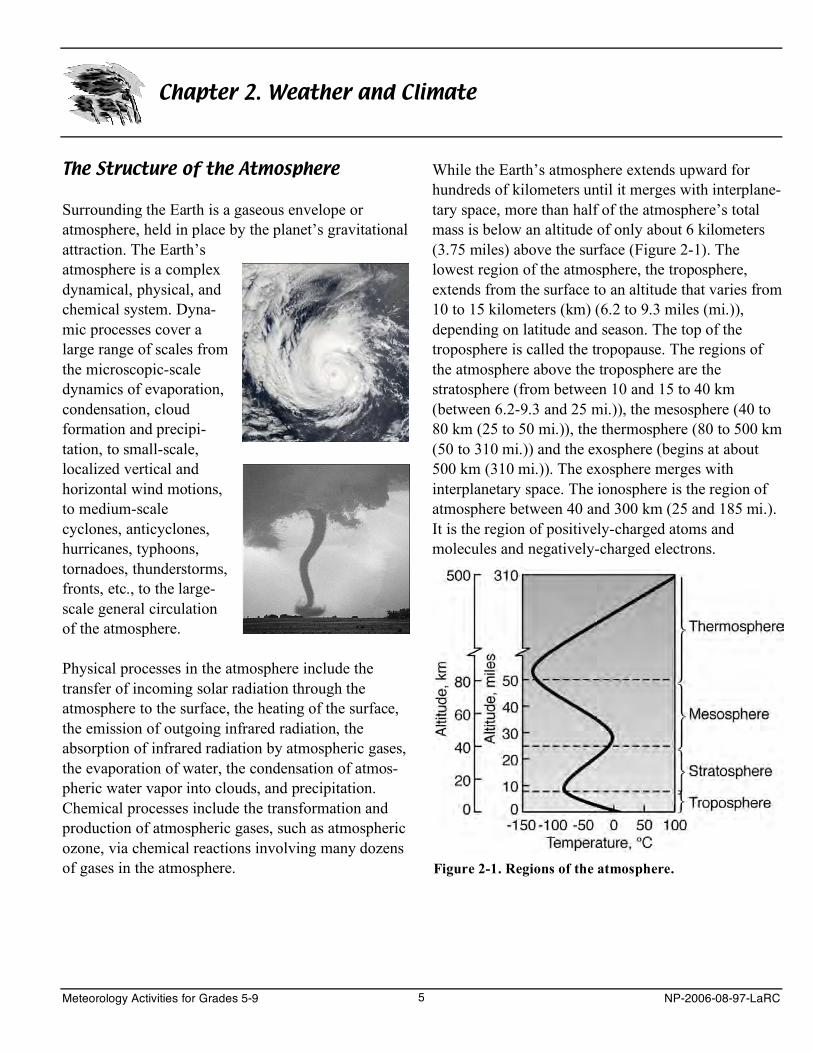
While the Earth’s atmosphere extends upward for hundreds of kilometers until it merges with interplane-tary space, more than half of the atmosphere’s total mass is below an altitude of only about 6 kilometers (3.75 miles) above the surface (Figure 2-1). The lowest region of the atmosphere, the troposphere, extends from the surface to an altitude that varies from 10 to 15 kilometers (km) (6.2 to 9.3 miles (mi.)), depending on latitude and season. The top of the troposphere is called the tropopause. The regions of the atmosphere above the troposphere are the stratosphere (from between 10 and 15 to 40 km (between 6.2-9.3 and 25 mi.)), the mesosphere (40 to 80 km (25 to 50 mi.)), the thermosphere (80 to 500 km (50 to 310 mi.)) and the exosphere (begins at about 500 km (310 mi.)). The exosphere merges with interplanetary space. The ionosphere is the region of atmosphere between 40 and 300 km (25 and 185 mi.). It is the region of positively-charged atoms and molecules and negatively-charged electrons.
Figure 2-1. Regions of the atmosphere.
Meteorology Activities for Grades 5-9 5 NP-2006-08-97-LaRC
The Chemical Composition of the Atmosphere
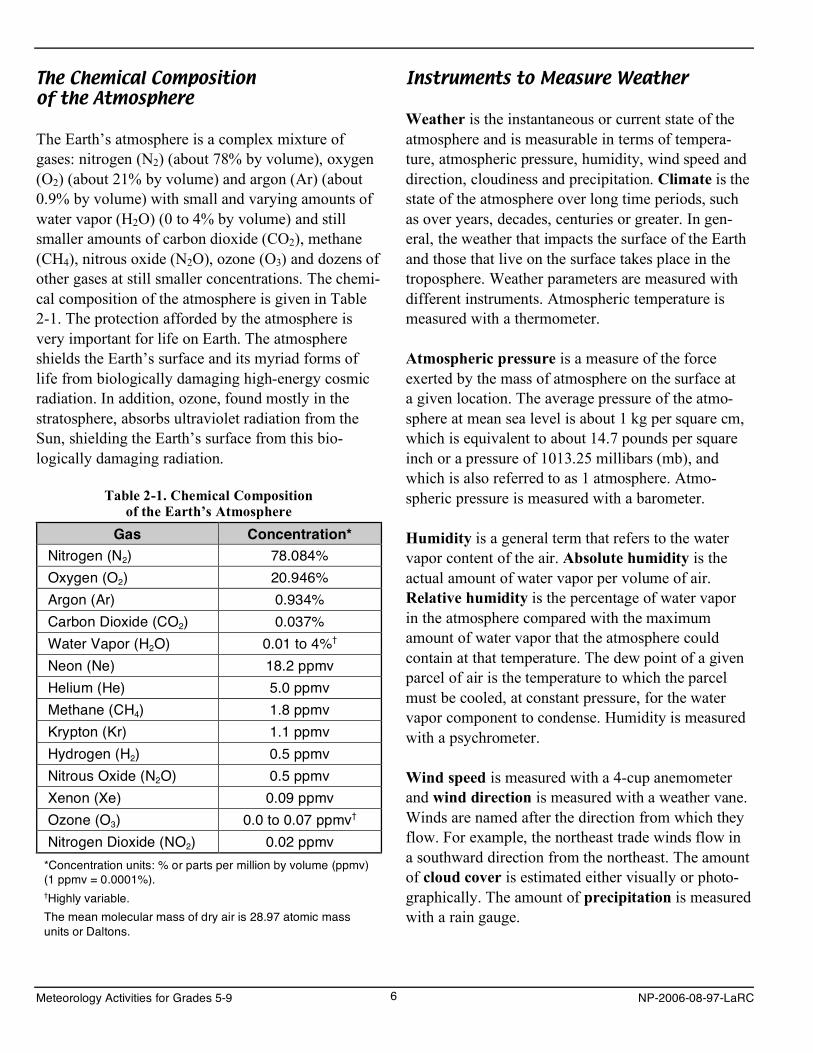
The Earth’s atmosphere is a complex mixture of gases: nitrogen (N2) (about 78% by volume), oxygen (O2) (about 21% by volume) and argon (Ar) (about 0.9% by volume) with small and varying amounts of water vapor (H2O) (0 to 4% by volume) and still smaller amounts of carbon dioxide (CO2), methane (CH4), nitrous oxide (N2O), ozone (O3) and dozens of other gases at still smaller concentrations. The chemi-cal composition of the atmosphere is given in Table 2-1. The protection afforded by the atmosphere is very important for life on Earth. The atmosphere shields the Earth’s surface and its myriad forms of life from biologically damaging high-energy cosmic radiation. In addition, ozone, found mostly in the stratosphere, absorbs ultraviolet radiation from the Sun, shielding the Earth’s surface from this bio-logically damaging radiation.
Table 2-1. Chemical Composition of the Earth’s Atmosphere
Gas Concentration* Nitrogen (N2) 78.084% Oxygen (O2) 20.946% Argon (Ar) 0.934% Carbon Dioxide (CO2) 0.037% Water Vapor (H2O) 0.01 to 4%†
Neon (Ne) 18.2 ppmv Helium (He) 5.0 ppmv Methane (CH4) 1.8 ppmv Krypton (Kr) 1.1 ppmv Hydrogen (H2) 0.5 ppmv Nitrous Oxide (N2O) 0.5 ppmv Xenon (Xe) 0.09 ppmv Ozone (O3) 0.0 to 0.07 ppmv†
Nitrogen Dioxide (NO2) 0.02 ppmv *Concentration units: % or parts per million by volume (ppmv) (1 ppmv = 0.0001%). †Highly variable. The mean molecular mass of dry air is 28.97 atomic mass units or Daltons.
Instruments to Measure Weather
Weather is the instantaneous or current state of the atmosphere and is measurable in terms of tempera-ture, atmospheric pressure, humidity, wind speed and direction, cloudiness and precipitation. Climate is the state of the atmosphere over long time periods, such as over years, decades, centuries or greater. In gen-eral, the weather that impacts the surface of the Earth and those that live on the surface takes place in the troposphere. Weather parameters are measured with different instruments. Atmospheric temperature is measured with a thermometer.
Atmospheric pressure is a measure of the force exerted by the mass of atmosphere on the surface at a given location. The average pressure of the atmo-sphere at mean sea level is about 1 kg per square cm, which is equivalent to about 14.7 pounds per square inch or a pressure of 1013.25 millibars (mb), and which is also referred to as 1 atmosphere. Atmo-spheric pressure is measured with a barometer.
Humidity is a general term that refers to the water vapor content of the air. Absolute humidity is the actual amount of water vapor per volume of air. Relative humidity is the percentage of water vapor in the atmosphere compared with the maximum amount of water vapor that the atmosphere could contain at that temperature. The dew point of a given parcel of air is the temperature to which the parcel must be cooled, at constant pressure, for the water vapor component to condense. Humidity is measured with a psychrometer.
Wind speed is measured with a 4-cup anemometer and wind direction is measured with a weather vane. Winds are named after the direction from which they flow. For example, the northeast trade winds flow in a southward direction from the northeast. The amount of cloud cover is estimated either visually or photo-graphically. The amount of precipitation is measured with a rain gauge.
Meteorology Activities for Grades 5-9 6 NP-2006-08-97-LaRC
Solar Radiation, the Greenhouse Effect and the Temperature of the Earth
To a large extent, the temperature of the Earth’s surface is determined by the amount of radiation received from the Sun. Most of the incoming radiation from the Sun is in the form of visible radiation.
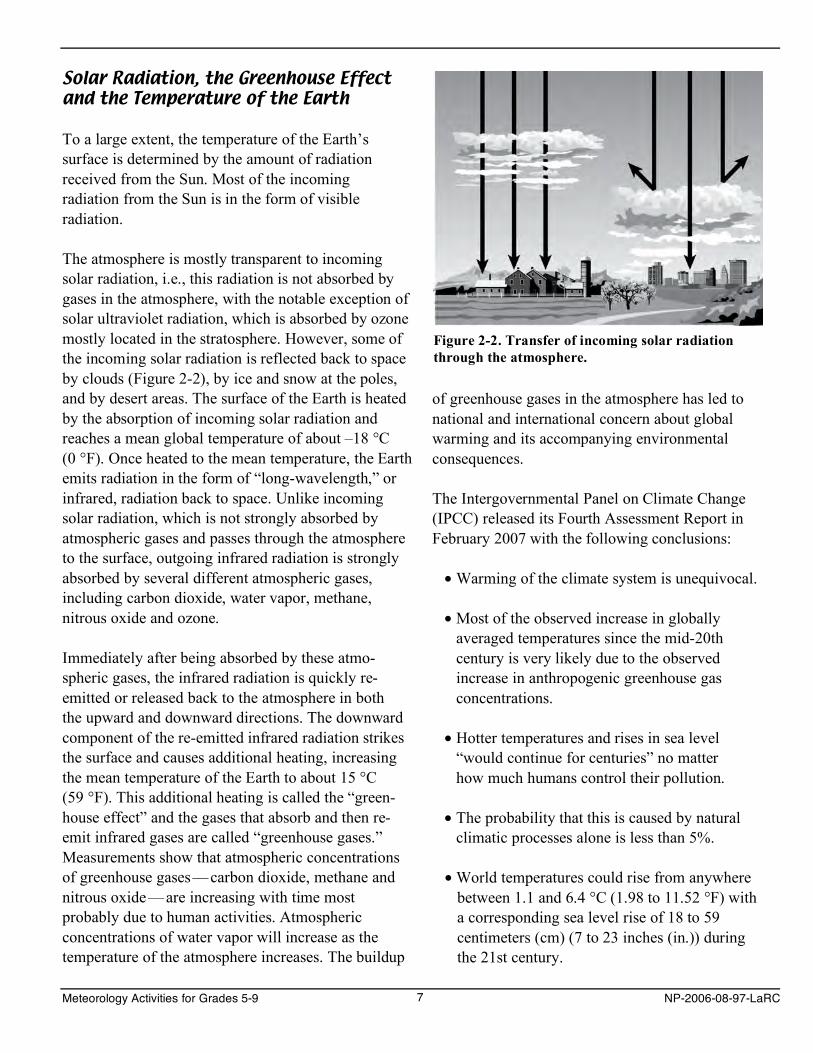
The atmosphere is mostly transparent to incoming solar radiation, i.e., this radiation is not absorbed by gases in the atmosphere, with the notable exception of solar ultraviolet radiation, which is absorbed by ozone mostly located in the stratosphere. However, some of the incoming solar radiation is reflected back to space by clouds (Figure 2-2), by ice and snow at the poles, and by desert areas. The surface of the Earth is heated by the absorption of incoming solar radiation and reaches a mean global temperature of about –18 °C (0 °F). Once heated to the mean temperature, the Earth emits radiation in the form of “long-wavelength,” or infrared, radiation back to space. Unlike incoming solar radiation, which is not strongly absorbed by atmospheric gases and passes through the atmosphere to the surface, outgoing infrared radiation is strongly absorbed by several different atmospheric gases, including carbon dioxide, water vapor, methane, nitrous oxide and ozone.
Immediately after being absorbed by these atmo-spheric gases, the infrared radiation is quickly re-emitted or released back to the atmosphere in both the upward and downward directions. The downward component of the re-emitted infrared radiation strikes the surface and causes additional heating, increasing the mean temperature of the Earth to about 15 °C (59 °F). This additional heating is called the “green-house effect” and the gases that absorb and then re-emit infrared gases are called “greenhouse gases.” Measurements show that atmospheric concentrations of greenhouse gases—carbon dioxide, methane and nitrous oxide —are increasing with time most probably due to human activities. Atmospheric concentrations of water vapor will increase as the temperature of the atmosphere increases. The buildup
Figure 2-2. Transfer of incoming solar radiation through the atmosphere.
of greenhouse gases in the atmosphere has led to national and international concern about global warming and its accompanying environmental consequences.
The Intergovernmental Panel on Climate Change (IPCC) released its Fourth Assessment Report in February 2007 with the following conclusions:
• Warming of the climate system is unequivocal.
• Most of the observed increase in globally averaged temperatures since the mid-20thcentury is very likely due to the observed increase in anthropogenic greenhouse gasconcentrations.
• Hotter temperatures and rises in sea level“would continue for centuries” no matterhow much humans control their pollution.
• The probability that this is caused by natural climatic processes alone is less than 5%.
• World temperatures could rise from anywhere between 1.1 and 6.4 °C (1.98 to 11.52 °F) with a corresponding sea level rise of 18 to 59 centimeters (cm) (7 to 23 inches (in.)) during the 21st century.
Meteorology Activities for Grades 5-9 7 NP-2006-08-97-LaRC
Solar Heating and Atmospheric Motion
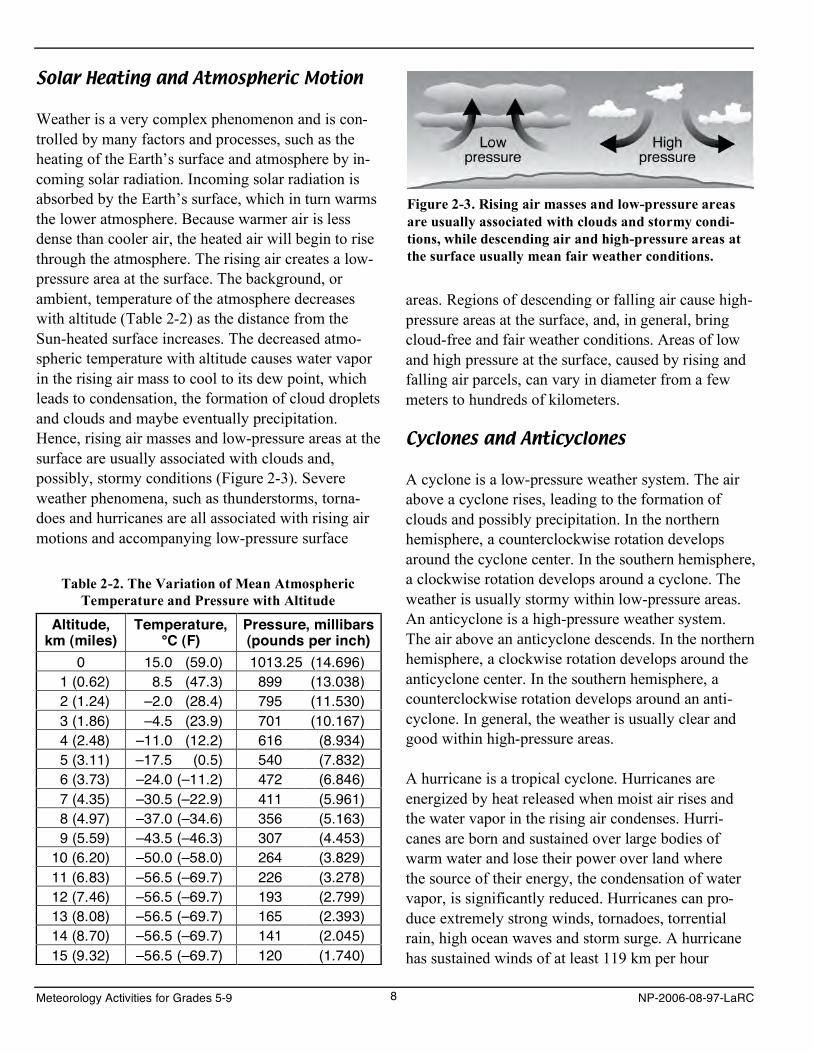
Weather is a very complex phenomenon and is con-trolled by many factors and processes, such as the heating of the Earth’s surface and atmosphere by in-coming solar radiation. Incoming solar radiation is absorbed by the Earth’s surface, which in turn warms the lower atmosphere. Because warmer air is less dense than cooler air, the heated air will begin to rise through the atmosphere. The rising air creates a low-pressure area at the surface. The background, or ambient, temperature of the atmosphere decreases with altitude (Table 2-2) as the distance from the Sun-heated surface increases. The decreased atmo-spheric temperature with altitude causes water vapor in the rising air mass to cool to its dew point, which leads to condensation, the formation of cloud droplets and clouds and maybe eventually precipitation. Hence, rising air masses and low-pressure areas at the surface are usually associated with clouds and, possibly, stormy conditions (Figure 2-3). Severe weather phenomena, such as thunderstorms, torna-does and hurricanes are all associated with rising air motions and accompanying low-pressure surface
Table 2-2. The Variation of Mean AtmosphericTemperature and Pressure with Altitude
Altitude, Temperature, Pressure, millibarskm (miles) (pounds per inch) °C (F)
0 15.0 (59.0) 1013.25 (14.696) 1 (0.62) 8.5 (47.3) 899 (13.038) 2 (1.24) –2.0 (28.4) 795 (11.530) 3 (1.86) –4.5 (23.9) 701 (10.167) 4 (2.48) –11.0 (12.2) 616 (8.934) 5 (3.11) –17.5 (0.5) 540 (7.832) 6 (3.73) –24.0 (–11.2) 472 (6.846) 7 (4.35) –30.5 (–22.9) 411 (5.961) 8 (4.97) –37.0 (–34.6) 356 (5.163) 9 (5.59) –43.5 (–46.3) 307 (4.453)
10 (6.20) –50.0 (–58.0) 264 (3.829) 11 (6.83) –56.5 (–69.7) 226 (3.278) 12 (7.46) –56.5 (–69.7) 193 (2.799) 13 (8.08) –56.5 (–69.7) 165 (2.393) 14 (8.70) –56.5 (–69.7) 141 (2.045) 15 (9.32) –56.5 (–69.7) 120 (1.740)
Figure 2-3. Rising air masses and low-pressure areas are usually associated with clouds and stormy condi-tions, while descending air and high-pressure areas at the surface usually mean fair weather conditions.
areas. Regions of descending or falling air cause high-pressure areas at the surface, and, in general, bring cloud-free and fair weather conditions. Areas of low and high pressure at the surface, caused by rising and falling air parcels, can vary in diameter from a few meters to hundreds of kilometers.
Cyclones and Anticyclones
A cyclone is a low-pressure weather system. The air above a cyclone rises, leading to the formation of clouds and possibly precipitation. In the northern hemisphere, a counterclockwise rotation develops around the cyclone center. In the southern hemisphere, a clockwise rotation develops around a cyclone. The weather is usually stormy within low-pressure areas. An anticyclone is a high-pressure weather system. The air above an anticyclone descends. In the northern hemisphere, a clockwise rotation develops around the anticyclone center. In the southern hemisphere, a counterclockwise rotation develops around an anti-cyclone. In general, the weather is usually clear and good within high-pressure areas.
A hurricane is a tropical cyclone. Hurricanes are energized by heat released when moist air rises and the water vapor in the rising air condenses. Hurri-canes are born and sustained over large bodies of warm water and lose their power over land where the source of their energy, the condensation of water vapor, is significantly reduced. Hurricanes can pro-duce extremely strong winds, tornadoes, torrential rain, high ocean waves and storm surge. A hurricane has sustained winds of at least 119 km per hour
Meteorology Activities for Grades 5-9 8 NP-2006-08-97-LaRC
(74 miles per hour). A hurricane is a very energetic phenomenon with energy release estimated to be the equivalent of exploding a 10-megaton nuclear bomb every 20 minutes or about 200 times the worldwide electrical generating capacity per day. Although hurricanes are large weather systems generating enormous energy, their movements over the Earth’s surface are controlled by large-scale atmospheric winds. Recently, it has been suggested that both the numbers and intensity or energy of hurricanes will increase as a consequence of global warming.
Variations in Surface Atmospheric Pressure
The mean sea level atmospheric pressure is about 1013.25 millibars (mb) or 14.7 pounds per square inch (psi). A moderate cyclone has a surface pressure
of about 995 mb. A very strong cyclone has a surface pressure of about 975 mb. Hurricane Camille in 1969 had a surface pressure of 908 mb. The lowest re-corded sea level pressure was 870 mb associated with a Pacific typhoon on October 12, 1979. A moderate anticyclone has a surface pressure of about 1030 mb. A very strong anticyclone has a surface pressure of about 1050 mb. The highest recorded sea level pres-sure was 1084 mb over Agata, Siberia, on December 31, 1968. The decrease of atmospheric pressure with altitude is shown in Table 2-2.
Air Masses and Fronts
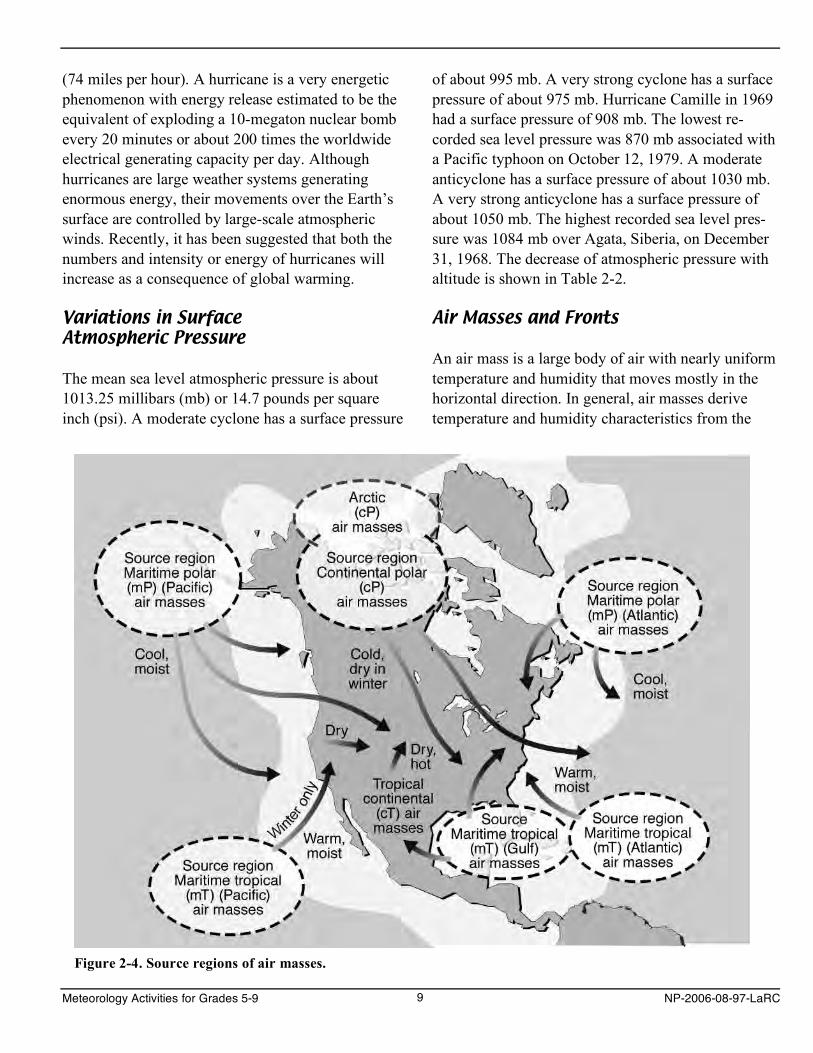
An air mass is a large body of air with nearly uniform temperature and humidity that moves mostly in the horizontal direction. In general, air masses derive temperature and humidity characteristics from the
Figure 2-4. Source regions of air masses.
Meteorology Activities for Grades 5-9 9 NP-2006-08-97-LaRC
regions in which they originate, which are called the air mass source regions (Figure 2-4). Typically, air masses are classified first according to temperature: polar (from between 50° and 65° latitude), tropical (from 20° to 35° latitude) and equatorial (from over the oceans near the equator). Polar (P) air masses are cold; tropical (T) air masses are warm. Then, air masses are classified either moist or dry depending upon whether the source region is land or water. Maritime (m) air masses form over the oceans and are relatively moist; continental (c) air masses form over land and are relatively dry. A maritime tropical air mass is designated as mT, while a continental polar air mass is designated cP. Fronts are the boundaries between two different interacting air masses. A cold front occurs when a cooler air mass moves in on a warmer air mass. A warm front occurs when a warm-er air mass moves over a cooler air mass. A stationary front is a front that exhibits little or no movement.
General Circulation of the Atmosphere
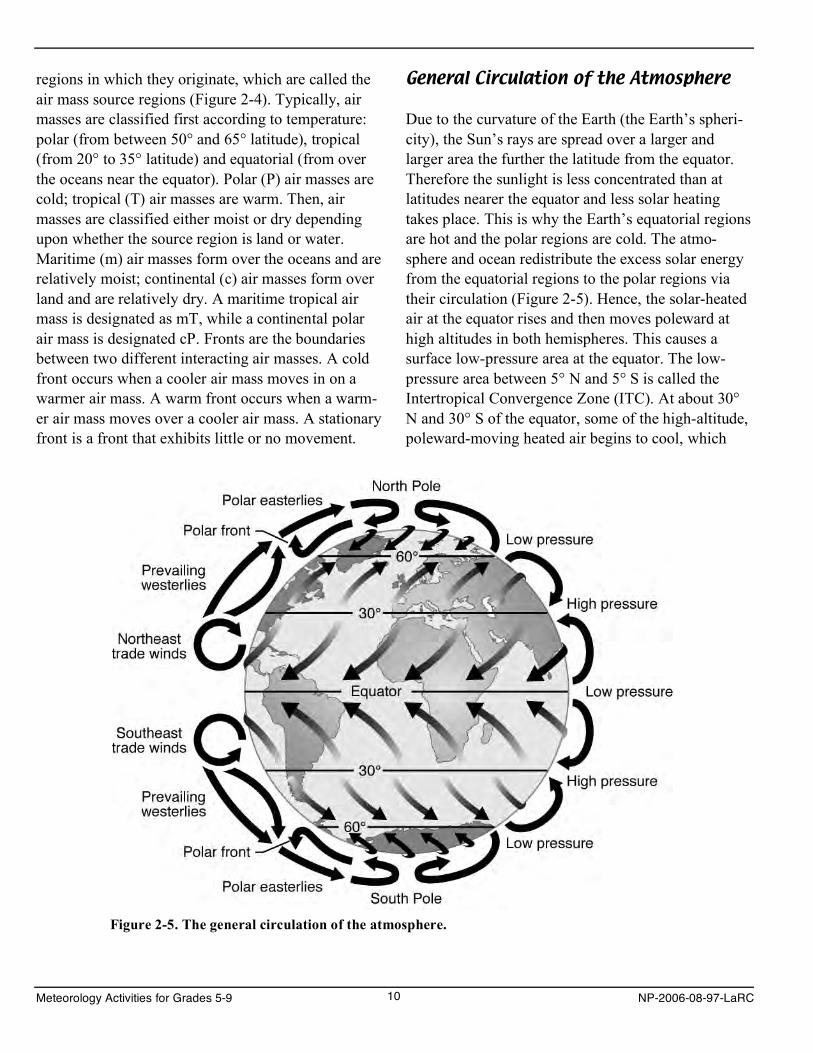
Due to the curvature of the Earth (the Earth’s spheri-city), the Sun’s rays are spread over a larger and larger area the further the latitude from the equator. Therefore the sunlight is less concentrated than at latitudes nearer the equator and less solar heating takes place. This is why the Earth’s equatorial regions are hot and the polar regions are cold. The atmo-sphere and ocean redistribute the excess solar energy from the equatorial regions to the polar regions via their circulation (Figure 2-5). Hence, the solar-heated air at the equator rises and then moves poleward at high altitudes in both hemispheres. This causes a surface low-pressure area at the equator. The low-pressure area between 5° N and 5° S is called the Intertropical Convergence Zone (ITC). At about 30° N and 30° S of the equator, some of the high-altitude, poleward-moving heated air begins to cool, which
Figure 2-5. The general circulation of the atmosphere.
Meteorology Activities for Grades 5-9 10 NP-2006-08-97-LaRC
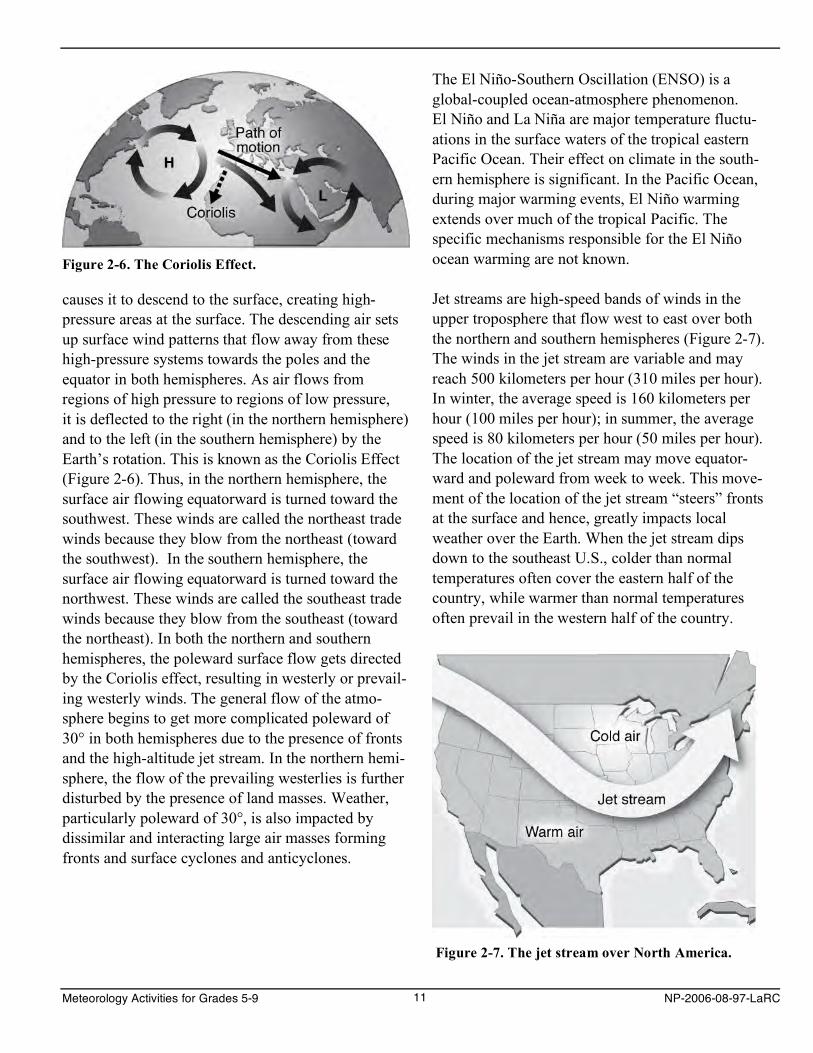
Figure 2-6. The Coriolis Effect.
causes it to descend to the surface, creating high-pressure areas at the surface. The descending air sets up surface wind patterns that flow away from these high-pressure systems towards the poles and the equator in both hemispheres. As air flows from regions of high pressure to regions of low pressure, it is deflected to the right (in the northern hemisphere) and to the left (in the southern hemisphere) by the Earth’s rotation. This is known as the Coriolis Effect (Figure 2-6). Thus, in the northern hemisphere, the surface air flowing equatorward is turned toward the southwest. These winds are called the northeast trade winds because they blow from the northeast (toward the southwest). In the southern hemisphere, the surface air flowing equatorward is turned toward the northwest. These winds are called the southeast trade winds because they blow from the southeast (toward the northeast). In both the northern and southern hemispheres, the poleward surface flow gets directed by the Coriolis effect, resulting in westerly or prevail-ing westerly winds. The general flow of the atmo-sphere begins to get more complicated poleward of 30° in both hemispheres due to the presence of fronts and the high-altitude jet stream. In the northern hemi-sphere, the flow of the prevailing westerlies is further disturbed by the presence of land masses. Weather, particularly poleward of 30°, is also impacted by dissimilar and interacting large air masses forming fronts and surface cyclones and anticyclones.
The El Niño-Southern Oscillation (ENSO) is a global-coupled ocean-atmosphere phenomenon. El Niño and La Niña are major temperature fluctu-ations in the surface waters of the tropical eastern Pacific Ocean. Their effect on climate in the south-ern hemisphere is significant. In the Pacific Ocean, during major warming events, El Niño warming extends over much of the tropical Pacific. The specific mechanisms responsible for the El Niño ocean warming are not known.
Jet streams are high-speed bands of winds in the upper troposphere that flow west to east over both the northern and southern hemispheres (Figure 2-7). The winds in the jet stream are variable and may reach 500 kilometers per hour (310 miles per hour). In winter, the average speed is 160 kilometers per hour (100 miles per hour); in summer, the average speed is 80 kilometers per hour (50 miles per hour). The location of the jet stream may move equator-ward and poleward from week to week. This move-ment of the location of the jet stream “steers” fronts at the surface and hence, greatly impacts local weather over the Earth. When the jet stream dips down to the southeast U.S., colder than normal temperatures often cover the eastern half of the country, while warmer than normal temperatures often prevail in the western half of the country.
Figure 2-7. The jet stream over North America.
Meteorology Activities for Grades 5-9 11 NP-2006-08-97-LaRC
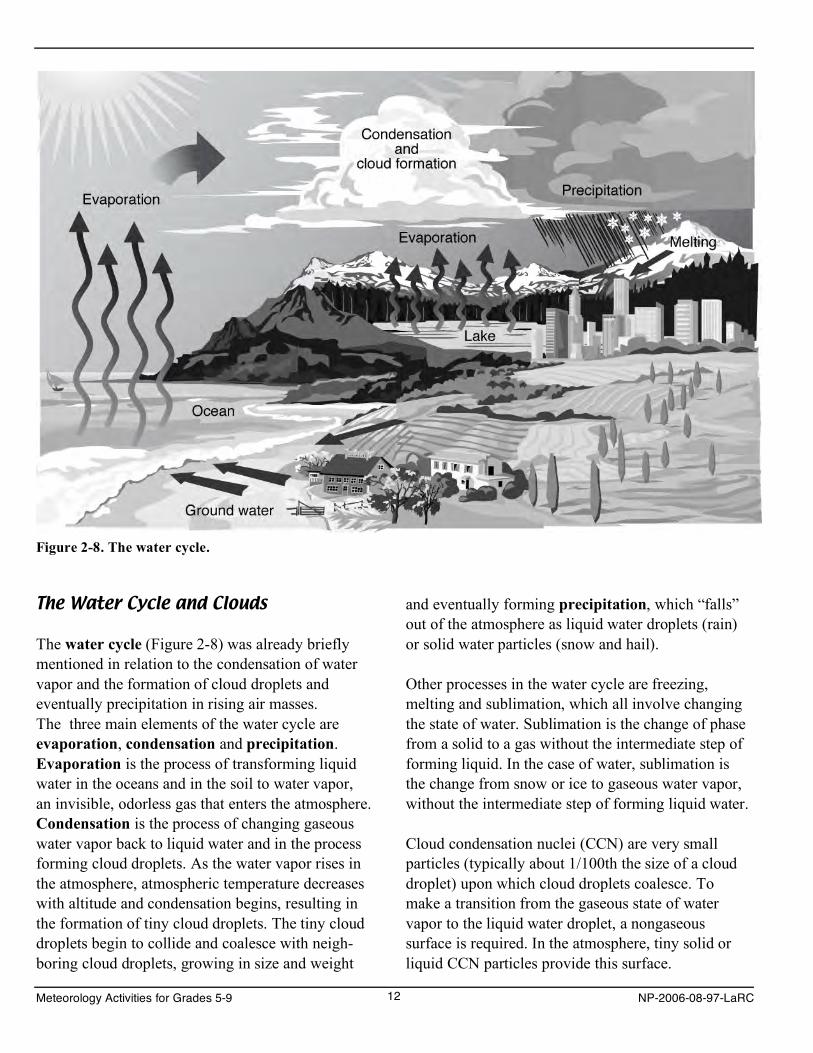
Figure 2-8. The water cycle.
The Water Cycle and Clouds
The water cycle (Figure 2-8) was already briefly mentioned in relation to the condensation of water vapor and the formation of cloud droplets and eventually precipitation in rising air masses. The three main elements of the water cycle are evaporation, condensation and precipitation. Evaporation is the process of transforming liquid water in the oceans and in the soil to water vapor, an invisible, odorless gas that enters the atmosphere. Condensation is the process of changing gaseous water vapor back to liquid water and in the process forming cloud droplets. As the water vapor rises in the atmosphere, atmospheric temperature decreases with altitude and condensation begins, resulting in the formation of tiny cloud droplets. The tiny cloud droplets begin to collide and coalesce with neigh-boring cloud droplets, growing in size and weight
and eventually forming precipitation, which “falls” out of the atmosphere as liquid water droplets (rain) or solid water particles (snow and hail).
Other processes in the water cycle are freezing, melting and sublimation, which all involve changing the state of water. Sublimation is the change of phase from a solid to a gas without the intermediate step of forming liquid. In the case of water, sublimation is the change from snow or ice to gaseous water vapor, without the intermediate step of forming liquid water.
Cloud condensation nuclei (CCN) are very small particles (typically about 1/100th the size of a cloud droplet) upon which cloud droplets coalesce. To make a transition from the gaseous state of water vapor to the liquid water droplet, a nongaseous surface is required. In the atmosphere, tiny solid or liquid CCN particles provide this surface.
Meteorology Activities for Grades 5-9 12 NP-2006-08-97-LaRC
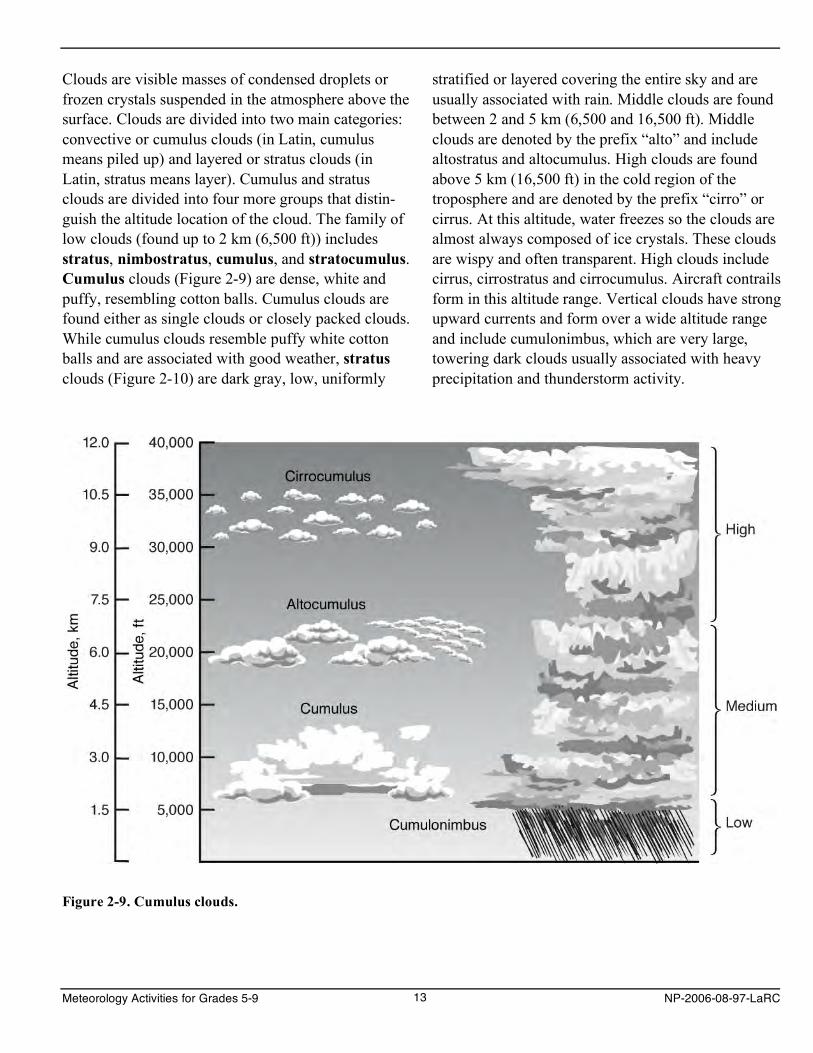
Clouds are visible masses of condensed droplets or frozen crystals suspended in the atmosphere above the surface. Clouds are divided into two main categories: convective or cumulus clouds (in Latin, cumulus means piled up) and layered or stratus clouds (in Latin, stratus means layer). Cumulus and stratus clouds are divided into four more groups that distin-guish the altitude location of the cloud. The family of low clouds (found up to 2 km (6,500 ft)) includes stratus, nimbostratus, cumulus, and stratocumulus. Cumulus clouds (Figure 2-9) are dense, white and puffy, resembling cotton balls. Cumulus clouds are found either as single clouds or closely packed clouds. While cumulus clouds resemble puffy white cotton balls and are associated with good weather, stratus clouds (Figure 2-10) are dark gray, low, uniformly
stratified or layered covering the entire sky and are usually associated with rain. Middle clouds are found between 2 and 5 km (6,500 and 16,500 ft). Middle clouds are denoted by the prefix “alto” and include altostratus and altocumulus. High clouds are found above 5 km (16,500 ft) in the cold region of the troposphere and are denoted by the prefix “cirro” or cirrus. At this altitude, water freezes so the clouds are almost always composed of ice crystals. These clouds are wispy and often transparent. High clouds include cirrus, cirrostratus and cirrocumulus. Aircraft contrails form in this altitude range. Vertical clouds have strong upward currents and form over a wide altitude range and include cumulonimbus, which are very large, towering dark clouds usually associated with heavy precipitation and thunderstorm activity.
Figure 2-9. Cumulus clouds.
Meteorology Activities for Grades 5-9 13 NP-2006-08-97-LaRC
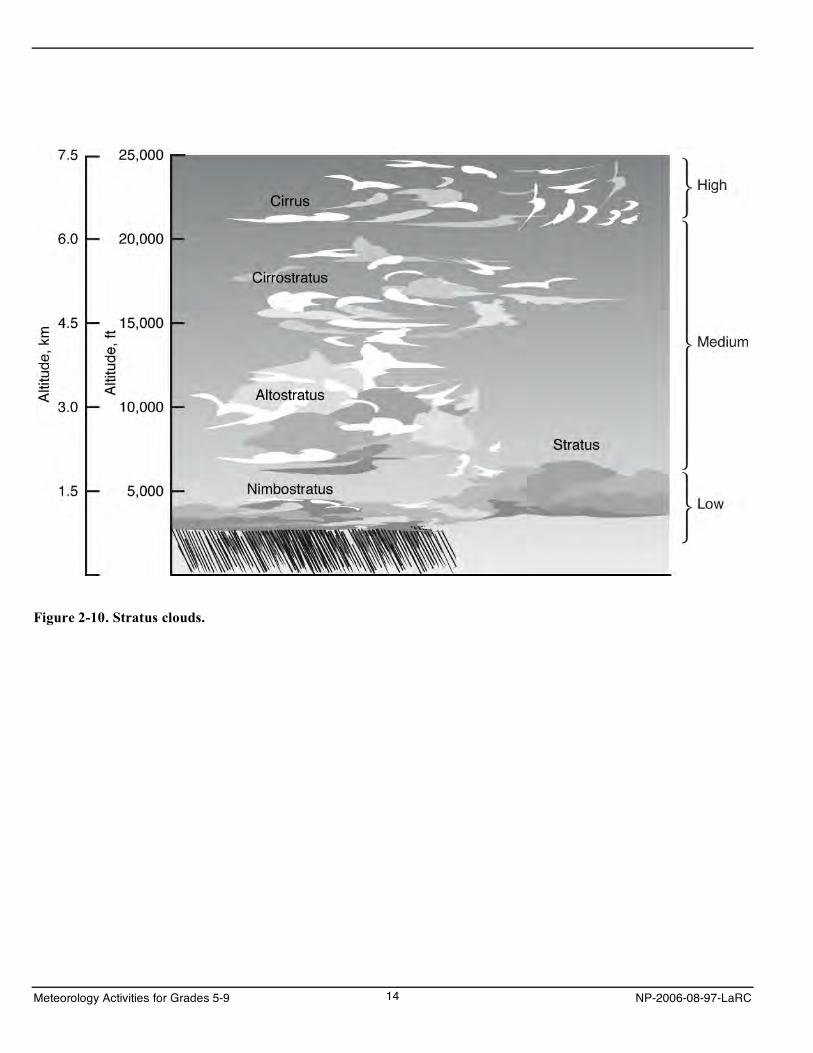
Figure 2-10. Stratus clouds.
Meteorology Activities for Grades 5-9 14 NP-2006-08-97-LaRC
Chapter 3. Surface Color and Effect on Temperature Change: A Confirmation-Verification Activity
Think About This!
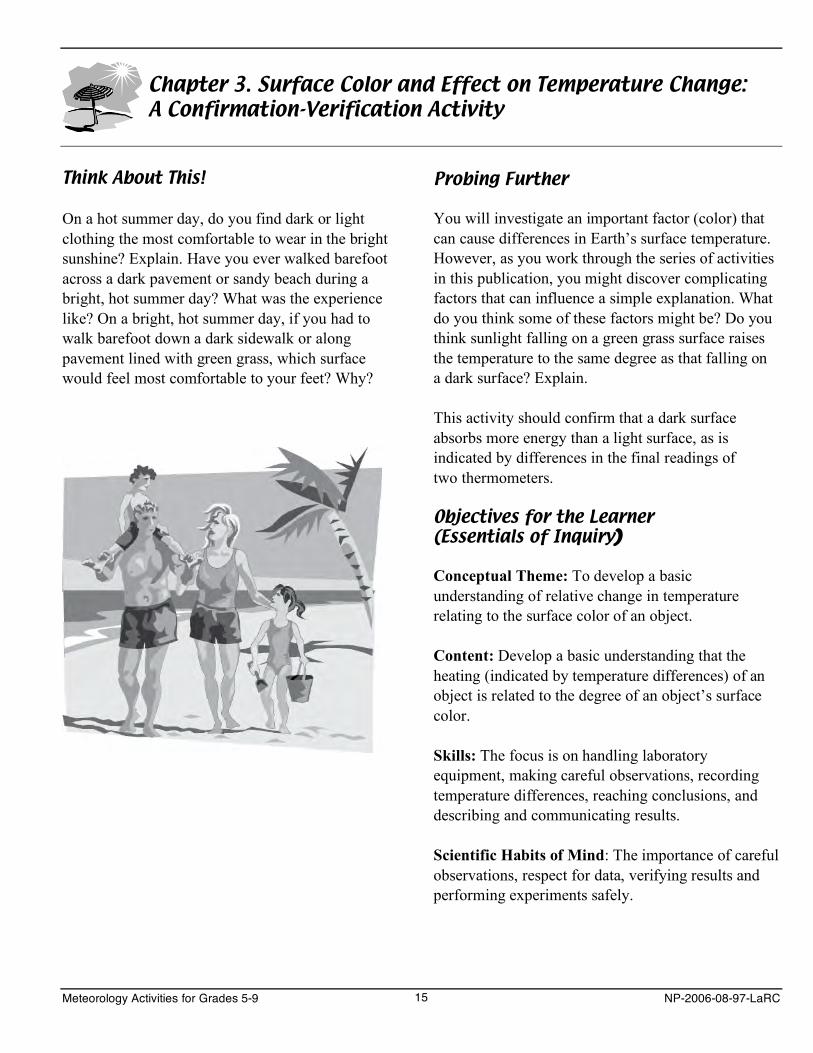
On a hot summer day, do you find dark or light clothing the most comfortable to wear in the bright sunshine? Explain. Have you ever walked barefoot across a dark pavement or sandy beach during a bright, hot summer day? What was the experience like? On a bright, hot summer day, if you had to walk barefoot down a dark sidewalk or along pavement lined with green grass, which surface would feel most comfortable to your feet? Why?
Probing Further
You will investigate an important factor (color) that can cause differences in Earth’s surface temperature. However, as you work through the series of activities in this publication, you might discover complicating factors that can influence a simple explanation. What do you think some of these factors might be? Do you think sunlight falling on a green grass surface raises the temperature to the same degree as that falling on a dark surface? Explain.
This activity should confirm that a dark surface absorbs more energy than a light surface, as is indicated by differences in the final readings of two thermometers.
Objectives for the Learner (Essentials of Inquiry)
Conceptual Theme: To develop a basic understanding of relative change in temperature relating to the surface color of an object.
Content: Develop a basic understanding that the heating (indicated by temperature differences) of an object is related to the degree of an object’s surface color.
Skills: The focus is on handling laboratory equipment, making careful observations, recording temperature differences, reaching conclusions, and describing and communicating results.
Scientific Habits of Mind: The importance of careful observations, respect for data, verifying results and performing experiments safely.
Meteorology Activities for Grades 5-9 15 NP-2006-08-97-LaRC
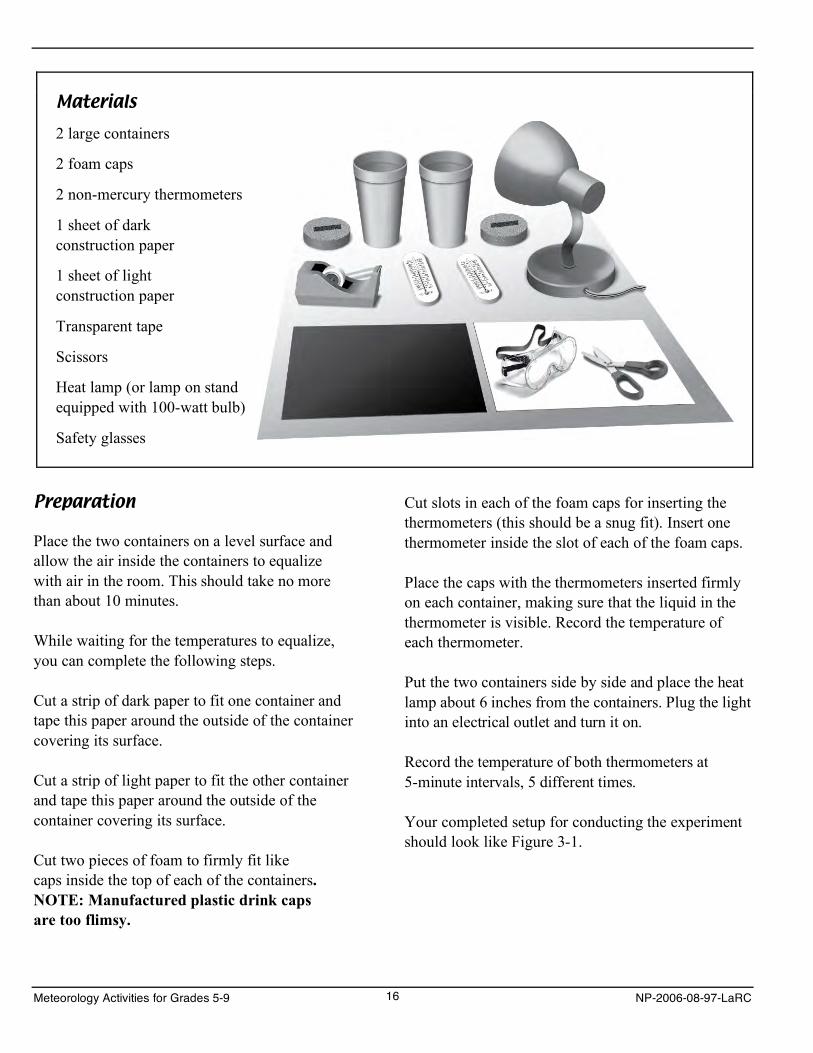
Materials
2 large containers
2 foam caps
2 non-mercury thermometers
1 sheet of dark construction paper
1 sheet of light construction paper
Transparent tape
Scissors
Heat lamp (or lamp on stand equipped with 100-watt bulb)
Safety glasses
Preparation
Place the two containers on a level surface and allow the air inside the containers to equalize with air in the room. This should take no more than about 10 minutes.
While waiting for the temperatures to equalize, you can complete the following steps.
Cut a strip of dark paper to fit one container and tape this paper around the outside of the container covering its surface.
Cut a strip of light paper to fit the other container and tape this paper around the outside of the container covering its surface.
Cut two pieces of foam to firmly fit like caps inside the top of each of the containers. NOTE: Manufactured plastic drink caps are too flimsy.
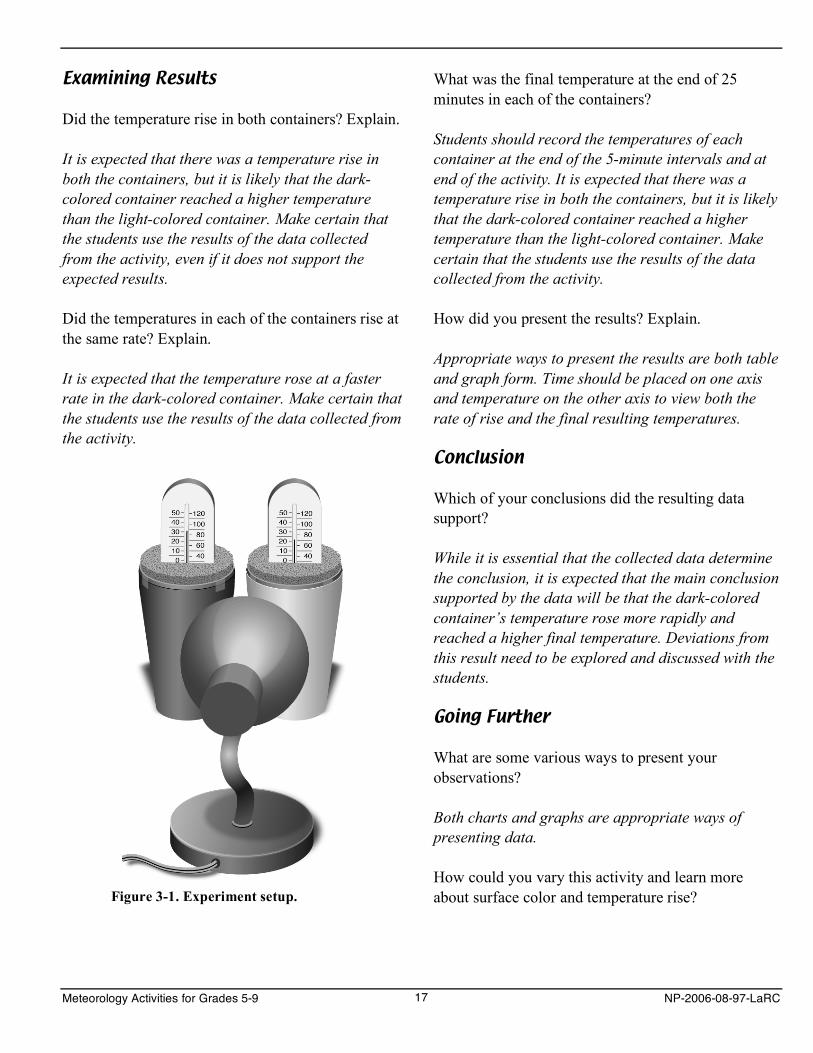
Cut slots in each of the foam caps for inserting the thermometers (this should be a snug fit). Insert one thermometer inside the slot of each of the foam caps.
Place the caps with the thermometers inserted firmly on each container, making sure that the liquid in the thermometer is visible. Record the temperature of each thermometer.
Put the two containers side by side and place the heat lamp about 6 inches from the containers. Plug the light into an electrical outlet and turn it on.
Record the temperature of both thermometers at 5-minute intervals, 5 different times.
Your completed setup for conducting the experiment should look like Figure 3-1.
Meteorology Activities for Grades 5-9 16 NP-2006-08-97-LaRC
Examining Results
Did the temperature rise in both containers? Explain.
It is expected that there was a temperature rise in both the containers, but it is likely that the dark-colored container reached a higher temperature than the light-colored container. Make certain that the students use the results of the data collected from the activity, even if it does not support the expected results.
Did the temperatures in each of the containers rise at the same rate? Explain.
It is expected that the temperature rose at a faster rate in the dark-colored container. Make certain that the students use the results of the data collected from the activity.
Figure 3-1. Experiment setup.
What was the final temperature at the end of 25 minutes in each of the containers?
Students should record the temperatures of each container at the end of the 5-minute intervals and at end of the activity. It is expected that there was a temperature rise in both the containers, but it is likely that the dark-colored container reached a higher temperature than the light-colored container. Make certain that the students use the results of the data collected from the activity.
How did you present the results? Explain.
Appropriate ways to present the results are both table and graph form. Time should be placed on one axis and temperature on the other axis to view both the rate of rise and the final resulting temperatures.
Conclusion
Which of your conclusions did the resulting data support?
While it is essential that the collected data determine the conclusion, it is expected that the main conclusion supported by the data will be that the dark-colored container’s temperature rose more rapidly and reached a higher final temperature. Deviations from this result need to be explored and discussed with the students.
Going Further
What are some various ways to present your observations?
Both charts and graphs are appropriate ways of presenting data.
How could you vary this activity and learn more about surface color and temperature rise?
Meteorology Activities for Grades 5-9 17 NP-2006-08-97-LaRC
There are a number of comparisons that could be made regarding temperature change; some examples are:
a. Repeat the activity several times.
b. Conduct the activity comparing other colors.
c. Add materials such as sand to the containerand check for temperature changes.
d. Fill like-colored containers with differentmaterials, such as sand and water, and examine the results.
Challenge
Try designing an activity to verify that materials of the same surface color but varying composition affect the absorption of energy.
Background for the Teacher
This confirmation-verification activity should simply show that light and dark surfaces (made of the same material) show a difference in increase of tempera-ture over a 25-minute period, with the dark-colored container reaching the highest temperature reading. Dark surfaces become warmer because they absorb more of the incident radiation. Light-colored surfaces reflect more of the incident radiation, hence absorb-ing less radiation. The higher the absorption, the warmer the temperature.
This concept is very important for students, who will eventually better understand that temperature differ-ences, as influenced by the different surface colors of the Earth, result in important changes in the move-ment of air. It is an extremely important “building block” to this eventual understanding and application to other situations. As an example, place two pieces of construction paper, one white and one black, on top of snow or boxes filled with ice. Aim a heat source of equal intensity and distance at both the white and black pieces of construction paper. Observe the results.
The data will likely show that the dark surface reached a higher temperature and at a faster rate. This result should form the basis of the learner’s conclusion. Graphing the information is a good way to determine the rate of rise in both containers. You should ensure that the generated data support the conclusion and thus reinforce an important scientific habit —“respect for data.”
Both “Going Further” and “Challenge” can be addressed by having the learner compare the temperature increases in containers with various characteristics and contents. Encourage the students to be innovative in their designs.
Meteorology Activities for Grades 5-9 18 NP-2006-08-97-LaRC
Chapter 4. Angle of Light Rays and Surface Distribution: A Structured-Inquiry Activity
Think About This!
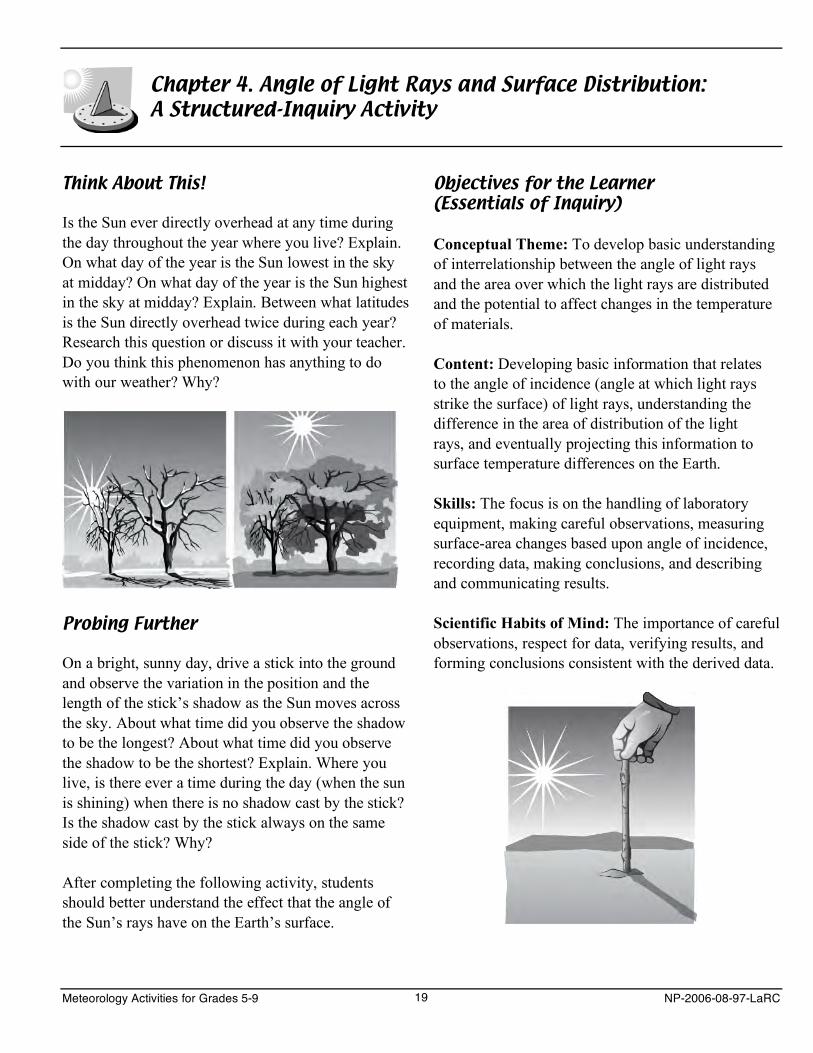
Is the Sun ever directly overhead at any time during the day throughout the year where you live? Explain. On what day of the year is the Sun lowest in the sky at midday? On what day of the year is the Sun highest in the sky at midday? Explain. Between what latitudes is the Sun directly overhead twice during each year? Research this question or discuss it with your teacher. Do you think this phenomenon has anything to do with our weather? Why?
Probing Further
On a bright, sunny day, drive a stick into the ground and observe the variation in the position and the length of the stick’s shadow as the Sun moves across the sky. About what time did you observe the shadow to be the longest? About what time did you observe the shadow to be the shortest? Explain. Where you live, is there ever a time during the day (when the sun is shining) when there is no shadow cast by the stick? Is the shadow cast by the stick always on the same side of the stick? Why?
After completing the following activity, students should better understand the effect that the angle of the Sun’s rays have on the Earth’s surface.
Objectives for the Learner (Essentials of Inquiry)
Conceptual Theme: To develop basic understanding of interrelationship between the angle of light rays and the area over which the light rays are distributed and the potential to affect changes in the temperature of materials.
Content: Developing basic information that relates to the angle of incidence (angle at which light rays strike the surface) of light rays, understanding the difference in the area of distribution of the light rays, and eventually projecting this information to surface temperature differences on the Earth.
Skills: The focus is on the handling of laboratory equipment, making careful observations, measuring surface-area changes based upon angle of incidence, recording data, making conclusions, and describing and communicating results.
Scientific Habits of Mind: The importance of careful observations, respect for data, verifying results, and forming conclusions consistent with the derived data.
Meteorology Activities for Grades 5-9 19 NP-2006-08-97-LaRC
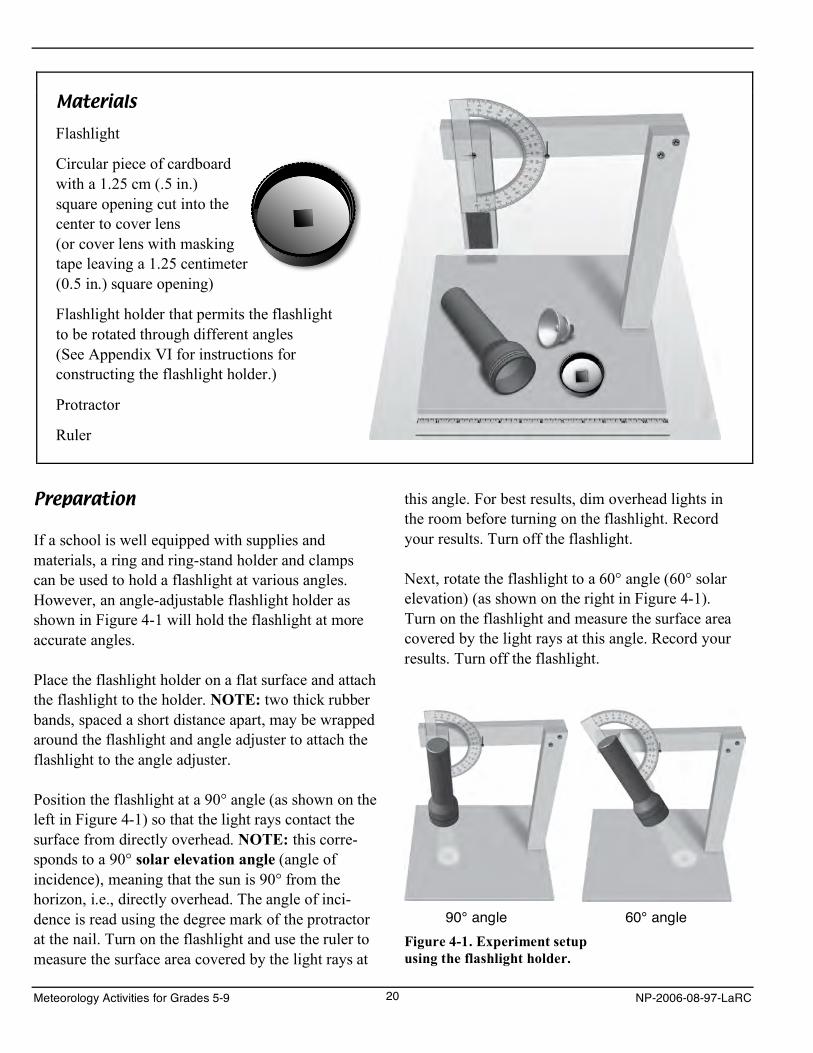
Materials
Flashlight
Circular piece of cardboard with a 1.25 cm (.5 in.) square opening cut into the center to cover lens (or cover lens with masking tape leaving a 1.25 centimeter (0.5 in.) square opening)
Flashlight holder that permits the flashlight to be rotated through different angles (See Appendix VI for instructions for constructing the flashlight holder.)
Protractor
Ruler
Preparation
If a school is well equipped with supplies and materials, a ring and ring-stand holder and clamps can be used to hold a flashlight at various angles. However, an angle-adjustable flashlight holder as shown in Figure 4-1 will hold the flashlight at more accurate angles.
Place the flashlight holder on a flat surface and attach the flashlight to the holder. NOTE: two thick rubber bands, spaced a short distance apart, may be wrapped around the flashlight and angle adjuster to attach the flashlight to the angle adjuster.
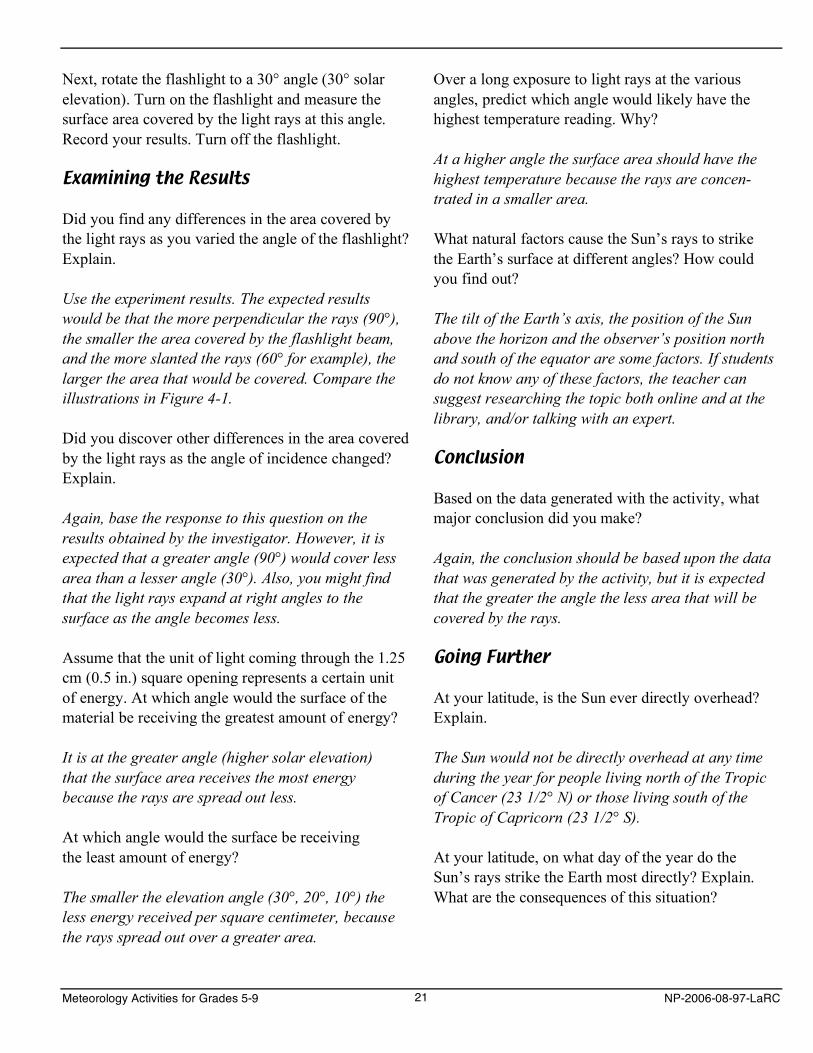
Position the flashlight at a 90° angle (as shown on the left in Figure 4-1) so that the light rays contact the surface from directly overhead. NOTE: this corre-sponds to a 90° solar elevation angle (angle of incidence), meaning that the sun is 90° from the horizon, i.e., directly overhead. The angle of inci-dence is read using the degree mark of the protractor at the nail. Turn on the flashlight and use the ruler to measure the surface area covered by the light rays at
this angle. For best results, dim overhead lights in the room before turning on the flashlight. Record your results. Turn off the flashlight.
Next, rotate the flashlight to a 60° angle (60° solar elevation) (as shown on the right in Figure 4-1). Turn on the flashlight and measure the surface area covered by the light rays at this angle. Record your results. Turn off the flashlight.
90° angle 60° angle Figure 4-1. Experiment setup using the flashlight holder.
Meteorology Activities for Grades 5-9 20 NP-2006-08-97-LaRC
Next, rotate the flashlight to a 30° angle (30° solar elevation). Turn on the flashlight and measure the surface area covered by the light rays at this angle. Record your results. Turn off the flashlight.
Examining the Results
Did you find any differences in the area covered by the light rays as you varied the angle of the flashlight? Explain.
Use the experiment results. The expected results would be that the more perpendicular the rays (90°), the smaller the area covered by the flashlight beam, and the more slanted the rays (60° for example), the larger the area that would be covered. Compare the illustrations in Figure 4-1.
Did you discover other differences in the area covered by the light rays as the angle of incidence changed? Explain.
Again, base the response to this question on the results obtained by the investigator. However, it is expected that a greater angle (90°) would cover less area than a lesser angle (30°). Also, you might find that the light rays expand at right angles to the surface as the angle becomes less.
Assume that the unit of light coming through the 1.25 cm (0.5 in.) square opening represents a certain unit of energy. At which angle would the surface of the material be receiving the greatest amount of energy?
It is at the greater angle (higher solar elevation) that the surface area receives the most energy because the rays are spread out less.
At which angle would the surface be receiving the least amount of energy?
The smaller the elevation angle (30°, 20°, 10°) the less energy received per square centimeter, because the rays spread out over a greater area.
Over a long exposure to light rays at the various angles, predict which angle would likely have the highest temperature reading. Why?
At a higher angle the surface area should have the highest temperature because the rays are concen-trated in a smaller area.
What natural factors cause the Sun’s rays to strike the Earth’s surface at different angles? How could you find out?
The tilt of the Earth’s axis, the position of the Sun above the horizon and the observer’s position north and south of the equator are some factors. If students do not know any of these factors, the teacher can suggest researching the topic both online and at the library, and/or talking with an expert.
Conclusion
Based on the data generated with the activity, what major conclusion did you make?
Again, the conclusion should be based upon the data that was generated by the activity, but it is expected that the greater the angle the less area that will be covered by the rays.
Going Further
At your latitude, is the Sun ever directly overhead? Explain.
The Sun would not be directly overhead at any time during the year for people living north of the Tropic of Cancer (23 1/2° N) or those living south of the Tropic of Capricorn (23 1/2° S).
At your latitude, on what day of the year do the Sun’s rays strike the Earth most directly? Explain. What are the consequences of this situation?
Meteorology Activities for Grades 5-9 21 NP-2006-08-97-LaRC
North of the Tropic of Cancer and south of the Tropic of Capricorn, the first day of summer is the time of year that the Sun’s rays strike most directly. This factor results in greater heating of these regions at opposite times of the year.
Challenge
How could you verify that slanted rays heat a surface differently than direct rays?
Background for the Teacher
If the Sun is directly overhead (the angle of incidence of the Sun’s rays to the surface is 90°), the shadow is of minimum size, and the sunlight is concentrated into a small area, the maximum amount of heating takes place, and higher temperatures result. If the Sun is lower in the sky (e.g., 30° angle of incidence), the shadow length increases, sunlight is less concen-trated; hence, less heating takes place, and a smaller increase in temperature occurs.
If students vary the angle several times and measure the surface area covered at each angle, they can show this relationship graphically. They can measure and sketch the differences and show the results.
At your latitude, is the Sun ever directly overhead? Explain. On what day of the year is the Sun lowest in the sky at midday?
In the Think About This! section there are several concepts to discuss. The 23° tilt of Earth’s axis pro-duces interesting results and can become complicated. Most students in the United States are found well north of the Tropic of Cancer and well south of the Arctic Circle (66°34' N), so most of the complicating factors associated with these zones can be ignored.
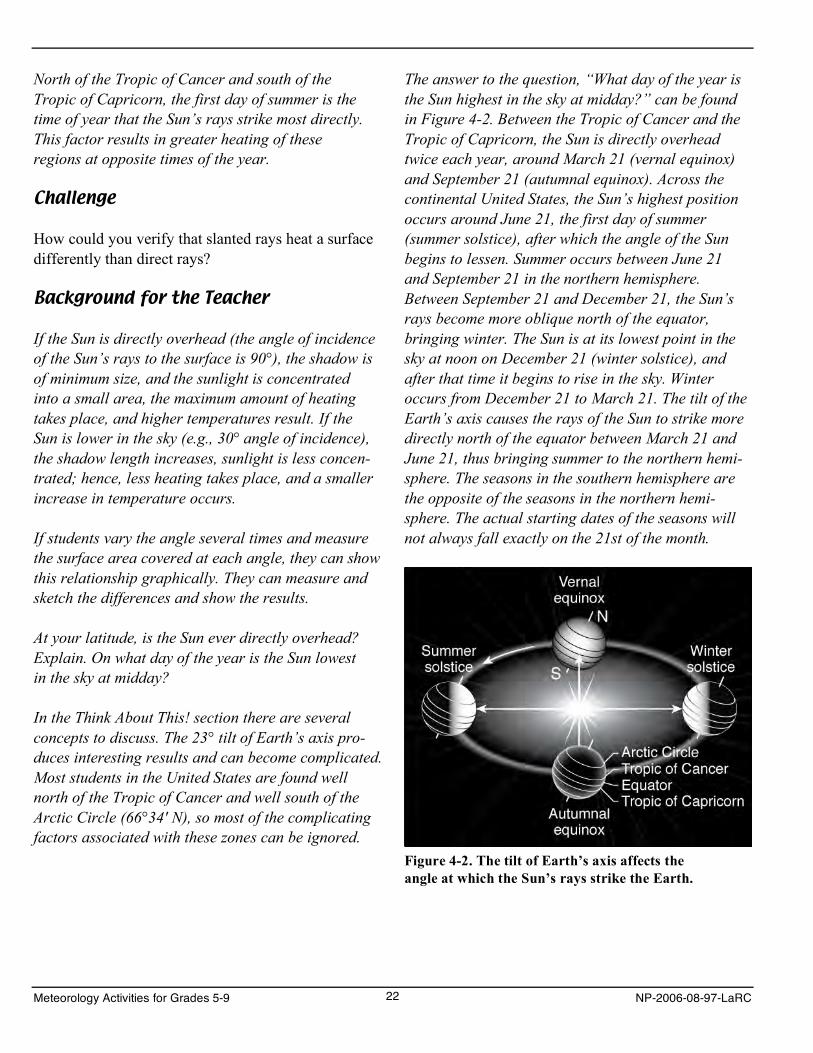
The answer to the question, “What day of the year is the Sun highest in the sky at midday?” can be found in Figure 4-2. Between the Tropic of Cancer and the Tropic of Capricorn, the Sun is directly overhead twice each year, around March 21 (vernal equinox) and September 21 (autumnal equinox). Across the continental United States, the Sun’s highest position occurs around June 21, the first day of summer (summer solstice), after which the angle of the Sun begins to lessen. Summer occurs between June 21 and September 21 in the northern hemisphere. Between September 21 and December 21, the Sun’s rays become more oblique north of the equator, bringing winter. The Sun is at its lowest point in the sky at noon on December 21 (winter solstice), and after that time it begins to rise in the sky. Winter occurs from December 21 to March 21. The tilt of the Earth’s axis causes the rays of the Sun to strike more directly north of the equator between March 21 and June 21, thus bringing summer to the northern hemi-sphere. The seasons in the southern hemisphere are the opposite of the seasons in the northern hemi-sphere. The actual starting dates of the seasons will not always fall exactly on the 21st of the month.
Figure 4-2. The tilt of Earth’s axis affects the angle at which the Sun’s rays strike the Earth.
Meteorology Activities for Grades 5-9 22 NP-2006-08-97-LaRC
Chapter 5. Barometer Basics:A Structured-Inquiry Activity
Think About This!
Have you ever gone up a hill or mountain in a car or flown in an airplane and had your ears “plug up” or ache? Why do you think it happens?
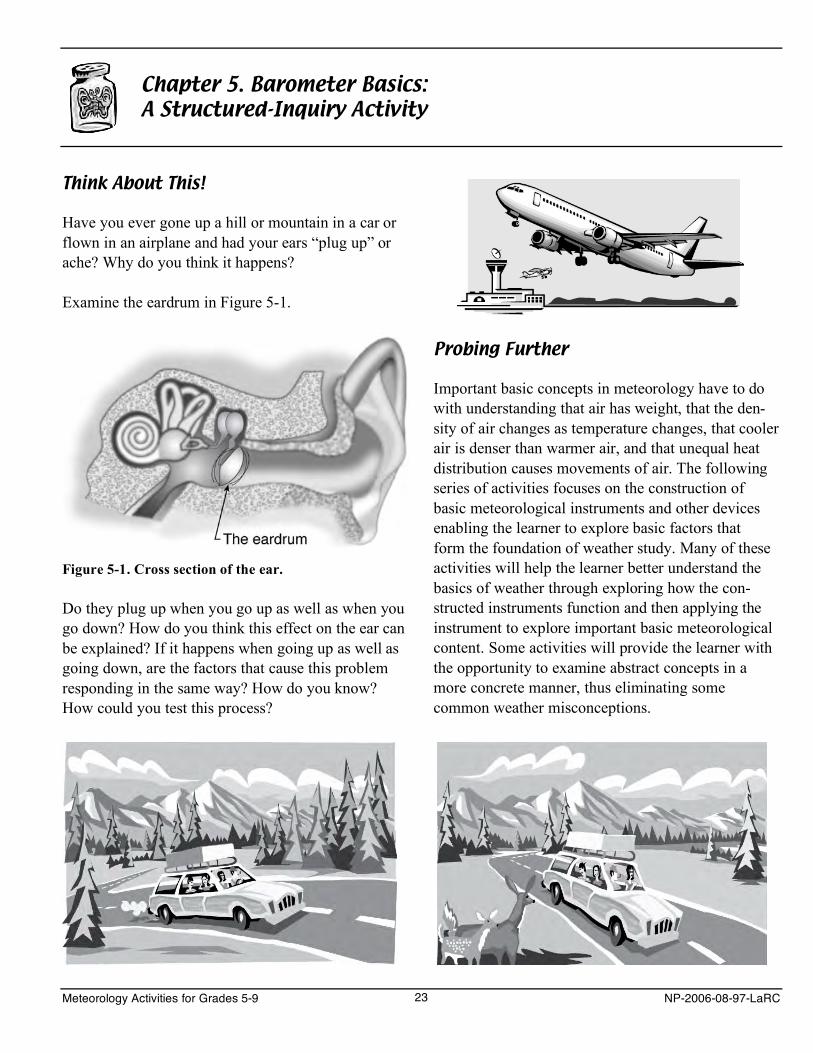
Examine the eardrum in Figure 5-1.
Figure 5-1. Cross section of the ear.
Do they plug up when you go up as well as when you go down? How do you think this effect on the ear can be explained? If it happens when going up as well as going down, are the factors that cause this problem responding in the same way? How do you know? How could you test this process?
Probing Further
Important basic concepts in meteorology have to do with understanding that air has weight, that the den-sity of air changes as temperature changes, that cooler air is denser than warmer air, and that unequal heat distribution causes movements of air. The following series of activities focuses on the construction of basic meteorological instruments and other devices enabling the learner to explore basic factors that form the foundation of weather study. Many of these activities will help the learner better understand the basics of weather through exploring how the con-structed instruments function and then applying the instrument to explore important basic meteorological content. Some activities will provide the learner with the opportunity to examine abstract concepts in a more concrete manner, thus eliminating some common weather misconceptions.
Meteorology Activities for Grades 5-9 23 NP-2006-08-97-LaRC
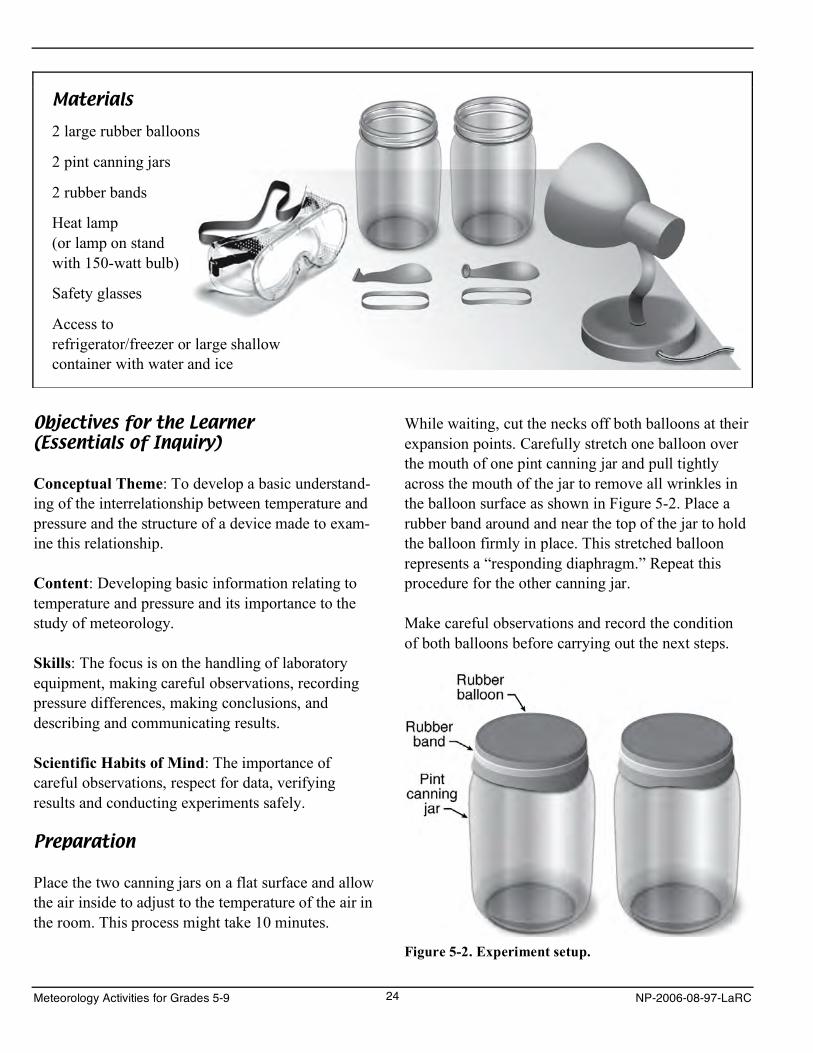
Materials
2 large rubber balloons
2 pint canning jars
2 rubber bands
Heat lamp (or lamp on stand with 150-watt bulb)
Safety glasses
Access to refrigerator/freezer or large shallow container with water and ice
Objectives for the Learner (Essentials of Inquiry)
Conceptual Theme: To develop a basic understand-ing of the interrelationship between temperature and pressure and the structure of a device made to exam-ine this relationship.
Content: Developing basic information relating to temperature and pressure and its importance to the study of meteorology.
Skills: The focus is on the handling of laboratory equipment, making careful observations, recording pressure differences, making conclusions, and describing and communicating results.
Scientific Habits of Mind: The importance of careful observations, respect for data, verifying results and conducting experiments safely.
Preparation
Place the two canning jars on a flat surface and allow the air inside to adjust to the temperature of the air in the room. This process might take 10 minutes.
While waiting, cut the necks off both balloons at their expansion points. Carefully stretch one balloon over the mouth of one pint canning jar and pull tightly across the mouth of the jar to remove all wrinkles in the balloon surface as shown in Figure 5-2. Place a rubber band around and near the top of the jar to hold the balloon firmly in place. This stretched balloon represents a “responding diaphragm.” Repeat this procedure for the other canning jar.
Make careful observations and record the condition of both balloons before carrying out the next steps.
Figure 5-2. Experiment setup.
Meteorology Activities for Grades 5-9 24 NP-2006-08-97-LaRC
Place one of the prepared jars into a freezer or place it in a shallow container with ice cubes and water. The water level should be about 2 inches from the bottom of the container. Place the other jar near a light source (a heat lamp or lamp with 100-watt bulb). Allow the jars to remain in these two environments for at least 15 minutes.
Examining Results
After 15 minutes, remove the two jars from the environments and place them together on a firm, flat surface side by side.
Observe the appearance of the balloons and jars and record what you see.
How do the two jars differ in appearance?
Did you discover anything about the relationship between temperature and pressure through this activity? If so, what did you discover?
From this activity did you develop any more infor-mation about temperature? If so, describe what type of information. What do you still need to know?
Can you relate the changes in the balloons on the canning jars to what might take place inside your ear as you go up and down a mountain or take off and land in an airplane?
Conclusion
How do you account for the changes you observe?
Background for the Teacher
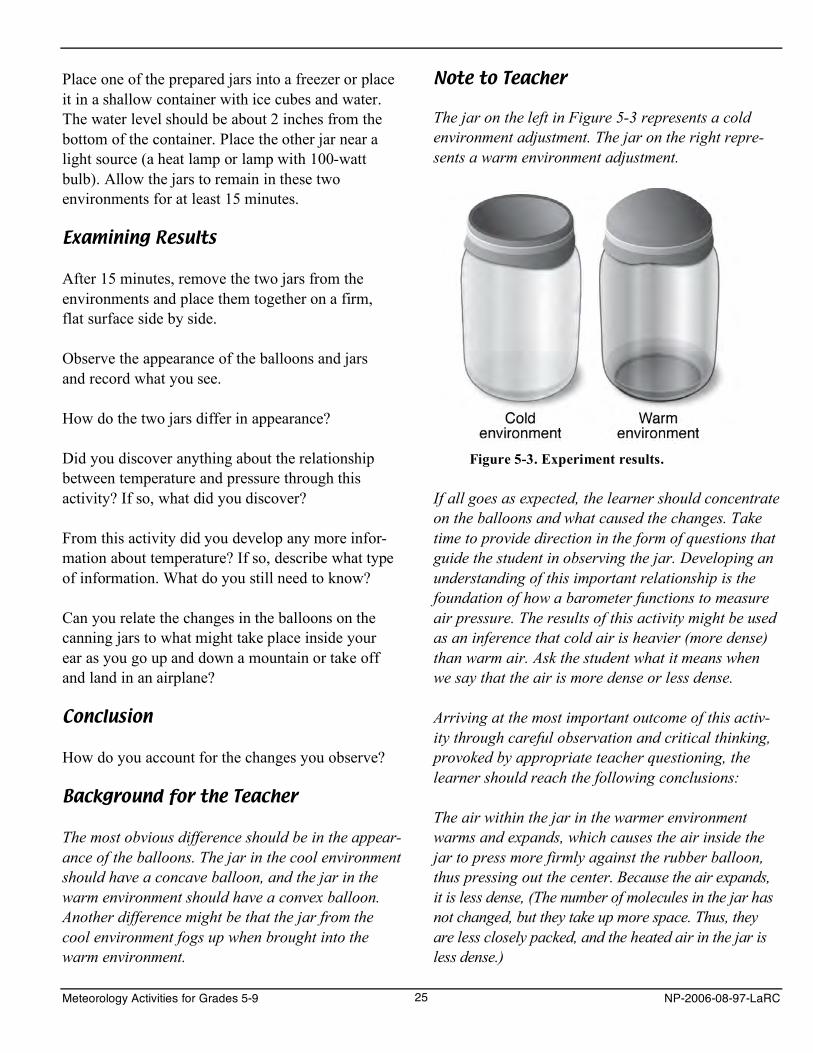
The most obvious difference should be in the appear-ance of the balloons. The jar in the cool environment should have a concave balloon, and the jar in the warm environment should have a convex balloon. Another difference might be that the jar from the cool environment fogs up when brought into the warm environment.
Note to Teacher
The jar on the left in Figure 5-3 represents a cold environment adjustment. The jar on the right repre-sents a warm environment adjustment.
Figure 5-3. Experiment results.
If all goes as expected, the learner should concentrate on the balloons and what caused the changes. Take time to provide direction in the form of questions that guide the student in observing the jar. Developing an understanding of this important relationship is the foundation of how a barometer functions to measure air pressure. The results of this activity might be used as an inference that cold air is heavier (more dense) than warm air. Ask the student what it means when we say that the air is more dense or less dense.
Arriving at the most important outcome of this activ-ity through careful observation and critical thinking, provoked by appropriate teacher questioning, the learner should reach the following conclusions:
The air within the jar in the warmer environment warms and expands, which causes the air inside the jar to press more firmly against the rubber balloon, thus pressing out the center. Because the air expands, it is less dense, (The number of molecules in the jar has not changed, but they take up more space. Thus, they are less closely packed, and the heated air in the jar is less dense.)
Meteorology Activities for Grades 5-9 25 NP-2006-08-97-LaRC
The air in the jar in the cooler environment cools and contracts, which causes the outside air to press down more firmly against the rubber balloon, thus depressing its center. Because the air contracts, it is more dense. (The molecules are more closely packed, and thus the cool air is more dense.)
Going Further
To further verify the action of the balloon and its response to air pressure, you can repeat the activity by switching the jars to the different environments to observe the results. Does the convex balloon become concave when switched to the different environment? Explain.
The results of the balloon should be the exact oppo-site when the environments are switched, helping to further verify the action of the balloon in response to warm and cold air.
Challenge
Research and write a paper regarding aspects of ear-drum damage/changes in air travel and changes in altitude. Keep in mind that the eardrum functions like the balloon on the barometer with changes in pressure.
The learner might start with Web sites found in Appendix V.
NOTE: This challenge singles out eardrum damage and not hearing loss in general. Therefore, the Web sites will give specific information relevant to this challenge. This challenge is important for nurturing the “scientific habits of mind” respect for data.
For the Teacher:Example of Bringing Closure to“Think About This!”
“Think About This!” is an advanced organizer to get the learner in a mind-set to better prepare for a subsequent activity.
Bringing Closure to “Think About This!”
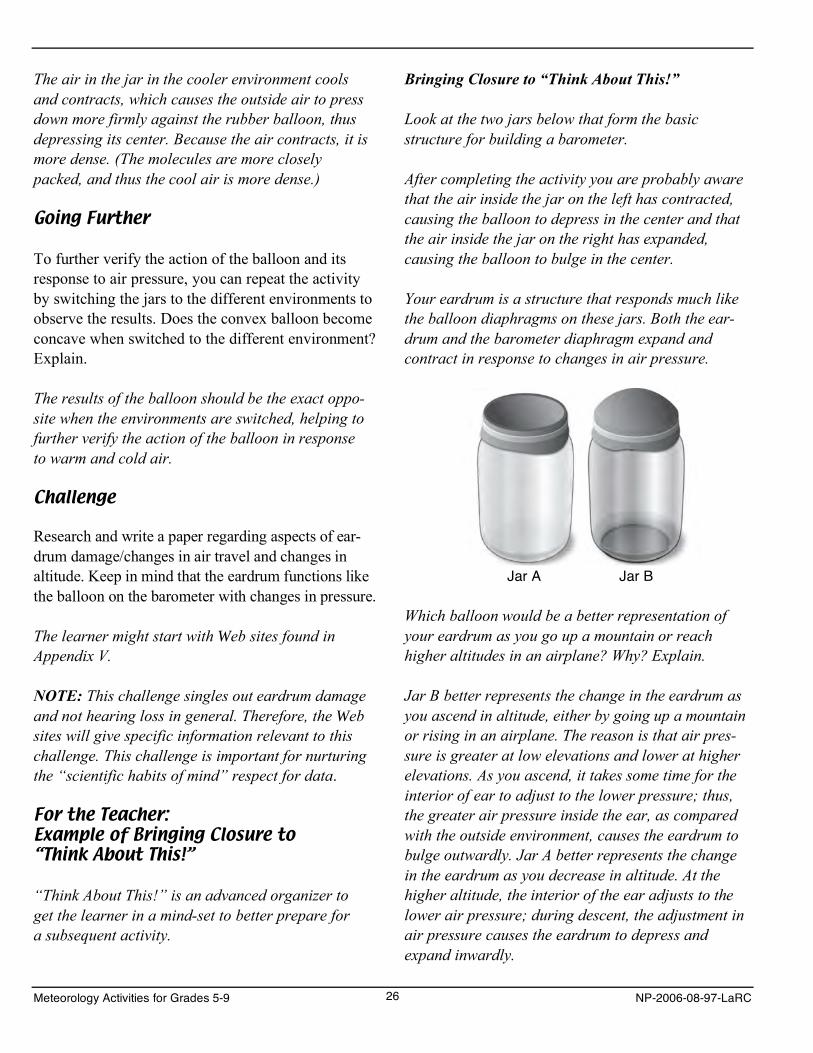
Look at the two jars below that form the basic structure for building a barometer.
After completing the activity you are probably aware that the air inside the jar on the left has contracted, causing the balloon to depress in the center and that the air inside the jar on the right has expanded, causing the balloon to bulge in the center.
Your eardrum is a structure that responds much like the balloon diaphragms on these jars. Both the ear-drum and the barometer diaphragm expand and contract in response to changes in air pressure.
Jar A Jar B
Which balloon would be a better representation of your eardrum as you go up a mountain or reach higher altitudes in an airplane? Why? Explain.
Jar B better represents the change in the eardrum as you ascend in altitude, either by going up a mountain or rising in an airplane. The reason is that air pres-sure is greater at low elevations and lower at higher elevations. As you ascend, it takes some time for the interior of ear to adjust to the lower pressure; thus, the greater air pressure inside the ear, as compared with the outside environment, causes the eardrum to bulge outwardly. Jar A better represents the change in the eardrum as you decrease in altitude. At the higher altitude, the interior of the ear adjusts to the lower air pressure; during descent, the adjustment in air pressure causes the eardrum to depress and expand inwardly.
Meteorology Activities for Grades 5-9 26 NP-2006-08-97-LaRC
Chapter 6. Constructing a Barometer: A Structured Inquiry Activity
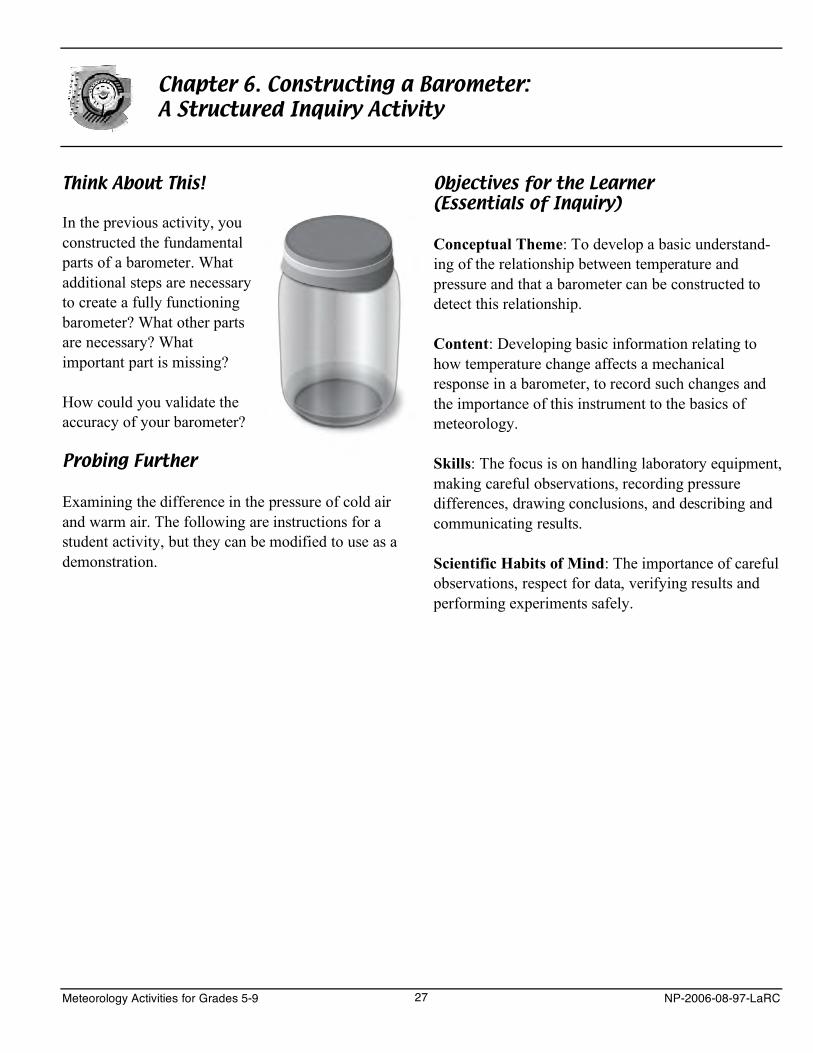
Think About This!
In the previous activity, you constructed the fundamental parts of a barometer. What additional steps are necessary to create a fully functioning barometer? What other parts are necessary? What important part is missing?
How could you validate the accuracy of your barometer?
Probing Further
Examining the difference in the pressure of cold air and warm air. The following are instructions for a student activity, but they can be modified to use as a demonstration.
Objectives for the Learner (Essentials of Inquiry)
Conceptual Theme: To develop a basic understand-ing of the relationship between temperature and pressure and that a barometer can be constructed to detect this relationship.
Content: Developing basic information relating to how temperature change affects a mechanical response in a barometer, to record such changes and the importance of this instrument to the basics of meteorology.
Skills: The focus is on handling laboratory equipment, making careful observations, recording pressure differences, drawing conclusions, and describing and communicating results.
Scientific Habits of Mind: The importance of careful observations, respect for data, verifying results and performing experiments safely.
Meteorology Activities for Grades 5-9 27 NP-2006-08-97-LaRC
Materials
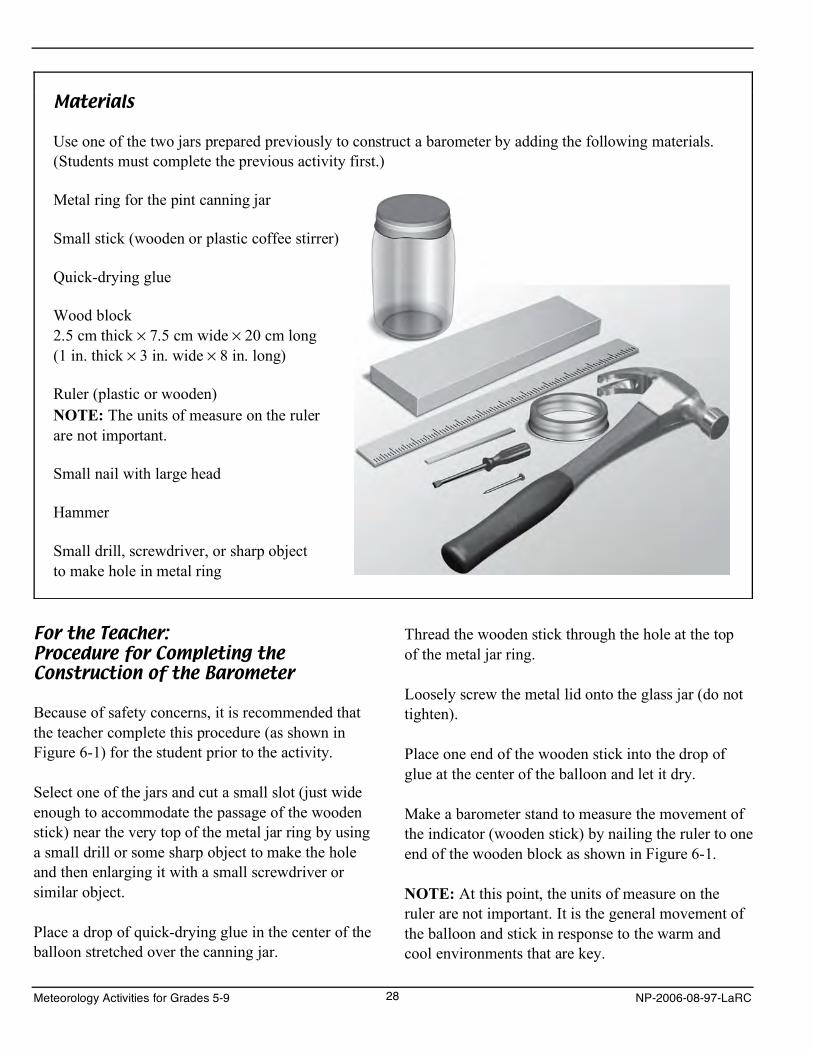
Use one of the two jars prepared previously to construct a barometer by adding the following materials.(Students must complete the previous activity first.)
Metal ring for the pint canning jar
Small stick (wooden or plastic coffee stirrer)
Quick-drying glue
Wood block 2.5 cm thick × 7.5 cm wide × 20 cm long (1 in. thick × 3 in. wide × 8 in. long)
Ruler (plastic or wooden)NOTE: The units of measure on the rulerare not important.
Small nail with large head
Hammer
Small drill, screwdriver, or sharp object to make hole in metal ring
For the Teacher: Procedure for Completing the Construction of the Barometer
Because of safety concerns, it is recommended that the teacher complete this procedure (as shown in Figure 6-1) for the student prior to the activity.
Select one of the jars and cut a small slot (just wide enough to accommodate the passage of the wooden stick) near the very top of the metal jar ring by using a small drill or some sharp object to make the hole and then enlarging it with a small screwdriver or similar object.
Place a drop of quick-drying glue in the center of the balloon stretched over the canning jar.
Thread the wooden stick through the hole at the top of the metal jar ring.
Loosely screw the metal lid onto the glass jar (do not tighten).
Place one end of the wooden stick into the drop of glue at the center of the balloon and let it dry.
Make a barometer stand to measure the movement of the indicator (wooden stick) by nailing the ruler to one end of the wooden block as shown in Figure 6-1.
NOTE: At this point, the units of measure on the ruler are not important. It is the general movement of the balloon and stick in response to the warm and cool environments that are key.
Meteorology Activities for Grades 5-9 28 NP-2006-08-97-LaRC
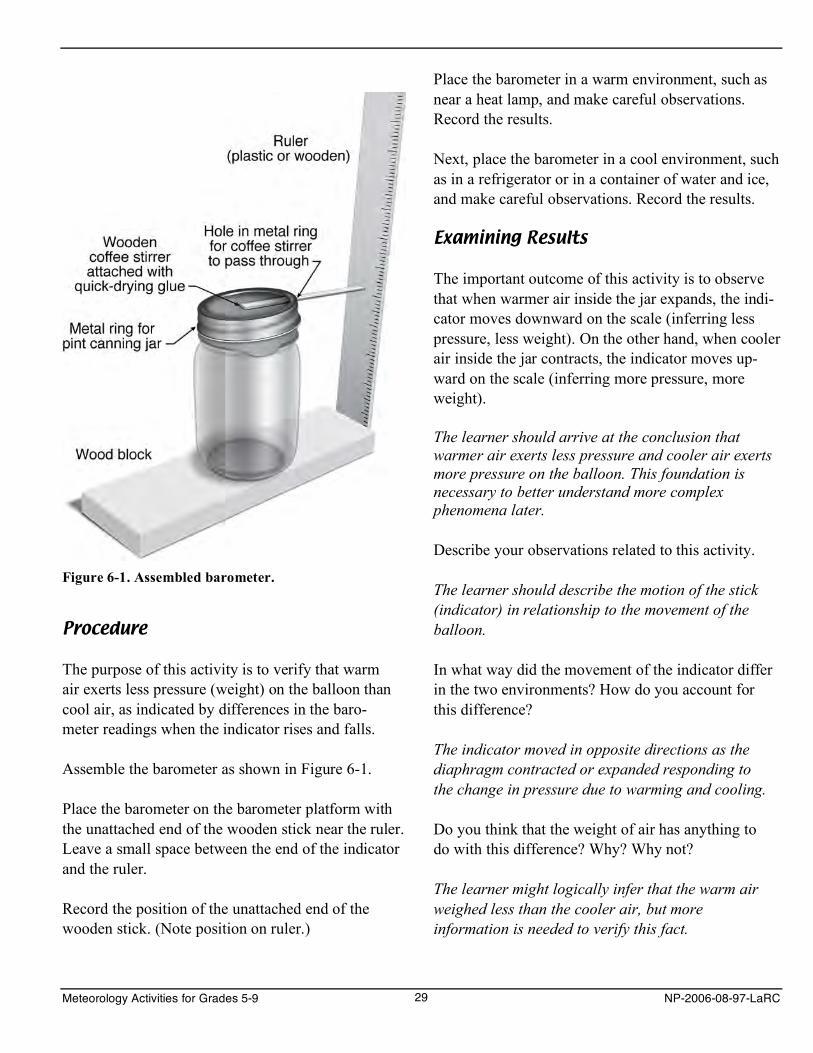
Figure 6-1. Assembled barometer.
Procedure
The purpose of this activity is to verify that warm air exerts less pressure (weight) on the balloon than cool air, as indicated by differences in the baro-meter readings when the indicator rises and falls.
Assemble the barometer as shown in Figure 6-1.
Place the barometer on the barometer platform with the unattached end of the wooden stick near the ruler. Leave a small space between the end of the indicator and the ruler.
Record the position of the unattached end of the wooden stick. (Note position on ruler.)
Place the barometer in a warm environment, such as near a heat lamp, and make careful observations. Record the results.
Next, place the barometer in a cool environment, such as in a refrigerator or in a container of water and ice, and make careful observations. Record the results.
Examining Results
The important outcome of this activity is to observe that when warmer air inside the jar expands, the indi-cator moves downward on the scale (inferring less pressure, less weight). On the other hand, when cooler air inside the jar contracts, the indicator moves up-ward on the scale (inferring more pressure, more weight).
The learner should arrive at the conclusion that warmer air exerts less pressure and cooler air exerts more pressure on the balloon. This foundation is necessary to better understand more complex phenomena later.
Describe your observations related to this activity.
The learner should describe the motion of the stick (indicator) in relationship to the movement of the balloon.
In what way did the movement of the indicator differ in the two environments? How do you account for this difference?
The indicator moved in opposite directions as the diaphragm contracted or expanded responding to the change in pressure due to warming and cooling.
Do you think that the weight of air has anything to do with this difference? Why? Why not?
The learner might logically infer that the warm air weighed less than the cooler air, but more information is needed to verify this fact.
Meteorology Activities for Grades 5-9 29 NP-2006-08-97-LaRC
Conclusion
The learner should base the conclusion on the results of the data, but it would be logical to infer that warmer air is lighter per volume but expands and pushes with less force on the balloon.
Going Further
The learner could confirm the results by repeating this activity several times. He/she could vary the tempera-ture of the environment to see what differing results could be obtained.
Challenge
Have the learner suggest ways that the barometer’s accuracy could be validated and thus further confirm the obtained results. One way to do this is to repeat the procedure using the constructed barometer and a manufactured barometer.
Meteorology Activities for Grades 5-9 30 NP-2006-08-97-LaRC
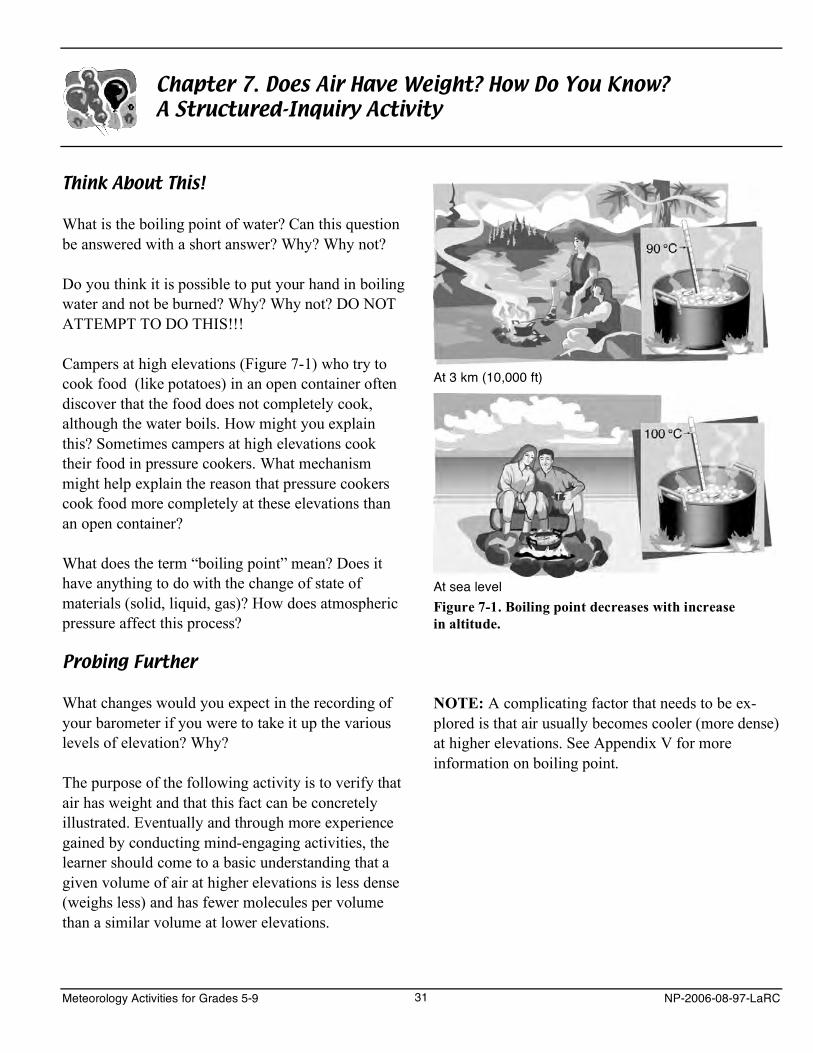
Chapter 7. Does Air Have Weight? How Do You Know? A Structured-Inquiry Activity
Think About This!
What is the boiling point of water? Can this question be answered with a short answer? Why? Why not?
Do you think it is possible to put your hand in boiling water and not be burned? Why? Why not? DO NOT ATTEMPT TO DO THIS!!!
Campers at high elevations (Figure 7-1) who try to cook food (like potatoes) in an open container often discover that the food does not completely cook, although the water boils. How might you explain this? Sometimes campers at high elevations cook their food in pressure cookers. What mechanism might help explain the reason that pressure cookers cook food more completely at these elevations than an open container?
What does the term “boiling point” mean? Does it have anything to do with the change of state of materials (solid, liquid, gas)? How does atmospheric pressure affect this process?
Probing Further
What changes would you expect in the recording of your barometer if you were to take it up the various levels of elevation? Why?
The purpose of the following activity is to verify that air has weight and that this fact can be concretely illustrated. Eventually and through more experience gained by conducting mind-engaging activities, the learner should come to a basic understanding that a given volume of air at higher elevations is less dense (weighs less) and has fewer molecules per volume than a similar volume at lower elevations.
At 3 km (10,000 ft)
At sea level Figure 7-1. Boiling point decreases with increase in altitude.
NOTE: A complicating factor that needs to be ex-plored is that air usually becomes cooler (more dense) at higher elevations. See Appendix V for more information on boiling point.
Meteorology Activities for Grades 5-9 31 NP-2006-08-97-LaRC
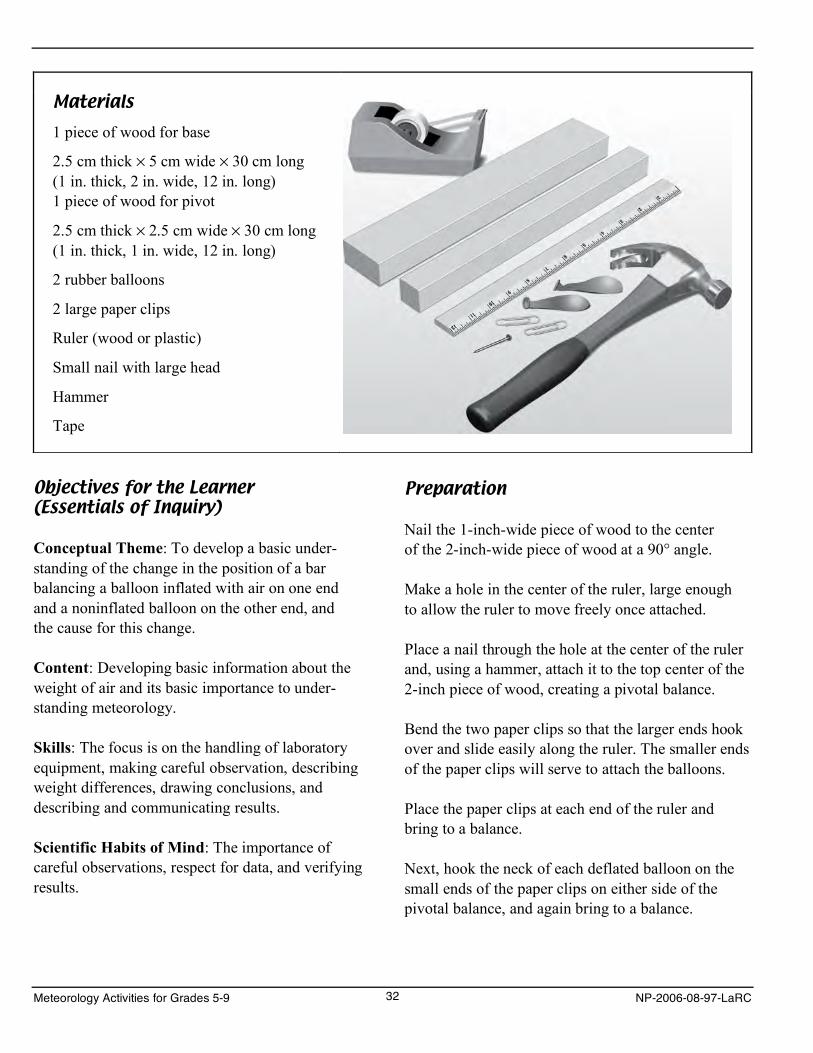
Materials 1 piece of wood for base
2.5 cm thick × 5 cm wide × 30 cm long (1 in. thick, 2 in. wide, 12 in. long) 1 piece of wood for pivot
2.5 cm thick × 2.5 cm wide × 30 cm long (1 in. thick, 1 in. wide, 12 in. long)
2 rubber balloons
2 large paper clips
Ruler (wood or plastic)
Small nail with large head
Hammer
Tape
Objectives for the Learner (Essentials of Inquiry)
Conceptual Theme: To develop a basic under-standing of the change in the position of a bar balancing a balloon inflated with air on one end and a noninflated balloon on the other end, and the cause for this change.
Content: Developing basic information about the weight of air and its basic importance to under-standing meteorology.
Skills: The focus is on the handling of laboratory equipment, making careful observation, describing weight differences, drawing conclusions, and describing and communicating results.
Scientific Habits of Mind: The importance of careful observations, respect for data, and verifying results.
Preparation
Nail the 1-inch-wide piece of wood to the center of the 2-inch-wide piece of wood at a 90° angle.
Make a hole in the center of the ruler, large enough to allow the ruler to move freely once attached.
Place a nail through the hole at the center of the ruler and, using a hammer, attach it to the top center of the 2-inch piece of wood, creating a pivotal balance.
Bend the two paper clips so that the larger ends hook over and slide easily along the ruler. The smaller ends of the paper clips will serve to attach the balloons.
Place the paper clips at each end of the ruler and bring to a balance.
Next, hook the neck of each deflated balloon on the small ends of the paper clips on either side of the pivotal balance, and again bring to a balance.
Meteorology Activities for Grades 5-9 32 NP-2006-08-97-LaRC
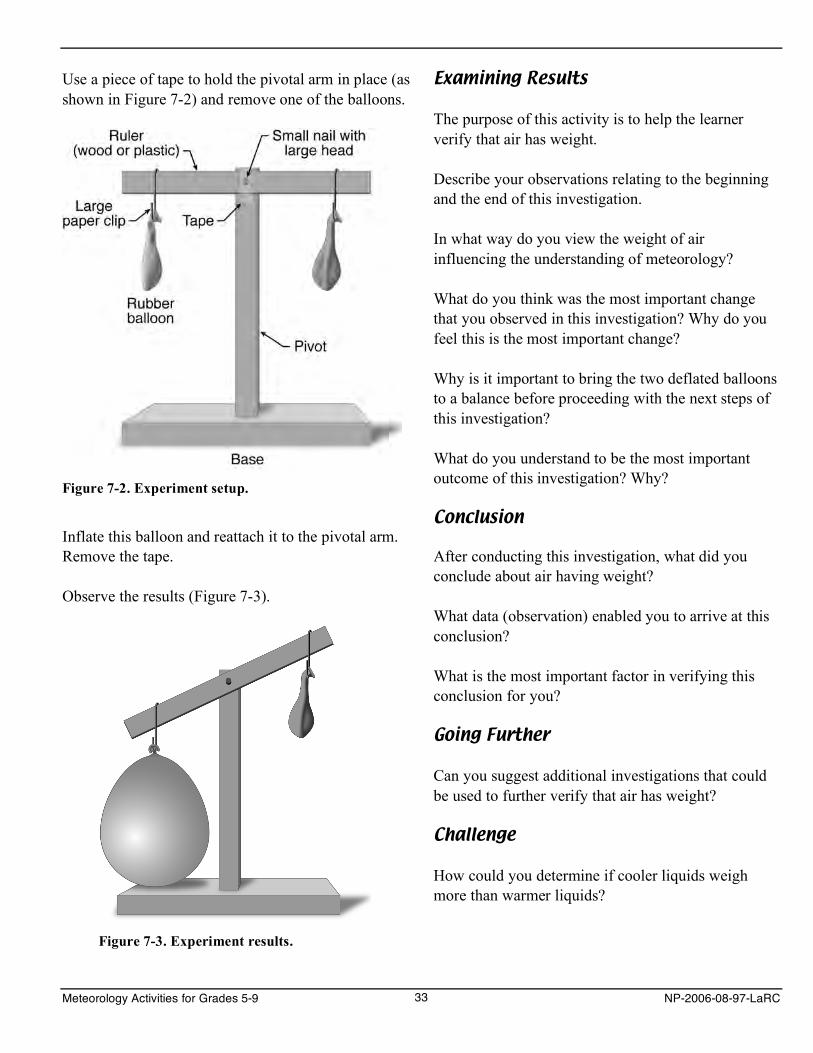
Use a piece of tape to hold the pivotal arm in place (as shown in Figure 7-2) and remove one of the balloons.
Figure 7-2. Experiment setup.
Inflate this balloon and reattach it to the pivotal arm. Remove the tape.
Observe the results (Figure 7-3).
Figure 7-3. Experiment results.
Examining Results
The purpose of this activity is to help the learner verify that air has weight.
Describe your observations relating to the beginning and the end of this investigation.
In what way do you view the weight of air influencing the understanding of meteorology?
What do you think was the most important change that you observed in this investigation? Why do you feel this is the most important change?
Why is it important to bring the two deflated balloons to a balance before proceeding with the next steps of this investigation?
What do you understand to be the most important outcome of this investigation? Why?
Conclusion
After conducting this investigation, what did you conclude about air having weight?
What data (observation) enabled you to arrive at this conclusion?
What is the most important factor in verifying this conclusion for you?
Going Further
Can you suggest additional investigations that could be used to further verify that air has weight?
Challenge
How could you determine if cooler liquids weigh more than warmer liquids?
Meteorology Activities for Grades 5-9 33 NP-2006-08-97-LaRC
Background for the Teacher
This activity facilitates the understanding of air having weight. The deflated balloons achieved a balance when placed on the pivotal balance. However, when one balloon was removed, inflated, and placed back at the same location, the balance was disrupted, thus indicating that the inflated balloon has additional weight caused by the air inside. While the barometer activities indicate that cooler air contracts and warmer air expands by the action of the rubber balloon, they also firmly verify that cooler liquids or gases weigh more than warmer liquids or gases.
Boiling can take place when the vapor pressure of the water vapor, at the temperature of boiling, equals that of the overlying atmosphere.
At higher altitudes, the air is less dense. Thus, there is less weight of air in the column of atmosphere above the liquid, and it is easier for the water vapor to “escape” from the liquid (i.e., boil). Water does not have to be at 100 °C (212 °F) to boil at high altitudes. It can boil at 90 °C (201 °F) at 1.5 km (6000 ft), but boiling at 90 °C does not cook it as thoroughly. Therefore, at high altitudes, to get the food “done,” you have to boil it longer, or use a pressure cooker.
NOTE: Pressure caps on car radiators allow the water to be 230 °F or higher. Above 19.2 km (63,000 ft) altitude, your blood would boil if you were not in a pressure suit.
Meteorology Activities for Grades 5-9 34 NP-2006-08-97-LaRC
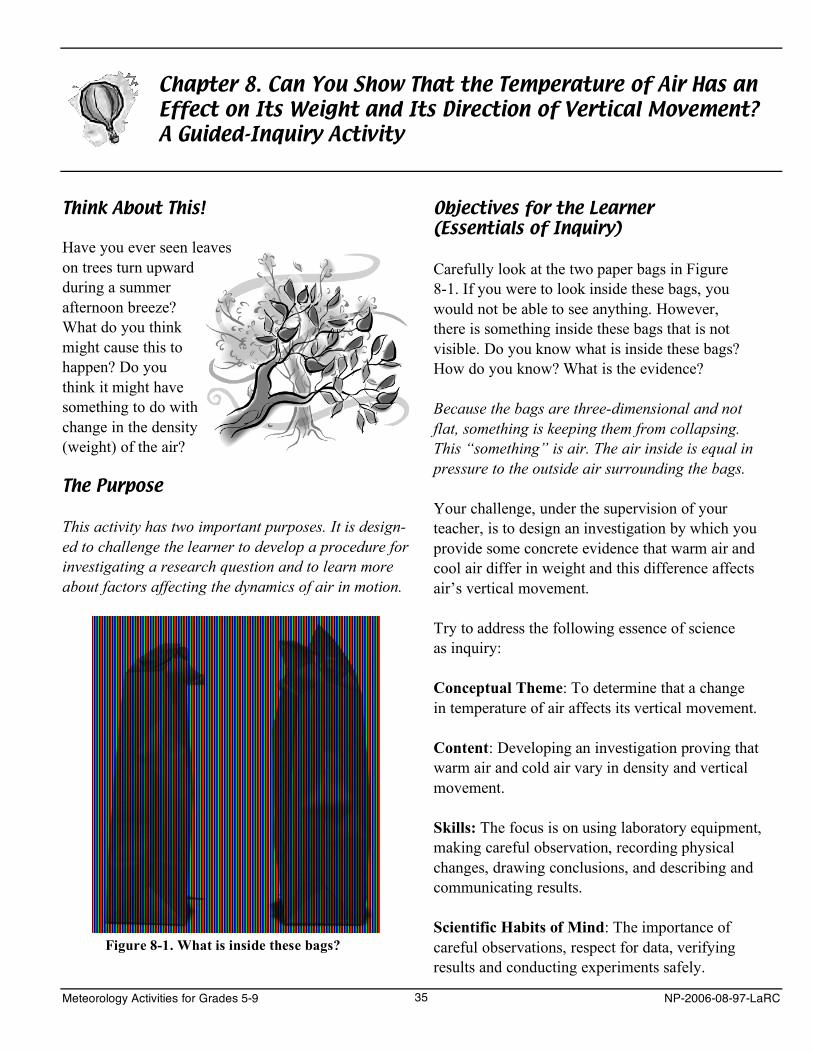
Chapter 8. Can You Show That the Temperature of Air Has an Effect on Its Weight and Its Direction of Vertical Movement? A Guided-Inquiry Activity
Think About This!
Have you ever seen leaves on trees turn upward during a summer afternoon breeze? What do you think might cause this to happen? Do you think it might have something to do with change in the density (weight) of the air?
The Purpose
This activity has two important purposes. It is design-ed to challenge the learner to develop a procedure for investigating a research question and to learn more about factors affecting the dynamics of air in motion.
Figure 8-1. What is inside these bags?
Objectives for the Learner (Essentials of Inquiry)
Carefully look at the two paper bags in Figure 8-1. If you were to look inside these bags, you would not be able to see anything. However, there is something inside these bags that is not visible. Do you know what is inside these bags? How do you know? What is the evidence?
Because the bags are three-dimensional and not flat, something is keeping them from collapsing. This “something” is air. The air inside is equal in pressure to the outside air surrounding the bags.
Your challenge, under the supervision of your teacher, is to design an investigation by which you provide some concrete evidence that warm air and cool air differ in weight and this difference affects air’s vertical movement.
Try to address the following essence of science as inquiry:
Conceptual Theme: To determine that a change in temperature of air affects its vertical movement.
Content: Developing an investigation proving that warm air and cold air vary in density and vertical movement.
Skills: The focus is on using laboratory equipment, making careful observation, recording physical changes, drawing conclusions, and describing and communicating results.
Scientific Habits of Mind: The importance of careful observations, respect for data, verifying results and conducting experiments safely.
Meteorology Activities for Grades 5-9 35 NP-2006-08-97-LaRC
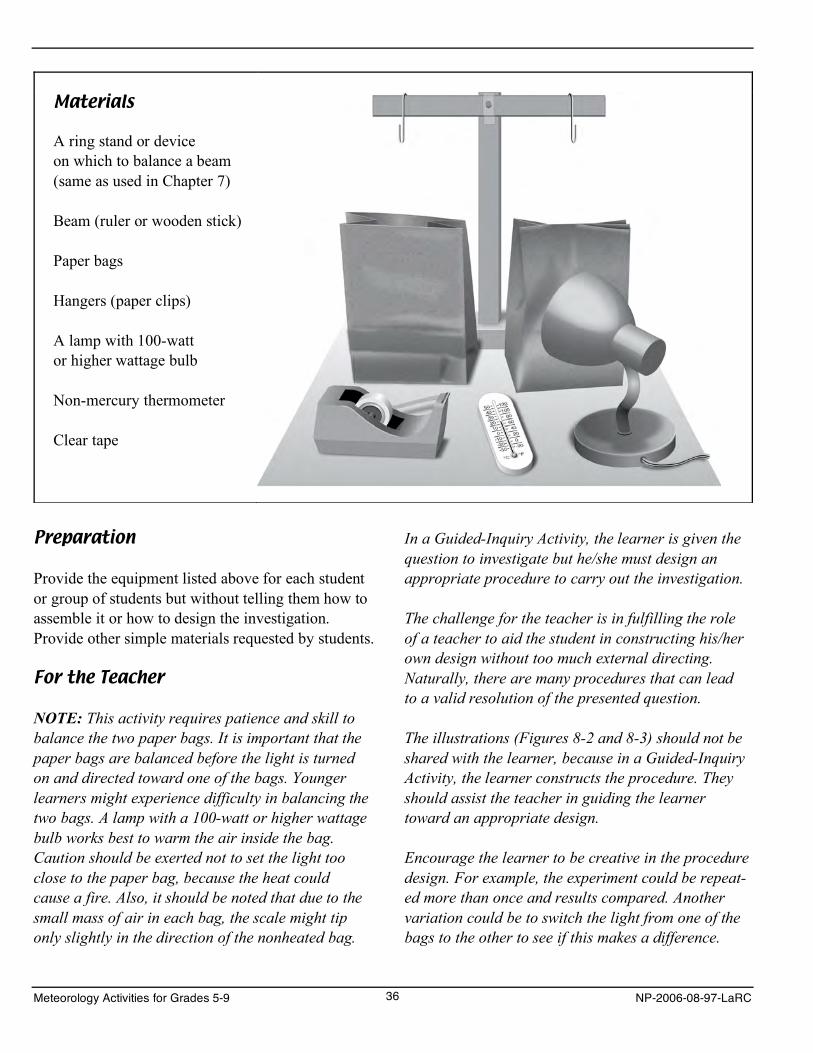
Materials
A ring stand or device on which to balance a beam (same as used in Chapter 7)
Beam (ruler or wooden stick)
Paper bags
Hangers (paper clips)
A lamp with 100-wattor higher wattage bulb
Non-mercury thermometer
Clear tape
Preparation
Provide the equipment listed above for each student or group of students but without telling them how to assemble it or how to design the investigation. Provide other simple materials requested by students.
For the Teacher
NOTE: This activity requires patience and skill to balance the two paper bags. It is important that the paper bags are balanced before the light is turned on and directed toward one of the bags. Younger learners might experience difficulty in balancing the two bags. A lamp with a 100-watt or higher wattage bulb works best to warm the air inside the bag. Caution should be exerted not to set the light too close to the paper bag, because the heat could cause a fire. Also, it should be noted that due to the small mass of air in each bag, the scale might tip only slightly in the direction of the nonheated bag.
In a Guided-Inquiry Activity, the learner is given the question to investigate but he/she must design an appropriate procedure to carry out the investigation.
The challenge for the teacher is in fulfilling the role of a teacher to aid the student in constructing his/her own design without too much external directing. Naturally, there are many procedures that can lead to a valid resolution of the presented question.
The illustrations (Figures 8-2 and 8-3) should not be shared with the learner, because in a Guided-Inquiry Activity, the learner constructs the procedure. They should assist the teacher in guiding the learner toward an appropriate design.
Encourage the learner to be creative in the procedure design. For example, the experiment could be repeat-ed more than once and results compared. Another variation could be to switch the light from one of the bags to the other to see if this makes a difference.
Meteorology Activities for Grades 5-9 36 NP-2006-08-97-LaRC
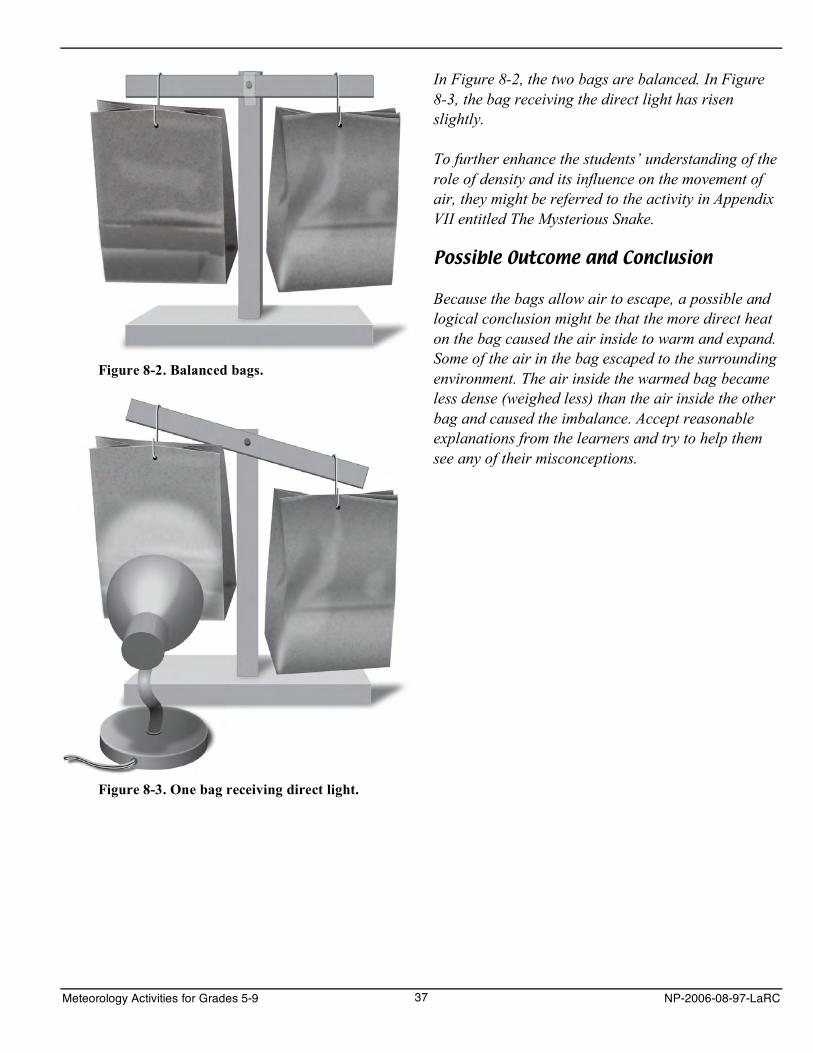
Figure 8-2. Balanced bags.
Figure 8-3. One bag receiving direct light.
In Figure 8-2, the two bags are balanced. In Figure 8-3, the bag receiving the direct light has risen slightly.
To further enhance the students’ understanding of the role of density and its influence on the movement of air, they might be referred to the activity in Appendix VII entitled The Mysterious Snake.
Possible Outcome and Conclusion
Because the bags allow air to escape, a possible and logical conclusion might be that the more direct heat on the bag caused the air inside to warm and expand. Some of the air in the bag escaped to the surrounding environment. The air inside the warmed bag became less dense (weighed less) than the air inside the other bag and caused the imbalance. Accept reasonable explanations from the learners and try to help them see any of their misconceptions.
Meteorology Activities for Grades 5-9 37 NP-2006-08-97-LaRC

This Page for Notes
Meteorology Activities for Grades 5-9 38 NP-2006-08-97-LaRC
Chapter 9. Are Cold Liquids More Dense Than Warm Liquids? A Guided-Inquiry Activity
Think About This!
Have you ever been in a very warm room on a very cold winter day and opened a door or window leading to the outside for a short period of time? What did you experience as you stood in the opened doorway or near the opened window? Did you experience a rush of cold air past you as you stood there? What do you think might explain this rush of air into the room? What if you had been on the out-side in a similar situation and opened a door into a warm room. Do you think you would have experi-enced a rush of warmer air past you to the cooler outside? Why? Why not?
Probing Further
An important concept in meteorology has to do with the difference in the weight of cooler air compared with the weight of warmer air. This difference helps to set up important dynamics in the atmosphere. Verifying that warmer air is lighter than cooler air helps to take some of the abstractness out of developing a basic understanding of weather. Using simple equipment, it is very difficult to design experiments to test this concept with gases.
However, liquids have many of the same physical properties as gases with regard to the dynamics of flow and movements. In science, it is often necessary to project findings from one set of materials or situations to another. This projection is valid only if the physical properties being studied are very similar. Because of the similarity of the fluid dynamics of both liquids and gases, the following activity will use water in the liquid form to better understand some of the properties of gas in setting up dynamics in the atmosphere.
Objectives for the Learner (Essentials of Inquiry)
Conceptual Theme: To develop a basic under-standing of some of the movements that take place when warmer water and cooler water interface, and probing the dynamics resulting from this interaction.
Content: Developing basic information relating to the flow of liquids and gases, relating to differences in densities to variations in temperature and the process setting liquids and gases in motion. Further, providing a basic understanding of other factors that constitute the study of meteorology.
Skills: The focus is on using laboratory equipment, making careful observations, recording physical changes, drawing conclusions and describing and communicating results. This activity is important because the student will learn about experimental design procedures.
Scientific Habits of Mind: The importance of careful observations, respect for data, and verifying results.
Meteorology Activities for Grades 5-9 39 NP-2006-08-97-LaRC
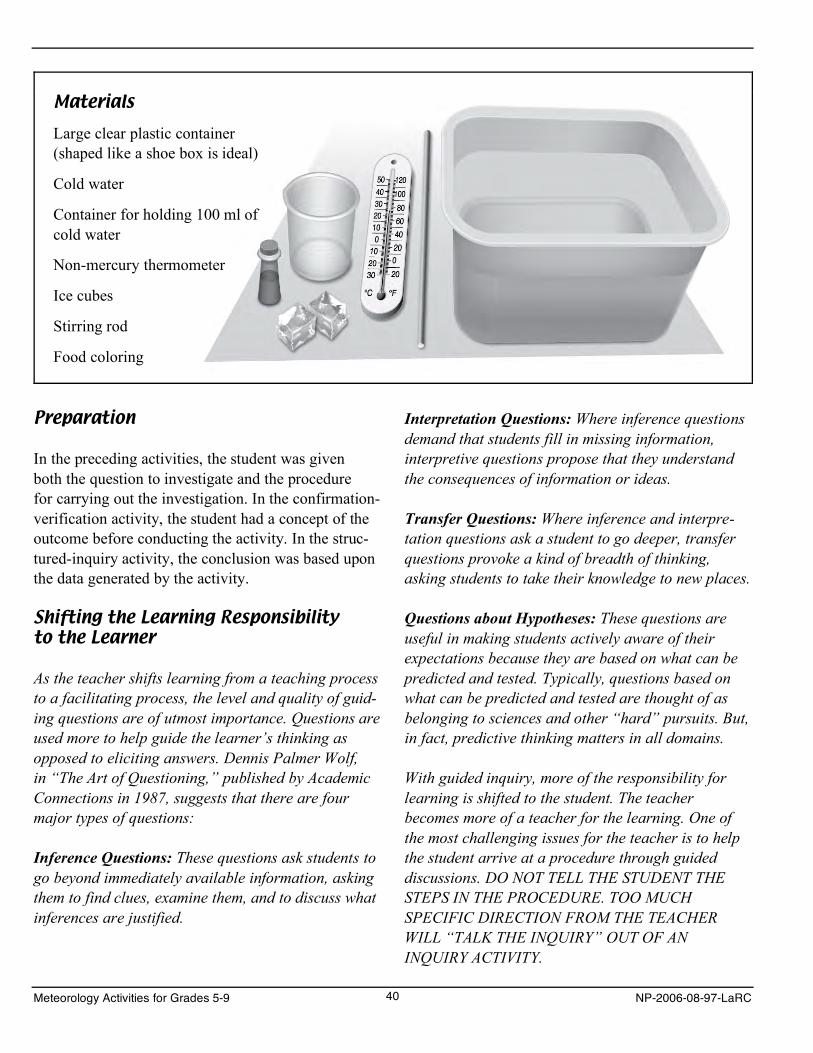
Materials
Large clear plastic container (shaped like a shoe box is ideal)
Cold water
Container for holding 100 ml of cold water
Non-mercury thermometer
Ice cubes
Stirring rod
Food coloring
Preparation
In the preceding activities, the student was given both the question to investigate and the procedure for carrying out the investigation. In the confirmation-verification activity, the student had a concept of the outcome before conducting the activity. In the struc-tured-inquiry activity, the conclusion was based upon the data generated by the activity.
Shifting the Learning Responsibility to the Learner
As the teacher shifts learning from a teaching process to a facilitating process, the level and quality of guid-ing questions are of utmost importance. Questions are used more to help guide the learner’s thinking as opposed to eliciting answers. Dennis Palmer Wolf, in “The Art of Questioning,” published by Academic Connections in 1987, suggests that there are four major types of questions:
Inference Questions: These questions ask students to go beyond immediately available information, asking them to find clues, examine them, and to discuss what inferences are justified.
Interpretation Questions: Where inference questions demand that students fill in missing information, interpretive questions propose that they understand the consequences of information or ideas.
Transfer Questions: Where inference and interpre-tation questions ask a student to go deeper, transfer questions provoke a kind of breadth of thinking, asking students to take their knowledge to new places.
Questions about Hypotheses: These questions are useful in making students actively aware of their expectations because they are based on what can be predicted and tested. Typically, questions based on what can be predicted and tested are thought of as belonging to sciences and other “hard” pursuits. But, in fact, predictive thinking matters in all domains.
With guided inquiry, more of the responsibility for learning is shifted to the student. The teacher becomes more of a teacher for the learning. One of the most challenging issues for the teacher is to help the student arrive at a procedure through guided discussions. DO NOT TELL THE STUDENT THE STEPS IN THE PROCEDURE. TOO MUCH SPECIFIC DIRECTION FROM THE TEACHER WILL “TALK THE INQUIRY” OUT OF AN INQUIRY ACTIVITY.
Meteorology Activities for Grades 5-9 40 NP-2006-08-97-LaRC
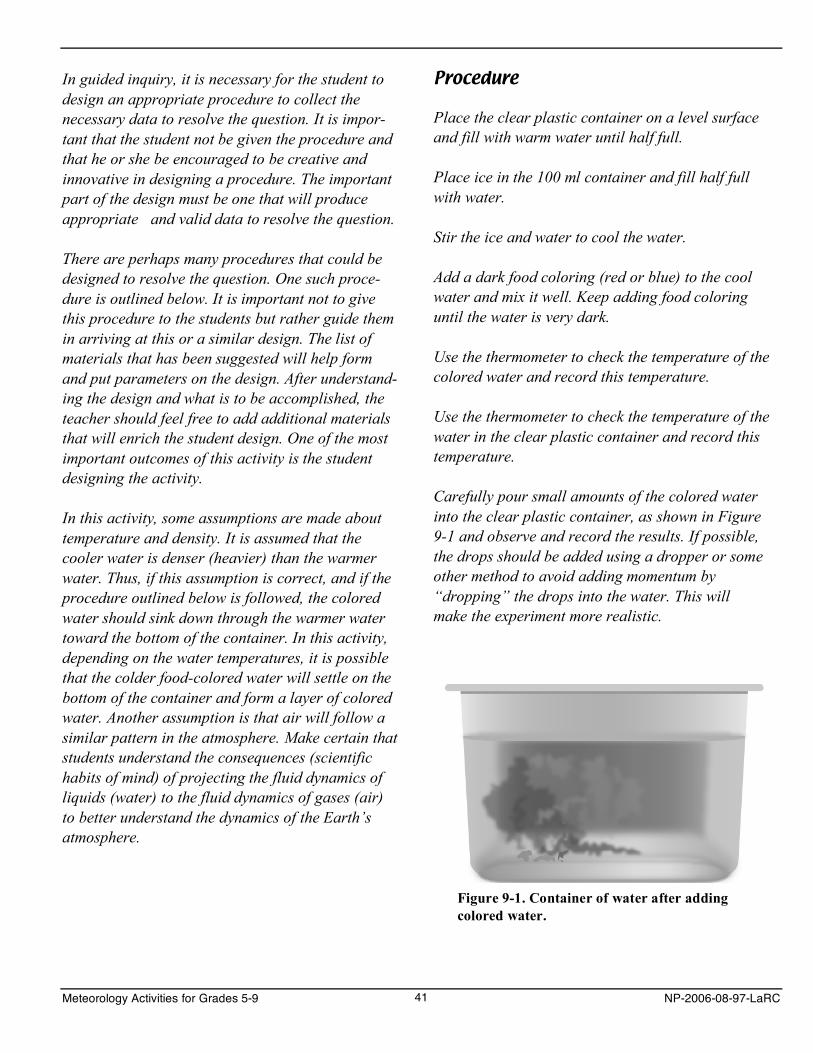
In guided inquiry, it is necessary for the student to design an appropriate procedure to collect the necessary data to resolve the question. It is impor-tant that the student not be given the procedure and that he or she be encouraged to be creative and innovative in designing a procedure. The important part of the design must be one that will produce appropriate and valid data to resolve the question.
There are perhaps many procedures that could be designed to resolve the question. One such proce-dure is outlined below. It is important not to give this procedure to the students but rather guide them in arriving at this or a similar design. The list of materials that has been suggested will help form and put parameters on the design. After understand-ing the design and what is to be accomplished, the teacher should feel free to add additional materials that will enrich the student design. One of the most important outcomes of this activity is the student designing the activity.
In this activity, some assumptions are made about temperature and density. It is assumed that the cooler water is denser (heavier) than the warmer water. Thus, if this assumption is correct, and if the procedure outlined below is followed, the colored water should sink down through the warmer water toward the bottom of the container. In this activity, depending on the water temperatures, it is possible that the colder food-colored water will settle on the bottom of the container and form a layer of colored water. Another assumption is that air will follow a similar pattern in the atmosphere. Make certain that students understand the consequences (scientific habits of mind) of projecting the fluid dynamics of liquids (water) to the fluid dynamics of gases (air) to better understand the dynamics of the Earth’s atmosphere.
Procedure
Place the clear plastic container on a level surface and fill with warm water until half full.
Place ice in the 100 ml container and fill half full with water.
Stir the ice and water to cool the water.
Add a dark food coloring (red or blue) to the cool water and mix it well. Keep adding food coloring until the water is very dark.
Use the thermometer to check the temperature of the colored water and record this temperature.
Use the thermometer to check the temperature of the water in the clear plastic container and record this temperature.
Carefully pour small amounts of the colored water into the clear plastic container, as shown in Figure 9-1 and observe and record the results. If possible, the drops should be added using a dropper or some other method to avoid adding momentum by “dropping” the drops into the water. This will make the experiment more realistic.
Figure 9-1. Container of water after adding colored water.
Meteorology Activities for Grades 5-9 41 NP-2006-08-97-LaRC
Examining Results Background for the Teacher
In this activity, the teacher must fulfill the role of teacher of learning. This role demands less em-phasis upon dispensing information and an in-creased role of drawing from the learner the information necessary to complete the design of a temperature inversion in the atmosphere where warm air forms a layer above cooler air.
Discuss the challenge, designing a procedure similar to or better than the subsequent activity.
The key expectation for the student is to design the procedure to determine if cold liquids are heavier than warm liquids. The experimental design should be specifically and appropriately derived so that it will produce data that will resolve the question. Further, it is important that an appropriate conclu-sion be drawn from the results of the activity. It is expected that the learner will find out that the colder liquid sinks through the warmer liquids and thus strongly suggesting that cold liquids are heavier than warm liquids. A discussion should ensue that will help the learner understand that the dynamics of fluids (water and air) have similar properties and characteristics. This fact is important because air cannot be manipulated as easily as water. The learning must be successfully transferred to the dynamics of air in the atmosphere and setting up important circulation patterns.
Going Further
Students might be challenged to experiment with other safe liquids to help confirm the similarity of the dynamics of liquids. (The teacher must become versed in helping students think of other designs.)
Challenge
An interesting modification of the activity is to re-verse the temperatures by having cold water in the larger container and adding food coloring to the warmer water instead. Trying to pour the warmer water down through the colder water will sometimes result in the warmer food-colored water sinking part way and then returning to the top. This is very similar to air motion.
Meteorology Activities for Grades 5-9 42 NP-2006-08-97-LaRC
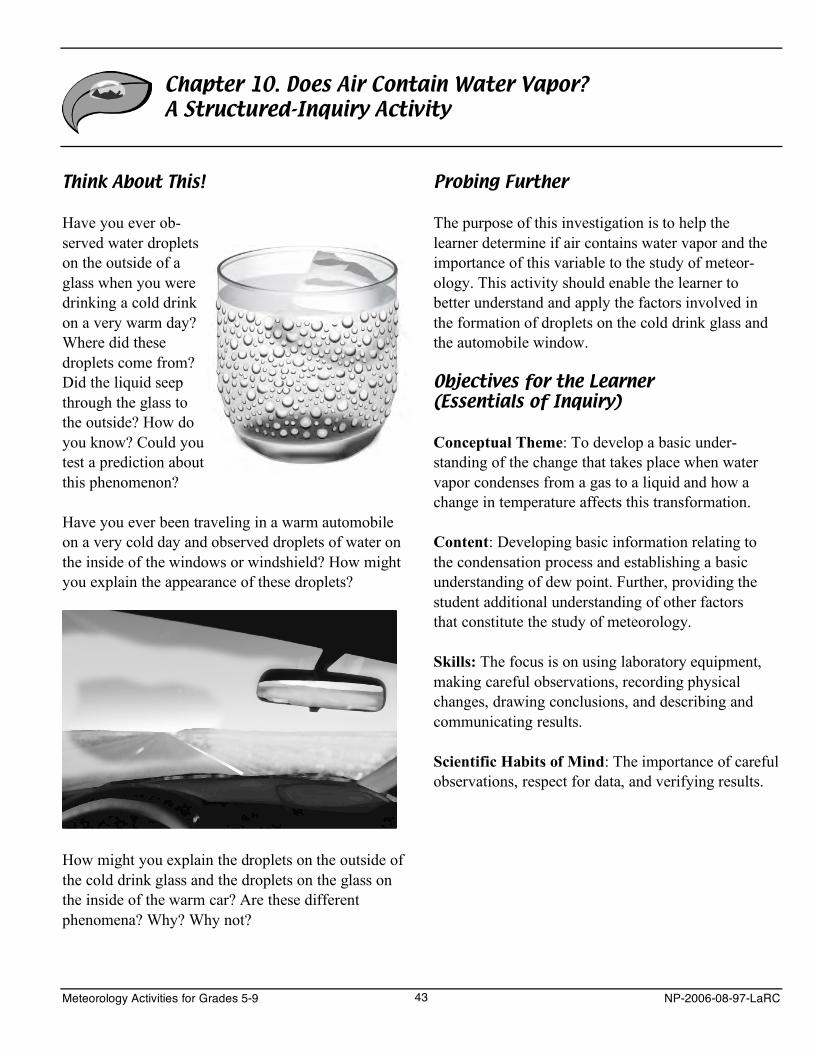
Chapter 10. Does Air Contain Water Vapor? A Structured-Inquiry Activity
Think About This!
Have you ever ob-served water droplets on the outside of a glass when you were drinking a cold drink on a very warm day? Where did these droplets come from? Did the liquid seep through the glass to the outside? How do you know? Could you test a prediction about this phenomenon?
Have you ever been traveling in a warm automobile on a very cold day and observed droplets of water on the inside of the windows or windshield? How might you explain the appearance of these droplets?
How might you explain the droplets on the outside of the cold drink glass and the droplets on the glass on the inside of the warm car? Are these different phenomena? Why? Why not?
Probing Further
The purpose of this investigation is to help the learner determine if air contains water vapor and the importance of this variable to the study of meteor-ology. This activity should enable the learner to better understand and apply the factors involved in the formation of droplets on the cold drink glass and the automobile window.
Objectives for the Learner (Essentials of Inquiry)
Conceptual Theme: To develop a basic under-standing of the change that takes place when water vapor condenses from a gas to a liquid and how a change in temperature affects this transformation.
Content: Developing basic information relating to the condensation process and establishing a basic understanding of dew point. Further, providing the student additional understanding of other factors that constitute the study of meteorology.
Skills: The focus is on using laboratory equipment, making careful observations, recording physical changes, drawing conclusions, and describing and communicating results.
Scientific Habits of Mind: The importance of careful observations, respect for data, and verifying results.
Meteorology Activities for Grades 5-9 43 NP-2006-08-97-LaRC
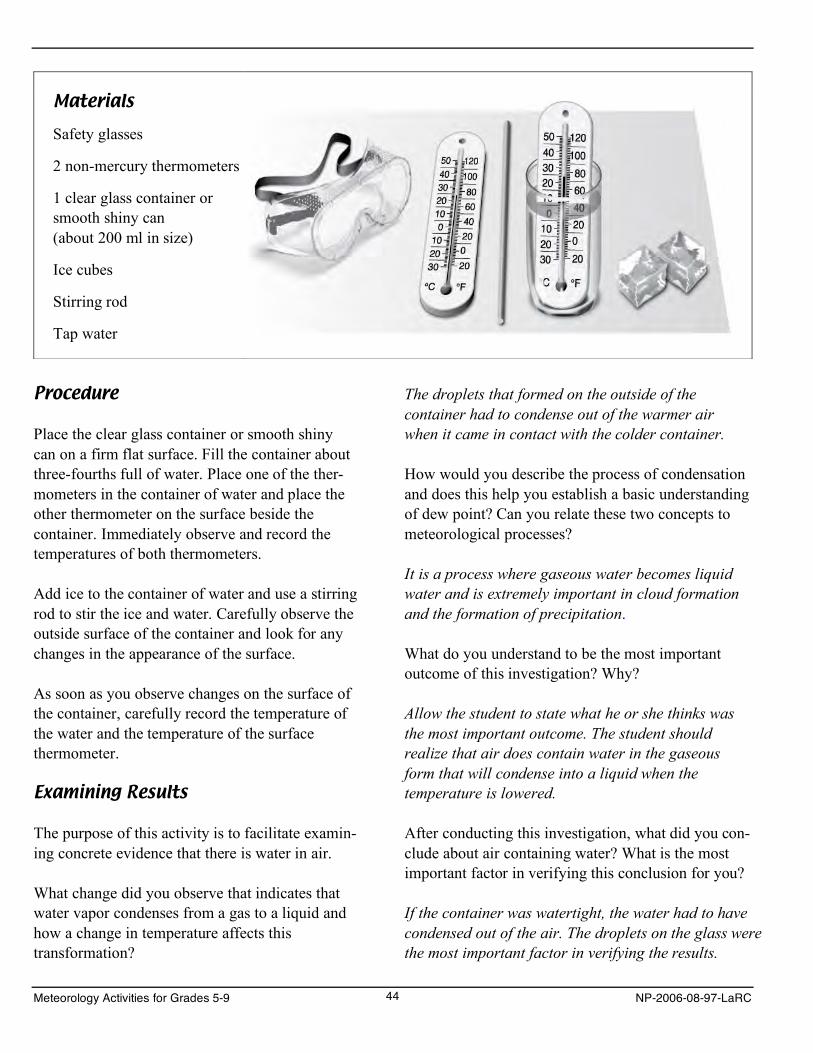
Materials
Safety glasses
2 non-mercury thermometers
1 clear glass container or smooth shiny can (about 200 ml in size)
Ice cubes
Stirring rod
Tap water
Procedure
Place the clear glass container or smooth shiny can on a firm flat surface. Fill the container about three-fourths full of water. Place one of the ther-mometers in the container of water and place the other thermometer on the surface beside the container. Immediately observe and record the temperatures of both thermometers.
Add ice to the container of water and use a stirring rod to stir the ice and water. Carefully observe the outside surface of the container and look for any changes in the appearance of the surface.
As soon as you observe changes on the surface of the container, carefully record the temperature of the water and the temperature of the surface thermometer.
Examining Results
The purpose of this activity is to facilitate examin-ing concrete evidence that there is water in air.
What change did you observe that indicates that water vapor condenses from a gas to a liquid and how a change in temperature affects this transformation?
The droplets that formed on the outside of the container had to condense out of the warmer air when it came in contact with the colder container.
How would you describe the process of condensation and does this help you establish a basic understanding of dew point? Can you relate these two concepts to meteorological processes?
It is a process where gaseous water becomes liquid water and is extremely important in cloud formation and the formation of precipitation.
What do you understand to be the most important outcome of this investigation? Why?
Allow the student to state what he or she thinks was the most important outcome. The student should realize that air does contain water in the gaseous form that will condense into a liquid when the temperature is lowered.
After conducting this investigation, what did you con-clude about air containing water? What is the most important factor in verifying this conclusion for you?
If the container was watertight, the water had to have condensed out of the air. The droplets on the glass were the most important factor in verifying the results.
Meteorology Activities for Grades 5-9 44 NP-2006-08-97-LaRC
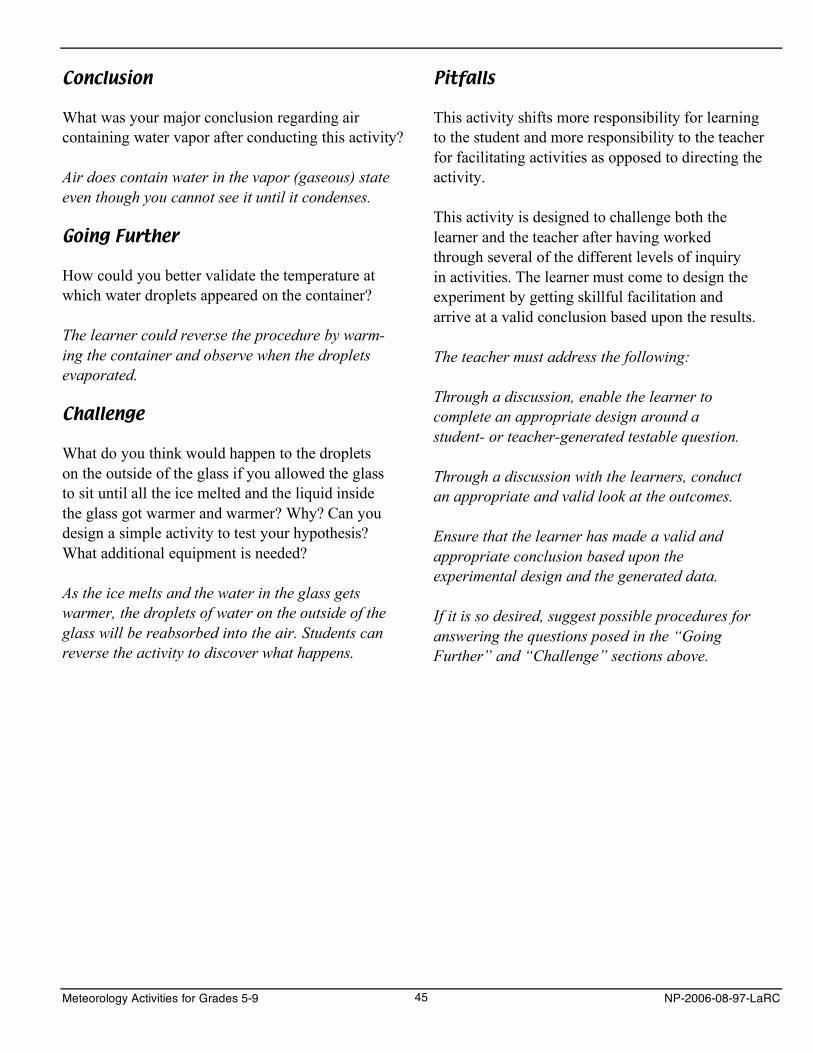
Conclusion
What was your major conclusion regarding air containing water vapor after conducting this activity?
Air does contain water in the vapor (gaseous) state even though you cannot see it until it condenses.
Going Further
How could you better validate the temperature at which water droplets appeared on the container?
The learner could reverse the procedure by warm-ing the container and observe when the droplets evaporated.
Challenge
What do you think would happen to the droplets on the outside of the glass if you allowed the glass to sit until all the ice melted and the liquid inside the glass got warmer and warmer? Why? Can you design a simple activity to test your hypothesis? What additional equipment is needed?
As the ice melts and the water in the glass gets warmer, the droplets of water on the outside of the glass will be reabsorbed into the air. Students can reverse the activity to discover what happens.
Pitfalls
This activity shifts more responsibility for learning to the student and more responsibility to the teacher for facilitating activities as opposed to directing the activity.
This activity is designed to challenge both the learner and the teacher after having worked through several of the different levels of inquiry in activities. The learner must come to design the experiment by getting skillful facilitation and arrive at a valid conclusion based upon the results.
The teacher must address the following:
Through a discussion, enable the learner to complete an appropriate design around a student- or teacher-generated testable question.
Through a discussion with the learners, conduct an appropriate and valid look at the outcomes.
Ensure that the learner has made a valid and appropriate conclusion based upon the experimental design and the generated data.
If it is so desired, suggest possible procedures for answering the questions posed in the “Going Further” and “Challenge” sections above.
Meteorology Activities for Grades 5-9 45 NP-2006-08-97-LaRC

This Page for Notes
Meteorology Activities for Grades 5-9 46 NP-2006-08-97-LaRC
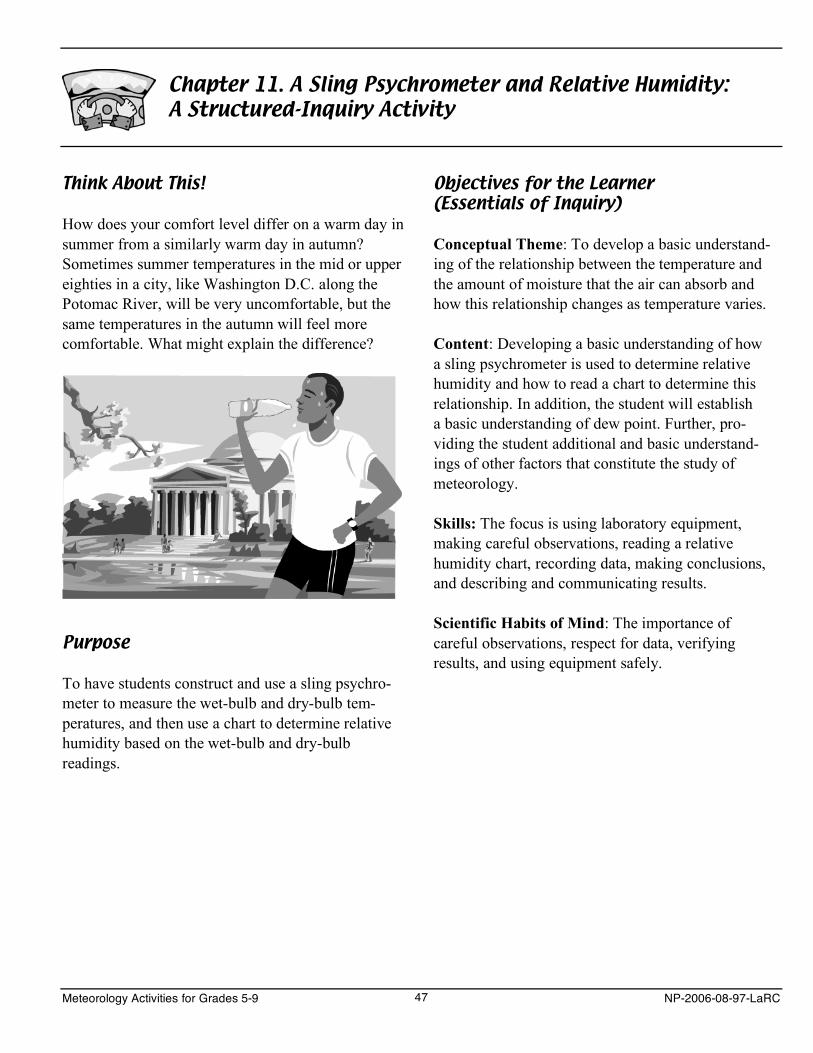
Chapter 11. A Sling Psychrometer and Relative Humidity: A Structured-Inquiry Activity
Think About This!
How does your comfort level differ on a warm day in summer from a similarly warm day in autumn? Sometimes summer temperatures in the mid or upper eighties in a city, like Washington D.C. along the Potomac River, will be very uncomfortable, but the same temperatures in the autumn will feel more comfortable. What might explain the difference?
Purpose
To have students construct and use a sling psychro-meter to measure the wet-bulb and dry-bulb tem-peratures, and then use a chart to determine relative humidity based on the wet-bulb and dry-bulb readings.
Objectives for the Learner (Essentials of Inquiry)
Conceptual Theme: To develop a basic understand-ing of the relationship between the temperature and the amount of moisture that the air can absorb and how this relationship changes as temperature varies.
Content: Developing a basic understanding of how a sling psychrometer is used to determine relative humidity and how to read a chart to determine this relationship. In addition, the student will establish a basic understanding of dew point. Further, pro-viding the student additional and basic understand-ings of other factors that constitute the study of meteorology.
Skills: The focus is using laboratory equipment, making careful observations, reading a relative humidity chart, recording data, making conclusions, and describing and communicating results.
Scientific Habits of Mind: The importance of careful observations, respect for data, verifying results, and using equipment safely.
Meteorology Activities for Grades 5-9 47 NP-2006-08-97-LaRC
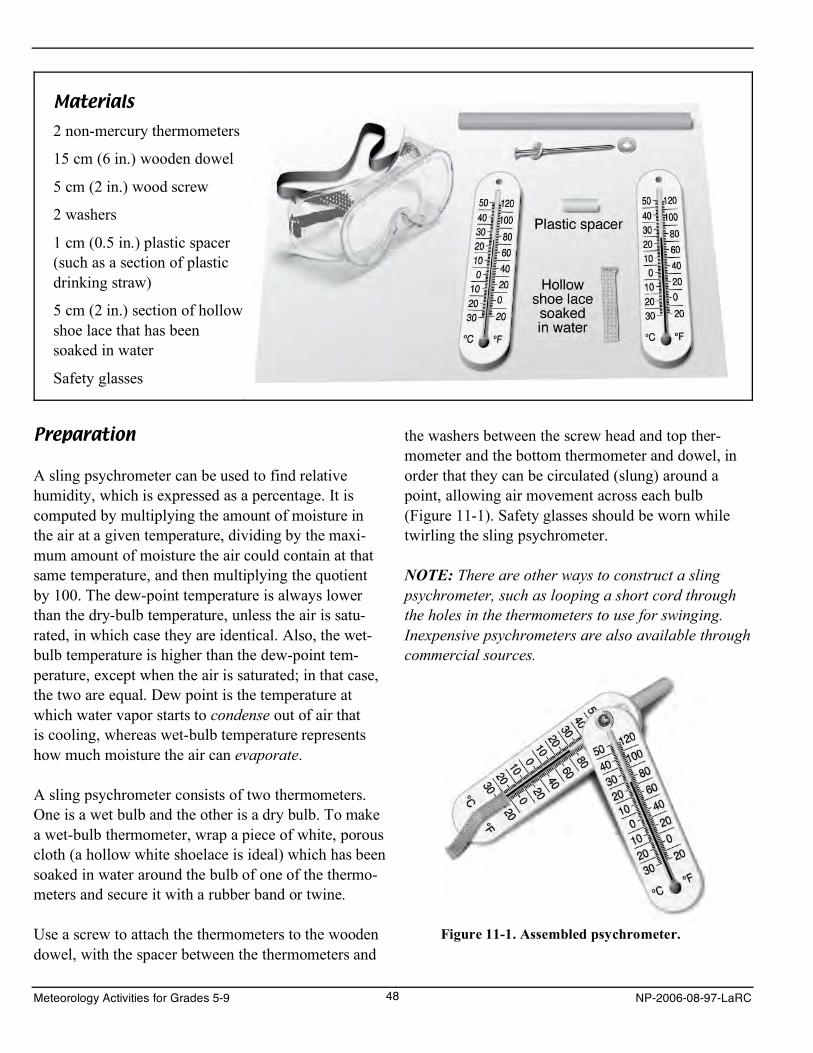
Materials 2 non-mercury thermometers
15 cm (6 in.) wooden dowel
5 cm (2 in.) wood screw
2 washers
1 cm (0.5 in.) plastic spacer (such as a section of plastic drinking straw)
5 cm (2 in.) section of hollow shoe lace that has been soaked in water
Safety glasses
Preparation
A sling psychrometer can be used to find relative humidity, which is expressed as a percentage. It is computed by multiplying the amount of moisture in the air at a given temperature, dividing by the maxi-mum amount of moisture the air could contain at that same temperature, and then multiplying the quotient by 100. The dew-point temperature is always lower than the dry-bulb temperature, unless the air is satu-rated, in which case they are identical. Also, the wet-bulb temperature is higher than the dew-point tem-perature, except when the air is saturated; in that case, the two are equal. Dew point is the temperature at which water vapor starts to condense out of air that is cooling, whereas wet-bulb temperature represents how much moisture the air can evaporate.
A sling psychrometer consists of two thermometers. One is a wet bulb and the other is a dry bulb. To make a wet-bulb thermometer, wrap a piece of white, porous cloth (a hollow white shoelace is ideal) which has been soaked in water around the bulb of one of the thermo-meters and secure it with a rubber band or twine.
Use a screw to attach the thermometers to the wooden dowel, with the spacer between the thermometers and
the washers between the screw head and top ther-mometer and the bottom thermometer and dowel, in order that they can be circulated (slung) around a point, allowing air movement across each bulb (Figure 11-1). Safety glasses should be worn while twirling the sling psychrometer.
NOTE: There are other ways to construct a sling psychrometer, such as looping a short cord through the holes in the thermometers to use for swinging. Inexpensive psychrometers are also available through commercial sources.
Figure 11-1. Assembled psychrometer.
Meteorology Activities for Grades 5-9 48 NP-2006-08-97-LaRC
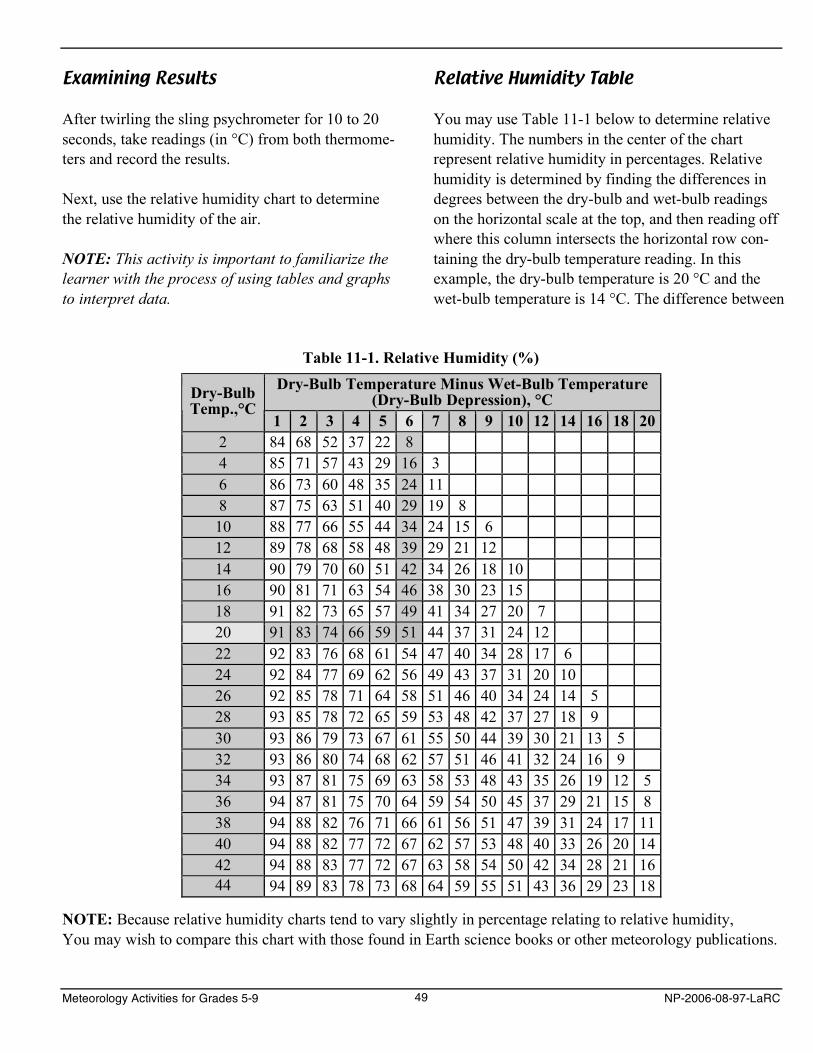
Examining Results
After twirling the sling psychrometer for 10 to 20 seconds, take readings (in °C) from both thermome-ters and record the results.
Next, use the relative humidity chart to determine the relative humidity of the air.
NOTE: This activity is important to familiarize the learner with the process of using tables and graphs to interpret data.
Relative Humidity Table
You may use Table 11-1 below to determine relative humidity. The numbers in the center of the chart represent relative humidity in percentages. Relative humidity is determined by finding the differences in degrees between the dry-bulb and wet-bulb readings on the horizontal scale at the top, and then reading off where this column intersects the horizontal row con-taining the dry-bulb temperature reading. In this example, the dry-bulb temperature is 20 °C and the wet-bulb temperature is 14 °C. The difference between
Table 11-1. Relative Humidity (%) Dry-Bulb Temperature Minus Wet-Bulb Temperature
(Dry-Bulb Depression), °C Dry-Bulb Temp.,°C
1 2 3 4 5 6 7 8 9 10 12 14 16 18 20 2 84 68 52 37 22 8 4 85 71 57 43 29 16 3 6 86 73 60 48 35 24 11 8 87 75 63 51 40 29 19 8 10 88 77 66 55 44 34 24 15 6 12 89 78 68 58 48 39 29 21 12 14 90 79 70 60 51 42 34 26 18 10 16 90 81 71 63 54 46 38 30 23 15 18 91 82 73 65 57 49 41 34 27 20 7 20 91 83 74 66 59 51 44 37 31 24 12 22 92 83 76 68 61 54 47 40 34 28 17 6 24 92 84 77 69 62 56 49 43 37 31 20 10 26 92 85 78 71 64 58 51 46 40 34 24 14 5 28 93 85 78 72 65 59 53 48 42 37 27 18 9 30 93 86 79 73 67 61 55 50 44 39 30 21 13 5 32 93 86 80 74 68 62 57 51 46 41 32 24 16 9 34 93 87 81 75 69 63 58 53 48 43 35 26 19 12 5 36 94 87 81 75 70 64 59 54 50 45 37 29 21 15 8 38 94 88 82 76 71 66 61 56 51 47 39 31 24 17 11 40 94 88 82 77 72 67 62 57 53 48 40 33 26 20 14 42 94 88 83 77 72 67 63 58 54 50 42 34 28 21 16 44 94 89 83 78 73 68 64 59 55 51 43 36 29 23 18
NOTE: Because relative humidity charts tend to vary slightly in percentage relating to relative humidity,You may wish to compare this chart with those found in Earth science books or other meteorology publications.
Meteorology Activities for Grades 5-9 49 NP-2006-08-97-LaRC
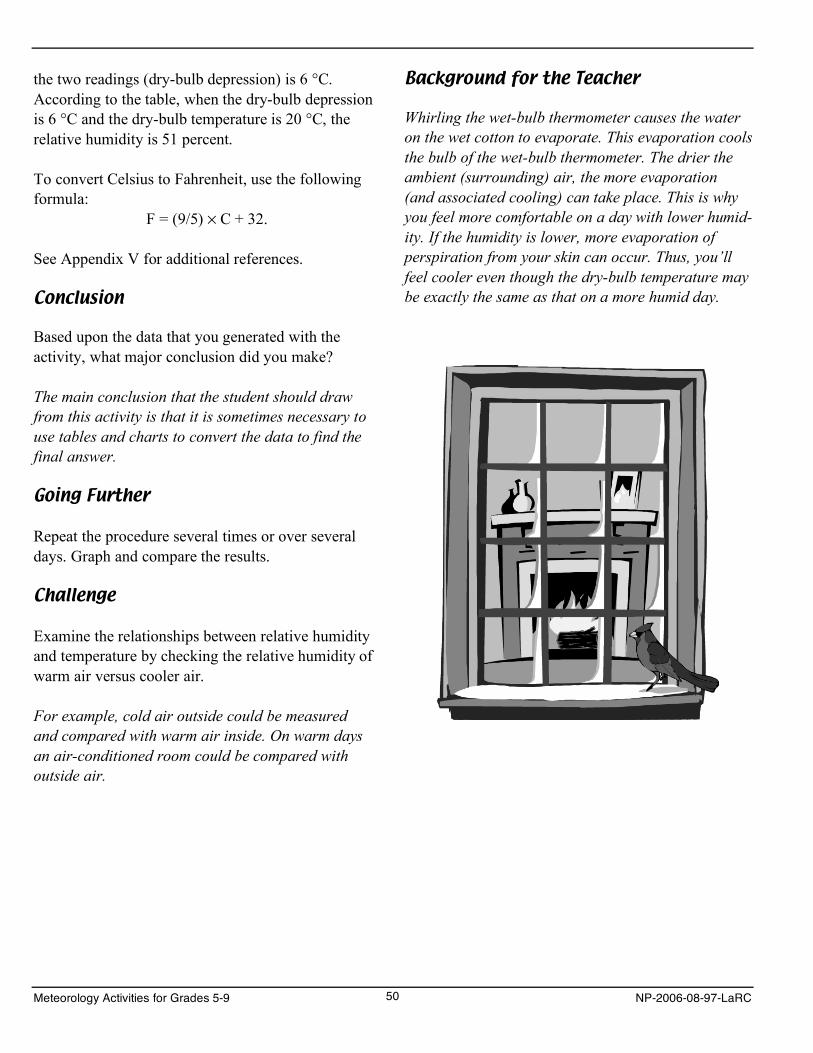
the two readings (dry-bulb depression) is 6 °C. According to the table, when the dry-bulb depression is 6 °C and the dry-bulb temperature is 20 °C, the relative humidity is 51 percent.
To convert Celsius to Fahrenheit, use the following formula:
F = (9/5) × C + 32.
See Appendix V for additional references.
Conclusion
Based upon the data that you generated with the activity, what major conclusion did you make?
The main conclusion that the student should draw from this activity is that it is sometimes necessary to use tables and charts to convert the data to find the final answer.
Going Further
Repeat the procedure several times or over several days. Graph and compare the results.
Challenge
Examine the relationships between relative humidity and temperature by checking the relative humidity of warm air versus cooler air.
For example, cold air outside could be measured and compared with warm air inside. On warm days an air-conditioned room could be compared with outside air.
Background for the Teacher
Whirling the wet-bulb thermometer causes the water on the wet cotton to evaporate. This evaporation cools the bulb of the wet-bulb thermometer. The drier the ambient (surrounding) air, the more evaporation (and associated cooling) can take place. This is why you feel more comfortable on a day with lower humid-ity. If the humidity is lower, more evaporation of perspiration from your skin can occur. Thus, you’ll feel cooler even though the dry-bulb temperature may be exactly the same as that on a more humid day.
Meteorology Activities for Grades 5-9 50 NP-2006-08-97-LaRC
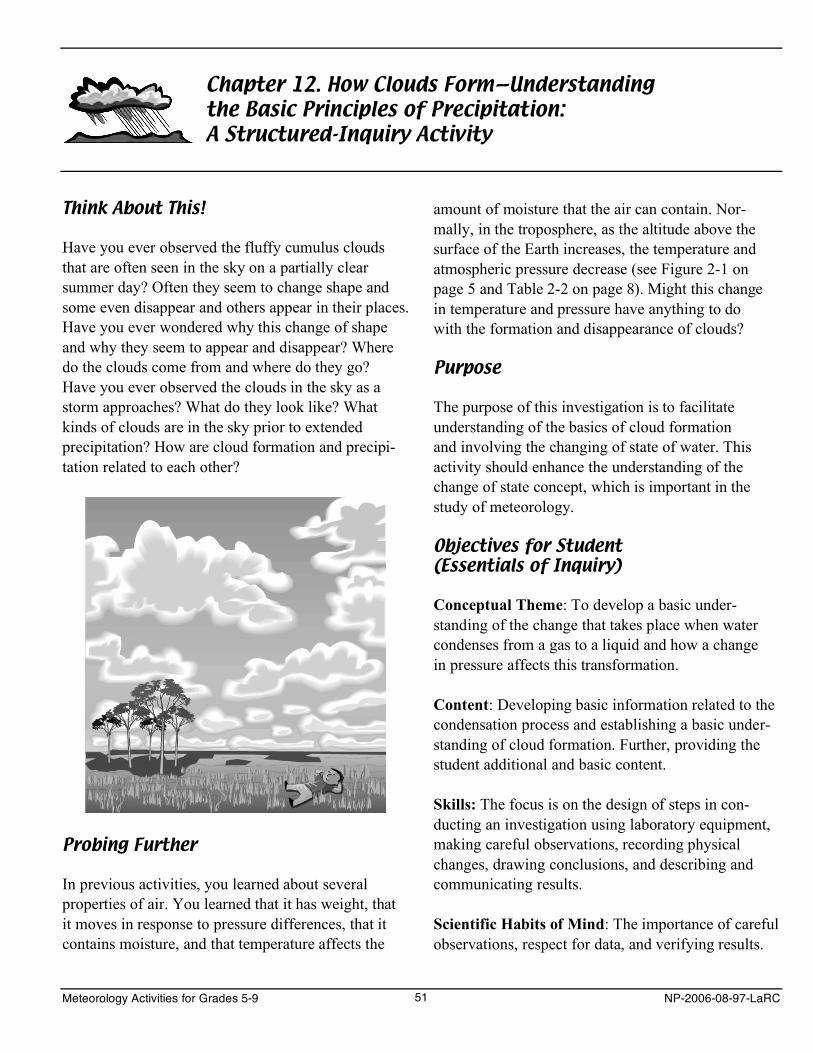
Chapter 12. How Clouds Form—Understanding the Basic Principles of Precipitation: A Structured-Inquiry Activity
Think About This!
Have you ever observed the fluffy cumulus clouds that are often seen in the sky on a partially clear summer day? Often they seem to change shape and some even disappear and others appear in their places. Have you ever wondered why this change of shape and why they seem to appear and disappear? Where do the clouds come from and where do they go? Have you ever observed the clouds in the sky as a storm approaches? What do they look like? What kinds of clouds are in the sky prior to extended precipitation? How are cloud formation and precipi-tation related to each other?
Probing Further
In previous activities, you learned about several properties of air. You learned that it has weight, that it moves in response to pressure differences, that it contains moisture, and that temperature affects the
amount of moisture that the air can contain. Nor-mally, in the troposphere, as the altitude above the surface of the Earth increases, the temperature and atmospheric pressure decrease (see Figure 2-1 on page 5 and Table 2-2 on page 8). Might this change in temperature and pressure have anything to do with the formation and disappearance of clouds?
Purpose
The purpose of this investigation is to facilitate understanding of the basics of cloud formation and involving the changing of state of water. This activity should enhance the understanding of the change of state concept, which is important in the study of meteorology.
Objectives for Student (Essentials of Inquiry)
Conceptual Theme: To develop a basic under-standing of the change that takes place when water condenses from a gas to a liquid and how a change in pressure affects this transformation.
Content: Developing basic information related to the condensation process and establishing a basic under-standing of cloud formation. Further, providing the student additional and basic content.
Skills: The focus is on the design of steps in con-ducting an investigation using laboratory equipment, making careful observations, recording physical changes, drawing conclusions, and describing and communicating results.
Scientific Habits of Mind: The importance of careful observations, respect for data, and verifying results.
Meteorology Activities for Grades 5-9 51 NP-2006-08-97-LaRC
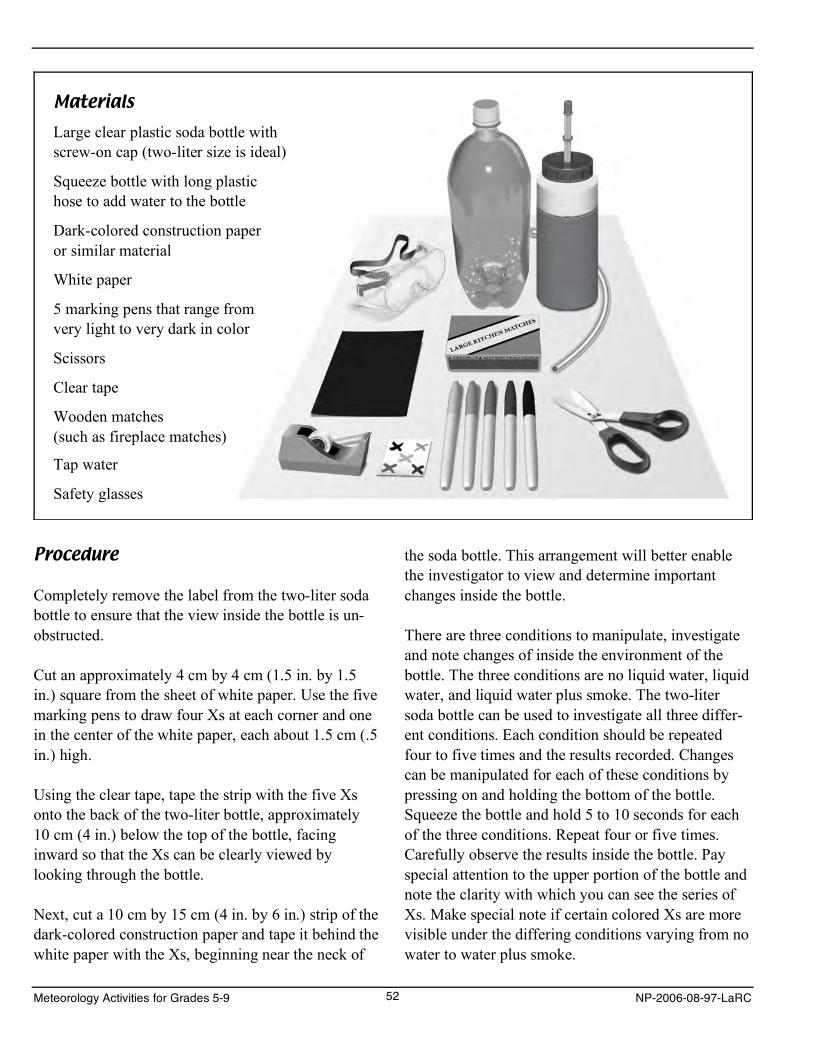
Materials Large clear plastic soda bottle with screw-on cap (two-liter size is ideal)
Squeeze bottle with long plastic hose to add water to the bottle
Dark-colored construction paper or similar material
White paper
5 marking pens that range from very light to very dark in color
Scissors
Clear tape
Wooden matches (such as fireplace matches)
Tap water
Safety glasses
Procedure
Completely remove the label from the two-liter soda bottle to ensure that the view inside the bottle is un-obstructed.
Cut an approximately 4 cm by 4 cm (1.5 in. by 1.5 in.) square from the sheet of white paper. Use the five marking pens to draw four Xs at each corner and one in the center of the white paper, each about 1.5 cm (.5 in.) high.
Using the clear tape, tape the strip with the five Xs onto the back of the two-liter bottle, approximately 10 cm (4 in.) below the top of the bottle, facing inward so that the Xs can be clearly viewed by looking through the bottle.
Next, cut a 10 cm by 15 cm (4 in. by 6 in.) strip of the dark-colored construction paper and tape it behind the white paper with the Xs, beginning near the neck of
the soda bottle. This arrangement will better enable the investigator to view and determine important changes inside the bottle.
There are three conditions to manipulate, investigate and note changes of inside the environment of the bottle. The three conditions are no liquid water, liquid water, and liquid water plus smoke. The two-liter soda bottle can be used to investigate all three differ-ent conditions. Each condition should be repeated four to five times and the results recorded. Changes can be manipulated for each of these conditions by pressing on and holding the bottom of the bottle. Squeeze the bottle and hold 5 to 10 seconds for each of the three conditions. Repeat four or five times. Carefully observe the results inside the bottle. Pay special attention to the upper portion of the bottle and note the clarity with which you can see the series of Xs. Make special note if certain colored Xs are more visible under the differing conditions varying from no water to water plus smoke.
Meteorology Activities for Grades 5-9 52 NP-2006-08-97-LaRC
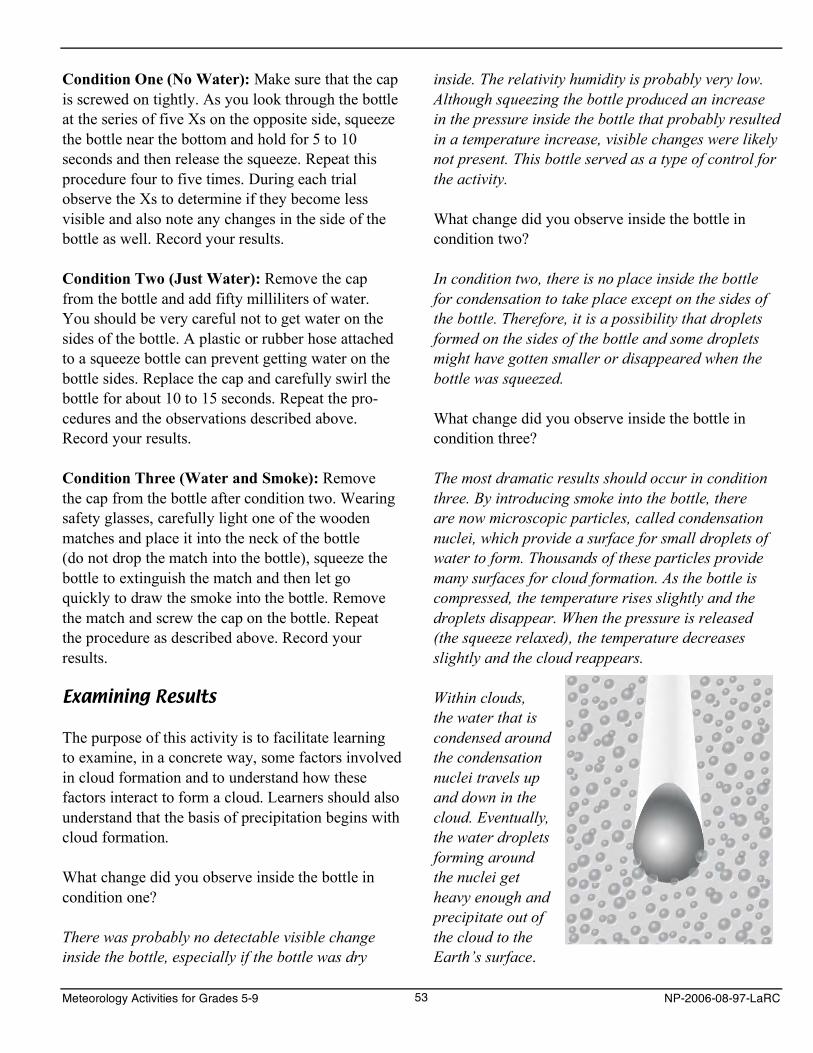
Condition One (No Water): Make sure that the cap is screwed on tightly. As you look through the bottle at the series of five Xs on the opposite side, squeeze the bottle near the bottom and hold for 5 to 10 seconds and then release the squeeze. Repeat this procedure four to five times. During each trial observe the Xs to determine if they become less visible and also note any changes in the side of the bottle as well. Record your results.
Condition Two (Just Water): Remove the cap from the bottle and add fifty milliliters of water. You should be very careful not to get water on the sides of the bottle. A plastic or rubber hose attached to a squeeze bottle can prevent getting water on the bottle sides. Replace the cap and carefully swirl the bottle for about 10 to 15 seconds. Repeat the pro-cedures and the observations described above. Record your results.
Condition Three (Water and Smoke): Remove the cap from the bottle after condition two. Wearing safety glasses, carefully light one of the wooden matches and place it into the neck of the bottle (do not drop the match into the bottle), squeeze the bottle to extinguish the match and then let go quickly to draw the smoke into the bottle. Remove the match and screw the cap on the bottle. Repeat the procedure as described above. Record your results.
Examining Results
The purpose of this activity is to facilitate learning to examine, in a concrete way, some factors involved in cloud formation and to understand how these factors interact to form a cloud. Learners should also understand that the basis of precipitation begins with cloud formation.
What change did you observe inside the bottle in condition one?
There was probably no detectable visible change inside the bottle, especially if the bottle was dry
inside. The relativity humidity is probably very low. Although squeezing the bottle produced an increase in the pressure inside the bottle that probably resulted in a temperature increase, visible changes were likely not present. This bottle served as a type of control for the activity.
What change did you observe inside the bottle in condition two?
In condition two, there is no place inside the bottle for condensation to take place except on the sides of the bottle. Therefore, it is a possibility that droplets formed on the sides of the bottle and some droplets might have gotten smaller or disappeared when the bottle was squeezed.
What change did you observe inside the bottle in condition three?
The most dramatic results should occur in condition three. By introducing smoke into the bottle, there are now microscopic particles, called condensation nuclei, which provide a surface for small droplets of water to form. Thousands of these particles provide many surfaces for cloud formation. As the bottle is compressed, the temperature rises slightly and the droplets disappear. When the pressure is released (the squeeze relaxed), the temperature decreases slightly and the cloud reappears.
Within clouds, the water that is condensed around the condensation nuclei travels up and down in the cloud. Eventually, the water droplets forming around the nuclei get heavy enough and precipitate out of the cloud to the Earth’s surface.
Meteorology Activities for Grades 5-9 53 NP-2006-08-97-LaRC
Conclusion
What major conclusion did you draw about conditions for cloud formation after conducting this activity?
The conclusions should be based upon the results. Very likely a cloud formed only in the bottle where the smoke was introduced (condensation nuclei). A logical conclusion would be that some particles are essential for water to condense and form a cloud.
Going Further
How could you better validate that “condensation nuclei” are an essential part cloud formation?
Repeat the procedure several times using fine dust as particles and repeat several times without using any particles. Chalk dust or fireplace ash is useful.
Challenge
What do you think happens inside a cloud to get pre-cipitation (droplets) to fall to the Earth in the form of rain, snow or even hail? What do you think are the conditions that ultimately determine which form of precipitation finally reaches the surface of the Earth. You might want to discuss this with your teacher or to do some further research.
Have the learner select one or more of these questions to research and prepare a written report.
Meteorology Activities for Grades 5-9 54 NP-2006-08-97-LaRC
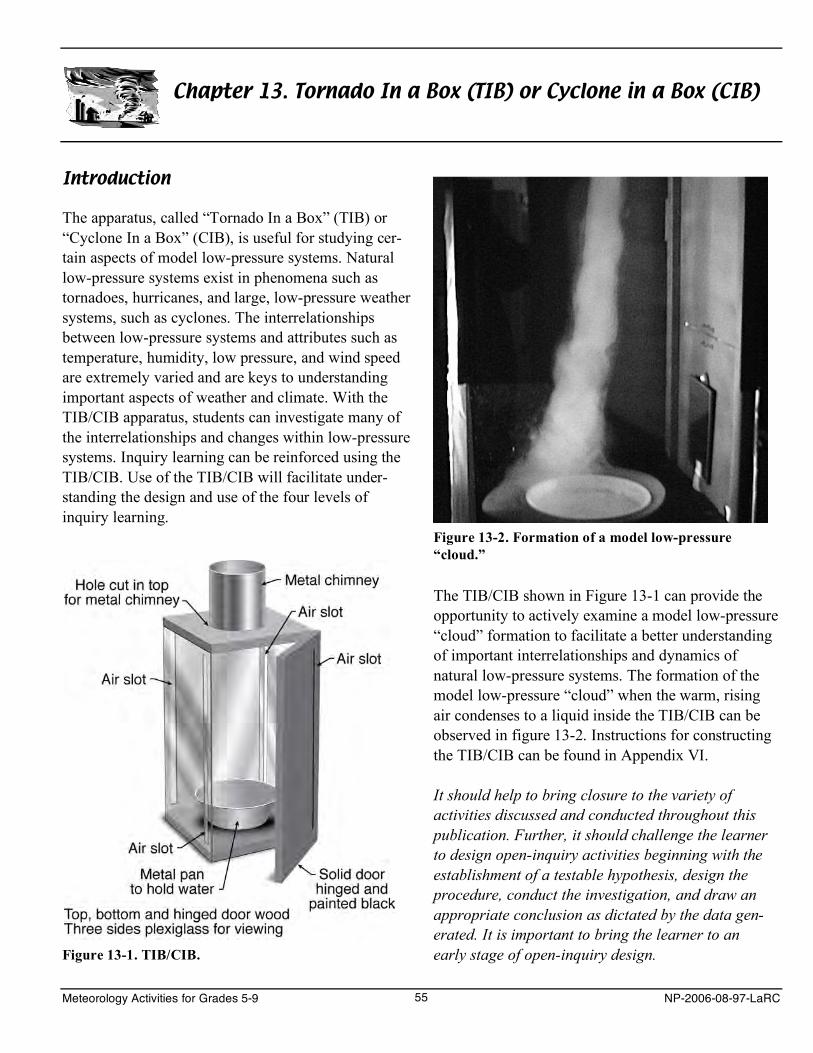
Chapter 13. Tornado In a Box (TIB) or Cyclone in a Box (CIB)
Introduction
The apparatus, called “Tornado In a Box” (TIB) or “Cyclone In a Box” (CIB), is useful for studying cer-tain aspects of model low-pressure systems. Natural low-pressure systems exist in phenomena such as tornadoes, hurricanes, and large, low-pressure weather systems, such as cyclones. The interrelationships between low-pressure systems and attributes such as temperature, humidity, low pressure, and wind speed are extremely varied and are keys to understanding important aspects of weather and climate. With the TIB/CIB apparatus, students can investigate many of the interrelationships and changes within low-pressure systems. Inquiry learning can be reinforced using the TIB/CIB. Use of the TIB/CIB will facilitate under-standing the design and use of the four levels of inquiry learning.
Figure 13-1. TIB/CIB.
Figure 13-2. Formation of a model low-pressure “cloud.”
The TIB/CIB shown in Figure 13-1 can provide the opportunity to actively examine a model low-pressure “cloud” formation to facilitate a better understanding of important interrelationships and dynamics of natural low-pressure systems. The formation of the model low-pressure “cloud” when the warm, rising air condenses to a liquid inside the TIB/CIB can be observed in figure 13-2. Instructions for constructing the TIB/CIB can be found in Appendix VI.
It should help to bring closure to the variety of activities discussed and conducted throughout this publication. Further, it should challenge the learner to design open-inquiry activities beginning with the establishment of a testable hypothesis, design the procedure, conduct the investigation, and draw an appropriate conclusion as dictated by the data gen-erated. It is important to bring the learner to an early stage of open-inquiry design.
Meteorology Activities for Grades 5-9 55 NP-2006-08-97-LaRC
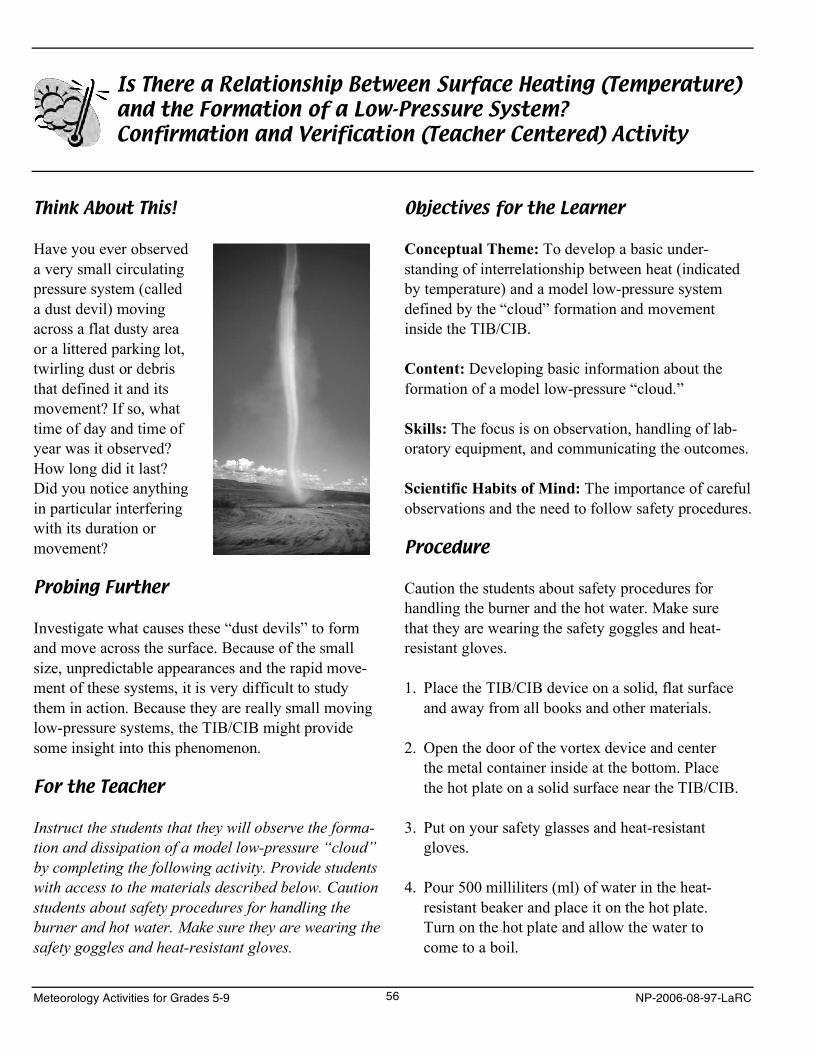
Is There a Relationship Between Surface Heating (Temperature)and the Formation of a Low-Pressure System?Confirmation and Verification (Teacher Centered) Activity
Think About This!
Have you ever observed a very small circulating pressure system (called a dust devil) moving across a flat dusty area or a littered parking lot, twirling dust or debris that defined it and its movement? If so, what time of day and time of year was it observed? How long did it last? Did you notice anything in particular interfering with its duration or movement?
Probing Further
Investigate what causes these “dust devils” to form and move across the surface. Because of the small size, unpredictable appearances and the rapid move-ment of these systems, it is very difficult to study them in action. Because they are really small moving low-pressure systems, the TIB/CIB might provide some insight into this phenomenon.
For the Teacher
Instruct the students that they will observe the forma-tion and dissipation of a model low-pressure “cloud” by completing the following activity. Provide students with access to the materials described below. Caution students about safety procedures for handling the burner and hot water. Make sure they are wearing the safety goggles and heat-resistant gloves.
Objectives for the Learner
Conceptual Theme: To develop a basic under-standing of interrelationship between heat (indicated by temperature) and a model low-pressure system defined by the “cloud” formation and movement inside the TIB/CIB.
Content: Developing basic information about the formation of a model low-pressure “cloud.”
Skills: The focus is on observation, handling of lab-oratory equipment, and communicating the outcomes.
Scientific Habits of Mind: The importance of careful observations and the need to follow safety procedures.
Procedure
Caution the students about safety procedures for handling the burner and the hot water. Make sure that they are wearing the safety goggles and heat-resistant gloves.
1. Place the TIB/CIB device on a solid, flat surface and away from all books and other materials.
2. Open the door of the vortex device and center the metal container inside at the bottom. Place the hot plate on a solid surface near the TIB/CIB.
3. Put on your safety glasses and heat-resistant gloves.
4. Pour 500 milliliters (ml) of water in the heat-resistant beaker and place it on the hot plate. Turn on the hot plate and allow the water to come to a boil.
Meteorology Activities for Grades 5-9 56 NP-2006-08-97-LaRC
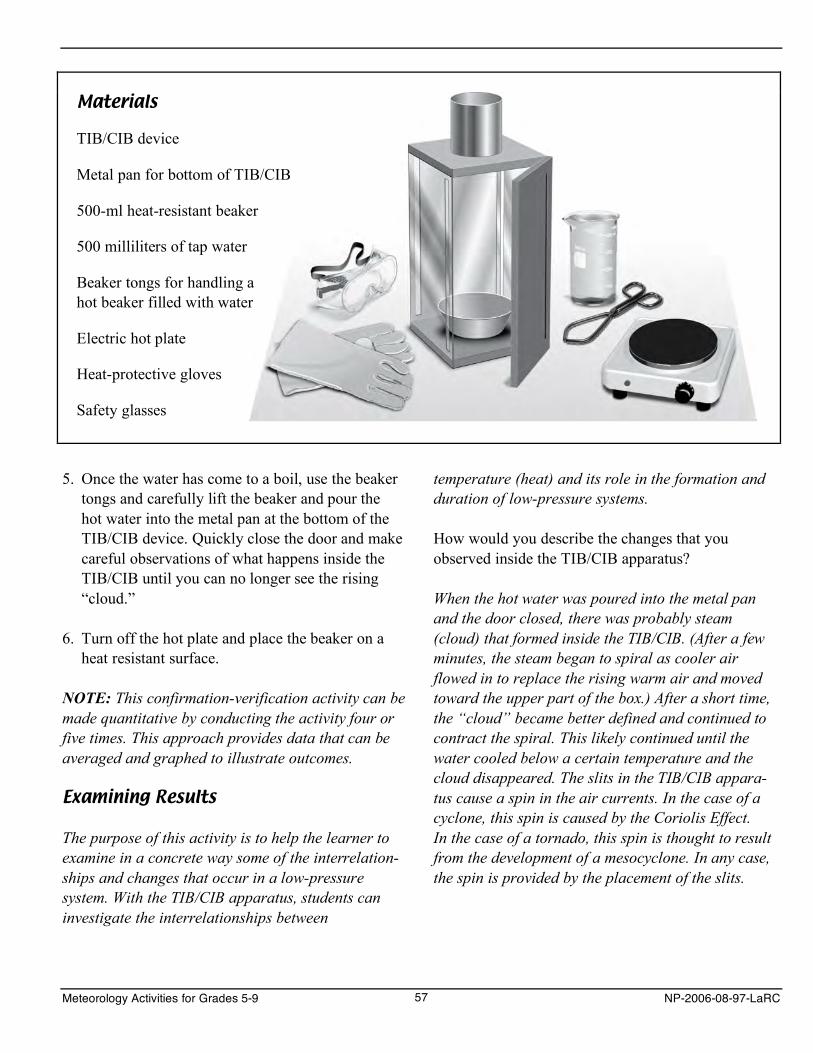
Materials
TIB/CIB device
Metal pan for bottom of TIB/CIB
500-ml heat-resistant beaker
500 milliliters of tap water
Beaker tongs for handling a hot beaker filled with water
Electric hot plate
Heat-protective gloves
Safety glasses
5. Once the water has come to a boil, use the beaker tongs and carefully lift the beaker and pour the hot water into the metal pan at the bottom of the TIB/CIB device. Quickly close the door and make careful observations of what happens inside the TIB/CIB until you can no longer see the rising “cloud.”
6. Turn off the hot plate and place the beaker on a heat resistant surface.
NOTE: This confirmation-verification activity can be made quantitative by conducting the activity four or five times. This approach provides data that can be averaged and graphed to illustrate outcomes.
Examining Results
The purpose of this activity is to help the learner to examine in a concrete way some of the interrelation-ships and changes that occur in a low-pressure system. With the TIB/CIB apparatus, students can investigate the interrelationships between
temperature (heat) and its role in the formation and duration of low-pressure systems.
How would you describe the changes that you observed inside the TIB/CIB apparatus?
When the hot water was poured into the metal pan and the door closed, there was probably steam (cloud) that formed inside the TIB/CIB. (After a few minutes, the steam began to spiral as cooler air flowed in to replace the rising warm air and moved toward the upper part of the box.) After a short time, the “cloud” became better defined and continued to contract the spiral. This likely continued until the water cooled below a certain temperature and the cloud disappeared. The slits in the TIB/CIB appara-tus cause a spin in the air currents. In the case of a cyclone, this spin is caused by the Coriolis Effect. In the case of a tornado, this spin is thought to result from the development of a mesocyclone. In any case, the spin is provided by the placement of the slits.
Meteorology Activities for Grades 5-9 57 NP-2006-08-97-LaRC
Do you have any evidence that temperature had an effect on the formation and the duration of a low-pressure system? Explain.
The student might infer that the temperature had an effect on both the formation and duration of the low-pressure system (the spiraling cloud), but there is little or no valid evidence from just this activity. More activities can be conducted to produce such evidence.
How could you further verify the relationships between temperature and duration?
Conduct a series of experiments that vary the temperature. Time the duration of the spiraling cloud at the various temperatures and compare the results.
Conclusion
After conducting this activity, what major conclu-sion did you draw, regarding relationship between temperature and conditions for low-pressure system development as illustrated by cloud formation and its movement inside the TIB/CIB?
The activity helps to illustrate the important relation-ship between heat (indicated by temperature) and a model low-pressure system defined by the “cloud” formation and its spiral movement inside the TIB/CIB.
Going Further
How could you better validate the important inter-relationship between heat (temperature) and the formation of the TIB/CIB low-pressure phenomena?
Conduct a series of similar activities at varying water temperatures and time the duration of the model low-pressure system as defined by the formation and action of the cloud.
Challenge
Think of a series of other activities that you could perform to develop more evidence of the important interrelationships of heat and low-pressure system formation.
There is a variety of activities that could performed such as comparing different amounts of water at the same temperature and compare the duration; com-paring the same amount of water at different temper-atures and compare the duration; comparing various liquids such as salt water, fresh water, and distilled water using same amounts and same temperatures and compare duration; and many others.
Background for the Teacher
The apparatus called “Tornado in a Box” or “Cyclone in a Box” in the figures here is often used to demonstrate and depict the formation of tornadoes. However, it can also be used to study the factors associated with cloud formation in low-pressure systems, such as cyclones or hurri-canes. In the present context, the TIB/CIB device is used as a CIB model.
Meteorology Activities for Grades 5-9 58 NP-2006-08-97-LaRC
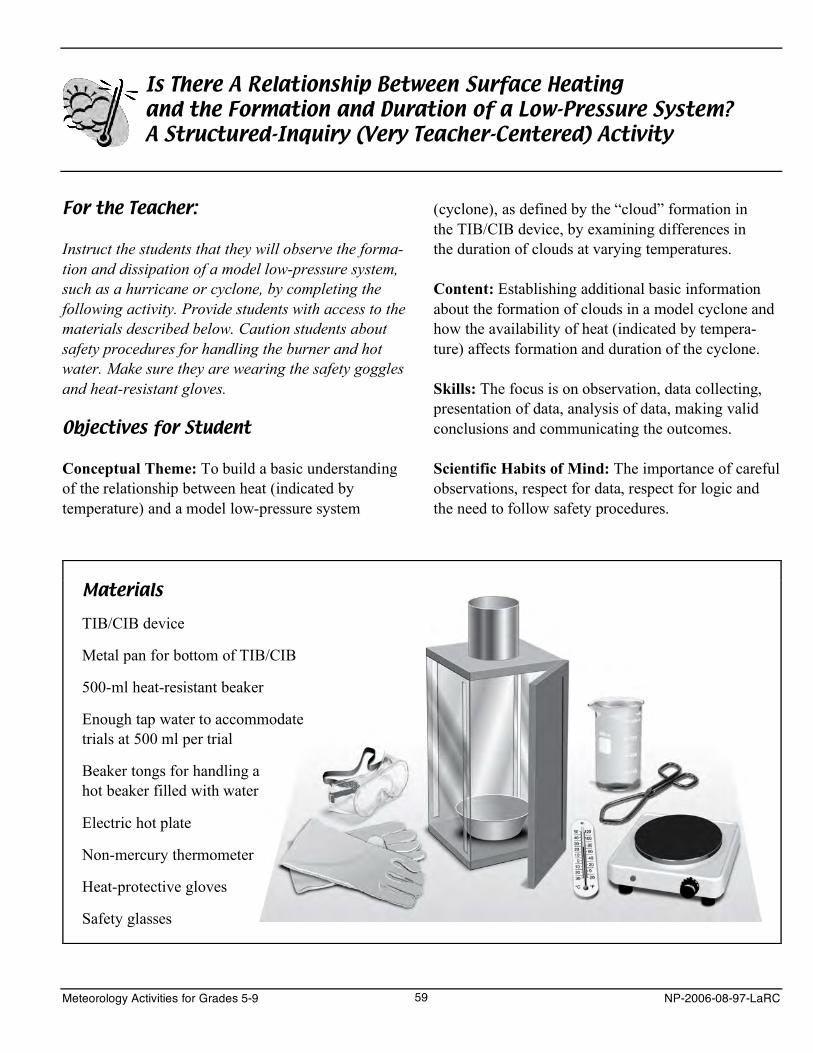
Is There A Relationship Between Surface Heating and the Formation and Duration of a Low-Pressure System? A Structured-Inquiry (Very Teacher-Centered) Activity
For the Teacher:
Instruct the students that they will observe the forma-tion and dissipation of a model low-pressure system, such as a hurricane or cyclone, by completing the following activity. Provide students with access to the materials described below. Caution students about safety procedures for handling the burner and hot water. Make sure they are wearing the safety goggles and heat-resistant gloves.
Objectives for Student
Conceptual Theme: To build a basic understanding of the relationship between heat (indicated by temperature) and a model low-pressure system
(cyclone), as defined by the “cloud” formation in the TIB/CIB device, by examining differences in the duration of clouds at varying temperatures.
Content: Establishing additional basic information about the formation of clouds in a model cyclone and how the availability of heat (indicated by tempera-ture) affects formation and duration of the cyclone.
Skills: The focus is on observation, data collecting, presentation of data, analysis of data, making valid conclusions and communicating the outcomes.
Scientific Habits of Mind: The importance of careful observations, respect for data, respect for logic and the need to follow safety procedures.
Materials
TIB/CIB device
Metal pan for bottom of TIB/CIB
500-ml heat-resistant beaker
Enough tap water to accommodate trials at 500 ml per trial
Beaker tongs for handling a hot beaker filled with water
Electric hot plate
Non-mercury thermometer
Heat-protective gloves
Safety glasses
Meteorology Activities for Grades 5-9 59 NP-2006-08-97-LaRC
Procedure for Conducting the Activity
Caution the students about safety procedures in han-dling the burner and the hot water. Make sure they are wearing the safety goggles and heat-resistant gloves.
Trial # 1 (100 °C)
1. Place the TIB/CIB device on a solid flat surface and away from all books and other flammable materials.
2. Open the door of the TIB/CIB and center the metal container inside at the bottom. Place the hot plate on a solid surface near the TIB/CIB device.
3. Put on your safety glasses and gloves.
4. Pour 500 ml of water in the heat-resistant beaker and place it on the hot plate.
5. Turn on the hot plate and allow the water to come to a boil (100 °C). Once the water has come to a boil, use the beaker tongs and carefully lift the beaker and pour the hot water into the metal pan at the bottom of the TIB/CIB device.
6. Quickly close the door and make careful obser-vations of the activity in the TIB/CIB device until you can no longer see the rising “cloud.” Record the duration of the rising cloud.
Trial # 1 can be repeated three or four times and the cloud duration noted, averaged and graphed to illustrate the results.
Trial #2 (90 ° C)
1. Repeat steps one through four of trial #1. Turn on the hot plate and allow the water to reach a temperature of 90 °C.
2. Once the water has reached a temperature of 90 °C, use the beaker tongs and carefully lift the beaker and pour the hot water into the metal pan at the bottom of the TIB/CIB device.
3. Quickly close the door and make careful observa-tions of what happens inside the TIB/CIB device until you can no longer see the rising “cloud.”
4. Record the results of the duration of the rising cloud.
Trial #2 can be repeated three or four times and the duration noted, averaged and graphed to illustrate the results.
Trial # 3 (60 °C)
1. Repeat steps one through four of trial #1. Turn on the hot plate and allow the water to reach a temperature of 60 °C.
2. Once the water has reached a temperature of 60 °C, use the beaker tongs and carefully lift the beaker and pour the hot water into the metal pan at the bottom of the TIB/CIB.
3. Quickly close the door and make careful observa-tions of what happens inside the TIB/CIB device until you can no longer see the rising “cloud.”
4. Record the results of the duration of the rising cloud.
Trial #3 can be repeated three or four times and the duration noted, averaged and graphed to illustrate the results.
Meteorology Activities for Grades 5-9 60 NP-2006-08-97-LaRC
Examining Results
The purpose of this activity is to facilitate the learning in a concrete way about how the differences in heat (indicated by temperature) can affect the duration of the model cyclone.
How students examine the results will depend upon the number of tests conducted at the three different trial levels. If they conduct more than one test at each of the three trial levels, they can average the results for each trial and compare the three trials graphically.
Conclusion
After conducting this activity, what major conclusion did you draw regarding the relationship between temperature and the duration of the low pressure system as illustrated by cloud formation and its dissipation?
If the students were careful in both observing and recording their observations of the duration, it is very likely that the duration of the cyclone as depicted by the persistence of the model “cloud” will be longer for the higher water temperature and shorter for the lower water temperature. However, the students should be encouraged to use the data to draw con-clusions. This helps to reinforce the scientific habits of mind “respect for data.” The results that vary from expectations can produce some important discussion and provide opportunities for new insights into an investigation. In this structured-inquiry activity, the learner was not sure about the outcome until the activity had been conducted. This developmental approach is beginning to shift responsibility for the learning to the learner and will be shifted more in the guided and open inquiry.
Going Further
How could you better validate the important relationship between heat (temperature) and the duration of the cyclone?
With increasing numbers of tests at the three trial levels, the more confident the experimenter should be in the average results obtained. Therefore, the learner should be encouraged to repeat a series of these tests at the different trial levels.
Challenge
Think of a series of other activities that you could perform to develop more evidence of the important relationships of heat and duration of the model cyclone.
Different conditions of the water (salt water, distilled water and so forth) could be tested with several trials at each trial level and compare the results.
Background for the Teacher
It is important to realize that the formation of torna-does is considerably different, in that the cloud is predominantly composed of dust and debris rather than condensed water vapor.
Meteorology Activities for Grades 5-9 61 NP-2006-08-97-LaRC
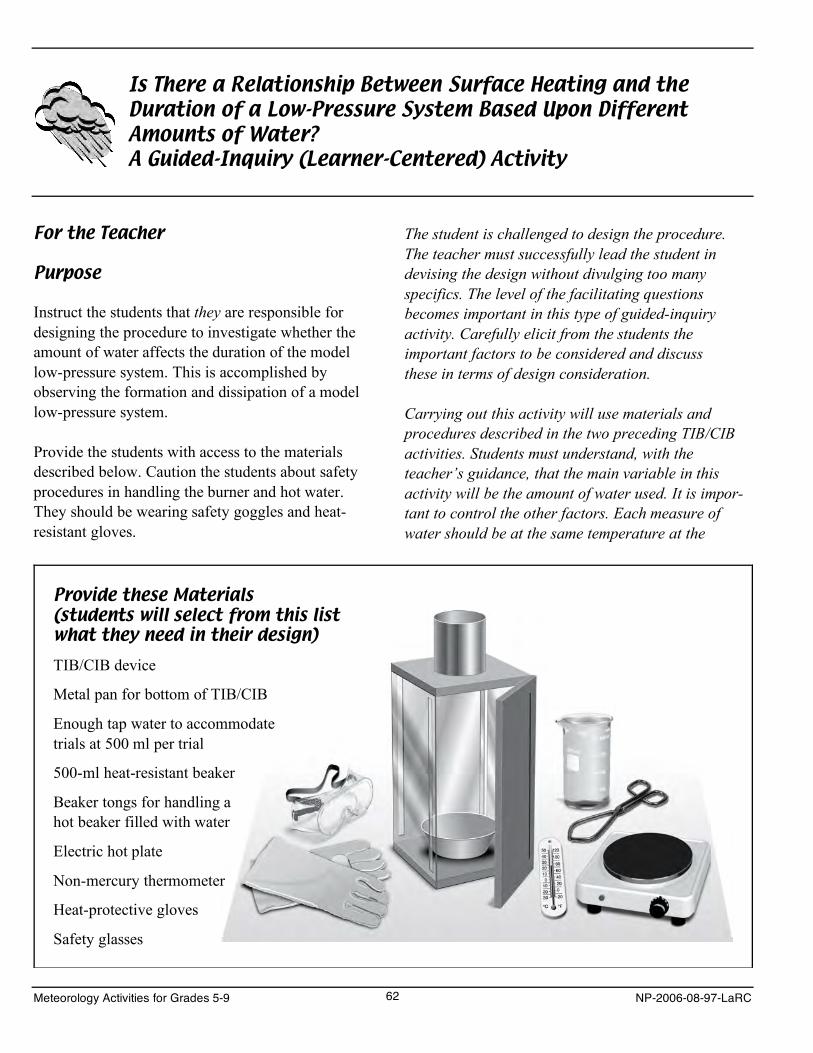
Is There a Relationship Between Surface Heating and the Duration of a Low-Pressure System Based Upon Different Amounts of Water? A Guided-Inquiry (Learner-Centered) Activity
For the Teacher
Purpose
Instruct the students that they are responsible for designing the procedure to investigate whether the amount of water affects the duration of the model low-pressure system. This is accomplished by observing the formation and dissipation of a model low-pressure system.
Provide the students with access to the materials described below. Caution the students about safety procedures in handling the burner and hot water. They should be wearing safety goggles and heat-resistant gloves.
The student is challenged to design the procedure. The teacher must successfully lead the student in devising the design without divulging too many specifics. The level of the facilitating questions becomes important in this type of guided-inquiry activity. Carefully elicit from the students the important factors to be considered and discuss these in terms of design consideration.
Carrying out this activity will use materials and procedures described in the two preceding TIB/CIB activities. Students must understand, with the teacher’s guidance, that the main variable in this activity will be the amount of water used. It is impor-tant to control the other factors. Each measure of water should be at the same temperature at the
Provide these Materials (students will select from this list what they need in their design) TIB/CIB device
Metal pan for bottom of TIB/CIB
Enough tap water to accommodate trials at 500 ml per trial
500-ml heat-resistant beaker
Beaker tongs for handling a hot beaker filled with water
Electric hot plate
Non-mercury thermometer
Heat-protective gloves
Safety glasses
Meteorology Activities for Grades 5-9 62 NP-2006-08-97-LaRC
beginning of the experiment. It might be interesting to compare each of the temperatures of the various amounts of water when the low pressure (cloud) is no longer visible.
The learner has had very little experience in guided inquiry and his/her responsibility for taking charge of learning. Therefore, this activity provides a series of guiding questions. As the learner becomes more experienced in conducting guided and open inquiries, less emphasis should be placed on the guiding questions.
Objectives for the Learner
Conceptual Theme: To build on the basic under-standing of the relationship between the amount of water (volume) and the duration of a model low-pressure system, as defined by the “cloud” formation and dissipation.
Content: Generating additional basic information about the formation of a model low-pressure system “cloud” and establishing a greater understanding of how the availability of heat (indicated by temperature and volume of water) affects formation and duration of low-pressure systems.
Skills: The focus is on experimental design that considers observation, data collecting, presentation and analysis of data, making valid conclusions, and communicating the outcomes.
Scientific Habits of Mind: The importance of careful observations, respect for data, respect for logic and the need to follow safety procedures.
A Potential Procedure for the Learner
Background
It is important to guide the learner in designing the procedure for this activity. More responsibility for learning has been shifted to the learner. Revisit the list of question types given below and decide which
are most useful in getting the learner to understand and address this task. If the learner has had the background and experience in doing confirmation-verification and structured-inquiry type of activities, he/she should be able to transfer this learning to the design of a guided-inquiry activity.
REVIEW THESE TYPES OF QUESTIONS BEFORE BEGINNING WITH STUDENTS
Inference Questions: These questions ask students to go beyond immediately available information that asks them to find clues, examine them, and to discuss what inferences are justified.
Interpretation Questions: Where inference questions demand that students fill in missing information, interpretive questions propose that they understand the consequences of information or ideas.
Transfer Questions: Where inference and interpreta-tion questions ask a student to go deeper, transfer questions provoke a kind of breadth of thinking, asking students to take their knowledge to new places.
Questions about Hypotheses: These questions are useful in making students actively aware of their expectations because they are based on what can be predicted and tested. Typically, questions based on what can be predicted and tested are thought of as belonging to sciences and other “hard” pursuits. In fact, predictive thinking matters in all domains.
Remember!
• Guiding the learner and not “telling”the learner is the design challenge.
• Bring out key points in this procedure design (some suggested guiding questions).
These are some guiding questions that must be considered in arriving at a design based upon the challenge question given by the teacher.
Meteorology Activities for Grades 5-9 63 NP-2006-08-97-LaRC
Does the amount (volume) of water affect the duration of the low-pressure system? How would you know? What would confirm that volume does or doesn’t affect duration?
What method will you use to determine duration?
What materials and supplies will you need to devise an appropriate design?
What variable is a critical factor to control in this activity?
What variable will be necessary to draw a valid conclusion?
How will you present your data to make it understandable to others?
Conclusion
After conducting this activity, what major conclusion did you draw regarding the relationship between the amount of water (volume) and the duration of the low pressure system as illustrated by cloud formation and its dissipation?
It is likely that the conclusion drawn will be that as the volume of water increases (temperatures remain-ing the same) the duration of the low pressure (cloud) will increase also. However, if this was not the result, the students should be encouraged to use the data to draw conclusions. This helps to reinforce the scien-tific habits of mind “respect for data.” The results that vary from expectations can produce some impor-tant discussion and provide opportunities for new insights into an investigation. This developmental approach shifts responsibility for the learning to the learner and will be shifted more in the open-inquiry type.
Going Further
How could you validate the important relationship between heat (temperature) and the duration of the low-pressure phenomena?
The higher the number of trials conducted at the three trial levels, the more confident the experimenter should be in the averaged results obtained. Therefore, the learner should be encouraged to repeat a series of these trials at the different trial levels.
Challenge
Think of other activities that you could perform to develop more evidence of the important relationships of heat and low-pressure system formation.
There are a variety of activities that could be devised, such as comparing different amounts of water at the same temperature and comparing the duration; comparing the same amount of water at different temperatures and comparing the duration; comparing different kinds of liquids such as salt water, fresh water, and distilled water using same amounts and same temperatures and comparing duration; and many others.
Meteorology Activities for Grades 5-9 64 NP-2006-08-97-LaRC
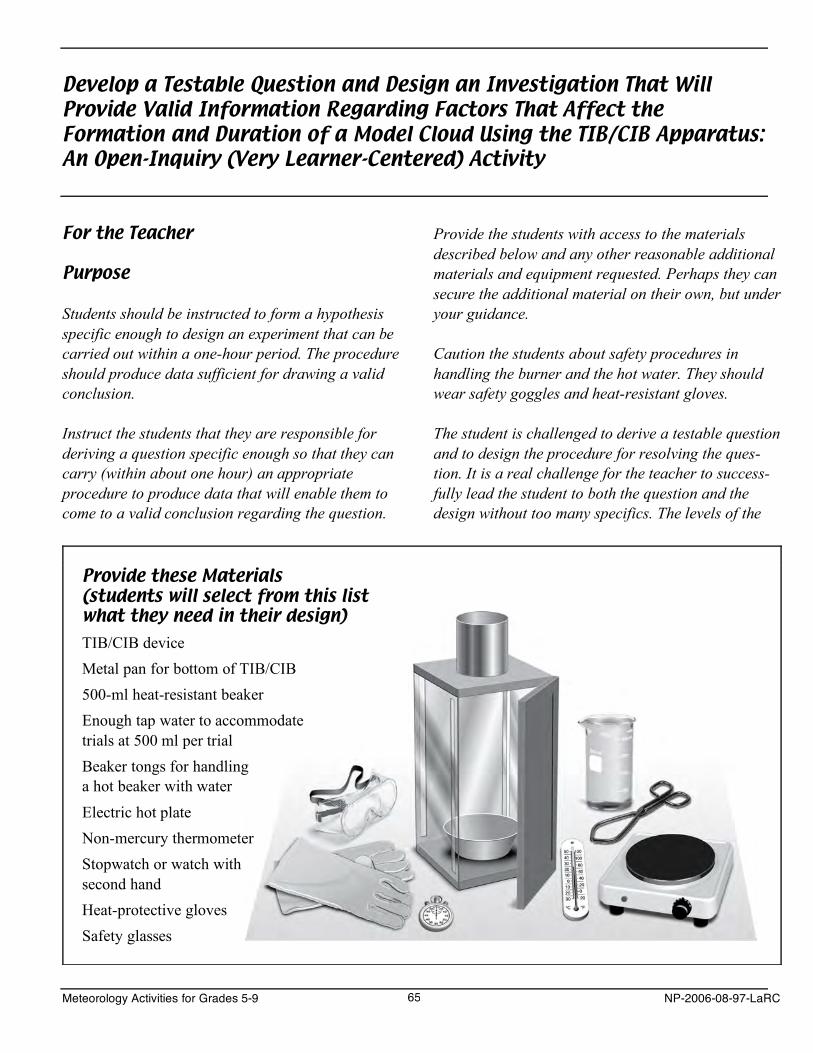
Develop a Testable Question and Design an Investigation That Will Provide Valid Information Regarding Factors That Affect the Formation and Duration of a Model Cloud Using the TIB/CIB Apparatus: An Open-Inquiry (Very Learner-Centered) Activity
For the Teacher
Purpose
Students should be instructed to form a hypothesis specific enough to design an experiment that can be carried out within a one-hour period. The procedure should produce data sufficient for drawing a valid conclusion.
Instruct the students that they are responsible for deriving a question specific enough so that they can carry (within about one hour) an appropriate procedure to produce data that will enable them to come to a valid conclusion regarding the question.
Provide the students with access to the materials described below and any other reasonable additional materials and equipment requested. Perhaps they can secure the additional material on their own, but under your guidance.
Caution the students about safety procedures in handling the burner and the hot water. They should wear safety goggles and heat-resistant gloves.
The student is challenged to derive a testable question and to design the procedure for resolving the ques-tion. It is a real challenge for the teacher to success-fully lead the student to both the question and the design without too many specifics. The levels of the
Provide these Materials (students will select from this list what they need in their design) TIB/CIB device Metal pan for bottom of TIB/CIB 500-ml heat-resistant beaker Enough tap water to accommodate trials at 500 ml per trial Beaker tongs for handling a hot beaker with water Electric hot plate Non-mercury thermometer Stopwatch or watch with second hand Heat-protective gloves Safety glasses
Meteorology Activities for Grades 5-9 65 NP-2006-08-97-LaRC
facilitating questions become very important in this type of open-inquiry activity. Carefully elicit from the students the important factors to be considered and discuss these in terms of design considerations.
Performing this activity will use materials and pro-cedures described in the three preceding TIB/CIB activities. The student must understand, with the teacher’s guidance, how to narrow the question to a point where they can specifically search and derive relevant information.
The learner has little experience in guided-inquiry and for his/her responsibility for taking charge of learning. This activity provides a series of guiding questions. As the learner becomes more experienced in carrying out guided- and open-inquiry activities, less emphasis should be placed on the guiding questions. It might be beneficial for the learners to work in groups if they have little experience with open-inquiry activities in order to take advantage of each other’s helpful suggestions.
The following are examples of testable questions that students might use to design a procedure to produce data needed to draw a valid conclusion:
Does using salt water instead of distilled water affect the duration of the low-pressure cloud inside the TIB/CIB?
Does increasing the temperature of 250 ml of water to 100 °C have an equal effect on the duration of the model cloud as using 500 ml of water at 50 °C?
Does a difference in temperature outside of the TIB/CIB affect the duration of the model cloud inside the TIB/CIB? What is the lowest temperature at which a model cloud will form inside the TIB/CIB?
Does the length of the air slots in the TIB/CIB affect the length of time it takes a model cloud to form inside the TIB/CIB?
Does the width of the air slots in the TIB/CIB affect the length of time it takes a model cloud to form inside the TIB/CIB?
Does the length (or width) of the air slots in the TIB/CIB affect the duration time of the model cloud inside the TIB/CIB?
Does it make a difference in the length of time it takes a model cloud to form depending on where the outside air enters the TIB through the air slots?
YOU WILL HAVE TO REWORK THE OBJECTIVES FOR THE STUDENT IN A WAY TO EVALUATE HIS/HER EFFORTS
Conceptual Theme: Did the question and activity add new insight into the student’s understanding of change, organization, or interrelationships?
Content: Did the question and the activity add new insight and understanding of content knowledge of meteorology?
Skills: Did the question and the activity add to the skill development or enhancing basic skill development for the student?
Scientific Habits of Mind: Did the question and the activity illustrate means by which the scientific habits of mind were further nurtured on the part of the learner?
Meteorology Activities for Grades 5-9 66 NP-2006-08-97-LaRC
Guiding The Learner In Developing a Testable Question and In the Design Challenge
Outline of key points in this procedure design (some suggested guiding questions):
For example, does doubling the temperature (100 °C versus 50 °C) of half the volume of water (200 ml versus 400 ml) result in providing equal durations of the model cloud inside the TIB/CIB? How would you know? What kind of design and data would help you resolve this question?
What method will you use to determine duration?
What materials and supplies will you need for an appropriate design?
What variable(s) is critical to control in this activity?
What variable will give the data necessary to draw a valid conclusion?
How will you present your data to make it understandable to others?
These are some guiding questions that you must consider in arriving at a design based upon the challenge questions that you have developed.
Examining Results
As the teacher of this open inquiry you must use your knowledge, background and experience from the series of previous activities to help the student draw an appropriate and valid conclusion from the activity.
It is time to put this experience and knowledge to work performing some weather predictions using a weather station and observations involving cloud types.
Before that happens, there is a challenge for both teacher and learner in a type of practical test to see how well the levels of inquiry have been mastered.
Meteorology Activities for Grades 5-9 67 NP-2006-08-97-LaRC

This Page for Notes
Meteorology Activities for Grades 5-9 68 NP-2006-08-97-LaRC
Chapter 14. Design Challenge:What Factors Determine the Comfort Index of the Air?A Guided or Open-Inquiry Activity
IT IS SUGGESTED THAT THIS ACTIVITY BE DESIGNED AS A GUIDED-INQUIRY OR OPEN-INQUIRY TYPE. THIS ACTIVITY SHOULD CHALLENGE BOTH TEACHER AND STUDENT!
Purpose
The purpose of this investigation is to understand how the amount of water vapor in the air at various tem-peratures affects the way the human body responds. This is an extremely important basic concept for why one might feel either comfortable or uncomfortable at exactly the same temperature.
Think About This!
Have you ever heard meteorologists talk of combin-ing the temperature and the humidity to get a better reading of the comfort index? This action is usually taken on a hot summer day when the air becomes saturated with moisture. Regarding hot summer days, have you ever heard the saying, “It’s not the heat but the humidity that causes the uncomfortable feeling.” On very cold days why might adding moisture to very dry air help one to feel more comfortable?
Probing Further
What do you think would happen to the rate of water evaporation if you put a pan of water in the sunlight on a day of low humidity and placed a similar amount of water in a similar pan on a day of high humidity? Why? You might try conducting such an activity several times and comparing the results.
Objectives for the Learner (Essentials of Inquiry)
These are rather broad outlines of what the objectives might address. More-specific objectives will need to be written to best address what is to be done with the activity.
Conceptual Theme: To develop a basic understand-ing of the change that takes place when water evapo-rates and changes from a liquid to a gas and how a change in temperature at various humidities affects this transformation.
Content: Developing basic information relating to the evaporation process and establishing a basic understanding of dew point and the relationship to relative humidity.
Skills: The focus is on the design of steps in conduct-ing an investigation, using laboratory equipment safely, making careful observations, recording physi-cal changes, forming conclusions, and describing and communicating results.
Scientific Habits of Mind: The importance of careful observations, respect for data, and verifying results.
Meteorology Activities for Grades 5-9 69 NP-2006-08-97-LaRC
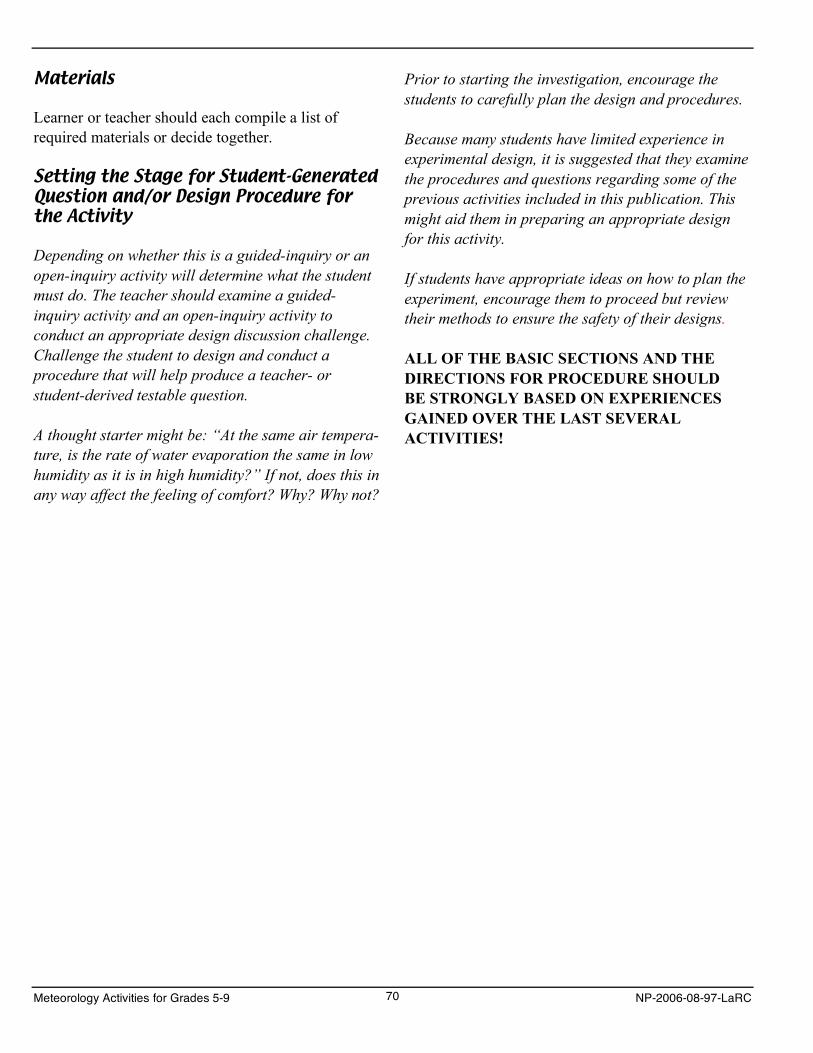
Materials
Learner or teacher should each compile a list of required materials or decide together.
Setting the Stage for Student-Generated Question and/or Design Procedure for the Activity
Depending on whether this is a guided-inquiry or an open-inquiry activity will determine what the student must do. The teacher should examine a guided-inquiry activity and an open-inquiry activity to conduct an appropriate design discussion challenge. Challenge the student to design and conduct a procedure that will help produce a teacher- or student-derived testable question.
A thought starter might be: “At the same air tempera-ture, is the rate of water evaporation the same in low humidity as it is in high humidity?” If not, does this in any way affect the feeling of comfort? Why? Why not?
Prior to starting the investigation, encourage the students to carefully plan the design and procedures.
Because many students have limited experience in experimental design, it is suggested that they examine the procedures and questions regarding some of the previous activities included in this publication. This might aid them in preparing an appropriate design for this activity.
If students have appropriate ideas on how to plan the experiment, encourage them to proceed but review their methods to ensure the safety of their designs.
ALL OF THE BASIC SECTIONS AND THE DIRECTIONS FOR PROCEDURE SHOULD BE STRONGLY BASED ON EXPERIENCES GAINED OVER THE LAST SEVERAL ACTIVITIES!
Meteorology Activities for Grades 5-9 70 NP-2006-08-97-LaRC
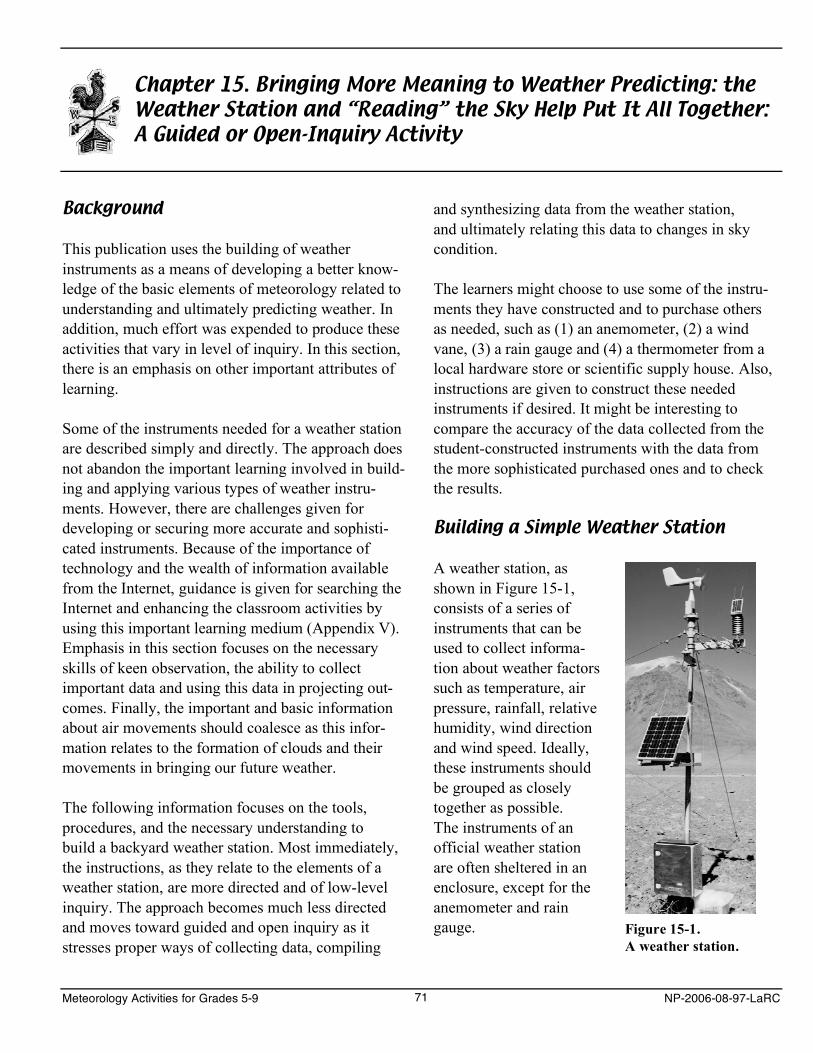
Chapter 15. Bringing More Meaning to Weather Predicting: the Weather Station and “Reading” the Sky Help Put It All Together: A Guided or Open-Inquiry Activity
Background
This publication uses the building of weather instruments as a means of developing a better know-ledge of the basic elements of meteorology related to understanding and ultimately predicting weather. In addition, much effort was expended to produce these activities that vary in level of inquiry. In this section, there is an emphasis on other important attributes of learning.
Some of the instruments needed for a weather station are described simply and directly. The approach does not abandon the important learning involved in build-ing and applying various types of weather instru-ments. However, there are challenges given for developing or securing more accurate and sophisti-cated instruments. Because of the importance of technology and the wealth of information available from the Internet, guidance is given for searching the Internet and enhancing the classroom activities by using this important learning medium (Appendix V). Emphasis in this section focuses on the necessary skills of keen observation, the ability to collect important data and using this data in projecting out-comes. Finally, the important and basic information about air movements should coalesce as this infor-mation relates to the formation of clouds and their movements in bringing our future weather.
The following information focuses on the tools, procedures, and the necessary understanding to build a backyard weather station. Most immediately, the instructions, as they relate to the elements of a weather station, are more directed and of low-level inquiry. The approach becomes much less directed and moves toward guided and open inquiry as it stresses proper ways of collecting data, compiling
and synthesizing data from the weather station, and ultimately relating this data to changes in sky condition.
The learners might choose to use some of the instru-ments they have constructed and to purchase others as needed, such as (1) an anemometer, (2) a wind vane, (3) a rain gauge and (4) a thermometer from a local hardware store or scientific supply house. Also, instructions are given to construct these needed instruments if desired. It might be interesting to compare the accuracy of the data collected from the student-constructed instruments with the data from the more sophisticated purchased ones and to check the results.
Building a Simple Weather Station
A weather station, as shown in Figure 15-1, consists of a series of instruments that can be used to collect informa-tion about weather factors such as temperature, air pressure, rainfall, relative humidity, wind direction and wind speed. Ideally, these instruments should be grouped as closely together as possible. The instruments of an official weather station are often sheltered in an enclosure, except for the anemometer and rain gauge. Figure 15-1.
A weather station.
Meteorology Activities for Grades 5-9 71 NP-2006-08-97-LaRC
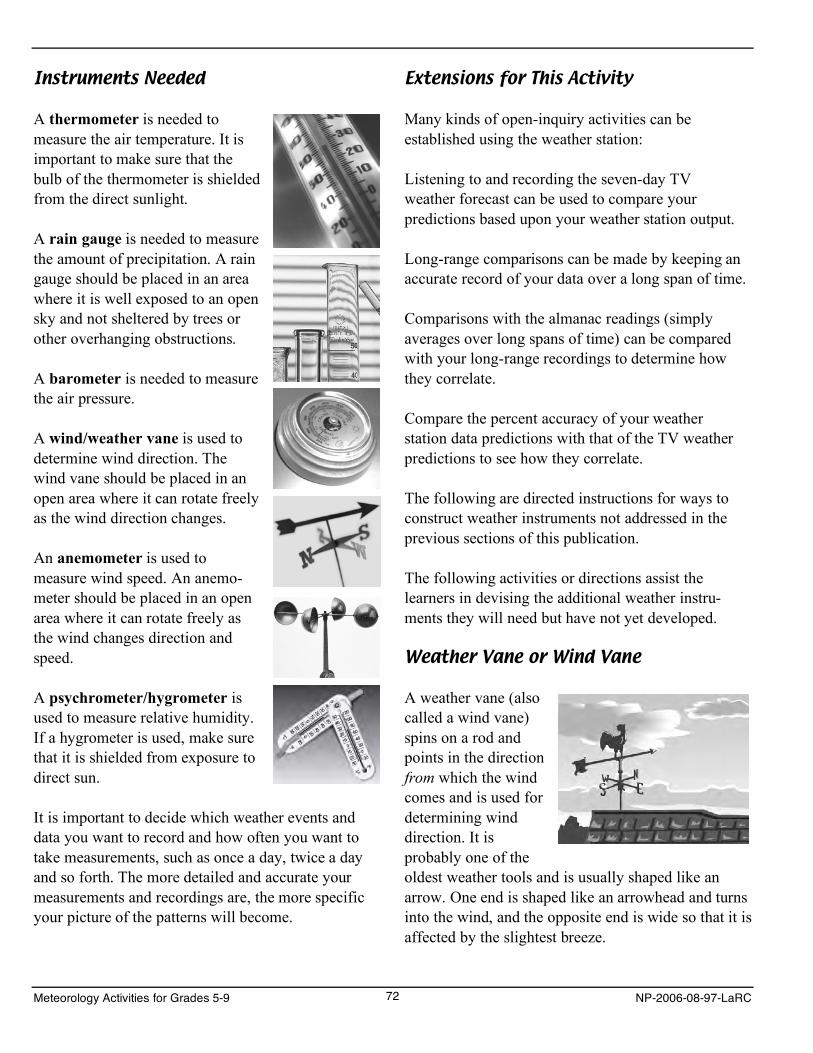
Instruments Needed
A thermometer is needed to measure the air temperature. It is important to make sure that the bulb of the thermometer is shielded from the direct sunlight.
A rain gauge is needed to measure the amount of precipitation. A rain gauge should be placed in an area where it is well exposed to an open sky and not sheltered by trees or other overhanging obstructions.
A barometer is needed to measure the air pressure.
A wind/weather vane is used to determine wind direction. The wind vane should be placed in an open area where it can rotate freely as the wind direction changes.
An anemometer is used to measure wind speed. An anemo-meter should be placed in an open area where it can rotate freely as the wind changes direction and speed.
A psychrometer/hygrometer is used to measure relative humidity. If a hygrometer is used, make sure that it is shielded from exposure to direct sun.
It is important to decide which weather events and data you want to record and how often you want to take measurements, such as once a day, twice a day and so forth. The more detailed and accurate your measurements and recordings are, the more specific your picture of the patterns will become.
Extensions for This Activity
Many kinds of open-inquiry activities can be established using the weather station:
Listening to and recording the seven-day TV weather forecast can be used to compare your predictions based upon your weather station output.
Long-range comparisons can be made by keeping an accurate record of your data over a long span of time.
Comparisons with the almanac readings (simply averages over long spans of time) can be compared with your long-range recordings to determine how they correlate.
Compare the percent accuracy of your weather station data predictions with that of the TV weather predictions to see how they correlate.
The following are directed instructions for ways to construct weather instruments not addressed in the previous sections of this publication.
The following activities or directions assist the learners in devising the additional weather instru-ments they will need but have not yet developed.
Weather Vane or Wind Vane
A weather vane (also called a wind vane) spins on a rod and points in the direction from which the wind comes and is used for determining wind direction. It is probably one of the oldest weather tools and is usually shaped like an arrow. One end is shaped like an arrowhead and turns into the wind, and the opposite end is wide so that it is affected by the slightest breeze.
Meteorology Activities for Grades 5-9 72 NP-2006-08-97-LaRC
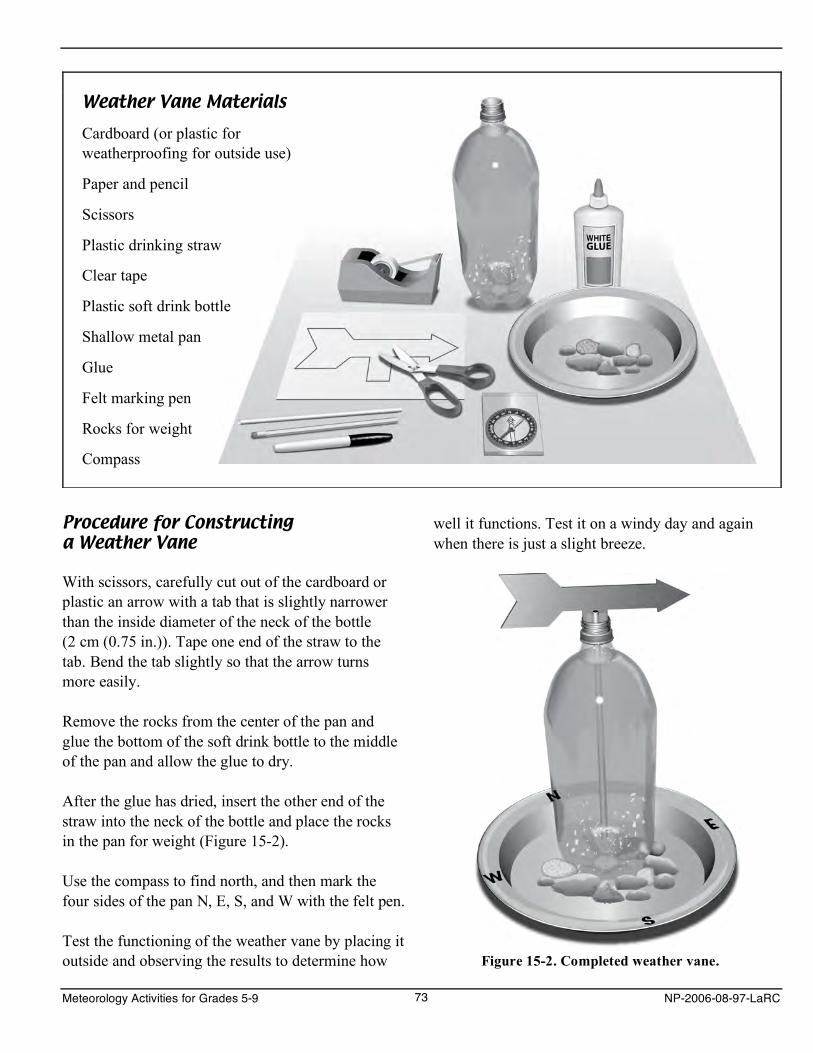
Weather Vane Materials
Cardboard (or plastic for weatherproofing for outside use)
Paper and pencil
Scissors
Plastic drinking straw
Clear tape
Plastic soft drink bottle
Shallow metal pan
Glue
Felt marking pen
Rocks for weight
Compass
Procedure for Constructing a Weather Vane
With scissors, carefully cut out of the cardboard or plastic an arrow with a tab that is slightly narrower than the inside diameter of the neck of the bottle (2 cm (0.75 in.)). Tape one end of the straw to the tab. Bend the tab slightly so that the arrow turns more easily.
Remove the rocks from the center of the pan and glue the bottom of the soft drink bottle to the middle of the pan and allow the glue to dry.
After the glue has dried, insert the other end of the straw into the neck of the bottle and place the rocks in the pan for weight (Figure 15-2).
Use the compass to find north, and then mark the four sides of the pan N, E, S, and W with the felt pen.
Test the functioning of the weather vane by placing it outside and observing the results to determine how
well it functions. Test it on a windy day and again when there is just a slight breeze.
Figure 15-2. Completed weather vane.
Meteorology Activities for Grades 5-9 73 NP-2006-08-97-LaRC
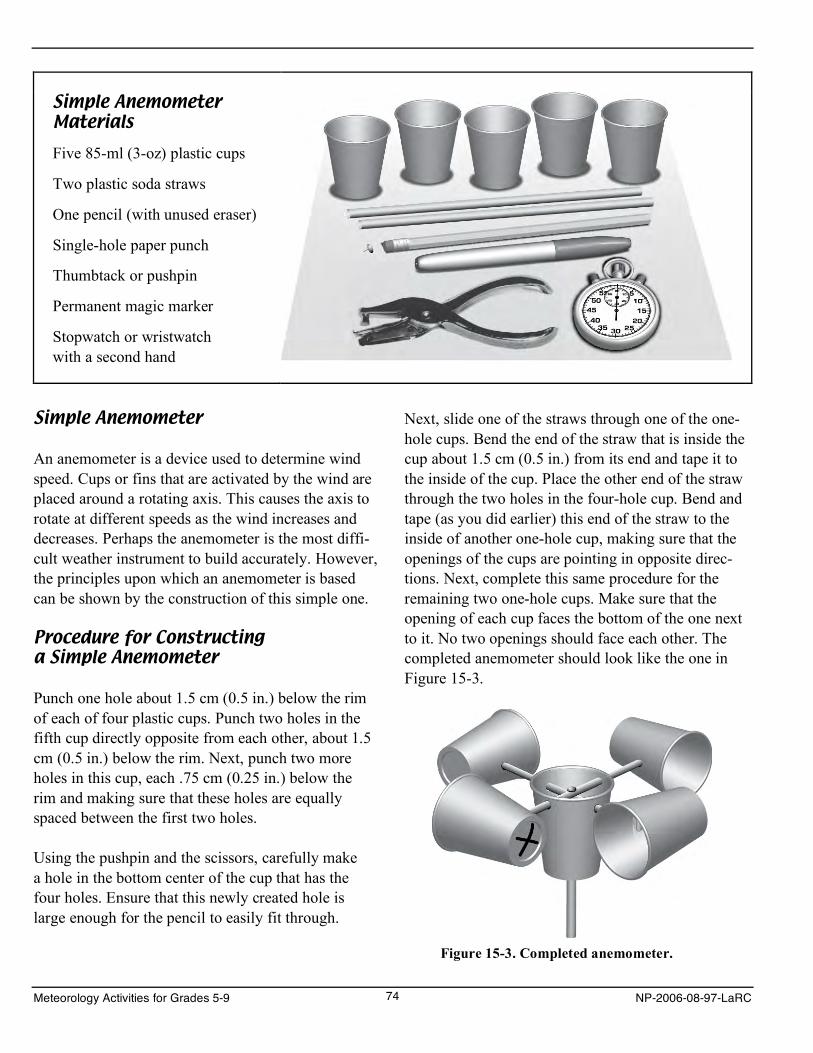
Simple Anemometer Materials
Five 85-ml (3-oz) plastic cups
Two plastic soda straws
One pencil (with unused eraser)
Single-hole paper punch
Thumbtack or pushpin
Permanent magic marker
Stopwatch or wristwatch with a second hand
Simple Anemometer
An anemometer is a device used to determine wind speed. Cups or fins that are activated by the wind are placed around a rotating axis. This causes the axis to rotate at different speeds as the wind increases and decreases. Perhaps the anemometer is the most diffi-cult weather instrument to build accurately. However, the principles upon which an anemometer is based can be shown by the construction of this simple one.
Procedure for Constructing a Simple Anemometer
Punch one hole about 1.5 cm (0.5 in.) below the rim of each of four plastic cups. Punch two holes in the fifth cup directly opposite from each other, about 1.5 cm (0.5 in.) below the rim. Next, punch two more holes in this cup, each .75 cm (0.25 in.) below the rim and making sure that these holes are equally spaced between the first two holes.
Using the pushpin and the scissors, carefully make a hole in the bottom center of the cup that has the four holes. Ensure that this newly created hole is large enough for the pencil to easily fit through.
Next, slide one of the straws through one of the one-hole cups. Bend the end of the straw that is inside the cup about 1.5 cm (0.5 in.) from its end and tape it to the inside of the cup. Place the other end of the straw through the two holes in the four-hole cup. Bend and tape (as you did earlier) this end of the straw to the inside of another one-hole cup, making sure that the openings of the cups are pointing in opposite direc-tions. Next, complete this same procedure for the remaining two one-hole cups. Make sure that the opening of each cup faces the bottom of the one next to it. No two openings should face each other. The completed anemometer should look like the one in Figure 15-3.
Figure 15-3. Completed anemometer.
Meteorology Activities for Grades 5-9 74 NP-2006-08-97-LaRC
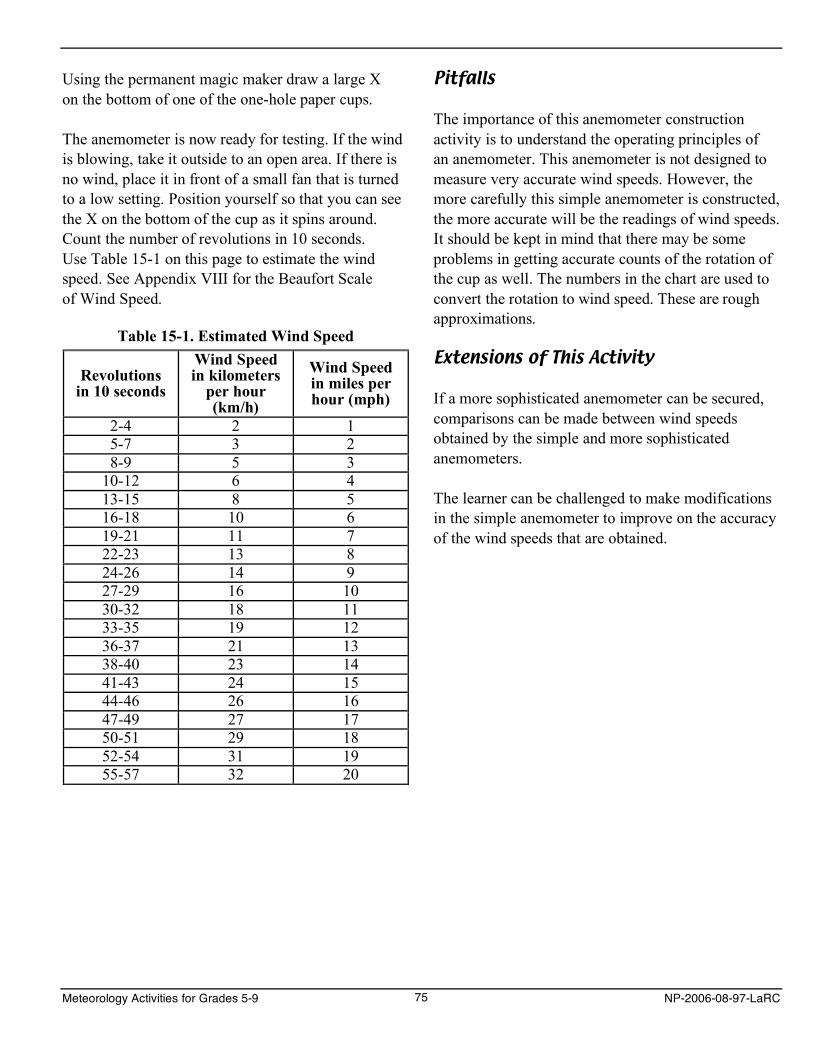
Using the permanent magic maker draw a large X on the bottom of one of the one-hole paper cups.
The anemometer is now ready for testing. If the wind is blowing, take it outside to an open area. If there is no wind, place it in front of a small fan that is turned to a low setting. Position yourself so that you can see the X on the bottom of the cup as it spins around. Count the number of revolutions in 10 seconds. Use Table 15-1 on this page to estimate the wind speed. See Appendix VIII for the Beaufort Scale of Wind Speed.
Table 15-1. Estimated Wind Speed Wind Speed Wind SpeedRevolutions in kilometers in miles perin 10 seconds per hour hour (mph) (km/h)
2-4 2 1 5-7 3 2 8-9 5 3
10-12 6 4 13-15 8 5 16-18 10 6 19-21 11 7 22-23 13 8 24-26 14 9 27-29 16 10 30-32 18 11 33-35 19 12 36-37 21 13 38-40 23 14 41-43 24 15 44-46 26 16 47-49 27 17 50-51 29 18 52-54 31 19 55-57 32 20
Pitfalls
The importance of this anemometer construction activity is to understand the operating principles of an anemometer. This anemometer is not designed to measure very accurate wind speeds. However, the more carefully this simple anemometer is constructed, the more accurate will be the readings of wind speeds. It should be kept in mind that there may be some problems in getting accurate counts of the rotation of the cup as well. The numbers in the chart are used to convert the rotation to wind speed. These are rough approximations.
Extensions of This Activity
If a more sophisticated anemometer can be secured, comparisons can be made between wind speeds obtained by the simple and more sophisticated anemometers.
The learner can be challenged to make modifications in the simple anemometer to improve on the accuracy of the wind speeds that are obtained.
Meteorology Activities for Grades 5-9 75 NP-2006-08-97-LaRC
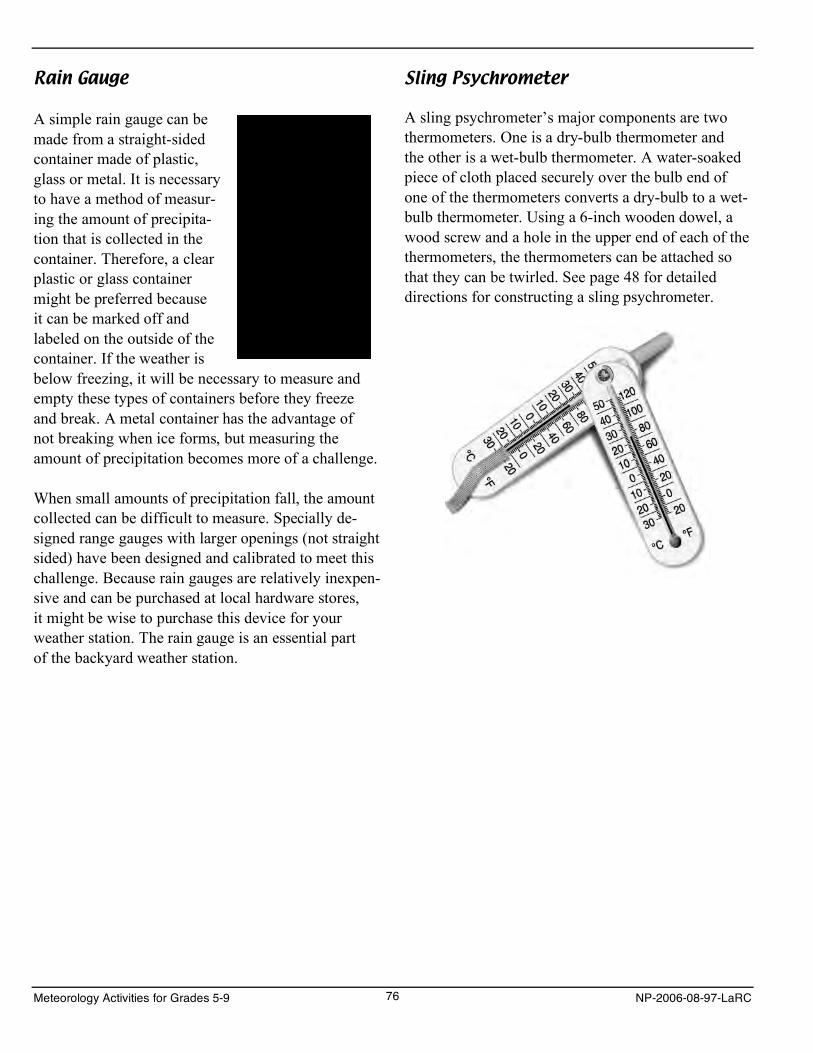
Rain Gauge
A simple rain gauge can be made from a straight-sided container made of plastic, glass or metal. It is necessary to have a method of measur-ing the amount of precipita-tion that is collected in the container. Therefore, a clear plastic or glass container might be preferred because it can be marked off and labeled on the outside of the container. If the weather is below freezing, it will be necessary to measure and empty these types of containers before they freeze and break. A metal container has the advantage of not breaking when ice forms, but measuring the amount of precipitation becomes more of a challenge.
When small amounts of precipitation fall, the amount collected can be difficult to measure. Specially de-signed range gauges with larger openings (not straight sided) have been designed and calibrated to meet this challenge. Because rain gauges are relatively inexpen-sive and can be purchased at local hardware stores, it might be wise to purchase this device for your weather station. The rain gauge is an essential part of the backyard weather station.
Sling Psychrometer
A sling psychrometer’s major components are two thermometers. One is a dry-bulb thermometer and the other is a wet-bulb thermometer. A water-soaked piece of cloth placed securely over the bulb end of one of the thermometers converts a dry-bulb to a wet-bulb thermometer. Using a 6-inch wooden dowel, a wood screw and a hole in the upper end of each of the thermometers, the thermometers can be attached so that they can be twirled. See page 48 for detailed directions for constructing a sling psychrometer.
Meteorology Activities for Grades 5-9 76 NP-2006-08-97-LaRC
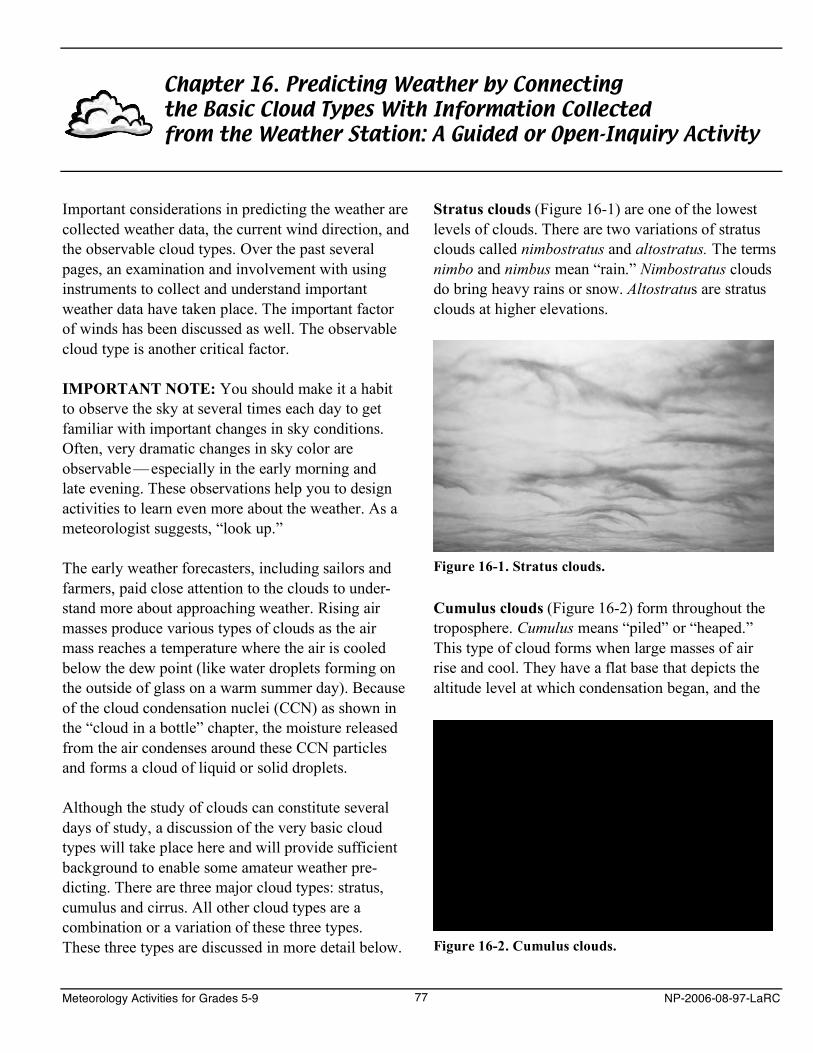
Chapter 16. Predicting Weather by Connecting the Basic Cloud Types With Information Collected from the Weather Station: A Guided or Open-Inquiry Activity
Important considerations in predicting the weather are collected weather data, the current wind direction, and the observable cloud types. Over the past several pages, an examination and involvement with using instruments to collect and understand important weather data have taken place. The important factor of winds has been discussed as well. The observable cloud type is another critical factor.
IMPORTANT NOTE: You should make it a habit to observe the sky at several times each day to get familiar with important changes in sky conditions. Often, very dramatic changes in sky color are observable —especially in the early morning and late evening. These observations help you to design activities to learn even more about the weather. As a meteorologist suggests, “look up.”
The early weather forecasters, including sailors and farmers, paid close attention to the clouds to under-stand more about approaching weather. Rising air masses produce various types of clouds as the air mass reaches a temperature where the air is cooled below the dew point (like water droplets forming on the outside of glass on a warm summer day). Because of the cloud condensation nuclei (CCN) as shown in the “cloud in a bottle” chapter, the moisture released from the air condenses around these CCN particles and forms a cloud of liquid or solid droplets.
Although the study of clouds can constitute several days of study, a discussion of the very basic cloud types will take place here and will provide sufficient background to enable some amateur weather pre-dicting. There are three major cloud types: stratus, cumulus and cirrus. All other cloud types are a combination or a variation of these three types. These three types are discussed in more detail below.
Stratus clouds (Figure 16-1) are one of the lowest levels of clouds. There are two variations of stratus clouds called nimbostratus and altostratus. The terms nimbo and nimbus mean “rain.” Nimbostratus clouds do bring heavy rains or snow. Altostratus are stratus clouds at higher elevations.
Figure 16-1. Stratus clouds.
Cumulus clouds (Figure 16-2) form throughout the troposphere. Cumulus means “piled” or “heaped.” This type of cloud forms when large masses of air rise and cool. They have a flat base that depicts the altitude level at which condensation began, and the
Figure 16-2. Cumulus clouds.
Meteorology Activities for Grades 5-9 77 NP-2006-08-97-LaRC
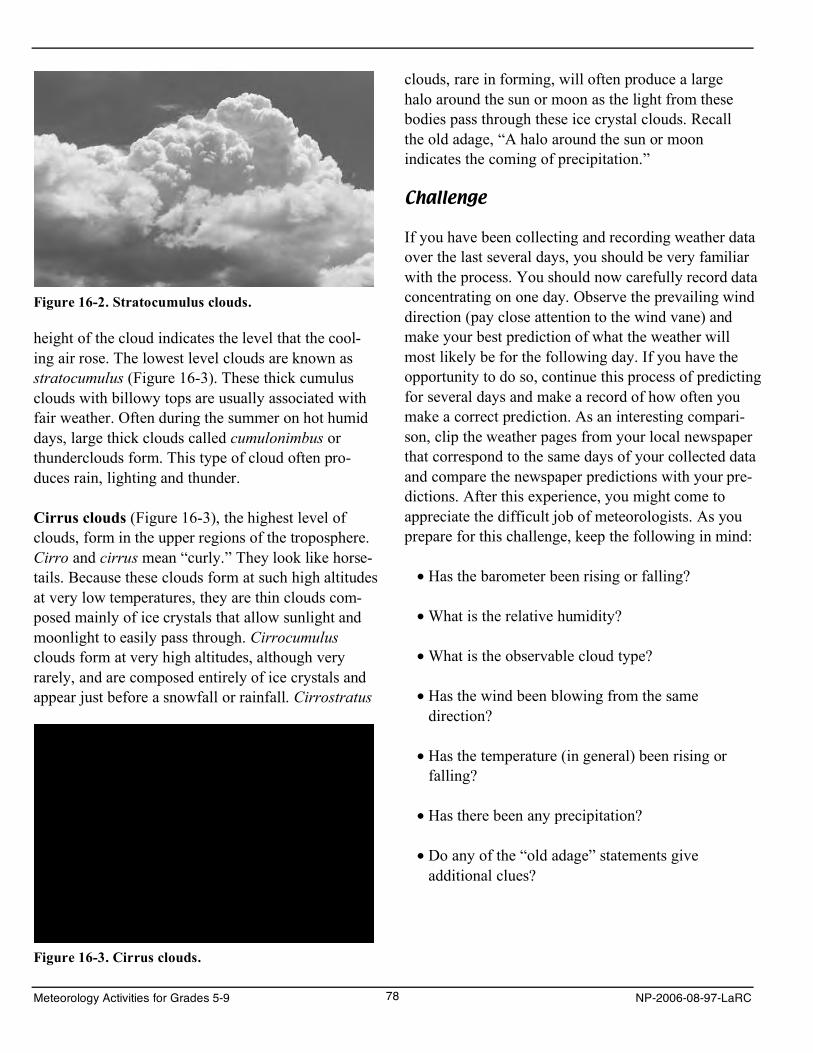
Figure 16-2. Stratocumulus clouds.
height of the cloud indicates the level that the cool-ing air rose. The lowest level clouds are known as stratocumulus (Figure 16-3). These thick cumulus clouds with billowy tops are usually associated with fair weather. Often during the summer on hot humid days, large thick clouds called cumulonimbus or thunderclouds form. This type of cloud often pro-duces rain, lighting and thunder.
Cirrus clouds (Figure 16-3), the highest level of clouds, form in the upper regions of the troposphere. Cirro and cirrus mean “curly.” They look like horse-tails. Because these clouds form at such high altitudes at very low temperatures, they are thin clouds com-posed mainly of ice crystals that allow sunlight and moonlight to easily pass through. Cirrocumulus clouds form at very high altitudes, although very rarely, and are composed entirely of ice crystals and appear just before a snowfall or rainfall. Cirrostratus
Figure 16-3. Cirrus clouds.
clouds, rare in forming, will often produce a large halo around the sun or moon as the light from these bodies pass through these ice crystal clouds. Recall the old adage, “A halo around the sun or moon indicates the coming of precipitation.”
Challenge
If you have been collecting and recording weather data over the last several days, you should be very familiar with the process. You should now carefully record data concentrating on one day. Observe the prevailing wind direction (pay close attention to the wind vane) and make your best prediction of what the weather will most likely be for the following day. If you have the opportunity to do so, continue this process of predicting for several days and make a record of how often you make a correct prediction. As an interesting compari-son, clip the weather pages from your local newspaper that correspond to the same days of your collected data and compare the newspaper predictions with your pre-dictions. After this experience, you might come to appreciate the difficult job of meteorologists. As you prepare for this challenge, keep the following in mind:
• Has the barometer been rising or falling?
• What is the relative humidity?
• What is the observable cloud type?
• Has the wind been blowing from the samedirection?
• Has the temperature (in general) been rising orfalling?
• Has there been any precipitation?
• Do any of the “old adage” statements giveadditional clues?
Meteorology Activities for Grades 5-9 78 NP-2006-08-97-LaRC
The following suggestions are a mixture of scientific information provided by the weather instruments and some of the old adages regarding weather predicting. Perhaps the old adage can be further understood, as to its origin, by doing some comparisons with the scientific data. You might want to review some of the information relating to the weather instruments such as:
• What are indications of a falling or rising barometer?
• What do cloud types suggest about tomorrow’s weather?
• Is the air relatively dry or moist (relativehumidity)?
• Has the sky been red at night or in the morning?
• Have the leaves on trees been lifted up by abreeze?
• What is the dew point temperature?
• Has there been a halo around either the sun or moon?
• Has anyone(especially olderpeople) complained of aching joints?
It should be made clear that the purpose for mixing the scientific data with some of the old adages is to illustrate that a scientific approach to understanding the world helps to expose a lack of scientific basis for some of the myths or to illustrate some type of scientific connection to these myths. For example, it would be an appropriate educational experience and perhaps add interest for the learner to explore how often a “red sky at night” correlates with a change from fair to stormy weather.
Background for the Teacher
This activity brings closure to the study provided by the various activities and should help the learner to connect the previous experiences more effectively. Learning about key weather factors by constructing and using the instruments to collect weather data has practical application. Understanding the nature of prevailing winds should help the learner understand that local weather changes often approach from similar directions. Observing or “reading” the sky and connecting these observations with what the weather instruments data show, should provide an interesting and real challenge for all learners. It is recommended that sufficient time be devoted to this activity to discuss and explore the many opportuni-ties for a valid and practical study of a phase of science. This activity requires that learners use collected data, make further current observations of the sky, and reason how these need to be analyzed to carry out their task.
This activity probably falls into structured inquiry because the question to be resolved has been set for them. Their challenge is to “predict tomorrow’s weather” and the procedure has been somewhat delineated for them. However, there is some guided inquiry to the procedure because the learner has some latitude to make his/her own choices about how to proceed. It is a most challenging task because they have to infer certain relationships and connect certain parameters in order to come to a resolution to the problem.
Because of the variety of weather conditions on the day the activity starts, it is not possible to give a specific Examining Results section here; therefore, a hypothetical example will be given instead.
Meteorology Activities for Grades 5-9 79 NP-2006-08-97-LaRC
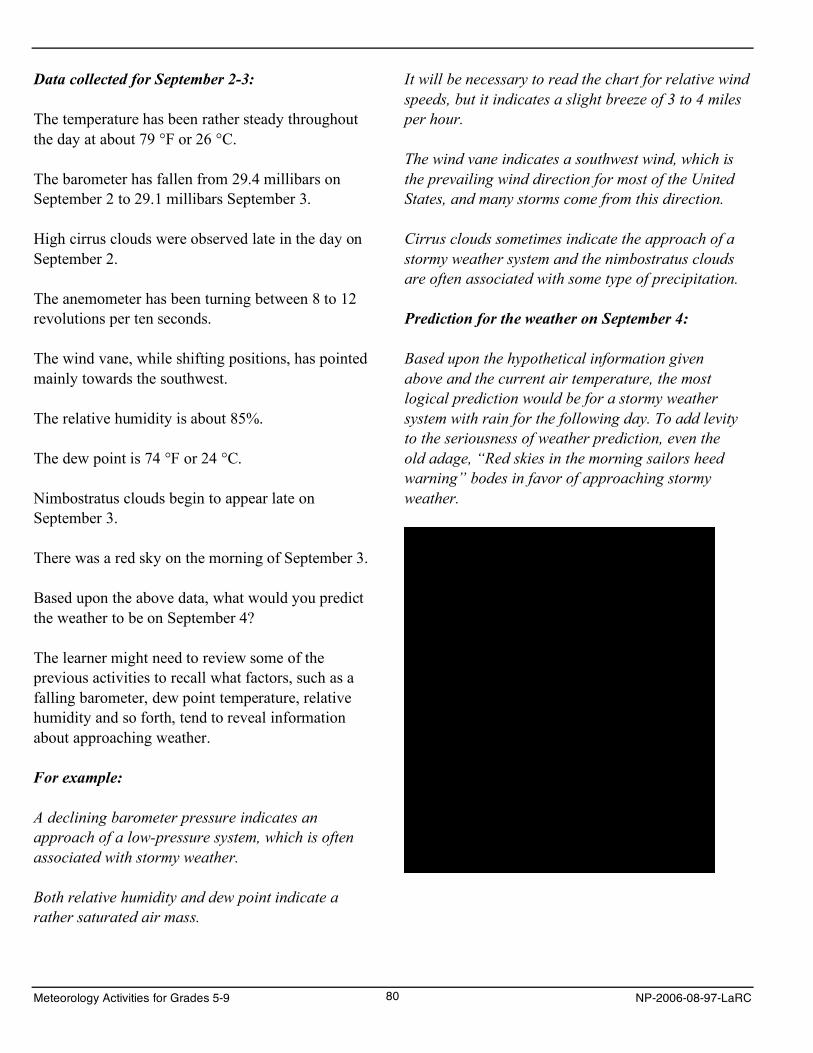
Data collected for September 2-3:
The temperature has been rather steady throughout the day at about 79 °F or 26 °C.
The barometer has fallen from 29.4 millibars on September 2 to 29.1 millibars September 3.
High cirrus clouds were observed late in the day on September 2.
The anemometer has been turning between 8 to 12 revolutions per ten seconds.
The wind vane, while shifting positions, has pointed mainly towards the southwest.
The relative humidity is about 85%.
The dew point is 74 °F or 24 °C.
Nimbostratus clouds begin to appear late on September 3.
There was a red sky on the morning of September 3.
Based upon the above data, what would you predict the weather to be on September 4?
The learner might need to review some of the previous activities to recall what factors, such as a falling barometer, dew point temperature, relative humidity and so forth, tend to reveal information about approaching weather.
For example:
A declining barometer pressure indicates an approach of a low-pressure system, which is often associated with stormy weather.
Both relative humidity and dew point indicate a rather saturated air mass.
It will be necessary to read the chart for relative wind speeds, but it indicates a slight breeze of 3 to 4 miles per hour.
The wind vane indicates a southwest wind, which is the prevailing wind direction for most of the United States, and many storms come from this direction.
Cirrus clouds sometimes indicate the approach of a stormy weather system and the nimbostratus clouds are often associated with some type of precipitation.
Prediction for the weather on September 4:
Based upon the hypothetical information given above and the current air temperature, the most logical prediction would be for a stormy weather system with rain for the following day. To add levity to the seriousness of weather prediction, even the old adage, “Red skies in the morning sailors heed warning” bodes in favor of approaching stormy weather.
Meteorology Activities for Grades 5-9 80 NP-2006-08-97-LaRC
Selected References on Science Education
American Association for the Advancement of Science. Science for All Americans. Oxford University Press, New York, 1989.
American Association for the Advancement of Science. Benchmarks for Science Literacy. Oxford University Press, New York, 1993.
Anderson, R. A. “Inquiry in Everyday World of Schools.” Focus, 6(2), 16-17, 1999.
Audet, R. H., and L. K. Jordan, L. K. Standards in the Classroom: An Implementation Guide for Teachers of Science and Mathematics. Corwin. Thousand Oaks, CA, 2003.
Baker, T.R. Two Suns and a Green Sky. TAB Books (McGraw-Hill), USA, 1994.
Barman, C. R. “How Do You Define Inquiry?” Science and Children, 39(10), 8-9, 2002.
DeMillo, R. How Weather Works. Ziff-Davis Press, Emeryville, CA, 1994.
Krulik, S. and J. Rudnick. Reasoning and Problem Solving: A Handbook for Elementary School Teachers. Allyn and Bacon, Boston, MA, 1993.
Lawson, Anton E. Science Teaching and the Development of Thinking. Wadsworth Publishing Company, Inc., Belmont, CA, 1995.
Lazarowitz, R. and P. Tamir. “Research on Using Laboratory Instruction in Science,” Handbook of Research on Science Teaching and Learning, D. L. Gabel (ed.), pp. 94-128. Macmillan, New York, 1994.
Llewellyn, D. Inquiry Within: Implementing Inquiry-based Science. Corwin, Thousand Oaks, CA, 2002.
National Research Council. Inquiry and the National Education Standards. National Academy Press, Washington, DC, 2000.
National Research Council. Inquiry and the National Education Standards: A Guide for Teaching and Learning. National Academy Press, Washington, DC, 2000.
Padilla, Michael J., et al. Science Explorer. Prentice Hall, Upper Saddle River, NJ, 2002.
Ramsey, William L., et al. Modern Earth Science. Holt, Rinehart and Winston, New York, 2002.
Schwab, J. J. Biology Teachers’ Handbook. Wiley, New York, 1963.
Schwab, J. J. “The Practical: A Language for Curriculum,” School Review, 78, 1-23, 1969.
Schwab, J. J., and P. F. Brandwein. The Teaching of Science. Harvard University Press, Cambridge, MA, 1962.
Welch, W. W., L. E. Klopfer, and G. E. Aikenhead. “The Role of Inquiry in Science: An Analysis and Recommendations,” Science Education, 65 (1), 33-50, 1981.
Williams, Jack. The Weather Book: An Easy to Understand Guide to the USA’s Weather (Second Edition). Vintage Books, New York, 1997.
Meteorology Activities for Grades 5-9 81 NP-2006-08-97-LaRC

Meteorology Activities for Grades 5-9 82 NP-2006-08-97-LaRC
APPENDICES
Meteorology Activities for Grades 5-9 83 NP-2006-08-97-LaRC

Meteorology Activities for Grades 5-9 84 NP-2006-08-97-LaRC
APPENDIX I: Suggestions for Maximizing the Use of Learner-Designed Activities
We planned this guide to facilitate the move from teacher-centered learning to more student-centered learning. Here are some suggestions and explanations in using the various sections of each chapter. However, the educator should feel free to determine how these suggestions are best used for students under her/his guidance. Our suggestions should augment, rather than supplant, the creative abilities of teachers.
Think About This!
This section is a type of advanced organizer to be used by the teacher with students to prepare students for in-depth thought and to create a mindset for the activity to follow. Often, this section makes use of events or situations that are common experiences for the learner. At times, the learner is asked to think about next steps to develop further an experience or activity that he/she just completed. The teachers are encouraged to substitute an advanced organizer they feel fits the situation.
Probing Further
This section is intended to facilitate deeper thought about the experience or activity performed. The learner is encouraged to think beyond the simple outcome to which factors might affect the outcomes and make the experience more complex. Further, the learner might need to conduct additional investigations to verify his/her conclusions.
Objectives For The Learner
This section identifies and provides examples of student objectives for the four essentials of inquiry. It is strongly suggested that the four essentials of inquiry be addressed in each activity. In the case of guided and open inquiry, the examples are more hypothetical because the objectives in these types of activities will need to be determined by input from learner and teacher alike.
Preparation
This section provides the educator with some aspects of classroom management. If the activity is confirmation-verification or structured inquiry, assistance is in the form of listing and explaining needed materials and equipment. If the activity is guided or open inquiry, suggestions have more to do with how the teacher anticipates possible activity design and prepares materials and equipment to accommodate the learner’s potential direction. It is important to become more experienced with guided and open inquiry learning.
Meteorology Activities for Grades 5-9 85 NP-2006-08-97-LaRC
Examining The Results
Important guidance is provided for the teacher to bring effective closure to an activity or experience. This guidance is in the form of questions that can facilitate learners’ rethinking important steps in the activity or experience. The teacher is provided some possible resolutions to the questions. These are italicized and should not be seen by the learner. The educator should feel free to accept suggested solutions put forth by the student that are supported by data gathered in the activity or experience.
Conclusion
Examples are provided for the teacher that seem to flow naturally from the questions asked and the data gathered to support the learner’s conclusions. An important consideration is nurturing of the scientific habits of mind, such as careful observations, respect for data, insistence on verification, and conducting experiments safely.
Going Further
This section provides the educator suggestions to challenge the learner to go beyond the current activity or experience to further verify results, probe more deeply. or to take the outcome to another level of inquiry.
Challenge
This section is designed for the teacher to raise new issues. It is intended to encourage the learner to take a different perspective on the same issue that has been discussed or investigated. This perspective might yield additional insight into the issue.
Background For The Teacher
Where concepts are more advanced, in-depth or additional information about subjects under investigation are provided.
Meteorology Activities for Grades 5-9 86 NP-2006-08-97-LaRC
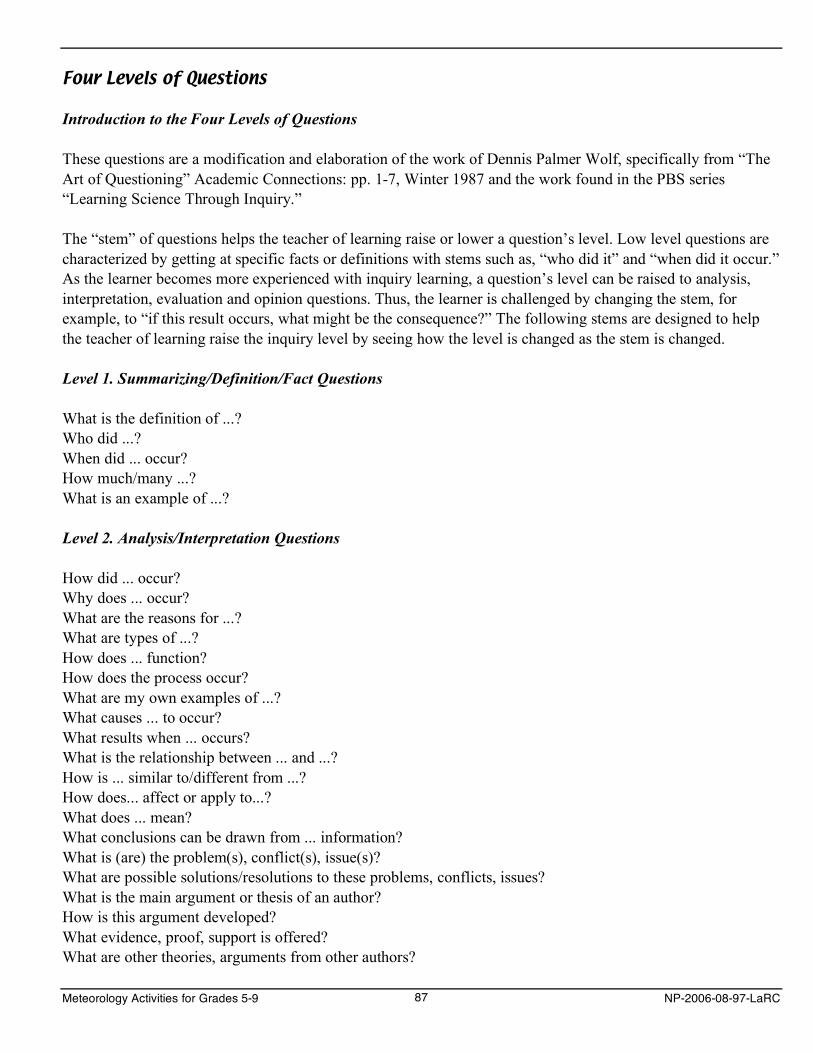
Four Levels of Questions
Introduction to the Four Levels of Questions
These questions are a modification and elaboration of the work of Dennis Palmer Wolf, specifically from “The Art of Questioning” Academic Connections: pp. 1-7, Winter 1987 and the work found in the PBS series “Learning Science Through Inquiry.”
The “stem” of questions helps the teacher of learning raise or lower a question’s level. Low level questions are characterized by getting at specific facts or definitions with stems such as, “who did it” and “when did it occur.” As the learner becomes more experienced with inquiry learning, a question’s level can be raised to analysis, interpretation, evaluation and opinion questions. Thus, the learner is challenged by changing the stem, for example, to “if this result occurs, what might be the consequence?” The following stems are designed to help the teacher of learning raise the inquiry level by seeing how the level is changed as the stem is changed.
Level 1. Summarizing/Definition/Fact Questions
What is the definition of ...?Who did ...?When did ... occur?How much/many ...?What is an example of ...?
Level 2. Analysis/Interpretation Questions
How did ... occur?Why does ... occur?What are the reasons for ...?What are types of ...?How does ... function?How does the process occur?What are my own examples of ...?What causes ... to occur?What results when ... occurs?What is the relationship between ... and ...?How is ... similar to/different from ...?How does... affect or apply to...?What does ... mean?What conclusions can be drawn from ... information?What is (are) the problem(s), conflict(s), issue(s)?What are possible solutions/resolutions to these problems, conflicts, issues?What is the main argument or thesis of an author?How is this argument developed?What evidence, proof, support is offered?What are other theories, arguments from other authors?
Meteorology Activities for Grades 5-9 87 NP-2006-08-97-LaRC
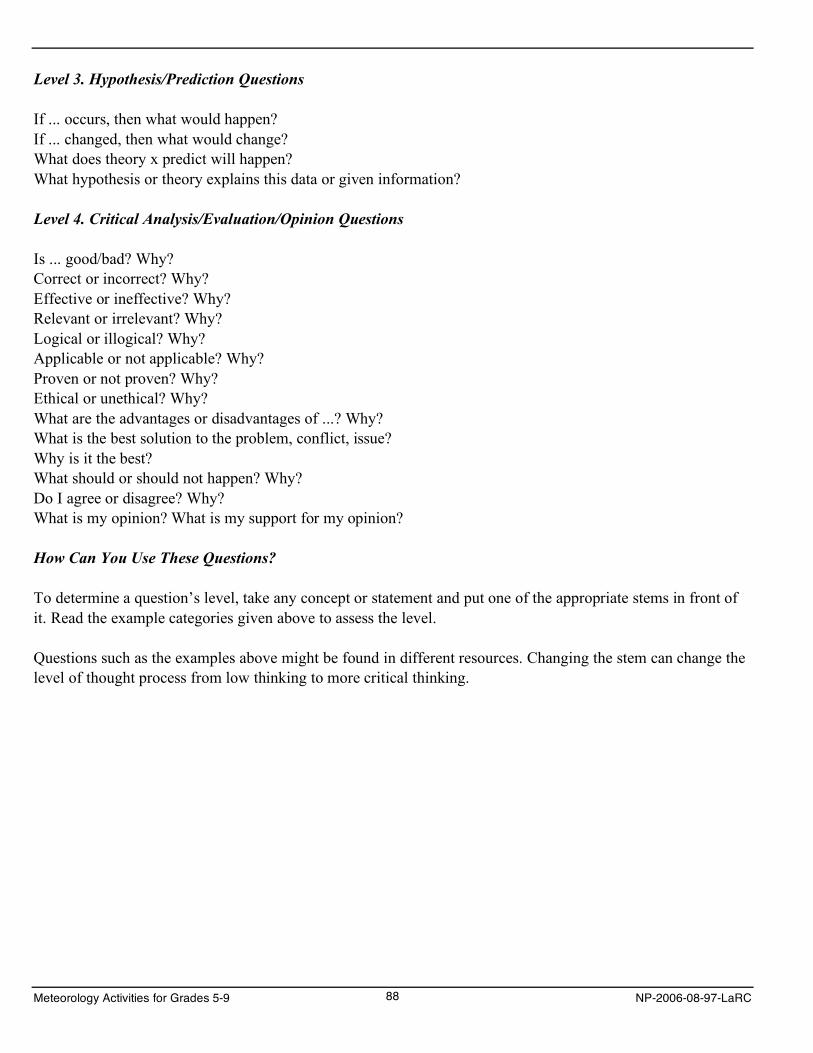
Level 3. Hypothesis/Prediction Questions
If ... occurs, then what would happen?If ... changed, then what would change?What does theory x predict will happen?What hypothesis or theory explains this data or given information?
Level 4. Critical Analysis/Evaluation/Opinion Questions
Is ... good/bad? Why?Correct or incorrect? Why?Effective or ineffective? Why?Relevant or irrelevant? Why?Logical or illogical? Why?Applicable or not applicable? Why?Proven or not proven? Why?Ethical or unethical? Why?What are the advantages or disadvantages of ...? Why?What is the best solution to the problem, conflict, issue?Why is it the best?What should or should not happen? Why?Do I agree or disagree? Why?What is my opinion? What is my support for my opinion?
How Can You Use These Questions?
To determine a question’s level, take any concept or statement and put one of the appropriate stems in front of it. Read the example categories given above to assess the level.
Questions such as the examples above might be found in different resources. Changing the stem can change the level of thought process from low thinking to more critical thinking.
Meteorology Activities for Grades 5-9 88 NP-2006-08-97-LaRC
APPENDIX II: Selected Weather Adages
The higher the clouds the better the weather.High clouds indicate fine weather will prevail.Lower clouds mean rain.
If all stars are out at night,it will be a nice day tomorrow.
When dew is on the grass,no rain will come to pass.
A setting red sun means it’ll be hot tomorrow.If the sun goes pale to bed ’twill rain tomorrow.
Red sky at night, sailors’ delight.Red sky in morning, sailors take warning.
The evening red and morning grayare sure signs of a fine day,but evening gray and morning redwill bring rain upon your head.
If red the sun begin his race,be sure the rain will fall apace.if red the sun set in gray,the next will be a rainy day.
When clouds look like rocks and towers,the Earth will be refreshed by showers.
If clouds look as if scratched by a hen,get ready to reef your topsails then.
Herringbone sky, neither too wet nor too dry. (Cirrus clouds have a herringbone pattern.)
Mackerel sky, not 24 hours dry.
Mackerel sky, storm is nigh.
Mackerel sky, mackerel sky — never long wet, never long dry.
Mackerel skies and mares’ tails make ships carry shortened sails.
Mares’ tails mean storms and gales.
Horses’ manes and mares’ tails, sailors soon shall shorten sails.
If clouds are gathering thick and fast, keep sharp look out for sail and mast, but if they slowly onward crawl, shoot your lines, nets and trawl.
Meteorology Activities for Grades 5-9 89 NP-2006-08-97-LaRC
When the wind is blowing in the NorthNo fisherman should set forth,When the wind is blowing in the East,’Tis not fit for man nor beast,When the wind is blowing in the SouthIt brings the food over the fish’s mouth,When the wind is blowing in the West,That is when the fishing is best!
No weather is ill, if the wind be still.
Every wind has its weather.
Yellow sky at sunset, wind in the morrow.
Rainbow in the morning,travelers take warning;rainbow at night,traveler's delight.
Rainbow in the eastern sky,the morrow will be dry.Rainbow in the west that gleams,rain falls in streams.
Grasshoppers chirp louder and louder the hotter it gets.
If wooly fleeces deck the heavenly way, be sure no rain will mar a summer's day.
When bees are out flying, there will be fair weather. When they stay close to the hive, rain is coming. (Bees do not swarm before a storm.)
March comes in like a lion, goes out like a lamb.
March winds bring April showers.
April showers bring May flowers.
Find more adages at these Web sites: http://users.tpg.com.au/sharenet/wea/forecast.html http://www.moonsmuses.com/weatherlore.html
Meteorology Activities for Grades 5-9 90 NP-2006-08-97-LaRC
APPENDIX III: The Scientific Habits of Mind* and Conceptual Themes Addressed in This Publication
Scientific Habits of Mind
The work of the 1966 Education Policies Commission serves as the foundation for addressing the “scientific habits of mind” found in this publication. “In 1966, the Education Policies Commission, recognizing the key role that could be played by science education in developing the ability to think, published a document, Education and the Spirit of Science, which emphasized science not so much as a body of accumulated knowledge but as a way of thinking, a spirit of rational inquiry driven by a belief in its efficiency and by a restless curiosity to know and understand.”
While the commission recognized that no scientist may fully exemplify the spirit of science and no work can be completely objective, it is clear that the following key values underlie science as an enterprise:
• Longing to know and understand • Questioning all things • Searching for data and their meanings • Demanding verification • Respecting logic • Considering the premises • Considering the consequences
It is believed that the more objective nature of these listed scientific habits of mind will encourage and enable educators to better nurture their development in learners.
Conceptual Themes
Conceptual themes used effectively can set specific content in a broad context to enable learners to better understand how the natural and human-designed worlds are organized, change and interrelate, thus enabling a better transfer and application of knowledge. In this publication, the first-level conceptual themes are inter-disciplinary so as to provide curriculum developers appropriate links across disciplines.
Three broad first-level conceptual themes used in this publication are:
• Organization • Change • Interrelationships
*Lawson, 1995.
Meteorology Activities for Grades 5-9 91 NP-2006-08-97-LaRC

Meteorology Activities for Grades 5-9 92 NP-2006-08-97-LaRC
APPENDIX IV: Specific National Science Education Standards Addressed In This Publication
Unifying Concepts and Processes Standard
“Conceptual and procedural schemes unify science disciplines and provide students with powerful ideas to help them understand the natural world. Because of the underlying principles embodied in this standard, the understandings and abilities described here are repeated in the other content standards. Unifying concepts and processes include:
• Systems, order, and organization. • Evidence, models, and explanation. • Change, constancy, and measurement. • Evolution and equilibrium. • Form and function.”
Science As Inquiry Standards
“In the vision presented by the Standards, inquiry is a step beyond “science as a process,” in which students learn skills, such as observation, inference, and experimentation. The new vision includes the “processes of science” and requires that students combine processes and scientific knowledge as they use scientific reasoning and critical thinking to develop their understanding of science. Engaging students in inquiry helps students develop:
• Understanding of scientific concepts. • An appreciation of “how we know” what we know in science. • Understanding of the nature of science. • Skills necessary to become independent inquirers about the natural world. • The dispositions to use the skills, abilities, and attitudes associated with science.”
Science As Content Standards
As a result of their activities in grades 5-8 all students should develop an understanding of • Structure of the Earth system. • Water evaporates from the Earth’s surface, rises, cools as it rises to higher elevations,
condenses as rain or snow and falls to the surface.• The atmosphere is a mixture of nitrogen, oxygen, and trace gases that include water
vapor.• Clouds, formed by condensation of water vapor, affect weather and climate. • Global patterns of atmospheric movement influence local weather. • The sun is the major source of energy for phenomena on the Earth’s surface, such as
the movement of air masses and winds.• As the number of parts of a system increases, the number of possible interactions between pairs of parts
increases much more rapidly.
Meteorology Activities for Grades 5-9 93 NP-2006-08-97-LaRC
The Nature of Technology
Standard 1: Students will develop an understanding of the characteristics and scope of technology.
Standard 2: Students will develop an understanding of the core concepts of technology.
Standard 3: Students will develop an understanding of the relationships among technologies and theconnections between technology and other fields of study.
Technology and Society
Standard 4: Students will develop an understanding of the cultural, social, economic, and political effects of technology.
Standard 5: Students will develop an understanding of the effects of technology on the environment.
Standard 6: Students will develop an understanding of the role of society in the development and use of technology.
Standard 7: Students will develop an understanding of the influence of technology on history.
Design
Standard 8: Students will develop an understanding of the attributes of design.
Standard 9: Students will develop an understanding of engineering design.
Standard 10: Students will develop an understanding of the role of troubleshooting, research and development, invention and innovation, and experimentation in problem solving.
Abilities for a Technological World
Standard 11: Students will develop abilities to apply the design process.
Standard 12: Students will develop abilities to use and maintain technological products and systems.
Standard 13: Students will develop abilities to assess the impact of products and systems.
The Designed World
Standard 16: Students will develop an understanding of and be able to select and use energy and power technologies.
Standard 17: Students will develop an understanding of and be able to select and use information and communication technologies.
Standard 20: Students will develop an understanding of and be able to select and use construction technologies.
Meteorology Activities for Grades 5-9 94 NP-2006-08-97-LaRC
APPENDIX V: Web Sites for Enhancing the Understanding of Weather
The following Web sites have been selected to enhance understanding of the activities presented in this booklet. Some are selected because they give more specific information about the essential knowledge and context for meteorology. Others provide additional insight into the tools and apparatus for measuring aspects of meteoro-logical factors. You should feel free to add to this list of Web sites.
Inquiry Learning
Networking for Leadership, Inquiry and Systemic Thinking (NLIST) http://www.nlistinquiryscience.com
NASA Weather Materials
On-line Lessons and Resources http://www.nasa.gov/audience/foreducators
The Case of the Phenomenal Weather (Scroll to 2001-2002 Season) http://scifiles.larc.nasa.gov/episodes.html
Wild Weather Adventure Game http://spaceplace.nasa.gov/en/kids/goes/wwa/
El Niño http://spaceplace.nasa.gov/en/kids/topex_make1.shtml
The Earth Observing System http://eospso.gsfc.nasa.gov
Tropical Rainfall Measuring Mission (TRMM) http://trmm.gsfc.nasa.gov/education_dir/education.html
TRMM Data Products http://trmm.gsfc.nasa.gov/data_dir/data.html
The CERES S’COOL Project http://asd-www.larc.nasa.gov/SCOOL/
NASA/NOAA Cloud Chart http://science-edu.larc.nasa.gov/cloud_chart/
NASA’s CloudSat Mission http://www.nasa.gov/mission_pages/cloudsat/main
Short NASA videoclips including weather, clouds, hurricanes and Hurricane Hunters http://www.nasa.gov/education/nasaeclips
Meteorology Activities for Grades 5-9 95 NP-2006-08-97-LaRC
Weather Resources
USA Today Education Online: Science Of Weather http://www.usatoday.com/educate/scienceofweather
Weather and Climate Information http://www.globe.gov/cgi-bin/resourceroom.cgi?parentid=25&lang=en&nav=1
NOAA Education Resources http://www.education.noaa.gov
NOAA Jetstream —an Online School for Weather http://www.srh.noaa.gov/srh/jetstream
The Weather Channel http://www.weather.com
The Weather Channel Kids http://www.theweatherchannelkids.com
National Severe Storms Laboratory http://www.nssl.noaa.gov/edu/
Skywatchers http://www.on.ec.gc.ca/skywatchers
Science of Weather http://www.usatoday.com/educate/scienceofweather
Optics for Kids http://www.opticalres.com/kidoptx_f.html#LightBasics
Converting Between Fahrenheit and Celsius Temperature Scaleshttp://www.usatoday.com/weather/wtempcf.htm
Folklore
Folklore Weather Forecasting http://tww.id.au/wea/weather.html
Weather Lore & Why http://en.wikipedia.org/wiki/Weather_lore
Meteorology Activities for Grades 5-9 96 NP-2006-08-97-LaRC
Eardrums and Changes In Pressure Cabin Pressurization http://en.wikipedia.org/wiki/Cabin_pressurization Gas Collections Within the Body http://www.pilotfriend.com/aeromed/medical/ascent_descent.htm Traveling in the Mountains and Ear Drum Pressure http://answers.google.com/answers/threadview?id=764673
The Boiling Point of Water
Under Pressure http://www.sfsite.com/fsf/2001/pmpd0110
Boiling Water http://astro.uchicago.edu/cara/southpole.edu/boil.html
The International Boiling Point Project http://www.k12science.org/curriculum/boilproj
Humidity and Moisture in the Air
Water Science for Schools: The Water Cycle http://ga.water.usgs.gov/edu/watercycle.html
Aviation Weather http://virtualskies.arc.nasa.gov/weather/tutorial/tutorial4.html
Observing Moisture http://www.miamisci.org/hurricane/moisture.html
Water Vapor, Humidity, Dewpoint and Relationship to Precipitation http://www.crh.noaa.gov/lmk/soo/docu/humidity.php
Snow and Winter Storms http://www.oswego.edu/wscp/SNOW.htm
Meteorology Activities for Grades 5-9 97 NP-2006-08-97-LaRC
Weather Prediction and Meteorological Instruments Make Your Own Weather Station http://sln.fi.edu/weather/todo/todo.html Meteorological Instruments http://www.infoplease.com/encyclopedia/1metinst.html?mail-10-28 Making Weather Instruments http://www.on.ec.gc.ca/skywatchers/makingInstruments_e.html Building a Psychrometer http://school.discovery.com/lessonplans/activities/weatherstation/airwaterboth.html Using a Psychrometric Chart to Describe Air Properties http://www.continentalconsulting.net/news_detail.php?NewsArticleID=3 Dry Bulb, Wet Bulb and Dew Point Temperature http://www.engineeringtoolbox.com/dry-wet-bulb-dew-point-air-d_682.html Wet-Bulb Temperature http://en.wikipedia.org/wiki/Wet-bulb_temperature Hygrometer http://en.wikipedia.org/wiki/Hygrometer Data Analysis and Measurement: a Head, Above the Clouds http://connect.larc.nasa.gov/programs/2000-2001/ahead_clouds.html STORM-E Weather Simulator http://storme.cet.edu Suggestions About Weather Modification http://www.space.com/scienceastronomy/051031_mystery_monday.html
Severe Weather Severe Weather Primer http://www.nssl.noaa.gov/primer/ Beaufort Scale http://en.wikipedia.org/wiki/Beaufort_scale Beaufort Wind Scale http://www.spc.noaa.gov/faq/tornado/beaufort.html
Meteorology Activities for Grades 5-9 98 NP-2006-08-97-LaRC
Hurricanes What is a Hurricane? http://www.nationalgeographic.com/forcesofnature/interactive/index.html?section=h Mystery of Hurricane Formation http://earthobservatory.nasa.gov/Newsroom/NasaNews/2005/2005092320505.html How Do Hurricanes Form? http://spaceplace.nasa.gov/en/kids/goes/hurricanes/index.shtml How Hurricanes Work http://www.miamisci.org/hurricane/howhurrwork.html Saffir-Simpson Hurricane Scale http://en.wikipedia.org/wiki/Saffir-Simpson_Hurricane_Scale Make Your Own Hurricane http://www.nationalgeographic.com/forcesofnature/interactive/index.html?section=h Hurricane Tracking http://www.hurricanetrack.com NASA’s Hurricane Resource Page http://www.nasa.gov/mission_pages/hurricanes/main Looking At Hurricanes http://learners.gsfc.nasa.gov/mediaviewer/sat_super/ Hurricane Birth Through Death Animation and Story http://learners.gsfc.nasa.gov/mediaviewer/birth_hurr/ Hurricane Education http://www.nasa.gov/vision/earth/lookingatearth/hurricane_educ_links.html NOAA Costly Hurricanes http://www.nhc.noaa.gov/pastcost.shtml The 2006 Hurricane Season Was Near Normal http://earthobservatory.nasa.gov/Newsroom/NasaNews/2007/2007011824146.html
Meteorology Activities for Grades 5-9 99 NP-2006-08-97-LaRC
Tornadoes
All About Tornadoes http://www.livescience.com/tornadoes/
Tornadoes In the Southern United States http://earthobservatory.nasa.gov/NaturalHazards/natural_hazards_v2.php3?img_id=13506
Tornado Information for Kids http://www.fema.gov/kids/tornado.htm
Twister: The Tornado Story http://whyfiles.org/013tornado
Tornadoes Are Earth’s Most Violent Storms http://www.usatoday.com/weather/resources/2006-04-03-tornado-basics_x.htm
Severe Weather and Natural Disasters http://teacher.scholastic.com/activities/wwatch/tornadoes
Tornadoes On The Sun http://apod.gsfc.nasa.gov/apod/ap980429.html
Spotting Tornadoes From Space http://science.nasa.gov/headlines/y2000/ast01may_1m.htm
The Fujita Pearson Tornado Scale http://www.fema.gov/kids/fscale.htm
The Fujita Scale http://en.wikipedia.org/wiki/Fujita_scale
The Fujita Scale http://www.tornadoproject.com/fscale/fscale.htm
The Fujita Scale as It Relates to the Beaufort and Saffir-Simpson Scales http://www.windows.ucar.edu/tour/link=/earth/Atmosphere/tornado/fujita.html
Meteorology Activities for Grades 5-9 100 NP-2006-08-97-LaRC
Severe Weather Preparedness National Hurricane Center http://www.nhc.noaa.gov/HAW2/english/intro.shtml Hurricane Warning http://www.hurricanewarning.org American Red Cross http://www.redcross.org Federal Emergency Management Agency (FEMA) http://www.fema.gov Pacific Disaster Center http://www.pdc.org
Clouds Head In The Clouds (Cloudspotter Wheel) http://www.srh.weather.gov/srh/jetstream/synoptic/ll_clouds1.htm Cloud Classifications (Sky Watcher Chart) http://www.srh.noaa.gov/srh/jetstream/synoptic/clouds_max.htm NASA/NOAA Cloud Chart http://science-edu.larc.nasa.gov/cloud_chart/ One-page Cloud ID Chart http://asd-www.larc.nasa.gov/SCOOL/Cloud_ID.html Cloud Appreciation Society Cloud Gallery http://www.cloudappreciationsociety.org/gallery/index.php?x=browse&category=39&pagenum=1>http://www. cloudappreciationsociety.org/gallery/index.php?x=browse&category=39&pagenum=1 An Illustration of Cloud Types http://forspaciousskies.com U.S. Postal Service Postage Stamps Illustrating Cloud Types http://www.lightwatcher.com/chemtrails/Cloudscapes.html
Meteorology Activities for Grades 5-9 101 NP-2006-08-97-LaRC
Careers in Meteorology Careers in Atmospheric Research and Applied Meteorology http://www.ametsoc.org/pubs/careers.html Careers In Meteorology http://www.theweatherchannelkids.com/weather-ed/careers-in-meteorology/ National Weather Service Careers http://www.weather.gov/careers.php About Meteorology Career Options http://www.nssl.noaa.gov/faq/faq_careers.php Meteorology Graduate School Programs http://www.gradschools.com/listings/menus/meteorology_menu.html American Meteorological Society Career Center http://www.ametsoc.org/careercenter/index.html Careers In Meteorology http://www.black-collegian.com/career/career-reports/meteorology2006-2nd.shtml Careers In Weather http://www.usatoday.com/weather/resources/askjack/wacareer.htm
Meteorology Activities for Grades 5-9 102 NP-2006-08-97-LaRC
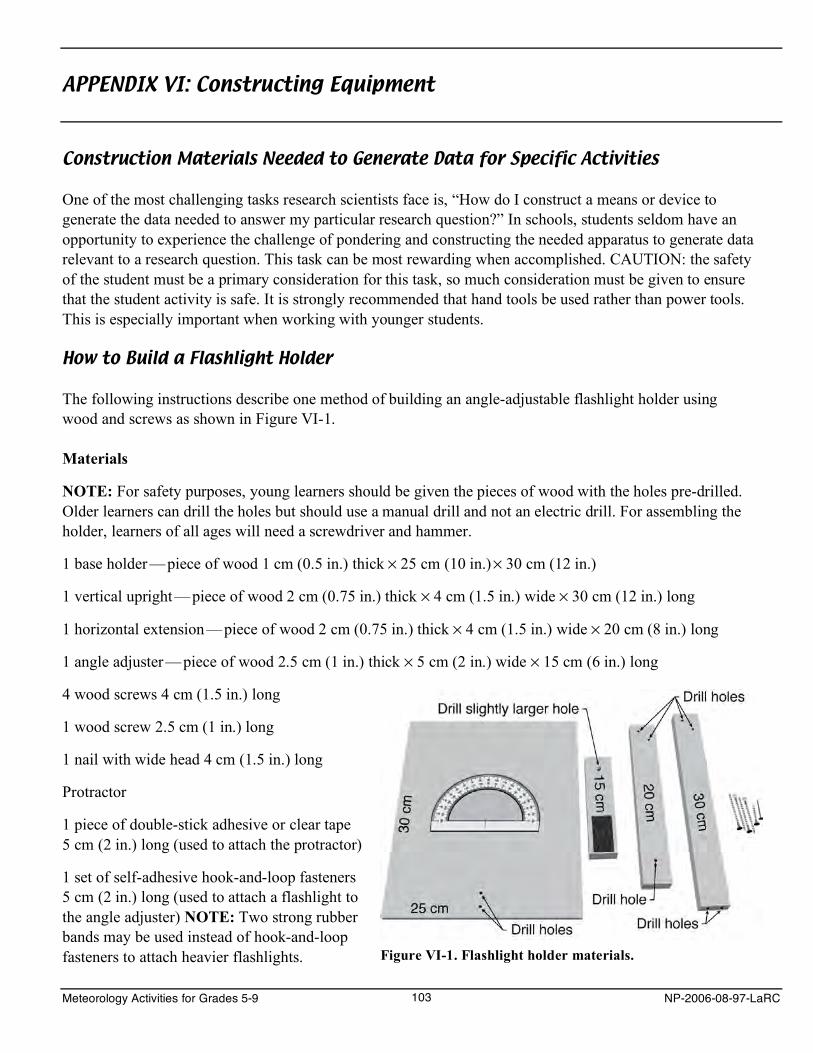
APPENDIX VI: Constructing Equipment
Construction Materials Needed to Generate Data for Specific Activities
One of the most challenging tasks research scientists face is, “How do I construct a means or device to generate the data needed to answer my particular research question?” In schools, students seldom have an opportunity to experience the challenge of pondering and constructing the needed apparatus to generate data relevant to a research question. This task can be most rewarding when accomplished. CAUTION: the safety of the student must be a primary consideration for this task, so much consideration must be given to ensure that the student activity is safe. It is strongly recommended that hand tools be used rather than power tools. This is especially important when working with younger students.
How to Build a Flashlight Holder
The following instructions describe one method of building an angle-adjustable flashlight holder using wood and screws as shown in Figure VI-1.
Materials
NOTE: For safety purposes, young learners should be given the pieces of wood with the holes pre-drilled. Older learners can drill the holes but should use a manual drill and not an electric drill. For assembling the holder, learners of all ages will need a screwdriver and hammer.
1 base holder —piece of wood 1 cm (0.5 in.) thick × 25 cm (10 in.) × 30 cm (12 in.)
1 vertical upright —piece of wood 2 cm (0.75 in.) thick × 4 cm (1.5 in.) wide × 30 cm (12 in.) long
1 horizontal extension —piece of wood 2 cm (0.75 in.) thick × 4 cm (1.5 in.) wide × 20 cm (8 in.) long
1 angle adjuster —piece of wood 2.5 cm (1 in.) thick × 5 cm (2 in.) wide × 15 cm (6 in.) long
4 wood screws 4 cm (1.5 in.) long
1 wood screw 2.5 cm (1 in.) long
1 nail with wide head 4 cm (1.5 in.) long
Protractor
1 piece of double-stick adhesive or clear tape 5 cm (2 in.) long (used to attach the protractor)
1 set of self-adhesive hook-and-loop fasteners 5 cm (2 in.) long (used to attach a flashlight to the angle adjuster) NOTE: Two strong rubber bands may be used instead of hook-and-loop fasteners to attach heavier flashlights. Figure VI-1. Flashlight holder materials.
Meteorology Activities for Grades 5-9 103 NP-2006-08-97-LaRC
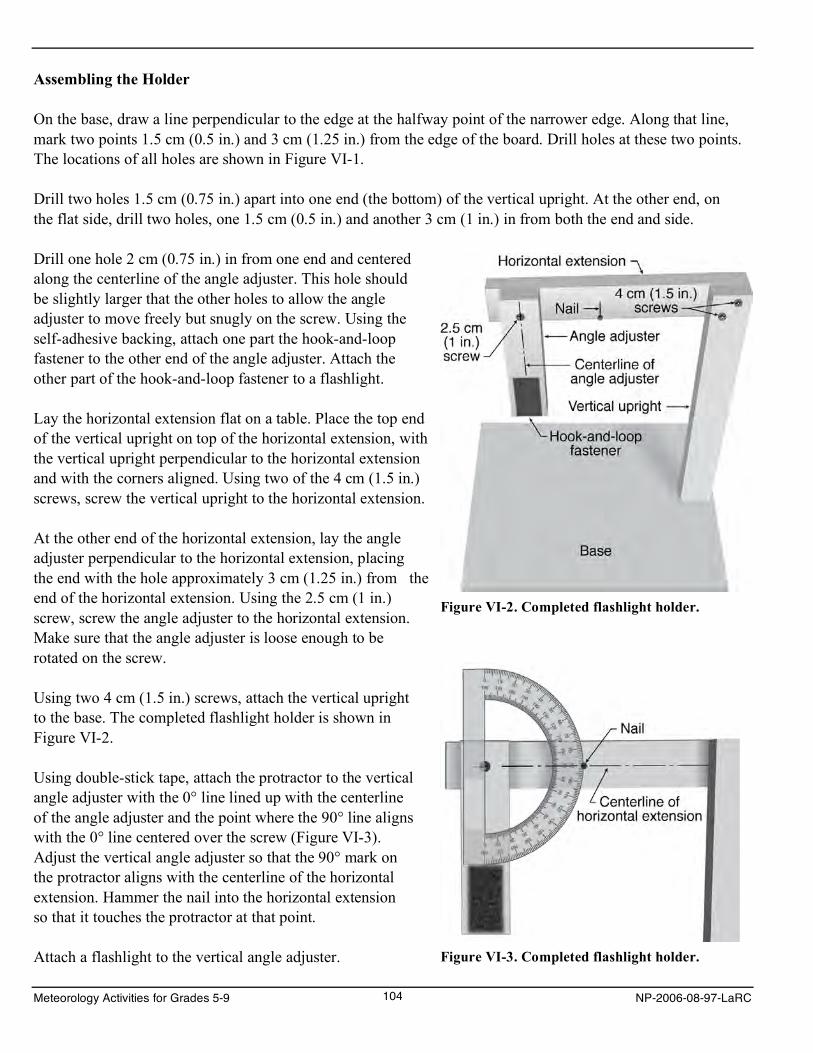
Assembling the Holder
On the base, draw a line perpendicular to the edge at the halfway point of the narrower edge. Along that line, mark two points 1.5 cm (0.5 in.) and 3 cm (1.25 in.) from the edge of the board. Drill holes at these two points. The locations of all holes are shown in Figure VI-1.
Drill two holes 1.5 cm (0.75 in.) apart into one end (the bottom) of the vertical upright. At the other end, on the flat side, drill two holes, one 1.5 cm (0.5 in.) and another 3 cm (1 in.) in from both the end and side.
Drill one hole 2 cm (0.75 in.) in from one end and centered along the centerline of the angle adjuster. This hole should be slightly larger that the other holes to allow the angle adjuster to move freely but snugly on the screw. Using the self-adhesive backing, attach one part the hook-and-loop fastener to the other end of the angle adjuster. Attach the other part of the hook-and-loop fastener to a flashlight.
Lay the horizontal extension flat on a table. Place the top end of the vertical upright on top of the horizontal extension, with the vertical upright perpendicular to the horizontal extension and with the corners aligned. Using two of the 4 cm (1.5 in.) screws, screw the vertical upright to the horizontal extension.
At the other end of the horizontal extension, lay the angle adjuster perpendicular to the horizontal extension, placing the end with the hole approximately 3 cm (1.25 in.) from the end of the horizontal extension. Using the 2.5 cm (1 in.) screw, screw the angle adjuster to the horizontal extension. Make sure that the angle adjuster is loose enough to be rotated on the screw.
Using two 4 cm (1.5 in.) screws, attach the vertical upright to the base. The completed flashlight holder is shown in Figure VI-2.
Using double-stick tape, attach the protractor to the vertical angle adjuster with the 0° line lined up with the centerline of the angle adjuster and the point where the 90° line aligns with the 0° line centered over the screw (Figure VI-3). Adjust the vertical angle adjuster so that the 90° mark on the protractor aligns with the centerline of the horizontal extension. Hammer the nail into the horizontal extension so that it touches the protractor at that point.
Attach a flashlight to the vertical angle adjuster.
Figure VI-2. Completed flashlight holder.
Figure VI-3. Completed flashlight holder.
Meteorology Activities for Grades 5-9 104 NP-2006-08-97-LaRC
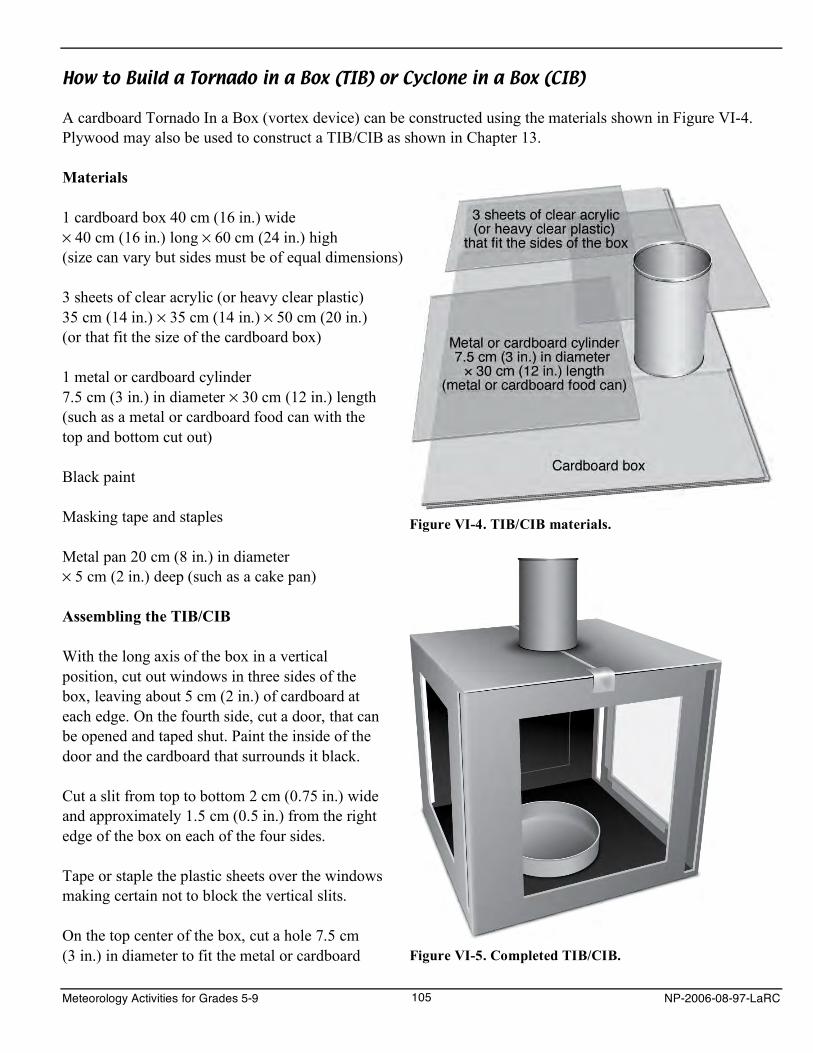
How to Build a Tornado in a Box (TIB) or Cyclone in a Box (CIB)
A cardboard Tornado In a Box (vortex device) can be constructed using the materials shown in Figure VI-4. Plywood may also be used to construct a TIB/CIB as shown in Chapter 13.
Materials
1 cardboard box 40 cm (16 in.) wide × 40 cm (16 in.) long × 60 cm (24 in.) high (size can vary but sides must be of equal dimensions)
Figure VI-4. TIB/CIB materials.
3 sheets of clear acrylic (or heavy clear plastic) 35 cm (14 in.) × 35 cm (14 in.) × 50 cm (20 in.) (or that fit the size of the cardboard box)
1 metal or cardboard cylinder 7.5 cm (3 in.) in diameter × 30 cm (12 in.) length (such as a metal or cardboard food can with the top and bottom cut out)
Black paint
Masking tape and staples
Metal pan 20 cm (8 in.) in diameter × 5 cm (2 in.) deep (such as a cake pan)
Assembling the TIB/CIB
With the long axis of the box in a vertical position, cut out windows in three sides of the box, leaving about 5 cm (2 in.) of cardboard at each edge. On the fourth side, cut a door, that can be opened and taped shut. Paint the inside of the door and the cardboard that surrounds it black.
Cut a slit from top to bottom 2 cm (0.75 in.) wide and approximately 1.5 cm (0.5 in.) from the right edge of the box on each of the four sides.
Tape or staple the plastic sheets over the windows making certain not to block the vertical slits.
On the top center of the box, cut a hole 7.5 cm (3 in.) in diameter to fit the metal or cardboard Figure VI-5. Completed TIB/CIB.
Meteorology Activities for Grades 5-9 105 NP-2006-08-97-LaRC
cylinder. Position the cylinder over the hole and tape it securely into the hole leaving approximately 25 cm (10 in.) of length extending above the top of the box to form a chimney.
After the box is constructed, place the 8-inch pan on the floor of the box so that heated water can be poured into it.
The completed TIB/CIB is shown in Figure VI-5.
Meteorology Activities for Grades 5-9 106 NP-2006-08-97-LaRC
APPENDIX VII: Additional Activities
The following activities have been included for use by the teacher in further facilitating interest in the study of meteorology. These activities can be used without modification, modified by learner or teacher or in other ways as best determined by the teacher for best meeting the needs of the learner.
Most of these activities fall within the confirmation-verification and structured-inquiry categories. Since the learner has come to understand the different levels of inquiry, one challenge could be to have them modify the activities to make them more challenging by adding the necessary directions to make them guided and/or open-inquiry types.
NOTE: Some of these activities are modified and credit-cited and others have been used unmodified and credit-cited.
Meteorology Activities for Grades 5-9 107 NP-2006-08-97-LaRC

Meteorology Activities for Grades 5-9 108 NP-2006-08-97-LaRC
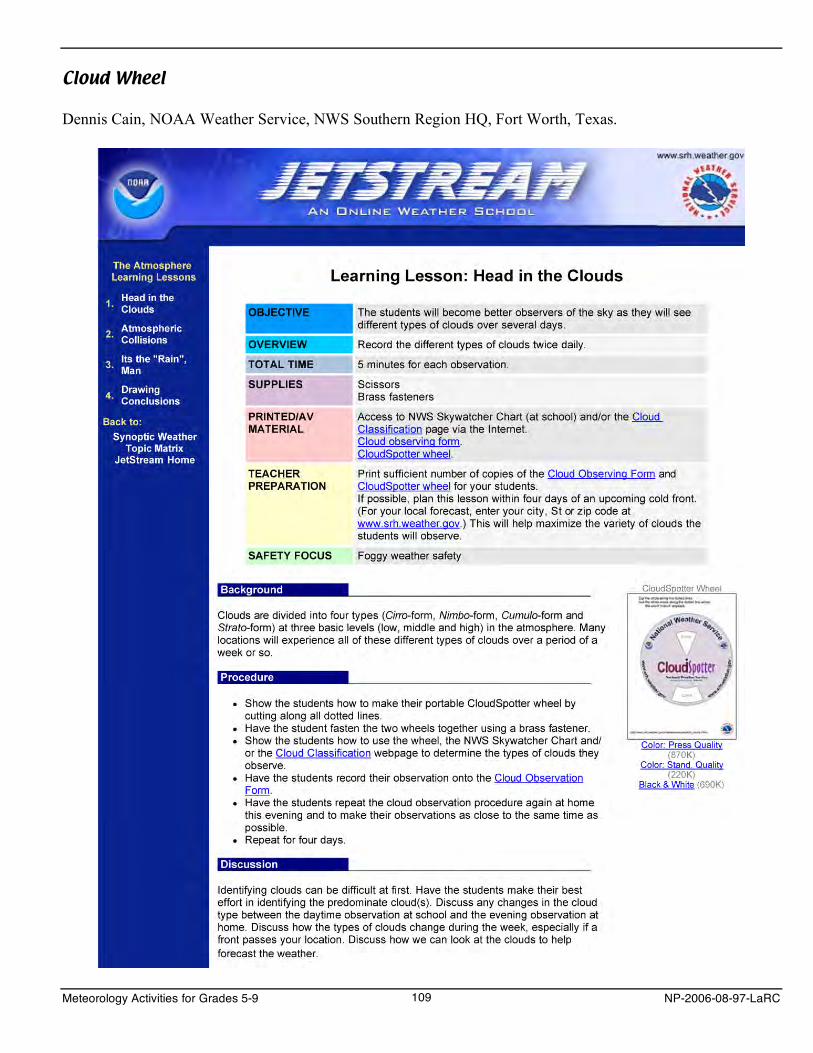
Cloud Wheel
Dennis Cain, NOAA Weather Service, NWS Southern Region HQ, Fort Worth, Texas.
Meteorology Activities for Grades 5-9 109 NP-2006-08-97-LaRC

Meteorology Activities for Grades 5-9 110 NP-2006-08-97-LaRC
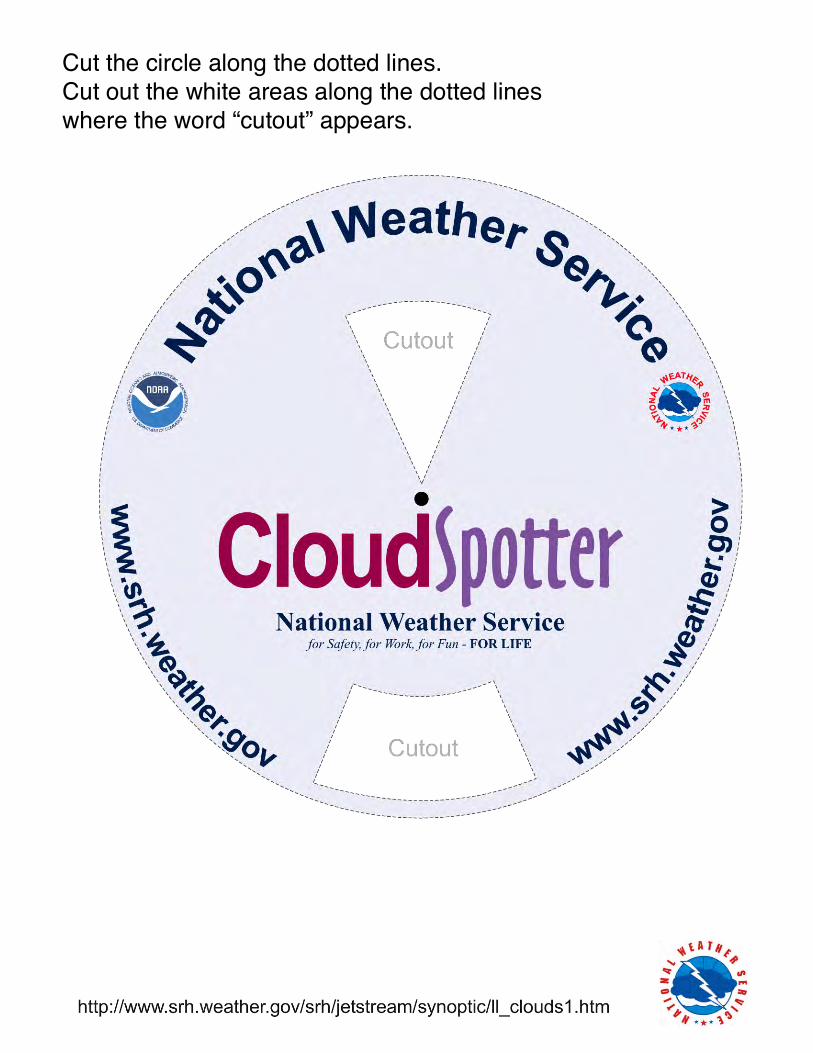
Cut the circle along the dotted lines.Cut out the white areas along the dotted lineswhere the word “cutout” appears.

Meteorology Activities for Grades 5-9 NP-2006-08-97-LaRC 112
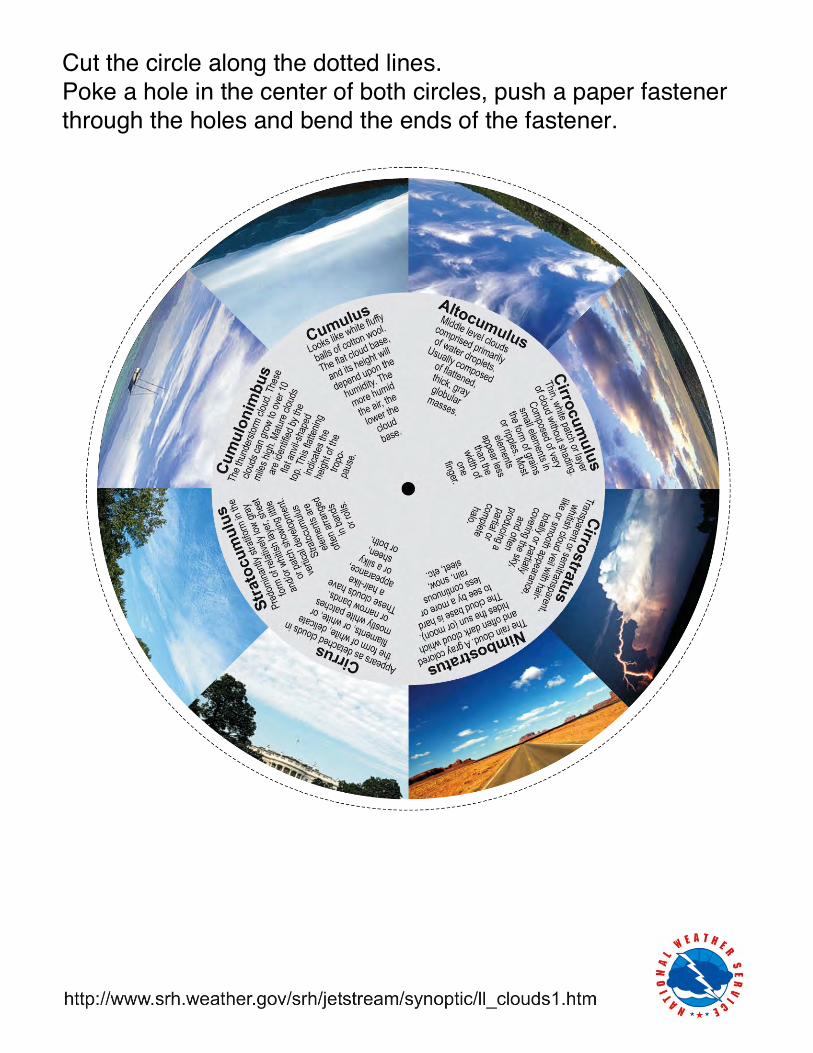
Cut the circle along the dotted lines.Poke a hole in the center of both circles, push a paper fastener through the holes and bend the ends of the fastener.

Meteorology Activities for Grades 5-9 114 NP-2006-08-97-LaRC
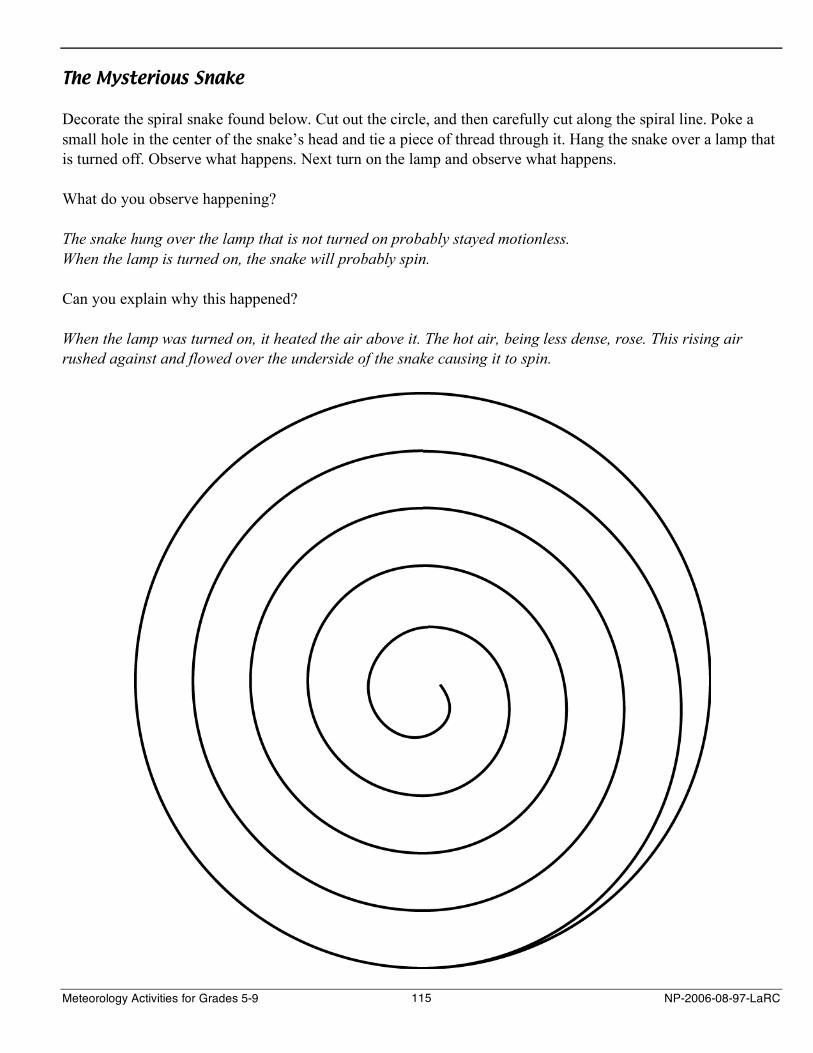
The Mysterious Snake
Decorate the spiral snake found below. Cut out the circle, and then carefully cut along the spiral line. Poke a small hole in the center of the snake’s head and tie a piece of thread through it. Hang the snake over a lamp that is turned off. Observe what happens. Next turn on the lamp and observe what happens.
What do you observe happening?
The snake hung over the lamp that is not turned on probably stayed motionless. When the lamp is turned on, the snake will probably spin.
Can you explain why this happened?
When the lamp was turned on, it heated the air above it. The hot air, being less dense, rose. This rising air rushed against and flowed over the underside of the snake causing it to spin.
Meteorology Activities for Grades 5-9 115 NP-2006-08-97-LaRC

Meteorology Activities for Grades 5-9 116 NP-2006-08-97-LaRC
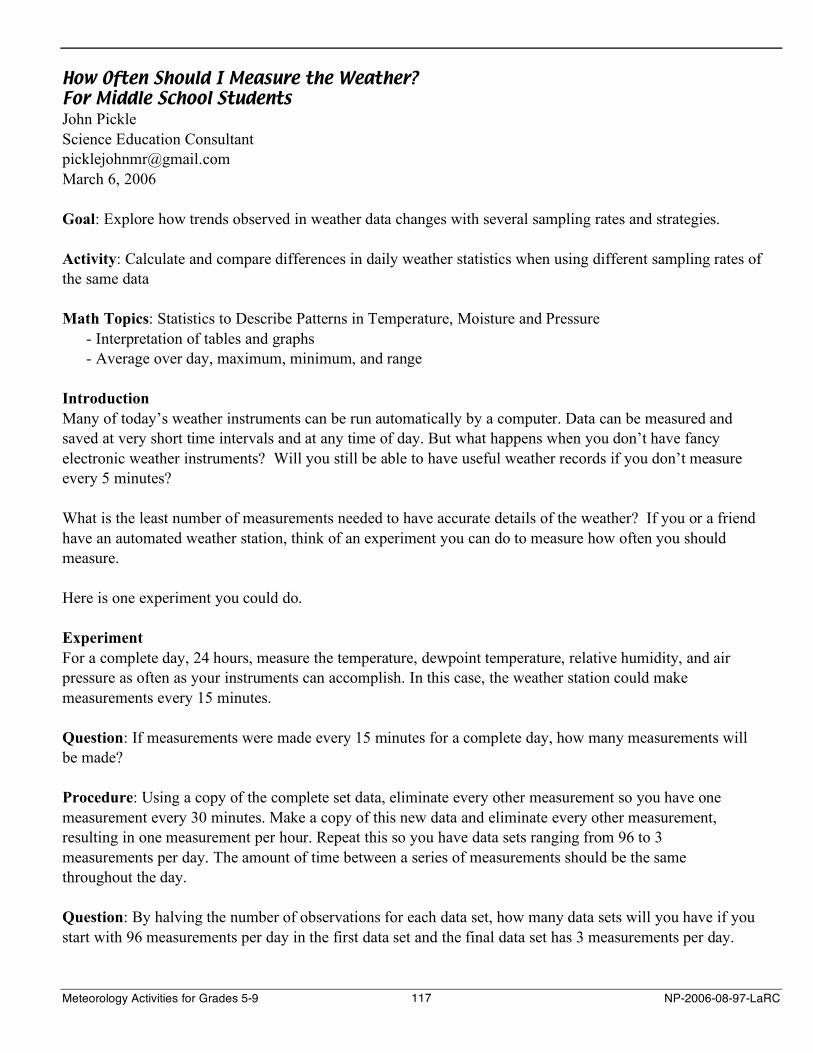
How Often Should I Measure the Weather? For Middle School Students John Pickle Science Education Consultant [email protected] March 6, 2006
Goal: Explore how trends observed in weather data changes with several sampling rates and strategies.
Activity: Calculate and compare differences in daily weather statistics when using different sampling rates of the same data
Math Topics: Statistics to Describe Patterns in Temperature, Moisture and Pressure - Interpretation of tables and graphs - Average over day, maximum, minimum, and range
Introduction Many of today’s weather instruments can be run automatically by a computer. Data can be measured and saved at very short time intervals and at any time of day. But what happens when you don’t have fancy electronic weather instruments? Will you still be able to have useful weather records if you don’t measure every 5 minutes?
What is the least number of measurements needed to have accurate details of the weather? If you or a friend have an automated weather station, think of an experiment you can do to measure how often you should measure.
Here is one experiment you could do.
Experiment For a complete day, 24 hours, measure the temperature, dewpoint temperature, relative humidity, and air pressure as often as your instruments can accomplish. In this case, the weather station could make measurements every 15 minutes.
Question: If measurements were made every 15 minutes for a complete day, how many measurements will be made?
Procedure: Using a copy of the complete set data, eliminate every other measurement so you have one measurement every 30 minutes. Make a copy of this new data and eliminate every other measurement, resulting in one measurement per hour. Repeat this so you have data sets ranging from 96 to 3 measurements per day. The amount of time between a series of measurements should be the same throughout the day.
Question: By halving the number of observations for each data set, how many data sets will you have if you start with 96 measurements per day in the first data set and the final data set has 3 measurements per day.
Meteorology Activities for Grades 5-9 117 NP-2006-08-97-LaRC
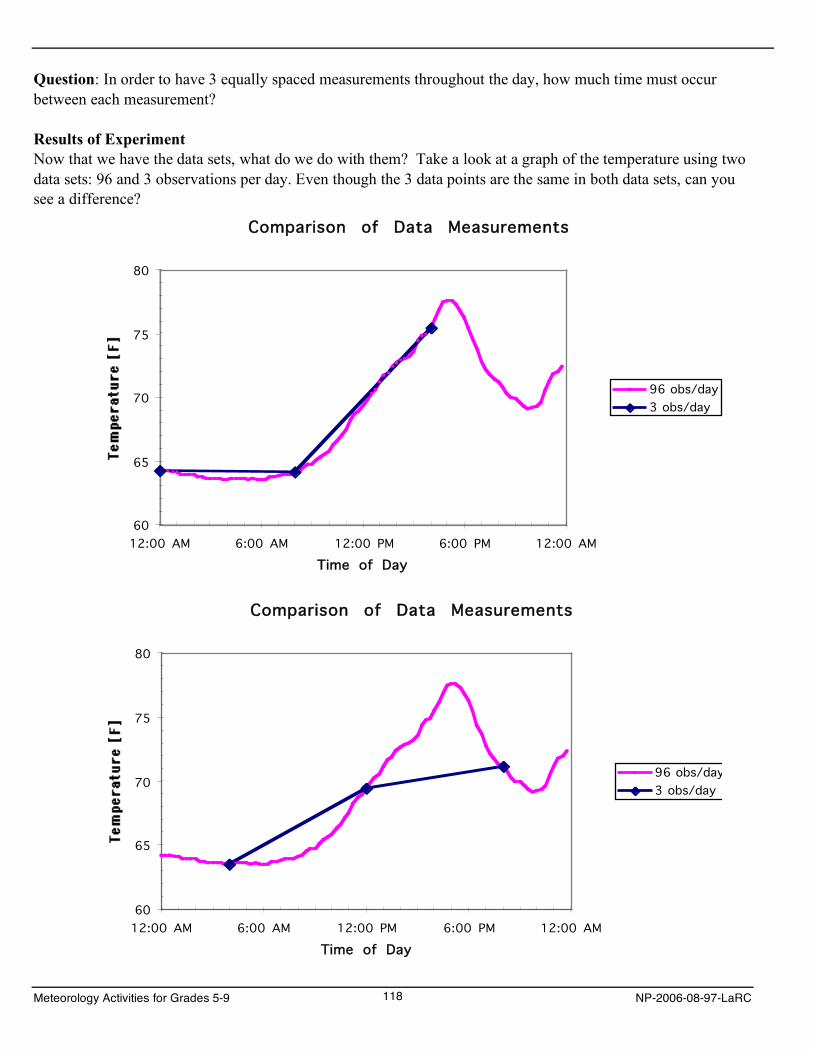
Question: In order to have 3 equally spaced measurements throughout the day, how much time must occur between each measurement?
Results of Experiment Now that we have the data sets, what do we do with them? Take a look at a graph of the temperature using two data sets: 96 and 3 observations per day. Even though the 3 data points are the same in both data sets, can you see a difference?
Comparison of Data Measurements
60
65
70
75
80
12:00 AM 6:00 AM 12:00 PM 6:00 PM 12:00 AM
Time of Day
96 obs/day
3 obs/day
Comparison of Data Measurements
60
65
70
75
80
12:00 AM 6:00 AM 12:00 PM 6:00 PM 12:00 AM
Time of Day
96 obs/day
3 obs/day
Meteorology Activities for Grades 5-9 118 NP-2006-08-97-LaRC
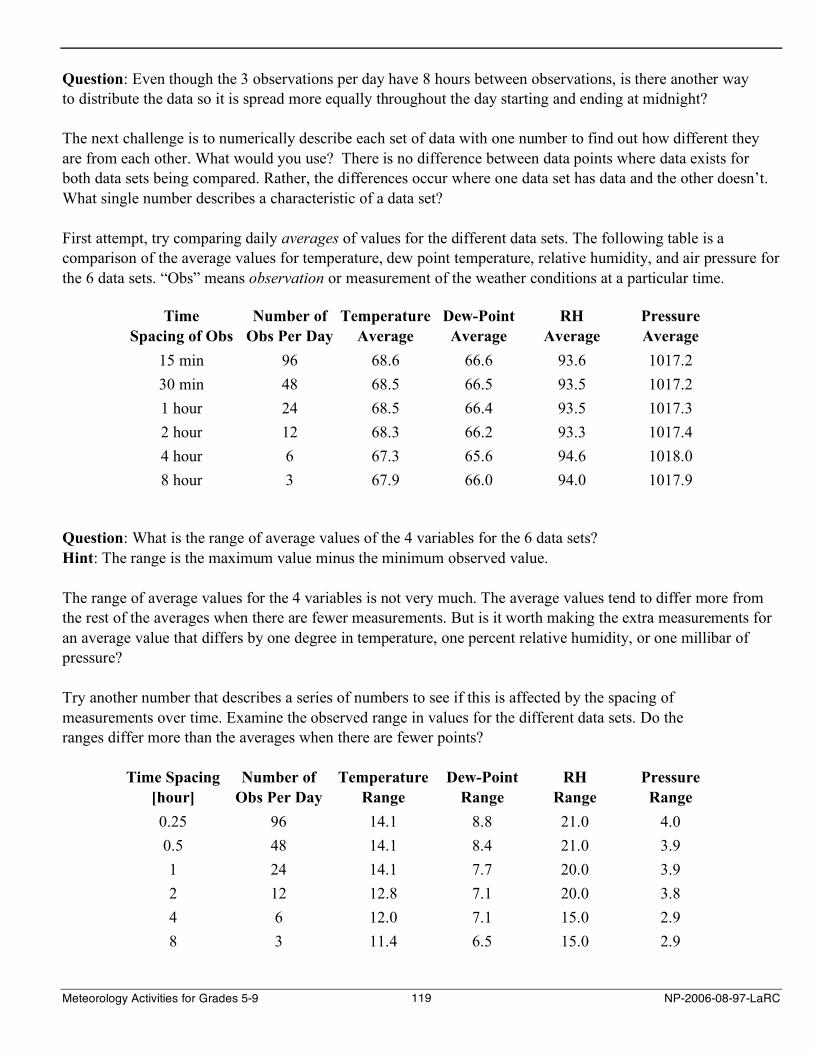
Question: Even though the 3 observations per day have 8 hours between observations, is there another way to distribute the data so it is spread more equally throughout the day starting and ending at midnight?
The next challenge is to numerically describe each set of data with one number to find out how different they are from each other. What would you use? There is no difference between data points where data exists for both data sets being compared. Rather, the differences occur where one data set has data and the other doesn’t. What single number describes a characteristic of a data set?
First attempt, try comparing daily averages of values for the different data sets. The following table is a comparison of the average values for temperature, dew point temperature, relative humidity, and air pressure for the 6 data sets. “Obs” means observation or measurement of the weather conditions at a particular time.
Time Number of Temperature Dew-Point RH Pressure Spacing of Obs Obs Per Day Average Average Average Average
15 min 96 68.6 66.6 93.6 1017.2 30 min 48 68.5 66.5 93.5 1017.2 1 hour 24 68.5 66.4 93.5 1017.3 2 hour 12 68.3 66.2 93.3 1017.4 4 hour 6 67.3 65.6 94.6 1018.0 8 hour 3 67.9 66.0 94.0 1017.9
Question: What is the range of average values of the 4 variables for the 6 data sets? Hint: The range is the maximum value minus the minimum observed value.
The range of average values for the 4 variables is not very much. The average values tend to differ more from the rest of the averages when there are fewer measurements. But is it worth making the extra measurements for an average value that differs by one degree in temperature, one percent relative humidity, or one millibar of pressure?
Try another number that describes a series of numbers to see if this is affected by the spacing of measurements over time. Examine the observed range in values for the different data sets. Do the ranges differ more than the averages when there are fewer points?
Time Spacing Number of Temperature Dew-Point RH Pressure [hour] Obs Per Day Range Range Range Range 0.25 96 14.1 8.8 21.0 4.0 0.5 48 14.1 8.4 21.0 3.9 1 24 14.1 7.7 20.0 3.9 2 12 12.8 7.1 20.0 3.8 4 6 12.0 7.1 15.0 2.9 8 3 11.4 6.5 15.0 2.9
Meteorology Activities for Grades 5-9 119 NP-2006-08-97-LaRC
Question: What is the range of these values for the 6 data sets? Is this a larger difference than observed for the average values?
Activity: Plot the range of temperature, dew point temperature, relative humidity, or pressure to examine what happens when fewer measurements are made over time. Describe any observed trends.
Why do relative humidity and temperature have a larger daily range than dew point and pressure? Both temperature and relative humidity are most effected by the heating of the sun; dew point and pressure do not change much during the day because they vary more with the character of air masses (large pools of air that move across the globe slowly changing properties).
Activity: But are these values very large? Compare the ranges to those of the largest observed range by calculating the percent range of the values:
Percent Range = 100* (Range / Maximum Range)
Activity: Study the graphs and tables you have generated, and decide what is an adequate rate of sampling the weather.
Meteorology Activities for Grades 5-9 120 NP-2006-08-97-LaRC
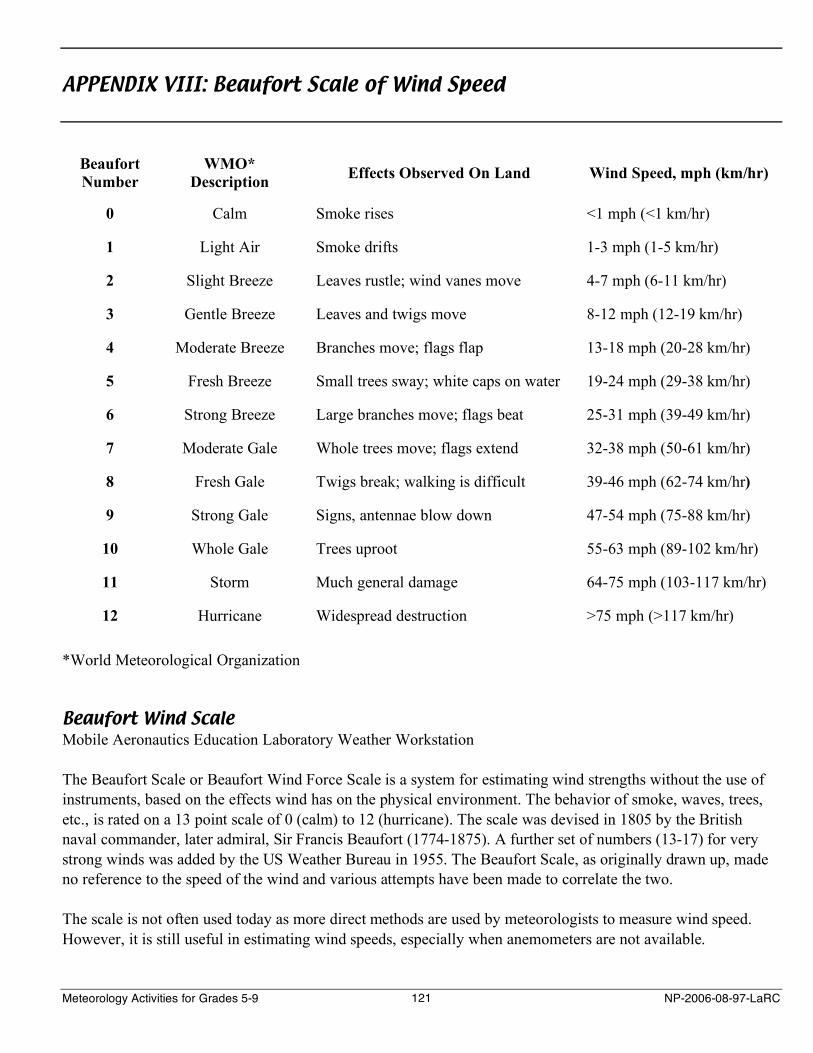
APPENDIX VIII: Beaufort Scale of Wind Speed
Beaufort Number
WMO* Description
Effects Observed On Land Wind Speed, mph (km/hr)
0 Calm Smoke rises <1 mph (<1 km/hr)
1 Light Air Smoke drifts 1-3 mph (1-5 km/hr)
2 Slight Breeze Leaves rustle; wind vanes move 4-7 mph (6-11 km/hr)
3 Gentle Breeze Leaves and twigs move 8-12 mph (12-19 km/hr)
4 Moderate Breeze Branches move; flags flap 13-18 mph (20-28 km/hr)
5 Fresh Breeze Small trees sway; white caps on water 19-24 mph (29-38 km/hr)
6 Strong Breeze Large branches move; flags beat 25-31 mph (39-49 km/hr)
7 Moderate Gale Whole trees move; flags extend 32-38 mph (50-61 km/hr)
8 Fresh Gale Twigs break; walking is difficult 39-46 mph (62-74 km/hr)
9 Strong Gale Signs, antennae blow down 47-54 mph (75-88 km/hr)
10 Whole Gale Trees uproot 55-63 mph (89-102 km/hr)
11 Storm Much general damage 64-75 mph (103-117 km/hr)
12 Hurricane Widespread destruction >75 mph (>117 km/hr)
*World Meteorological Organization
Beaufort Wind Scale Mobile Aeronautics Education Laboratory Weather Workstation
The Beaufort Scale or Beaufort Wind Force Scale is a system for estimating wind strengths without the use of instruments, based on the effects wind has on the physical environment. The behavior of smoke, waves, trees, etc., is rated on a 13 point scale of 0 (calm) to 12 (hurricane). The scale was devised in 1805 by the British naval commander, later admiral, Sir Francis Beaufort (1774-1875). A further set of numbers (13-17) for very strong winds was added by the US Weather Bureau in 1955. The Beaufort Scale, as originally drawn up, made no reference to the speed of the wind and various attempts have been made to correlate the two.
The scale is not often used today as more direct methods are used by meteorologists to measure wind speed. However, it is still useful in estimating wind speeds, especially when anemometers are not available.
Meteorology Activities for Grades 5-9 121 NP-2006-08-97-LaRC
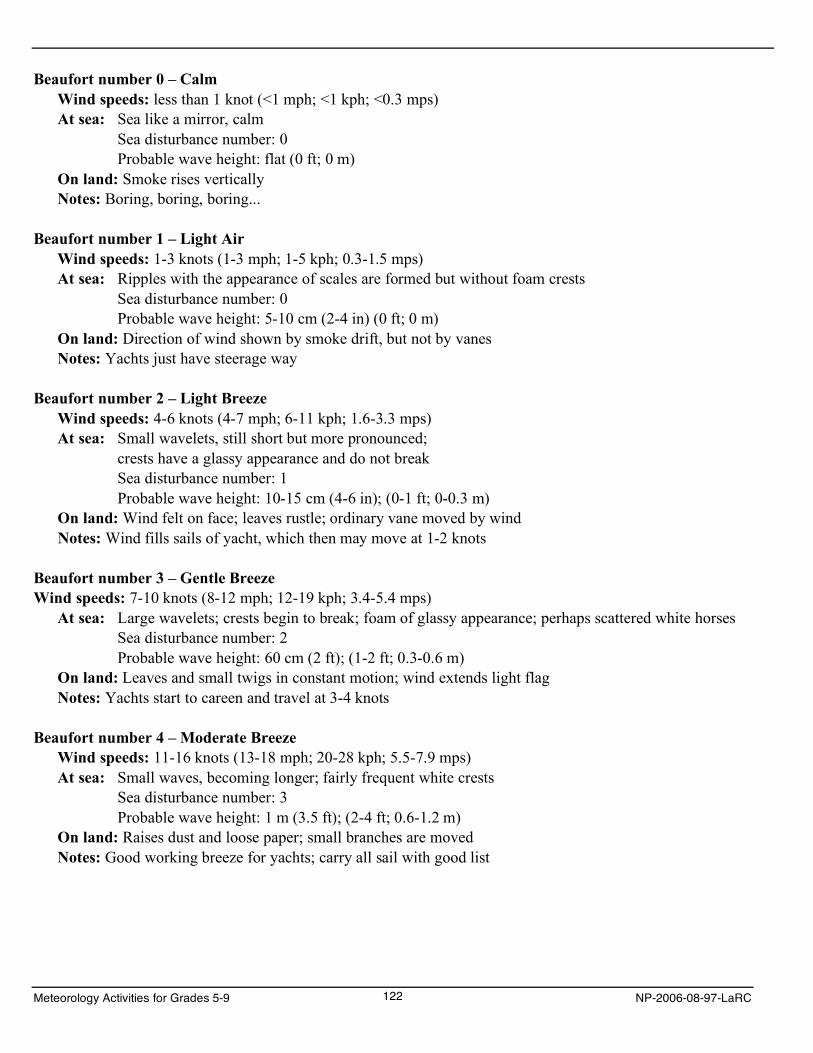
Beaufort number 0 – Calm Wind speeds: less than 1 knot (<1 mph; <1 kph; <0.3 mps) At sea: Sea like a mirror, calm
Sea disturbance number: 0 Probable wave height: flat (0 ft; 0 m)
On land: Smoke rises vertically Notes: Boring, boring, boring...
Beaufort number 1 – Light Air Wind speeds: 1-3 knots (1-3 mph; 1-5 kph; 0.3-1.5 mps) At sea: Ripples with the appearance of scales are formed but without foam crests
Sea disturbance number: 0 Probable wave height: 5-10 cm (2-4 in) (0 ft; 0 m)
On land: Direction of wind shown by smoke drift, but not by vanesNotes: Yachts just have steerage way
Beaufort number 2 – Light Breeze Wind speeds: 4-6 knots (4-7 mph; 6-11 kph; 1.6-3.3 mps) At sea: Small wavelets, still short but more pronounced;
crests have a glassy appearance and do not break Sea disturbance number: 1Probable wave height: 10-15 cm (4-6 in); (0-1 ft; 0-0.3 m)
On land: Wind felt on face; leaves rustle; ordinary vane moved by wind Notes: Wind fills sails of yacht, which then may move at 1-2 knots
Beaufort number 3 – Gentle BreezeWind speeds: 7-10 knots (8-12 mph; 12-19 kph; 3.4-5.4 mps)
At sea: Large wavelets; crests begin to break; foam of glassy appearance; perhaps scattered white horses Sea disturbance number: 2 Probable wave height: 60 cm (2 ft); (1-2 ft; 0.3-0.6 m)
On land: Leaves and small twigs in constant motion; wind extends light flagNotes: Yachts start to careen and travel at 3-4 knots
Beaufort number 4 – Moderate Breeze Wind speeds: 11-16 knots (13-18 mph; 20-28 kph; 5.5-7.9 mps) At sea: Small waves, becoming longer; fairly frequent white crests
Sea disturbance number: 3 Probable wave height: 1 m (3.5 ft); (2-4 ft; 0.6-1.2 m)
On land: Raises dust and loose paper; small branches are moved Notes: Good working breeze for yachts; carry all sail with good list
Meteorology Activities for Grades 5-9 122 NP-2006-08-97-LaRC
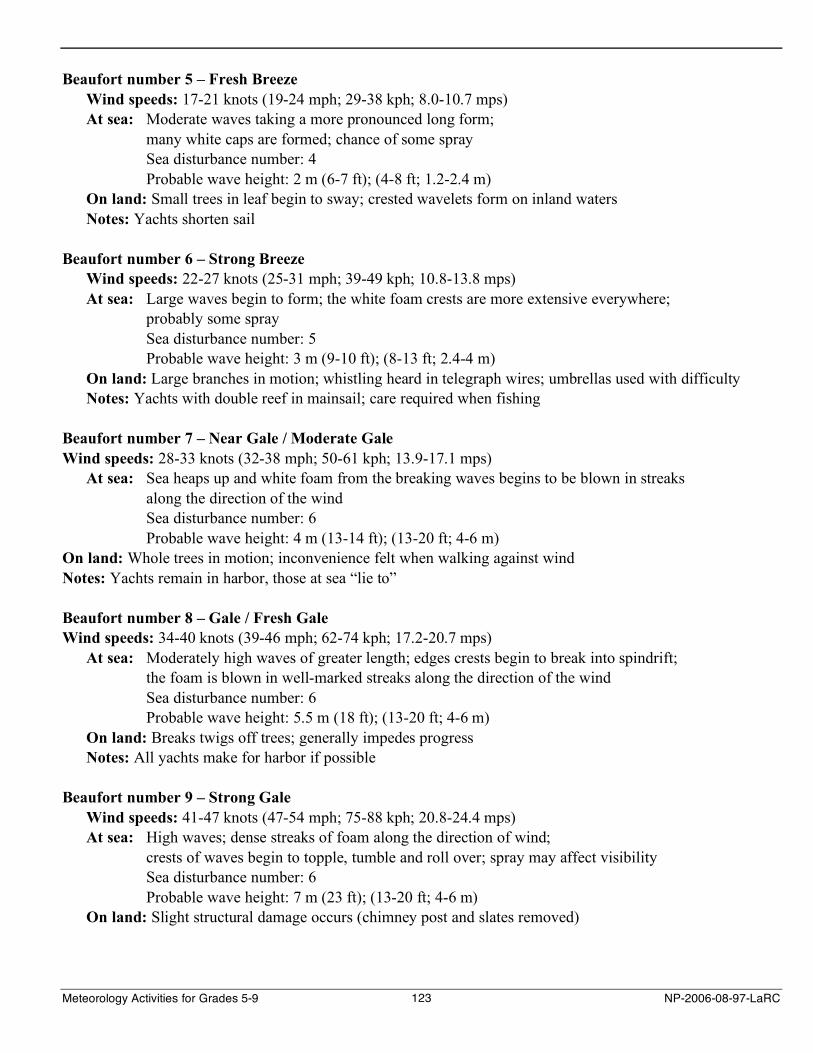
Beaufort number 5 – Fresh Breeze Wind speeds: 17-21 knots (19-24 mph; 29-38 kph; 8.0-10.7 mps) At sea: Moderate waves taking a more pronounced long form;
many white caps are formed; chance of some spray Sea disturbance number: 4Probable wave height: 2 m (6-7 ft); (4-8 ft; 1.2-2.4 m)
On land: Small trees in leaf begin to sway; crested wavelets form on inland watersNotes: Yachts shorten sail
Beaufort number 6 – Strong Breeze Wind speeds: 22-27 knots (25-31 mph; 39-49 kph; 10.8-13.8 mps) At sea: Large waves begin to form; the white foam crests are more extensive everywhere;
probably some spray Sea disturbance number: 5Probable wave height: 3 m (9-10 ft); (8-13 ft; 2.4-4 m)
On land: Large branches in motion; whistling heard in telegraph wires; umbrellas used with difficulty Notes: Yachts with double reef in mainsail; care required when fishing
Beaufort number 7 – Near Gale / Moderate GaleWind speeds: 28-33 knots (32-38 mph; 50-61 kph; 13.9-17.1 mps)
At sea: Sea heaps up and white foam from the breaking waves begins to be blown in streaksalong the direction of the wind Sea disturbance number: 6Probable wave height: 4 m (13-14 ft); (13-20 ft; 4-6 m)
On land: Whole trees in motion; inconvenience felt when walking against windNotes: Yachts remain in harbor, those at sea “lie to”
Beaufort number 8 – Gale / Fresh GaleWind speeds: 34-40 knots (39-46 mph; 62-74 kph; 17.2-20.7 mps)
At sea: Moderately high waves of greater length; edges crests begin to break into spindrift;the foam is blown in well-marked streaks along the direction of the windSea disturbance number: 6Probable wave height: 5.5 m (18 ft); (13-20 ft; 4-6 m)
On land: Breaks twigs off trees; generally impedes progressNotes: All yachts make for harbor if possible
Beaufort number 9 – Strong Gale Wind speeds: 41-47 knots (47-54 mph; 75-88 kph; 20.8-24.4 mps) At sea: High waves; dense streaks of foam along the direction of wind;
crests of waves begin to topple, tumble and roll over; spray may affect visibility Sea disturbance number: 6 Probable wave height: 7 m (23 ft); (13-20 ft; 4-6 m)
On land: Slight structural damage occurs (chimney post and slates removed)
Meteorology Activities for Grades 5-9 123 NP-2006-08-97-LaRC
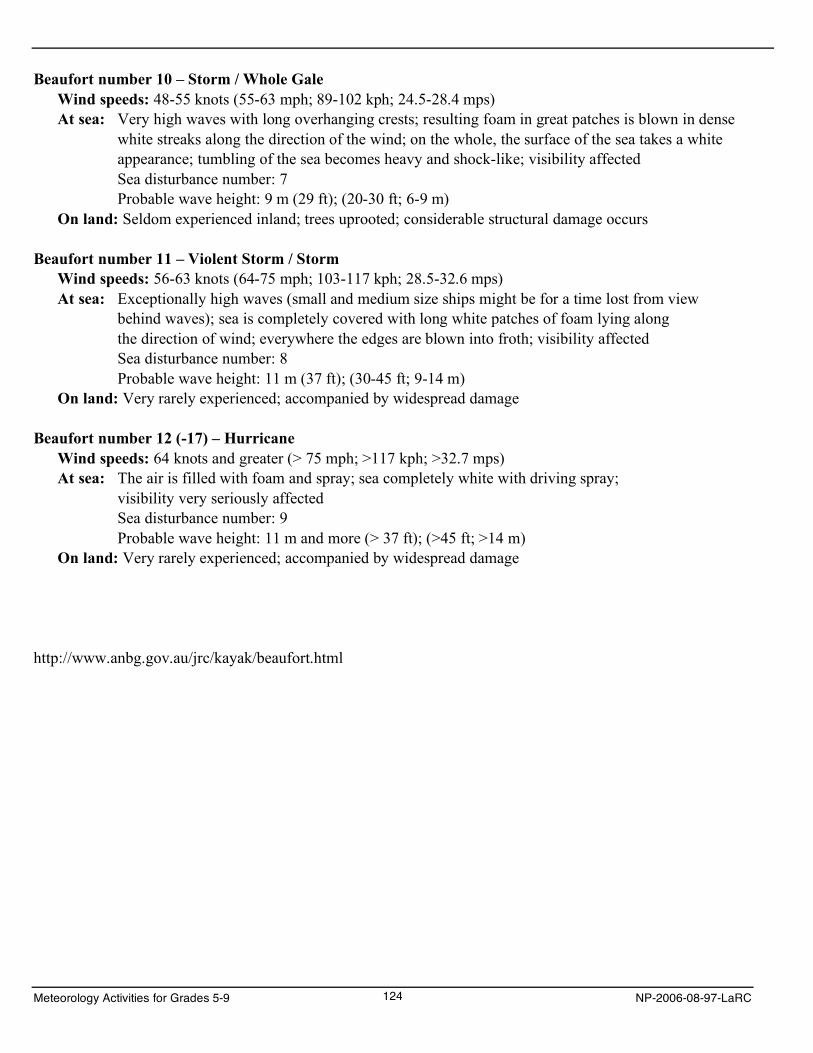
Beaufort number 10 – Storm / Whole Gale Wind speeds: 48-55 knots (55-63 mph; 89-102 kph; 24.5-28.4 mps) At sea: Very high waves with long overhanging crests; resulting foam in great patches is blown in dense
white streaks along the direction of the wind; on the whole, the surface of the sea takes a white appearance; tumbling of the sea becomes heavy and shock-like; visibility affected Sea disturbance number: 7 Probable wave height: 9 m (29 ft); (20-30 ft; 6-9 m)
On land: Seldom experienced inland; trees uprooted; considerable structural damage occurs
Beaufort number 11 – Violent Storm / Storm Wind speeds: 56-63 knots (64-75 mph; 103-117 kph; 28.5-32.6 mps) At sea: Exceptionally high waves (small and medium size ships might be for a time lost from view
behind waves); sea is completely covered with long white patches of foam lying along the direction of wind; everywhere the edges are blown into froth; visibility affected Sea disturbance number: 8 Probable wave height: 11 m (37 ft); (30-45 ft; 9-14 m)
On land: Very rarely experienced; accompanied by widespread damage
Beaufort number 12 (-17) – Hurricane Wind speeds: 64 knots and greater (> 75 mph; >117 kph; >32.7 mps) At sea: The air is filled with foam and spray; sea completely white with driving spray;
visibility very seriously affected Sea disturbance number: 9 Probable wave height: 11 m and more (> 37 ft); (>45 ft; >14 m)
On land: Very rarely experienced; accompanied by widespread damage
http://www.anbg.gov.au/jrc/kayak/beaufort.html
Meteorology Activities for Grades 5-9 124 NP-2006-08-97-LaRC
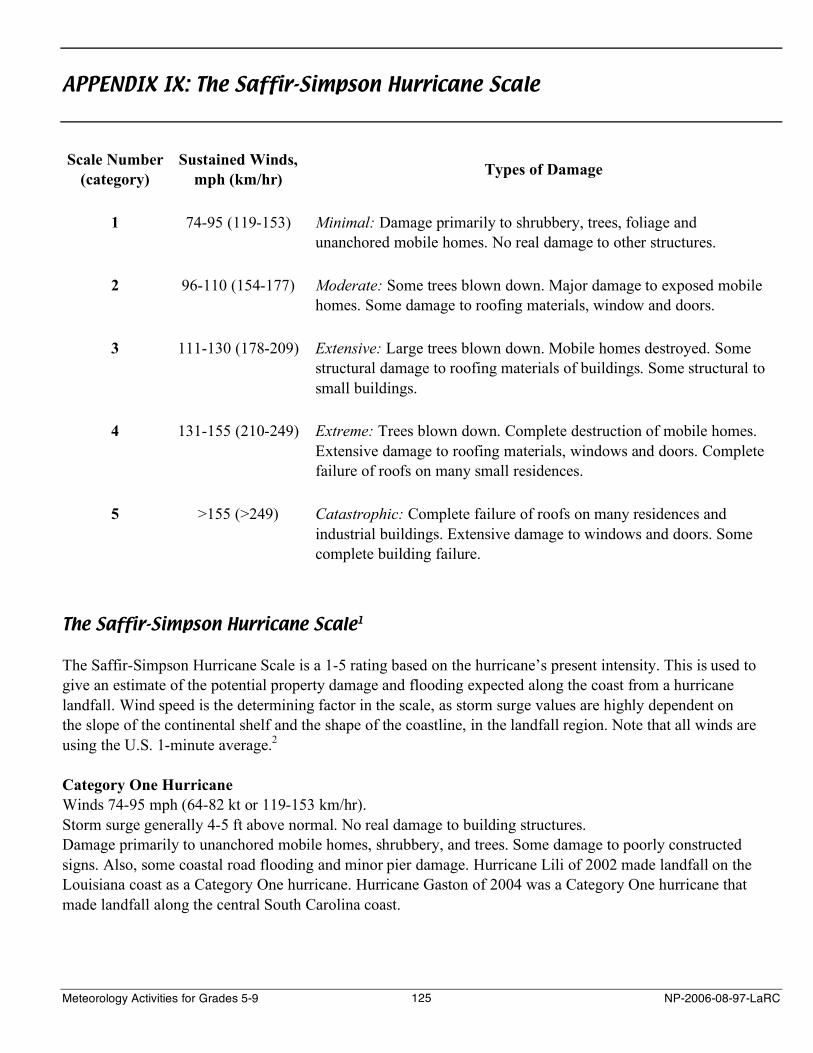
APPENDIX IX: The Saffir-Simpson Hurricane Scale
Scale Number (category)
Sustained Winds, mph (km/hr) Types of Damage
1 74-95 (119-153) Minimal: Damage primarily to shrubbery, trees, foliage and unanchored mobile homes. No real damage to other structures.
2 96-110 (154-177) Moderate: Some trees blown down. Major damage to exposed mobile homes. Some damage to roofing materials, window and doors.
3 111-130 (178-209) Extensive: Large trees blown down. Mobile homes destroyed. Some structural damage to roofing materials of buildings. Some structural to
small buildings.
4 131-155 (210-249) Extreme: Trees blown down. Complete destruction of mobile homes. Extensive damage to roofing materials, windows and doors. Complete
failure of roofs on many small residences.
5 >155 (>249) Catastrophic: Complete failure of roofs on many residences and industrial buildings. Extensive damage to windows and doors. Some complete building failure.
The Saffir-Simpson Hurricane Scale1
The Saffir-Simpson Hurricane Scale is a 1-5 rating based on the hurricane’s present intensity. This is used to give an estimate of the potential property damage and flooding expected along the coast from a hurricane landfall. Wind speed is the determining factor in the scale, as storm surge values are highly dependent on the slope of the continental shelf and the shape of the coastline, in the landfall region. Note that all winds are using the U.S. 1-minute average.2
Category One Hurricane Winds 74-95 mph (64-82 kt or 119-153 km/hr). Storm surge generally 4-5 ft above normal. No real damage to building structures. Damage primarily to unanchored mobile homes, shrubbery, and trees. Some damage to poorly constructed signs. Also, some coastal road flooding and minor pier damage. Hurricane Lili of 2002 made landfall on the Louisiana coast as a Category One hurricane. Hurricane Gaston of 2004 was a Category One hurricane that made landfall along the central South Carolina coast.
Meteorology Activities for Grades 5-9 125 NP-2006-08-97-LaRC
Category Two Hurricane Winds 96-110 mph (83-95 kt or 154-177 km/hr).Storm surge generally 6-8 feet above normal.Some roofing material, door, and window damage of buildings. Considerable damage to shrubbery and treeswith some trees blown down. Considerable damage to mobile homes, poorly constructed signs, and piers.Coastal and low-lying escape routes flood 2-4 hours before arrival of the hurricane center. Small craft in unprotected anchorages break moorings. Hurricane Frances of 2004 made landfall over the southern end ofHutchinson Island, Florida as a Category Two hurricane. Hurricane Isabel of 2003 made landfall near DrumInlet on the Outer Banks of North Carolina as a Category 2 hurricane.
Category Three Hurricane Winds 111-130 mph (96-113 kt or 178-209 km/hr). Storm surge generally 9-12 ft above normal. Some structural damage to small residences and utility buildings with a minor amount of curtainwall failures. Damage to shrubbery and trees with foliage blown off trees and large trees blown down. Mobile homes and poorly constructed signs are destroyed. Low-lying escape routes are cut by rising water 3-5 hours before arrival of the center of the hurricane. Flooding near the coast destroys smaller structures with larger structures damaged by battering from floating debris. Terrain continuously lower than 5 ft above mean sea level may be flooded inland 8 miles (13 km) or more. Evacuation of low-lying residences with several blocks of the shoreline may be required. Hurricanes Jeanne and Ivan of 2004 were Category Three hurricanes when they made landfall in Florida and in Alabama, respectively.
Category Four Hurricane Winds 131-155 mph (114-135 kt or 210-249 km/hr). Storm surge generally 13-18 ft above normal. More extensive curtainwall failures with some complete roof structure failures on small residences. Shrubs, trees, and all signs are blown down. Complete destruction of mobile homes. Extensive damage to doors and windows. Low-lying escape routes may be cut by rising water 3-5 hours before arrival of the center of the hurricane. Major damage to lower floors of structures near the shore. Terrain lower than 10 ft above sea level may be flooded requiring massive evacuation of residential areas as far inland as 6 miles (10 km). Hurricane Charley of 2004 was a Category Four hurricane that made landfall in Charlotte County, Florida with winds of 150 mph. Hurricane Dennis of 2005 struck the island of Cuba as a Category Four hurricane.
Category Five Hurricane Winds greater than 155 mph (135 kt or 249 km/hr). Storm surge generally greater than 18 ft above normal. Complete roof failure on many residences and industrial buildings. Some complete building failures with small utility buildings blown over or away. All shrubs, trees, and signs blown down. Complete destruction of mobile homes. Severe and extensive window and door damage. Low-lying escape routes are cut by rising water 3-5 hours before arrival of the center of the hurricane. Major damage to lower floors of all structures located less than 15 ft above sea level and within 500 yards of the shoreline. Massive evacuation of residential areas on low ground within 5-10 miles (8-16 km) of the shoreline may be required. Only three Category Five Hurricanes have made landfall in the United States since records began: The Labor Day Hurricane of 1935, Hurricane Camille (1969), and Hurricane Andrew in August, 1992. The 1935 Labor Day Hurricane struck the Florida Keys with a minimum pressure of 892 mb — the lowest pressure ever observed in the United States.
Meteorology Activities for Grades 5-9 126 NP-2006-08-97-LaRC
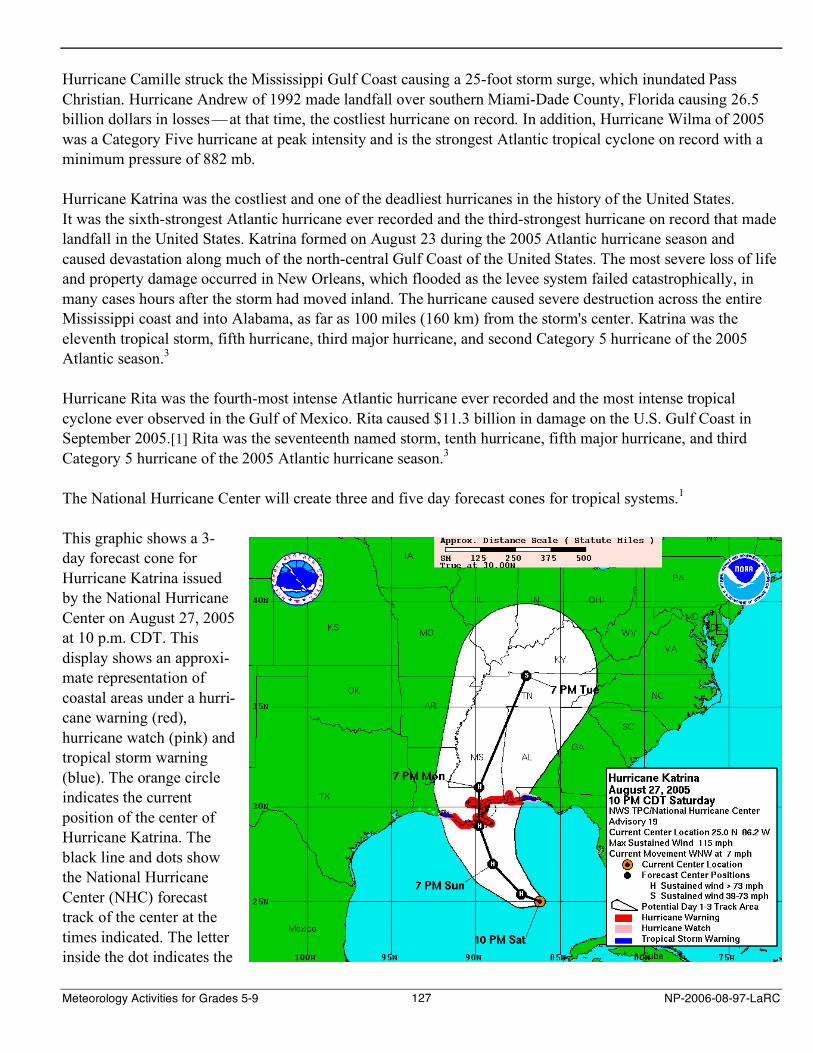
Hurricane Camille struck the Mississippi Gulf Coast causing a 25-foot storm surge, which inundated Pass Christian. Hurricane Andrew of 1992 made landfall over southern Miami-Dade County, Florida causing 26.5 billion dollars in losses—at that time, the costliest hurricane on record. In addition, Hurricane Wilma of 2005 was a Category Five hurricane at peak intensity and is the strongest Atlantic tropical cyclone on record with a minimum pressure of 882 mb.
Hurricane Katrina was the costliest and one of the deadliest hurricanes in the history of the United States. It was the sixth-strongest Atlantic hurricane ever recorded and the third-strongest hurricane on record that made landfall in the United States. Katrina formed on August 23 during the 2005 Atlantic hurricane season and caused devastation along much of the north-central Gulf Coast of the United States. The most severe loss of life and property damage occurred in New Orleans, which flooded as the levee system failed catastrophically, in many cases hours after the storm had moved inland. The hurricane caused severe destruction across the entire Mississippi coast and into Alabama, as far as 100 miles (160 km) from the storm's center. Katrina was the eleventh tropical storm, fifth hurricane, third major hurricane, and second Category 5 hurricane of the 2005 Atlantic season.3
Hurricane Rita was the fourth-most intense Atlantic hurricane ever recorded and the most intense tropical cyclone ever observed in the Gulf of Mexico. Rita caused $11.3 billion in damage on the U.S. Gulf Coast in September 2005.[1] Rita was the seventeenth named storm, tenth hurricane, fifth major hurricane, and third Category 5 hurricane of the 2005 Atlantic hurricane season.3
The National Hurricane Center will create three and five day forecast cones for tropical systems.1
This graphic shows a 3-day forecast cone for Hurricane Katrina issued by the National Hurricane Center on August 27, 2005 at 10 p.m. CDT. This display shows an approxi-mate representation of coastal areas under a hurri-cane warning (red), hurricane watch (pink) and tropical storm warning (blue). The orange circle indicates the current position of the center of Hurricane Katrina. The black line and dots show the National Hurricane Center (NHC) forecast track of the center at the times indicated. The letter inside the dot indicates the
Meteorology Activities for Grades 5-9 127 NP-2006-08-97-LaRC
____________________________
NHC’s forecast intensity for that time. It should be noted not to focus on the skinny black line in the center of the cone and assume that it represents the exact track of the hurricane. Because of a margin of forecast error, the hurricane could be anywhere within the forecast cone within the time periods noted.
NHC forecast tracks of the center can be in error; the average track forecast errors in recent years were used to construct the areas of uncertainty for the 3 days (solid white area). There is also uncertainty in the NHC intensity forecasts.
It is also important to realize that a tropical cyclone is not a point. Their effects can span many hundreds of miles from the center. The area experiencing hurricane force (one-minute average wind speeds of at least 74 mph) and tropical storm force (one-minute average wind speeds of 39-73 mph) winds can extend well beyond the white areas shown enclosing the most likely track area of the center.
1Erik Salna Project Coordinator Meteorologist, AMS, NWA Disaster Survival House and Hurricane Warning! 1345 FAU Research Park Boulevard Deerfield Beach, Florida 33441 [email protected] http://www.hurricanewarning.org
2NOAA/ National Weather Service National Centers for Environmental Prediction National Hurricane Center Tropical Prediction Center 11691 SW 17th Street Miami, Florida, 33165-2149 USA http://www.nhc.noaa.gov
3Wikipedia http://www.wikipedia.org
Meteorology Activities for Grades 5-9 128 NP-2006-08-97-LaRC
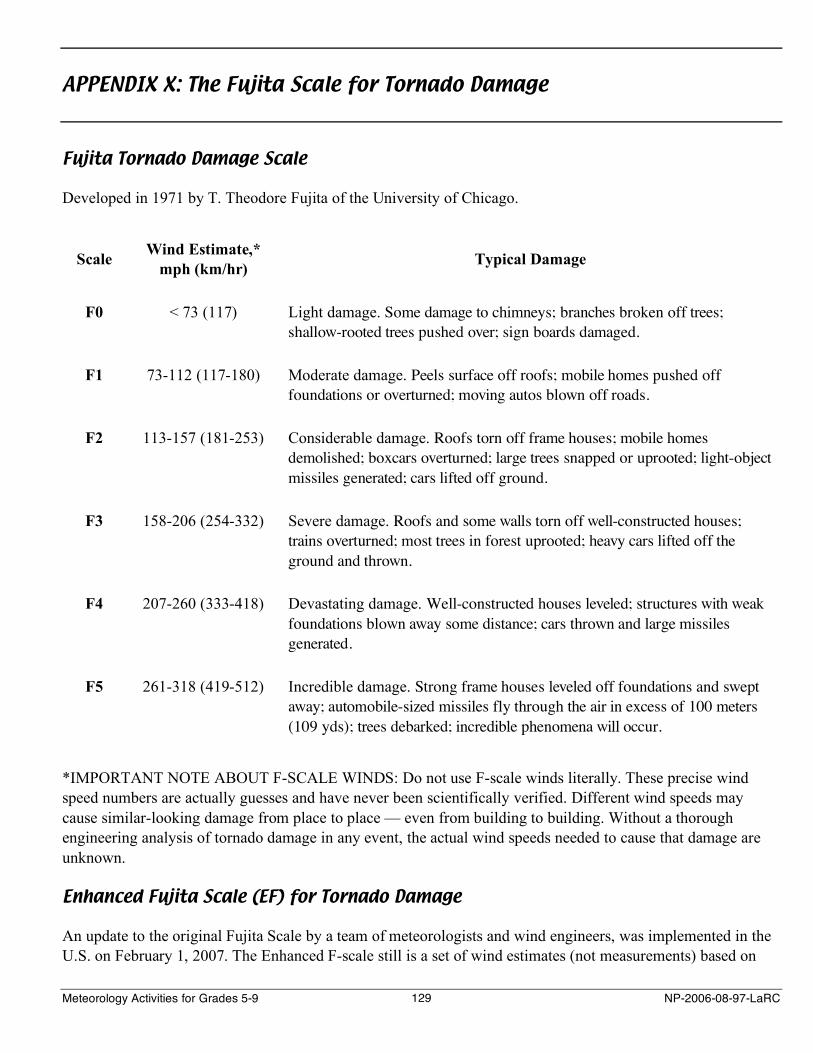
APPENDIX X: The Fujita Scale for Tornado Damage
Fujita Tornado Damage Scale
Developed in 1971 by T. Theodore Fujita of the University of Chicago.
Scale Wind Estimate,* mph (km/hr) Typical Damage
F0 < 73 (117) Light damage. Some damage to chimneys; branches broken off trees; shallow-rooted trees pushed over; sign boards damaged.
F1 73-112 (117-180) Moderate damage. Peels surface off roofs; mobile homes pushed offfoundations or overturned; moving autos blown off roads.
F2 113-157 (181-253) Considerable damage. Roofs torn off frame houses; mobile homesdemolished; boxcars overturned; large trees snapped or uprooted; light-object missiles generated; cars lifted off ground.
F3 158-206 (254-332) Severe damage. Roofs and some walls torn off well-constructed houses;trains overturned; most trees in forest uprooted; heavy cars lifted off theground and thrown.
F4 207-260 (333-418) Devastating damage. Well-constructed houses leveled; structures with weakfoundations blown away some distance; cars thrown and large missilesgenerated.
F5 261-318 (419-512) Incredible damage. Strong frame houses leveled off foundations and swept away; automobile-sized missiles fly through the air in excess of 100 meters(109 yds); trees debarked; incredible phenomena will occur.
*IMPORTANT NOTE ABOUT F-SCALE WINDS: Do not use F-scale winds literally. These precise wind speed numbers are actually guesses and have never been scientifically verified. Different wind speeds may cause similar-looking damage from place to place — even from building to building. Without a thorough engineering analysis of tornado damage in any event, the actual wind speeds needed to cause that damage are unknown.
Enhanced Fujita Scale (EF) for Tornado Damage
An update to the original Fujita Scale by a team of meteorologists and wind engineers, was implemented in the U.S. on February 1, 2007. The Enhanced F-scale still is a set of wind estimates (not measurements) based on
Meteorology Activities for Grades 5-9 129 NP-2006-08-97-LaRC
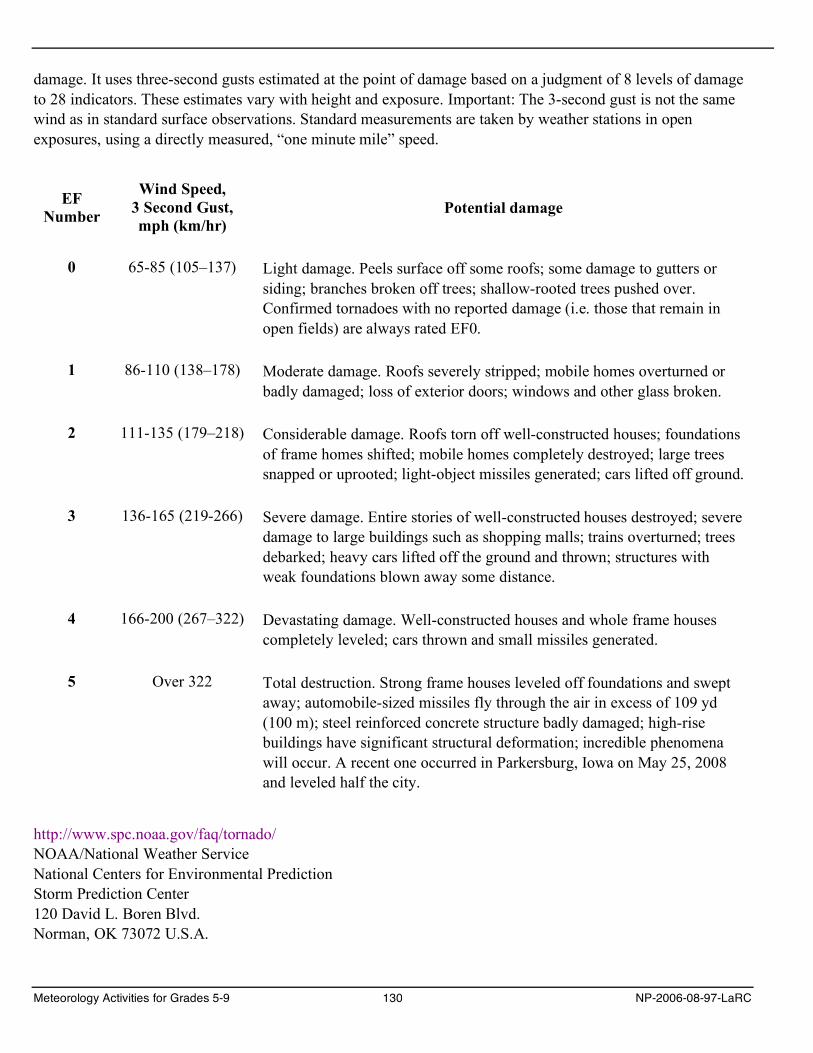
damage. It uses three-second gusts estimated at the point of damage based on a judgment of 8 levels of damage to 28 indicators. These estimates vary with height and exposure. Important: The 3-second gust is not the same wind as in standard surface observations. Standard measurements are taken by weather stations in open exposures, using a directly measured, “one minute mile” speed.
EF Number
Wind Speed, 3 Second Gust, mph (km/hr)
Potential damage
0 65-85 (105–137) Light damage. Peels surface off some roofs; some damage to gutters or siding; branches broken off trees; shallow-rooted trees pushed over. Confirmed tornadoes with no reported damage (i.e. those that remain in open fields) are always rated EF0.
1 86-110 (138–178) Moderate damage. Roofs severely stripped; mobile homes overturned or badly damaged; loss of exterior doors; windows and other glass broken.
2 111-135 (179–218) Considerable damage. Roofs torn off well-constructed houses; foundations of frame homes shifted; mobile homes completely destroyed; large trees snapped or uprooted; light-object missiles generated; cars lifted off ground.
3 136-165 (219-266) Severe damage. Entire stories of well-constructed houses destroyed; severe damage to large buildings such as shopping malls; trains overturned; trees debarked; heavy cars lifted off the ground and thrown; structures with weak foundations blown away some distance.
4 166-200 (267–322) Devastating damage. Well-constructed houses and whole frame houses completely leveled; cars thrown and small missiles generated.
5 Over 322 Total destruction. Strong frame houses leveled off foundations and swept away; automobile-sized missiles fly through the air in excess of 109 yd (100 m); steel reinforced concrete structure badly damaged; high-rise buildings have significant structural deformation; incredible phenomena will occur. A recent one occurred in Parkersburg, Iowa on May 25, 2008 and leveled half the city.
http://www.spc.noaa.gov/faq/tornado/ NOAA/National Weather Service National Centers for Environmental Prediction Storm Prediction Center 120 David L. Boren Blvd. Norman, OK 73072 U.S.A.
Meteorology Activities for Grades 5-9 130 NP-2006-08-97-LaRC
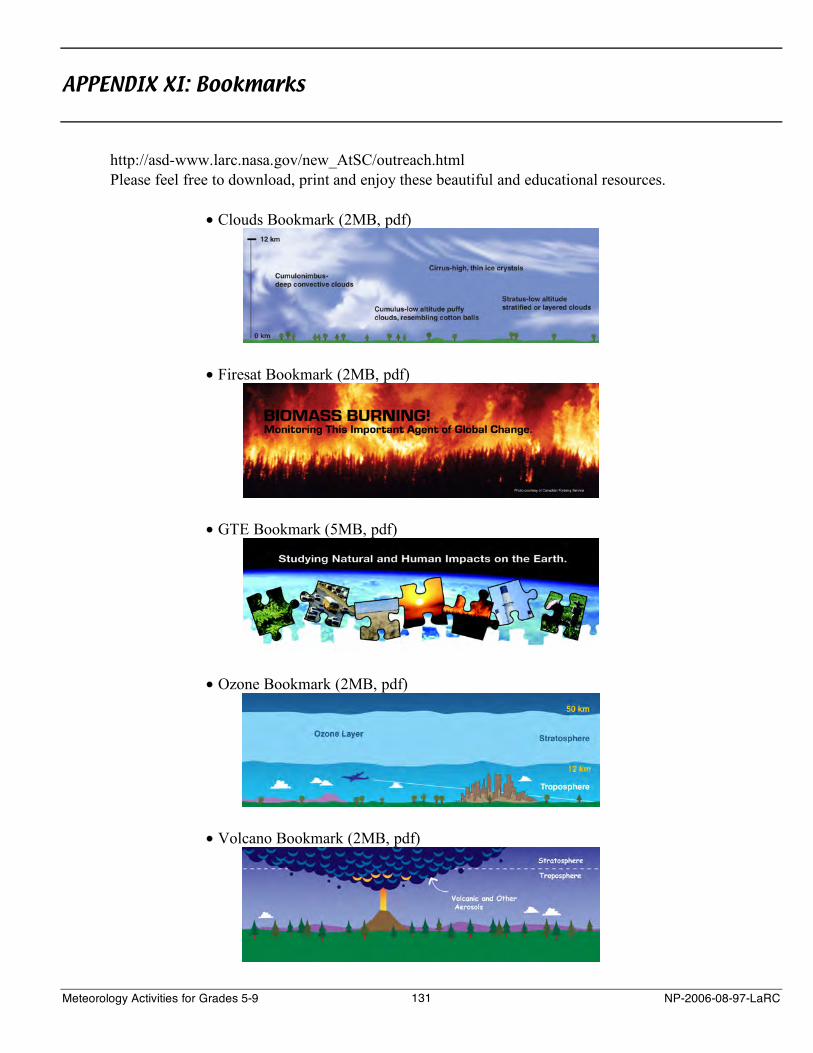
APPENDIX XI: Bookmarks
http://asd-www.larc.nasa.gov/new_AtSC/outreach.htmlPlease feel free to download, print and enjoy these beautiful and educational resources.
• Clouds Bookmark (2MB, pdf)
• Firesat Bookmark (2MB, pdf)
• GTE Bookmark (5MB, pdf)
• Ozone Bookmark (2MB, pdf)
• Volcano Bookmark (2MB, pdf)
Meteorology Activities for Grades 5-9 131 NP-2006-08-97-LaRC

Meteorology Activities for Grades 5-9 132 NP-2006-08-97-LaRC
About the Authors
Joseph Exline, Arlene Levine and Joel Levine have collaborated on science educational activities for more than 25 years.
Joseph D. Exline
Joe Exline served as Principal Investigator/ Project Director for the CS3/NASA NLIST Initiative. He holds a bachelors degree from Glenville State College (1960), a masters degree from Ohio State University (1968), and a doctorate from the University of Maryland (1973). For twelve years, he was a middle school and high school science teacher in Fairfax County, Virginia. He joined the Virginia Department of Education in 1974 and served as Director of Science for the state of Virginia for about 18 years. During his last three years of state employment, he directed the state’s National Science Foundation-funded systemic initiative Virginia Quality Education in Science & Technology (V-QUEST). He currently directs Exline Consulting Services, Inc., and served as Executive Secretary for the Council of State Science Supervisors for about twenty-six years. He has about twenty-five years experience in edu-cational program implementation with an emphasis on student-centered learning through an analysis of how well the school-community system elements align with expected student outcomes. Joe has authored some 40 journal articles and authored/ edited six books about student-centered science education. He helped develop the Education and Public Outreach (EPO) program for the Aerial Regional-Scale Environmental Survey (ARES) of Mars.
Arlene S. Levine
Arlene S. Levine is a Manager for Education and Public Outreach for NASA Earth and plane-tary missions and science projects in the Science Directorate at NASA’s Langley Research Center. Dr. Levine received a bachelors degree in psychology from Queens College, City University of New York, and a Masters degree and a Doctorate in counseling, both from the College of William and Mary, Williamsburg, Virginia. Dr. Levine came to the Langley Research Center in 1984 as a Research Fellow under the American Association for Engineering Education (ASEE) Summer Research Faculty Program. In 1984, Dr. Levine worked in Langley’s Space Station Office and performed research on the psychological effects of long duration space missions on astronauts. Following this, Dr. Levine worked on NASA’s Long Duration Exposure Facility (LDEF) Mission and NASA’s Geostationary Infrared Fourier Transform Spectrometer (GIFTS) Mission. Dr. Levine is Manager of Education and Public Outreach on the NASA Aerial Regional-scale Environmental Survey (ARES) Mission to Mars. ARES is a proposed rocket-powered, robotic airplane designed to fly through the atmosphere of Mars to investigate the atmosphere and surface of Mars and to search for life on the Red Planet. Dr. Levine has worked and continues to work with Girl Scouts, both locally and nationally, to pro-vide more science information and activities for girls. She also works with the National Alliance of Black School Educators (NABSE) to promote science and inspire the next generation of scientists, engineers, mathematicians and technologists. Dr. Levine has authored, co-authored and edited over a dozen articles, reports, book chapters and books on the
Meteorology Activities for Grades 5-9 133 NP-2006-08-97-LaRC
psychological effects of long duration space missions on astronauts, on NASA’s LDEF Mission and co-authored the GIFTS Water Vapor Monitoring Educator’s Guide. Prior to coming to the NASA Langley Research Center in 1984, Dr. Levine taught psychology and human relations at Thomas Nelson Community College, Hampton, and later taught psychology, counseling and human behavior for graduate programs at Hampton University and the Hampton Campus of Golden Gate University. For her NASA education and outreach activities, Dr. Levine received the Aerospace Educator of the Year Award from Women In Aerospace (WIA), the Girl Scout Lifetime Achievement Award presented by the Colonial Coast Council of the Girl Scouts, and the NASA Langley Research Center Equal Opportunity Award. In addition, Dr. Levine received over 20 performance and superior accomplishment awards for her contributions to LDEF, GIFTS and ARES, among other projects.
Joel S. Levine
Joel Levine is Senior Research Scientist in the Science Directorate at the NASA Langley Research Center. Dr. Levine received a BS in physics from the Brooklyn College, City University of New York, an MS in meteorology from New York University and an MS in aeronomy and planetary atmospheres and a Ph.D. in atmospheric science, both from the University of Michigan. Dr. Levine has authored or co-authored more than 150 scientific papers and reports and edited four books on atmo-spheric science, planetary atmospheres, biomass burning and global change.
Dr. Levine is the Principal Investigator of the Aerial Regional-scale Environmental Survey (ARES) of Mars. ARES is a proposed robotic, rocket-powered
airplane that will fly through the atmosphere of Mars to search for water and life and investigate the evolu-tion of the surface and atmosphere of Mars. ARES was one of four finalists in the first NASA Mars Exploration Program (MEP) Mars Scout Mission competition. In 2007, Dr. Levine was selected as the Mars Scout 2011 Program Scientist and Co-Chair of NASA’s Human Exploration of Mars Science Panel. Dr. Levine also serves as Principal Investigator for two other NASA research programs: The Titan Explorer Vision Mission Study and Human Mars Mission Robotic Precursors: Developing the Meas-urement Database Needed to Ensure the Safety of Humans Exploring and Living on Mars. Dr. Levine also served as Project Leader of the NASA Charters of Freedom Research Team. In 1998, at the request of the U. S. National Archives and Records Administra-tion (NARA), Washington, D.C., Dr. Levine formed and directed a team of NASA scientists to determine the chemical composition and water vapor content of the atmosphere in the seven hermetically sealed encasements containing the Declaration of Indepen-dence, the U. S. Constitution, and the Bill of Rights, collectively called the “Charters of Freedom.” Levine and his team used non-invasive and other measure-ment techniques and discovered that the helium atmosphere in the hermetically sealed encasements contained significantly more water vapor than pre-viously believed (a relative humidity in excess of 60% compared to the expected relative humidity of 25 to 35%). Water vapor in its elevated concentration reacted with the encasement glass resulting in the leaching of alkaline material from the glass forming tiny white spots in the encasements. In 2002, in an effort to better preserve all seven documents, the Charters of Freedom were removed from their origi-nal encasements and placed in newly constructed, hermetically sealed encasements in an argon atmos-phere with a relative humidity of only 25 to 35%.
Dr. Levine received the NASA Medal for Exceptional Scientific Achievement, the the NASA Medal for Outstanding Leadership, the New York Academy of Sciences Halpern Award, and was selected asVirginia’s Outstanding Scientist.
Meteorology Activities for Grades 5-9 134 NP-2006-08-97-LaRC


Langley Research Center http://www.nasa.gov/centers/langley/home