Embed Size (px)
Citation preview
Methodology for the free allocation of emission allowances in the
EU ETS post 2012
Sector report for the non-ferrous metals industry
November 2009
Ecofys (project leader)
Fraunhofer Institute for Systems and Innovation Research
Öko-Institut
By order of the European Commission
Study Contract: 07.0307/2008/515770/ETU/C2
Ecofys project Number: PECSNL082164

i
Disclaimer and acknowledgements
Disclaimer The views expressed in this study represent only the views of the authors and not those of the
European Commission. The focus of this study is on preparing a first blueprint of an
allocation methodology for free allocation of emission allowances under the EU Emission
Trading Scheme for the period 2013 – 2020 for installations in the non-ferrous metals
industry. The report should be read in conjunction with the report on the project approach and
general issues. This sector report has been written by the Fraunhofer Institute for Systems and
Innovation Research.
Acknowledgements The authors would like to thank representatives from the non ferrous metals industry for the
in-depth discussions on possible benchmarking options for the non-ferrous metals industry
during the execution of the project.
ii
Table of content
Introduct ion . . . . . . . . . . . . . . . . . . . . . . . . . . . . . . . . . . . . . . . . . . . . . . . . . . . . . . . . . . 1
2 Product ion process and GHG emiss ions . . . . . . . . . . . . . . . . . 5
2.1 Description of the production process...................................................................... 5
2.2 Direct emissions and steam use................................................................................ 7
3 Benchmark ing methodology . . . . . . . . . . . . . . . . . . . . . . . . . . . . . . . . 8
3.1 Background .............................................................................................................. 8
3.2 Relevant PRODCOM codes..................................................................................... 8
4 Emiss ion intens i ty data . . . . . . . . . . . . . . . . . . . . . . . . . . . . . . . . . . . . . 10
5 Addit iona l s teps required . . . . . . . . . . . . . . . . . . . . . . . . . . . . . . . . . . 14
6 Stakeholder comments . . . . . . . . . . . . . . . . . . . . . . . . . . . . . . . . . . . . . . 15
6.1 Comments of the copper sector.............................................................................. 15
6.2 Comments of the zinc sector .................................................................................. 17
7 References . . . . . . . . . . . . . . . . . . . . . . . . . . . . . . . . . . . . . . . . . . . . . . . . . . . . . . 18
Appendix A: PRODCOM codes of the non-ferrous meta ls
sector . . . . . . . . . . . . . . . . . . . . . . . . . . . . . . . . . . . . . . . . . . . . . . . . . . . . . . . . . . . . . 19
1
1 Introduction
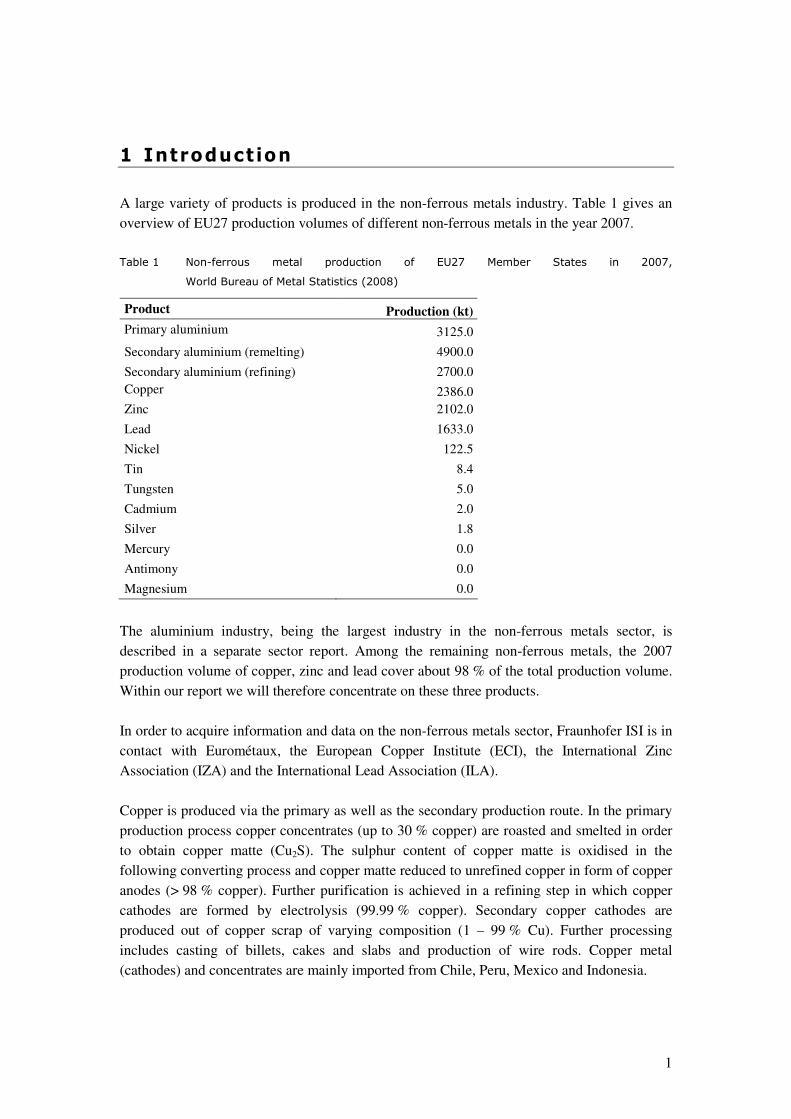
A large variety of products is produced in the non-ferrous metals industry. Table 1 gives an
overview of EU27 production volumes of different non-ferrous metals in the year 2007.
Table 1 Non-ferrous metal production of EU27 Member States in 2007,
World Bureau of Metal Statistics (2008)
Product Production (kt) Primary aluminium 3125.0
Secondary aluminium (remelting) 4900.0
Secondary aluminium (refining) 2700.0
Copper 2386.0
Zinc 2102.0
Lead 1633.0
Nickel 122.5
Tin 8.4
Tungsten 5.0
Cadmium 2.0
Silver 1.8
Mercury 0.0
Antimony 0.0
Magnesium 0.0
The aluminium industry, being the largest industry in the non-ferrous metals sector, is
described in a separate sector report. Among the remaining non-ferrous metals, the 2007
production volume of copper, zinc and lead cover about 98 % of the total production volume.
Within our report we will therefore concentrate on these three products.
In order to acquire information and data on the non-ferrous metals sector, Fraunhofer ISI is in
contact with Eurométaux, the European Copper Institute (ECI), the International Zinc
Association (IZA) and the International Lead Association (ILA).
Copper is produced via the primary as well as the secondary production route. In the primary
production process copper concentrates (up to 30 % copper) are roasted and smelted in order
to obtain copper matte (Cu2S). The sulphur content of copper matte is oxidised in the
following converting process and copper matte reduced to unrefined copper in form of copper
anodes (> 98 % copper). Further purification is achieved in a refining step in which copper
cathodes are formed by electrolysis (99.99 % copper). Secondary copper cathodes are
produced out of copper scrap of varying composition (1 – 99 % Cu). Further processing
includes casting of billets, cakes and slabs and production of wire rods. Copper metal
(cathodes) and concentrates are mainly imported from Chile, Peru, Mexico and Indonesia.
2
Primary zinc is produced via either the RLE (Roasting – Leaching – Electrolysis) or the ISF
(Imperial Smelting Furnace) route. In the RLE route calcine (ZnO) is produced from zinc
concentrates in a roasting process and a zinc sulphate solution (ZnSO4) obtained following a
leaching and purification step. Pure zinc metal is finally produced by electrolysis. Two
different RLE processes are distinguished by either hydrometallurgical or pyrometallurgical
treatment of the leaching residues. In the ISF process zinc concentrate is fed as a sinter and
then directly lead into the Imperial Smelting Furnace together with coke. Further purification
of crude zinc is achieved through refining. In the RLE as well as in the ISF process secondary
raw materials such as zinc oxide or EAF dusts can be added. Further processing of zinc is
production of alloys, which are then delivered to the die casting, galvanizing, etc. industries.
Most of the primary lead production in the EU27 is carried out in processes with one or two
furnaces with one or two process stages. Alternative production methods offer many potential
advantages in terms of overall efficiency, energy consumption and lower emissions (e.g. QSL,
Kivcet, Isasmelt, TBRC) and include considerable amounts of secondary materials in their
feedstock. 60 % of the European lead production stems from recycled materials (mainly
batteries). Secondary smelters either separate out the plastics and smelt the lead containing
fractions in furnaces (mostly rotary furnaces) or process the batteries as a whole in shaft
furnaces after removing the acid. Subsequent to the primary as well as the secondary smelting
process, the recovered lead bullions need to be refined to marketable qualities.
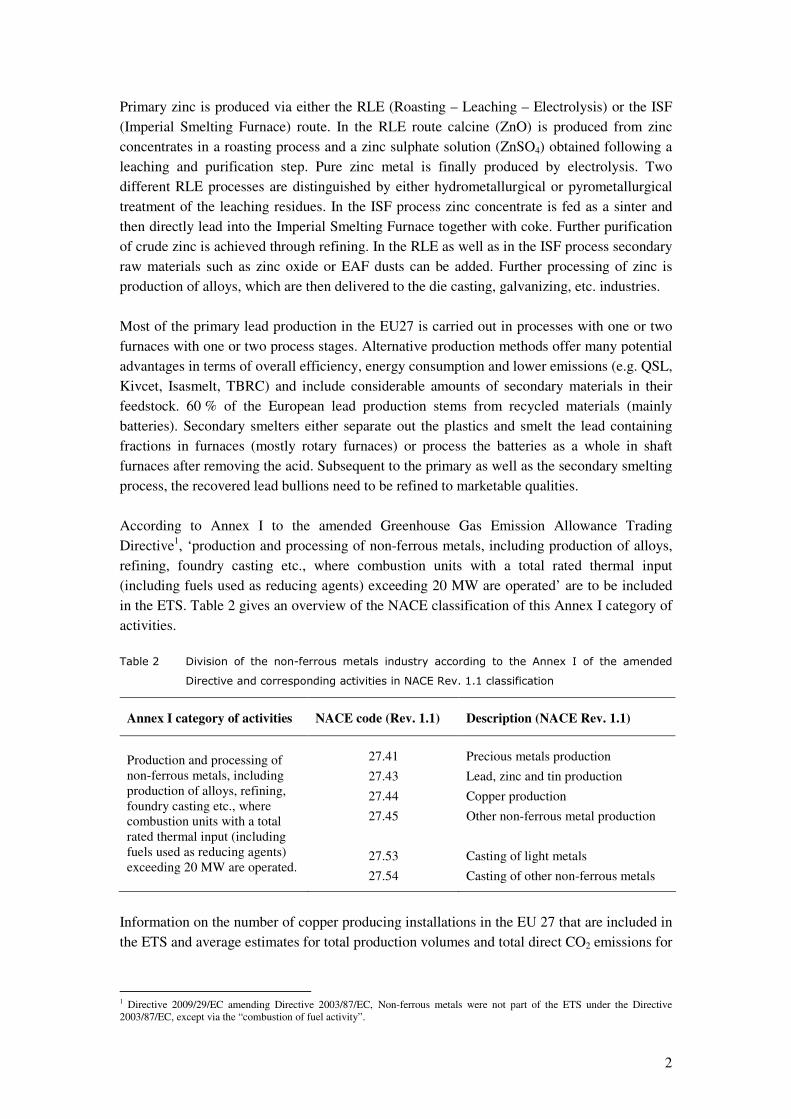
According to Annex I to the amended Greenhouse Gas Emission Allowance Trading
Directive1, ‘production and processing of non-ferrous metals, including production of alloys,
refining, foundry casting etc., where combustion units with a total rated thermal input
(including fuels used as reducing agents) exceeding 20 MW are operated’ are to be included
in the ETS. Table 2 gives an overview of the NACE classification of this Annex I category of
activities.
Table 2 Division of the non-ferrous metals industry according to the Annex I of the amended
Directive and corresponding activities in NACE Rev. 1.1 classification
Annex I category of activities NACE code (Rev. 1.1) Description (NACE Rev. 1.1)
Production and processing of
non-ferrous metals, including
production of alloys, refining,
foundry casting etc., where
combustion units with a total
rated thermal input (including
fuels used as reducing agents)
exceeding 20 MW are operated.
27.41
27.43
27.44
27.45
27.53
27.54
Precious metals production
Lead, zinc and tin production
Copper production
Other non-ferrous metal production
Casting of light metals
Casting of other non-ferrous metals
Information on the number of copper producing installations in the EU 27 that are included in
the ETS and average estimates for total production volumes and total direct CO2 emissions for
1 Directive 2009/29/EC amending Directive 2003/87/EC, Non-ferrous metals were not part of the ETS under the Directive
2003/87/EC, except via the “combustion of fuel activity”.
3
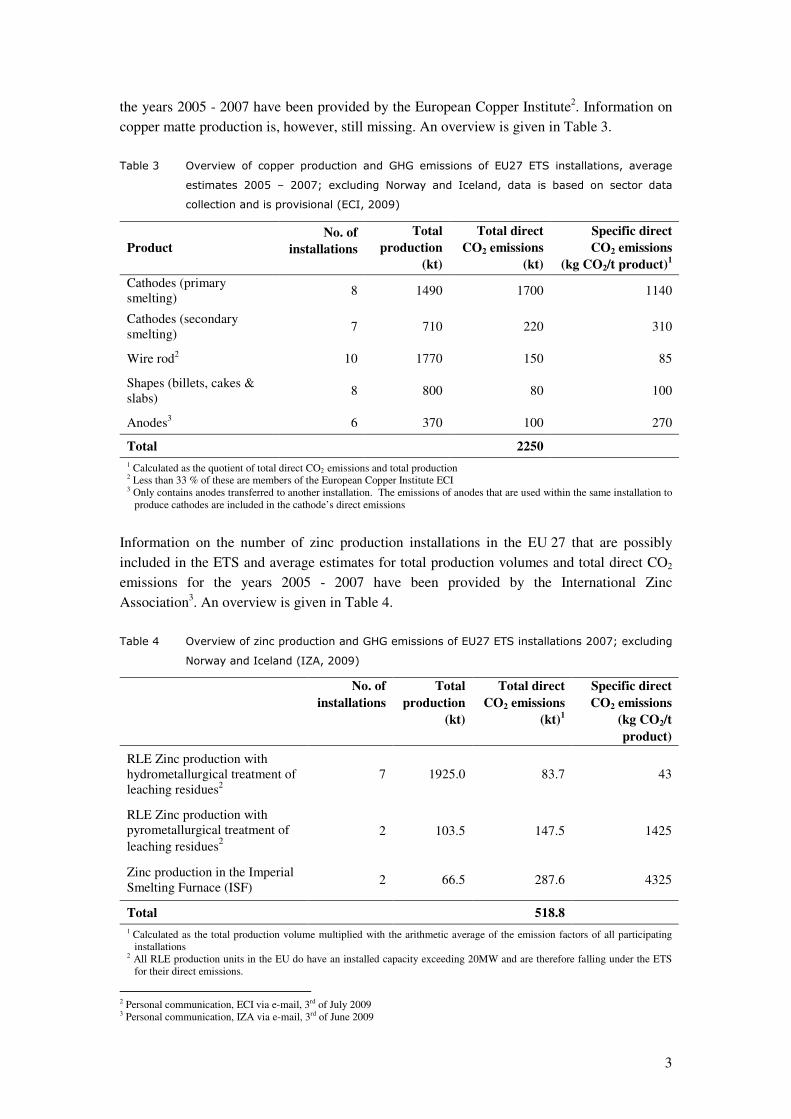
the years 2005 - 2007 have been provided by the European Copper Institute2. Information on
copper matte production is, however, still missing. An overview is given in Table 3.
Table 3 Overview of copper production and GHG emissions of EU27 ETS installations, average
estimates 2005 – 2007; excluding Norway and Iceland, data is based on sector data
collection and is provisional (ECI, 2009)
Product No. of
installations
Total production
(kt)
Total direct CO2 emissions
(kt)
Specific direct CO2 emissions
(kg CO2/t product)1
Cathodes (primary
smelting) 8 1490 1700 1140
Cathodes (secondary
smelting) 7 710 220 310
Wire rod2
10 1770 150 85
Shapes (billets, cakes &
slabs) 8 800 80 100
Anodes3
6 370 100 270
Total 2250 1 Calculated as the quotient of total direct CO2 emissions and total production 2 Less than 33 % of these are members of the European Copper Institute ECI 3 Only contains anodes transferred to another installation. The emissions of anodes that are used within the same installation to
produce cathodes are included in the cathode’s direct emissions
Information on the number of zinc production installations in the EU 27 that are possibly
included in the ETS and average estimates for total production volumes and total direct CO2
emissions for the years 2005 - 2007 have been provided by the International Zinc
Association3. An overview is given in Table 4.
Table 4 Overview of zinc production and GHG emissions of EU27 ETS installations 2007; excluding
Norway and Iceland (IZA, 2009)
No. of installations
Total production
(kt)
Total direct CO2 emissions
(kt)1
Specific direct CO2 emissions
(kg CO2/t product)
RLE Zinc production with
hydrometallurgical treatment of
leaching residues2
7 1925.0 83.7 43
RLE Zinc production with
pyrometallurgical treatment of
leaching residues2
2 103.5 147.5 1425
Zinc production in the Imperial
Smelting Furnace (ISF) 2 66.5 287.6 4325
Total 518.8 1 Calculated as the total production volume multiplied with the arithmetic average of the emission factors of all participating
installations 2 All RLE production units in the EU do have an installed capacity exceeding 20MW and are therefore falling under the ETS
for their direct emissions.
2 Personal communication, ECI via e-mail, 3rd of July 2009 3 Personal communication, IZA via e-mail, 3rd of June 2009
4
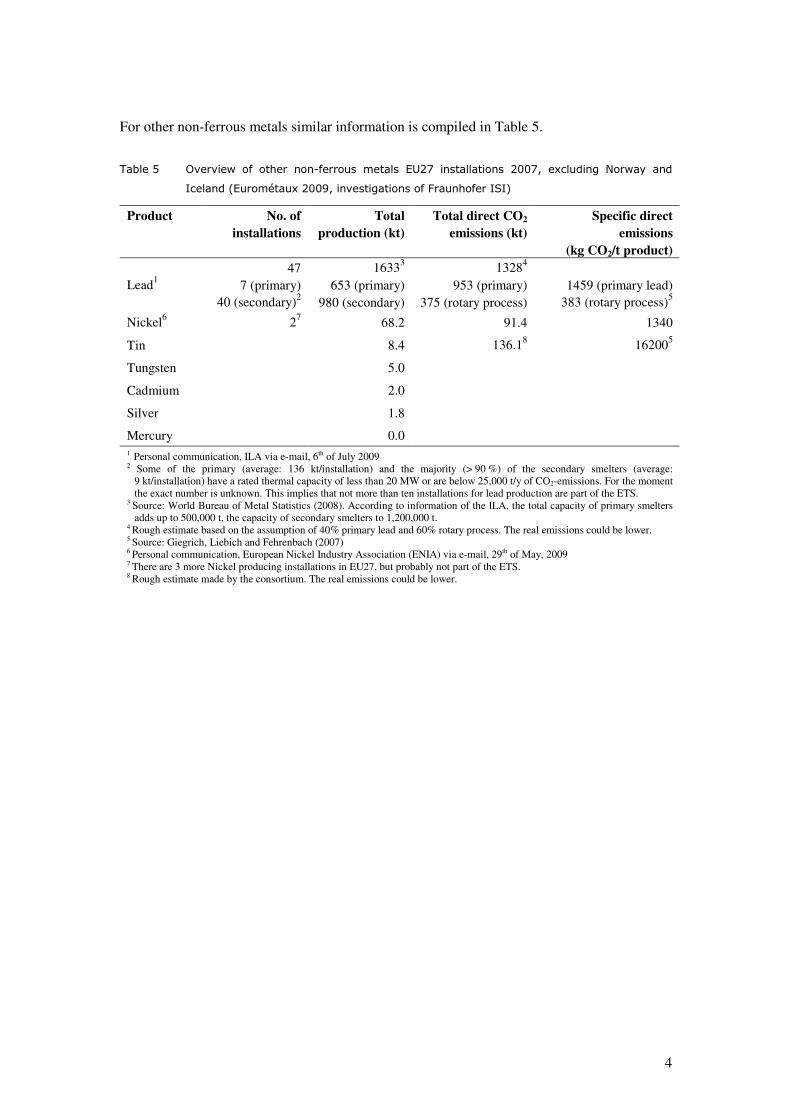
For other non-ferrous metals similar information is compiled in Table 5.
Table 5 Overview of other non-ferrous metals EU27 installations 2007, excluding Norway and
Iceland (Eurométaux 2009, investigations of Fraunhofer ISI)
Product No. of installations
Total production (kt)
Total direct CO2 emissions (kt)
Specific direct emissions
(kg CO2/t product)
Lead1
47
7 (primary)
40 (secondary)2
16333
653 (primary)
980 (secondary)
13284
953 (primary)
375 (rotary process)
1459 (primary lead)
383 (rotary process)5
Nickel6
27
68.2 91.4 1340
Tin 8.4 136.18
162005
Tungsten 5.0
Cadmium 2.0
Silver 1.8
Mercury 0.0
1 Personal communication, ILA via e-mail, 6th of July 2009 2 Some of the primary (average: 136 kt/installation) and the majority (> 90 %) of the secondary smelters (average:
9 kt/installation) have a rated thermal capacity of less than 20 MW or are below 25,000 t/y of CO2-emissions. For the moment
the exact number is unknown. This implies that not more than ten installations for lead production are part of the ETS. 3 Source: World Bureau of Metal Statistics (2008). According to information of the ILA, the total capacity of primary smelters
adds up to 500,000 t, the capacity of secondary smelters to 1,200,000 t. 4 Rough estimate based on the assumption of 40% primary lead and 60% rotary process. The real emissions could be lower. 5 Source: Giegrich, Liebich and Fehrenbach (2007) 6 Personal communication, European Nickel Industry Association (ENIA) via e-mail, 29th of May, 2009 7 There are 3 more Nickel producing installations in EU27, but probably not part of the ETS. 8 Rough estimate made by the consortium. The real emissions could be lower.
5
2 Production process and GHG emissions
2.1 Descr ipt ion of the product ion process
Copper Primary copper production starts from concentrates with a copper content of up to 30 %. In a
first production step copper concentrates are roasted and smelted in order to obtain copper
matte (Cu2S) with a copper content of about 70 %. In the following converting process the
sulphur content is oxidised by blowing oxygen through the hot copper matte. Copper matte is
reduced to unrefined copper with a copper content of more than 98 % and cast into anodes.
Further purification is achieved in the refining process, where copper anodes are
electrolytically reduced to copper cathodes with a copper content of 99.99 %.
Pure copper scrap for secondary production can directly be melt into billets, cakes and slabs.
Less pure scrap with a copper content between 1 and 99 % is transformed to anodes by
different treatments, depending on the scrap quality. In the following refining step, copper
cathodes with a copper content of 99.99 % are formed.
Semi-fabrication of copper cathodes and direct melt scrap includes casting of billets, cakes
and slabs as well as production of wire-rod. Further downstream activities are e.g. ingot-
making, casting, tube, wire and powder-making.
Copper concentrates and copper scrap mostly contain a variety of metals in addition to
copper. These are simultaneously extracted in the copper smelting process.
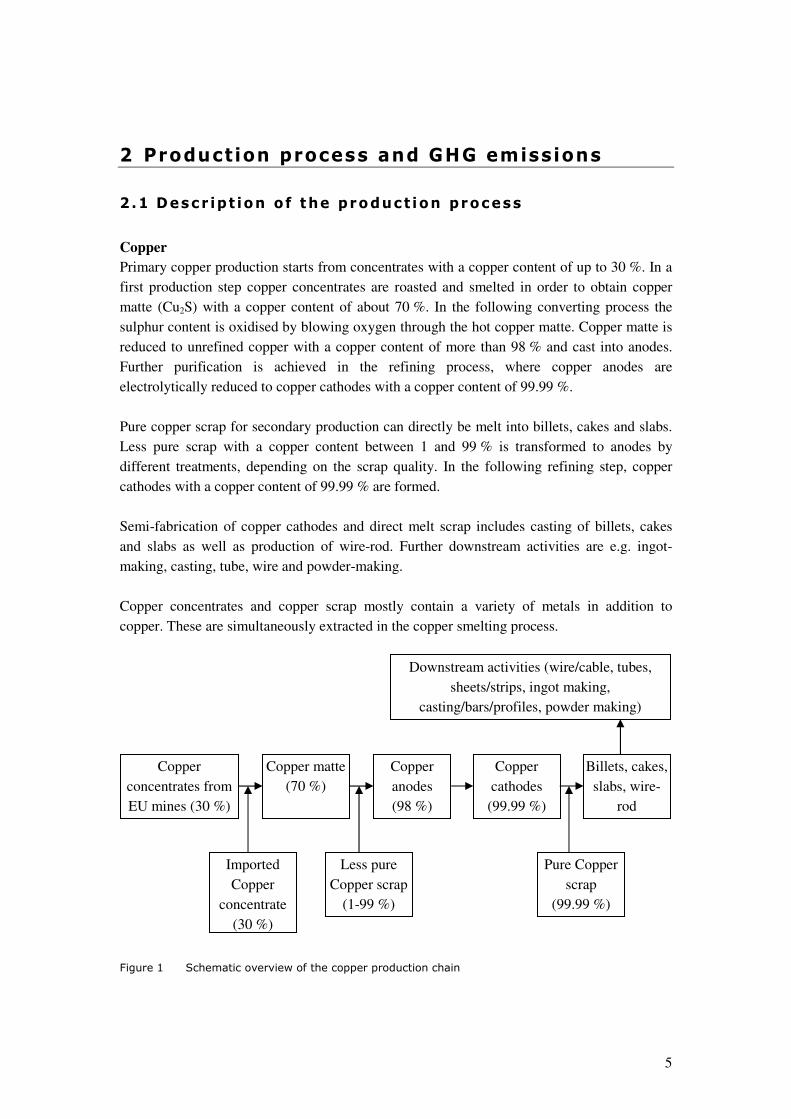
Figure 1 Schematic overview of the copper production chain
Copper
cathodes
(99.99 %)
Billets, cakes,
slabs, wire-
rod
Imported
Copper
concentrate
(30 %)
Less pure
Copper scrap
(1-99 %)
Copper
anodes
(98 %)
Copper matte
(70 %)
Copper
concentrates from
EU mines (30 %)
Pure Copper
scrap
(99.99 %)
Downstream activities (wire/cable, tubes,
sheets/strips, ingot making,
casting/bars/profiles, powder making)
6
Zinc Primary zinc is produced via two different routes, namely “Roasting – Leaching –
Electrolysis” (RLE) and the Imperial Smelting Furnace (ISF). Only two ISF installations are
left in Europe with one of them momentarily out of production. Both production routes start
from concentrates with a zinc content of 10 – 50 %.
In the first production step of the RLE route, calcine (ZnO) is produced in an exothermic
roasting process. The released SO2 is then used to produce H2SO4 either in-house or by the
chemical industry. RLE continues with a neutral leaching step followed by a purification step
where a zinc sulphate (ZnSO4) solution is obtained. In the purification step copper, cadmium,
cobalt, nickel and possible other impurities are taken out, can be further treated and sold. Pure
zinc cathodes containing less than 50g of impurities per t of zinc are obtained by electrolysis.
This is also called SHG (Special High Grade) zinc or 99.995 % pure zinc. RLE zinc
production can further be categorised by the kind of treatment of the leaching residues, in
which still > 15 % of the original zinc input may be contained.
In the case of hydrometallurgical treatment the residues are decomposed into zinc sulphate
(ZnSO4), possibly a lead/silver by-product and an iron precipitate by high temperature acid
leaching and further precipitation. The zinc sulphate obtained is recirculated to the leaching
step. In the pyrometallurgical residue treatment process, the residues are burnt under addition
of cokes in a Waelz Kiln. The outputs are slag and ZnO fume, which is recirculated to the
leaching process.
The first production step of the ISF route consists in sintering of the concentrates. Crude zinc
is then obtained from the Imperial Smelting Furnace where sinter is burnt together with coke.
Further purification of crude zinc is achieved through refining.
Zinc oxides and scrap can be used for secondary zinc production. In the RLE as well as in the
ISF primary production process zinc oxides and scrap can be added and account for 10 to
30% of total input. In comparison to RLE plants, ISF plants are better prepared to take
secondary raw material in.
Further processing of zinc cathodes takes place in a foundry, where either SHG (super high
grade) zinc is melted and given its “sales shape” or alloys are produced. Downstream
activities include galvanizing, brass production (by the copper industry), die casting, sheet
production and chemicals. About 50 % of the overall zinc demand is used for galvanising.
Lead The traditional primary lead production process route via sintering and shaft furnace has been
phased out by most of the producers in the EU 27 and replaced by processes with only one or
two furnaces with one or two process stages. Alternative production methods offer many
potential advantages in terms of overall efficiency, energy consumption and lower emissions
(e.g. QSL, Kivcet, Isasmelt, TBRC) and include considerable amounts of secondary materials
in their feedstock. One plant in Germany relies on the environment-friendly and energy-
saving technology of the QSL process. Here, lead is won by charging lead concentrates and
secondary raw materials to a single, self-contained aggregate, the so-called QSL reactor.
7
60 % of the lead in Europe is produced from recycled materials (mainly batteries). Much less
energy (less than half) is required for secondary production in comparison to the production
of lead from ore (energy need for primary production: 7000 - 20000 MJ/t lead, secondary
production: 5000 - 10000 MJ/t lead). Secondary smelters either separate out the plastics and
smelt the lead containing fractions in furnaces (mostly rotary furnaces) or process the
batteries as a whole in shaft furnaces after removing the acid.
Subsequent to the primary as well as the secondary smelting process, the recovered lead
bullions need to be refined to marketable qualities. The refining process is more complex for
metals of primary origin involving the removal of impurities (Ag, Bi, etc.) arising in the ore
concentrate.
2.2 Direct emiss ions and steam use
Copper In the primary copper matte production process (roasting and smelting) direct CO2 emissions
result from fossil fuel and coke input as well as from the carbon, which is dissolved in the
concentrates. During the following copper anode production (converting) direct CO2
emissions occur due to fossil fuel input. No direct CO2 emissions stem from the electrolysis
process as electricity is used. Secondary copper smelting leads to direct CO2 emissions due to
fossil fuel input. Apart from that, a significant amount of carbon may be embodied in
secondary raw material like electronic scrap and cause up to 60 % of total direct emissions.
Steam can be used in the copper refining step to heat the electrolysis bath.
Zinc Direct emissions in the zinc sector are very limited. Fuel combustion is required for starting
up the roaster, but following the start-up it is an exothermic process which is only asking for
electric driven vans, blowing air into the roaster. Further fuel is used in foundries where
cathodic zinc is molten and possibly alloyed with other metals. Foundries can be heated with
either gas or electricity and in many cases a mix of both energy carriers is used. In
pyrometallurgical treatment of the leach residues, coke is used.
Lead CO2 emissions occur from smelting and reducing with gas and coal. Kettles used for the
refining processes are indirectly heated with gas and oil.
8
3 Allocation methodology
3.1 Background
Emissions from copper activities in the EU ETS represent about 2.25 Mt of CO24. Emissions
from other non-ferrous metals represent together a similar amount, mostly due to lead.
Compared to the emissions from aluminium-related activities, this represents not more than
20 % of the overall emissions from the non-ferrous metals sector including aluminium.
Compared to the overall industrial emissions from the EU 27 under the ETS of around 850
Mt, this represents about 0.5 % only. Beyond that, each of the processes in the non-ferrous
metals sector involves a very limited number of installations, which makes a benchmark
system based on the average of the 10 % most efficient installations hardly possible. We
therefore recommend treating copper, zinc, lead and other non-ferrous metals through a fall-
back approach (see section 5 of the report on the project approach and general issues).
The obstacles to a benchmark approach for the non-ferrous metal sector are discussed in more
detail in Chapter 4.
Electricity benchmarks The compensation mechanism for indirect emissions is not within the scope of this study. he
electrolysis step to produce copper cathodes, the electric furnaces in copper production and
the electrolysis of zinc are all electricity-intensive processes that could possibly be considered
for the development of electricity benchmarks in the non-ferrous metals industry. So far, no
data is available on the electricity consumption in the non-ferrous metals industry.
3.2 Relevant PRODCOM codes
As mentioned earlier we recommend treating the whole non-ferrous metal sector with a fall-
back approach (see section 5 of the report on the project approach and general issues) and do
not consider a benchmark approach described as follows an adequate approach for the non-
ferrous metal sector. Below we give overviews of the relevant PRODCOM codes for copper,
zinc and lead in case the final decision is made to develop a product benchmark for the
copper, zinc and lead sector. A full list of the PRODCOM codes of non-ferrous metals in
unwrought form is attached to this report (see appendix A).
4 See Table 3.
9
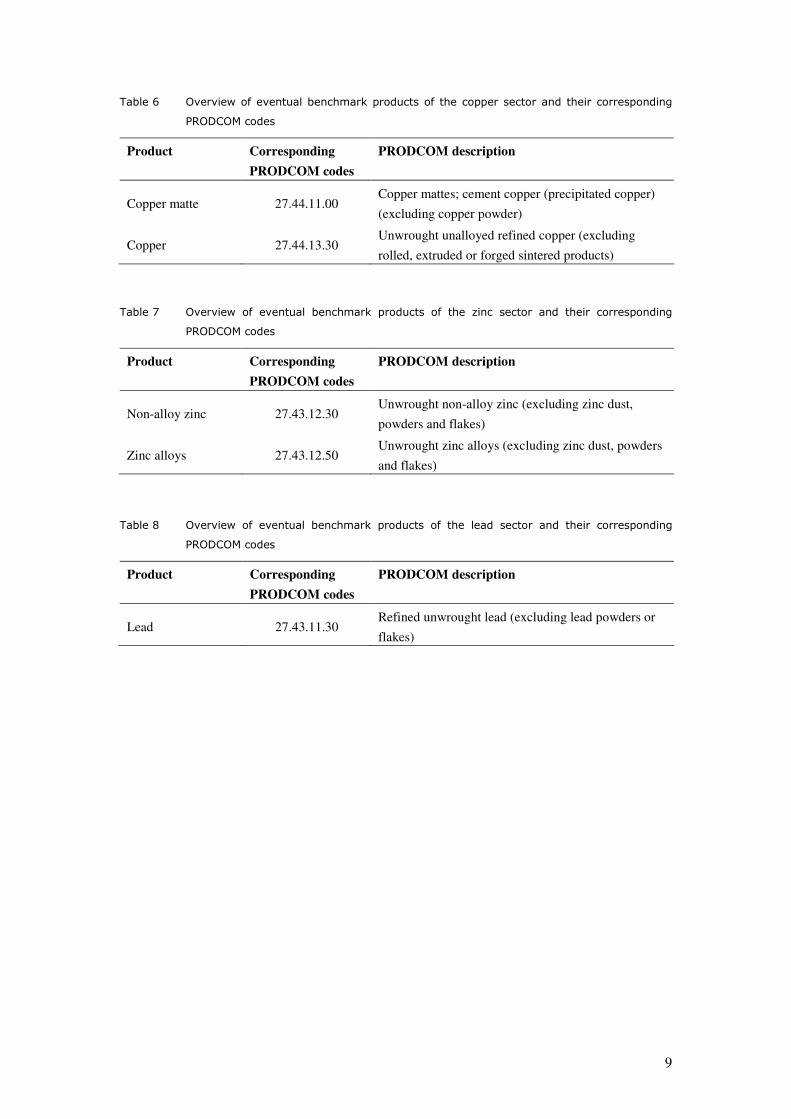
Table 6 Overview of eventual benchmark products of the copper sector and their corresponding
PRODCOM codes
Product Corresponding
PRODCOM codes
PRODCOM description
Copper matte 27.44.11.00 Copper mattes; cement copper (precipitated copper)
(excluding copper powder)
Copper 27.44.13.30 Unwrought unalloyed refined copper (excluding
rolled, extruded or forged sintered products)
Table 7 Overview of eventual benchmark products of the zinc sector and their corresponding
PRODCOM codes
Product Corresponding
PRODCOM codes
PRODCOM description
Non-alloy zinc 27.43.12.30 Unwrought non-alloy zinc (excluding zinc dust,
powders and flakes)
Zinc alloys 27.43.12.50 Unwrought zinc alloys (excluding zinc dust, powders
and flakes)
Table 8 Overview of eventual benchmark products of the lead sector and their corresponding
PRODCOM codes
Product Corresponding
PRODCOM codes
PRODCOM description
Lead 27.43.11.30 Refined unwrought lead (excluding lead powders or
flakes)
10
4 Emission intensity data
As stated earlier, we do not consider product benchmarking an adequate approach for the non-
ferrous metal sector and therefore recommend applying a fall-back approach (see section 5 of
the report on the project approach and general issues). Below we nevertheless give
information on emission intensity differences for several copper, zinc and lead production
steps as it was obtained from the relevant sector organizations. This data supports our opinion
that product benchmarking is not an appropriate approach for the non-ferrous metals sector. In
addition, we also give some reflections for copper on the various products that need to be
distinguished in case a decision on product benchmarking is being made.
Copper The European Copper Institute has collected data on direct emissions among its members.
The whole benchmark curves for primary cathodes, secondary cathodes, wire rod, shapes
(cakes, slabs and billets) and anodes can in principle be provided but are not public for
confidentiality reasons, even more because of the low number of installations in each curve.
The copper sector has nevertheless provided the values of the lowest and highest performer.
Table 9 gives an overview of the spread factor for benchmarking curves of the different
copper production steps, i.e. the factor describing the distance from the lowest to the highest
emitter in the curve (ECI, 2009a).
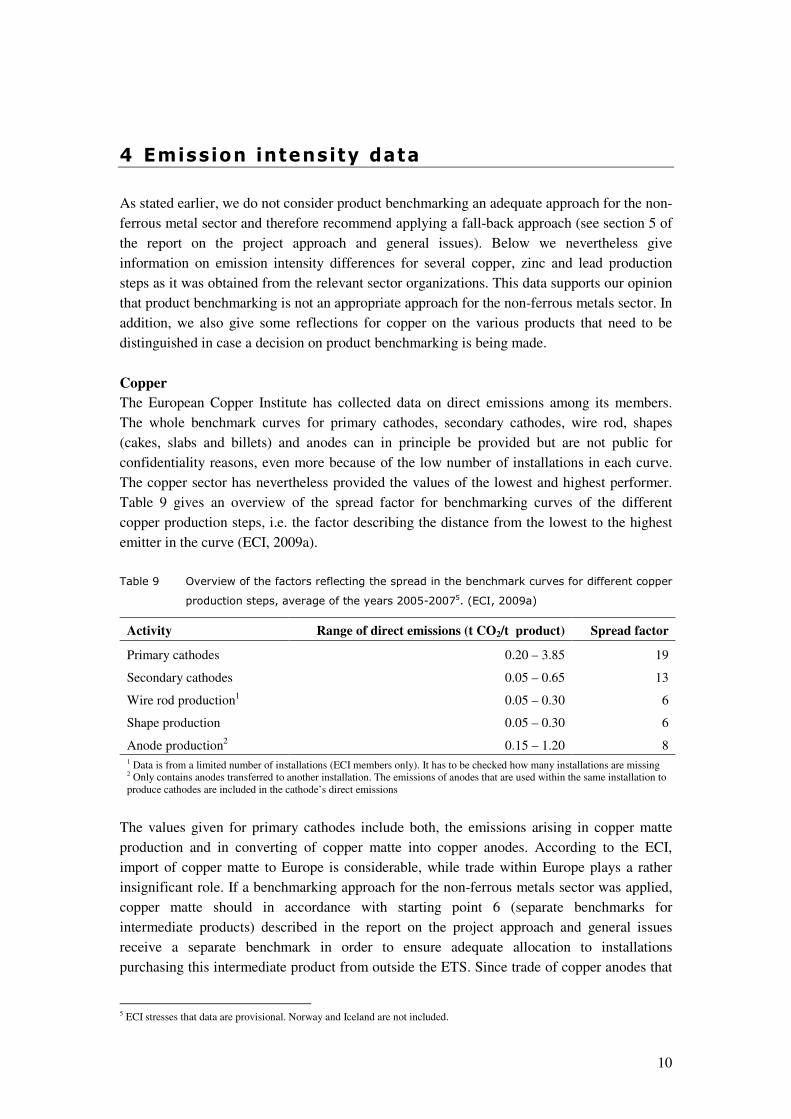
Table 9 Overview of the factors reflecting the spread in the benchmark curves for different copper
production steps, average of the years 2005-20075. (ECI, 2009a)
Activity Range of direct emissions (t CO2/t product) Spread factor
Primary cathodes 0.20 – 3.85 19
Secondary cathodes 0.05 – 0.65 13
Wire rod production1 0.05 – 0.30 6
Shape production 0.05 – 0.30 6
Anode production2 0.15 – 1.20 8
1 Data is from a limited number of installations (ECI members only). It has to be checked how many installations are missing 2 Only contains anodes transferred to another installation. The emissions of anodes that are used within the same installation to
produce cathodes are included in the cathode’s direct emissions
The values given for primary cathodes include both, the emissions arising in copper matte
production and in converting of copper matte into copper anodes. According to the ECI,
import of copper matte to Europe is considerable, while trade within Europe plays a rather
insignificant role. If a benchmarking approach for the non-ferrous metals sector was applied,
copper matte should in accordance with starting point 6 (separate benchmarks for
intermediate products) described in the report on the project approach and general issues
receive a separate benchmark in order to ensure adequate allocation to installations
purchasing this intermediate product from outside the ETS. Since trade of copper anodes that
5 ECI stresses that data are provisional. Norway and Iceland are not included.
11
are produced in the converting process is considerable, a separate benchmark for copper
anodes would be required as well. No direct emissions occur in the following electrolysis step
and no direct emission benchmark would therefore be necessary for the production of copper
cathodes from anodes.
It becomes clear from Table 9 that the spread in the benchmarking curves of the copper sector
is high, which means that a benchmark approach would practically result in auctioning for a
number of installations. In the case of anodes and primary and secondary cathodes the reasons
for the high spreads in the benchmark curves have been investigated by the ECI. It was found
out that the main reasons for outliers are firstly the use of electricity versus fossil fuel as
source of energy, secondly a high share of carbon content in the feed, which varies between
0.2 % and 7 % for concentrates and even more strongly for secondary raw material and
thirdly the share of copper content of concentrates varying between 25 and 40 %. Specific
energy consumption of copper matte production depends strongly on the concentrates’ copper
content, based on the volume of gases to pump in the smelter and acid plants per unit of
copper. According to a rough estimate of the ECI, considering all the energies involved in
primary cathode production, the specific energy consumption of primary cathode will increase
by 1.5 % with every 1 % lower copper content.
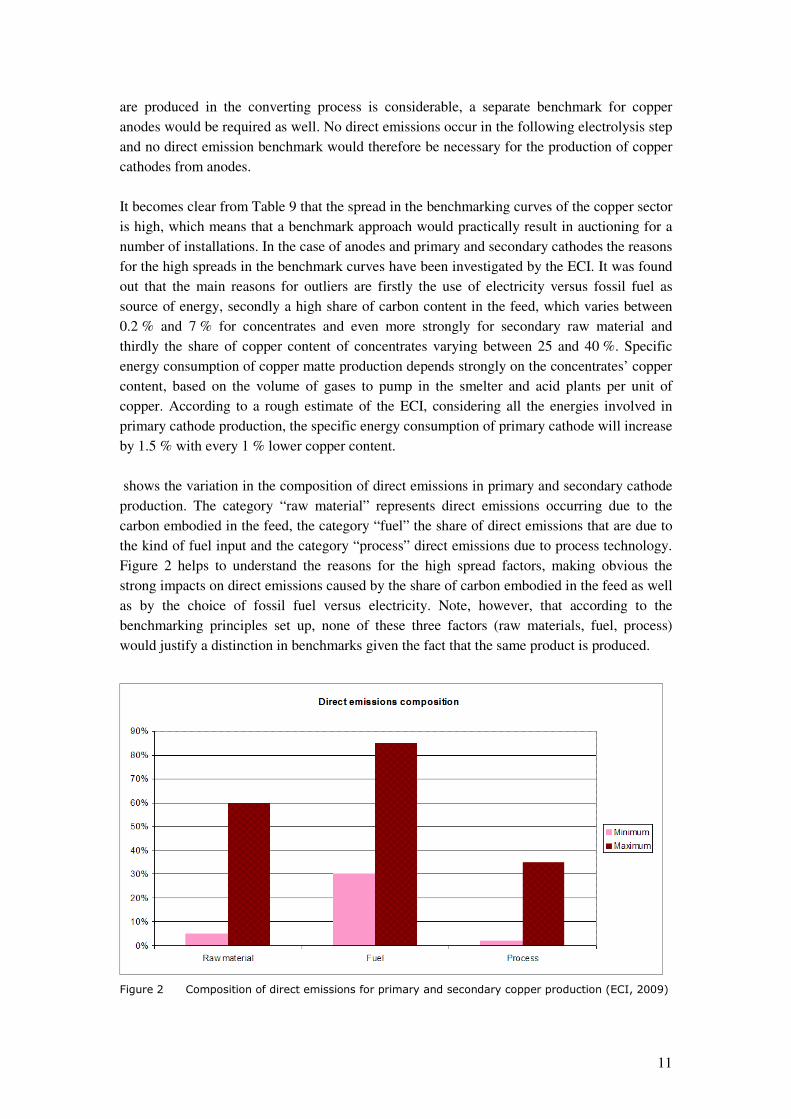
shows the variation in the composition of direct emissions in primary and secondary cathode
production. The category “raw material” represents direct emissions occurring due to the
carbon embodied in the feed, the category “fuel” the share of direct emissions that are due to
the kind of fuel input and the category “process” direct emissions due to process technology.
Figure 2 helps to understand the reasons for the high spread factors, making obvious the
strong impacts on direct emissions caused by the share of carbon embodied in the feed as well
as by the choice of fossil fuel versus electricity. Note, however, that according to the
benchmarking principles set up, none of these three factors (raw materials, fuel, process)
would justify a distinction in benchmarks given the fact that the same product is produced.
Figure 2 Composition of direct emissions for primary and secondary copper production (ECI, 2009)
12
Scrap quality has got a high impact on the energy consumption and direct emissions of
secondary copper furnaces, i.e. production of secondary copper from low quality scrap is
more energy and CO2-intensive than from high quality scrap. Recycling of electronic scrap in
particular leads to high CO2 emissions, since on the one hand electronic scrap contains a high
share of carbon leading to additional process emissions and on the other hand two smelting
steps are necessary instead of one. This indicates that there are conflicting environmental
goals: CO2 reduction and waste recycling. With the aim of saving resources, production of
non-ferrous metals from low quality scrap is required from European environmental policies6.
Considerable investment in environmentally friendly technology has been made by European
copper smelters in the last years. Stakeholders from the non-ferrous metal industry therefore
argue that companies should not be punished for their recycling efforts and a consideration of
scrap quality in the allocation would be necessary. In our opinion consideration of different
recycling efforts will however be difficult within a benchmark approach for the non-ferrous
metal industry, even more since the share of recycling material in the feed of secondary
production varies continuously between 30 and 100 % between different European
installations7. In view of the very limited number of producers in combination with the
limited amount of emissions, the occurrence of intermediate process steps with varying shares
of primary versus secondary inputs and, related to this, some interchangeabilty of electricity
and fuel use, it is very difficult to develop a benchmark approach for the copper production
chain. We therefore recommend a fall-back approach for this sector (see section 5 of the
report on the project approach and general issues).
Zinc
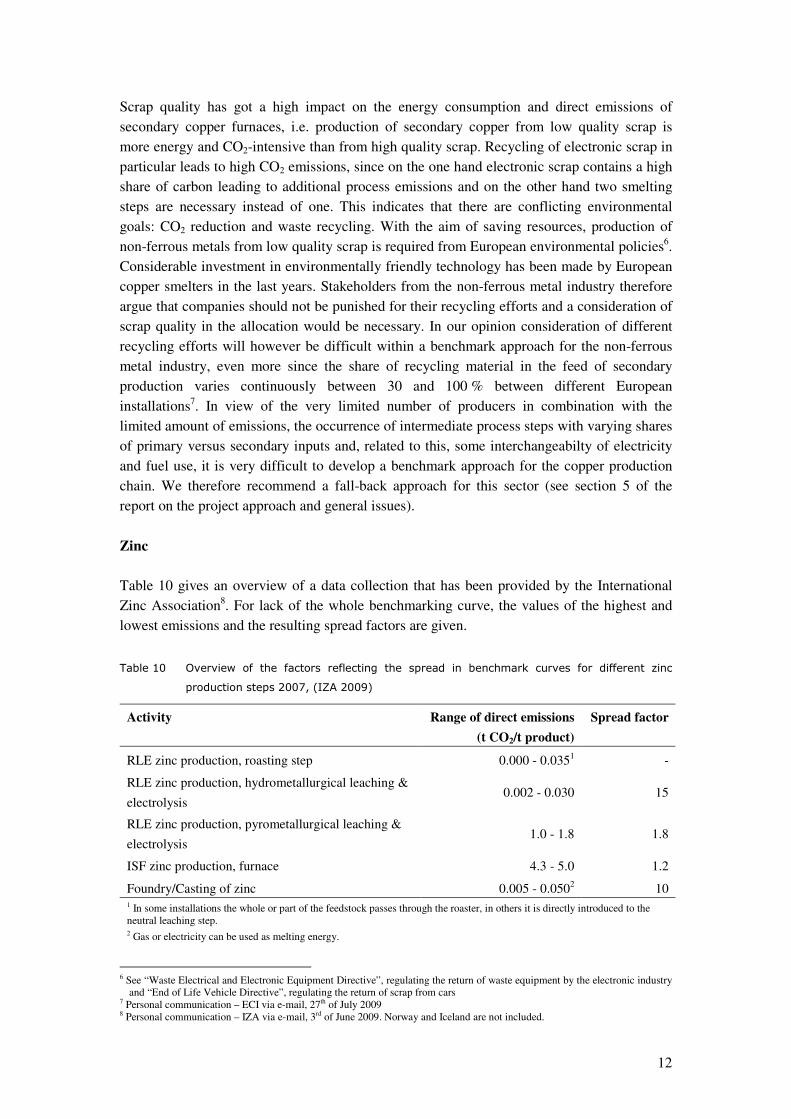
Table 10 gives an overview of a data collection that has been provided by the International
Zinc Association8. For lack of the whole benchmarking curve, the values of the highest and
lowest emissions and the resulting spread factors are given.
Table 10 Overview of the factors reflecting the spread in benchmark curves for different zinc
production steps 2007, (IZA 2009)
Activity Range of direct emissions
(t CO2/t product)
Spread factor
RLE zinc production, roasting step 0.000 - 0.0351 -
RLE zinc production, hydrometallurgical leaching &
electrolysis 0.002 - 0.030 15
RLE zinc production, pyrometallurgical leaching &
electrolysis 1.0 - 1.8 1.8
ISF zinc production, furnace 4.3 - 5.0 1.2
Foundry/Casting of zinc 0.005 - 0.0502 10
1 In some installations the whole or part of the feedstock passes through the roaster, in others it is directly introduced to the
neutral leaching step. 2 Gas or electricity can be used as melting energy.
6 See “Waste Electrical and Electronic Equipment Directive”, regulating the return of waste equipment by the electronic industry
and “End of Life Vehicle Directive”, regulating the return of scrap from cars 7 Personal communication – ECI via e-mail, 27th of July 2009 8 Personal communication – IZA via e-mail, 3rd of June 2009. Norway and Iceland are not included.
13
Energy consumption of zinc oxide production depends amongst others on the zinc content of
the concentrates varying between 10 and 50 %, but also on the share of electricity versus fuel
use in the different process routes. Given the overall size of the sub sector with only a limited
amount of installations and emissions (11 installations with only about 0.5 Mt CO2
emissions), we recommend a fall-back approach for this product (see section 5 of the report
on the project approach and general issues).
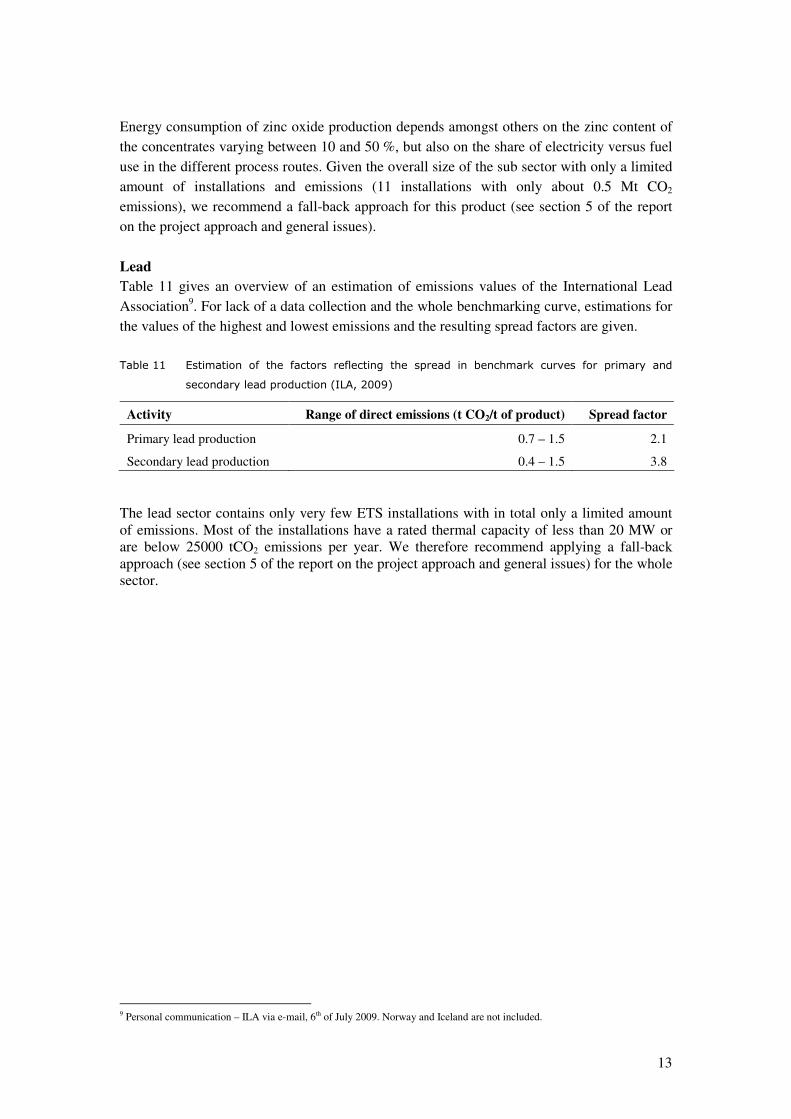
Lead Table 11 gives an overview of an estimation of emissions values of the International Lead
Association9. For lack of a data collection and the whole benchmarking curve, estimations for
the values of the highest and lowest emissions and the resulting spread factors are given.
Table 11 Estimation of the factors reflecting the spread in benchmark curves for primary and
secondary lead production (ILA, 2009)
Activity Range of direct emissions (t CO2/t of product) Spread factor
Primary lead production 0.7 – 1.5 2.1
Secondary lead production 0.4 – 1.5 3.8
The lead sector contains only very few ETS installations with in total only a limited amount
of emissions. Most of the installations have a rated thermal capacity of less than 20 MW or
are below 25000 tCO2 emissions per year. We therefore recommend applying a fall-back
approach (see section 5 of the report on the project approach and general issues) for the whole
sector.
9 Personal communication – ILA via e-mail, 6th of July 2009. Norway and Iceland are not included.
14
5 Additional steps required
If, as recommended by the consortium, a fall-back approach for the whole non-ferrous metal
sector was chosen, no more data would be required from the sector associations.
In case that the choice of a benchmark approach would be made for parts of the non-ferrous
metal industry, additional data would be necessary.
1. For further work on the determination of final benchmark values based on the average of
the 10% most carbon efficient installations, benchmark curves including all installations
from EU27, Norway and Iceland would be required for each of the benchmark groups.
2. Separate benchmark curves for copper matte and the production of copper anodes from
copper matte would be required.
3. The data that has been provided from the ECI is given on copper cathodes (primary and
secondary) as end-products. We emphasize that the benchmarks should, however, be
based on copper anodes, since the import of copper anodes to Europe is significant and no
allocation should be given to installations producing copper cathodes from imported
anodes10
.
4. It would in particular be essential that system boundaries would be made clear to all
installations participating in the data collection, in order to ensure high quality of the data
provided.
10 No further direct emissions arise during transformation of anodes into cathodes via electrolysis.
15
6 Stakeholder comments
6.1 Comments o f the copper sector
Comments on the interim report have been made by the ECI on the following issues11
.
Product choice The ECI does not understand the logic for a separate benchmark for copper matte. This
product is primarily treated in house, with merchant trade being very small. A separate
benchmark for copper anode production is also not considered advisable, since these anodes
are not traded internationally at the LME. Finally, the ECI wishes to have more than one
benchmark for secondary cathode production depending on the complexity of the feed.
Fall-back approach It is important to note that in some cases the potential for additional measures to reduce CO2
emissions reaches technological and physical limits. In the discussion of any generic
efficiency improvement factor combined with a fallback approach it should be taken into
account that the improvement potential for the production processes of copper wire rod and
shapes is extremely limited due to mature technology. The factor should be based on
performance, which could be assessed from the reference document on best available
techniques for the non-ferrous metals industry (BREF non-ferrous metals-draft, 2008).
For some installations, a large amount (up to 60 % of direct emissions) is due to the carbon
content of the raw materials (in naturally occurring ores, concentrates and secondary materials
for recycling). The processors of these raw materials have no control over the quality of these
resources. For the whole copper sector it represents ca. 30 % of total direct emissions (i.e.
690,000 t of CO2). As a result it seriously reduces the potential scope for decreasing CO2
emissions.
The ultimate solution for treating recycling in ETS would be grandfathering. Furthermore for
grandfathering the generic efficiency improvement factor has to be designed in such a way
that carbon in feed and fuel should be excluded from the calculations.
Recycling During copper processing, recycling plays a major role as it supplied 41 % of the European
demand in 2007. Furthermore, copper plays an important role as “collector” of precious
metals and trace metals, which, if not recycled, would be entirely lost to dumping grounds or
exported to non-EU countries. Thus to improve supply security, resource conservation and
environmental protection, the EU is increasing its support. As recovery and recycling rates
increase, e.g. from End-of Life Vehicles (ELV) and Waste Electrical & Electronic Equipment
(WEEE), the copper content in the feedstock decreases and the carbon content increases (e.g.
11 Personal communication – ECI via e-mail, 3rd of July 2009
16
plastics from cable insulation and from printed circuit boards.) Both of these drive up carbon
emissions per t.
European copper smelters/foundries have the highest environmental standards worldwide. For
example, in 2008, European smelters emitted twelve times less SO2 compared to international
smelters. Unfortunately the operation of environmental abatement techniques is connected
with high energy consumption. CO2 emissions, which are caused by environmental protection
measures, must be fully compensated or recycling and environmental abatement measures
must be excluded from the ETS.
Considering the fact that producing cathodes with recycled materials saves ca. 650.000 t of
CO2, because specific direct emissions of secondary smelters are 4 times less than of primary
smelters, designing suitable compensation measures (e.g. free allocation for direct emissions
and financial compensation for indirect emissions) during the ETS implementation will be an
effective and efficient driver for recycling and further processing. Failing such compensation
measures, recycling materials will either leave Europe or will be driven towards landfill.
Carbon leakage Copper cathode is a commodity for which the price is quoted on London Metal Exchange.
This LME price is a worldwide reference. Additional CO2 related burdens in Europe do not
affect this global price in any way. In other words, if the CO2 related burden is imposed to
European manufacturers, it will have to be absorbed by European producers and can not be
charged to the customers. This will lead to loss of competitiveness for European
manufacturers and will result in carbon leakage.
If raw materials with a high carbon content are subject to ETS in Europe, and carry a financial
burden either directly or indirectly, then EU will increasingly export high-carbon raw
materials and secondary materials, thereby increasing carbon leakage; a threat recently
recognised by the EC in its preliminary list of sectors “at significant risk of carbon leakage”
(which includes the copper industry).
Substantial investments have been made since 1995 by the industry to improve energy
efficiency and reduce CO2 emissions. European copper production is the most energy-
efficient in the world and energy is produced from a comparatively clean fuel mix. For
example, for the production of cathodes, the 2006 unit energy consumption is 54 % lower
than that of 1995. The possibilities for further improvements for this subsector and others,
like wire-rod and shapes or electro-refining of anodes to cathodes, are very limited and would
be dependent on future technological breakthroughs. Without realistic improvements targets,
full free allocations for direct emissions and financial compensation for indirect emissions;
these installations would close down, and the objective of mitigating carbon leakage would
not be met.
Capacity expansion Capacity increases and full utilisation of approved capacities for all feed materials and new
installations must be taken into account in the allocation, because the greatest efficiency
improvements and specific emission decreases are reached by production increases in Europe.
17
In the past the copper sector has already invested in the most modern technology to improve
energy efficiency and to decrease the specific direct and indirect CO2 emissions. This has
been mainly supported by capacity expansion. Therefore capacity expansion should be
promoted by the free CO2 emission rights allocation, and full financial compensation for the
indirect emissions where required.
6.2 Comments o f the z inc sector
The following further comments on the interim report have been made by the IZA12
.
Product choice In the opinion of the IZA, it would not make sense to have the hydro- and pyrometallurgical
treatment of the leaching residue combined with RLE in one group. We are of the opinion that
benchmarking cannot be done due to the low number of installations in the benchmarking
group.
Whether combined or separate, benchmarking within the RLE group is very difficult due to
the diversity of process variants. Even if the absolute numbers are low, the relative differences
are high.
Indirect emissions Because of the influence of the pass through of CO2 costs in electricity prices on the
production cost of zinc we feel it is important and appreciate that realistic energy efficiency
benchmarks will be developed related to the consumption of electricity and primary zinc
production. These will be used in the light of provisions being made in the amended Directive
for compensation of the pass through of these CO2 costs in electricity prices.
Real improvement possibilities as basis It also needs to be realized that for an RLE based production scheme our sector is entirely tied
in to the two physical laws of Faraday – completely linked to physical constants - and there is
no real room for further optimizing of the process and stay in an economical viable situation.
In the light of the carbon leakage discussions, this has to be taken into account for these type
of sectors, mostly primary production, when setting possible limitations to the amount of free
allocation provided to such sectors, for instance when an ‘’improvement factor’’ is applied in
a fallback position on free allocation: there is very little to no room for improvement in such
case.
12 Personal communication – IZA via e-mail, 4thSeptember 2009
18
7 References
BREF non-ferrous metals-draft (2008) Draft Reference Document on Best Available
Techniques for the Non-Ferrous Metals Industries, European Commission, Institute for
Prospective Technological studies, Seville, December 2008
ECI (2009a) Personal e-mail communications with Fraunhofer ISI, 3rd
of July, 24th of July
and 27th of July 2009
ECI (2009b) ECI comments to zero-order draft report, 3rd
of July 2009
ENIA (2009) Personal e-mail communication with Fraunhofer ISI, 29th of May 2009
EU (2000) Directive 2000/53/EC of the European Parliament and of the Council of 18
September 2000 on end-of life vehicles
EU (2008) Directive 2008/34/EC of the European Parliament and of the Council of 11 March
2008 amending Directive 2002/96/EC on waste electrical and electronic equipment
(WEEE), as regards the implementing powers conferred on the Commission
Giegrich, Liebich and Fehrenbach (2007) Ableitung von Kriterien zur Beurteilung einer
hochwertigen Verwertung gefährlicher Abfälle. Forschungsprojekt im Auftrag des
Umweltbundesamtes. FuE-Vorhaben Förderkennzeichen 202 35 310. ifeu-Institut für
Energie- und Umweltforschung. December 2007.
www.umweltdaten.de/publikationen/fpdf-l/3504.pdf
ILA (2009) Personal e-mail communication with Fraunhofer ISI, 6th of July 2009
IZA (2009a) Personal e-mail communication with Fraunhofer ISI, 3rd
of June 2009
IZA (2009b) IZA comments to zero-order draft report, 4th of September 2009
World Bureau of Metal Statistics (2008) Metal Statistics 1997 - 2007, 95th Edition, Ware,
England
19
Appendix A: PRODCOM codes of the non-
ferrous metals sector
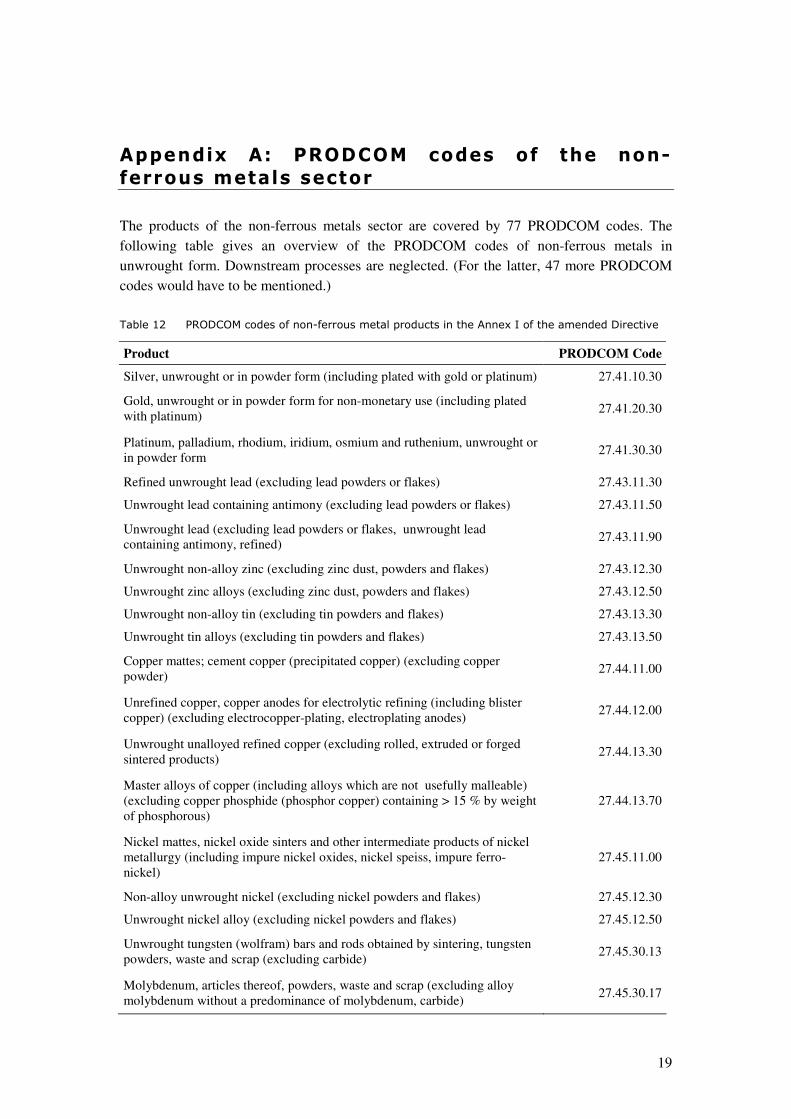
The products of the non-ferrous metals sector are covered by 77 PRODCOM codes. The
following table gives an overview of the PRODCOM codes of non-ferrous metals in
unwrought form. Downstream processes are neglected. (For the latter, 47 more PRODCOM
codes would have to be mentioned.)
Table 12 PRODCOM codes of non-ferrous metal products in the Annex I of the amended Directive
Product PRODCOM Code
Silver, unwrought or in powder form (including plated with gold or platinum) 27.41.10.30
Gold, unwrought or in powder form for non-monetary use (including plated
with platinum) 27.41.20.30
Platinum, palladium, rhodium, iridium, osmium and ruthenium, unwrought or
in powder form 27.41.30.30
Refined unwrought lead (excluding lead powders or flakes) 27.43.11.30
Unwrought lead containing antimony (excluding lead powders or flakes) 27.43.11.50
Unwrought lead (excluding lead powders or flakes, unwrought lead
containing antimony, refined) 27.43.11.90
Unwrought non-alloy zinc (excluding zinc dust, powders and flakes) 27.43.12.30
Unwrought zinc alloys (excluding zinc dust, powders and flakes) 27.43.12.50
Unwrought non-alloy tin (excluding tin powders and flakes) 27.43.13.30
Unwrought tin alloys (excluding tin powders and flakes) 27.43.13.50
Copper mattes; cement copper (precipitated copper) (excluding copper
powder) 27.44.11.00
Unrefined copper, copper anodes for electrolytic refining (including blister
copper) (excluding electrocopper-plating, electroplating anodes) 27.44.12.00
Unwrought unalloyed refined copper (excluding rolled, extruded or forged
sintered products) 27.44.13.30
Master alloys of copper (including alloys which are not usefully malleable)
(excluding copper phosphide (phosphor copper) containing > 15 % by weight
of phosphorous)
27.44.13.70
Nickel mattes, nickel oxide sinters and other intermediate products of nickel
metallurgy (including impure nickel oxides, nickel speiss, impure ferro-
nickel)
27.45.11.00
Non-alloy unwrought nickel (excluding nickel powders and flakes) 27.45.12.30
Unwrought nickel alloy (excluding nickel powders and flakes) 27.45.12.50
Unwrought tungsten (wolfram) bars and rods obtained by sintering, tungsten
powders, waste and scrap (excluding carbide) 27.45.30.13
Molybdenum, articles thereof, powders, waste and scrap (excluding alloy
molybdenum without a predominance of molybdenum, carbide) 27.45.30.17
20
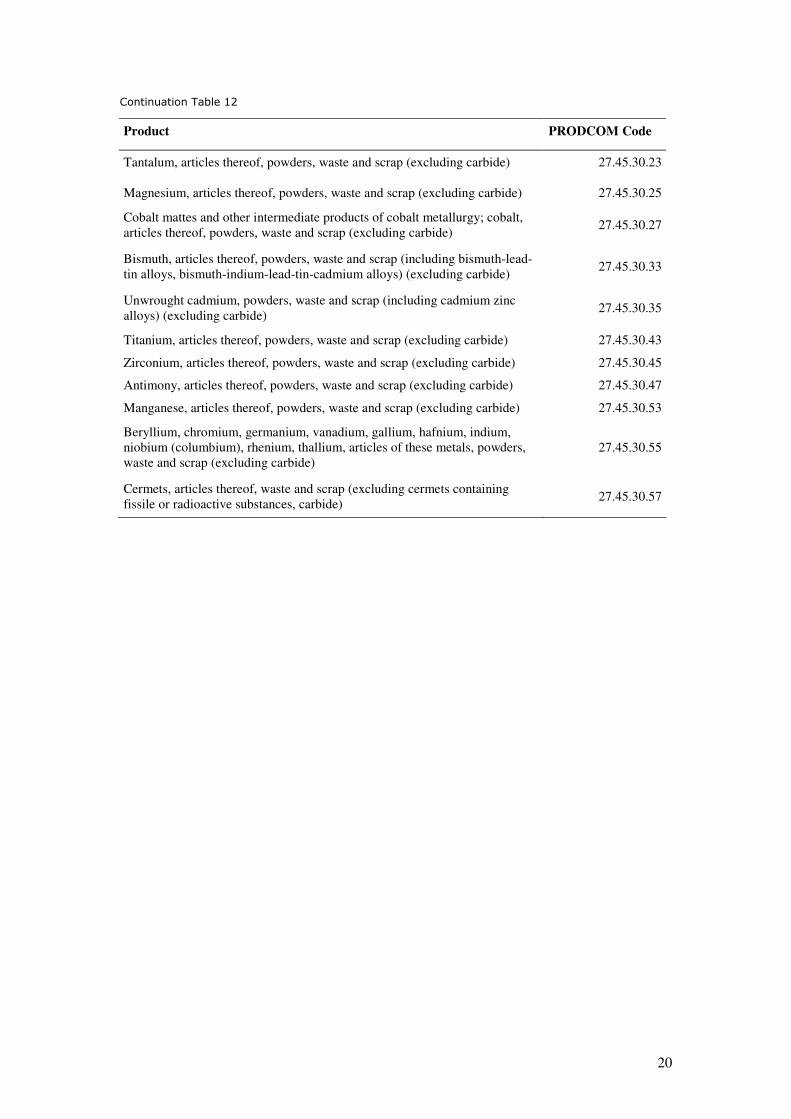
Continuation Table 12
Product PRODCOM Code
Tantalum, articles thereof, powders, waste and scrap (excluding carbide) 27.45.30.23
Magnesium, articles thereof, powders, waste and scrap (excluding carbide) 27.45.30.25
Cobalt mattes and other intermediate products of cobalt metallurgy; cobalt,
articles thereof, powders, waste and scrap (excluding carbide) 27.45.30.27
Bismuth, articles thereof, powders, waste and scrap (including bismuth-lead-
tin alloys, bismuth-indium-lead-tin-cadmium alloys) (excluding carbide) 27.45.30.33
Unwrought cadmium, powders, waste and scrap (including cadmium zinc
alloys) (excluding carbide) 27.45.30.35
Titanium, articles thereof, powders, waste and scrap (excluding carbide) 27.45.30.43
Zirconium, articles thereof, powders, waste and scrap (excluding carbide) 27.45.30.45
Antimony, articles thereof, powders, waste and scrap (excluding carbide) 27.45.30.47
Manganese, articles thereof, powders, waste and scrap (excluding carbide) 27.45.30.53
Beryllium, chromium, germanium, vanadium, gallium, hafnium, indium,
niobium (columbium), rhenium, thallium, articles of these metals, powders,
waste and scrap (excluding carbide)
27.45.30.55
Cermets, articles thereof, waste and scrap (excluding cermets containing
fissile or radioactive substances, carbide) 27.45.30.57