Embed Size (px)
Citation preview
S T A T E O F N E W Y O R K C I T Y ’ S H O U S I N G & N E I G H B O R H O O D S I N 2 0 1 3 1 7 1
ME
TH
OD
S
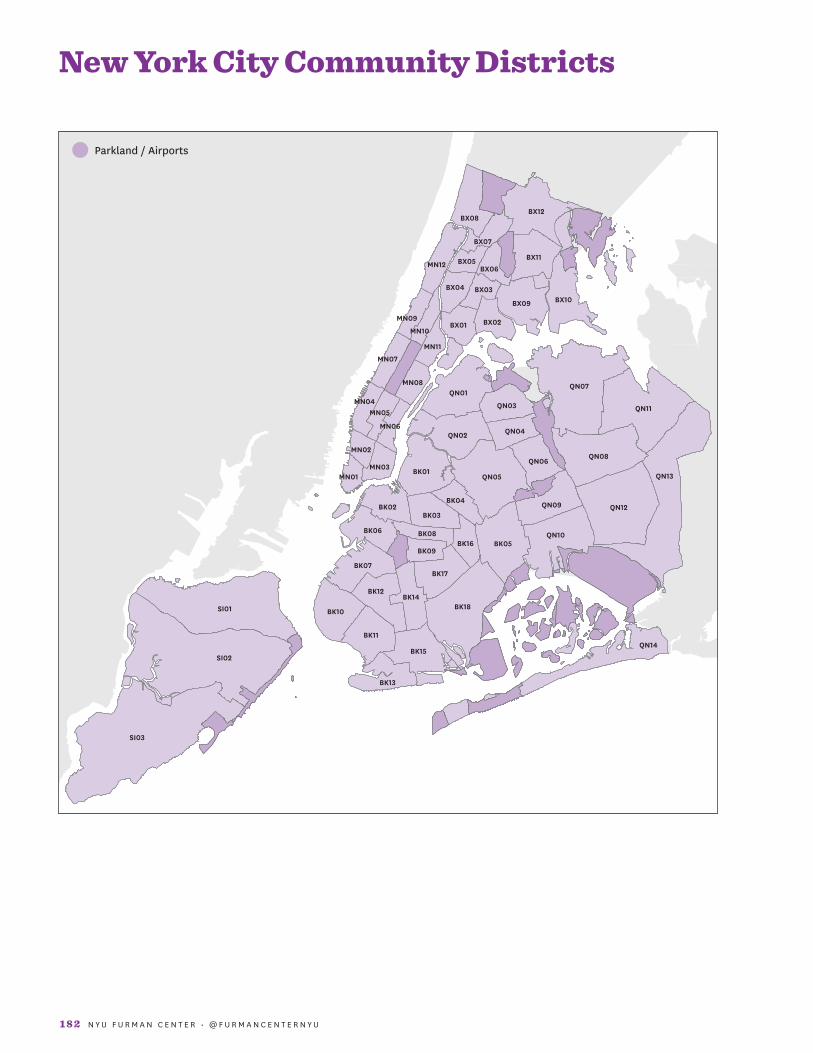
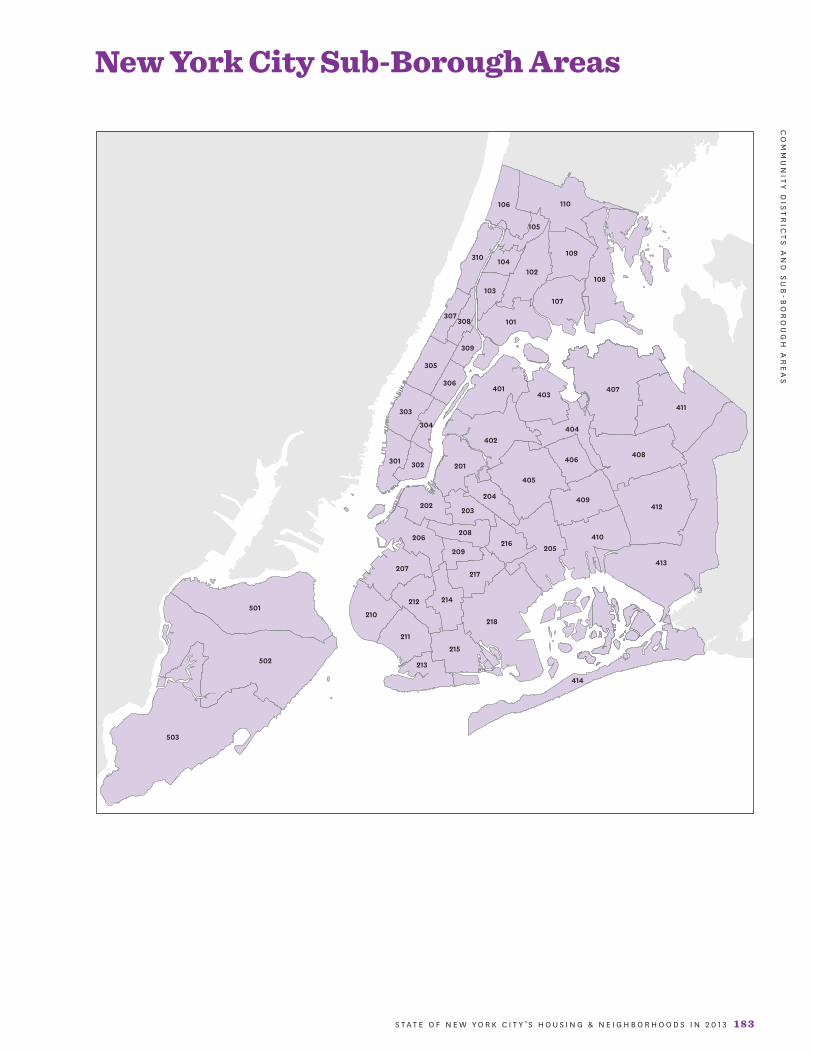
Geographic DefinitionsThis report presents information for the entire City of New
York, for each of the five boroughs, and for the neighborhoods
within each borough. The city defines neighborhoods by
dividing the boroughs into 59 community districts (CDs);
the U.S. Census Bureau, however, divides the boroughs into
55 sub-borough areas (SBAs). This report provides data for
community districts where available but otherwise employs
data at the sub-borough level. The term neighborhood is
used in this report to refer to both community districts and
sub-borough areas even though they are larger than what
many consider to be neighborhoods. We have included
reference maps for community districts and sub-borough
areas following this chapter.
BoroughNew York City consists of five boroughs: the Bronx, Brooklyn,
Manhattan, Queens, and Staten Island. Each borough is
represented by a borough president, an elected official who
advises the mayor on issues related to his or her borough and,
along with the borough board, makes recommendations
concerning land use and the allocation of public services.
Each borough is also a county. Counties are legal entities
with boundaries defined by state law.
Community District (CD)Community districts are political units unique to New York
City. Each of the 59 community districts has a commu-
nity board. Half of the community board’s members are
appointed by the borough president and half are nominated
by the City Council members who represent the district. The
community boards review applications for zoning changes
and other land use proposals and make recommendations
for budget priorities.
Each community board is assigned a number within its
borough. The borough and this number uniquely identify
each of the 59 community districts. Therefore, the NYU
Furman Center designates each community district with a
two-letter borough code and a two-digit community board
code. For example, BK 02 is the community district repre-
sented by Community Board 2 in Brooklyn.
Sub-Borough Area (SBA)Sub-borough areas are geographic units created by the U.S.
Census Bureau for the administration of the New York City
Housing and Vacancy Survey and were designed to have
similar boundaries to those of the community districts.
These same areas are also defined by the U.S. Census Bureau
as Public Use Microdata Areas (PUMAs) so we are able to
use the two terms interchangeably.
Because sub-borough areas are constructed from Cen-
sus tracts, their boundaries do not coincide precisely with
community district boundaries, which generally follow
major streets. However, they are similar enough that we
use them interchangeably throughout this report. There
are 59 community districts in New York City but only 55
sub-borough areas. The U.S. Census Bureau combined four
pairs of community districts in creating the sub-borough
areas to improve sampling and protect the confidentiality
of respondents. These pairs are Mott Haven/Melrose (BX
01) and Hunts Point/Longwood (BX 02) in the Bronx, Mor-
risania/Crotona (BX 03) and Belmont/East Tremont (BX 06)
in the Bronx, the Financial District (MN 01) and Greenwich
Village/Soho (MN 02) in Manhattan, and Clinton/Chelsea
(MN 04) and Midtown (MN 05) in Manhattan.
RankingsThis report includes rankings of the five boroughs and all
59 community districts or 55 sub-borough areas for each
indicator. The neighborhood ranked first has the highest
number or percentage for the measure, even if the mea-
sure is for a quality that one might think is “best” if lower.
When possible, we rank all 59 community districts, however,
because data for several indicators—including all indicators
drawn from U.S. Census Bureau sources—are only available
at the sub-borough area level, we can only rank the 55 sub-
borough areas with respect to these indicators. In addition,
a few indicators are not available for all neighborhoods so
we provide rankings for a subset of neighborhoods. For
instance, the NYU Furman Center only reports the index of
housing price appreciation at the community district level
for the predominant housing type in that district. Therefore,
the rankings for these indicators come from a substantially
reduced subset of the community districts.
Methods
1 7 2 N Y U F U R M A N C E N T E R • @ F U R M A N C E N T E R N Y U
Comparison CitiesThe text of the State of New York City’s Housing and Neigh-
borhoods frequently compares indicators across the five
U.S. cities with the largest populations according to the
American Community Survey’s 2012 estimates, including
New York City. In 2012 these cities included, in descending
size order, New York City, Los Angeles, Chicago, Houston,
and Philadelphia.
Visualization in Geographic Information SystemsMaps displaying New York City-specific administrative and
political boundaries use base map data provided by the
New York City Department of City Planning’s Bytes of the
Big Apple program. These boundaries include boroughs,
community districts, zoning boundaries, public streets,
and individual properties.
United States Census SourcesA number of the indicators presented in the State of New
York City’s Housing and Neighborhoods are derived from
five data sources collected by the U.S. Census Bureau. These
sources are described below along with a discussion of issues
of comparability across sources.
Decennial Census (Census)From 1970 to 2000, the decennial Census consisted of two
parts: the short form that collected information from every
person and about every housing unit in the country, and the
long form of additional questions asked of a sample of people
and households. The short form collected information on age,
race, Hispanic or Latino origin, household relationship, sex,
tenure, and vacancy status. The long form provided more
in-depth information about personal and housing charac-
teristics such as income, employment status, and housing
costs. In this edition of the State of New York City’s Housing
and Neighborhoods, we use data from the decennial Census
short and long forms to derive demographic, economic, and
housing measures for the year 2000. To create most of these
indicators, we use summary Census data reported at the
city, borough, and sub-borough area levels.
In 2010, the decennial Census only included the short
form since most of the data that have previously been
included in the long form have now been reported in the
American Community Survey. While much of the short
form data are also found in the American Community Sur-
vey, the numbers often differ because of statistical and
methodological reasons. Whenever possible, we report data
from the decennial Census with one exception: the rental
vacancy rate in 2010.
American Community Survey (ACS)The American Community Survey is an annual survey
that collects data similar to those formerly collected by the
Census long form, described above. As with the long form,
the ACS covers only a sample of individuals and housing
units. However, the ACS uses a smaller sample: the long
form covered one out of every six housing units while the
ACS only covers one in 40 housing units each year. The
U.S. Census Bureau began developing the ACS in 1996, but
reliable annual estimates for geographic areas with a popu-
lation of 65,000 or more only became available in 2005. In
December 2008, the U.S. Census Bureau began releasing
three-year rolling estimates for all geographic areas with
populations of 20,000 or more. In December 2010, the U.S.
Census Bureau began releasing five-year rolling estimates
for geographic areas as small as block groups.
Most of the indicators in this edition are derived from
summary level data reported by the U.S. Census Bureau for
PUMAs, which, as discussed above, are identical to New
York City’s sub-borough areas. Summary-level data are
also reported at the borough and city levels. Because each
PUMA in New York City has at least 100,000 residents, reli-
able annual estimates are available for each PUMA from the
ACS. In this edition of the State of New York City’s Housing
and Neighborhoods we use annual estimates for almost all
of the data we get from the ACS. One exception is the rental
vacancy rate, for which we use the three-year estimate at the
PUMA level (see the section below for more details). Because
ACS one-year estimates can be prone to sizable margins of
error and volatility at the PUMA level, we report only the
first and last years of data available for each ACS-derived
indicator shown on the community district data tables.
New York City Housing and Vacancy Survey (HVS)The New York City Housing and Vacancy Survey is conducted
every three years by the U.S. Census Bureau under contract
S T A T E O F N E W Y O R K C I T Y ’ S H O U S I N G & N E I G H B O R H O O D S I N 2 0 1 3 1 7 3
ME
TH
OD
S
with the City of New York. The New York City Department
of Housing Preservation and Development sponsors and
supervises the HVS. The primary purpose of the HVS is
to satisfy the city’s statutory requirement to measure the
rental vacancy rate in order to determine if rent regulation
will continue. In addition to the housing unit information,
a limited set of data are also collected about the household
and the individual answering the questionnaire.
In this edition of the State of New York City’s Housing and
Neighborhoods, we use HVS data to construct one indicator
that is specific to New York City and therefore not captured
in the ACS: the number of units that are rent-stabilized or
rent-controlled.
Public Use Microdata Sample (PUMS)While most indicators that draw on U.S. Census Bureau data
use measures that are already reported at a given geography,
the NYU Furman Center calculates some indicators by aggre-
gating person- and household-level data to the required geog-
raphy. The U.S. Census Bureau makes household-level data
available in Public Use Microdata Samples (PUMS), which
are censored extracts from the confidential microdata that
the U.S. Census Bureau uses in its own calculations from the
decennial Census, the ACS, and the HVS. The NYU Furman
Center uses PUMS data to calculate the income diversity ratio,
median monthly rent for recent movers, median rent burden
(low-income renters), rent-stabilized or rent-controlled units,
several indicators in the State of New Yorkers section, and
most indicators by income level in Part 1 of the report (see
Household Income Distribution section below).
The PUMS data identify only the state and the PUMA in
which a household is located, and does not identify the city
or Census “place.” New York City’s and Philadelphia’s PUMAs
are completely coterminous with their place boundaries,
so households can be placed in those cities by PUMA. The
place boundaries of Chicago, Los Angeles, and, in particular,
Houston, however, are not coterminous with PUMAs, which
means that the data do not allow users to identify if house-
holds in several PUMAs in those metropolitan areas are in
the City or bordering suburb. To address this issue, the NYU
Furman Center weights observations by the share of the
PUMA’s households contained within the place boundary as
calculated by the Missouri Census Data Center. (Specifically, if
60 percent of a PUMA’s households live in the City of Chicago
and 40 percent live in Cook County, outside of Chicago city
limits, we assign each household in that PUMA a 60 percent
weight.) For estimates prior to 2010, we use PUMA-to-place
allocations as of the 2000 decennial Census, and for estimates
afterward, we use allocations as of the 2010 decennial Census.
Comparisons Between Census Bureau ProductsThe U.S. Census Bureau makes continual adjustments to
the decennial Census and the ACS to improve the coverage
of the surveys and accuracy of the results. These adjust-
ments often make cross-year comparisons difficult. Below
is a discussion of the key areas where changes in sampling,
question construction, or other methodology might affect
the comparability of indicators that we report in the State
of New York City’s Housing and Neighborhoods over time.
More information about comparability between U.S. Cen-
sus Bureau data sources is available at: http://www.census.
gov/acs/www/guidance_for_data_users/comparing_data/.
SamplingBecause both the ACS and HVS are sample surveys, not
Censuses, all data derived from them are estimates, not
exact counts. The ACS sample includes approximately three
million housing units nationwide, including about 66,000
in New York City; the HVS samples 18,000 housing units.
The sample for the HVS is designed primarily to achieve
acceptable reliability in estimating the rental vacancy rate
for the entire city, so estimates for smaller geographic units
such as sub-borough areas are subject to potentially large
sampling errors. Readers should treat all estimates with
some skepticism and be aware that the true value may dif-
fer from the reported estimate. This is especially important
when comparing small year-to-year changes in the ACS or
with estimates that are derived from a reduced sample. For
example, the median monthly rent does not use the entire
sample but just the subset of respondents who are rent-
ers. The median monthly rent indicator for recent movers
reduces the sample even more.
IncomeQuestion construction and data collection for income infor-
mation differs between the decennial Census and the ACS.
The 1990 Census asked for the respondent’s 1989 income,
1 74 N Y U F U R M A N C E N T E R • @ F U R M A N C E N T E R N Y U
and similarly, the 2000 Census asked for the respondent’s
1999 income; thus incomes reported in 1990 and 2000 are
all for one fixed period of time (calendar years 1989 and 1999
respectively). The ACS, by contrast, asks for the respondent’s
income over the “past 12 months” and as this information
is collected on an on-going monthly basis, these figures
are not directly comparable. The U.S. Census Bureau notes
that a comparison study of the 2000 Census and the 2000
ACS found that incomes reported in the Census were about
four percent higher than the incomes reported in the ACS.
Because of the data collection methods mentioned above,
adjacent years of ACS data may have reference months in
common; thus comparisons of income data between adja-
cent ACS years (for example, 2010 and 2011) should not be
interpreted as precise comparisons of economic conditions
in those years. Indicators affected by the income method-
ology issues are income diversity ratio, median household
income, poverty rate, and poverty rate by age. Note that for
comparison purposes, we adjust all dollar amounts reported
in this report to 2013 dollars (see below for more details).
Rental Vacancy RateTo improve the accuracy of the rental vacancy rate, on the
community district pages we report a three-year average
rental vacancy rate for 2010–2012. We still report annual
rental vacancy rates on the borough and city pages, but the
reported value for community districts cannot be directly
compared to any one year of borough or city data.
Industry and OccupationWe use industry and occupation of employment data in
Parts 1 and 2 to examine shifts over time in the industries
and required skill levels of jobs. These comparisons are
difficult to undertake in original U.S. Census Bureau PUMS
files due to changes in codes used to categorize industry and
occupation. To ease these comparisons, we use Integrated
Public Use Microdata Series PUMS files with consistent,
harmonized industrial and occupational categories.
Indicator NotesHousehold Income DistributionIn Part 1: Focus on Income Inequality and Integration, we
report distributions of household income. These analyses
use income and other characteristics from household- and
person-level U.S. Census Bureau PUMS files (explained in
more detail above). For 1990, we use decennial Census PUMS
from the Integrated Public Use Microdata Series, and for
2012, we use American Community Survey PUMS. In order
to facilitate comparison across space and time, we adjust
all dollar amounts for inflation to constant 2013 dollars (see
Inflation Adjustments section below) and stratify incomes
into consistent categories. To reduce volatility in the lowest
income category, we exclude all households without posi-
tive income from our analyses. For additional information
about the treatment of income data in U.S. Census Bureau
sources, please see the Income section above.
Neighborhood Characteristics by Household IncomeAlso in Part 1: Focus on Income Inequality, we report sev-
eral indicators of neighborhood conditions (crime, public
school student achievement, and park access) by household
income. We construct these indicators through a multistep
process. First we transform neighborhood condition data
from their original unit of observation (e.g. police precincts
or school districts) to the sub-borough area level (the finest
geographic level of PUMS data), so that they can be assigned
to each household. We then find the average neighborhood
characteristics by household income category weighted
by the number of households in that category. As a result,
these indicators should be interpreted as average neigh-
borhood conditions by income, not household outcomes
by income. For example, the first bar of Figure 1.17 should
not be interpreted as the share of public school students
in households earning $20,000 who performed at or above
grade level in math in 2000. The correct interpretation is
that households earning $20,000 or less in 2000 lived in
school districts where the average percentage of students
performing at grade level in math was 34 percent.
Isolation Index of Household IncomeThe isolation index is an indicator of the concentration of
some group over a larger area. Specifically, it measures—for
an average member of a given group—the proportion of
residents of her neighborhood that belongs to her same
group. One typical application of the isolation index is to
S T A T E O F N E W Y O R K C I T Y ’ S H O U S I N G & N E I G H B O R H O O D S I N 2 0 1 3 1 7 5
ME
TH
OD
S
measure racial segregation, but this year’s State of New York
City’s Housing and Neighborhoods applies it to measure the
segregation of low- and high-income households.
Using the bottom 10 percent of the household income dis-
tribution (its first or lowest decile) as an example, an isolation
index of 0.25 means that the average household in the lowest
income decile lives in a neighborhood where 25 percent of
households are also in the lowest income decile. The values
of the isolation index range from zero, indicating extreme
dispersion of a group, to one, indicating extreme isolation
of that group. The isolation index is sensitive to a group’s
overall share of a population, so if that share increases over
time, so does the isolation index.
The isolation index is calculated using the following
formula:
∑ni=1 (
xiX )(xi
ti)
where xi is the group population within a tract, X is the
citywide population of the group of interest, and ti is the
total tract population.
We calculate isolation indices for the top and bottom 10
percent of the household income distribution using tract-
level summary files for the 1990 Census and the 2008-2012
American Community Survey. Because these summary files
report counts of households by dollar amount ranges and
not percentile ranges, we construct approximate deciles
based on the share of households each dollar amount range
comprises. Table M.1 compares the actual shares each decile
comprises in 1990 and 2008-2012 and shows that they have
been relatively stable over time. Notably, our definition of
the bottom decile shrank as a share of all households over
this period. This has important implications for the isola-
tion index, because if no households would have moved
over those two decades, the isolation index should have
fallen. We found that the isolation index for New York City
actually increased from 0.148 in 1990 to 0.163 in 2008-2012,
suggesting that our estimate of the citywide increase might
be somewhat understated.
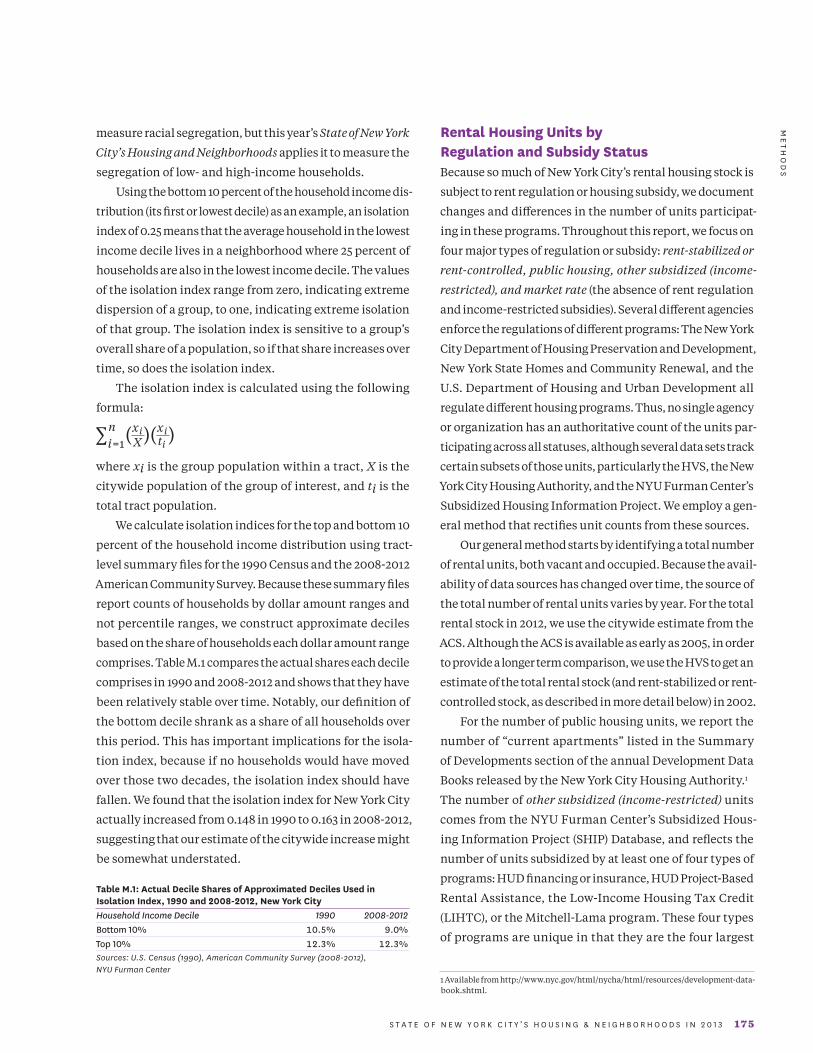
Table M.1: Actual Decile Shares of Approximated Deciles Used in Isolation Index, 1990 and 2008-2012, New York CityHousehold Income Decile 1990 2008-2012Bottom 10% 10.5% 9.0%Top 10% 12.3% 12.3%Sources: U.S. Census (1990), American Community Survey (2008-2012), NYU Furman Center
Rental Housing Units by Regulation and Subsidy StatusBecause so much of New York City’s rental housing stock is
subject to rent regulation or housing subsidy, we document
changes and differences in the number of units participat-
ing in these programs. Throughout this report, we focus on
four major types of regulation or subsidy: rent-stabilized or
rent-controlled, public housing, other subsidized (income-
restricted), and market rate (the absence of rent regulation
and income-restricted subsidies). Several different agencies
enforce the regulations of different programs: The New York
City Department of Housing Preservation and Development,
New York State Homes and Community Renewal, and the
U.S. Department of Housing and Urban Development all
regulate different housing programs. Thus, no single agency
or organization has an authoritative count of the units par-
ticipating across all statuses, although several data sets track
certain subsets of those units, particularly the HVS, the New
York City Housing Authority, and the NYU Furman Center’s
Subsidized Housing Information Project. We employ a gen-
eral method that rectifies unit counts from these sources.
Our general method starts by identifying a total number
of rental units, both vacant and occupied. Because the avail-
ability of data sources has changed over time, the source of
the total number of rental units varies by year. For the total
rental stock in 2012, we use the citywide estimate from the
ACS. Although the ACS is available as early as 2005, in order
to provide a longer term comparison, we use the HVS to get an
estimate of the total rental stock (and rent-stabilized or rent-
controlled stock, as described in more detail below) in 2002.
For the number of public housing units, we report the
number of “current apartments” listed in the Summary
of Developments section of the annual Development Data
Books released by the New York City Housing Authority.1
The number of other subsidized (income-restricted) units
comes from the NYU Furman Center’s Subsidized Hous-
ing Information Project (SHIP) Database, and reflects the
number of units subsidized by at least one of four types of
programs: HUD financing or insurance, HUD Project-Based
Rental Assistance, the Low-Income Housing Tax Credit
(LIHTC), or the Mitchell-Lama program. These four types
of programs are unique in that they are the four largest
1 Available from http://www.nyc.gov/html/nycha/html/resources/development-data-book.shtml.
1 7 6 N Y U F U R M A N C E N T E R • @ F U R M A N C E N T E R N Y U
subsidy programs used in New York City and all require
means testing of residents. For 2012, we filter for the num-
ber of units that are “currently affordable,” although the
most recent data in the SHIP refers to 2011 conditions. For
2002, we filter out properties whose affordability started
after 2002 or that were no longer subject to affordability
restrictions before 2002. We generally treat our estimate of
the number of other subsidized units as a low-bound esti-
mate. For a property to be cataloged in the SHIP database,
it must have at least one of the four subsidies listed above.
The city and state administer some other programs that are
not explicitly captured in the SHIP Database because they
do not require means testing (e.g. LAMP, 8A, PLP). Those
units are generally subject to rent-stabilization and so are
classified as rent-regulated as described below.
Our estimate of rent-stabilized or rent-controlled units is
an adjustment of totals reported in the HVS. First, we sum
the number of rent-stabilized and rent-controlled units as
indicated in the New Control Status Recode field. This field
prioritizes rent stabilization over HUD subsidized status in
cases when units are both stabilized and HUD subsidized.
A deficiency of the HVS is that it does not track units sub-
sidized with LIHTC. Instead those units are classified by
the other subsidies they receive or the other regulations to
which they are subject. Some LIHTC units technically are
governed by rent stabilization because they also receive a
city property tax incentive (we estimate 41,004 units were
subject to both programs in 2011), though the LIHTC rent
regulations are stricter than the rent stabilization regula-
tion. Thus, we assume that these LIHTC units are classified
as rent-stabilized in the HVS.
To avoid double-counting these units in our totals, we
perform the following adjustment. In the SHIP we are able to
identify units developed with a combination of LIHTC and
either the 421-a or J-51 property tax incentive programs, which
impose rent stabilization in addition to LIHTC’s rent restric-
tions. We subtract the number of currently affordable LIHTC
units with either 421-a or J-51 from the HVS rent-stabilized
and rent-controlled unit total to arrive at a revised estimate
of rent-stabilized or rent-controlled units. Our adjusted
count of rent-stabilized or rent-controlled units might still
include other LIHTC units with rent stabilization that we
cannot identify. The rent-stabilized or rent-controlled count
in 2012 might be further inflated by the fact that the HVS
data represent 2011 conditions, and it is likely the number
of rent-stabilized and rent-controlled units has experienced
a slight net decline consistent with prior trends.
Finally, to estimate of the number of market rate units,
we subtract public housing, other subsidized (income-
restricted) units, and our revised estimate of rent-stabilized
or rent-controlled units from the total number of rental hous-
ing units. Because our revised estimate of rent-stabilized
or rent-controlled units might still include units should be
classified as other subsidized, our estimate of market rate
units might understate the true number of market rate units.
The general method above applies to totals presented at
the city and borough levels. When we perform this analysis
at the neighborhood level, we aggregate to the sub-borough
area (SBA, the smallest geographic area available in the HVS),
and we provide data only for 2011, due to the small sample
size of the HVS. We also employ a few small additional
changes to the method, which are explained below. Alto-
gether, these changes would lead to minor differences in the
total number of units by rent-regulation and subsidy status
that we count citywide. Table M.2 compares these totals
to the citywide totals reported in Part 2, Section 3: Renters
and Their Homes using the general method reported above.
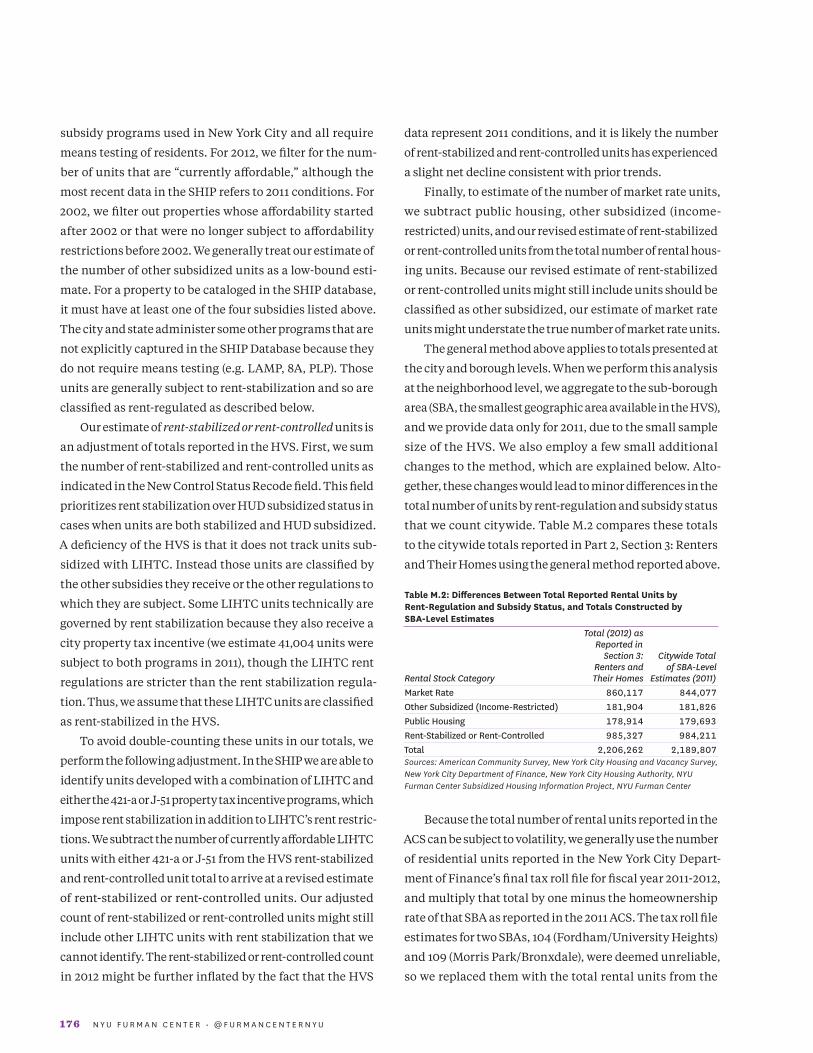
Table M.2: Differences Between Total Reported Rental Units by Rent-Regulation and Subsidy Status, and Totals Constructed by SBA-Level Estimates Total (2012) as Reported in Section 3: Citywide Total Renters and of SBA-Level Rental Stock Category Their Homes Estimates (2011)Market Rate 860,117 844,077Other Subsidized (Income-Restricted) 181,904 181,826Public Housing 178,914 179,693Rent-Stabilized or Rent-Controlled 985,327 984,211Total 2,206,262 2,189,807Sources: American Community Survey, New York City Housing and Vacancy Survey, New York City Department of Finance, New York City Housing Authority, NYU Furman Center Subsidized Housing Information Project, NYU Furman Center
Because the total number of rental units reported in the
ACS can be subject to volatility, we generally use the number
of residential units reported in the New York City Depart-
ment of Finance’s final tax roll file for fiscal year 2011-2012,
and multiply that total by one minus the homeownership
rate of that SBA as reported in the 2011 ACS. The tax roll file
estimates for two SBAs, 104 (Fordham/University Heights)
and 109 (Morris Park/Bronxdale), were deemed unreliable,
so we replaced them with the total rental units from the
S T A T E O F N E W Y O R K C I T Y ’ S H O U S I N G & N E I G H B O R H O O D S I N 2 0 1 3 1 7 7
ME
TH
OD
S
ACS. Results for SBA 105 (Kingsbridge Heights/Bedford)
led to a negative number of market rate units, so we instead
used the total number of rental units from the HVS. Public
housing counts come from a GIS shapefile of developments,
which includes slightly more units than NYCHA’s Develop-
ment Data Book for 2011. Several properties cataloged in the
SHIP do not have spatial coordinates and we cannot assign
them to an SBA, so our other subsidized (income-restricted)
counts are slightly lower at the SBA level.
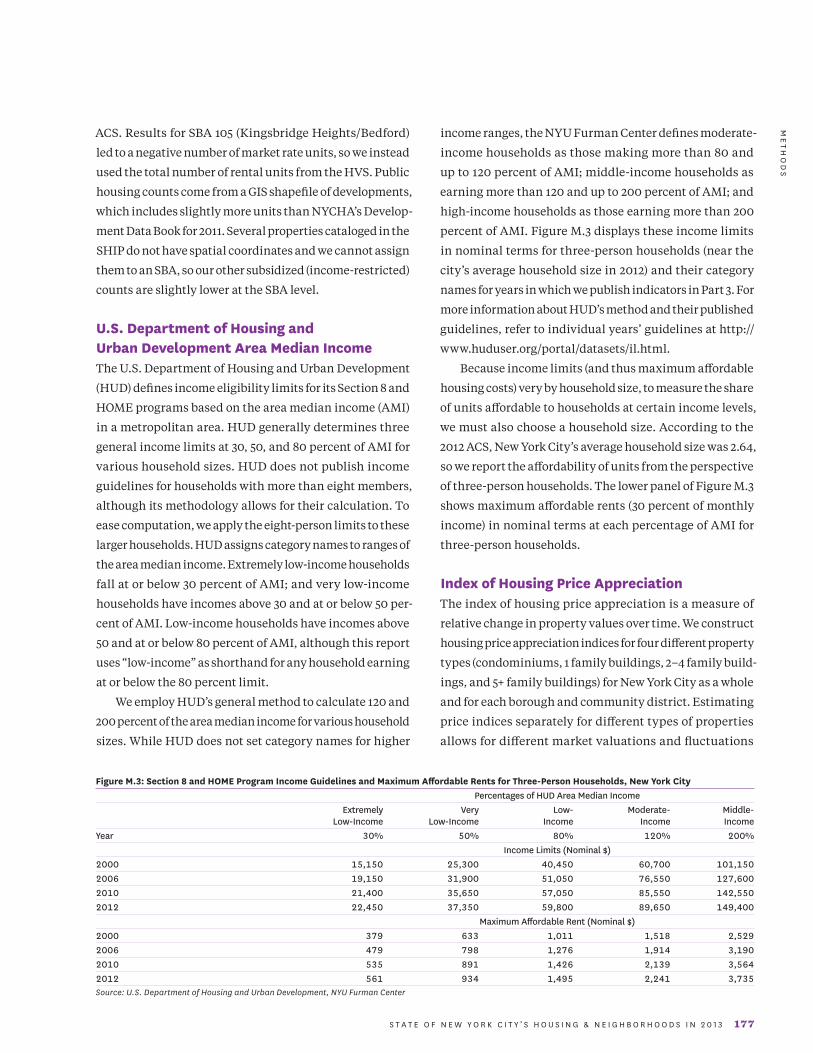
U.S. Department of Housing and Urban Development Area Median IncomeThe U.S. Department of Housing and Urban Development
(HUD) defines income eligibility limits for its Section 8 and
HOME programs based on the area median income (AMI)
in a metropolitan area. HUD generally determines three
general income limits at 30, 50, and 80 percent of AMI for
various household sizes. HUD does not publish income
guidelines for households with more than eight members,
although its methodology allows for their calculation. To
ease computation, we apply the eight-person limits to these
larger households. HUD assigns category names to ranges of
the area median income. Extremely low-income households
fall at or below 30 percent of AMI; and very low-income
households have incomes above 30 and at or below 50 per-
cent of AMI. Low-income households have incomes above
50 and at or below 80 percent of AMI, although this report
uses “low-income” as shorthand for any household earning
at or below the 80 percent limit.
We employ HUD’s general method to calculate 120 and
200 percent of the area median income for various household
sizes. While HUD does not set category names for higher
income ranges, the NYU Furman Center defines moderate-
income households as those making more than 80 and
up to 120 percent of AMI; middle-income households as
earning more than 120 and up to 200 percent of AMI; and
high-income households as those earning more than 200
percent of AMI. Figure M.3 displays these income limits
in nominal terms for three-person households (near the
city’s average household size in 2012) and their category
names for years in which we publish indicators in Part 3. For
more information about HUD’s method and their published
guidelines, refer to individual years’ guidelines at http://
www.huduser.org/portal/datasets/il.html.
Because income limits (and thus maximum affordable
housing costs) very by household size, to measure the share
of units affordable to households at certain income levels,
we must also choose a household size. According to the
2012 ACS, New York City’s average household size was 2.64,
so we report the affordability of units from the perspective
of three-person households. The lower panel of Figure M.3
shows maximum affordable rents (30 percent of monthly
income) in nominal terms at each percentage of AMI for
three-person households.
Index of Housing Price AppreciationThe index of housing price appreciation is a measure of
relative change in property values over time. We construct
housing price appreciation indices for four different property
types (condominiums, 1 family buildings, 2–4 family build-
ings, and 5+ family buildings) for New York City as a whole
and for each borough and community district. Estimating
price indices separately for different types of properties
allows for different market valuations and fluctuations
Figure M.3: Section 8 and HOME Program Income Guidelines and Maximum Affordable Rents for Three-Person Households, New York City Percentages of HUD Area Median Income Extremely Very Low- Moderate- Middle- Low-Income Low-Income Income Income IncomeYear 30% 50% 80% 120% 200% Income Limits (Nominal $)2000 15,150 25,300 40,450 60,700 101,1502006 19,150 31,900 51,050 76,550 127,6002010 21,400 35,650 57,050 85,550 142,5502012 22,450 37,350 59,800 89,650 149,400 Maximum Affordable Rent (Nominal $)2000 379 633 1,011 1,518 2,5292006 479 798 1,276 1,914 3,1902010 535 891 1,426 2,139 3,5642012 561 934 1,495 2,241 3,735Source: U.S. Department of Housing and Urban Development, NYU Furman Center
1 7 8 N Y U F U R M A N C E N T E R • @ F U R M A N C E N T E R N Y U
within each property type. Due to insufficient data, we report
the price indices only for the predominant property type at
the community district level and at the two predominant
property types for each borough.
The data used to construct the price index come from two
sources, both obtained from the New York City Department
of Finance. The first dataset is an annual sales file, which we
receive under an exclusive arrangement. The second dataset
is the Automated City Register Information System (ACRIS)
sales data, which is available online from the Department
of Finance. Both datasets contain information on address,
price, and date of sale for all transactions involving sales
of apartment buildings, condominium apartments and
single- and multi-family homes in New York City between
1974 and 2013. While the ACRIS data are updated daily, the
system contains less information on the circumstances of
the sale than the annual sales file. The ACRIS data are used
only if the sale is not recorded by the time we receive our
annual sales file.
The repeat sales price indices are created using statistical
regression techniques. Economists use two basic approaches
to estimate housing price indices: the hedonic regression and
the repeat sales method. Both of these approaches estimate
temporal price movement controlling for the variation in
the types of homes sold from period to period. Each method
has its own strengths and weaknesses.
The repeat sales methodology controls for housing
characteristics by using data on properties that have sold
more than once. An attractive feature of this method is
that, unlike the hedonic approach, it does not require the
measurement of house quality; it only requires the quality
of individual houses in the sample to be time invariant. The
most important drawback of the repeat sales method is that
it fails to use the full information available in the data. In
most datasets, only a small proportion of the housing stock
is sold more than once; the data on single sales cannot be
used. Moreover, properties that transact more than once
may not be representative of all properties in the market,
raising concerns about sample selection bias. However, as
the index period lengthens, more properties have changed
hands more than once. This reduces sample selection bias
but exacerbates a heteroskedasticity problem: Case and
Shiller (1989) show evidence that price variability is positively
related to the interval of time between sales because the
longer the amount of time between sales, the more likely
it is that the surrounding neighborhood has experienced
an exogenous shock.
This report overcomes most of the problems associated
with the repeat sales method. Specifically, the dataset used
here is quite large, so we lose little precision by eliminating
properties that sold only once. Moreover, because we have
sales data over such a long period (39 years), by 2012, more
than 61 percent of residential lots changed hands at least
twice. Finally, we use the three-step procedure suggested
by Case and Shiller (1989) and modified by Quigley and Van
Order (1995) to account for the possibility of time dependent
error variances.
In the first stage, the difference between the log price of
the second sale and the log price of the first sale is regressed
on a set of dummy variables, one for each time period in the
sample (a year, in this case) except for the base year (2000).
The dummy variables have values of +1 for the year of the
second sale, -1 for the year of the first sale, and zeros otherwise.
In the second stage, the squared residuals from the first
stage are regressed on a constant term, the time interval
between sales, and the time interval squared. The fitted
value in the stage-two regression is a consistent estimate of
the error variance in the stage-one regression. In the third
stage, the stage-one regression is re-estimated by general-
ized least squares, using the inverses of the square root of
the fitted values from the stage-two regression as weights.
Mortgage Lending IndicatorsThe Federal Home Mortgage Disclosure Act (HMDA) requires
financial institutions with assets totaling $39 million or more
to report information on loan applications and originations
if they have originated or refinanced any home purchase
loans on 1–4 family properties (including condominium
and co-op units) in the previous year. Thus, the HMDA data
capture most, but not all, 1–4 family residential mortgage
lending activity. The NYU Furman Center uses this dataset
to calculate the home purchase loan rate, the refinance loan
rate and a number of derivative indicators.
All figures in our analysis are based on 1–4 family, non-
business-related loans. We exclude from our analysis any
loans for manufactured or multi-family housing (5+ families)
and any loans deemed to be business related (classified
as those loans for which a lender reports an applicant’s
S T A T E O F N E W Y O R K C I T Y ’ S H O U S I N G & N E I G H B O R H O O D S I N 2 0 1 3 1 7 9
ME
TH
OD
S
ethnicity, race and sex as “not applicable”). The loans that
we consider constituted more than 80 percent of all loan
applications in New York City in 2010.
Beginning in 2004, HMDA requires lenders to report
when the spread between the annual percentage rate (APR)
of a loan and the rate of Treasury securities of comparable
maturity is greater than three percentage points for first-
lien loans and five percentage points for junior-lien loans.
In this report, all loans with an APR above this threshold
are referred to as higher-cost loans.
Loan applicants were assigned to a racial/ethnic group
for purposes of our research based on the first reported race
of the primary applicant. However, if the applicant reported
his or her ethnicity as “Hispanic” the applicant was classi-
fied as Hispanic, regardless of the applicant’s reported race.
When an applicant provided information to the lender via
mail, internet or telephone and did not provide information
on their race, we assigned those loans to the “not reported”
racial category. These loans were included in our city and
borough level analyses, but were omitted when calculating
racial shares for our State of New Yorkers table in the New
York City section.
Notices of ForeclosureThe NYU Furman Center collects data on lis pendens (LP)
filings from a private vendor, Public Data Corporation. An
LP may be filed for a host of reasons unrelated to a mortgage
foreclosure so we use a variety of screening techniques to
identify only those LPs related to a mortgage. These tech-
niques include searching for words within either of the
party names and dropping any LPs that relate to a tax lien,
a mechanic’s lien, or are originated by a government agency.
If the same property receives any additional LPs within 90
days of the initial LP, the additional LPs are not included
in our rate to avoid counting the same foreclosure twice.
Properties That Entered REOThe data for this indicator come from two sources—LPs
from Public Data Corporation and residential sales data
from the New York City Department of Finance. Each of
these datasets identifies properties using a unique borough,
block and lot number (BBL). Starting with the set of all LPs,
we use BBLs to match each LP issued since 1993 with the
most recent sale of that property prior to the LP (if the sale
happened in 1974 or later). We then match the LP to any
sales that occurred within three years from the date of the
LP, and assume that the first such sale was undertaken in
response to the foreclosure filing. To identify transfers into
REO, we search the grantee name field of the first sale after
the LP for the word “bank” or the name of any large bank
or subsidiary. Finally, we check if the name of the grantee
matches the name of the LP servicer. If this is the case we
classify the sale as a transfer into REO.
Population Weighting FormulaSeveral indicators included in this report are provided at
geographic levels other than the community district level
such as police precincts, school districts, or zip codes. We
aggregate data to the community district level, weighing
observations by the distribution of housing units.
For instance, when aggregating the student proficiency
rates from the 32 school districts to the 59 community dis-
tricts, we first calculate the rate for each of the 32 school
districts. If a community district only contains one school
district then that rate is directly used for the community
district. If multiple community districts fall within the
same school district, we assign the same proficiency rate
to each. If a community district contains more than one
school district, we weight each school district based on the
number of housing units within the community district
that are in that school district.
For example, if community district 1 contains three
school districts A, B, and C, and of the 100 housing units
in community district 1, 50 are in school district A, 30 are
in school district B, and 20 are in school district C, then
school district A would have weight 50/100, school district B
would have weight 30/100, and school district C would have
weight 20/100. The rate for community district 1 would be
given by: rateCD1 = rateA * .5 + rateB * .3 + rateC * .2
Calculating Distances to AmenitiesThis report reports the percentage of housing units within
one-quarter mile of parks. To determine walking distances,
the NYU Furman Center uses the New York City Department
of City Planning’s LION geodatabase of public streets to
create network buffers of pedestrian rights-of-way within
a specificed distance of an amenity. Using geographic
information systems (GIS) software, we then selected the
1 8 0 N Y U F U R M A N C E N T E R • @ F U R M A N C E N T E R N Y U
parcel polygons from the New York City Department of City
Planning’s MapPLUTO data that intersected this network
buffer. Finally, we summed the total number of residen-
tial units associated with the parcels within the specified
distance of the amenity, and divided by the total number
of residential units.
To calculate distance from parks, we first constructed
a data set of all parks, playgrounds, and Greenstreets that
are administered by the New York City Department of Parks
and Recreation through data posted on the City of New
York’s Open Data portal in 2010. Because this data set does
not contain information on park entrances, we calculated
walking distances from points along each park’s perimeter.
For parks with an area of 2.5 acres or less, we decomposed
park polygons into their component points that typically
rest at their corners. For parks larger than 2.5 acres, this
process often resulted in perimeter points that were too far
apart to generate realistic service areas. Instead, we used
the intersections of pedestrian rights-of-way within 150
feet of these larger parks to approximate their perimeters.
Consistent with indicators used in the City of New York’s
PlaNYC report, we did not include parks with areas of less
than 0.25 acres in this analysis.
Inflation AdjustmentsUnless stated otherwise, when reporting dollar-denomi-
nated indicators, we adjust amounts to 2013 dollars using
the Consumer Price Index for All Urban Consumers (Current
Series) without seasonal adjustments from the Bureau of
Labor Statistics over all major expenditure classes for the
relevant metropolitan area. This allows for more consistent
comparisons across years for individual indicators. The
inflation-adjusted values include median monthly rent,
median household income, and median price per unit.
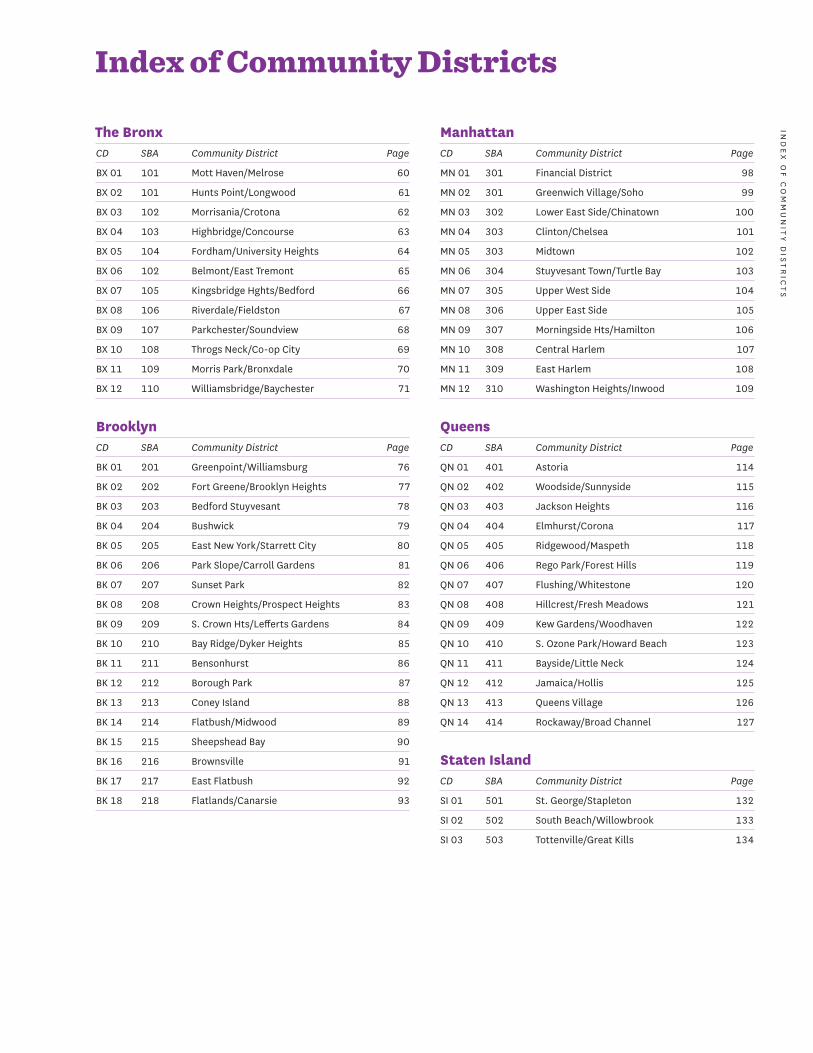
The Bronx CD SBA Community District Page
BX 01 101 Mott Haven/Melrose 60
BX 02 101 Hunts Point/Longwood 61
BX 03 102 Morrisania/Crotona 62
BX 04 103 Highbridge/Concourse 63
BX 05 104 Fordham/University Heights 64
BX 06 102 Belmont/East Tremont 65
BX 07 105 Kingsbridge Hghts/Bedford 66
BX 08 106 Riverdale/Fieldston 67
BX 09 107 Parkchester/Soundview 68
BX 10 108 Throgs Neck/Co-op City 69
BX 11 109 Morris Park/Bronxdale 70
BX 12 110 Williamsbridge/Baychester 71
Brooklyn CD SBA Community District Page
BK 01 201 Greenpoint/Williamsburg 76
BK 02 202 Fort Greene/Brooklyn Heights 77
BK 03 203 Bedford Stuyvesant 78
BK 04 204 Bushwick 79
BK 05 205 East New York/Starrett City 80
BK 06 206 Park Slope/Carroll Gardens 81
BK 07 207 Sunset Park 82
BK 08 208 Crown Heights/Prospect Heights 83
BK 09 209 S. Crown Hts/Lefferts Gardens 84
BK 10 210 Bay Ridge/Dyker Heights 85
BK 11 211 Bensonhurst 86
BK 12 212 Borough Park 87
BK 13 213 Coney Island 88
BK 14 214 Flatbush/Midwood 89
BK 15 215 Sheepshead Bay 90
BK 16 216 Brownsville 91
BK 17 217 East Flatbush 92
BK 18 218 Flatlands/Canarsie 93
ManhattanCD SBA Community District Page
MN 01 301 Financial District 98
MN 02 301 Greenwich Village/Soho 99
MN 03 302 Lower East Side/Chinatown 100
MN 04 303 Clinton/Chelsea 101
MN 05 303 Midtown 102
MN 06 304 Stuyvesant Town/Turtle Bay 103
MN 07 305 Upper West Side 104
MN 08 306 Upper East Side 105
MN 09 307 Morningside Hts/Hamilton 106
MN 10 308 Central Harlem 107
MN 11 309 East Harlem 108
MN 12 310 Washington Heights/Inwood 109
QueensCD SBA Community District Page
QN 01 401 Astoria 114
QN 02 402 Woodside/Sunnyside 115
QN 03 403 Jackson Heights 116
QN 04 404 Elmhurst/Corona 117
QN 05 405 Ridgewood/Maspeth 118
QN 06 406 Rego Park/Forest Hills 119
QN 07 407 Flushing/Whitestone 120
QN 08 408 Hillcrest/Fresh Meadows 121
QN 09 409 Kew Gardens/Woodhaven 122
QN 10 410 S. Ozone Park/Howard Beach 123
QN 11 411 Bayside/Little Neck 124
QN 12 412 Jamaica/Hollis 125
QN 13 413 Queens Village 126
QN 14 414 Rockaway/Broad Channel 127
Staten IslandCD SBA Community District Page
SI 01 501 St. George/Stapleton 132
SI 02 502 South Beach/Willowbrook 133
SI 03 503 Tottenville/Great Kills 134
Index of Community DistrictsIN
DE
X O
F C
OM
MU
NIT
Y D
IST
RIC
TS
1 8 2 N Y U F U R M A N C E N T E R • @ F U R M A N C E N T E R N Y U
SI01 BK10
BK11
BK13
BK15
BK18
BK17
BK14BK12
BK07
BK06
BK02
BK01
QN02
QN01
QN03
QN04
QN05
QN06
QN07
BX10
BX11
BX12BX08
BX07
BX05BX06
BX09
BX02BX01
BX03BX04
MN12
MN09
MN10
MN11
MN07
MN04MN05
MN06
MN02
MN01MN03
MN08
QN11
QN13
QN12
QN08
QN09
QN10
QN14
BK09
BK08
BK03
BK04
BK16 BK05
SI02
SI03
New York City Community Districts
Parkland / Airports
S T A T E O F N E W Y O R K C I T Y ’ S H O U S I N G & N E I G H B O R H O O D S I N 2 0 1 3 1 8 3
CO
MM
UN
ITY
DIS
TR
ICT
S A
ND
SU
B-B
OR
OU
GH
AR
EA
S
503
502
413
501
407
218
411
412
414
408
405
110
410205
402
108
401
409
102
215
107
101
207
403
206
201
210
211
404
109
106
213
305
212
202
217
303
214
310
406
216
204
301
203
208
103
306
302
209
104
309
307
304
105
308
New York City Sub-Borough Areas