Embed Size (px)
Citation preview
14317.2 FOR INSTITUTIONAL USE ONLYMFS Institutional Advisors, Inc.
28 September 2010
MFS® Core Equity
Portfolio characteristics are based on equivalent exposure, which measures how a portfolio's value would change due to price changes in an asset held either directly or, in thecase of a derivative contract, indirectly. The market value of the holding may differ.
MFS® Core Equity2976-I-M-CE-28SEP10.2
Presenters
Kevin Beatty - Investment Officer, - Director of Research - US, Equity Portfolio Manager- Serves on MFS US Equity Management Committee.- Joined MFS in 2002; positions include Equity Research Analyst.- Previous experience includes 3 years as Equity Analyst/Sector Head at State Street Research &
Management; 1 year as Investment Research Analyst at Fleet Investment Advisors.- Babson College, MBA- St. Bonaventure University, BA
Karen C. Jordan - Managing Director, Institutional Public Fund Sales- Joined MFS in 1978.- Affiliations include National Conference of Public Employee Retirement Systems (NCPERS), National
Association of Governmental Defined Contribution Administrators (NAGDCA), State Association ofCounty Retirement Systems (SACRS), Michigan Association of Public Employee Retirement Systems(MAPERS), National Conference on Teacher Retirement (NCTR), Louisiana Public EmployeeRetirement Systems (LAPERS), National Association of State Treasurers (NAST), MassachusettsAssociation of Contributory Retirement Systems (MACRS), Missouri Association of Public EmployeeRetirement Systems (MAPERS).
- Salem State College, BS
MFS® Core Equity2976-I-M-CE-28SEP10.3
Table of contents
Contents Tab
Corporate organization 1
Investment overview 2
Appendix 3
1MFS® Core Equity2976-I-M-CE-28SEP10.1
Corporate overview
Heritage• Founded in 1924• Majority owned by Sun Life Financial, Inc. since 1982• Up to 22% employee ownership available
Global presence and research depth
• Manage $180 billion in assets for clients in 75 countries• Over 180 equity and fixed income investment professionals• Collaborative, research-intensive investment approach
Product integrity• Capacity management• Emphasis on quality• Risk management
As of 30-Jun-10.
19139
2MFS® Core Equity2976-I-M-CE-28SEP10.2
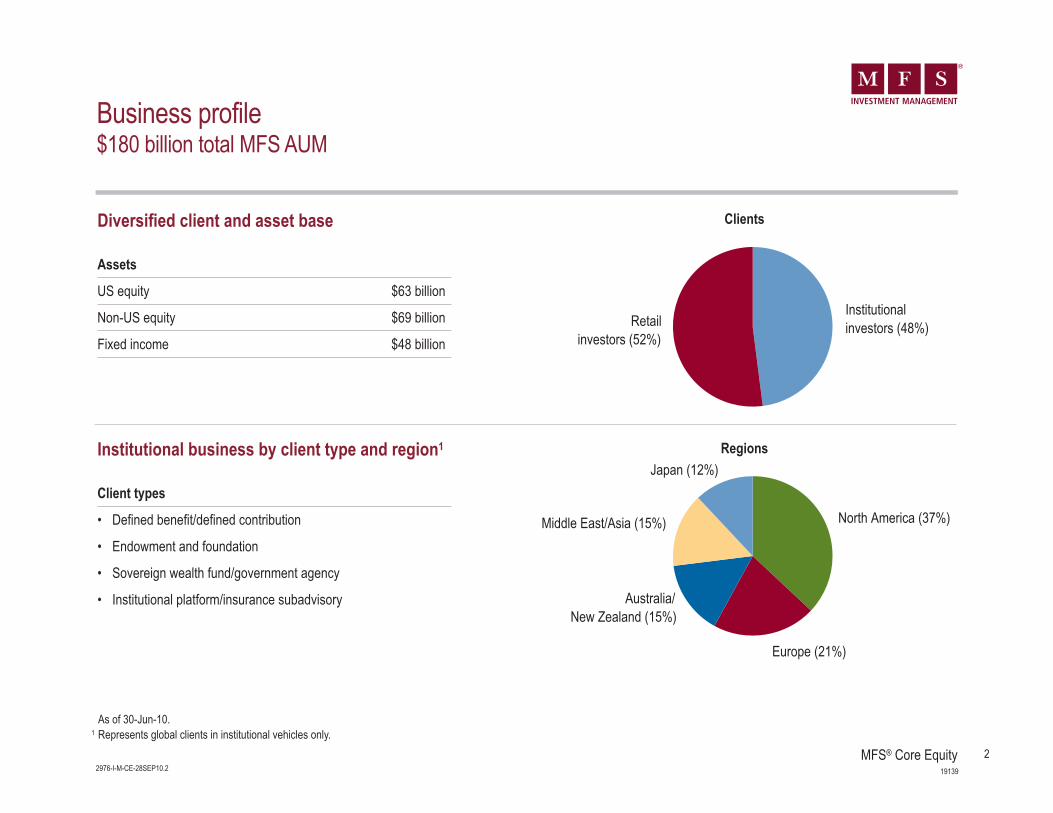
Institutionalinvestors (48%)Retail
investors (52%)
North America (37%)
Europe (21%)
Australia/New Zealand (15%)
Middle East/Asia (15%)
Japan (12%)
As of 30-Jun-10.1 Represents global clients in institutional vehicles only.
Business profile$180 billion total MFS AUM
Clients
Regions
Diversified client and asset base
Assets
US equity $63 billion
Non-US equity $69 billion
Fixed income $48 billion
Institutional business by client type and region1
Client types
• Defined benefit/defined contribution
• Endowment and foundation
• Sovereign wealth fund/government agency
• Institutional platform/insurance subadvisory
19139
3MFS® Core Equity2976-I-M-CE-28SEP10.3
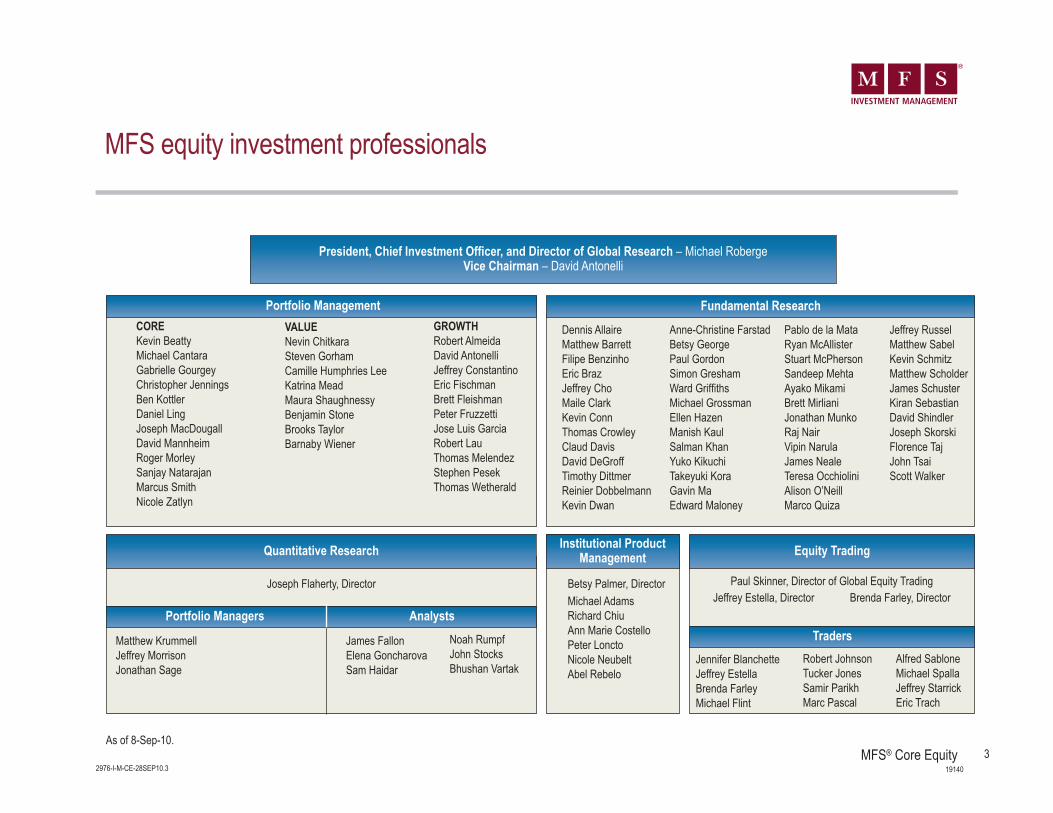
MFS equity investment professionals
19140
Robert JohnsonTucker JonesSamir ParikhMarc Pascal
Alfred SabloneMichael SpallaJeffrey StarrickEric Trach
Jennifer BlanchetteJeffrey EstellaBrenda FarleyMichael Flint
President, Chief Investment Officer, and Director of Global Research – Michael RobergeVice Chairman – David Antonelli
Paul Skinner, Director of Global Equity TradingJeffrey Estella, Director Brenda Farley, Director
Fundamental Research
Equity Trading
Anne-Christine FarstadBetsy GeorgePaul GordonSimon GreshamWard Griffiths Michael GrossmanEllen HazenManish KaulSalman KhanYuko KikuchiTakeyuki KoraGavin Ma Edward Maloney
Dennis AllaireMatthew BarrettFilipe BenzinhoEric Braz Jeffrey ChoMaile ClarkKevin ConnThomas Crowley Claud DavisDavid DeGroffTimothy Dittmer Reinier DobbelmannKevin Dwan
Pablo de la MataRyan McAllister Stuart McPherson Sandeep MehtaAyako Mikami Brett MirlianiJonathan MunkoRaj NairVipin NarulaJames NealeTeresa OcchioliniAlison O’NeillMarco Quiza
Portfolio Managers AnalystsNoah RumpfJohn StocksBhushan Vartak
James FallonElena GoncharovaSam Haidar
Matthew KrummellJeffrey MorrisonJonathan Sage
Joseph Flaherty, Director
Quantitative Research
Jeffrey RusselMatthew SabelKevin SchmitzMatthew ScholderJames SchusterKiran SebastianDavid ShindlerJoseph SkorskiFlorence TajJohn TsaiScott Walker
Betsy Palmer, Director
Institutional ProductManagement
Portfolio Management
Michael AdamsRichard ChiuAnn Marie CostelloPeter LonctoNicole NeubeltAbel Rebelo
Traders
VALUENevin ChitkaraSteven Gorham Camille Humphries LeeKatrina MeadMaura ShaughnessyBenjamin StoneBrooks TaylorBarnaby Wiener
COREKevin BeattyMichael CantaraGabrielle GourgeyChristopher JenningsBen KottlerDaniel LingJoseph MacDougallDavid MannheimRoger MorleySanjay NatarajanMarcus Smith Nicole Zatlyn
GROWTHRobert AlmeidaDavid AntonelliJeffrey ConstantinoEric FischmanBrett FleishmanPeter FruzzettiJose Luis GarciaRobert LauThomas MelendezStephen PesekThomas Wetherald
As of 8-Sep-10.
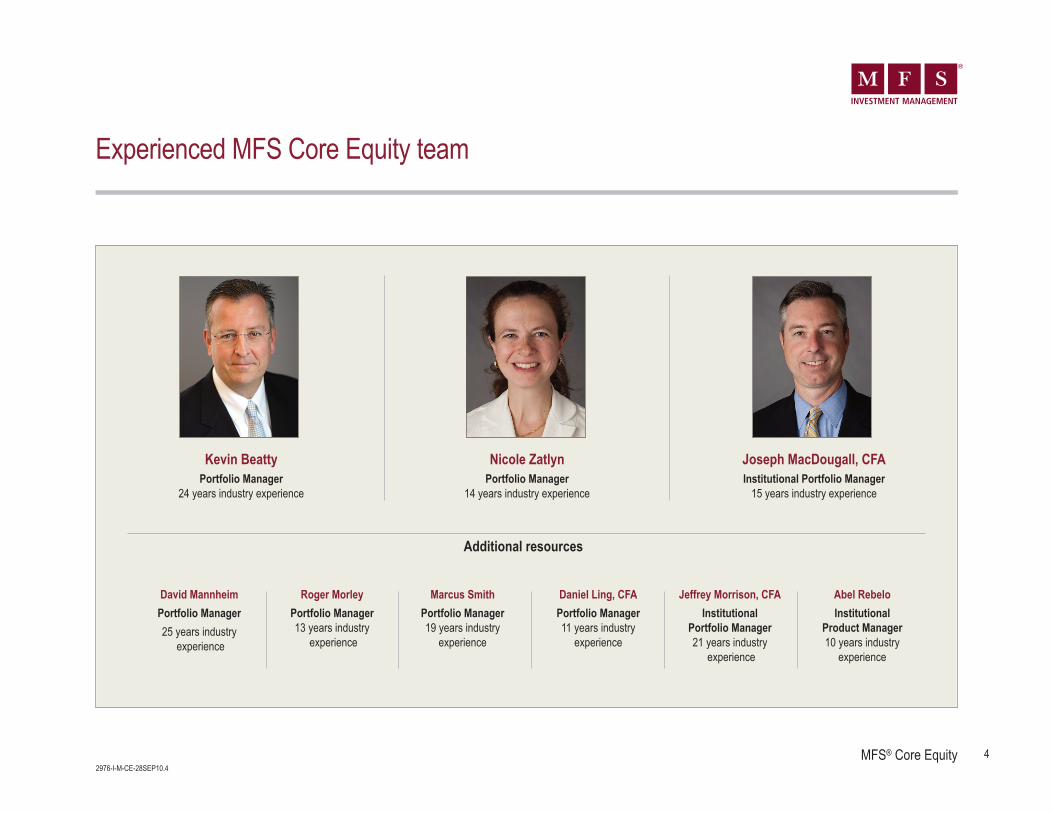
Kevin BeattyPortfolio Manager
24 years industry experience
Nicole ZatlynPortfolio Manager
14 years industry experience
Joseph MacDougall, CFAInstitutional Portfolio Manager
15 years industry experience
Experienced MFS Core Equity team
Additional resources
Abel RebeloInstitutional
Product Manager10 years industry
experience
Marcus SmithPortfolio Manager19 years industry
experience
Daniel Ling, CFAPortfolio Manager11 years industry
experience
Roger MorleyPortfolio Manager13 years industry
experience
David MannheimPortfolio Manager25 years industry
experience
Jeffrey Morrison, CFAInstitutional
Portfolio Manager21 years industry
experience
4MFS® Core Equity2976-I-M-CE-28SEP10.4
5MFS® Core Equity2976-I-M-CE-28SEP10.5
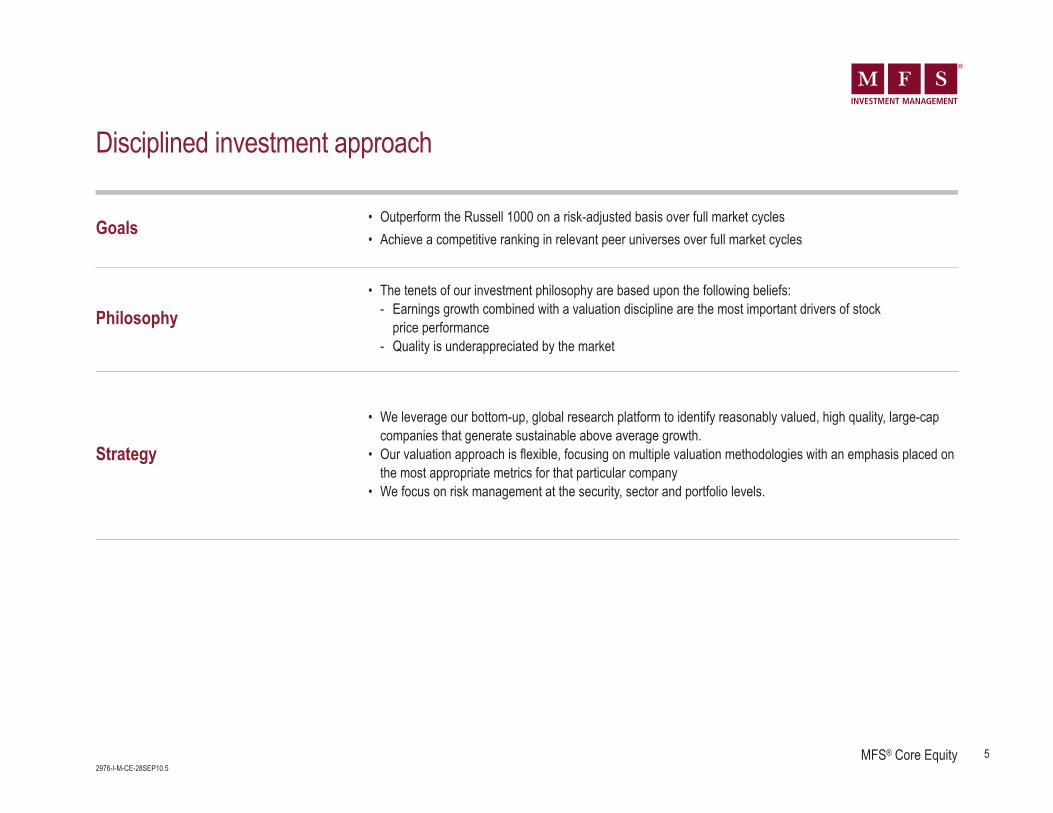
Disciplined investment approach
Goals • Outperform the Russell 1000 on a risk-adjusted basis over full market cycles• Achieve a competitive ranking in relevant peer universes over full market cycles
Philosophy• The tenets of our investment philosophy are based upon the following beliefs:
- Earnings growth combined with a valuation discipline are the most important drivers of stock price performance
- Quality is underappreciated by the market
Strategy
• We leverage our bottom-up, global research platform to identify reasonably valued, high quality, large-capcompanies that generate sustainable above average growth.
• Our valuation approach is flexible, focusing on multiple valuation methodologies with an emphasis placed onthe most appropriate metrics for that particular company
• We focus on risk management at the security, sector and portfolio levels.
6MFS® Core Equity2976-I-M-CE-28SEP10.6
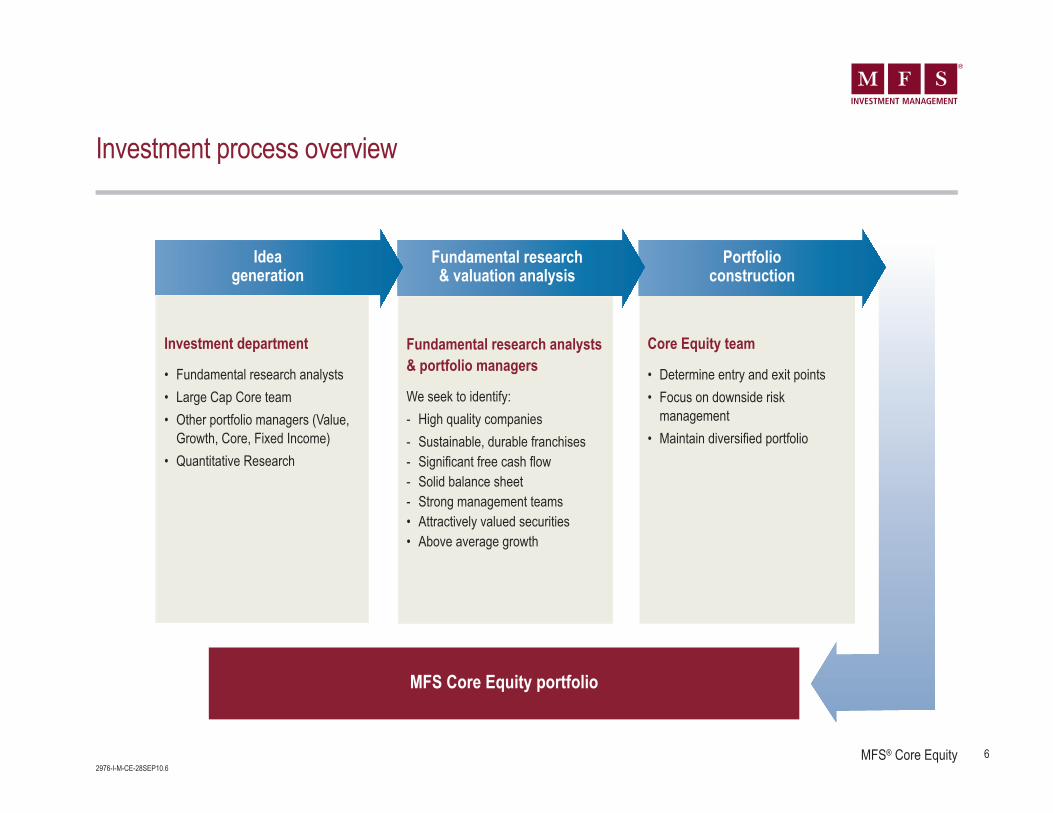
Investment process overview
Fundamental research analysts& portfolio managers
We seek to identify:- High quality companies- Sustainable, durable franchises- Significant free cash flow- Solid balance sheet- Strong management teams• Attractively valued securities• Above average growth
Core Equity team
• Determine entry and exit points• Focus on downside risk
management• Maintain diversified portfolio
Investment department
• Fundamental research analysts• Large Cap Core team• Other portfolio managers (Value,
Growth, Core, Fixed Income)• Quantitative Research
MFS Core Equity portfolio
Portfolio construction
Fundamental research & valuation analysis
Idea generation
7MFS® Core Equity2976-I-M-CE-28SEP10.7
Core Equity portfolio
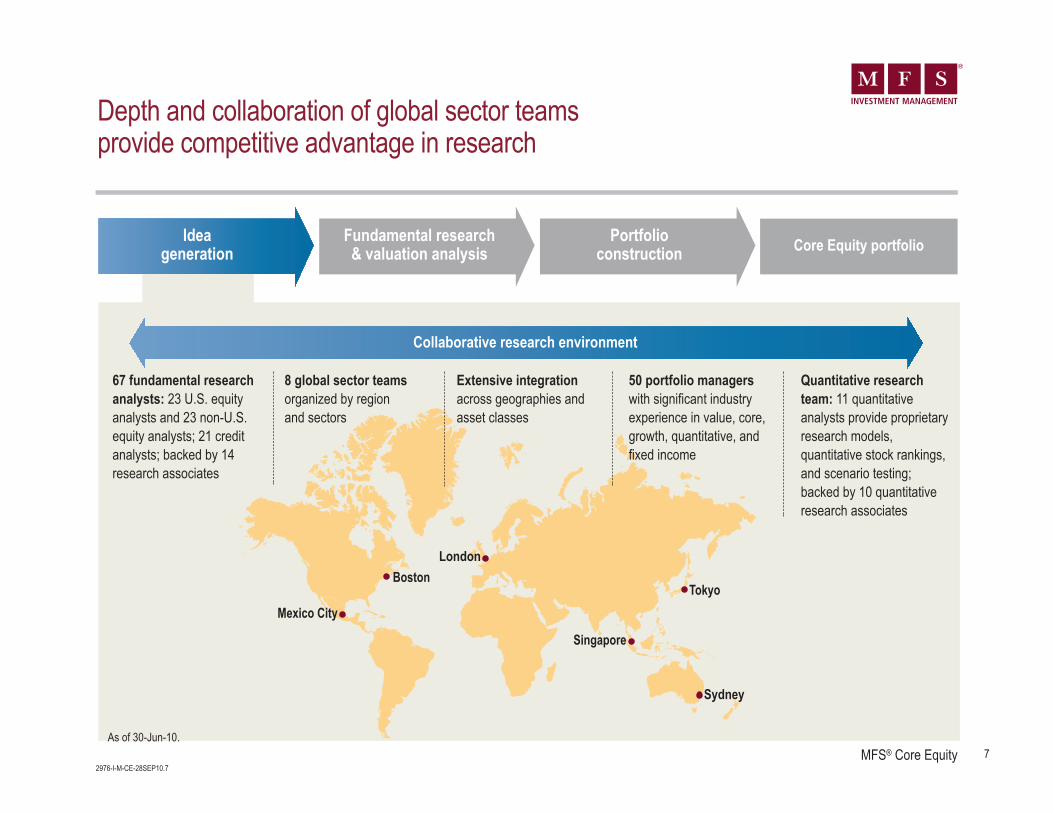
Depth and collaboration of global sector teams provide competitive advantage in research
As of 30-Jun-10.
Tokyo
Sydney
London
Mexico City
Boston
Singapore
Fundamental research & valuation analysis
Idea generation
Portfolio construction
Collaborative research environment
67 fundamental researchanalysts: 23 U.S. equityanalysts and 23 non-U.S.equity analysts; 21 creditanalysts; backed by 14research associates
8 global sector teams organized by region and sectors
Extensive integrationacross geographies andasset classes
50 portfolio managerswith significant industryexperience in value, core,growth, quantitative, andfixed income
Quantitative researchteam: 11 quantitativeanalysts provide proprietaryresearch models,quantitative stock rankings,and scenario testing;backed by 10 quantitativeresearch associates

8MFS® Core Equity2976-I-M-CE-28SEP10.8
Consistent focus on high quality and valuation in all market environments
Core Equity portfolioFundamental research & valuation analysis
Idea generation
Portfolio construction
Sustainable, durable franchises• Robust business model• Consistent, high returns• High barriers to entry
High quality companies
Significant free cash flow• Above average returns
on capital• Capital investment discipline
Solid balance sheet• Above average capital
position
Strong management teams• Proven track record• History of capital
stewardship
Attractively valued securities
• Multiple measures of valuation are considered:
• Emphasis placed on mostappropriate metric
- Price/free cash flow- Price/sales- Price/book- Dividend yield- Price/earnings- Discounted cash flow analysis
Sustainable, above average growth
• Earnings • Revenue
9MFS® Core Equity2976-I-M-CE-28SEP10.9
Sell
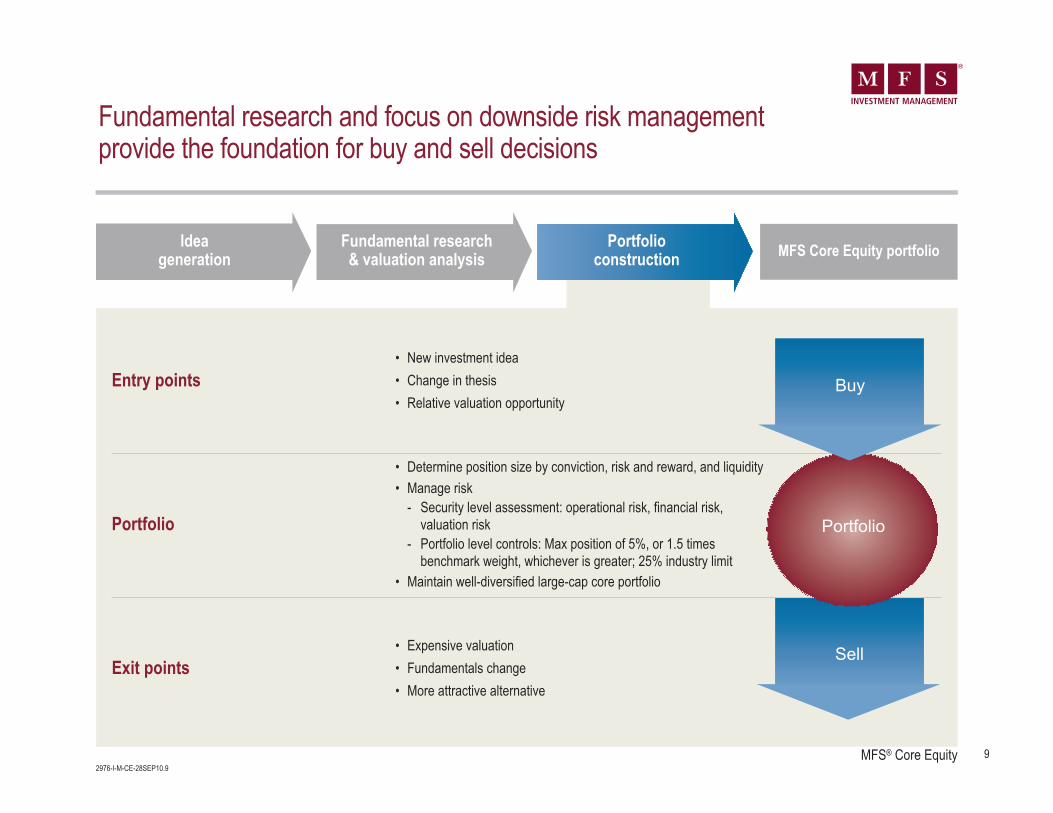
Fundamental research and focus on downside risk management provide the foundation for buy and sell decisions
MFS Core Equity portfolioFundamental research & valuation analysis
Idea generation
Portfolio construction
Entry points• New investment idea• Change in thesis• Relative valuation opportunity
Portfolio
• Determine position size by conviction, risk and reward, and liquidity• Manage risk
- Security level assessment: operational risk, financial risk, valuation risk
- Portfolio level controls: Max position of 5%, or 1.5 times benchmark weight, whichever is greater; 25% industry limit
• Maintain well-diversified large-cap core portfolio
Exit points• Expensive valuation• Fundamentals change• More attractive alternative
Portfolio
Buy
Sell
10MFS® Core Equity2976-I-M-CE-28SEP10.10
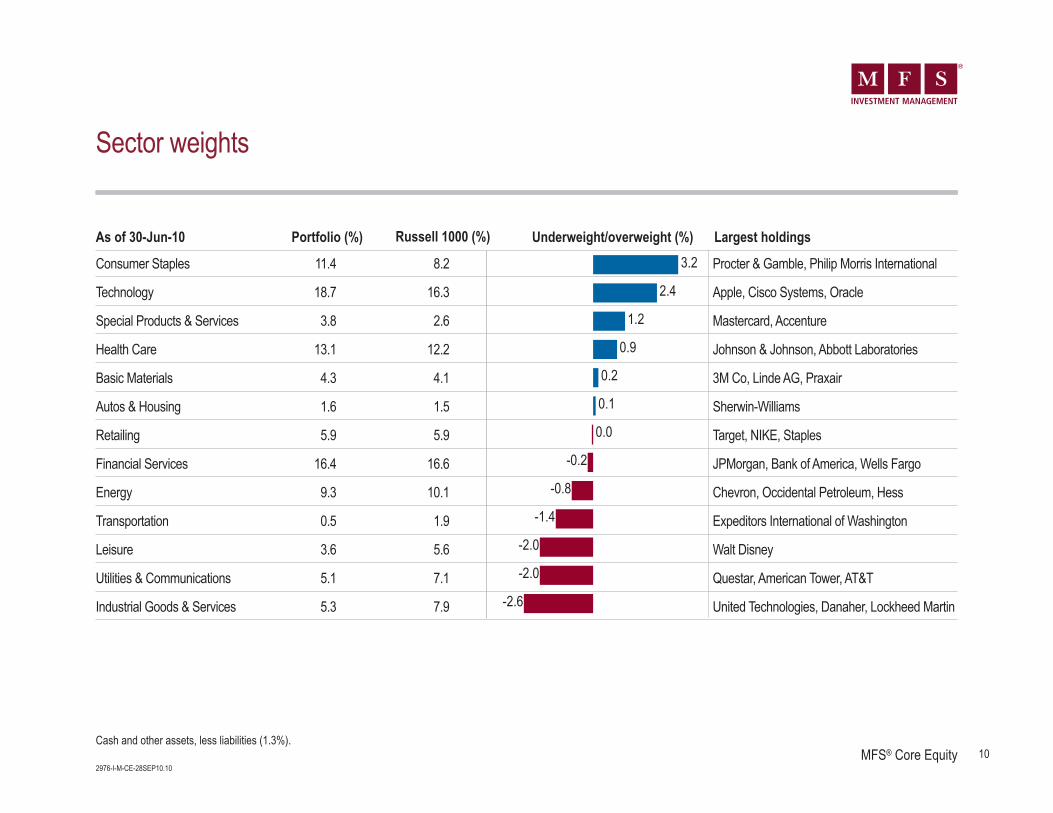
Sector weights
Cash and other assets, less liabilities (1.3%).
3.2
2.4
1.2
0.9
0.2
0.1
0.0
-0.2
-0.8
-1.4
-2.0
-2.0
-2.6
As of 30-Jun-10 Portfolio (%) Underweight/overweight (%) Largest holdingsRussell 1000 (%)
Consumer Staples 11.4 8.2 Procter & Gamble, Philip Morris International
Technology 18.7 16.3 Apple, Cisco Systems, Oracle
Special Products & Services 3.8 2.6 Mastercard, Accenture
Health Care 13.1 12.2 Johnson & Johnson, Abbott Laboratories
Basic Materials 4.3 4.1 3M Co, Linde AG, Praxair
Autos & Housing 1.6 1.5 Sherwin-Williams
Retailing 5.9 5.9 Target, NIKE, Staples
Financial Services 16.4 16.6 JPMorgan, Bank of America, Wells Fargo
Energy 9.3 10.1 Chevron, Occidental Petroleum, Hess
Transportation 0.5 1.9 Expeditors International of Washington
Leisure 3.6 5.6 Walt Disney
Utilities & Communications 5.1 7.1 Questar, American Tower, AT&T
Industrial Goods & Services 5.3 7.9 United Technologies, Danaher, Lockheed Martin
11MFS® Core Equity2976-I-M-CE-28SEP10.11
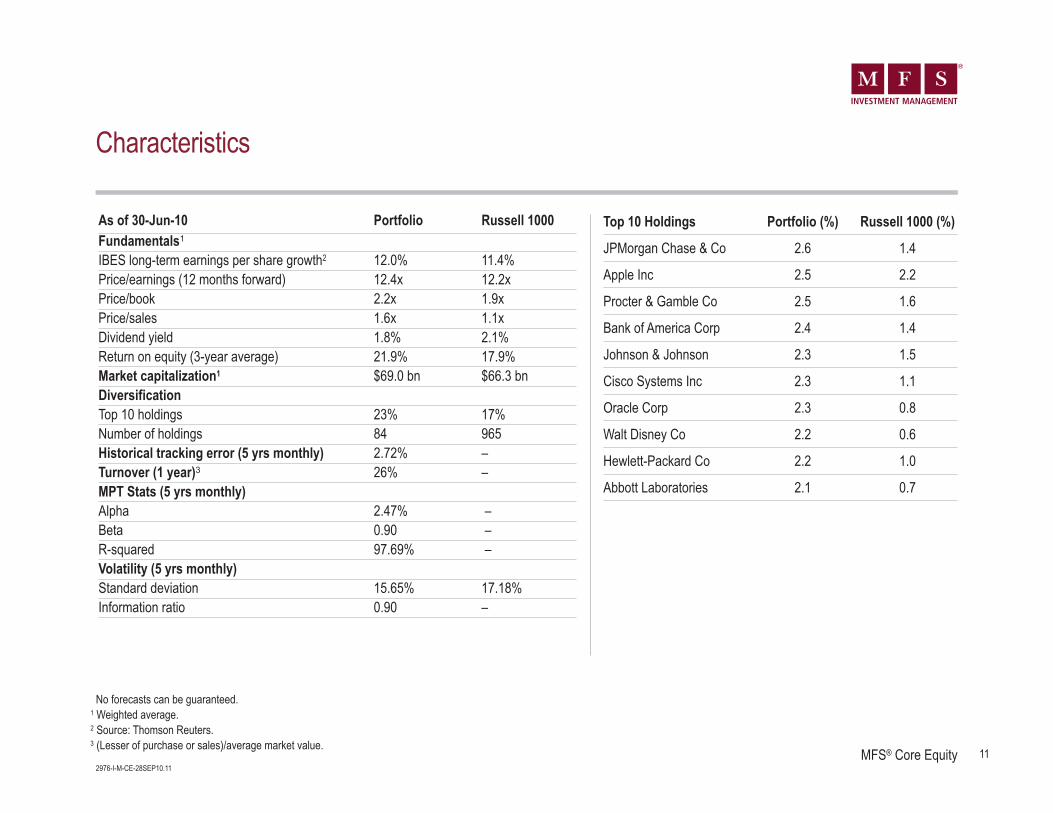
Characteristics
No forecasts can be guaranteed.1 Weighted average.2 Source: Thomson Reuters.3 (Lesser of purchase or sales)/average market value.
Top 10 Holdings Portfolio (%) Russell 1000 (%)
JPMorgan Chase & Co 2.6 1.4
Apple Inc 2.5 2.2
Procter & Gamble Co 2.5 1.6
Bank of America Corp 2.4 1.4
Johnson & Johnson 2.3 1.5
Cisco Systems Inc 2.3 1.1
Oracle Corp 2.3 0.8
Walt Disney Co 2.2 0.6
Hewlett-Packard Co 2.2 1.0
Abbott Laboratories 2.1 0.7
As of 30-Jun-10 Portfolio Russell 1000 Fundamentals1
IBES long-term earnings per share growth2 12.0% 11.4%Price/earnings (12 months forward) 12.4x 12.2xPrice/book 2.2x 1.9xPrice/sales 1.6x 1.1xDividend yield 1.8% 2.1%Return on equity (3-year average) 21.9% 17.9%Market capitalization1 $69.0 bn $66.3 bnDiversificationTop 10 holdings 23% 17%Number of holdings 84 965Historical tracking error (5 yrs monthly) 2.72% –Turnover (1 year)3 26% –MPT Stats (5 yrs monthly)Alpha 2.47% – Beta 0.90 – R-squared 97.69% .– Volatility (5 yrs monthly)Standard deviation 15.65% 17.18%Information ratio 0.90 –
12MFS® Core Equity2976-I-M-CE-28SEP10.12
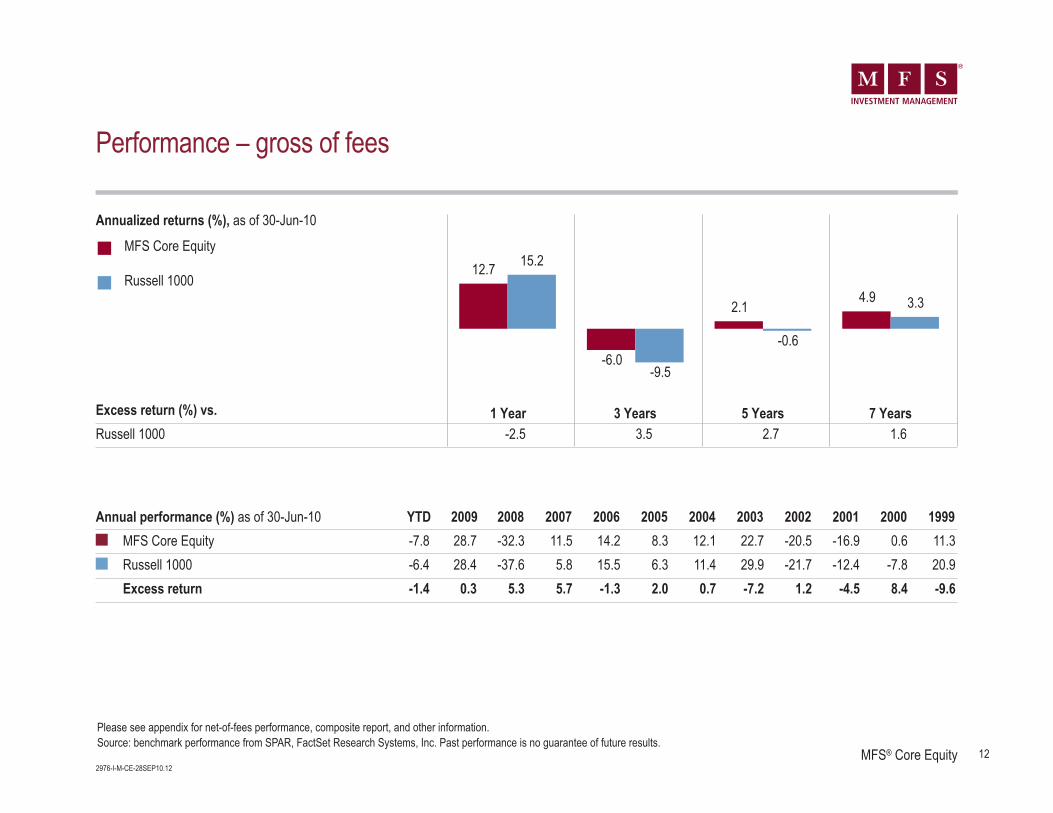
Performance – gross of fees
Please see appendix for net-of-fees performance, composite report, and other information. Source: benchmark performance from SPAR, FactSet Research Systems, Inc. Past performance is no guarantee of future results.
Annual performance (%) as of 30-Jun-10 YTD 2009 2008 2007 2006 2005 2004 2003 2002 2001 2000 1999MFS Core Equity -7.8 28.7 -32.3 11.5 14.2 8.3 12.1 22.7 -20.5 -16.9 0.6 11.3Russell 1000 -6.4 28.4 -37.6 5.8 15.5 6.3 11.4 29.9 -21.7 -12.4 -7.8 20.9Excess return -1.4 0.3 5.3 5.7 -1.3 2.0 0.7 -7.2 1.2 -4.5 8.4 -9.6
Excess return (%) vs.Russell 1000 -2.5 3.5 2.7 1.6
1 Year 3 Years 5 Years 7 Years
12.7 15.2
-6.0-9.5
2.1
-0.6
4.9 3.3
MFS Core Equity
Russell 1000
Annualized returns (%), as of 30-Jun-10
13MFS® Core Equity2976-I-M-CE-28SEP10.13
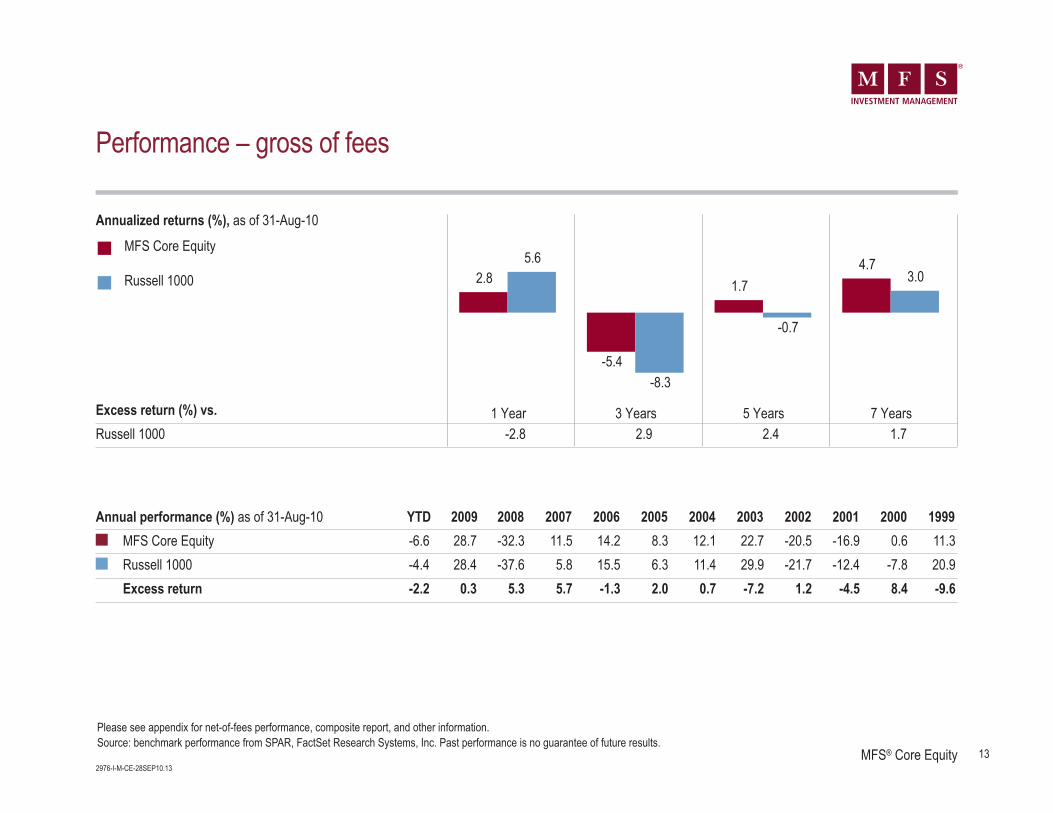
Performance – gross of fees
Please see appendix for net-of-fees performance, composite report, and other information. Source: benchmark performance from SPAR, FactSet Research Systems, Inc. Past performance is no guarantee of future results.
Annual performance (%) as of 31-Aug-10 YTD 2009 2008 2007 2006 2005 2004 2003 2002 2001 2000 1999MFS Core Equity -6.6 28.7 -32.3 11.5 14.2 8.3 12.1 22.7 -20.5 -16.9 0.6 11.3Russell 1000 -4.4 28.4 -37.6 5.8 15.5 6.3 11.4 29.9 -21.7 -12.4 -7.8 20.9Excess return -2.2 0.3 5.3 5.7 -1.3 2.0 0.7 -7.2 1.2 -4.5 8.4 -9.6
Excess return (%) vs.Russell 1000 -2.8 2.9 2.4 1.7
1 Year 3 Years 5 Years 7 Years
2.85.6
-5.4-8.3
1.7
-0.7
4.73.0
MFS Core Equity
Russell 1000
Annualized returns (%), as of 31-Aug-10
14MFS® Core Equity2976-I-M-CE-28SEP10.14
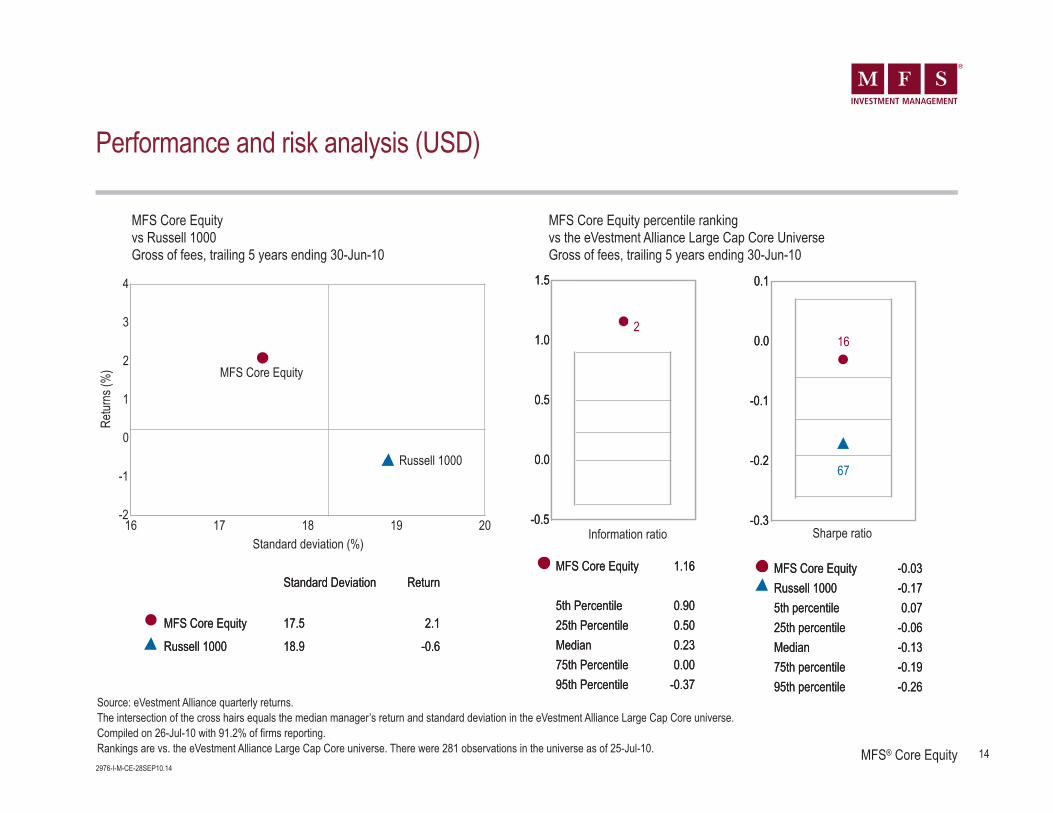
Performance and risk analysis (USD)
17.517.518.918.9
2.12.1-0.6-0.6
MFS Core EquityMFS Core EquityRussell 1000Russell 1000
Standard DeviationStandard Deviation ReturnReturn
-2
-1
0
1
2
3
4
16 17 18 19 20
Retur
ns (%
)
Standard deviation (%)
MFS Core Equity
Russell 1000
-0.5
0.0
0.5
1.0
1.5
-0.5
0.0
0.5
1.0
1.5
Information ratio
1.161.16
0.900.900.500.500.230.230.000.00
-0.37-0.37
MFS Core EquityMFS Core Equity
5th Percentile5th Percentile25th Percentile25th PercentileMedianMedian75th Percentile75th Percentile95th Percentile95th Percentile
2
MFS Core Equityvs Russell 1000Gross of fees, trailing 5 years ending 30-Jun-10
MFS Core Equity percentile ranking vs the eVestment Alliance Large Cap Core Universe Gross of fees, trailing 5 years ending 30-Jun-10
Source: eVestment Alliance quarterly returns.The intersection of the cross hairs equals the median manager’s return and standard deviation in the eVestment Alliance Large Cap Core universe.Compiled on 26-Jul-10 with 91.2% of firms reporting.Rankings are vs. the eVestment Alliance Large Cap Core universe. There were 281 observations in the universe as of 25-Jul-10.
-0.3
-0.2
-0.1
0.0
0.1
-0.3
-0.2
-0.1
0.0
0.1
Sharpe ratio
-0.03-0.03-0.17-0.170.070.07
-0.06-0.06-0.13-0.13-0.19-0.19-0.26-0.26
MFS Core EquityMFS Core EquityRussell 1000Russell 10005th percentile5th percentile25th percentile25th percentileMedianMedian75th percentile75th percentile95th percentile95th percentile
16
67
15MFS® Core Equity2976-I-M-CE-28SEP10.15
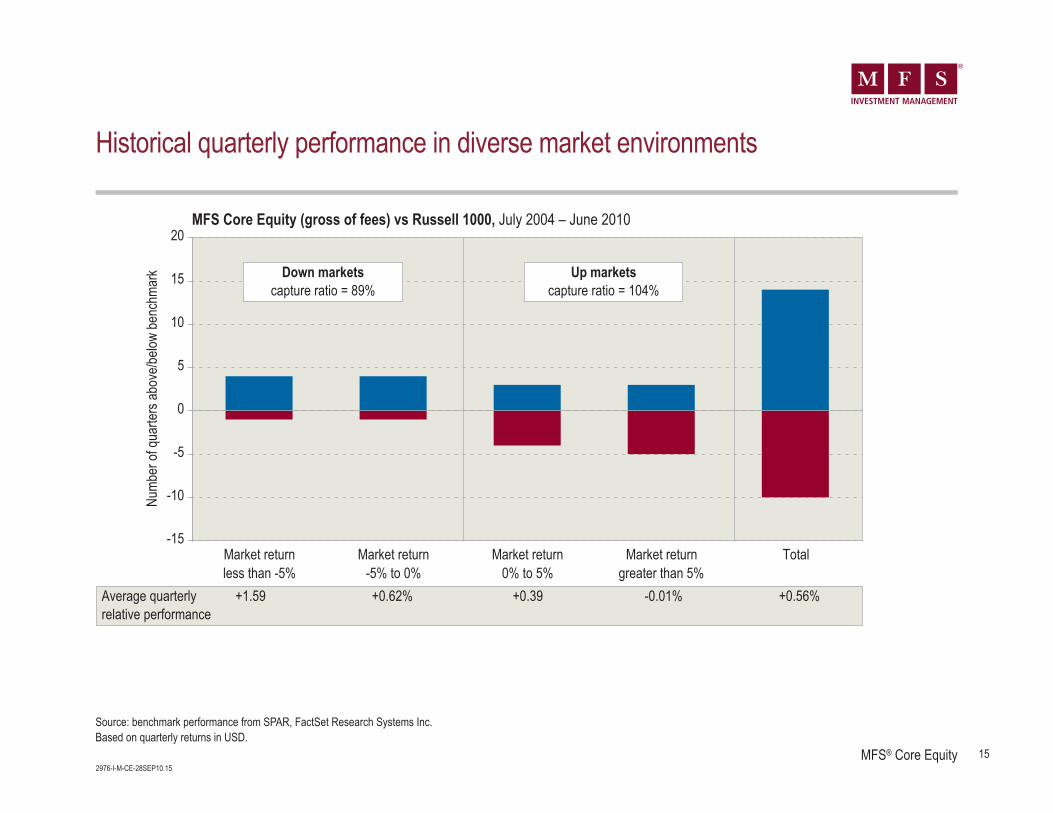
Historical quarterly performance in diverse market environments
Source: benchmark performance from SPAR, FactSet Research Systems Inc.Based on quarterly returns in USD.
Market returnless than -5%
Market return-5% to 0%
Market return0% to 5%
Market returngreater than 5%
Total-15
-10
-5
0
5
10
15
20
Numb
er of
quar
ters a
bove
/below
benc
hmar
k
Average quarterly +1.59 +0.62% +0.39 -0.01% +0.56%relative performance
Up marketscapture ratio = 104%
Down marketscapture ratio = 89%
MFS Core Equity (gross of fees) vs Russell 1000, July 2004 – June 2010
16MFS® Core Equity2976-I-M-CE-28SEP10.16
MFS Core EquityDistinguishing characteristics
What makes us different from other large cap core managers?
Integrated global research platform• Unique, collaborative culture• Fully integrated approach to researching companies combining equity, fixed income and quant• Fundamental, bottom-up stock selection drives alphaLong-term investment horizon• Assess investment opportunities in context of 3-5+ year time horizon; low turnover, not a trading or
momentum style• Take advantage of dislocations created by short term stock price volatilityEmphasis on sustainability, durability and quality of business model• Seek companies with durable competitive advantages and strong management teams• Holdings typically have high returns on capital with significant free cash generationSeek sustainable, above average growth• Seek companies that can compound growth at above average ratesValuation discipline• Rigorous and flexible valuation analysis with focus on downside risk exposure
How has this translated intoperformance results?
Consistent relative performance• Outperformed the index in 3-, 5-, and 10 years1,2
Strong risk-adjusted returns• 0.95 information ratio since 1-Jul-041,4
• Ranks in the 3rd percentile versus other core managers1,3,4
Preservation of capital• 89% downside capture ratio since 1-July-041,2,5
1 As of 30-Jun-10. 2 Relative to the Russell 1000.3 Peer universe rankings are from eVestment Alliace Large Cap Core Equity universe since 1-Jul-04.4 Based on monthly returns in USD.5 Based on quarterly returns in USD.
17MFS® Core Equity2976-I-M-CE-28SEP10.17
Summary
• Our core equity flagship since 1924, and the foundation of MFS
• Focus on large-cap, higher quality companies with sound, above average earnings growth trading at reasonable valuations
• Consistent relative performance, risk-adjusted returns, and preservation of capital
The views expressed are those of the portfolio managers, and are subject to change at any time. These views do not necessarily reflect the views of MFS or others in the MFS organisation, and should not be relied upon as investment advice, as securities recommendations, or as an indication of trading intent on behalf of any MFS investment product.
18MFS® Core Equity2976-I-M-CE-28SEP10.18
Portfolio outlook
The portfolio is focused on large-cap, higher-quality companies with sound, above average earnings growth trading at reasonablevaluations. More specifically, key attributes that we look for in an investment include sustainable, durable franchises with realbarriers to entry, rising returns on invested capital in excess of the cost of capital, balance sheets that can withstand adversemarket conditions, and solid management teams that aim to create long term value.
Looking at current positioning, one general theme that developed during the quarter was a reduction in exposure to some cyclicaloutperformers. For example, while technology remained a significant overweight, we continued to reduce our exposure tosemiconductors, the most cyclical industry in technology, on concerns that the semi cycle has peaked as inventory levels build inthe channel. In the leisure, industrials, and retailing sectors we sold or trimmed positions in order to invest in more attractiveopportunities. While we remain underweight the energy sector, we modestly increased our exposure to oil services.
Leading economic indicators point to strong, but decelerating economic growth. At the inflection point, early cycle small- andmid-cap stocks ceded leadership to large-cap stocks. Leadership transitions like these are expected around peaks in economicmomentum, as investors seek out higher-quality companies that have demonstrated an ability to operate in more challengingenvironments. We believe our focus on higher quality companies with attractive fundamentals, sustainable business models andreasonable valuations should position us well as this change in leadership occurs and investment decisions are driven byfundamentals and valuations, a stock-picking, alpha oriented market.
The views expressed are those of MFS, and are subject to change at any time. These views should not be relied upon as investment advice, as securities recommendations, or as an indication of trading intent on behalf of any other MFS investment product.Past performance is no guarantee of future results. No forecasts can be guaranteed.
As of 30-Jun-10.
19MFS® Core Equity2976-I-M-CE-28SEP10.19
Appendix
Contents Page
Fee schedule 20
MFS Core Equity team 21
High quality focus works best when appetite is decreasing 25
Attribution 26
Market capitalization 35
Five largest relative industry overweights & underweights 36
Historical sector exposure 38
Relative annual historical sector allocations 39
Quarterly and annual performance summary 40
Performance – net of fees 41
Composite report 43
20MFS® Core Equity2976-I-M-CE-28SEP10.20
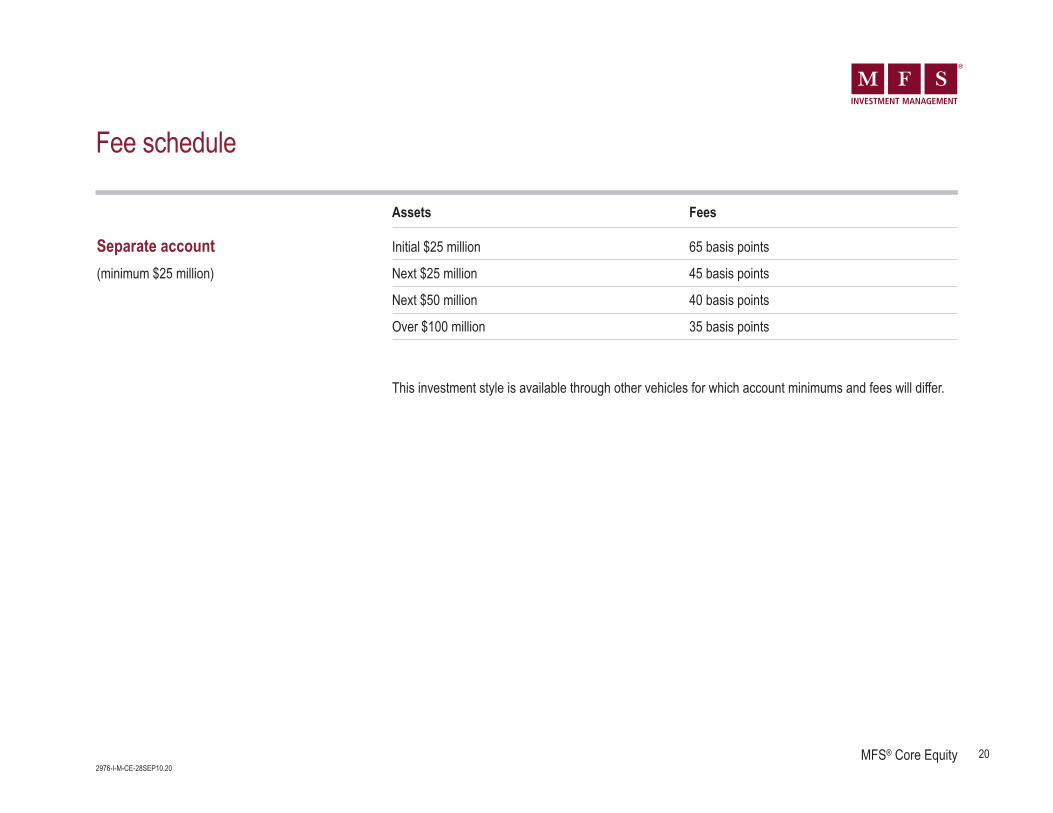
Assets Fees
Separate account Initial $25 million 65 basis points
(minimum $25 million) Next $25 million 45 basis points
Next $50 million 40 basis points
Over $100 million 35 basis points
This investment style is available through other vehicles for which account minimums and fees will differ.
Fee schedule
21MFS® Core Equity2976-I-M-CE-28SEP10.21
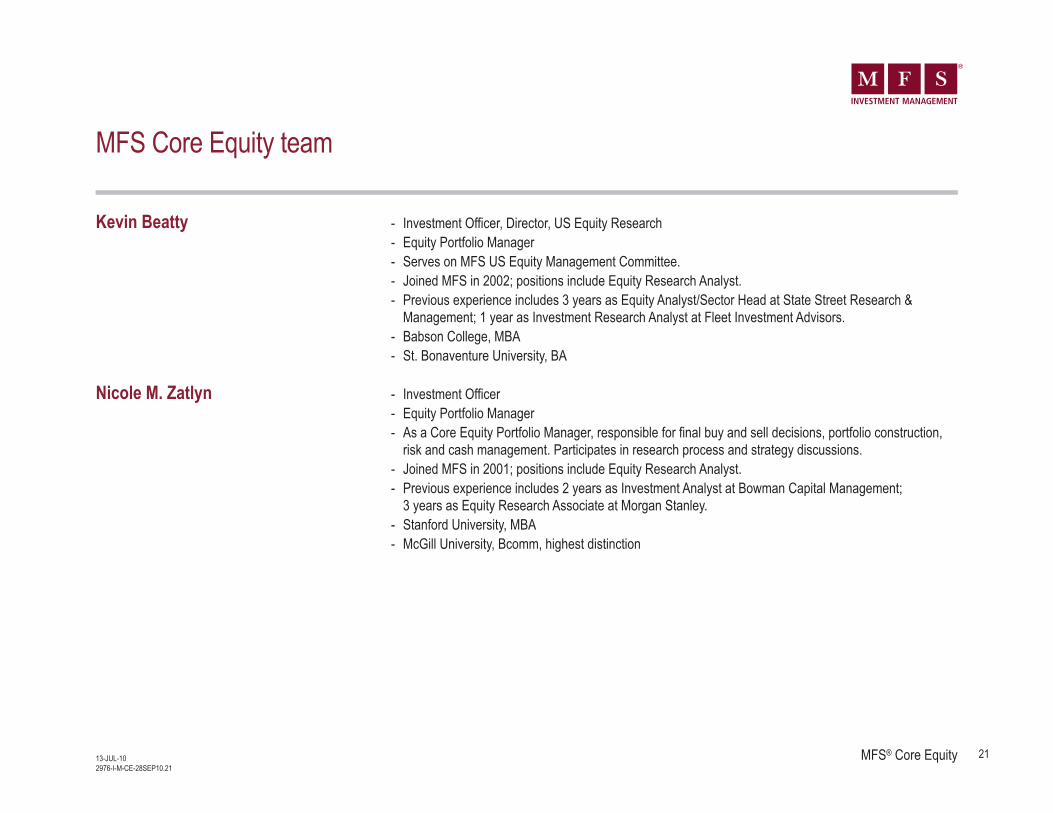
MFS Core Equity team
Kevin Beatty - Investment Officer, Director, US Equity Research- Equity Portfolio Manager- Serves on MFS US Equity Management Committee.- Joined MFS in 2002; positions include Equity Research Analyst.- Previous experience includes 3 years as Equity Analyst/Sector Head at State Street Research &
Management; 1 year as Investment Research Analyst at Fleet Investment Advisors.- Babson College, MBA- St. Bonaventure University, BA
Nicole M. Zatlyn - Investment Officer- Equity Portfolio Manager- As a Core Equity Portfolio Manager, responsible for final buy and sell decisions, portfolio construction,
risk and cash management. Participates in research process and strategy discussions.- Joined MFS in 2001; positions include Equity Research Analyst.- Previous experience includes 2 years as Investment Analyst at Bowman Capital Management;
3 years as Equity Research Associate at Morgan Stanley.- Stanford University, MBA- McGill University, Bcomm, highest distinction
13-JUL-10
22MFS® Core Equity2976-I-M-CE-28SEP10.22
MFS Core Equity team (continued)
Joseph G. MacDougall, CFA - Investment Officer- Institutional Equity Portfolio Manager- As an Institutional Portfolio Manager, participates in the research process and strategy discussions.
Assesses portfolio risk, customizes portfolios to client objectives and guidelines, and manages dailycash flows. Communicates investment policy, strategy, and positioning.
- Joined MFS in 2000; positions include Senior Product Manager.- Previous experience includes 1 year as Senior Investment Analyst at UAM Investment Services; 4 years
as Senior Financial Analyst and Director of Managed Accounts at New England Securities.- Affiliations include CFA Institute, Boston Security Analysts Society, Inc.- Boston University, MBA- Boston College, BS
23MFS® Core Equity2976-I-M-CE-28SEP10.23
Additional resources
David R. Mannheim - Investment Officer- Equity Portfolio Manager- Serves on MFS Non-US Equity Management Committee, MFS US Equity Management Committee.- As a Global Equity Portfolio Manager, responsible for final buy and sell decisions, portfolio construction,
risk and cash management. Participates in the research process and strategy discussions.- Joined MFS in 1988; positions include Equity Research Analyst.- Previous experience includes 4 years as Lending Officer at Mid Atlantic National Bank.- Massachusetts Institute of Technology, MSM- Amherst College, BA
Roger M. Morley - Investment Officer- Equity Portfolio Manager, Equity Research Analyst- Joined MFS in 2002; positions include Global Equity Research Analyst.- Previous experience includes 3 years as Associate - Healthcare Group at Deutsche Bank AG -Global
Investment Banking; 2 years as Financial Analyst -Technology and Media Group at Alex Brown & Sons.- INSEAD, MBA, with distinction- University of Cambridge, MA
Marcus L. Smith - Investment Officer, Director of Equity, Asia- Equity Portfolio Manager- Serves on MFS Non-US Equity Management Committee.- As a Non-US Equity Portfolio Manager, responsible for final buy and sell decisions, portfolio
construction, risk and cash management. Participates in the research process and strategy discussions.- Joined MFS in 1994.- Previous experience includes 4 years as Senior Consultant, Financial Services Group
at Andersen Consulting.- University of Pennsylvania, MBA- Mount Union College, BS, cum laude
24MFS® Core Equity2976-I-M-CE-28SEP10.24
Additional resources (continued)
Daniel T. Ling, CFA - Investment Officer- Equity Portfolio Manager, Equity Research Analyst- Joined MFS in 2006.- Previous experience includes 6 years as Investment Manager at Lion Global Investors; 1 year as
Process Analyst at Accenture.- Affiliations include CFA Institute.- Nanyang Technological University, BA
Jeffrey D. Morrison, CFA - Investment Officer- Institutional Equity Portfolio Manager- As an Institutional Portfolio Manager, participates in the research process and strategy discussions.
Assesses portfolio risk, customizes portfolios to client objectives and guidelines, and manages dailycash flows. Communicates investment policy, strategy, and positioning.
- Joined MFS in 2006.- Previous experience includes 8 years as Portfolio Manager at Franklin Templeton Investments; 6 years
as US Equity Research Analyst/Portfolio Manager at Mulvihill Capital Management; 3 years as CapitalMarkets Analyst at CT Investment Counsel (CTIC).
- Affiliations include CFA Institute.- Ryerson Polytechnical Institute, BBM
Abel Z. Rebelo - Director, Institutional Product Management- As an Institutional Product Manager, communicates investment policy, strategy and tactics, performs
portfolio analysis and leads institutional product development.- Joined MFS in 2000; positions include Associate Investment Specialist; Product Services Analyst.- Previous experience includes 2 years as Product Information Specialist, Senior Product Information
Specialist at Mellon Trust/Mellon Financial Company; 2 years as Trust Specialist, Senior Trust Specialistat Mellon Trust/The Boston Company.
- Boston University, MBA- Providence College, BS, cum laude
25MFS® Core Equity2976-I-M-CE-28SEP10.25
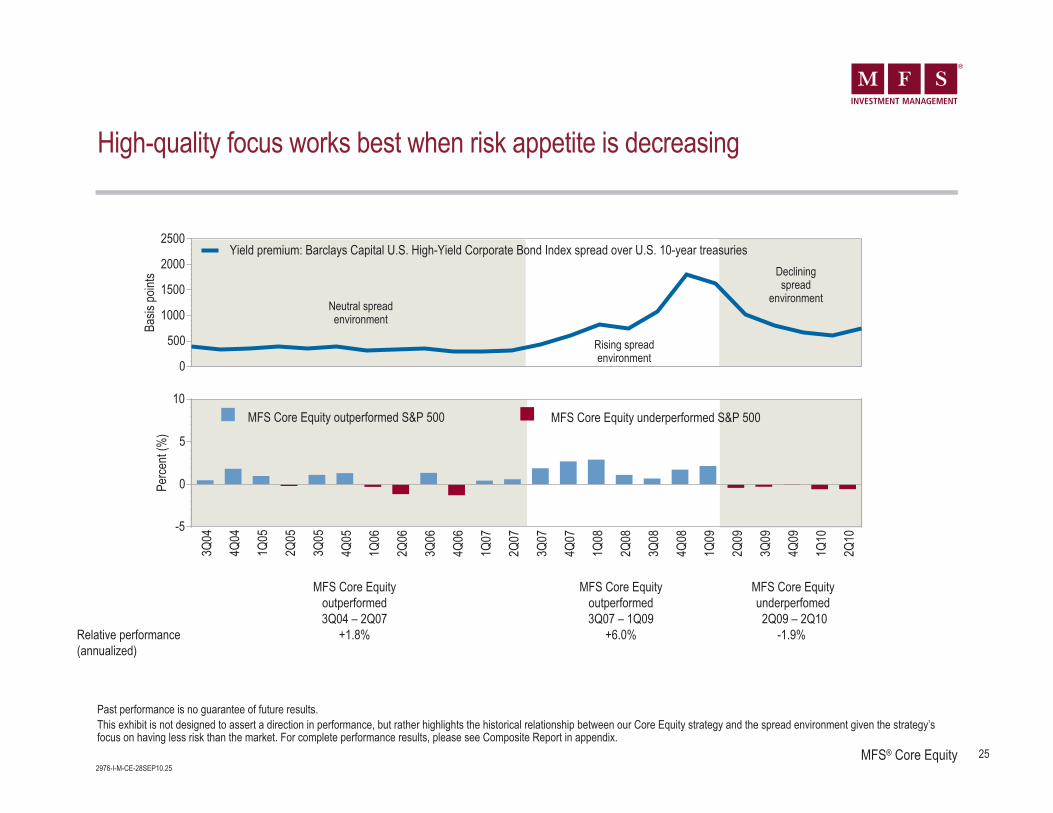
High-quality focus works best when risk appetite is decreasing
Past performance is no guarantee of future results.This exhibit is not designed to assert a direction in performance, but rather highlights the historical relationship between our Core Equity strategy and the spread environment given the strategy’sfocus on having less risk than the market. For complete performance results, please see Composite Report in appendix.
3Q04
4Q04
1Q05
2Q05
3Q05
4Q05
1Q06
2Q06
3Q06
4Q06
1Q07
2Q07
3Q07
4Q07
1Q08
2Q08
3Q08
4Q08
1Q09
2Q09
3Q09
4Q09
1Q10
2Q10
-5
0
5
10
Perce
nt (%
)
MFS Core Equity underperformed S&P 500
0
500
1000
1500
2000
2500
Basis
point
s
Yield premium: Barclays Capital U.S. High-Yield Corporate Bond Index spread over U.S. 10-year treasuries
MFS Core Equity MFS Core Equity MFS Core Equityoutperformed outperformed underperfomed
3Q04 – 2Q07 3Q07 – 1Q09 2Q09 – 2Q10Relative performance +1.8% +6.0% -1.9%(annualized)
Rising spreadenvironment
Decliningspread
environmentNeutral spreadenvironment
MFS Core Equity outperformed S&P 500

26MFS® Core Equity2976-I-M-CE-28SEP10.26
Performance drivers – sectorRelative to Russell 1000 – 5 years as of 30 June 2010
Average relative Sector Stock Relative weighting (%) selection (%) + selection (%) = contribution (%)
Contributors Consumer Staples 4.5 0.3 0.3 0.7Financial Services -1.1 0.1 0.4 0.5Industrial Goods & Services -1.3 0.0 0.4 0.4Energy -0.1 0.1 0.3 0.4Basic Materials 0.0 0.0 0.2 0.2Autos & Housing -0.8 0.1 0.1 0.2Special Products & Services 0.2 0.0 0.1 0.1Technology -0.4 0.0 0.0 0.1Retailing -0.1 0.0 0.1 0.1Cash 1.0 0.0 – 0.0
Detractors Health Care 2.2 0.0 -0.4 -0.4Leisure -0.9 0.0 -0.1 -0.2Utilities & Communications -2.4 -0.1 0.0 -0.1Transportation -1.0 0.0 0.0 0.0
Total 0.7 1.4 2.0
Attribution results are generated by the FactSet application utilizing a methodology which is widely accepted in the investment industry. Results are based upon daily holdings using a buy and holdmethodology to generate individual security returns and do not include expenses. As such, though generally accurate, attribution results are essentially estimates and not guaranteed to aggregate tothe total return of the portfolio or of the benchmark which can be found elsewhere in this presentation.
27MFS® Core Equity2976-I-M-CE-28SEP10.27
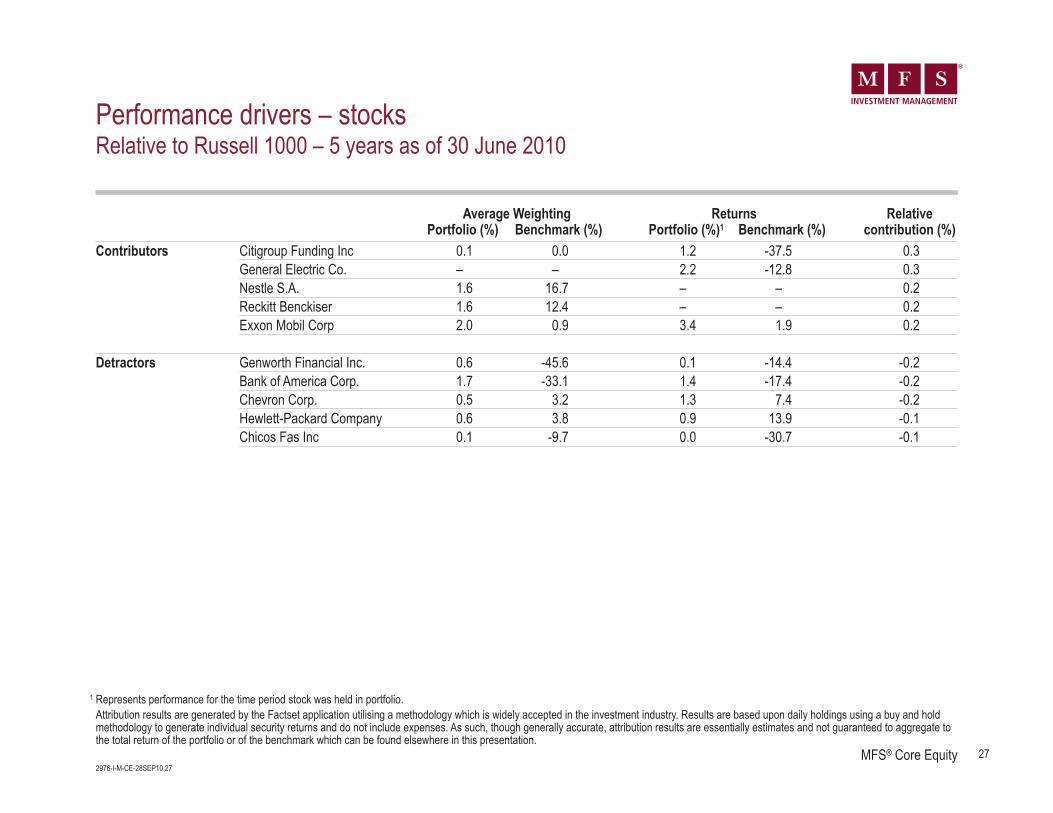
Performance drivers – stocksRelative to Russell 1000 – 5 years as of 30 June 2010
1 Represents performance for the time period stock was held in portfolio.Attribution results are generated by the Factset application utilising a methodology which is widely accepted in the investment industry. Results are based upon daily holdings using a buy and holdmethodology to generate individual security returns and do not include expenses. As such, though generally accurate, attribution results are essentially estimates and not guaranteed to aggregate tothe total return of the portfolio or of the benchmark which can be found elsewhere in this presentation.
Average Weighting Returns RelativePortfolio (%) Benchmark (%) Portfolio (%)1 Benchmark (%) contribution (%)
Contributors Citigroup Funding Inc 0.1 0.0 1.2 -37.5 0.3General Electric Co. – – 2.2 -12.8 0.3Nestle S.A. 1.6 16.7 – – 0.2Reckitt Benckiser 1.6 12.4 – – 0.2Exxon Mobil Corp 2.0 0.9 3.4 1.9 0.2
Detractors Genworth Financial Inc. 0.6 -45.6 0.1 -14.4 -0.2Bank of America Corp. 1.7 -33.1 1.4 -17.4 -0.2Chevron Corp. 0.5 3.2 1.3 7.4 -0.2Hewlett-Packard Company 0.6 3.8 0.9 13.9 -0.1Chicos Fas Inc 0.1 -9.7 0.0 -30.7 -0.1

28MFS® Core Equity2976-I-M-CE-28SEP10.28
Performance drivers – market capRelative to Russell 1000 – 5 years as of 30 June 2010
Average relative Sector Stock Relative weighting (%) selection (%) + selection (%) = contribution (%)
Contributors 100 Billion+ USD -0.8 0.0 0.9 1.010 - 50 Billion USD 10.8 0.1 0.5 0.60 - 1 Billion USD -0.8 0.3 0.1 0.41 - 5 Billion USD -8.1 0.4 -0.1 0.450 - 100 Billion USD 4.6 0.2 -0.1 0.2Cash 1.0 0.1 – 0.1
Detractors 5 - 10 Billion USD -2.8 0.0 -0.3 -0.3N/A -4.0 -0.2 -0.1 -0.2
Total 1.0 1.0 2.0
29MFS® Core Equity2976-I-M-CE-28SEP10.29
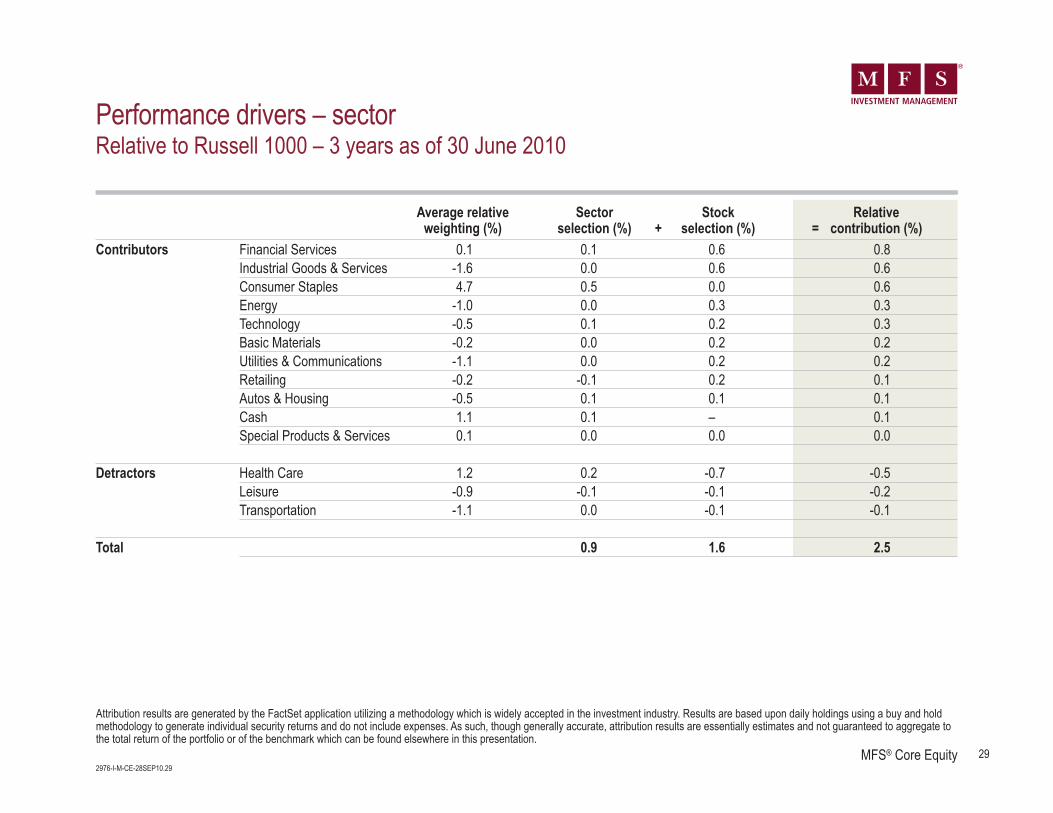
Performance drivers – sectorRelative to Russell 1000 – 3 years as of 30 June 2010
Average relative Sector Stock Relative weighting (%) selection (%) + selection (%) = contribution (%)
Contributors Financial Services 0.1 0.1 0.6 0.8Industrial Goods & Services -1.6 0.0 0.6 0.6Consumer Staples 4.7 0.5 0.0 0.6Energy -1.0 0.0 0.3 0.3Technology -0.5 0.1 0.2 0.3Basic Materials -0.2 0.0 0.2 0.2Utilities & Communications -1.1 0.0 0.2 0.2Retailing -0.2 -0.1 0.2 0.1Autos & Housing -0.5 0.1 0.1 0.1Cash 1.1 0.1 – 0.1Special Products & Services 0.1 0.0 0.0 0.0
Detractors Health Care 1.2 0.2 -0.7 -0.5Leisure -0.9 -0.1 -0.1 -0.2Transportation -1.1 0.0 -0.1 -0.1
Total 0.9 1.6 2.5
Attribution results are generated by the FactSet application utilizing a methodology which is widely accepted in the investment industry. Results are based upon daily holdings using a buy and holdmethodology to generate individual security returns and do not include expenses. As such, though generally accurate, attribution results are essentially estimates and not guaranteed to aggregate tothe total return of the portfolio or of the benchmark which can be found elsewhere in this presentation.
30MFS® Core Equity2976-I-M-CE-28SEP10.30
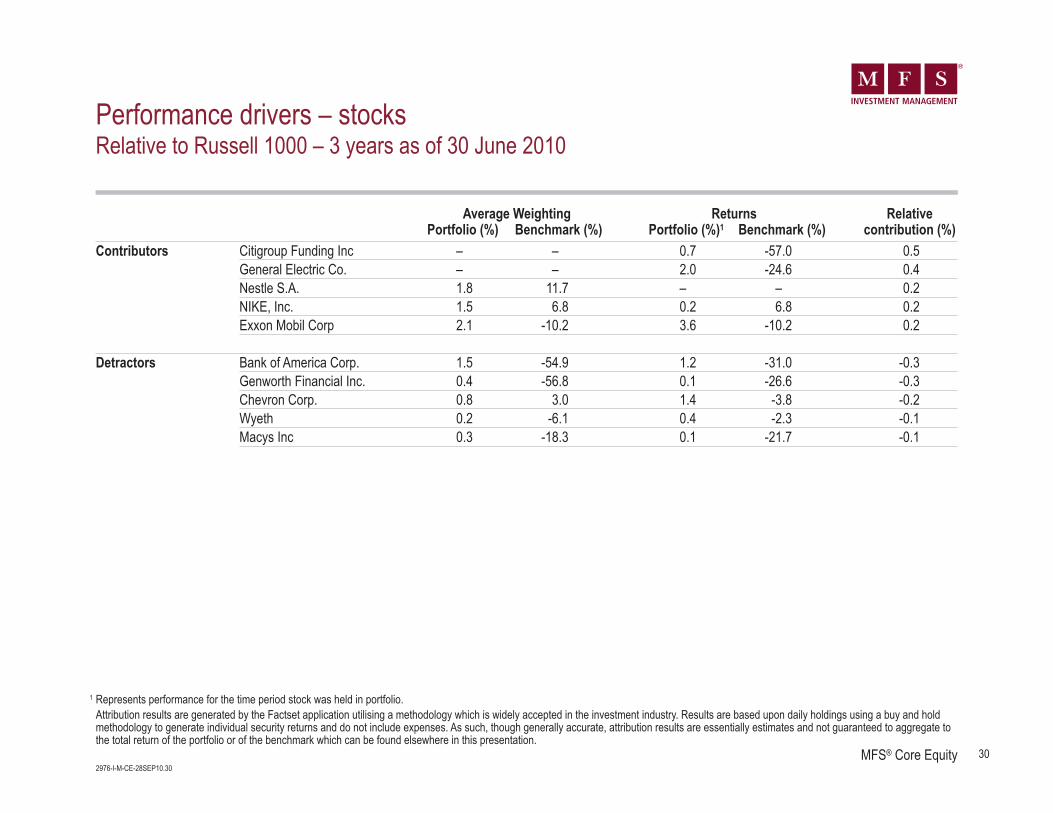
Performance drivers – stocksRelative to Russell 1000 – 3 years as of 30 June 2010
1 Represents performance for the time period stock was held in portfolio.Attribution results are generated by the Factset application utilising a methodology which is widely accepted in the investment industry. Results are based upon daily holdings using a buy and holdmethodology to generate individual security returns and do not include expenses. As such, though generally accurate, attribution results are essentially estimates and not guaranteed to aggregate tothe total return of the portfolio or of the benchmark which can be found elsewhere in this presentation.
Average Weighting Returns RelativePortfolio (%) Benchmark (%) Portfolio (%)1 Benchmark (%) contribution (%)
Contributors Citigroup Funding Inc – – 0.7 -57.0 0.5General Electric Co. – – 2.0 -24.6 0.4Nestle S.A. 1.8 11.7 – – 0.2NIKE, Inc. 1.5 6.8 0.2 6.8 0.2Exxon Mobil Corp 2.1 -10.2 3.6 -10.2 0.2
Detractors Bank of America Corp. 1.5 -54.9 1.2 -31.0 -0.3Genworth Financial Inc. 0.4 -56.8 0.1 -26.6 -0.3Chevron Corp. 0.8 3.0 1.4 -3.8 -0.2Wyeth 0.2 -6.1 0.4 -2.3 -0.1Macys Inc 0.3 -18.3 0.1 -21.7 -0.1

31MFS® Core Equity2976-I-M-CE-28SEP10.31
Performance drivers – market capRelative to Russell 1000 – 3 years as of 30 June 2010
Average relative Sector Stock Relative weighting (%) selection (%) + selection (%) = contribution (%)
Contributors 100 Billion+ USD 1.3 0.1 1.3 1.41 - 5 Billion USD -8.1 0.6 0.1 0.610 - 50 Billion USD 9.1 0.1 0.3 0.40 - 1 Billion USD -0.5 0.4 0.0 0.450 - 100 Billion USD 4.0 0.3 0.0 0.2Cash 1.1 0.1 – 0.1
Detractors 5 - 10 Billion USD -4.2 0.0 -0.3 -0.3N/A -2.7 -0.2 -0.1 -0.3
Total 1.3 1.2 2.5
32MFS® Core Equity2976-I-M-CE-28SEP10.32
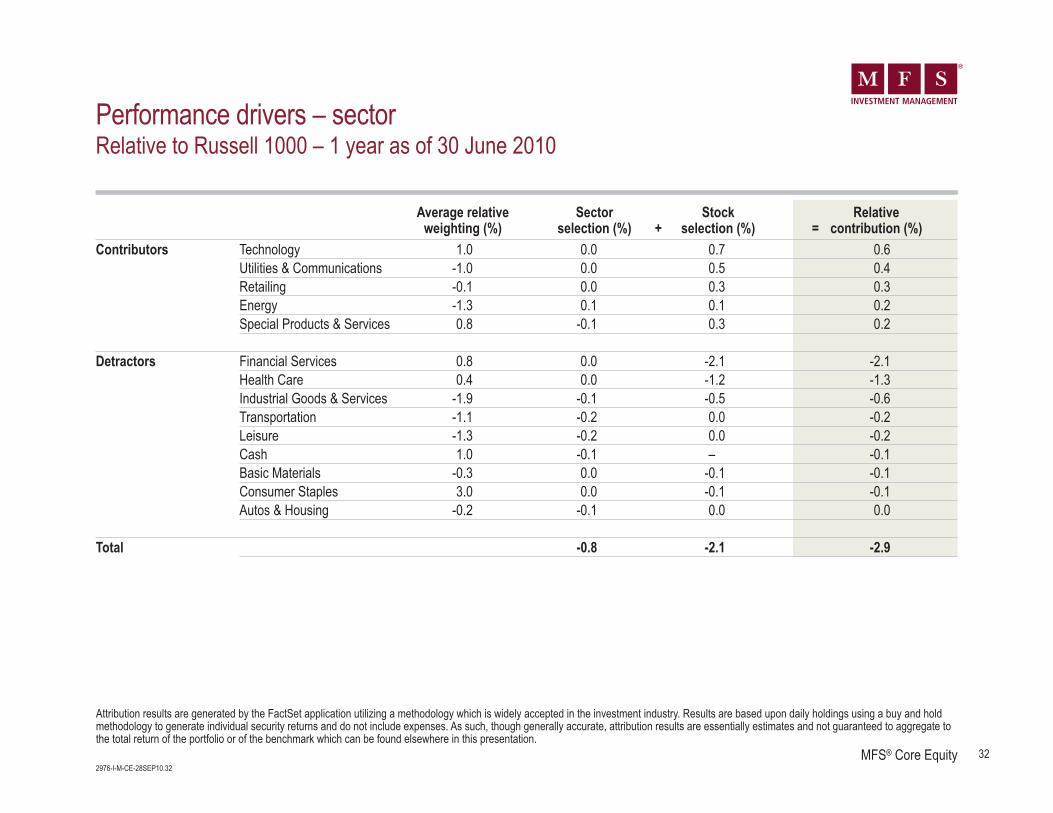
Performance drivers – sectorRelative to Russell 1000 – 1 year as of 30 June 2010
Average relative Sector Stock Relative weighting (%) selection (%) + selection (%) = contribution (%)
Contributors Technology 1.0 0.0 0.7 0.6Utilities & Communications -1.0 0.0 0.5 0.4Retailing -0.1 0.0 0.3 0.3Energy -1.3 0.1 0.1 0.2Special Products & Services 0.8 -0.1 0.3 0.2
Detractors Financial Services 0.8 0.0 -2.1 -2.1Health Care 0.4 0.0 -1.2 -1.3Industrial Goods & Services -1.9 -0.1 -0.5 -0.6Transportation -1.1 -0.2 0.0 -0.2Leisure -1.3 -0.2 0.0 -0.2Cash 1.0 -0.1 – -0.1Basic Materials -0.3 0.0 -0.1 -0.1Consumer Staples 3.0 0.0 -0.1 -0.1Autos & Housing -0.2 -0.1 0.0 0.0
Total -0.8 -2.1 -2.9
Attribution results are generated by the FactSet application utilizing a methodology which is widely accepted in the investment industry. Results are based upon daily holdings using a buy and holdmethodology to generate individual security returns and do not include expenses. As such, though generally accurate, attribution results are essentially estimates and not guaranteed to aggregate tothe total return of the portfolio or of the benchmark which can be found elsewhere in this presentation.
33MFS® Core Equity2976-I-M-CE-28SEP10.33
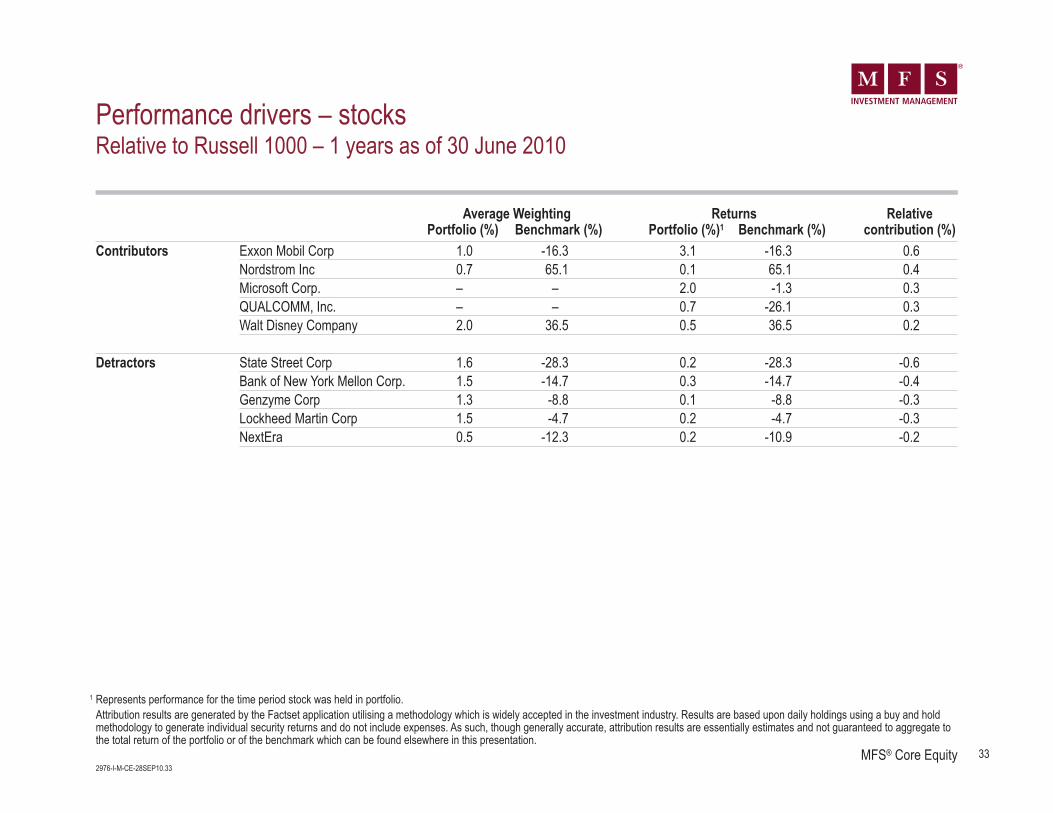
Performance drivers – stocksRelative to Russell 1000 – 1 years as of 30 June 2010
1 Represents performance for the time period stock was held in portfolio.Attribution results are generated by the Factset application utilising a methodology which is widely accepted in the investment industry. Results are based upon daily holdings using a buy and holdmethodology to generate individual security returns and do not include expenses. As such, though generally accurate, attribution results are essentially estimates and not guaranteed to aggregate tothe total return of the portfolio or of the benchmark which can be found elsewhere in this presentation.
Average Weighting Returns RelativePortfolio (%) Benchmark (%) Portfolio (%)1 Benchmark (%) contribution (%)
Contributors Exxon Mobil Corp 1.0 -16.3 3.1 -16.3 0.6Nordstrom Inc 0.7 65.1 0.1 65.1 0.4Microsoft Corp. – – 2.0 -1.3 0.3QUALCOMM, Inc. – – 0.7 -26.1 0.3Walt Disney Company 2.0 36.5 0.5 36.5 0.2
Detractors State Street Corp 1.6 -28.3 0.2 -28.3 -0.6Bank of New York Mellon Corp. 1.5 -14.7 0.3 -14.7 -0.4Genzyme Corp 1.3 -8.8 0.1 -8.8 -0.3Lockheed Martin Corp 1.5 -4.7 0.2 -4.7 -0.3NextEra 0.5 -12.3 0.2 -10.9 -0.2
34MFS® Core Equity2976-I-M-CE-28SEP10.34
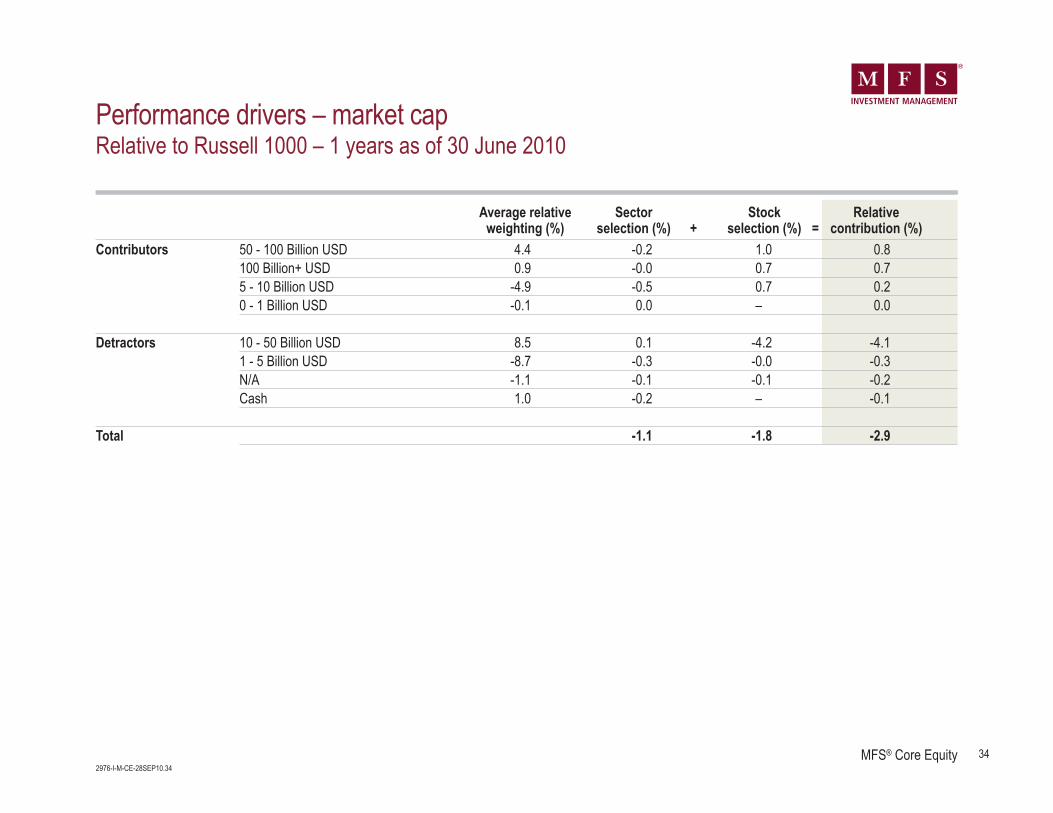
Performance drivers – market capRelative to Russell 1000 – 1 years as of 30 June 2010
Average relative Sector Stock Relative weighting (%) selection (%) + selection (%) = contribution (%)
Contributors 50 - 100 Billion USD 4.4 -0.2 1.0 0.8100 Billion+ USD 0.9 -0.0 0.7 0.75 - 10 Billion USD -4.9 -0.5 0.7 0.20 - 1 Billion USD -0.1 0.0 – 0.0
Detractors 10 - 50 Billion USD 8.5 0.1 -4.2 -4.11 - 5 Billion USD -8.7 -0.3 -0.0 -0.3N/A -1.1 -0.1 -0.1 -0.2Cash 1.0 -0.2 – -0.1
Total -1.1 -1.8 -2.9
35MFS® Core Equity2976-I-M-CE-28SEP10.35
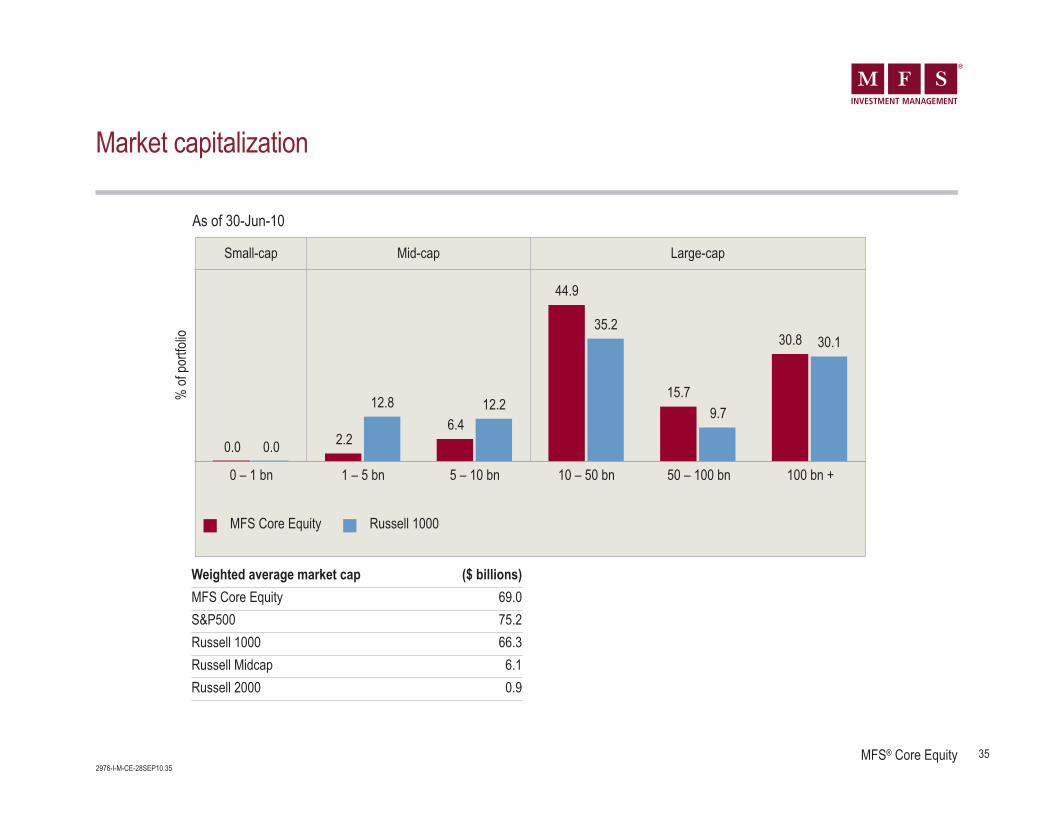
Market capitalization
As of 30-Jun-10
0 – 1 bn 1 – 5 bn 5 – 10 bn 10 – 50 bn 50 – 100 bn 100 bn +
% of
portf
olio
0.0 0.0 2.2
12.86.4
12.2
44.9
35.2
15.79.7
30.8 30.1
MFS Core Equity Russell 1000
Small-cap Mid-cap Large-cap
Weighted average market cap ($ billions)MFS Core Equity 69.0S&P500 75.2Russell 1000 66.3Russell Midcap 6.1Russell 2000 0.9
36MFS® Core Equity2976-I-M-CE-28SEP10.36
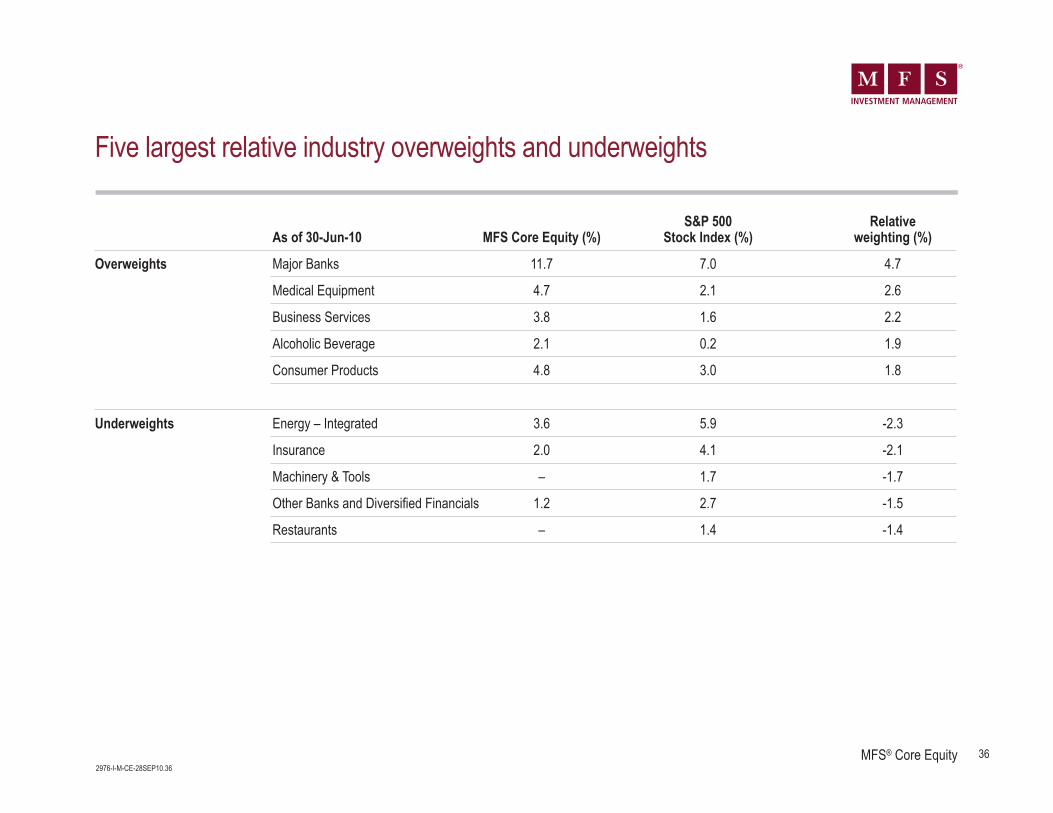
Five largest relative industry overweights and underweights
S&P 500 RelativeAs of 30-Jun-10 MFS Core Equity (%) Stock Index (%) weighting (%)
Overweights Major Banks 11.7 7.0 4.7
Medical Equipment 4.7 2.1 2.6
Business Services 3.8 1.6 2.2
Alcoholic Beverage 2.1 0.2 1.9
Consumer Products 4.8 3.0 1.8
Underweights Energy – Integrated 3.6 5.9 -2.3
Insurance 2.0 4.1 -2.1
Machinery & Tools – 1.7 -1.7
Other Banks and Diversified Financials 1.2 2.7 -1.5
Restaurants – 1.4 -1.4
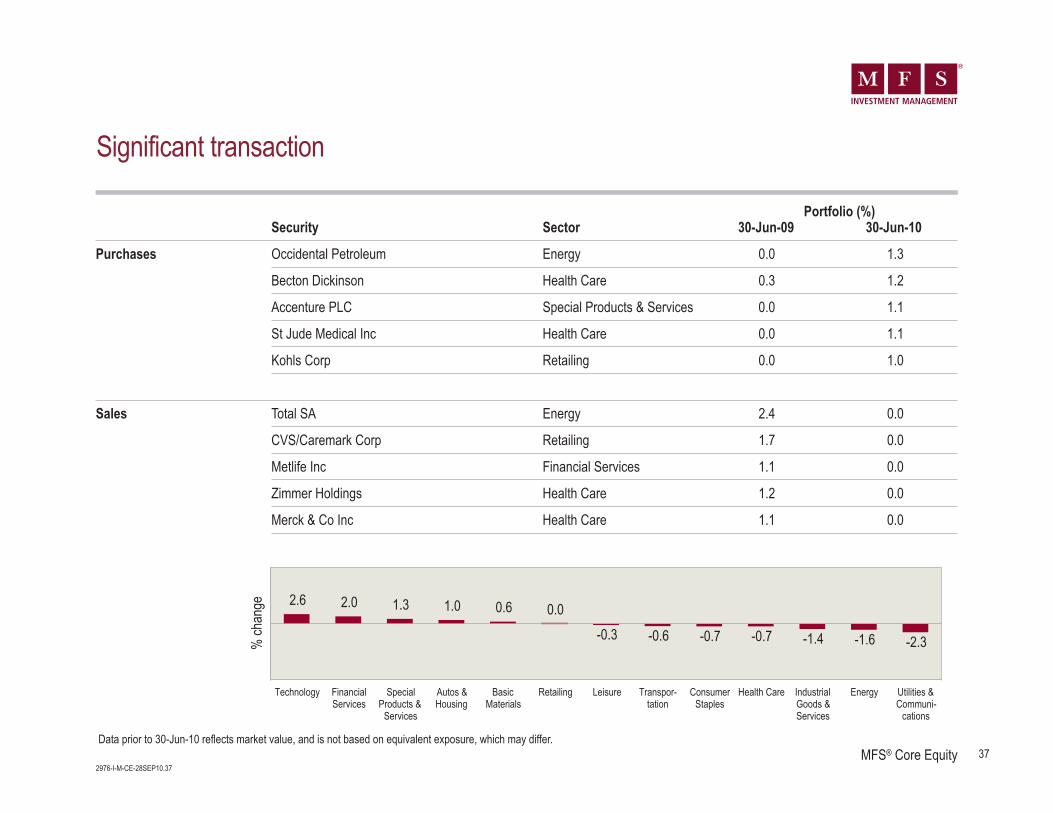
Portfolio (%)Security Sector 30-Jun-09 30-Jun-10
Purchases Occidental Petroleum Energy 0.0 1.3
Becton Dickinson Health Care 0.3 1.2
Accenture PLC Special Products & Services 0.0 1.1
St Jude Medical Inc Health Care 0.0 1.1
Kohls Corp Retailing 0.0 1.0
Sales Total SA Energy 2.4 0.0
CVS/Caremark Corp Retailing 1.7 0.0
Metlife Inc Financial Services 1.1 0.0
Zimmer Holdings Health Care 1.2 0.0
Merck & Co Inc Health Care 1.1 0.0
Technology FinancialServices
SpecialProducts &
Services
Autos &Housing
BasicMaterials
Retailing Leisure Transpor-tation
ConsumerStaples
Health Care IndustrialGoods &Services
Energy Utilities &Communi-
cations
% ch
ange 2.6 2.0 1.3 1.0 0.6 0.0
-0.3 -0.6 -0.7 -0.7 -1.4 -1.6 -2.3
37MFS® Core Equity2976-I-M-CE-28SEP10.37
Significant transaction
Data prior to 30-Jun-10 reflects market value, and is not based on equivalent exposure, which may differ.
38MFS® Core Equity2976-I-M-CE-28SEP10.38
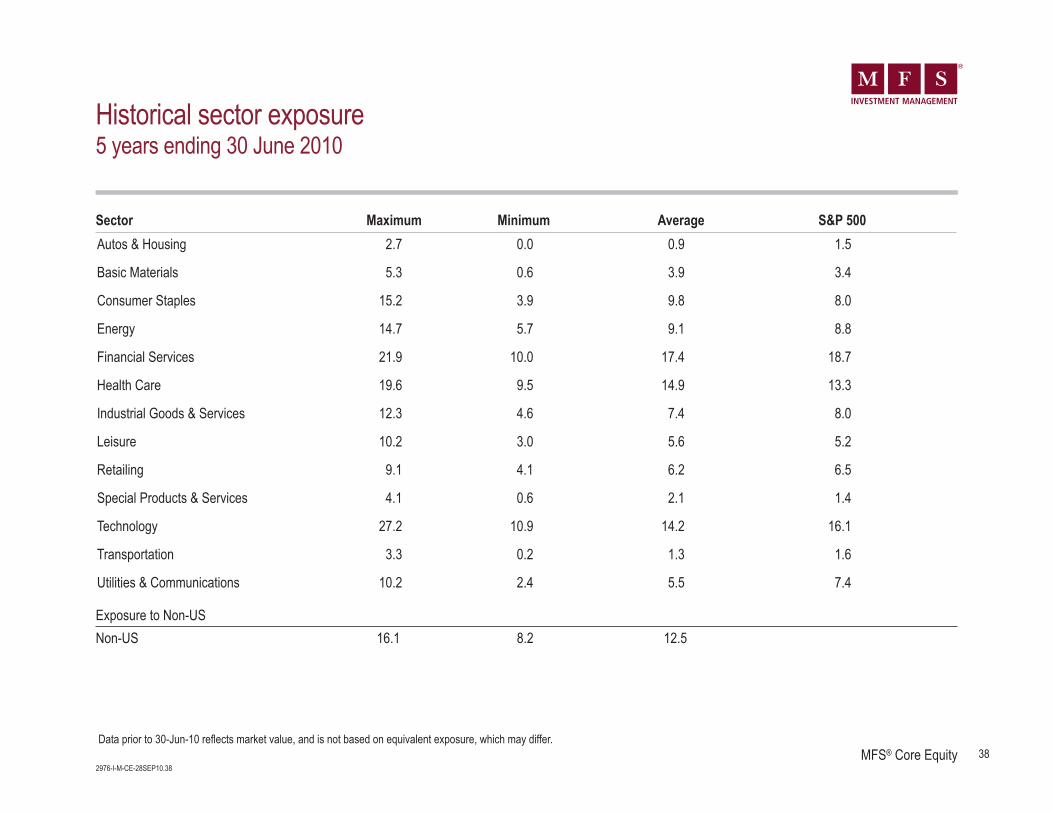
Historical sector exposure5 years ending 30 June 2010
Autos & Housing 2.7 0.0 0.9 1.5
Basic Materials 5.3 0.6 3.9 3.4
Consumer Staples 15.2 3.9 9.8 8.0
Energy 14.7 5.7 9.1 8.8
Financial Services 21.9 10.0 17.4 18.7
Health Care 19.6 9.5 14.9 13.3
Industrial Goods & Services 12.3 4.6 7.4 8.0
Leisure 10.2 3.0 5.6 5.2
Retailing 9.1 4.1 6.2 6.5
Special Products & Services 4.1 0.6 2.1 1.4
Technology 27.2 10.9 14.2 16.1
Transportation 3.3 0.2 1.3 1.6
Utilities & Communications 10.2 2.4 5.5 7.4
Sector Maximum Minimum Average S&P 500
Exposure to Non-USNon-US 16.1 8.2 12.5
Data prior to 30-Jun-10 reflects market value, and is not based on equivalent exposure, which may differ.
39MFS® Core Equity2976-I-M-CE-28SEP10.39
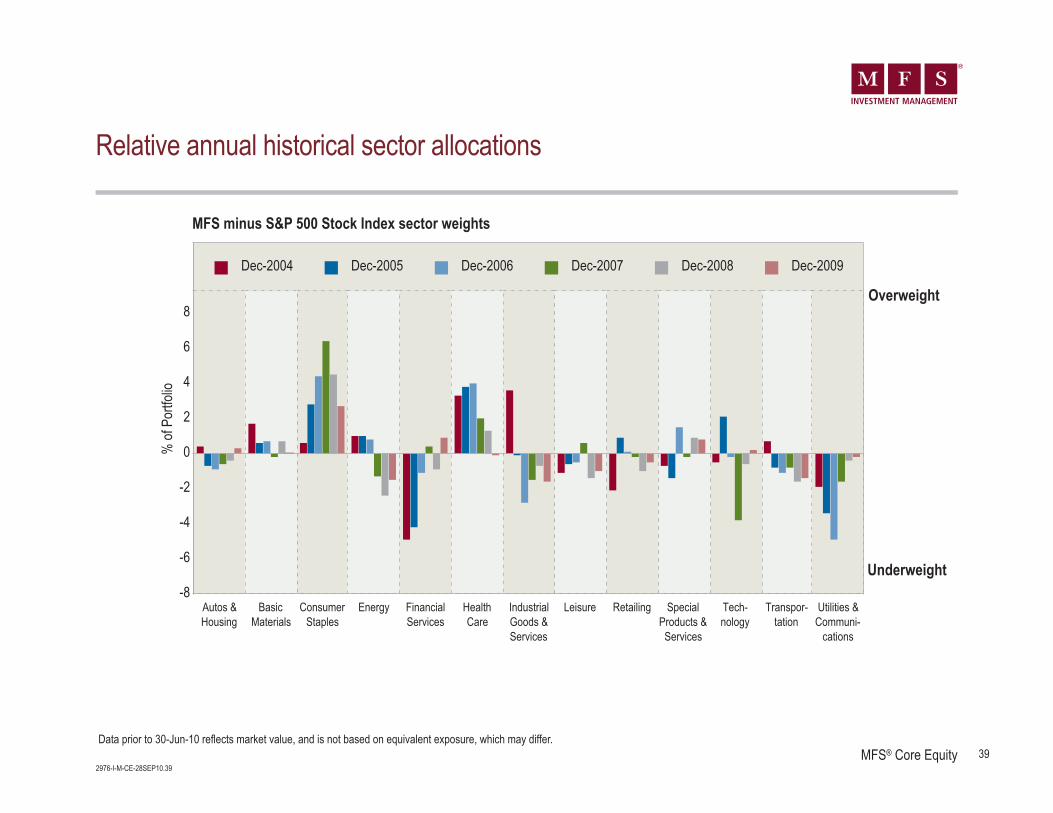
Relative annual historical sector allocations
MFS minus S&P 500 Stock Index sector weights
Autos &Housing
BasicMaterials
ConsumerStaples
Energy FinancialServices
HealthCare
IndustrialGoods &Services
Leisure Retailing SpecialProducts &Services
Tech-nology
Transpor-tation
Utilities &Communi-
cations
-8
-6
-4
-2
0
2
4
6
8
10
12
% of
Por
tfolio
Dec-2004 Dec-2005 Dec-2006 Dec-2007 Dec-2008 Dec-2009
Overweight
Underweight
Data prior to 30-Jun-10 reflects market value, and is not based on equivalent exposure, which may differ.
40MFS® Core Equity2976-I-M-CE-28SEP10.40
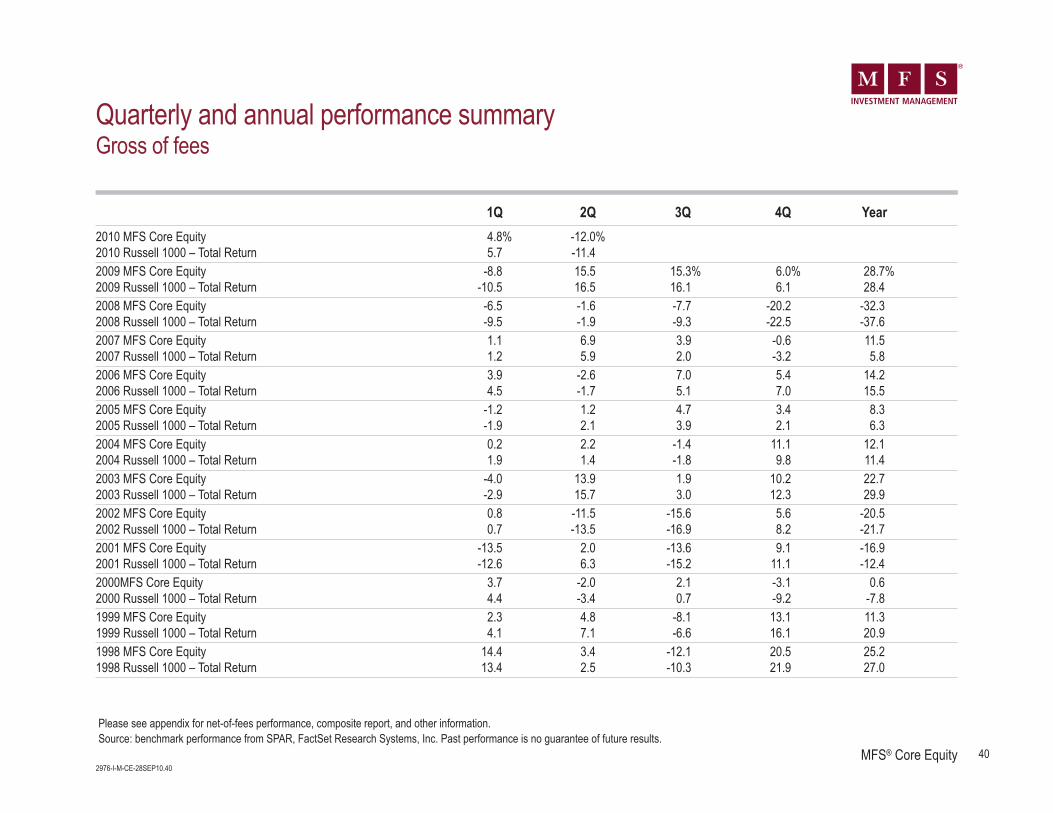
Please see appendix for net-of-fees performance, composite report, and other information. Source: benchmark performance from SPAR, FactSet Research Systems, Inc. Past performance is no guarantee of future results.
Quarterly and annual performance summaryGross of fees
1Q 2Q 3Q 4Q Year2010 MFS Core Equity 4.8% -12.0%2010 Russell 1000 – Total Return 5.7 -11.42009 MFS Core Equity -8.8 15.5 15.3% 6.0% 28.7%2009 Russell 1000 – Total Return -10.5 16.5 16.1 6.1 28.42008 MFS Core Equity -6.5 -1.6 -7.7 -20.2 -32.32008 Russell 1000 – Total Return -9.5 -1.9 -9.3 -22.5 -37.62007 MFS Core Equity 1.1 6.9 3.9 -0.6 11.52007 Russell 1000 – Total Return 1.2 5.9 2.0 -3.2 5.82006 MFS Core Equity 3.9 -2.6 7.0 5.4 14.22006 Russell 1000 – Total Return 4.5 -1.7 5.1 7.0 15.52005 MFS Core Equity -1.2 1.2 4.7 3.4 8.32005 Russell 1000 – Total Return -1.9 2.1 3.9 2.1 6.32004 MFS Core Equity 0.2 2.2 -1.4 11.1 12.12004 Russell 1000 – Total Return 1.9 1.4 -1.8 9.8 11.42003 MFS Core Equity -4.0 13.9 1.9 10.2 22.72003 Russell 1000 – Total Return -2.9 15.7 3.0 12.3 29.92002 MFS Core Equity 0.8 -11.5 -15.6 5.6 -20.52002 Russell 1000 – Total Return 0.7 -13.5 -16.9 8.2 -21.72001 MFS Core Equity -13.5 2.0 -13.6 9.1 -16.92001 Russell 1000 – Total Return -12.6 6.3 -15.2 11.1 -12.42000MFS Core Equity 3.7 -2.0 2.1 -3.1 0.62000 Russell 1000 – Total Return 4.4 -3.4 0.7 -9.2 -7.81999 MFS Core Equity 2.3 4.8 -8.1 13.1 11.31999 Russell 1000 – Total Return 4.1 7.1 -6.6 16.1 20.91998 MFS Core Equity 14.4 3.4 -12.1 20.5 25.21998 Russell 1000 – Total Return 13.4 2.5 -10.3 21.9 27.0
41MFS® Core Equity2976-I-M-CE-28SEP10.41
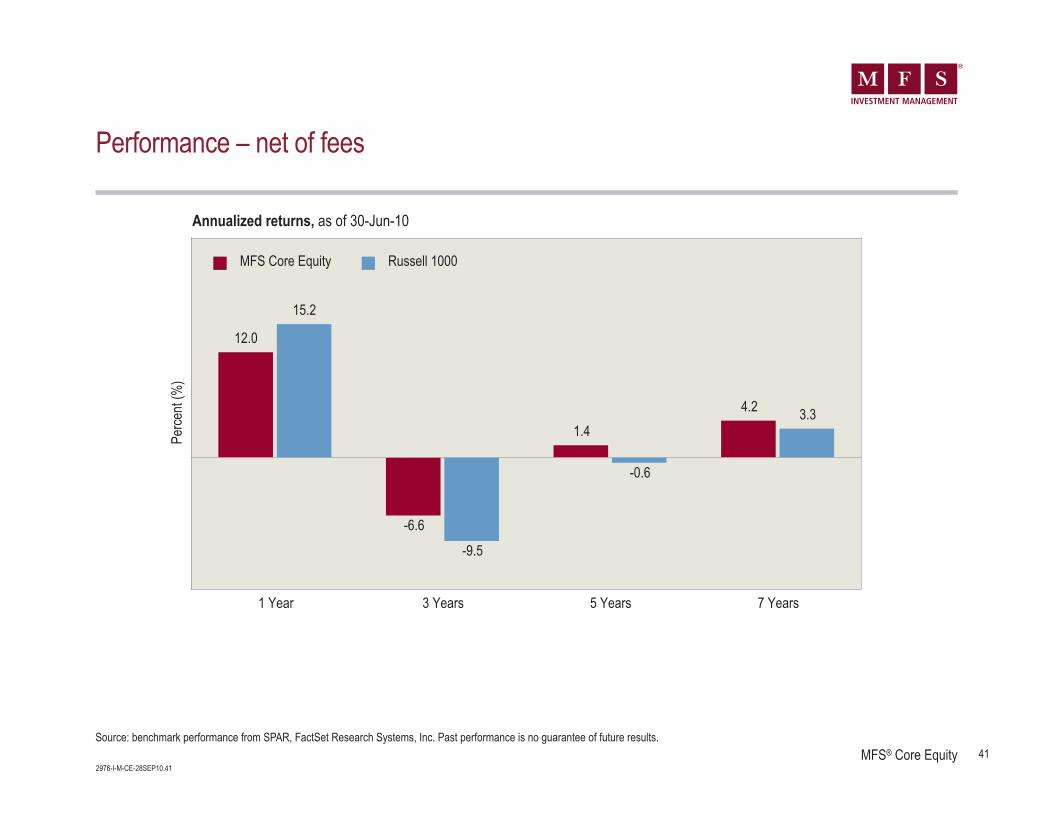
Performance – net of fees
Annualized returns, as of 30-Jun-10
Source: benchmark performance from SPAR, FactSet Research Systems, Inc. Past performance is no guarantee of future results.
1 Year 3 Years 5 Years 7 Years
Perce
nt (%
)
12.0
15.2
-6.6-9.5
1.4
-0.6
4.2 3.3
MFS Core Equity Russell 1000
42MFS® Core Equity2976-I-M-CE-28SEP10.42
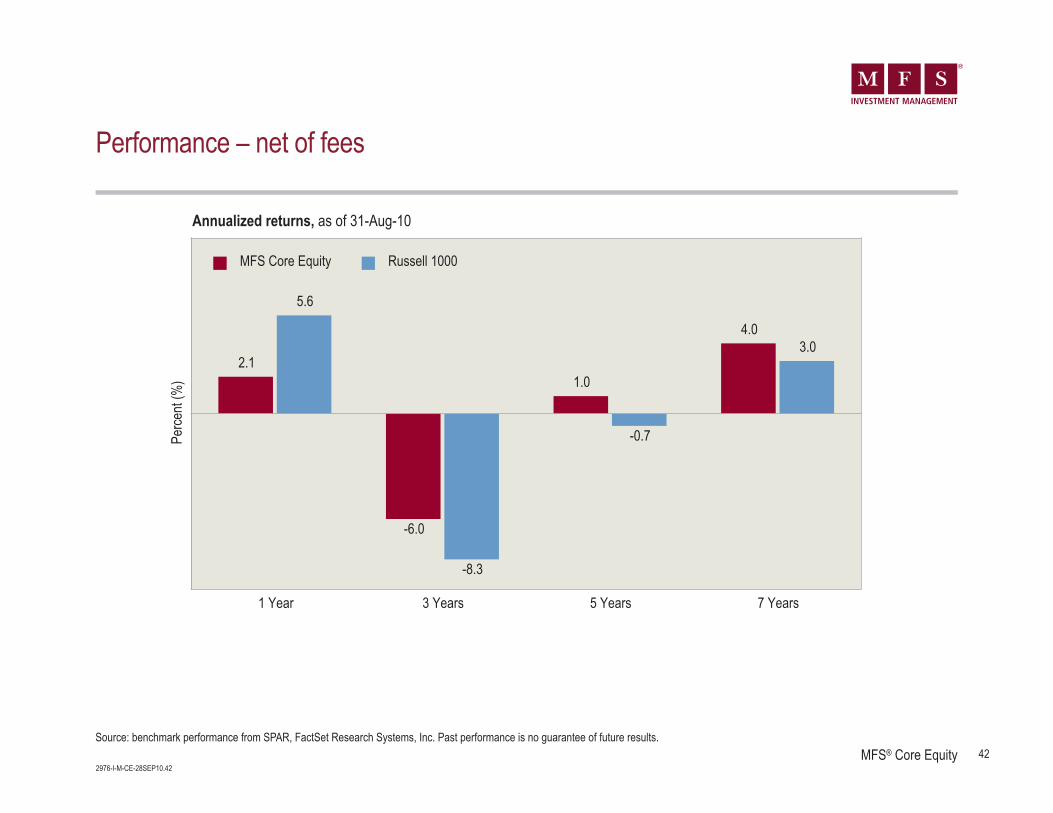
Annualized returns, as of 31-Aug-10
Source: benchmark performance from SPAR, FactSet Research Systems, Inc. Past performance is no guarantee of future results.
1 Year 3 Years 5 Years 7 Years
Perce
nt (%
)
2.1
5.6
-6.0
-8.3
1.0
-0.7
4.03.0
MFS Core Equity Russell 1000
Performance – net of fees
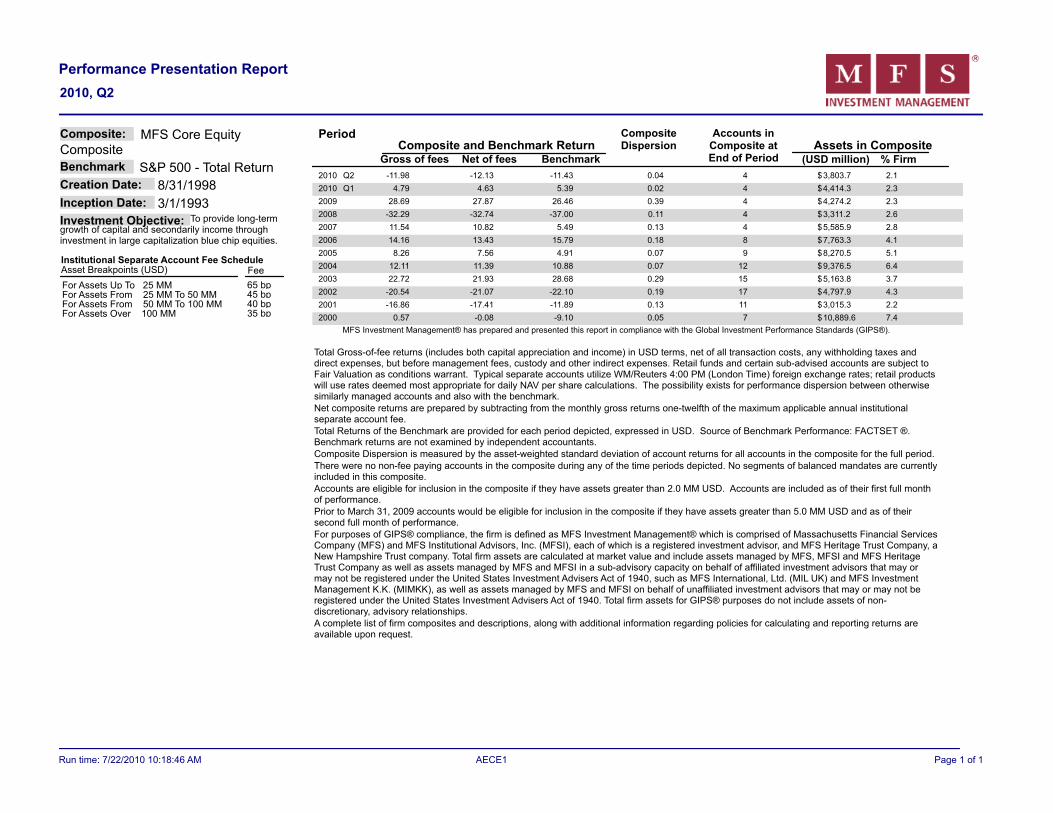
Accounts inComposite atEnd of PeriodGross of fees Net of fees Benchmark
Period CompositeDispersion Assets in CompositeComposite and Benchmark Return
(USD million) % Firm
3,803.74-11.98 -12.13Q22010 -11.43 $ 2.10.04
4,414.344.79 4.63Q12010 5.39 $ 2.30.02
4,274.2428.69 27.872009 26.46 $ 2.30.39
3,311.24-32.29 -32.742008 -37.00 $ 2.60.11
5,585.9411.54 10.822007 5.49 $ 2.80.13
7,763.3814.16 13.432006 15.79 $ 4.10.18
8,270.598.26 7.562005 4.91 $ 5.10.07
9,376.51212.11 11.392004 10.88 $ 6.40.07
5,163.81522.72 21.932003 28.68 $ 3.70.29
4,797.917-20.54 -21.072002 -22.10 $ 4.30.19
3,015.311-16.86 -17.412001 -11.89 $ 2.20.13
10,889.670.57 -0.082000 -9.10 $ 7.40.05
MFS Investment Management® has prepared and presented this report in compliance with the Global Investment Performance Standards (GIPS®).
Total Gross-of-fee returns (includes both capital appreciation and income) in USD terms, net of all transaction costs, any withholding taxes anddirect expenses, but before management fees, custody and other indirect expenses. Retail funds and certain sub-advised accounts are subject toFair Valuation as conditions warrant. Typical separate accounts utilize WM/Reuters 4:00 PM (London Time) foreign exchange rates; retail productswill use rates deemed most appropriate for daily NAV per share calculations. The possibility exists for performance dispersion between otherwisesimilarly managed accounts and also with the benchmark.Net composite returns are prepared by subtracting from the monthly gross returns one-twelfth of the maximum applicable annual institutionalseparate account fee.Total Returns of the Benchmark are provided for each period depicted, expressed in USD. Source of Benchmark Performance: FACTSET ®.Benchmark returns are not examined by independent accountants.Composite Dispersion is measured by the asset-weighted standard deviation of account returns for all accounts in the composite for the full period.There were no non-fee paying accounts in the composite during any of the time periods depicted. No segments of balanced mandates are currentlyincluded in this composite.Accounts are eligible for inclusion in the composite if they have assets greater than 2.0 MM USD. Accounts are included as of their first full monthof performance.Prior to March 31, 2009 accounts would be eligible for inclusion in the composite if they have assets greater than 5.0 MM USD and as of theirsecond full month of performance.For purposes of GIPS® compliance, the firm is defined as MFS Investment Management® which is comprised of Massachusetts Financial ServicesCompany (MFS) and MFS Institutional Advisors, Inc. (MFSI), each of which is a registered investment advisor, and MFS Heritage Trust Company, aNew Hampshire Trust company. Total firm assets are calculated at market value and include assets managed by MFS, MFSI and MFS HeritageTrust Company as well as assets managed by MFS and MFSI in a sub-advisory capacity on behalf of affiliated investment advisors that may ormay not be registered under the United States Investment Advisers Act of 1940, such as MFS International, Ltd. (MIL UK) and MFS InvestmentManagement K.K. (MIMKK), as well as assets managed by MFS and MFSI on behalf of unaffiliated investment advisors that may or may not beregistered under the United States Investment Advisers Act of 1940. Total firm assets for GIPS® purposes do not include assets of non-discretionary, advisory relationships.A complete list of firm composites and descriptions, along with additional information regarding policies for calculating and reporting returns areavailable upon request.
S&P 500 - Total Return
MFS Core EquityCompositeComposite:
Investment Objective: To provide long-termgrowth of capital and secondarily income throughinvestment in large capitalization blue chip equities.
Creation Date:
Benchmark
8/31/1998
Inception Date: 3/1/1993
Institutional Separate Account Fee ScheduleAsset Breakpoints (USD) Fee
For Assets Up To 25 MM 65 bpFor Assets From 25 MM To 50 MM 45 bpFor Assets From 50 MM To 100 MM 40 bpFor Assets Over 100 MM 35 bp
Performance Presentation Report
2010, Q2
Page 1 of 1AECE1Run time: 7/22/2010 10:18:46 AM