Embed Size (px)
Citation preview
MICHIGAN PUBLIC SCHOOL EMPLOYEES’ RETIREMENT SYSTEM ● 1
MICHIGAN PUBLIC SCHOOL EMPLOYEES’ RETIREMENT SYSTEM
A Pension and Other Employee Benefit Trust Fund of the State of Michigan
Comprehensive Annual Financial Report for the Fiscal Year Ended September 30, 2016
M P S E R S
Prepared by: Financial Services
for Office of Retirement Services
P.O. Box 30171 Lansing, Michigan 48909-7671
517-322-5103 1-800-381-5111
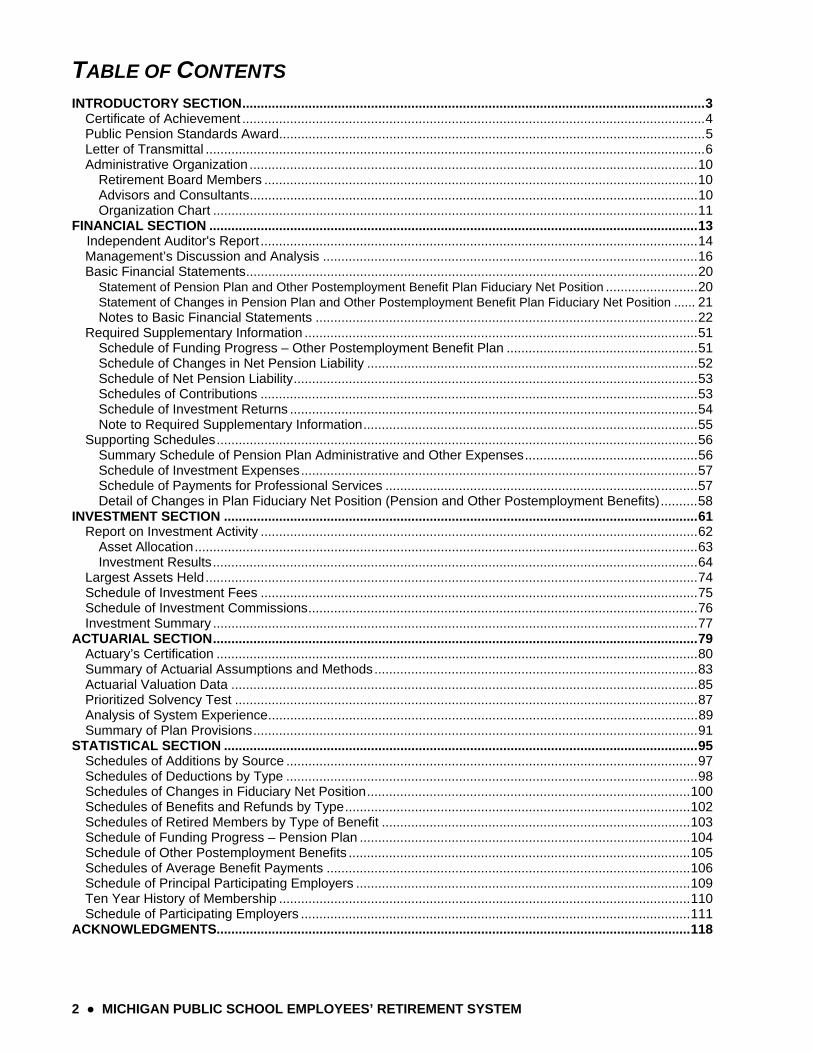
TABLE OF CONTENTS
2 ● MICHIGAN PUBLIC SCHOOL EMPLOYEES’ RETIREMENT SYSTEM
INTRODUCTORY SECTION .............................................................................................................................. 3 Certificate of Achievement .............................................................................................................................. 4 Public Pension Standards Award .................................................................................................................... 5 Letter of Transmittal ........................................................................................................................................ 6 Administrative Organization .......................................................................................................................... 10
Retirement Board Members ...................................................................................................................... 10 Advisors and Consultants .......................................................................................................................... 10 Organization Chart .................................................................................................................................... 11
FINANCIAL SECTION ..................................................................................................................................... 13 Independent Auditor's Report ....................................................................................................................... 14
Management’s Discussion and Analysis ...................................................................................................... 16 Basic Financial Statements ........................................................................................................................... 20
Statement of Pension Plan and Other Postemployment Benefit Plan Fiduciary Net Position ......................... 20 Statement of Changes in Pension Plan and Other Postemployment Benefit Plan Fiduciary Net Position ...... 21 Notes to Basic Financial Statements ........................................................................................................ 22
Required Supplementary Information ........................................................................................................... 51 Schedule of Funding Progress – Other Postemployment Benefit Plan .................................................... 51 Schedule of Changes in Net Pension Liability .......................................................................................... 52 Schedule of Net Pension Liability .............................................................................................................. 53 Schedules of Contributions ....................................................................................................................... 53 Schedule of Investment Returns ............................................................................................................... 54 Note to Required Supplementary Information ........................................................................................... 55
Supporting Schedules ................................................................................................................................... 56 Summary Schedule of Pension Plan Administrative and Other Expenses ............................................... 56 Schedule of Investment Expenses ............................................................................................................ 57 Schedule of Payments for Professional Services ..................................................................................... 57 Detail of Changes in Plan Fiduciary Net Position (Pension and Other Postemployment Benefits) .......... 58
INVESTMENT SECTION ................................................................................................................................. 61 Report on Investment Activity ....................................................................................................................... 62
Asset Allocation ......................................................................................................................................... 63 Investment Results .................................................................................................................................... 64
Largest Assets Held ...................................................................................................................................... 74 Schedule of Investment Fees ....................................................................................................................... 75 Schedule of Investment Commissions .......................................................................................................... 76 Investment Summary .................................................................................................................................... 77
ACTUARIAL SECTION .................................................................................................................................... 79 Actuary’s Certification ................................................................................................................................... 80 Summary of Actuarial Assumptions and Methods ........................................................................................ 83 Actuarial Valuation Data ............................................................................................................................... 85 Prioritized Solvency Test .............................................................................................................................. 87 Analysis of System Experience ..................................................................................................................... 89 Summary of Plan Provisions ......................................................................................................................... 91
STATISTICAL SECTION ................................................................................................................................. 95 Schedules of Additions by Source ................................................................................................................ 97 Schedules of Deductions by Type ................................................................................................................ 98 Schedules of Changes in Fiduciary Net Position ........................................................................................ 100 Schedules of Benefits and Refunds by Type .............................................................................................. 102 Schedules of Retired Members by Type of Benefit .................................................................................... 103 Schedule of Funding Progress – Pension Plan .......................................................................................... 104 Schedule of Other Postemployment Benefits ............................................................................................. 105 Schedules of Average Benefit Payments ................................................................................................... 106 Schedule of Principal Participating Employers ........................................................................................... 109 Ten Year History of Membership ................................................................................................................ 110 Schedule of Participating Employers .......................................................................................................... 111
ACKNOWLEDGMENTS................................................................................................................................. 118

MICHIGAN PUBLIC SCHOOL EMPLOYEES’ RETIREMENT SYSTEM ● 3
INTRODUCTORY SECTION
Certificate of Achievement Public Pension Standards Award
Letter of Transmittal Retirement Board Members
Advisors and Consultants Organization Chart

INTRODUCTORY SECTION
4 ● MICHIGAN PUBLIC SCHOOL EMPLOYEES’ RETIREMENT SYSTEM
Certificate of Achievement

INTRODUCTORY SECTION
MICHIGAN PUBLIC SCHOOL EMPLOYEES’ RETIREMENT SYSTEM ● 5
Public Pension Standards Award

INTRODUCTORY SECTION
6 ● MICHIGAN PUBLIC SCHOOL EMPLOYEES’ RETIREMENT SYSTEM
Letter of Transmittal
Michigan Public School Employees’ Retirement System P.O. Box 30171 Lansing, Michigan 48909-7671 Telephone 517- 322-5103 Outside Lansing 1-800-381-5111
STATE OF MICHIGAN
RICK SNYDER, Governor
DEPARTMENT OF TECHNOLOGY, MANAGEMENT & BUDGET January 11, 2017 The Honorable Rick Snyder Governor, State of Michigan, Members of the Legislature State of Michigan, Retirement Board Members and Members, Retirees and Beneficiaries Ladies and Gentlemen:
We are pleased to present the comprehensive annual financial report of the Michigan Public School Employees’ Retirement System (System) for fiscal year 2016.
INTRODUCTION TO REPORT
The System was established by legislation under Public Act 136 of 1945, and is administered by the Office of Retirement Services (ORS). The number of active and retired members and beneficiaries of the System is presented in Note 1 of the financial statements in the Financial Section of this report. The purpose of the System is to provide benefits for all public school employees. The services performed by ORS staff provide benefits to members.
Responsibility
Responsibility for both the accuracy of the data and the completeness and fairness of the presentation, including all disclosures, rests with the leadership team of the System. To the best of our knowledge and belief, the enclosed data is accurate in all material respects and is reported in a manner designed to present fairly the financial position and results of operations of the System.
Internal Control Structure
The leadership team of the System is responsible for maintaining adequate internal accounting controls designed to provide reasonable assurance that transactions are executed in accordance with management’s general or specific authorization, and are recorded as necessary to maintain accountability for assets and to permit preparation of financial statements in accordance with accounting principles generally accepted in the
INTRODUCTORY SECTION
Letter of Transmittal (Continued)
MICHIGAN PUBLIC SCHOOL EMPLOYEES’ RETIREMENT SYSTEM ● 7
United States of America. The internal control structure is designed to provide reasonable assurance regarding the safekeeping of assets and reliability of all financial records.
The concept of reasonable assurance recognizes that the cost of a control should not exceed the benefits likely to be derived and that the valuation of costs and benefits requires estimates and judgments by management. This internal control structure includes maintaining written policies and procedures. Discussion and analysis of fiduciary net position and related additions and deductions are presented in the Management Discussion and Analysis which can be found immediately following the Independent Auditor’s Report.
Independent Auditors and Actuary
The Office of the Auditor General (OAG), independent auditors, conducted an annual audit of the System. The independent auditor’s report on the System’s financial statements is included in the Financial Section of this report.
Statute requires that an annual actuarial valuation be conducted. The purpose of the valuation is to evaluate the mortality, service, compensation and other financial experience of the System and to recommend employer-funding rates for the subsequent year. The annual actuarial valuation was completed by Gabriel Roeder Smith & Company for the fiscal year ended September 30, 2015. Actuarial certification and supporting statistics are included in the Actuarial Section of this report.
Management’s Discussion and Analysis (MD&A)
Generally Accepted Accounting Principles (GAAP) require that management provide a narrative introduction, overview, and analysis to accompany the Basic Financial Statements in the form of MD&A. This letter of transmittal is intended to complement MD&A and should be read in conjunction with it. The MD&A can be found immediately following the Independent Auditor’s Report.
PROFILE OF THE GOVERNMENT
In accordance with Public Act 300 of 1980, on October 31, 1980, the Public School Employees’ Chapter I Retirement Fund merged with the Public School Employees’ Chapter II Retirement Fund to establish the Public School Employees’ Retirement System. Public Acts 136 of 1945 and 259 of 1974, respectively, created the two original funds. A twelve-member board governs administrative policy.
Employee contributions, employer contributions, and investment earnings provide financing for the System. Under Public Act 91 of 1985, employees may contribute additional amounts into a “member investment plan.” Public Act 75 of 2010 established a new Pension Plus plan which provides all individuals hired on or after July 1, 2010, with a combined Defined Benefit and Defined Contribution benefit structure. PA 300 of 2012 granted active members a voluntary election regarding their pension. Under the reform, members voluntarily chose to increase, maintain, or stop their contributions to the pension fund by remaining in the hybrid plan or choosing the defined contribution plan.
ECONOMIC CONDITIONS AND OUTLOOK
Despite challenging economic times, the System continues to show steady performance over the long-term.
Investments
The State Treasurer is the investment fiduciary and custodian of all investments of the System pursuant to State law. The primary investment objective is to maximize the rate of return on the total investment portfolio, consistent with a high degree of prudence and sufficient diversity to eliminate inordinate risks and to meet the actuarial assumption for the investment return rate. The investment activity for the year produced a total rate of return on the portfolio of 7.6% for the Pension and Other Postemployment Benefits (OPEB) Plans. For the last five years, the System has experienced an annualized rate of return of 10.2% for the Pension Plan and 10.1% for the Other Postemployment Benefits (OPEB) Plan. A summary of asset allocation and rates of return can be found in the Investment Section of this report.
INTRODUCTORY SECTION
Letter of Transmittal (Continued)
8 ● MICHIGAN PUBLIC SCHOOL EMPLOYEES’ RETIREMENT SYSTEM
Accounting System
Transactions of the System are reported on the accrual basis of accounting. Revenues are recorded when earned, and expenses are recorded when incurred. Participants’ benefits are recorded when payable by law. We believe that the accounting and administrative internal controls established by the System provide reasonable assurance the System is carrying out its responsibilities in safeguarding its assets, in maintaining the reliability of the financial records for preparing financial statements, and in maintaining accountability for its assets.
Funding
Funds are derived from the excess of additions to plan fiduciary net position over deductions from plan fiduciary net position. Funds are accumulated by the System to meet future benefit obligations to retirees and beneficiaries. The percentage computed by dividing the actuarial value of assets by the actuarial accrued liability is referred to as the “funded ratio.” This ratio provides an indication of the funding status of the System and generally, the greater this percentage, the stronger the System.
Pension – The actuarial value of the assets and actuarial accrued liability for pension benefits were $41.0 billion and $67.7 billion, respectively, resulting in a funded ratio of 60.5% at September 30, 2015. A historical perspective of funding levels for the Pension Plan is presented on the Schedule of Funding Progress in the Statistical Section of this report.
Postemployment Benefits – Prefunding for postemployment benefits began in fiscal year 2013. As of September 30, 2015, the actuarial value of the assets and actuarial accrued liability for postemployment benefits were $3.5 billion and $12.8 billion, respectively, resulting in a funded ratio of 27.5%. A historical perspective of funding levels is presented on the Schedule of Funding Progress in the Required Supplementary Information of the Financial Section in this report.
MAJOR GOALS ACCOMPLISHED
Customer Education and Branding – ORS developed a comprehensive plan to better educate and support its members. The plan included the creation and introduction of a new logo. The new logo presents ORS as a trusted partner helping members navigate the journey to retirement success. This will be an exciting story and an exciting time that will bring our organization closer together and closer to the people who rely on ORS in their retirement journey.
New Intranet Launched – ORS deployed a new intranet in SharePoint to engage its employees with a portal to the most current information and provide opportunities to collaborate and interact with each other. Information and tools were consolidated and reorganized to improve accessibility and communication throughout the business.
Customer Needs and Expectations Study – ORS surveyed active and retired customers to improve its understanding of what customers need and expect. The study’s purpose was to measure customer perceptions, evaluate satisfaction levels with various services, and determine the areas in need of change. ORS will use the findings to set priorities and develop improvements in its products and services.
ORS Delivers 1095-B Statements – This was the first year that ORS was required to deliver 1095-B health coverage statements to all non-Medicare PPO healthcare plan recipients. ORS executed a communication plan that included FAQ development, staff training, targeted email communication to customers, web content, and the 1095-B form development in compliance with IRS guidelines. ORS sent the 1095-B statements to approximately 52,000 recipients the first week of February 2016. As a result of the proactive communication plan and clear communication, ORS received contact on this topic from only 1,000 customers in January 2016 through April 2016.
New MPSERS Healthcare and Pharmacy Benefits Manager Contracts – New contracts for MPSERS healthcare and pharmacy benefits manager resulted in savings of nearly $500 million. ORS initiated a competitive bid process for the MPSERS healthcare and pharmacy benefits manager. The new contracts resulted in significant savings to the school employers who fund the benefit while maintaining the highest quality plan.

INTRODUCTORY SECTION
Letter of Transmittal (Continued)
MICHIGAN PUBLIC SCHOOL EMPLOYEES’ RETIREMENT SYSTEM ● 9
HONORS
Public Pension Standards Award – ORS has recently been awarded the 2016 Public Pension Coordinating Council Standards Award from the Public Pension Coordinating Councils Standards Program (PPCC) for both funding and administration. ORS has received this award every year since 2004. The PPCC Standards reflect expectations for public retirement system management and administration, and serve as a benchmark for all defined benefit public plans to be measured.
Government Finance Officers Association Award – The Government Finance Officers Association (GFOA) of the United States and Canada awarded the retirement system with the Certificate of Achievement for Excellence in Financial Reporting for our fiscal year 2015 Comprehensive Annual Financial Report (CAFR). This marks the 25th consecutive year ORS has received this prestigious award.
Truven Advantage Award – For the fourth time, ORS has earned a Truven Advantage Award. The Truven award recognizes hospitals, health plans, government agencies, and employers that use data analytics to improve quality of care and business results. ORS was recognized for its partnership with Truven in developing a new process for improving the accuracy of invoices and claims for Michigan Public School Employees' Retirement System healthcare plans.
Plan Sponsor Council of America (PSCA) Signature Award – ORS and Voya Financial® took second place in PSCA's Plan Publications for Participants category for their Nearing Retirement Guide. This is the second consecutive year that ORS and Voya have won a Signature Award. The Nearing Retirement Guide is handed out during ORS's Pre-Retirement Orientations and at Voya's Get Ready to Retire seminars.
ACKNOWLEDGEMENTS
The preparation of this report was accomplished with the dedication and cooperation of many people. It is intended to provide complete and reliable information as a basis for making management decisions, as a means of determining compliance with legal provisions, and as a means for determining responsible stewardship of the funds of the System.
We would, therefore, like to express our appreciation for the assistance given by staff, the advisors and the many people who contributed to its preparation. We believe their combined efforts have produced a report that will enable employers and plan members to better evaluate and understand the Michigan Public School Employees’ Retirement System. Their cooperation contributes significantly to the success of the System.
Sincerely,
David B. Behen, Director Department of Technology, Management & Budget
Kerrie Vanden Bosch, Director Office of Retirement Services
INTRODUCTORY SECTION
10 ● MICHIGAN PUBLIC SCHOOL EMPLOYEES’ RETIREMENT SYSTEM
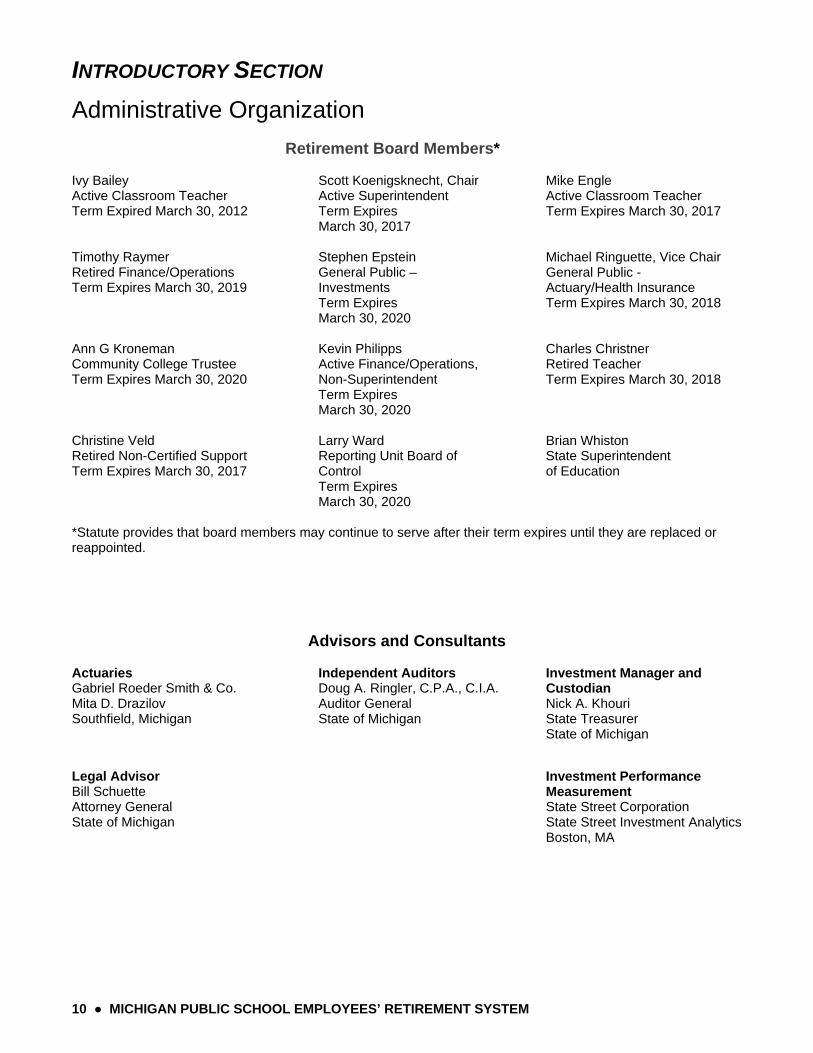
Administrative Organization
Retirement Board Members* Ivy Bailey Active Classroom Teacher Term Expired March 30, 2012
Scott Koenigsknecht, Chair Active Superintendent Term Expires March 30, 2017
Mike Engle Active Classroom Teacher Term Expires March 30, 2017
Timothy Raymer Retired Finance/Operations Term Expires March 30, 2019
Stephen Epstein General Public – Investments Term Expires March 30, 2020
Michael Ringuette, Vice Chair General Public - Actuary/Health Insurance Term Expires March 30, 2018
Ann G Kroneman Community College Trustee Term Expires March 30, 2020
Kevin Philipps Active Finance/Operations, Non-Superintendent Term Expires March 30, 2020
Charles Christner Retired Teacher Term Expires March 30, 2018
Christine Veld Retired Non-Certified Support Term Expires March 30, 2017
Larry Ward Reporting Unit Board of Control Term Expires March 30, 2020
Brian Whiston State Superintendent of Education
*Statute provides that board members may continue to serve after their term expires until they are replaced or reappointed.
Advisors and Consultants Actuaries Gabriel Roeder Smith & Co. Mita D. Drazilov Southfield, Michigan
Independent Auditors Doug A. Ringler, C.P.A., C.I.A. Auditor General State of Michigan
Investment Manager and Custodian Nick A. Khouri State Treasurer State of Michigan
Legal Advisor Bill Schuette Attorney General State of Michigan
Investment Performance Measurement State Street Corporation State Street Investment Analytics Boston, MA
INTRODUCTORY SECTION
Administrative Organization (Continued)
MICHIGAN PUBLIC SCHOOL EMPLOYEES’ RETIREMENT SYSTEM ● 11
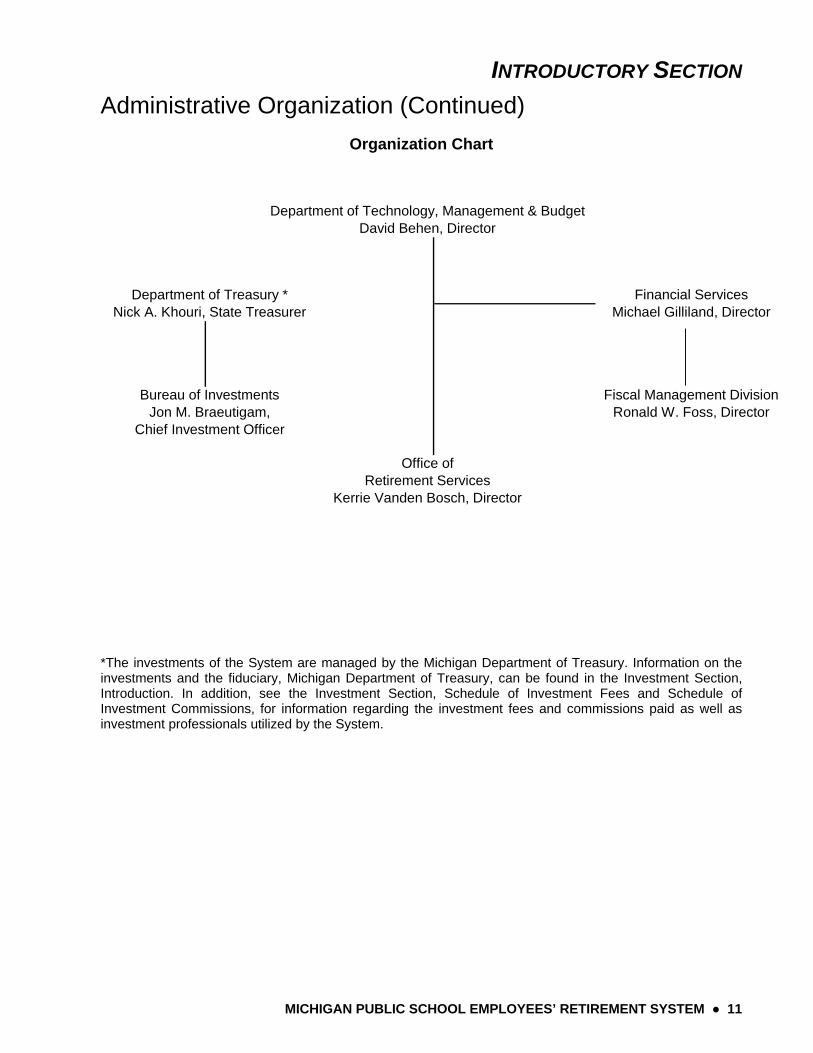
Organization Chart
Financial ServicesMichael Gilliland, Director
Fiscal Management DivisionRonald W. Foss, Director
Kerrie Vanden Bosch, Director
Jon M. Braeutigam,
Office ofRetirement Services
Chief Investment Officer
Department of Technology, Management & BudgetDavid Behen, Director
Department of Treasury *Nick A. Khouri, State Treasurer
Bureau of Investments
*The investments of the System are managed by the Michigan Department of Treasury. Information on the investments and the fiduciary, Michigan Department of Treasury, can be found in the Investment Section, Introduction. In addition, see the Investment Section, Schedule of Investment Fees and Schedule of Investment Commissions, for information regarding the investment fees and commissions paid as well as investment professionals utilized by the System.

INTRODUCTORY SECTION
12 ● MICHIGAN PUBLIC SCHOOL EMPLOYEES’ RETIREMENT SYSTEM
This page was intentionally left blank.

MICHIGAN PUBLIC SCHOOL EMPLOYEES’ RETIREMENT SYSTEM ● 13
FINANCIAL SECTION Independent Auditor’s Report
Management’s Discussion and Analysis Basic Financial Statements
Notes to Basic Financial Statements Required Supplementary Information
Note to Required Supplementary Information Supporting Schedules
14 ● MICHIGAN PUBLIC SCHOOL EMPLOYEES’ RETIREMENT SYSTEM
MICHIGAN PUBLIC SCHOOL EMPLOYEES’ RETIREMENT SYSTEM ● 15

FINANCIAL SECTION
16 ● MICHIGAN PUBLIC SCHOOL EMPLOYEES’ RETIREMENT SYSTEM
Management’s Discussion and Analysis
Our discussion and analysis of the Michigan Public School Employees’ Retirement System’s (System) financial performance provides an overview of the System’s financial activities for the fiscal year ended September 30, 2016. Please read it in conjunction with the transmittal letter in the Introductory Section on page 6 and the basic financial statements, which follow this discussion.
FINANCIAL HIGHLIGHTS
System assets exceeded liabilities at the close of fiscal year 2016 by $48.3 billion (reported as net position restricted for Pension Benefits and OPEB). Fiduciary net position is restricted to meet future benefit payments.
Additions for the year were $7.4 billion, which are comprised primarily of contributions of $4.0 billion and investment gains of $3.4 billion.
Deductions decreased over the prior year from $5.55 billion to $5.53 billion or 0.2%. This decrease is the result of increased pension benefit payments and administrative expenses combined with decreased contribution refunds and OPEB benefit payments.
THE STATEMENT OF PLAN FIDUCIARY NET POSITION AND THE STATEMENT OF CHANGES IN PLAN FIDUCIARY NET POSITION
This Comprehensive Annual Financial Report (CAFR) consists of two financial statements; The Statement of Pension Plan and Other Postemployment Benefit Plan Fiduciary Net Position (page 20) and The Statement of Changes in Pension Plan and Other Postemployment Benefit Plan Fiduciary Net Position (page 21). These financial statements report information about the System, as a whole, and about its financial condition that should help answer the question: Is the System, as a whole, better off or worse off as a result of this year’s activities? These statements include all assets and liabilities using the economic resources measurement focus and the accrual basis of accounting. Under the accrual basis of accounting, all revenues and expenses are taken into account regardless of when cash is received or paid.
The Statement of Pension Plan and Other Postemployment Benefit Plan Fiduciary Net Position presents all of the System’s assets and liabilities, with the difference between the two reported as fiduciary net position. Over time, increases and decreases in fiduciary net position measure whether the System’s financial position is improving or deteriorating. The Statement of Changes in Pension Plan and Other Postemployment Benefit Plan Fiduciary Net Position presents how the System’s fiduciary net position changed during the most recent fiscal year. These two financial statements should be reviewed along with the Schedule of Net Pension Liability (page 53), Schedule of Funding Progress – Other Postemployment Benefit Plan (page 51), and Schedules of Contributions (pages 53-54) to determine whether the System is becoming financially stronger or weaker.
FINANCIAL SECTION
Management’s Discussion and Analysis (Continued)
MICHIGAN PUBLIC SCHOOL EMPLOYEES’ RETIREMENT SYSTEM ● 17
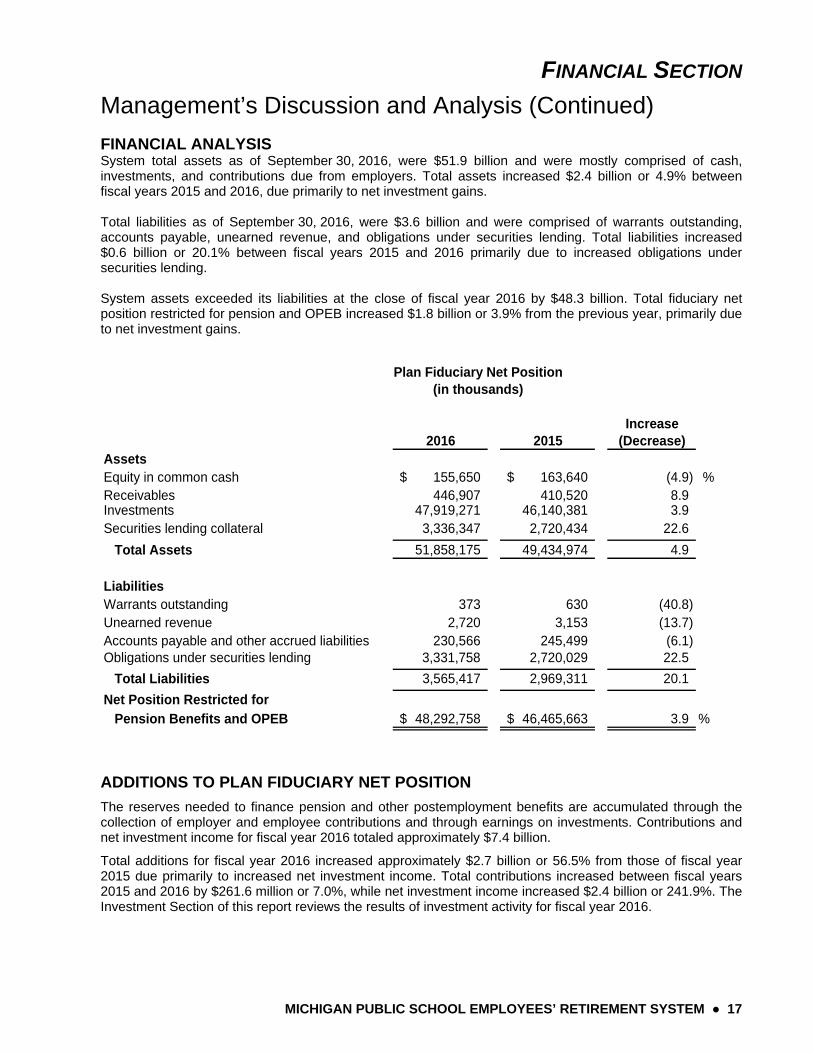
FINANCIAL ANALYSIS System total assets as of September 30, 2016, were $51.9 billion and were mostly comprised of cash, investments, and contributions due from employers. Total assets increased $2.4 billion or 4.9% between fiscal years 2015 and 2016, due primarily to net investment gains. Total liabilities as of September 30, 2016, were $3.6 billion and were comprised of warrants outstanding, accounts payable, unearned revenue, and obligations under securities lending. Total liabilities increased $0.6 billion or 20.1% between fiscal years 2015 and 2016 primarily due to increased obligations under securities lending. System assets exceeded its liabilities at the close of fiscal year 2016 by $48.3 billion. Total fiduciary net position restricted for pension and OPEB increased $1.8 billion or 3.9% from the previous year, primarily due to net investment gains.
Increase2016 2015 (Decrease)
AssetsEquity in common cash 155,650$ 163,640$ (4.9) %Receivables 446,907 410,520 8.9Investments 47,919,271 46,140,381 3.9Securities lending collateral 3,336,347 2,720,434 22.6
Total Assets 51,858,175 49,434,974 4.9
LiabilitiesWarrants outstanding 373 630 (40.8)Unearned revenue 2,720 3,153 (13.7)Accounts payable and other accrued liabilities 230,566 245,499 (6.1)Obligations under securities lending 3,331,758 2,720,029 22.5
Total Liabilities 3,565,417 2,969,311 20.1
Net Position Restricted for Pension Benefits and OPEB 48,292,758$ 46,465,663$ 3.9 %
slkdjf
Plan Fiduciary Net Position(in thousands)
ADDITIONS TO PLAN FIDUCIARY NET POSITION
The reserves needed to finance pension and other postemployment benefits are accumulated through the collection of employer and employee contributions and through earnings on investments. Contributions and net investment income for fiscal year 2016 totaled approximately $7.4 billion.
Total additions for fiscal year 2016 increased approximately $2.7 billion or 56.5% from those of fiscal year 2015 due primarily to increased net investment income. Total contributions increased between fiscal years 2015 and 2016 by $261.6 million or 7.0%, while net investment income increased $2.4 billion or 241.9%. The Investment Section of this report reviews the results of investment activity for fiscal year 2016.
FINANCIAL SECTION
Management’s Discussion and Analysis (Continued)
18 ● MICHIGAN PUBLIC SCHOOL EMPLOYEES’ RETIREMENT SYSTEM
DEDUCTIONS FROM PLAN FIDUCIARY NET POSITION
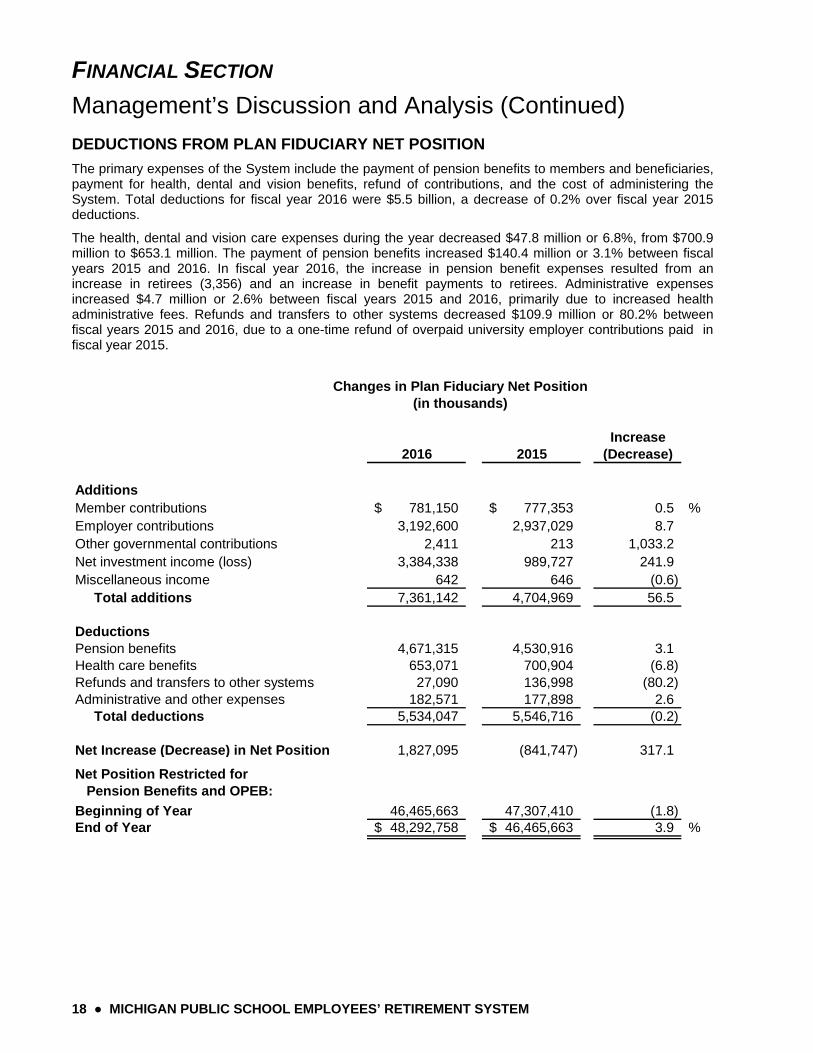
The primary expenses of the System include the payment of pension benefits to members and beneficiaries, payment for health, dental and vision benefits, refund of contributions, and the cost of administering the System. Total deductions for fiscal year 2016 were $5.5 billion, a decrease of 0.2% over fiscal year 2015 deductions.
The health, dental and vision care expenses during the year decreased $47.8 million or 6.8%, from $700.9 million to $653.1 million. The payment of pension benefits increased $140.4 million or 3.1% between fiscal years 2015 and 2016. In fiscal year 2016, the increase in pension benefit expenses resulted from an increase in retirees (3,356) and an increase in benefit payments to retirees. Administrative expenses increased $4.7 million or 2.6% between fiscal years 2015 and 2016, primarily due to increased health administrative fees. Refunds and transfers to other systems decreased $109.9 million or 80.2% between fiscal years 2015 and 2016, due to a one-time refund of overpaid university employer contributions paid in fiscal year 2015.
Increase2016 2015 (Decrease)
AdditionsMember contributions 781,150$ 777,353$ 0.5 %Employer contributions 3,192,600 2,937,029 8.7Other governmental contributions 2,411 213 1,033.2Net investment income (loss) 3,384,338 989,727 241.9Miscellaneous income 642 646 (0.6) Total additions 7,361,142 4,704,969 56.5
DeductionsPension benefits 4,671,315 4,530,916 3.1Health care benefits 653,071 700,904 (6.8)Refunds and transfers to other systems 27,090 136,998 (80.2)Administrative and other expenses 182,571 177,898 2.6 Total deductions 5,534,047 5,546,716 (0.2)
Net Increase (Decrease) in Net Position 1,827,095 (841,747) 317.1
Net Position Restricted for Pension Benefits and OPEB:
Beginning of Year 46,465,663 47,307,410 (1.8)End of Year 48,292,758$ 46,465,663$ 3.9 %
Changes in Plan Fiduciary Net Position(in thousands)
FINANCIAL SECTION
Management’s Discussion and Analysis (Continued)
MICHIGAN PUBLIC SCHOOL EMPLOYEES’ RETIREMENT SYSTEM ● 19
RETIREMENT SYSTEM AS A WHOLE
The System’s overall Fiduciary Net Position experienced an increase in fiscal year 2016. The System’s rate of return for the Pension Plan’s investments increased an overall 5.0% from a 2.6% return in fiscal year 2015 to a 7.6% return during fiscal year 2016. The System’s rate of return for the OPEB Plan’s investments increased an overall 5.1% from a 2.5% return in fiscal year 2015 to a 7.6% return during fiscal year 2016. Management believes that the System remains financially sound and positioned to meet its ongoing benefit obligations due, in part, to a prudent investment program, cost controls, and strategic planning.
CONTACTING SYSTEM FINANCIAL MANAGEMENT
This financial report is designed to provide the Retirement Board, our membership, taxpayers, investors, and creditors with a general overview of the System’s finances and to demonstrate the System’s accountability for the money it receives. If you have any questions about this report or need additional financial information, contact the Office of Retirement Services, P.O. Box 30171, Lansing, MI 48909-7671.
FINANCIAL SECTION
20 ● MICHIGAN PUBLIC SCHOOL EMPLOYEES’ RETIREMENT SYSTEM
Basic Financial Statements
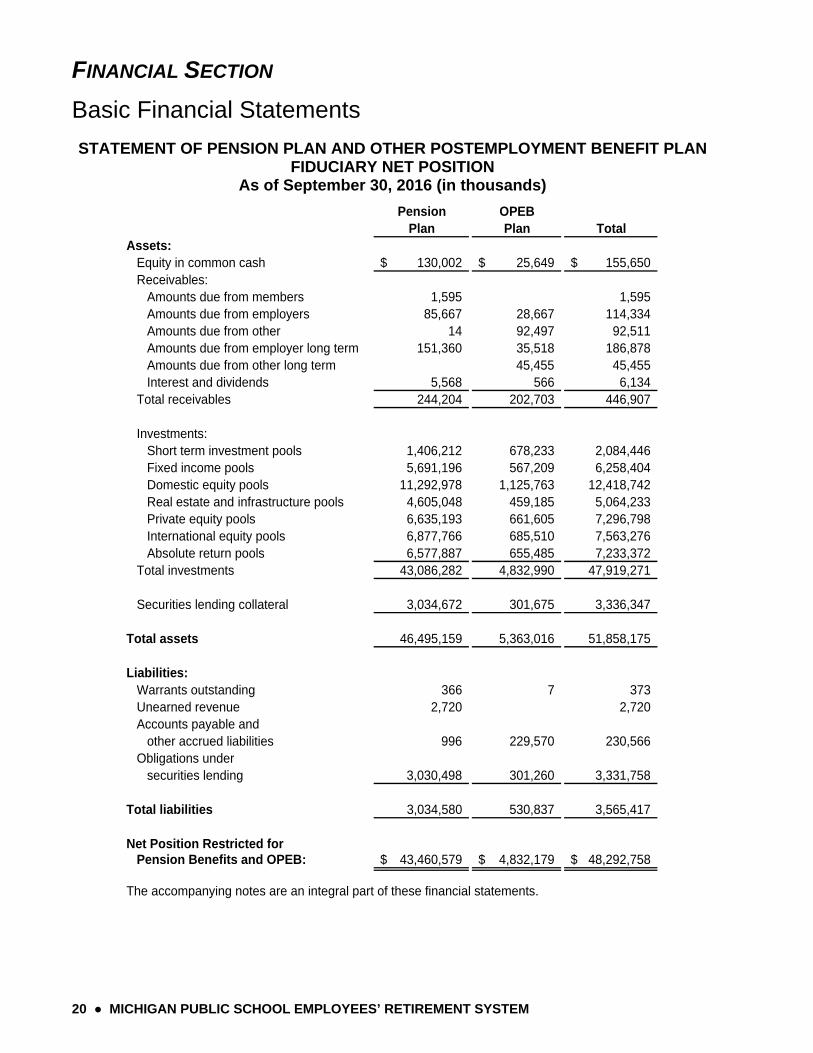
STATEMENT OF PENSION PLAN AND OTHER POSTEMPLOYMENT BENEFIT PLAN FIDUCIARY NET POSITION
As of September 30, 2016 (in thousands)
Pension OPEBPlan Plan Total
Assets: Equity in common cash 130,002$ 25,649$ 155,650$ Receivables: Amounts due from members 1,595 1,595 Amounts due from employers 85,667 28,667 114,334 Amounts due from other 14 92,497 92,511 Amounts due from employer long term 151,360 35,518 186,878 Amounts due from other long term 45,455 45,455 Interest and dividends 5,568 566 6,134 Total receivables 244,204 202,703 446,907
Investments: Short term investment pools 1,406,212 678,233 2,084,446 Fixed income pools 5,691,196 567,209 6,258,404 Domestic equity pools 11,292,978 1,125,763 12,418,742 Real estate and infrastructure pools 4,605,048 459,185 5,064,233 Private equity pools 6,635,193 661,605 7,296,798 International equity pools 6,877,766 685,510 7,563,276 Absolute return pools 6,577,887 655,485 7,233,372 Total investments 43,086,282 4,832,990 47,919,271
Securities lending collateral 3,034,672 301,675 3,336,347
Total assets 46,495,159 5,363,016 51,858,175
Liabilities: Warrants outstanding 366 7 373 Unearned revenue 2,720 2,720 Accounts payable and other accrued liabilities 996 229,570 230,566 Obligations under securities lending 3,030,498 301,260 3,331,758
Total liabilities 3,034,580 530,837 3,565,417
Net Position Restricted for Pension Benefits and OPEB: 43,460,579$ 4,832,179$ 48,292,758$
The accompanying notes are an integral part of these financial statements.
FINANCIAL SECTION
Basic Financial Statements (continued)
MICHIGAN PUBLIC SCHOOL EMPLOYEES’ RETIREMENT SYSTEM ● 21
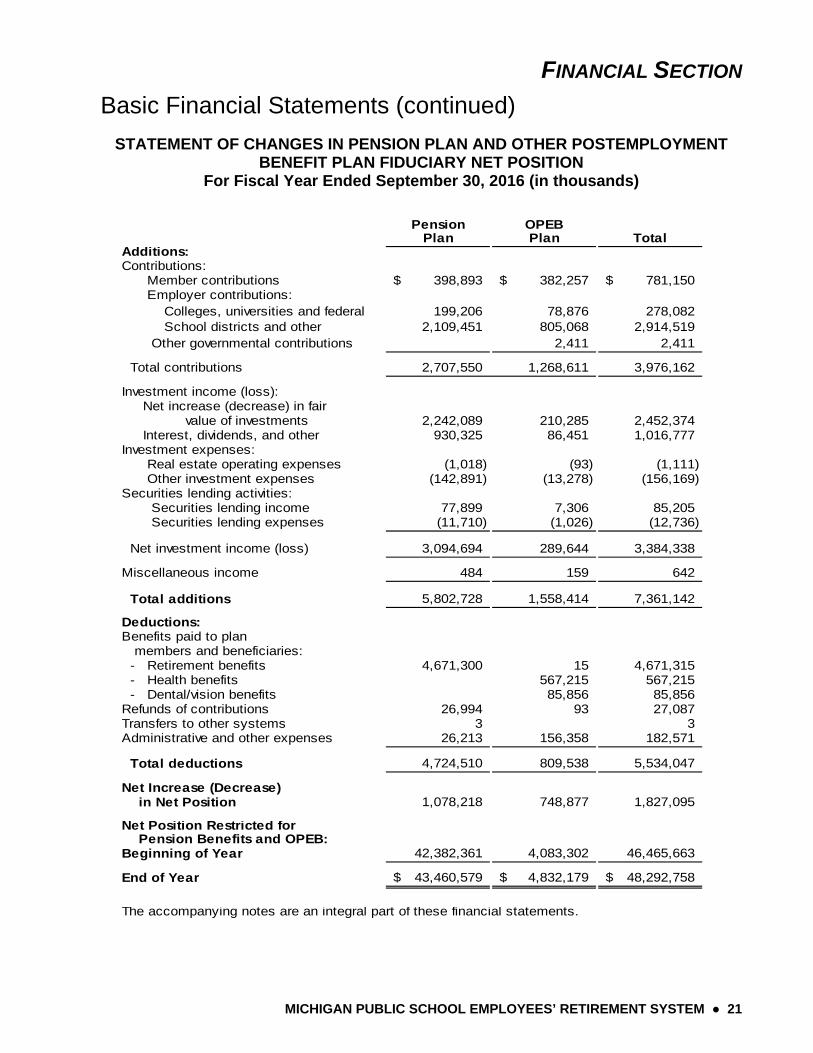
STATEMENT OF CHANGES IN PENSION PLAN AND OTHER POSTEMPLOYMENT BENEFIT PLAN FIDUCIARY NET POSITION
For Fiscal Year Ended September 30, 2016 (in thousands)
Pension OPEBPlan Plan Total
Additions:Contributions: Member contributions 398,893$ 382,257$ 781,150$ Employer contributions: Colleges, universities and federal 199,206 78,876 278,082 School districts and other 2,109,451 805,068 2,914,519 Other governmental contributions 2,411 2,411
Total contributions 2,707,550 1,268,611 3,976,162
Investment income (loss): Net increase (decrease) in fair value of investments 2,242,089 210,285 2,452,374 Interest, dividends, and other 930,325 86,451 1,016,777 Investment expenses: Real estate operating expenses (1,018) (93) (1,111) Other investment expenses (142,891) (13,278) (156,169) Securities lending activities: Securities lending income 77,899 7,306 85,205 Securities lending expenses (11,710) (1,026) (12,736)
Net investment income (loss) 3,094,694 289,644 3,384,338
Miscellaneous income 484 159 642
Total additions 5,802,728 1,558,414 7,361,142
Deductions:Benefits paid to plan members and beneficiaries: - Retirement benefits 4,671,300 15 4,671,315 - Health benefits 567,215 567,215 - Dental/vision benefits 85,856 85,856 Refunds of contributions 26,994 93 27,087 Transfers to other systems 3 3 Administrative and other expenses 26,213 156,358 182,571
Total deductions 4,724,510 809,538 5,534,047
Net Increase (Decrease) in Net Position 1,078,218 748,877 1,827,095
Net Position Restricted for Pension Benefits and OPEB:Beginning of Year 42,382,361 4,083,302 46,465,663
End of Year 43,460,579$ 4,832,179$ 48,292,758$
The accompanying notes are an integral part of these financial statements.
FINANCIAL SECTION
MICHIGAN PUBLIC SCHOOL EMPLOYEES’ RETIREMENT SYSTEM ● 22
NOTES TO BASIC FINANCIAL STATEMENTS SEPTEMBER 30, 2016
NOTE 1- PLAN DESCRIPTION
ORGANIZATION
The Michigan Public School Employees’ Retirement System (System) is a cost-sharing, multiple employer, state-wide, defined benefit public employee retirement plan governed by the State of Michigan (State) originally created under Public Act 136 of 1945, recodified and currently operating under the provisions of Public Act 300 of 1980, as amended. Section 25 of this act establishes the board’s authority to promulgate or amend the provisions of the System. The board consists of twelve members – eleven appointed by the Governor and the State Superintendent of Instruction, who serves as an ex-officio member. The Governor-appointed board members consist of:
Two active classroom teachers or other certified school personnel. One active member or retirant from a non-certified support position. One active school system superintendent. One active finance or operations (non-superintendent) member. One retirant from a classroom teaching position. One retirant from a finance or operations management position. One administrator or trustee of a community college that is a reporting unit of the System. Two from the general public, one with health insurance or actuarial science experience and one with
institutional investment experience. One elected member of a reporting unit’s board of control.
The System’s pension plan was established by the State to provide retirement, survivor and disability benefits to public school employees. In addition, the System’s health plan provides all retirees with the option of receiving health, prescription drug, dental and vision coverage under the Michigan Public School Employees’ Retirement Act. There are 678 participating employers. A list of employers is provided in the Statistical Section. The System is a qualified pension trust fund under section 401(a) of the Internal Revenue Code. By statute, employees of K-12 public school districts, public school academies, district libraries, tax-supported community colleges and seven universities may be members. The seven universities are: Eastern Michigan, Central Michigan, Northern Michigan, Western Michigan, Ferris State, Michigan Technological and Lake Superior State. Employees, who first become employed by one of the seven universities on or after January 1, 1996, become members of an alternative plan.
The System’s financial statements are included as a pension and other employee benefit trust fund in the State of Michigan Comprehensive Annual Financial Report.
The System is administered by the Office of Retirement Services within the Michigan Department of Technology, Management & Budget. The Department Director appoints the Office Director, with whom the general oversight of the System resides. The State Treasurer serves as the investment officer and custodian for the System.
FINANCIAL SECTION NOTES TO BASIC FINANCIAL STATEMENTS (CONTINUED)
MICHIGAN PUBLIC SCHOOL EMPLOYEES’ RETIREMENT SYSTEM ● 23
MEMBERSHIP
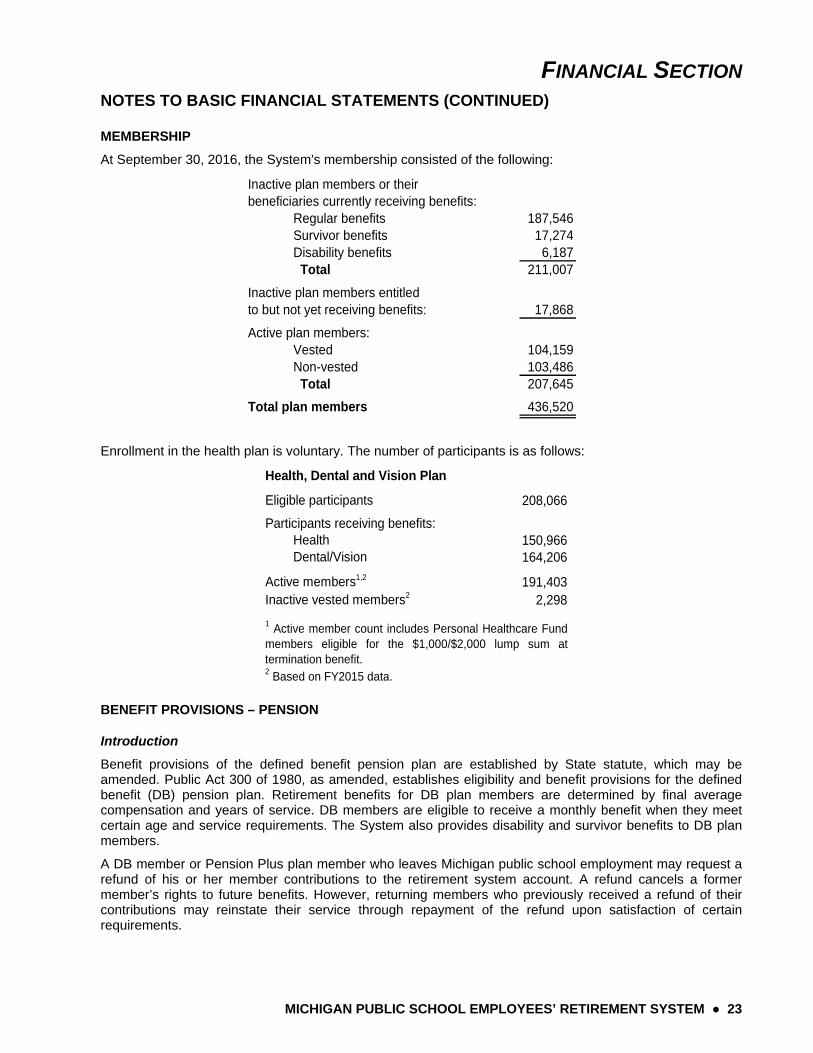
At September 30, 2016, the System's membership consisted of the following:
Inactive plan members or theirbeneficiaries currently receiving benefits: Regular benefits 187,546 Survivor benefits 17,274 Disability benefits 6,187 Total 211,007
Inactive plan members entitledto but not yet receiving benefits: 17,868
Active plan members: Vested 104,159 Non-vested 103,486 Total 207,645
Total plan members 436,520
Enrollment in the health plan is voluntary. The number of participants is as follows:
Eligible participants 208,066
Participants receiving benefits: Health 150,966 Dental/Vision 164,206
Active members1,2 191,403Inactive vested members2 2,298
2 Based on FY2015 data.
Health, Dental and Vision Plan
1 Active member count includes Personal Healthcare Fundmembers eligible for the $1,000/$2,000 lump sum attermination benefit.
BENEFIT PROVISIONS – PENSION
Introduction
Benefit provisions of the defined benefit pension plan are established by State statute, which may be amended. Public Act 300 of 1980, as amended, establishes eligibility and benefit provisions for the defined benefit (DB) pension plan. Retirement benefits for DB plan members are determined by final average compensation and years of service. DB members are eligible to receive a monthly benefit when they meet certain age and service requirements. The System also provides disability and survivor benefits to DB plan members.
A DB member or Pension Plus plan member who leaves Michigan public school employment may request a refund of his or her member contributions to the retirement system account. A refund cancels a former member’s rights to future benefits. However, returning members who previously received a refund of their contributions may reinstate their service through repayment of the refund upon satisfaction of certain requirements.
FINANCIAL SECTION
NOTES TO BASIC FINANCIAL STATEMENTS (CONTINUED)
24 ● MICHIGAN PUBLIC SCHOOL EMPLOYEES’ RETIREMENT SYSTEM
Pension Reform 2010
On May 19, 2010, the Governor signed Public Act 75 of 2010 into law. As a result, any member of the Michigan Public School Employees’ Retirement System (MPSERS) who became a member of MPSERS after June 30, 2010 is a Pension Plus member. Pension Plus is a hybrid plan that contains a pension component with an employee contribution (graded, up to 6.4% of salary) and a flexible and transferable defined contribution (DC) tax-deferred investment account that earns an employer match of 50% (up to 1% of salary) on employee contributions. Retirement benefits for Pension Plus members are determined by final average compensation and years of service. Disability and survivor benefits are available to Pension Plus members.
Pension Reform 2012
On September 4, 2012, the Governor signed Public Act 300 of 2012 into law. The legislation grants all active members who first became a member before July 1, 2010 and who earned service credit in the 12 months ending September 3, 2012, or were on an approved professional services or military leave of absence on September 3, 2012, a voluntary election regarding their pension. Any changes to a member’s pension are effective as of the member’s transition date, which is defined as the first day of the pay period that begins on or after February 1, 2013.
Under the reform, members voluntarily chose to increase, maintain, or stop their contributions to the pension fund.
Option 1 members voluntarily elected to increase their contributions to the pension fund as noted below, and retain the 1.5% pension factor in their pension formula. The increased contribution would begin as of their transition date and continue until they terminate public school employment.
Basic plan members: 4% contribution Member Investment Plan (MIP)-Fixed, MIP-Graded, and MIP-Plus members: a flat 7% contribution
Option 2 members voluntarily elected to increase their contribution to the pension fund as stated in Option 1 and retain the 1.5% pension factor in their pension formula. The increased contribution would begin as of their transition date and continue until they reach 30 years of service. If and when they reach 30 years of service, their contribution rates will return to the previous level in place as of the day before their transition date (0% for Basic plan members, 3.9% for MIP-Fixed, up to 4.3% for MIP-Graded, or up to 6.4% for MIP-Plus). The pension formula for any service thereafter would include a 1.25% pension factor.
Option 3 members voluntarily elected not to increase their contribution to the pension fund and maintain their current level of contribution to the pension fund. The pension formula for their years of service as of the day before their transition date will include a 1.5% pension factor. The pension formula for any service thereafter will include a 1.25% pension factor.
Option 4 members voluntarily elected to no longer contribute to the pension fund and therefore are switched to the Defined Contribution plan for future service as of their transition date. As a DC participant they receive a 4% employer contribution to a tax-deferred 401(k) account and can choose to contribute up to the maximum amounts permitted by the IRS to a 457 account. They vest in employer contributions and related earnings in their 401(k) account based on the following schedule: 50% at 2 years, 75% at 3 years, and 100% at 4 years of service. They are 100% vested in any personal contributions and related earnings in their 457 account. Upon retirement, if they meet age and service requirements (including their total years of service), they would also receive a pension (calculated based on years of service and final average compensation as of the day before their transition date and a 1.5% pension factor).
Members who did not make an election before the deadline defaulted to Option 3 as described above. Deferred or nonvested public school employees on September 3, 2012, who return to public school employment on or after September 4, 2012, will be considered as if they had elected Option 3 above. Returning members who made the retirement plan election will retain whichever option they chose.
FINANCIAL SECTION NOTES TO BASIC FINANCIAL STATEMENTS (CONTINUED)
MICHIGAN PUBLIC SCHOOL EMPLOYEES’ RETIREMENT SYSTEM ● 25
Employees who first work on or after September 4, 2012, choose between two retirement plans: the Pension Plus plan described above and a Defined Contribution (DC) plan that provides a 50% employer match (up to 3% of salary) on employee contributions. New employees are automatically enrolled as members in the Pension Plus plan as of their date of hire. They have 75 days from the last day of their first pay period, as reported to ORS, to elect to opt out of the Pension Plus plan and become a qualified participant in the DC plan; if no election is made they will remain in the Pension Plus plan. If they elect to opt out of the Pension Plus plan, their participation in the DC plan will be retroactive to their date of hire.
Regular Retirement
The pension benefit for DB and Pension Plus plan members is based on a member’s years of credited service (employment) and final average compensation (FAC). The FAC is calculated based on the member’s highest total wages earned during a specific period of consecutive calendar months divided by the service credit accrued during that same time period. For a MIP member, who became a member of MPSERS prior to July 1, 2010, the averaging period is 36 consecutive months. For a Pension Plus member, who became a member of MPSERS after June 30, 2010, the averaging period is 60 consecutive months. For a Basic plan member, this period is the 60 consecutive months yielding the highest total wages. The annual pension is paid monthly for the lifetime of a retiree. The calculation of a member’s pension is determined by their pension election under PA 300 of 2012 and is shown below:
Option 1: FAC × total years of service × 1.5% Option 2: FAC × 30 years of service × 1.5% + FAC × years of service beyond 30 × 1.25% Option 3: FAC × years of service as of transition date × 1.5% + FAC × years of service after transition date × 1.25% Option 4: FAC as of transition date × years of service as of transition date × 1.5%
A MIP member who became a member of MPSERS prior to July 1, 2010 may retire at:
age 46 with 30 or more years of credited service; or age 60 with 10 or more years of credited service; or age 60 with 5 years of credited service provided the member has worked through his or her 60th
birthday and has credited service in each of the five school fiscal years immediately preceding the retirement effective date.
A Pension Plus member who became a member of MPSERS after June 30, 2010 may retire at age 60 with 10 or more years of credited service.
A Basic plan member may retire at:
age 55 with 30 or more years of credited service; or age 60 with 10 or more years of credited service.
There is no mandatory retirement age.
Early Retirement
A MIP or Basic member may retire with an early permanently reduced pension:
after completing at least 15 but less than 30 years of credited service; and after attaining age 55; and with credited service in each of the 5 school years immediately preceding the pension effective date.
The early pension is computed in the same manner as a regular pension, but is permanently reduced 0.5% for each full and partial month between the pension effective date and the date the member will attain age 60.

FINANCIAL SECTION
NOTES TO BASIC FINANCIAL STATEMENTS (CONTINUED)
26 ● MICHIGAN PUBLIC SCHOOL EMPLOYEES’ RETIREMENT SYSTEM
Deferred Retirement
If a member terminates employment before attaining the age qualification, but after accruing 10 or more years of credited service, the member becomes a deferred member and is eligible for a pension at the time the age qualification is attained.
Nonduty Disability Benefit
Any member with 10 or more years of credited service who becomes totally and permanently disabled due to any non-duty related cause and who has not met the age requirement for a regular pension is eligible for a non-duty disability pension computed in the same manner as an age and service pension, upon recommendation from the member’s personal physician and the Retirement Board physician and the approval of the Retirement Board. An Annual Certification of Disability is conducted each January. Upon prior approval, total disability benefits plus authorized outside earnings are limited to 100% of final average compensation (increased by 2% for each year retired; first year 100%, next year 102%, etc.).
Duty Disability Benefit
Any member who becomes totally and permanently disabled as a result of a duty-related cause, who has not met the age and service requirement for a regular pension, and who is in receipt of weekly workers’ compensation is eligible for a duty disability pension computed in the same manner as an age and service pension (but based upon a minimum of 10 years of service) upon recommendation from the member’s personal physician and the Retirement Board physician and the approval of the Retirement Board. An Annual Certification of Disability is conducted each January. Upon prior approval, total disability benefits plus authorized outside earnings are limited to 100% of final average compensation (increased by 2% for each year retired; first year 100%, next year 102%, etc.).
Forms of Payment
The election of a pension option is made at the time of application. Once a member has retired, the option choice is irrevocable. The pension effective date is the first of the calendar month following the date the member has satisfied the age and service requirements, has terminated public school employment and has the completed application forms on file with the System for a period of 15 days. A retroactive pension can be paid for no more than 12 calendar months. Thus, delay in filing the application can result in a loss of some retroactive pension benefits. An applicant may select only one of the following options.
Straight Life Pension – The Straight Life Pension pays the largest level pension a retiree can receive during his or her lifetime and stops with the month of a retiree’s death. There are no monthly benefits for a beneficiary. The pension benefit is computed with no beneficiary rights. If the retiree made contributions while an employee and has not received the total accumulated contributions before death, a refund of the balance of the contributions is made to the beneficiary of record. If the retiree did not make any contributions, there will not be payments to any beneficiaries.
Survivor Options – Under the Survivor Options, 100% Survivor Pension, 100% Equated, 75% Survivor Pension, 75% Equated, 50% Survivor Pension and 50% Equated, the reduction is an actuarial determination dependent upon the combined life expectancies of a retiree and a beneficiary, and varies from case to case. A beneficiary may only be a spouse, brother, sister, parent or child (including an adopted child) of a retiring member. If the beneficiary pre-deceases a retiree, the pension will revert to either the Straight Life or Straight Life Equated amount (“pop-up” provision). If, however, a retiree was single at the time of retirement and subsequently married, the retiree can request to nominate a new spouse if they elected the straight life option at retirement. Also, if a retiree was married at the time of retirement and has since been widowed and remarried, the retiree can request to nominate a new spouse as a pension beneficiary as long as they elected a survivor option for the spouse at the time of retirement.
100% Survivor Pension – pays a reduced pension to a retiree. The month after a retiree’s death, the same amount will be paid to a designated beneficiary for the remainder of his or her lifetime.
FINANCIAL SECTION NOTES TO BASIC FINANCIAL STATEMENTS (CONTINUED)
MICHIGAN PUBLIC SCHOOL EMPLOYEES’ RETIREMENT SYSTEM ● 27
75% Survivor Pension – pays a reduced pension to a retiree. The month after a retiree’s death, 75% of the pension amount will be paid to a designated beneficiary for the remainder of his or her lifetime.
50% Survivor Pension – pays a reduced pension to a retiree. The month after a retiree’s death, 50% of the pension amount will be paid to a designated beneficiary for the remainder of his or her lifetime.
Equated Plan – For MIP and Basic plan members, the Equated plan may be combined with the Straight Life, 100% Survivor, 75% Survivor, or 50% Survivor Pension by any member under age 61, except a disability applicant. The Equated Plan provides a higher pension every month until age 62, at which time the monthly pension is permanently decreased to a lower amount than the Straight Life, 100%, 75%, or 50% Survivor alone would provide.
The intent of the Equated Plan is for the retiree’s pension to decrease at age 62 by approximately the same amount as that person’s Social Security benefit will provide. The System pension until age 62 should be about the same as the combined System pension and Social Security after age 62.
The projected Social Security pension the retiring member obtains from the Social Security Administration and furnishes to the System is used in the Equated Plan calculation. The actual Social Security pension may vary from the estimate.
NOTE: The reduction in the pension at age 62 pertains to the Equated Plan only and affects only the retiree. A beneficiary under 100% Equated, 75% Equated or 50% Equated will receive the 100%, 75%, or 50% Survivor amount the month following the retiree’s death as if the Equated Plan had not been chosen. A beneficiary does not participate in the Equated Plan.
Survivor Benefit
A non-duty survivor pension is available if a MIP member has 10 years of credited service or, if age 60 or older, with five years of credited service; the date they became a MIP member does not matter. The Basic plan provides a survivor pension with 15 years of credited service or, if age 60 or older, with 10 years of credited service. The Pension Plus plan provides for a survivor pension with 10 years of credited service. An active member may nominate as a survivor beneficiary a spouse, child(ren) (including adopted child(ren)), brother, sister, or parent. If other than the spouse is nominated and a spouse exists, the spouse must waive this benefit. If no beneficiary has been nominated, the beneficiary is automatically the spouse; or, if there is no spouse, unmarried children under age 18 share the benefit equally until age 18. The benefit is computed as a regular pension but reduced in accordance with a 100% survivor pension factor. The pension begins the first of the month following the member’s death. In the event of the death of a deferred member, the System begins payment to the nominated beneficiary at the time the member would have attained the minimum age qualification.
A duty survivor pension is payable if weekly workers’ compensation is being paid to the eligible beneficiary due to the member’s death. A spouse receives the benefit (based on a minimum of 10 years of service credit) reduced in accordance with a l00% survivor pension factor. If there is no spouse, unmarried children under age 18 share the benefit equally until age 18; if there is no spouse or child(ren), a disabled and dependent parent is eligible.
Postretirement Adjustments
A retiree who became a MIP member prior to July 1, 2010, receives an annual postretirement non-compounded increase of 3% of the initial pension in the October following twelve months of retirement. Basic plan members do not receive an annual postretirement increase, but are eligible to receive a supplemental payment in those years when investment earnings exceed actuarial assumptions. Pension Plus members do not receive an annual postretirement increase.
On January 1, 1990, pre-October 1, 1981 retirees received an increase that ranged from 1% to 22% dependent upon the pension effective date. On October 1, 1990, the base pension of all retirees with an effective pension date of January 1, 1987, or earlier was increased to include all prior postretirement adjustments.
FINANCIAL SECTION
NOTES TO BASIC FINANCIAL STATEMENTS (CONTINUED)
28 ● MICHIGAN PUBLIC SCHOOL EMPLOYEES’ RETIREMENT SYSTEM
On January 1, 1986, all recipients through calendar year 1985 received a permanent 8% increase that established the 1986 base pension. In addition, each October, retirees with a pension effective date of January 1, 1987, or earlier receive a fixed increase equal to 3% of the base pension. Both increases are deducted from the distribution of excess investment income, if any. Beginning in 1983, eligible recipients receive an annual distribution of excess investment income, if any.
Member Contributions
Mandatory member contributions were phased out between 1974 and 1977, with the plan remaining noncontributory until January 1, 1987, when the Member Investment Plan (MIP) was enacted. MIP members enrolled prior to January 1, 1990, contribute at a permanently fixed rate of 3.9% of gross wages. The MIP contribution rate was 4.0% from January 1, 1987, the effective date of the MIP, until January 1, 1990, when it was reduced to 3.9%. Members first hired between January 1, 1990 and June 30, 2008, and returning members who did not work between January 1, 1987, through December 31, 1989, contribute at the following graduated permanently fixed contribution rates: 3% of the first $5,000; 3.6% of $5,001 through $15,000; 4.3% of all wages over $15,000. Members first hired July 1, 2008, or later including Pension Plus plan members, contribute at the following graduated permanently fixed contribution rates: 3% of the first $5,000; 3.6% of $5,001 through $15,000; 6.4% of all wages over $15,000.
For a limited period ending December 31, 1992, an active Basic plan member could enroll in the MIP by paying the contributions that would have been made had enrollment occurred initially on January 1, 1987, or on the date of hire, plus interest. MIP contributions at the rate of 3.9% of gross wages begin at enrollment. Actuarial rate of interest is posted to member accounts on July 1 on all MIP monies on deposit for 12 months. If a member leaves public school service and no pension is payable, the member’s accumulated contributions plus interest, if any, are refundable.
Under Public Act 300 of 2012, eligible members voluntarily chose between increasing, maintaining, or stopping their contributions to the pension fund as of the transition date. Their options are described in detail under Pension Reform 2012 beginning on page 24. Members who elected to increase their level of contribution contribute 4% (Basic plan) or 7% (MIP); by doing so they maintain a 1.5% pension factor in their pension formula. Members who elected to maintain their level of contribution will receive a 1.25% pension factor in their pension formula for their years of service as of their transition date. Their contribution rates are described above. Members who elected to stop their contributions became participants in the Defined Contribution plan as of their transition date.
Employer Contributions
Each school district or reporting entity is required to contribute the full actuarial funding contribution amount to fund pension benefits.
BENEFIT PROVISIONS – OTHER POSTEMPLOYMENT
Introduction
Benefit provisions of the postemployment healthcare plan are established by State statute, which may be amended. Public Act 300 of 1980, as amended, establishes eligibility and benefit provisions. Retirees have the option of health coverage, which, through 2012, was funded on a cash disbursement basis. Beginning fiscal year 2013, it is funded on a prefunded basis. The System has contracted to provide the comprehensive group medical, prescription drug, dental and vision coverage for retirees and beneficiaries. A subsidized portion of the premium is paid by the System with the balance deducted from the monthly pension of each retiree healthcare recipient. For members who first worked before July 1, 2008, (Basic, MIP-Fixed, and MIP-Graded plan members) the subsidy is the maximum allowed by statute. To limit future liabilities of Other Postemployment Benefits, members who first worked on or after July 1, 2008, (MIP-Plus plan members) have a graded premium subsidy based on career length where they accrue credit towards their insurance premiums in retirement, not to exceed the maximum allowable by statute. Public Act 300 of 2012 sets the
FINANCIAL SECTION NOTES TO BASIC FINANCIAL STATEMENTS (CONTINUED)
MICHIGAN PUBLIC SCHOOL EMPLOYEES’ RETIREMENT SYSTEM ● 29
maximum subsidy at 80% beginning January 1, 2013; 90% for those Medicare eligible and enrolled in the insurances as of that date.
Public Act 75 of 2010 requires each actively employed member of MPSERS after June 30, 2010, to annually contribute 3% of their compensation to offset employer contributions for healthcare benefits of current retirees.
Dependents are eligible for healthcare coverage if they meet the dependency requirements set forth in Public Act 300 of 1980, as amended.
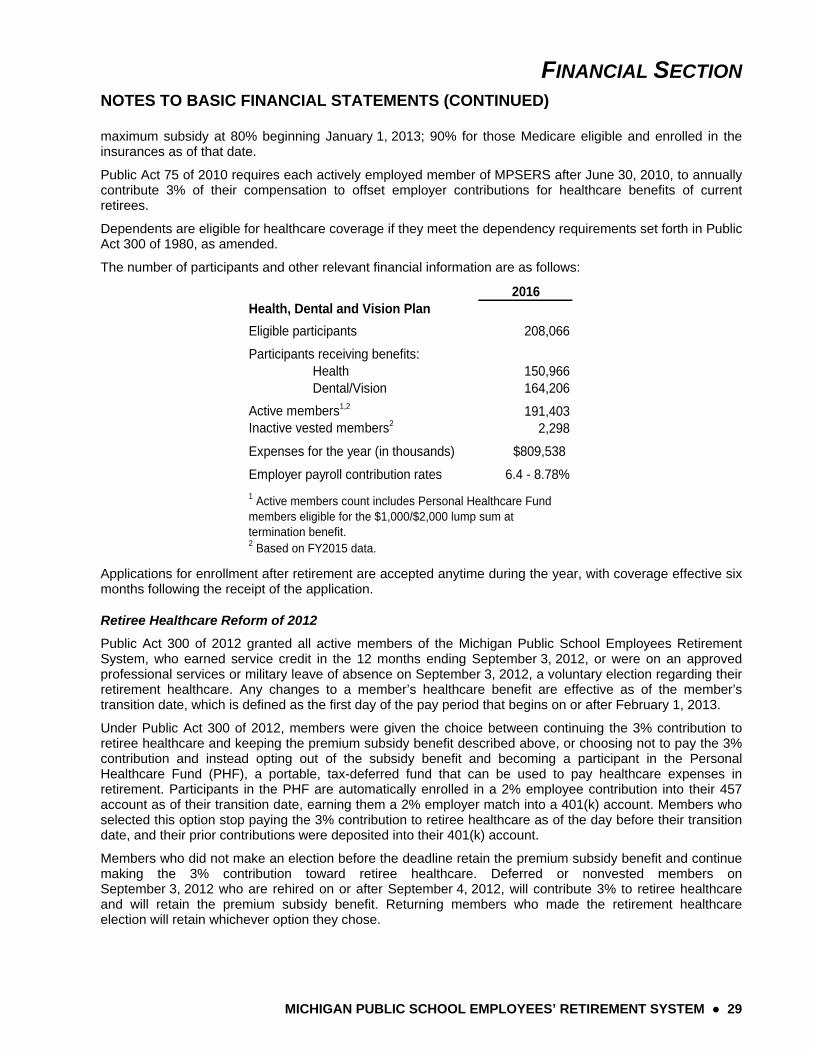
The number of participants and other relevant financial information are as follows:
2016Health, Dental and Vision Plan
Eligible participants 208,066
Participants receiving benefits:Health 150,966Dental/Vision 164,206
Active members1,2 191,403Inactive vested members2 2,298
Expenses for the year (in thousands) $809,538
Employer payroll contribution rates 6.4 - 8.78%
2 Based on FY2015 data.
1 Active members count includes Personal Healthcare Fund members eligible for the $1,000/$2,000 lump sum at termination benefit.
Applications for enrollment after retirement are accepted anytime during the year, with coverage effective six months following the receipt of the application.
Retiree Healthcare Reform of 2012
Public Act 300 of 2012 granted all active members of the Michigan Public School Employees Retirement System, who earned service credit in the 12 months ending September 3, 2012, or were on an approved professional services or military leave of absence on September 3, 2012, a voluntary election regarding their retirement healthcare. Any changes to a member’s healthcare benefit are effective as of the member’s transition date, which is defined as the first day of the pay period that begins on or after February 1, 2013.
Under Public Act 300 of 2012, members were given the choice between continuing the 3% contribution to retiree healthcare and keeping the premium subsidy benefit described above, or choosing not to pay the 3% contribution and instead opting out of the subsidy benefit and becoming a participant in the Personal Healthcare Fund (PHF), a portable, tax-deferred fund that can be used to pay healthcare expenses in retirement. Participants in the PHF are automatically enrolled in a 2% employee contribution into their 457 account as of their transition date, earning them a 2% employer match into a 401(k) account. Members who selected this option stop paying the 3% contribution to retiree healthcare as of the day before their transition date, and their prior contributions were deposited into their 401(k) account.
Members who did not make an election before the deadline retain the premium subsidy benefit and continue making the 3% contribution toward retiree healthcare. Deferred or nonvested members on September 3, 2012 who are rehired on or after September 4, 2012, will contribute 3% to retiree healthcare and will retain the premium subsidy benefit. Returning members who made the retirement healthcare election will retain whichever option they chose.
FINANCIAL SECTION
NOTES TO BASIC FINANCIAL STATEMENTS (CONTINUED)
30 ● MICHIGAN PUBLIC SCHOOL EMPLOYEES’ RETIREMENT SYSTEM
Those who elected to retain the premium subsidy continue to annually contribute 3% of compensation into the healthcare funding account. A member or former member age 60 or older, who made the 3% healthcare contributions but who does not meet eligibility requirements may request a refund of their contributions. Similarly, if a retiree dies before the total value of the insurance subsidy paid equals the total value of the contributions the member made, and there are no eligible dependents, the beneficiary may request a refund of unused funds. Refunds of member contributions to the healthcare funding account are issued as a supplemental benefit paid out over a 60-month period.
Retirees with at least 21 years of service, who terminate employment after October 31, 1980, with vested deferred benefits, are eligible for subsidized employer-paid health benefit coverage.
A delayed premium subsidy applies to retirees who became a member of the retirement system before July 1, 2008 and who purchased service credit on or after July 1, 2008. Such individuals are eligible for premium subsidy benefits at age 60 or when they would have been eligible to retire without having made a service purchase, whichever comes first. They may enroll in the insurances earlier, but are responsible for the full premium until the premium subsidy begins.
Under Public Act 300 of 2012, the state no longer offers an insurance premium subsidy in retirement for public school employees who first work on or after September 4, 2012. Instead, all new employees will be placed into the Personal Healthcare Fund where they will have support saving for retirement healthcare costs in the following ways:
They will be automatically enrolled in a 2% employee contribution into a 457 account as of their date of hire, earning them a 2% employer match into a 401(k) account.
They will receive a credit into a Health Reimbursement Account (HRA) at termination if they have at least 10 years of service at termination. The credit will be $2,000 for participants who are at least 60 years of age at termination or $1,000 for participants who are less than 60 years of age at termination.
Participants in the Personal Healthcare Fund who become disabled for any reason are not eligible for any employer-funded health insurance premium subsidy. If a PHF participant suffers a nonduty-related death, his or her health benefit dependents are not eligible to participate in any employer funded health insurance premium subsidy. If a PHF participant suffers a duty death, the state will pay the maximum health premium allowed by statute for the surviving spouse and health benefit dependents. The spouses’ insurance subsidy may continue until his or her death, the dependents’ subsidy may continue until their eligibility ends (through marriage, age, or other event). Upon eligibility for a duty death benefit, the 2% employer matching contributions and related earnings in the member’s 401(k) are forfeited and the state will pay for the subsidy. The beneficiaries receive the member’s personal contributions and related earnings in the member’s 457 account.
NOTE 2 – SUMMARY OF SIGNIFICANT ACCOUNTING POLICIES
Basis of Accounting and Presentation
The System’s financial statements are prepared using the accrual basis of accounting. Contributions from the employers are recognized as revenue when due and payable. Benefits and refunds are recognized when due and payable in accordance with the terms of the System. The reserves are described below and details are provided in the supporting schedules.
Governmental Accounting Standards Board (GASB) Statement No. 67, which was adopted during the year ended September 30, 2014, addresses accounting and financial reporting requirements for pension plans. The requirements for GASB Statement No. 67 require changes in presentation of the financial statements, notes to the financial statements, and required supplementary information. Significant changes include an actuarial calculation of total and net pension liability. It also includes comprehensive note disclosure regarding the pension liability, the sensitivity of the net pension liability to the discount rate, and increased investment activity disclosures. The implementation of GASB Statement No. 67 did not significantly impact the accounting for accounts receivable and investment balances. The total pension liability, determined in
FINANCIAL SECTION NOTES TO BASIC FINANCIAL STATEMENTS (CONTINUED)
MICHIGAN PUBLIC SCHOOL EMPLOYEES’ RETIREMENT SYSTEM ● 31
accordance with GASB Statement No. 67, is presented in Note 4 and in the Required Supplementary Information on page 51.
As of September 30, 2016, the System applied GASB Statement No. 72, Fair Value Measurement and Application. GASB Statement No. 72 provides guidance for determining a fair value measurement for reporting purposes and applying fair value to certain investments and disclosures related to all fair value measurements.
Reserves
Reserve for Employee Contributions – This reserve represents active member contributions and interest less amounts transferred to the Reserve for Retired Benefit Payments for regular and disability retirement, amounts refunded to terminated members, and amounts transferred to the Reserve for Employer Contributions representing unclaimed funds. Members no longer contribute to this reserve except to purchase eligible service credit or repay previously refunded contributions. At September 30, 2016, the balance in this reserve was $1.5 billion.
Reserve for Pension Plus Employee Contributions – This reserve represents active member contributions and interest less amounts transferred to the Reserve for Pension Plus Retired Benefit Payments for regular retirement, amounts refunded to terminated members, and amounts transferred to the Reserve for Pension Plus Employer Contributions representing unclaimed funds. This reserve was established under the provisions of Public Act 75 of 2010. At September 30, 2016, the balance in this reserve was $138.8 million.
Reserve for Member Investment Plan – This reserve represents MIP contributions and interest less refunds and transfers to the Reserve for Retired Benefit Payments. At September 30, 2016, the balance in this reserve was $5.8 billion.
Reserve for Employer Contributions – This reserve represents all reporting unit contributions, except payments for health benefits. Interest from the Reserve for Undistributed Investment Income is credited annually. Amounts are transferred annually to the Reserve for Retired Benefit Payments to bring the balance of that reserve into balance with the actuarial present value of retirement allowances. At September 30, 2016, the balance in this reserve was ($20.9) billion.
Reserve for Pension Plus Employer Contributions – This reserve represents all reporting unit contributions for Pension Plus members, except payments for health benefits. Interest from the Reserve for Undistributed Investment Income is credited annually at a rate of 7%. Amounts are transferred annually to the Reserve for Retired Pension Plus Benefit Payments to bring the balance of that reserve into balance with the actuarial present value of retirement allowances. This reserve was established under the provisions of Public Act 75 of 2010. At September 30, 2016, the balance in this reserve was $100.4 million.
Reserve for Retired Benefit Payments – This reserve represents payments of future retirement benefits to current retirees. At retirement, a member’s accumulated contributions plus interest are transferred into this reserve. Monthly benefits, which are paid to the retiree, reduce this reserve. At the end of each fiscal year, an amount, determined by an annual actuarial valuation, is transferred from the Reserve for Employer Contributions to bring the balance of this reserve into balance with the actuarial present value of retirement allowances. At September 30, 2016, the balance in this reserve was $43.5 billion.
Reserve for Retired Pension Plus Benefit Payments – This reserve represents payments of future retirement benefits to current Pension Plus retirees. At retirement, a member’s accumulated contributions plus interest are transferred into this reserve. Monthly benefits, which are paid to the retiree, reduce this reserve. At the end of each fiscal year, an amount, determined by an annual actuarial valuation, is transferred from the Reserve for Pension Plus Employer Contributions to bring the balance of this reserve into balance with the actuarial present value of retirement allowances. This reserve was established under the provisions of Public Act 75 of 2010. At September 30, 2016, the balance in this reserve was $40 thousand.
FINANCIAL SECTION
NOTES TO BASIC FINANCIAL STATEMENTS (CONTINUED)
32 ● MICHIGAN PUBLIC SCHOOL EMPLOYEES’ RETIREMENT SYSTEM
Reserve for Undistributed Investment Income – This reserve represents all investment earnings. Interest is transferred annually to the other reserves. Administrative expenses of the System are paid from the Reserve for Administrative Expenses, which is credited with amounts from the Reserve for Undistributed Investment Income to cover the expenses. For ease of reporting and understanding, the two reserves are presented as one reserve in the supporting schedules. Public Act 143 of 1997 established a stabilization subaccount within the Reserve for Undistributed Investment Income to which any over funding is credited. As of September 30, 2016, the balance in the subaccount was $0. At September 30, 2016, the balance in this reserve was $13.2 billion.
Reserve for Health (OPEB) Related Benefits – This reserve is credited with employee and employer contributions for retirees’ health, dental, and vision benefits. Starting in fiscal year 2013, the employer contribution is based on a prefunded basis and represents a level of funding that, if paid on an ongoing basis, is projected to cover normal cost each year and amortize any unfunded actuarial liability (or funding excess) over a period not to exceed 30 years. In addition, in fiscal year 2016, federal funding for Medicare Part D and Employer Group Waiver Plan (EGWP) was paid directly to a third party vendor. The third party vendor uses the EGWP funding for any claims submitted and bills the system for any remaining claims outstanding. Premiums for health, dental and vision benefits are paid from this reserve. At September 30, 2016, the balance in this reserve was $4.8 billion.
Reporting Entity
The System is a pension and other employee benefit trust fund of the State. As such, the System is considered part of the State and is included in the State’s Comprehensive Annual Financial Report as a pension and other employee benefit trust fund. The System and its Board are not financially accountable for any other entities or other organizations. Accordingly, the System is the only entity included in this financial report.
Benefit Protection
Public Act 100 of 2002 was passed by the Michigan Legislature to protect pension benefits of public employees from alienation (being transferred). Alienation is attachment, garnishment, levy, execution, bankruptcy or other legal process except for divorce orders or eligible domestic relation orders. The statutes governing the System contained an “anti-alienation” clause to provide for this protection; however, many smaller public pension systems did not have the benefit of this protection. Therefore, Public Act 100 of 2002 was passed to establish legal protection of pension assets that encompasses all public employees.
Investments
Generally, investments are reported at fair value, consistent with the provisions of GASB Statement No. 72, Fair Value Measurement and Application. Short-term, highly liquid debt instruments including commercial paper are reported at amortized cost. Additional disclosures describing investments are provided in Note 5.
Investment Income
Dividend and interest income is recognized on the accrual basis. Fair value changes are recorded as investment income or loss. Purchases and sales of investments are recorded as of the trade date (the date upon which the transaction is initiated), except for purchase and sale of mortgages, real estate, and private equity investments which are recorded as of the settlement date (the date upon which the transaction is ultimately completed). The effect of recording such transactions as of the settlement date does not materially affect the financial statements.
Costs of Administering the System
Each year a restricted general fund appropriation is requested to fund the ongoing business operations of the System. These administrative costs are ultimately funded by the System through the regular transfer of funds from the System to the State’s general fund based on either a direct cost or allocation basis depending on
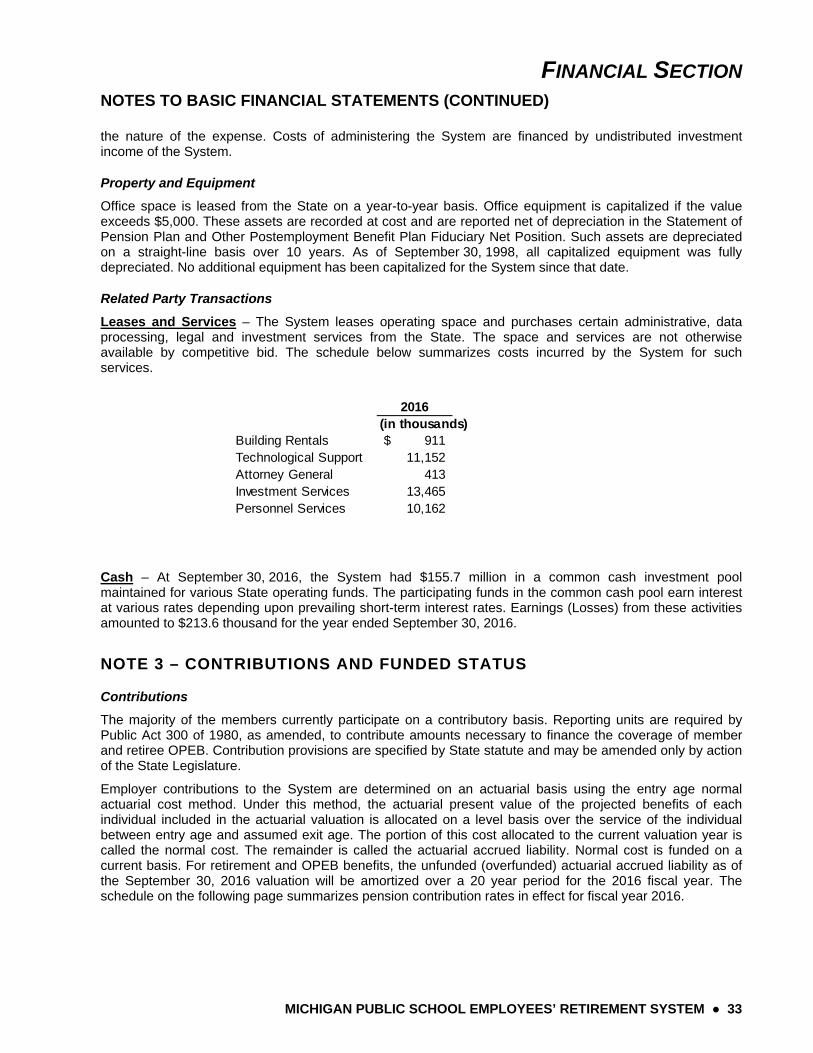
FINANCIAL SECTION NOTES TO BASIC FINANCIAL STATEMENTS (CONTINUED)
MICHIGAN PUBLIC SCHOOL EMPLOYEES’ RETIREMENT SYSTEM ● 33
the nature of the expense. Costs of administering the System are financed by undistributed investment income of the System.
Property and Equipment
Office space is leased from the State on a year-to-year basis. Office equipment is capitalized if the value exceeds $5,000. These assets are recorded at cost and are reported net of depreciation in the Statement of Pension Plan and Other Postemployment Benefit Plan Fiduciary Net Position. Such assets are depreciated on a straight-line basis over 10 years. As of September 30, 1998, all capitalized equipment was fully depreciated. No additional equipment has been capitalized for the System since that date.
Related Party Transactions
Leases and Services – The System leases operating space and purchases certain administrative, data processing, legal and investment services from the State. The space and services are not otherwise available by competitive bid. The schedule below summarizes costs incurred by the System for such services.
Cash – At September 30, 2016, the System had $155.7 million in a common cash investment pool maintained for various State operating funds. The participating funds in the common cash pool earn interest at various rates depending upon prevailing short-term interest rates. Earnings (Losses) from these activities amounted to $213.6 thousand for the year ended September 30, 2016.
NOTE 3 – CONTRIBUTIONS AND FUNDED STATUS
Contributions
The majority of the members currently participate on a contributory basis. Reporting units are required by Public Act 300 of 1980, as amended, to contribute amounts necessary to finance the coverage of member and retiree OPEB. Contribution provisions are specified by State statute and may be amended only by action of the State Legislature.
Employer contributions to the System are determined on an actuarial basis using the entry age normal actuarial cost method. Under this method, the actuarial present value of the projected benefits of each individual included in the actuarial valuation is allocated on a level basis over the service of the individual between entry age and assumed exit age. The portion of this cost allocated to the current valuation year is called the normal cost. The remainder is called the actuarial accrued liability. Normal cost is funded on a current basis. For retirement and OPEB benefits, the unfunded (overfunded) actuarial accrued liability as of the September 30, 2016 valuation will be amortized over a 20 year period for the 2016 fiscal year. The schedule on the following page summarizes pension contribution rates in effect for fiscal year 2016.
2016(in thousands)
Building Rentals 911$ Technological Support 11,152 Attorney General 413 Investment Services 13,465 Personnel Services 10,162
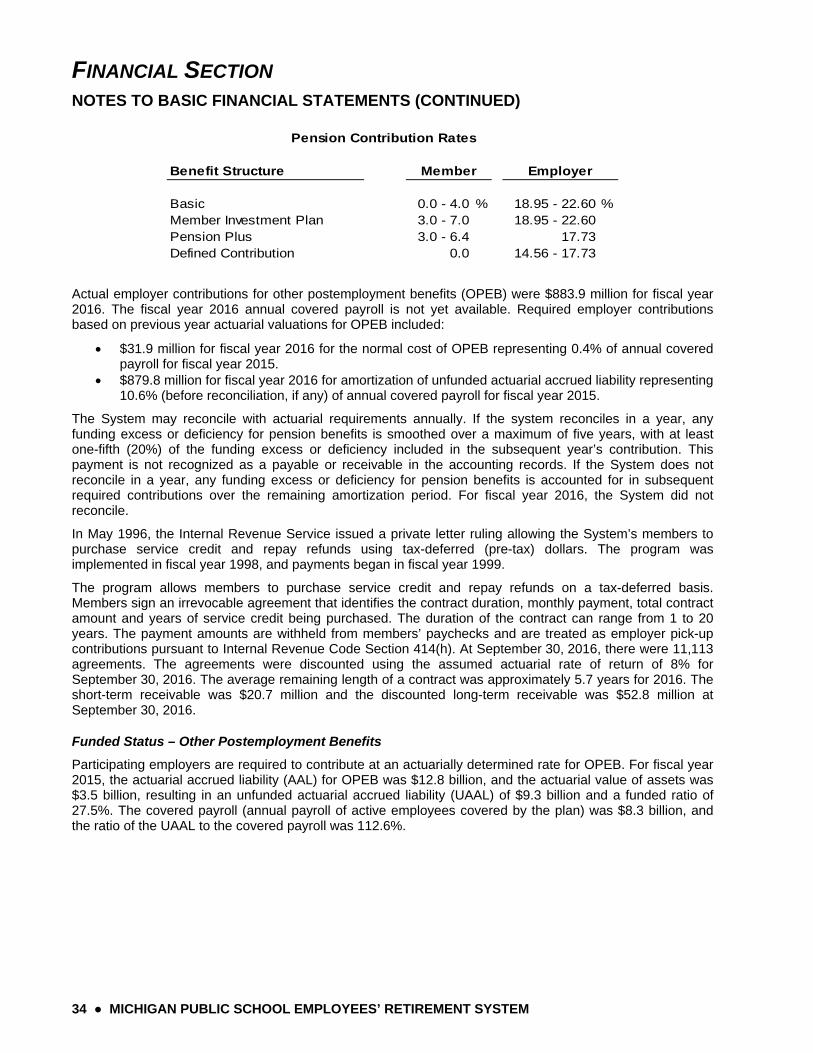
FINANCIAL SECTION
NOTES TO BASIC FINANCIAL STATEMENTS (CONTINUED)
34 ● MICHIGAN PUBLIC SCHOOL EMPLOYEES’ RETIREMENT SYSTEM
Actual employer contributions for other postemployment benefits (OPEB) were $883.9 million for fiscal year 2016. The fiscal year 2016 annual covered payroll is not yet available. Required employer contributions based on previous year actuarial valuations for OPEB included:
$31.9 million for fiscal year 2016 for the normal cost of OPEB representing 0.4% of annual covered payroll for fiscal year 2015.
$879.8 million for fiscal year 2016 for amortization of unfunded actuarial accrued liability representing 10.6% (before reconciliation, if any) of annual covered payroll for fiscal year 2015.
The System may reconcile with actuarial requirements annually. If the system reconciles in a year, any funding excess or deficiency for pension benefits is smoothed over a maximum of five years, with at least one-fifth (20%) of the funding excess or deficiency included in the subsequent year’s contribution. This payment is not recognized as a payable or receivable in the accounting records. If the System does not reconcile in a year, any funding excess or deficiency for pension benefits is accounted for in subsequent required contributions over the remaining amortization period. For fiscal year 2016, the System did not reconcile.
In May 1996, the Internal Revenue Service issued a private letter ruling allowing the System’s members to purchase service credit and repay refunds using tax-deferred (pre-tax) dollars. The program was implemented in fiscal year 1998, and payments began in fiscal year 1999.
The program allows members to purchase service credit and repay refunds on a tax-deferred basis. Members sign an irrevocable agreement that identifies the contract duration, monthly payment, total contract amount and years of service credit being purchased. The duration of the contract can range from 1 to 20 years. The payment amounts are withheld from members’ paychecks and are treated as employer pick-up contributions pursuant to Internal Revenue Code Section 414(h). At September 30, 2016, there were 11,113 agreements. The agreements were discounted using the assumed actuarial rate of return of 8% for September 30, 2016. The average remaining length of a contract was approximately 5.7 years for 2016. The short-term receivable was $20.7 million and the discounted long-term receivable was $52.8 million at September 30, 2016.
Funded Status – Other Postemployment Benefits
Participating employers are required to contribute at an actuarially determined rate for OPEB. For fiscal year 2015, the actuarial accrued liability (AAL) for OPEB was $12.8 billion, and the actuarial value of assets was $3.5 billion, resulting in an unfunded actuarial accrued liability (UAAL) of $9.3 billion and a funded ratio of 27.5%. The covered payroll (annual payroll of active employees covered by the plan) was $8.3 billion, and the ratio of the UAAL to the covered payroll was 112.6%.
Benefit Structure
Basic 0.0 - 4.0 % 18.95 - 22.60 %Member Investment Plan 3.0 - 7.0 18.95 - 22.60Pension Plus 3.0 - 6.4 17.73Defined Contribution 0.0 14.56 - 17.73
Pension Contribution Rates
Member Employer
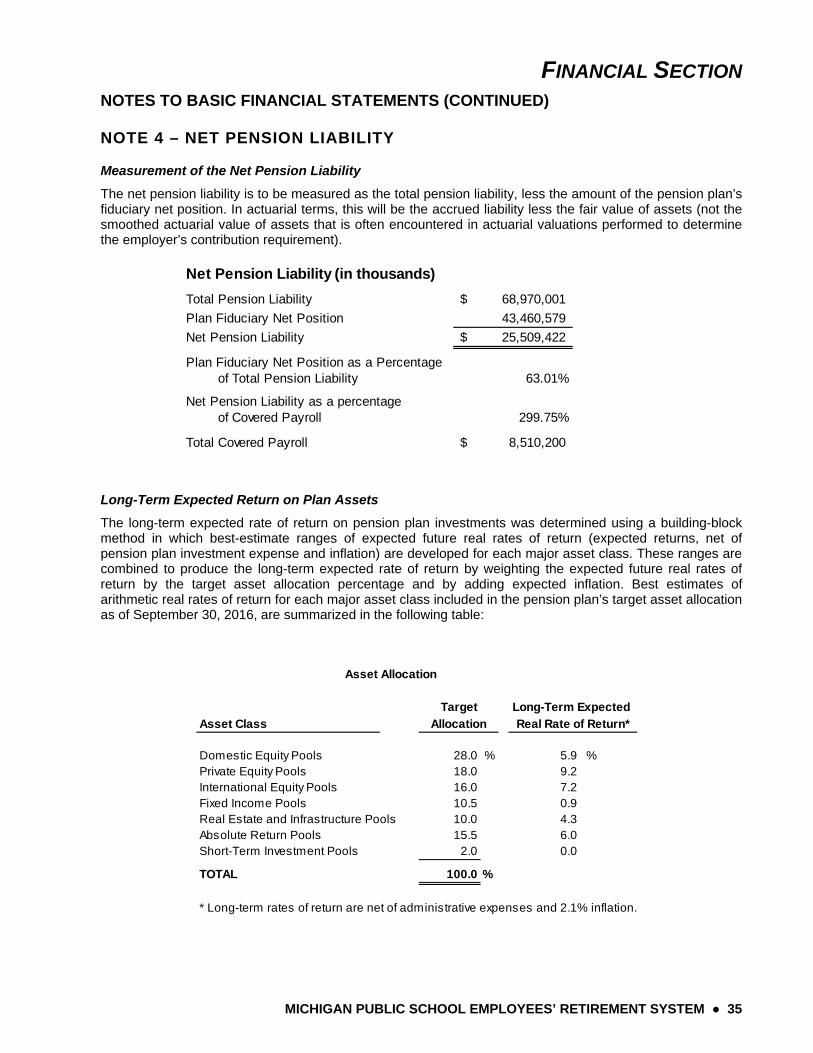
FINANCIAL SECTION NOTES TO BASIC FINANCIAL STATEMENTS (CONTINUED)
MICHIGAN PUBLIC SCHOOL EMPLOYEES’ RETIREMENT SYSTEM ● 35
NOTE 4 – NET PENSION LIABILITY
Measurement of the Net Pension Liability
The net pension liability is to be measured as the total pension liability, less the amount of the pension plan’s fiduciary net position. In actuarial terms, this will be the accrued liability less the fair value of assets (not the smoothed actuarial value of assets that is often encountered in actuarial valuations performed to determine the employer’s contribution requirement).
Long-Term Expected Return on Plan Assets
The long-term expected rate of return on pension plan investments was determined using a building-block method in which best-estimate ranges of expected future real rates of return (expected returns, net of pension plan investment expense and inflation) are developed for each major asset class. These ranges are combined to produce the long-term expected rate of return by weighting the expected future real rates of return by the target asset allocation percentage and by adding expected inflation. Best estimates of arithmetic real rates of return for each major asset class included in the pension plan’s target asset allocation as of September 30, 2016, are summarized in the following table:
Net Pension Liability (in thousands)
Total Pension Liability 68,970,001$
Plan Fiduciary Net Position 43,460,579
Net Pension Liability 25,509,422$
Plan Fiduciary Net Position as a Percentage of Total Pension Liability 63.01%
Net Pension Liability as a percentage of Covered Payroll 299.75%
Total Covered Payroll 8,510,200$
Asset Class
Domestic Equity Pools 28.0 % 5.9 %Private Equity Pools 18.0 9.2International Equity Pools 16.0 7.2Fixed Income Pools 10.5 0.9Real Estate and Infrastructure Pools 10.0 4.3Absolute Return Pools 15.5 6.0Short-Term Investment Pools 2.0 0.0
TOTAL 100.0 %
* Long-term rates of return are net of administrative expenses and 2.1% inflation.
Asset Allocation
Target
Allocation
Long-Term Expected
Real Rate of Return*
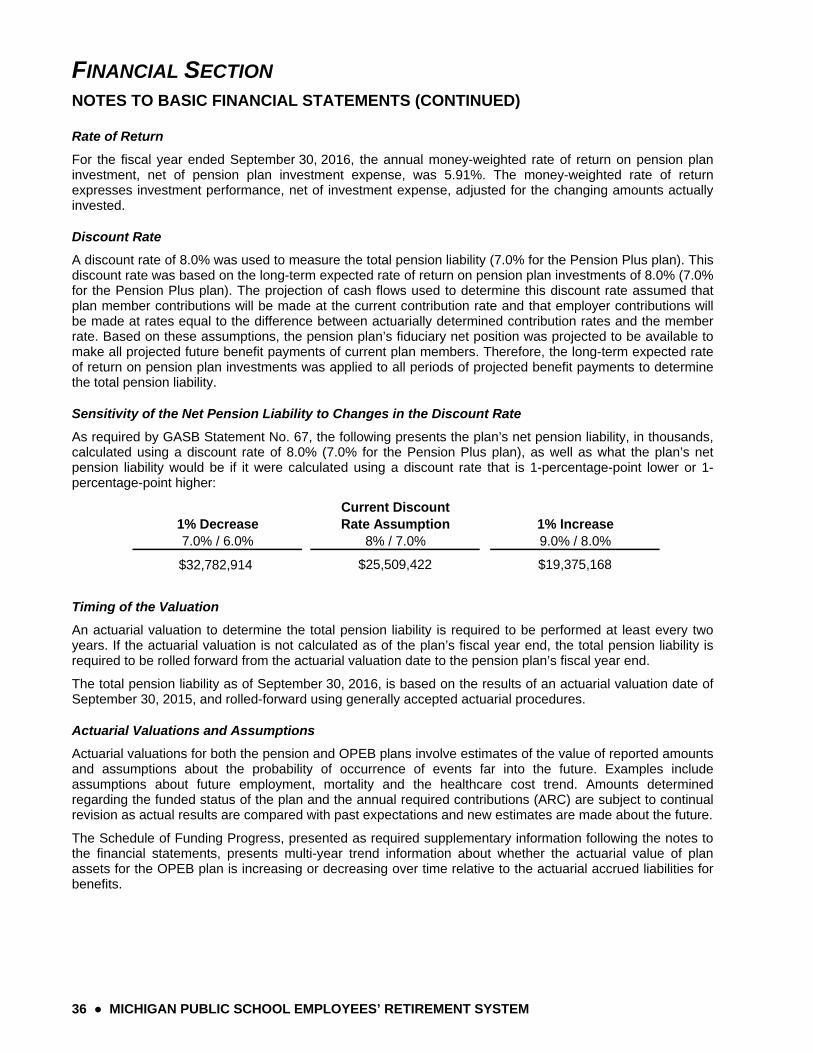
FINANCIAL SECTION
NOTES TO BASIC FINANCIAL STATEMENTS (CONTINUED)
36 ● MICHIGAN PUBLIC SCHOOL EMPLOYEES’ RETIREMENT SYSTEM
Rate of Return
For the fiscal year ended September 30, 2016, the annual money-weighted rate of return on pension plan investment, net of pension plan investment expense, was 5.91%. The money-weighted rate of return expresses investment performance, net of investment expense, adjusted for the changing amounts actually invested.
Discount Rate
A discount rate of 8.0% was used to measure the total pension liability (7.0% for the Pension Plus plan). This discount rate was based on the long-term expected rate of return on pension plan investments of 8.0% (7.0% for the Pension Plus plan). The projection of cash flows used to determine this discount rate assumed that plan member contributions will be made at the current contribution rate and that employer contributions will be made at rates equal to the difference between actuarially determined contribution rates and the member rate. Based on these assumptions, the pension plan’s fiduciary net position was projected to be available to make all projected future benefit payments of current plan members. Therefore, the long-term expected rate of return on pension plan investments was applied to all periods of projected benefit payments to determine the total pension liability.
Sensitivity of the Net Pension Liability to Changes in the Discount Rate
As required by GASB Statement No. 67, the following presents the plan’s net pension liability, in thousands, calculated using a discount rate of 8.0% (7.0% for the Pension Plus plan), as well as what the plan’s net pension liability would be if it were calculated using a discount rate that is 1-percentage-point lower or 1-percentage-point higher:
Current Discount1% Decrease Rate Assumption 1% Increase7.0% / 6.0% 8% / 7.0% 9.0% / 8.0%
$32,782,914 $25,509,422 $19,375,168
Timing of the Valuation
An actuarial valuation to determine the total pension liability is required to be performed at least every two years. If the actuarial valuation is not calculated as of the plan’s fiscal year end, the total pension liability is required to be rolled forward from the actuarial valuation date to the pension plan’s fiscal year end.
The total pension liability as of September 30, 2016, is based on the results of an actuarial valuation date of September 30, 2015, and rolled-forward using generally accepted actuarial procedures.
Actuarial Valuations and Assumptions
Actuarial valuations for both the pension and OPEB plans involve estimates of the value of reported amounts and assumptions about the probability of occurrence of events far into the future. Examples include assumptions about future employment, mortality and the healthcare cost trend. Amounts determined regarding the funded status of the plan and the annual required contributions (ARC) are subject to continual revision as actual results are compared with past expectations and new estimates are made about the future.
The Schedule of Funding Progress, presented as required supplementary information following the notes to the financial statements, presents multi-year trend information about whether the actuarial value of plan assets for the OPEB plan is increasing or decreasing over time relative to the actuarial accrued liabilities for benefits.
FINANCIAL SECTION NOTES TO BASIC FINANCIAL STATEMENTS (CONTINUED)
MICHIGAN PUBLIC SCHOOL EMPLOYEES’ RETIREMENT SYSTEM ● 37
The Schedules of Contributions in Required Supplementary Information present trend information about the amounts contributed to the plan by employers in comparison to the ARC, an amount that is actuarially determined in accordance with the parameters of GASB Statement No. 67 for pension contributions and GASB Statement No. 43 for OPEB contributions.
Projections of benefits for financial reporting purposes are based on the substantive plan (the plan as understood by the employer and plan members) and include the types of benefits provided at the time of each valuation and the historical pattern of sharing of benefit costs between the employer and plan members to that point. The actuarial methods and assumptions used include techniques that are designed to reduce the effects of short-term volatility in actuarial accrued liabilities and the actuarial value of assets, consistent with the long-term perspective of the calculations.
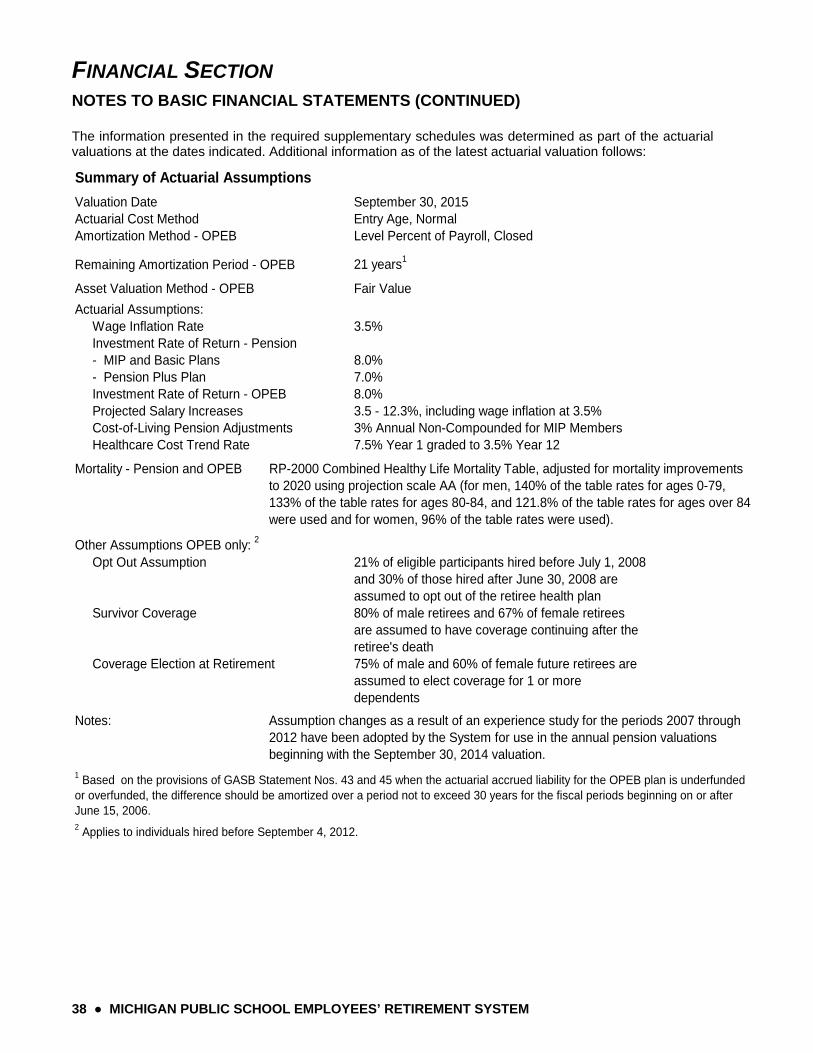
FINANCIAL SECTION
NOTES TO BASIC FINANCIAL STATEMENTS (CONTINUED)
38 ● MICHIGAN PUBLIC SCHOOL EMPLOYEES’ RETIREMENT SYSTEM
The information presented in the required supplementary schedules was determined as part of the actuarial valuations at the dates indicated. Additional information as of the latest actuarial valuation follows:
Summary of Actuarial Assumptions
Valuation Date September 30, 2015Actuarial Cost Method Entry Age, NormalAmortization Method - OPEB Level Percent of Payroll, Closed
Remaining Amortization Period - OPEB 21 years1
Asset Valuation Method - OPEB Fair Value
Actuarial Assumptions: Wage Inflation Rate 3.5% Investment Rate of Return - Pension - MIP and Basic Plans 8.0% - Pension Plus Plan 7.0% Investment Rate of Return - OPEB 8.0% Projected Salary Increases 3.5 - 12.3%, including wage inflation at 3.5% Cost-of-Living Pension Adjustments 3% Annual Non-Compounded for MIP Members Healthcare Cost Trend Rate 7.5% Year 1 graded to 3.5% Year 12
Mortality - Pension and OPEB RP-2000 Combined Healthy Life Mortality Table, adjusted for mortality improvementsto 2020 using projection scale AA (for men, 140% of the table rates for ages 0-79, 133% of the table rates for ages 80-84, and 121.8% of the table rates for ages over 84were used and for women, 96% of the table rates were used).
Other Assumptions OPEB only: 2
Opt Out Assumption 21% of eligible participants hired before July 1, 2008and 30% of those hired after June 30, 2008 areassumed to opt out of the retiree health plan
Survivor Coverage 80% of male retirees and 67% of female retireesare assumed to have coverage continuing after theretiree's death
Coverage Election at Retirement 75% of male and 60% of female future retirees areassumed to elect coverage for 1 or moredependents
Notes: Assumption changes as a result of an experience study for the periods 2007 through2012 have been adopted by the System for use in the annual pension valuationsbeginning with the September 30, 2014 valuation.
1 Based on the provisions of GASB Statement Nos. 43 and 45 when the actuarial accrued liability for the OPEB plan is underfunded or overfunded, the difference should be amortized over a period not to exceed 30 years for the fiscal periods beginning on or after June 15, 2006.2 Applies to individuals hired before September 4, 2012.
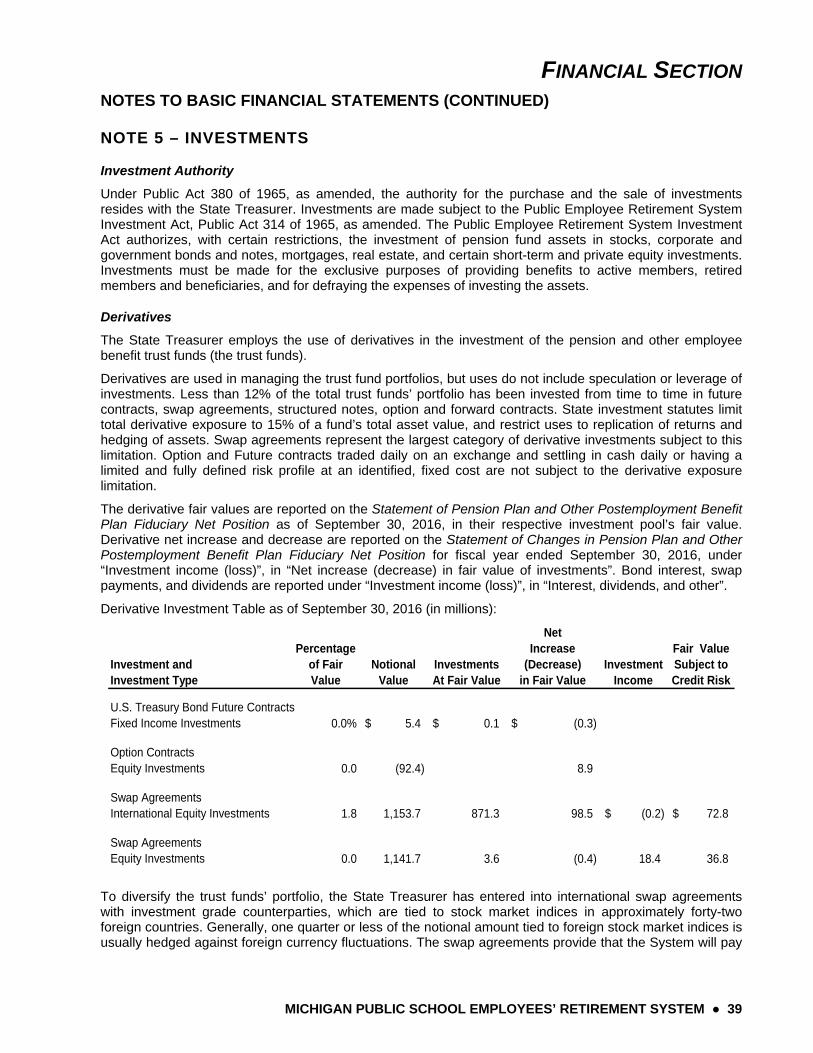
FINANCIAL SECTION NOTES TO BASIC FINANCIAL STATEMENTS (CONTINUED)
MICHIGAN PUBLIC SCHOOL EMPLOYEES’ RETIREMENT SYSTEM ● 39
NOTE 5 – INVESTMENTS
Investment Authority
Under Public Act 380 of 1965, as amended, the authority for the purchase and the sale of investments resides with the State Treasurer. Investments are made subject to the Public Employee Retirement System Investment Act, Public Act 314 of 1965, as amended. The Public Employee Retirement System Investment Act authorizes, with certain restrictions, the investment of pension fund assets in stocks, corporate and government bonds and notes, mortgages, real estate, and certain short-term and private equity investments. Investments must be made for the exclusive purposes of providing benefits to active members, retired members and beneficiaries, and for defraying the expenses of investing the assets.
Derivatives
The State Treasurer employs the use of derivatives in the investment of the pension and other employee benefit trust funds (the trust funds).
Derivatives are used in managing the trust fund portfolios, but uses do not include speculation or leverage of investments. Less than 12% of the total trust funds’ portfolio has been invested from time to time in future contracts, swap agreements, structured notes, option and forward contracts. State investment statutes limit total derivative exposure to 15% of a fund’s total asset value, and restrict uses to replication of returns and hedging of assets. Swap agreements represent the largest category of derivative investments subject to this limitation. Option and Future contracts traded daily on an exchange and settling in cash daily or having a limited and fully defined risk profile at an identified, fixed cost are not subject to the derivative exposure limitation.
The derivative fair values are reported on the Statement of Pension Plan and Other Postemployment Benefit Plan Fiduciary Net Position as of September 30, 2016, in their respective investment pool’s fair value. Derivative net increase and decrease are reported on the Statement of Changes in Pension Plan and Other Postemployment Benefit Plan Fiduciary Net Position for fiscal year ended September 30, 2016, under “Investment income (loss)”, in “Net increase (decrease) in fair value of investments”. Bond interest, swap payments, and dividends are reported under “Investment income (loss)”, in “Interest, dividends, and other”.
Derivative Investment Table as of September 30, 2016 (in millions):
NetPercentage Increase Fair Value
Investment and of Fair Notional Investments (Decrease) Investment Subject toInvestment Type Value Value At Fair Value in Fair Value Income Credit Risk
U.S. Treasury Bond Future ContractsFixed Income Investments
Option ContractsEquity Investments
Swap AgreementsInternational Equity Investments
Swap AgreementsEquity Investments
0.0% 5.4$ 0.1$ (0.3)$
0.0 (92.4) 8.9
1.8 1,153.7 871.3 98.5 (0.2)$ 72.8$
0.0 1,141.7 3.6 (0.4) 18.4 36.8
To diversify the trust funds’ portfolio, the State Treasurer has entered into international swap agreements with investment grade counterparties, which are tied to stock market indices in approximately forty-two foreign countries. Generally, one quarter or less of the notional amount tied to foreign stock market indices is usually hedged against foreign currency fluctuations. The swap agreements provide that the System will pay

FINANCIAL SECTION
NOTES TO BASIC FINANCIAL STATEMENTS (CONTINUED)
40 ● MICHIGAN PUBLIC SCHOOL EMPLOYEES’ RETIREMENT SYSTEM
quarterly over the term of the swap agreements, interest indexed to the three month London Inter-Bank Offer Rate (LIBOR), adjusted for an interest rate spread, on the notional amount stated in the agreements. International equity swap agreement maturity dates range from October 2016 to September 2017. The U.S. Domestic LIBOR based floating rate notes and other investments are held to correspond with the notional amount of the international swap agreements. The value of the international synthetic equity structures is a combination of the value of the swap agreements and the value of the notes and other investments. The book value represents the cost of the notes and other investments. The current value represents the current value of the notes and other investments and the change in the value of the underlying indices from the inception of the swap agreements. The current value is used as a representation of the fair value based on the intention to hold all swap agreements until maturity. At the maturity of the swap agreements, the trust funds will either receive the increase in the value of the equity indices from the level at the inception of the agreements, or pay the decrease in the value of the indices. The combined swap structure generally realizes gains and losses on a rolling basis.
Domestic equity swap agreements provide that the System will pay interest monthly, quarterly, or annually over the term of the swap agreements, interest indexed to the LIBOR, adjusted for an interest rate spread, on the notional amount stated in the agreements. Domestic equity swap agreement maturity dates range from October 2016 to May 2018. Domestic equity swaps value is a combination of the value of the swap agreements and the value of short-term investments. Book value represents the cost of short-term and equity investments. Current value represents the fair value of the short-term investments and the change in the value of the underlying indices from the inception of the swap agreements. Domestic equity swaps’ increase (decrease) primarily reflects the net changes in the domestic indices and short-term investments.
Counterparty credit risk is the maximum loss amount that would be incurred if the counterparties to the derivative instrument failed to perform according to the terms of the contract, without respect to any collateral or other security, or netting arrangement.
The State Treasurer traded U.S. Treasury bond future contracts to manage duration and yield curve exposure.
To provide downside protection and enhance current income, the State Treasurer traded covered equity options on single securities for the Real Return Opportunistic Investment, and Equity Investment pools. Put options are used to protect against large negative moves in single stocks, as well as, to express interest in a security that is trading well below its intrinsic value. Call options have been used to achieve current income on single equity securities that are trading near their intrinsic value.
Securities Lending
The System, pursuant to a Securities Lending Authorization Agreement, has authorized State Street Bank and Trust Company ("State Street") to act as the System’s agent in lending System's securities to approved borrowers. State Street, as agent, enters into Securities Loan Agreements with borrowers.
During the fiscal year, State Street lent, on behalf of the State Treasurer, certain securities of the System held by State Street as custodian and received cash or other collateral including securities issued or guaranteed by the United States government. The types of securities lent were equity, and fixed income, which includes government and corporate bonds and notes. State Street does not have the ability to pledge or sell collateral securities delivered absent a borrower default. Borrowers were required to deliver collateral for each loan equal to at least 100% of the fair value of the loaned securities.
Pursuant to the Securities Lending Authorization Agreement, State Street had an obligation to indemnify the System in the event of default by a borrower. There were no failures by any borrowers to return loaned securities or pay distributions thereon during the fiscal year that resulted in a declaration or notice of default of the Borrower.
FINANCIAL SECTION NOTES TO BASIC FINANCIAL STATEMENTS (CONTINUED)
MICHIGAN PUBLIC SCHOOL EMPLOYEES’ RETIREMENT SYSTEM ● 41
During the fiscal year, the System and the borrowers maintained the right to terminate securities lending transactions upon notice. The cash collateral received on each loan was invested, together with the cash collateral of other qualified tax-exempt plan lenders, in a collective investment pool. As of September 30, 2016, such investment pool had an average duration of 1.6 years and an average weighted final maturity of 1.6 years for USD. Because the loans were terminable at will their duration did not generally match the duration of the investments made with cash collateral. On September 30, 2016, the System had no credit risk exposure to borrowers. The fair value of collateral held and the fair value (USD) of securities on loan for the client as of September 30, 2016, was $3,336,346,583 and $3,277,163,743, respectively.
Risk
In accordance with GASB Statement No. 40, investments require certain disclosures regarding policies and practices and the risks associated with them. The credit risk, (including custodial credit risk and concentration of credit risk), the interest rate risk, and the foreign currency risk are discussed in the following paragraphs. Amounts represent the pro rata share of the underlying investments as required by GASB Statement No. 40. These investments are held in internal investment pools and reported as such in the financial statements.
Credit Risk – Credit risk is the risk that an issuer will not fulfill its obligations.
Short-Term Fixed Income Investments – Prime commercial paper investments must be rated A-1 or P-1 at the time of purchase as rated by two national rating services as specified in Public Act 314 of 1965, as amended. Borrowers must have at least $400.0 million in commercial paper outstanding, and the State Treasurer may not invest in more than 10% of the borrower's outstanding debt. The investments are further limited to $200.0 million in any borrower, unless the borrower has an A-1+ rating in which case the investment is not to exceed $300.0 million.
Long-Term Fixed Income Investments – Investment grade and noninvestment grade securities may be acquired in compliance with the parameters set forth in Public Act 314 and the State Treasurer’s Investment Policy Statement for the System. Public Act 314 defines investment grade as investments in the top four major grades, rated by two national rating services. At September 30, 2016, the System was in compliance with Public Act 314 and the Investment Policy Statement in all material aspects.
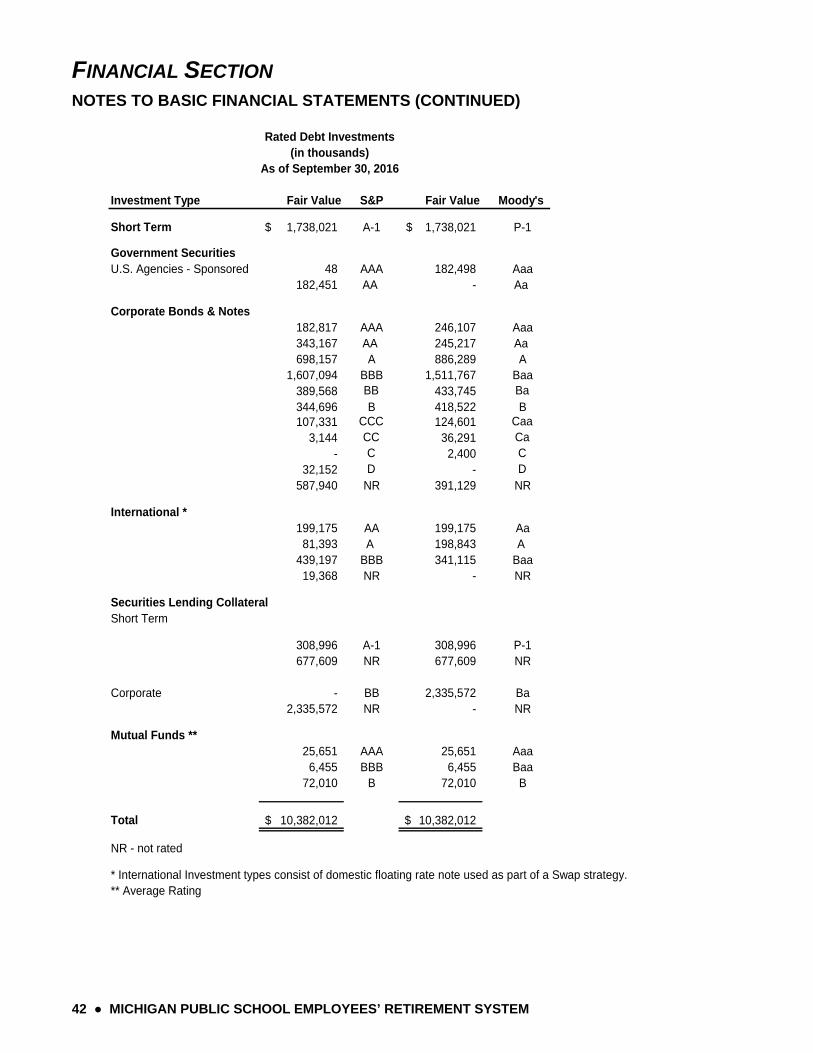
FINANCIAL SECTION
NOTES TO BASIC FINANCIAL STATEMENTS (CONTINUED)
42 ● MICHIGAN PUBLIC SCHOOL EMPLOYEES’ RETIREMENT SYSTEM
Investment Type Fair Value S&P Fair Value Moody's
Short Term 1,738,021$ A-1 1,738,021$ P-1
Government SecuritiesU.S. Agencies - Sponsored 48 AAA 182,498 Aaa
182,451 AA - Aa
Corporate Bonds & Notes182,817 AAA 246,107 Aaa343,167 AA 245,217 Aa 698,157 A 886,289 A
1,607,094 BBB 1,511,767 Baa389,568 BB 433,745 Ba 344,696 B 418,522 B107,331 CCC 124,601 Caa
3,144 CC 36,291 Ca - C 2,400 C
32,152 D - D587,940 NR 391,129 NR
International *199,175 AA 199,175 Aa81,393 A 198,843 A
439,197 BBB 341,115 Baa19,368 NR - NR
Securities Lending CollateralShort Term
308,996 A-1 308,996 P-1677,609 NR 677,609 NR
Corporate - BB 2,335,572 Ba2,335,572 NR - NR
Mutual Funds **25,651 AAA 25,651 Aaa
6,455 BBB 6,455 Baa72,010 B 72,010 B
Total 10,382,012$ 10,382,012$
NR - not rated
* International Investment types consist of domestic floating rate note used as part of a Swap strategy. ** Average Rating
Rated Debt Investments(in thousands)
As of September 30, 2016
FINANCIAL SECTION NOTES TO BASIC FINANCIAL STATEMENTS (CONTINUED)
MICHIGAN PUBLIC SCHOOL EMPLOYEES’ RETIREMENT SYSTEM ● 43
Custodial Credit Risk – Custodial credit risk for investments is the risk that, in the event of a failure of the counterparty, the State will not be able to recover the value of the investment or collateral securities that are in the possession of an outside party.
Investment securities are exposed to custodial credit risk if the securities are uninsured, are not registered in the name of the government and are held by either the counterparty or the counterparty’s trust department or agent, but not in the government name.
The State Treasurer does not have a policy for custodial credit risk. However, the State’s custodial bank had a credit rating of A at September 30, 2016. As of September 30, 2016, no securities were exposed to custodial credit risk.
Concentration of Credit Risk – Concentration of credit risk is the risk of loss attributed to the magnitude of a government’s investment in a single issuer.
Other than obligations issued, assumed or guaranteed by the United States, its agencies or United States government sponsored enterprises, the System is prohibited by Public Act 314 of 1965, as amended, from investing more than 5% of the outstanding obligations of any one issuer or investing more than 5% of a System’s assets in the obligations of any one issuer. When calculating the amount of outstanding obligations, the System includes publicly issued and privately held debt.
At September 30, 2016, there were no investments in any single issuer that accounted for more than 5% of the System’s assets.
Interest Rate Risk – Fixed Income Investments – Interest rate risk is the risk that changes in interest rates of debt investments will adversely affect the fair value of an investment.
The State Treasurer’s policy states that cash equivalents are invested in short-term fixed income securities with an average weighted maturity of less than one year to provide liquidity and safety of principal from capital market and default risk. At September 30, 2016, the fair value of the System’s prime commercial paper was $1,738.0 million with the weighted average maturity of 21 days.
The State Treasurer does not have a policy regarding interest rate risk for long-term debt investments. However, the trust funds are invested with a long-term strategy. The goal is to balance higher returns while accepting minimum risk for the return. Analyzing the yield curve on individual securities as compared to U.S. Treasuries determines, in part, what is an acceptable risk for the return. Therefore, market conditions such as lower interest rates result in shorter duration and higher interest rates result in longer duration.
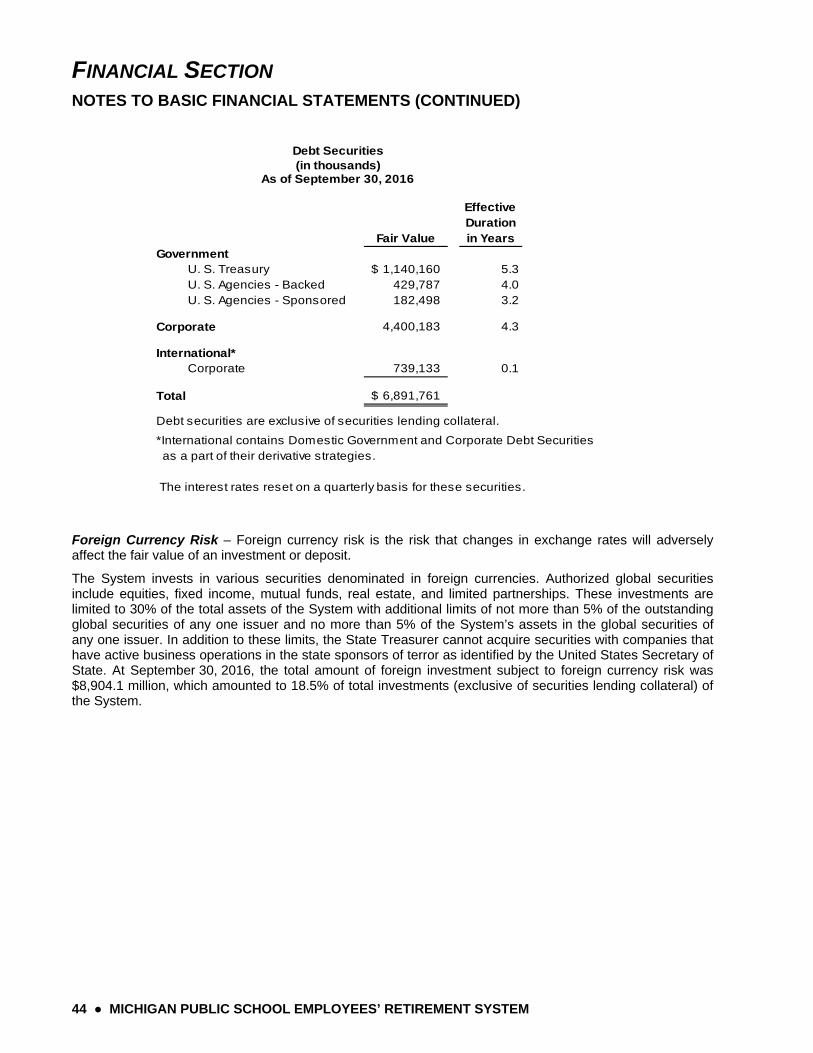
FINANCIAL SECTION
NOTES TO BASIC FINANCIAL STATEMENTS (CONTINUED)
44 ● MICHIGAN PUBLIC SCHOOL EMPLOYEES’ RETIREMENT SYSTEM
Foreign Currency Risk – Foreign currency risk is the risk that changes in exchange rates will adversely affect the fair value of an investment or deposit.
The System invests in various securities denominated in foreign currencies. Authorized global securities include equities, fixed income, mutual funds, real estate, and limited partnerships. These investments are limited to 30% of the total assets of the System with additional limits of not more than 5% of the outstanding global securities of any one issuer and no more than 5% of the System’s assets in the global securities of any one issuer. In addition to these limits, the State Treasurer cannot acquire securities with companies that have active business operations in the state sponsors of terror as identified by the United States Secretary of State. At September 30, 2016, the total amount of foreign investment subject to foreign currency risk was $8,904.1 million, which amounted to 18.5% of total investments (exclusive of securities lending collateral) of the System.
Fair Value
Effective Duration in Years
Government U. S. Treasury 1,140,160$ 5.3 U. S. Agencies - Backed 429,787 4.0 U. S. Agencies - Sponsored 182,498 3.2
Corporate 4,400,183 4.3
International* Corporate 739,133 0.1
Total 6,891,761$
Debt securities are exclusive of securities lending collateral.
as a part of their derivative strategies.
The interest rates reset on a quarterly basis for these securities.
*International contains Domestic Government and Corporate Debt Securities
Debt Securities(in thousands)
As of September 30, 2016
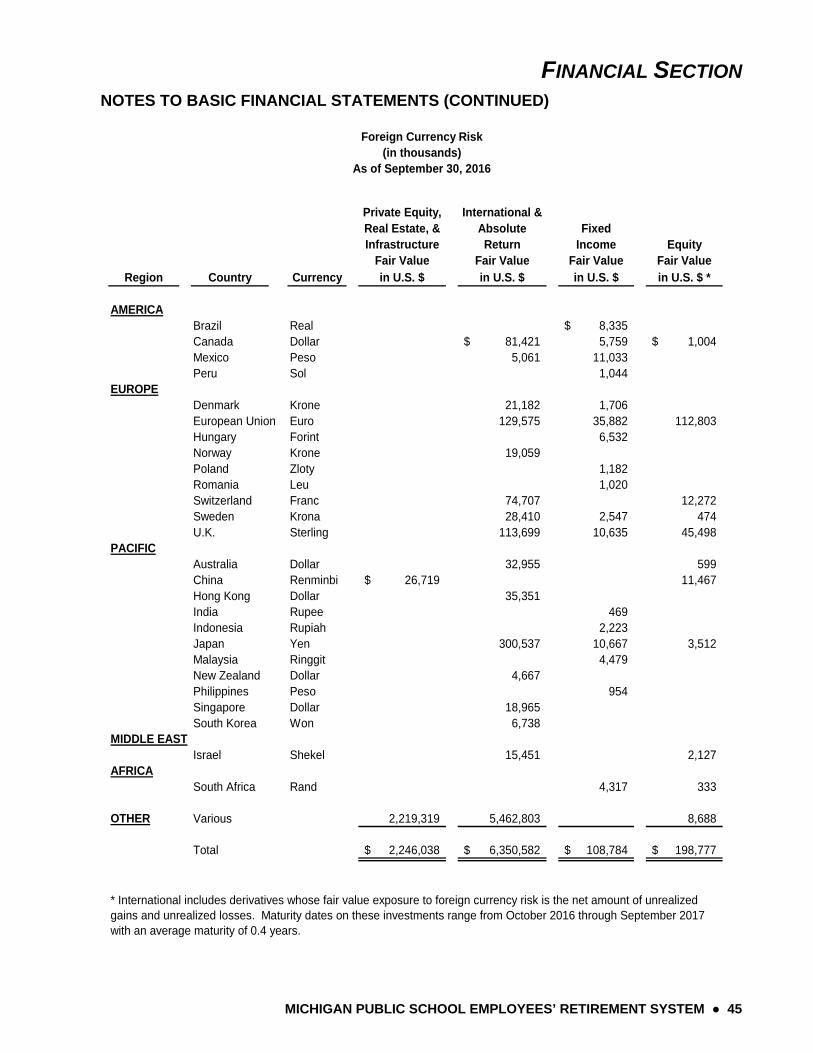
FINANCIAL SECTION NOTES TO BASIC FINANCIAL STATEMENTS (CONTINUED)
MICHIGAN PUBLIC SCHOOL EMPLOYEES’ RETIREMENT SYSTEM ● 45
Private Equity,Real Estate, &Infrastructure
Fair Value
International &Absolute Return
Fair Value
Fixed Income
Fair ValueEquity
Fair Value Region Country Currency in U.S. $ in U.S. $ in U.S. $ in U.S. $ *
AMERICABrazil Real 8,335$ Canada Dollar 81,421$ 5,759 1,004$ Mexico Peso 5,061 11,033 Peru Sol 1,044
EUROPEDenmark Krone 21,182 1,706 European Union Euro 129,575 35,882 112,803 Hungary Forint 6,532 Norway Krone 19,059 Poland Zloty 1,182 Romania Leu 1,020 Switzerland Franc 74,707 12,272 Sweden Krona 28,410 2,547 474 U.K. Sterling 113,699 10,635 45,498
PACIFICAustralia Dollar 32,955 599 China Renminbi 26,719$ 11,467 Hong Kong Dollar 35,351 India Rupee 469 Indonesia Rupiah 2,223 Japan Yen 300,537 10,667 3,512 Malaysia Ringgit 4,479 New Zealand Dollar 4,667 Philippines Peso 954 Singapore Dollar 18,965 South Korea Won 6,738
MIDDLE EASTIsrael Shekel 15,451 2,127
AFRICASouth Africa Rand 4,317 333
OTHER Various 2,219,319 5,462,803 8,688
Total 2,246,038$ 6,350,582$ 108,784$ 198,777$
Foreign Currency Risk(in thousands)
As of September 30, 2016
* International includes derivatives whose fair value exposure to foreign currency risk is the net amount of unrealized gains and unrealized losses. Maturity dates on these investments range from October 2016 through September 2017 with an average maturity of 0.4 years.
FINANCIAL SECTION
NOTES TO BASIC FINANCIAL STATEMENTS (CONTINUED)
46 ● MICHIGAN PUBLIC SCHOOL EMPLOYEES’ RETIREMENT SYSTEM
Fair Value Measurements
The Retirement System categorizes its fair value measurements within the fair value hierarchy established by generally accepted accounting principles. The hierarchy is based on the valuation inputs used to measure the fair value of the asset. Not all investments held by the Retirement System are recorded at fair value. GASB 72 allows for certain investments to be recorded at cost (or amortized cost or any other valuation method), and therefore, they are not presented in the fair value hierarchy table. Equity and fixed income securities classified in Level 1 of the fair value hierarchy are valued using prices quoted in active markets for those securities. Equity Swaps and Fixed Income securities classified in Level 2 of the fair value hierarchy are valued using a matrix pricing technique and other significant observable inputs. Equity and fixed income securities classified as Level 3 of the fair value hierarchy are valued using a third party data and reports that are unobservable. Securities reported at Net Asset Value (NAV) are valued using the most recent third party statement adjusted for cash flows as of September 30, 2016. Investments that are measured at fair value using the Net Asset Value per share (or its equivalent) as a practical expedient are not classified in the fair value hierarchy on the following page.
In instances where inputs used to measure fair value fall into different levels in the above fair value hierarchy, fair value measurements in their entirety are categorized based on the lowest level input that is significant to the valuation. The Retirement System’s assessment of the significance of particular inputs to these fair value measurements requires judgment and considers factors specific to each asset or liability.
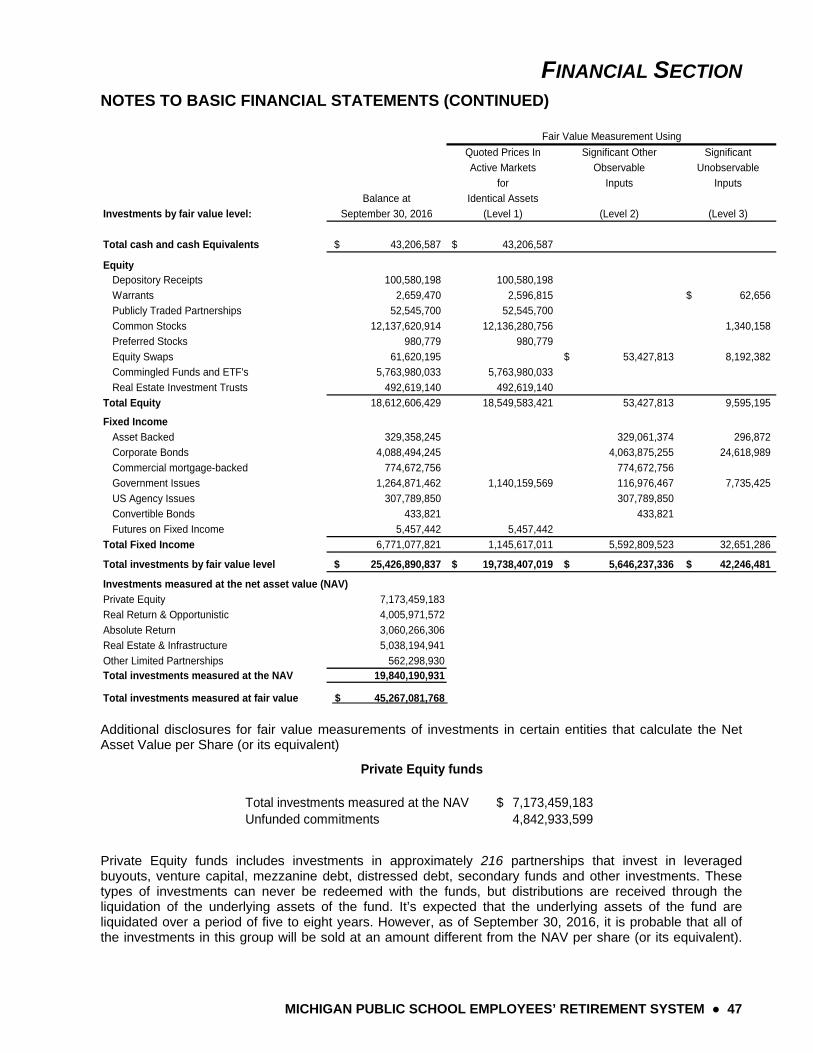
FINANCIAL SECTION NOTES TO BASIC FINANCIAL STATEMENTS (CONTINUED)
MICHIGAN PUBLIC SCHOOL EMPLOYEES’ RETIREMENT SYSTEM ● 47
Quoted Prices In Significant Other Significant
Active Markets Observable Unobservable
for Inputs Inputs
Balance at Identical Assets
Investments by fair value level: September 30, 2016 (Level 1) (Level 2) (Level 3)
Total cash and cash Equivalents 43,206,587$ 43,206,587$
EquityDepository Receipts 100,580,198 100,580,198
Warrants 2,659,470 2,596,815 62,656$
Publicly Traded Partnerships 52,545,700 52,545,700
Common Stocks 12,137,620,914 12,136,280,756 1,340,158
Preferred Stocks 980,779 980,779
Equity Swaps 61,620,195 53,427,813$ 8,192,382
Commingled Funds and ETF's 5,763,980,033 5,763,980,033
Real Estate Investment Trusts 492,619,140 492,619,140
Total Equity 18,612,606,429 18,549,583,421 53,427,813 9,595,195
Fixed Income
Asset Backed 329,358,245 329,061,374 296,872
Corporate Bonds 4,088,494,245 4,063,875,255 24,618,989
Commercial mortgage-backed 774,672,756 774,672,756
Government Issues 1,264,871,462 1,140,159,569 116,976,467 7,735,425
US Agency Issues 307,789,850 307,789,850
Convertible Bonds 433,821 433,821
Futures on Fixed Income 5,457,442 5,457,442
Total Fixed Income 6,771,077,821 1,145,617,011 5,592,809,523 32,651,286
Total investments by fair value level 25,426,890,837$ 19,738,407,019$ 5,646,237,336$ 42,246,481$
Investments measured at the net asset value (NAV)
Private Equity 7,173,459,183
Real Return & Opportunistic 4,005,971,572
Absolute Return 3,060,266,306
Real Estate & Infrastructure 5,038,194,941
Other Limited Partnerships 562,298,930 Total investments measured at the NAV 19,840,190,931
Total investments measured at fair value $ 45,267,081,768
Fair Value Measurement Using
Additional disclosures for fair value measurements of investments in certain entities that calculate the Net Asset Value per Share (or its equivalent)
Total investments measured at the NAV 7,173,459,183$ Unfunded commitments 4,842,933,599
Private Equity funds
Private Equity funds includes investments in approximately 216 partnerships that invest in leveraged buyouts, venture capital, mezzanine debt, distressed debt, secondary funds and other investments. These types of investments can never be redeemed with the funds, but distributions are received through the liquidation of the underlying assets of the fund. It’s expected that the underlying assets of the fund are liquidated over a period of five to eight years. However, as of September 30, 2016, it is probable that all of the investments in this group will be sold at an amount different from the NAV per share (or its equivalent).
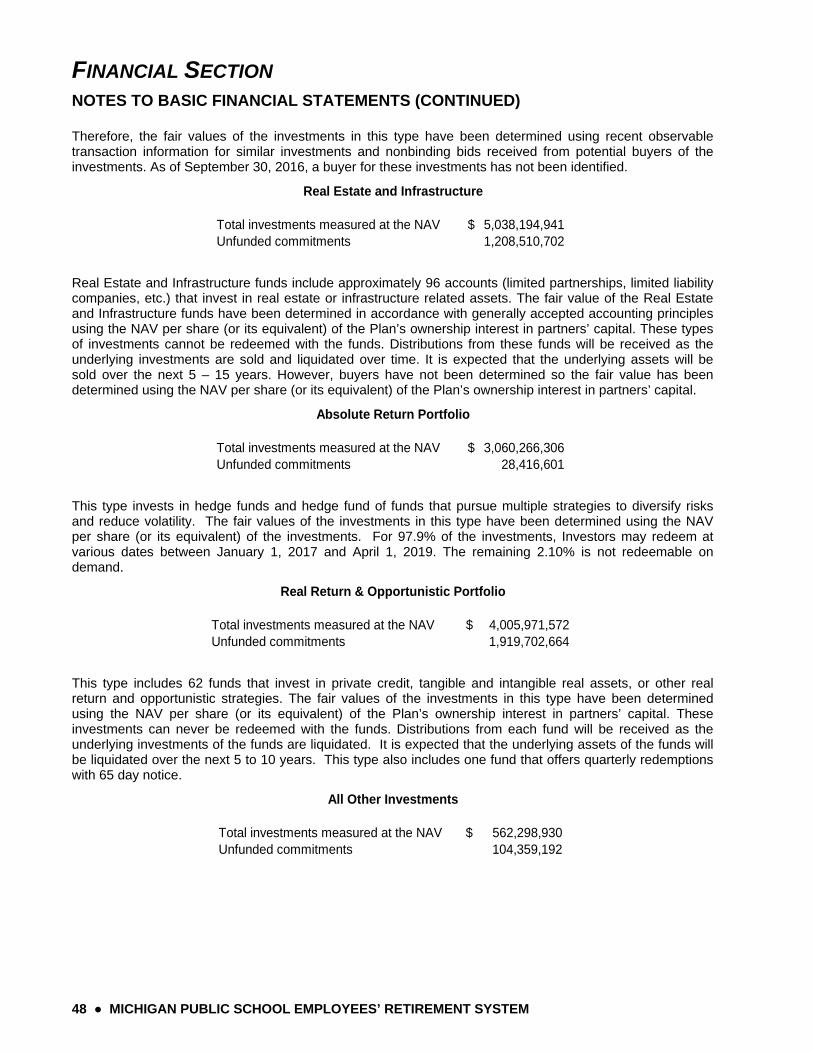
FINANCIAL SECTION
NOTES TO BASIC FINANCIAL STATEMENTS (CONTINUED)
48 ● MICHIGAN PUBLIC SCHOOL EMPLOYEES’ RETIREMENT SYSTEM
Therefore, the fair values of the investments in this type have been determined using recent observable transaction information for similar investments and nonbinding bids received from potential buyers of the investments. As of September 30, 2016, a buyer for these investments has not been identified.
Total investments measured at the NAV 5,038,194,941$ Unfunded commitments 1,208,510,702
Real Estate and Infrastructure
Real Estate and Infrastructure funds include approximately 96 accounts (limited partnerships, limited liability companies, etc.) that invest in real estate or infrastructure related assets. The fair value of the Real Estate and Infrastructure funds have been determined in accordance with generally accepted accounting principles using the NAV per share (or its equivalent) of the Plan’s ownership interest in partners’ capital. These types of investments cannot be redeemed with the funds. Distributions from these funds will be received as the underlying investments are sold and liquidated over time. It is expected that the underlying assets will be sold over the next 5 – 15 years. However, buyers have not been determined so the fair value has been determined using the NAV per share (or its equivalent) of the Plan’s ownership interest in partners’ capital.
Total investments measured at the NAV 3,060,266,306$ Unfunded commitments 28,416,601
Absolute Return Portfolio
This type invests in hedge funds and hedge fund of funds that pursue multiple strategies to diversify risks and reduce volatility. The fair values of the investments in this type have been determined using the NAV per share (or its equivalent) of the investments. For 97.9% of the investments, Investors may redeem at various dates between January 1, 2017 and April 1, 2019. The remaining 2.10% is not redeemable on demand.
Total investments measured at the NAV 4,005,971,572$ Unfunded commitments 1,919,702,664
Real Return & Opportunistic Portfolio
This type includes 62 funds that invest in private credit, tangible and intangible real assets, or other real return and opportunistic strategies. The fair values of the investments in this type have been determined using the NAV per share (or its equivalent) of the Plan’s ownership interest in partners’ capital. These investments can never be redeemed with the funds. Distributions from each fund will be received as the underlying investments of the funds are liquidated. It is expected that the underlying assets of the funds will be liquidated over the next 5 to 10 years. This type also includes one fund that offers quarterly redemptions with 65 day notice.
Total investments measured at the NAV 562,298,930$ Unfunded commitments 104,359,192
All Other Investments
FINANCIAL SECTION NOTES TO BASIC FINANCIAL STATEMENTS (CONTINUED)
MICHIGAN PUBLIC SCHOOL EMPLOYEES’ RETIREMENT SYSTEM ● 49
The balance of plan assets reported at fair value includes:
one limited partnership (lp) that invests in the equity of Japanese companies. This lp permits partners to withdraw funds quarterly with 180 days of advanced notice.
two limited partnerships that invest in senior secured debt financing of a 3rd party investment fund. This investment cannot be redeemed by limited partners. The debt has a 10 year maturity, with partnership distributions to include principal as the loan collateral matures four years after the initial investment.
one limited partnership permitting partners to redeem its debt securities quarterly with 60 days of advanced notice.
NOTE 6 – ACCOUNTING CHANGES
GASB Statement No. 72, Fair Value Measurement and Application, was established to provide guidance for determining a fair value measurement for financial reporting purposes. This statement also provides guidance for applying fair value to certain investments and disclosures related to all fair value measurements. This statement was implemented in fiscal year 2016.
NOTE 7 – NEW ACCOUNTING PRONOUNCEMENTS
The Governmental Accounting Standards Board (GASB) issued Statement No. 74, Financial Reporting for Postemployment Benefit Plans Other Than Pension Plans. The objective of this Statement is to improve the usefulness of information about postemployment benefits other than pensions (other postemployment benefits or OPEB) included in the general purpose external financial reports of state and local governmental OPEB plans for making decisions and assessing accountability. This Statement replaces Statements No. 43, Financial Reporting for Postemployment Benefit Plans other than Pension Plans, as amended, and No. 57, OPEB Measurements by Agent Employers and Agent Multiple-Employer Plans. It also includes requirements for defined contribution OPEB plans that replace the requirements for those OPEB plans in Statement No. 25, Financial Reporting for Defined Benefit Pension Plans and Note Disclosures for Defined Contribution Plans, as amended, Statement 43, and Statement No. 50, Pension Disclosures. This Statement is effective for financial statements for fiscal years beginning after June 15, 2016.
GASB issued Statement No. 75, Accounting and Financial Reporting for Postemployment Benefits Other Than Pensions. The objective of this Statement is to address accounting and financial reporting for OPEB that is provided to the employees of state and local governmental employers. This Statement establishes standards for recognizing and measuring liabilities, deferred outflows of resources, deferred inflows of resources, and expense/expenditures. For defined benefit OPEB, this Statement identifies the methods and assumptions that are required to be used to project benefit payments, discount projected benefit payments to their actuarial present value, and attribute that present value to periods of employee service. Note disclosure and required supplementary information requirements about defined benefit OPEB also are addressed. This Statement is effective for participating employers for the fiscal years beginning after June 15, 2017.
GASB issued Statement No. 82, Pension Issues—an amendment of GASB Statements No. 67, No. 68 and No. 73. This statement addresses issues regarding: 1) the presentation of payroll-related measures in required supplementary information; 2) the selection of assumptions and the treatment of deviations from the guidance in an actuarial standard of practice for financial reporting purposes; and 3) the classification of payments made by employers to satisfy employee (member) contribution requirements. This Statement is effective for financial statements for fiscal years beginning after June 15, 2016.
FINANCIAL SECTION
NOTES TO BASIC FINANCIAL STATEMENTS (CONTINUED)
50 ● MICHIGAN PUBLIC SCHOOL EMPLOYEES’ RETIREMENT SYSTEM
NOTE 8 – COMMITMENTS AND CONTINGENCIES
Under the Administrative Procedures Act, members may appeal a decision made by the Board. Once the administrative procedure has been exhausted, the decision may be appealed in Michigan’s court system. Various cases that have exhausted the administrative procedures have been appealed in the court system. These cases are in the normal course of business and the System does not anticipate any material loss as a result of the contingent liabilities.
Pending Litigation
Michigan Supreme Court No. 145924
These cases are consolidated and are pending on the second application for leave in the Michigan Supreme Court (MSC). The first application for leave resulted in the case being remanded to the Court of Appeals (COA). Plaintiffs are contesting the 3% contribution required by MCL 38.1343e, as enacted by Public Act 75 of 2010, to be made by members of the Michigan Public School Employees’ Retirement System. Plaintiffs allege that the underlying retiree healthcare contribution is unconstitutional on grounds that it allegedly violates the contracts, takings, and substantive due process clauses of the State and Unites States Constitutions. The trial court ruled in Plaintiffs’ favor and entered a preliminary injunction requiring that the Plaintiffs’ contributions not be applied toward the funding of retiree healthcare, but instead to be placed in an interest bearing account. The trial court ruling was affirmed by the COA. On the first application for leave to the MSC, the MSC ordered that the COA’s decision be vacated and that the constitutionality of Public Act 75 be reexamined in light of the enactment of Public Act 300 of 2012 and MSC’s April 2015 decision regarding the same. In June 2016, the COA reaffirmed its earlier decision and a second application for leave to the MSC was made in July 2016 and remains pending. The 3% contribution collected under Public Act 75, which continues to be held in escrow, totals approximately $553 million (including interest).
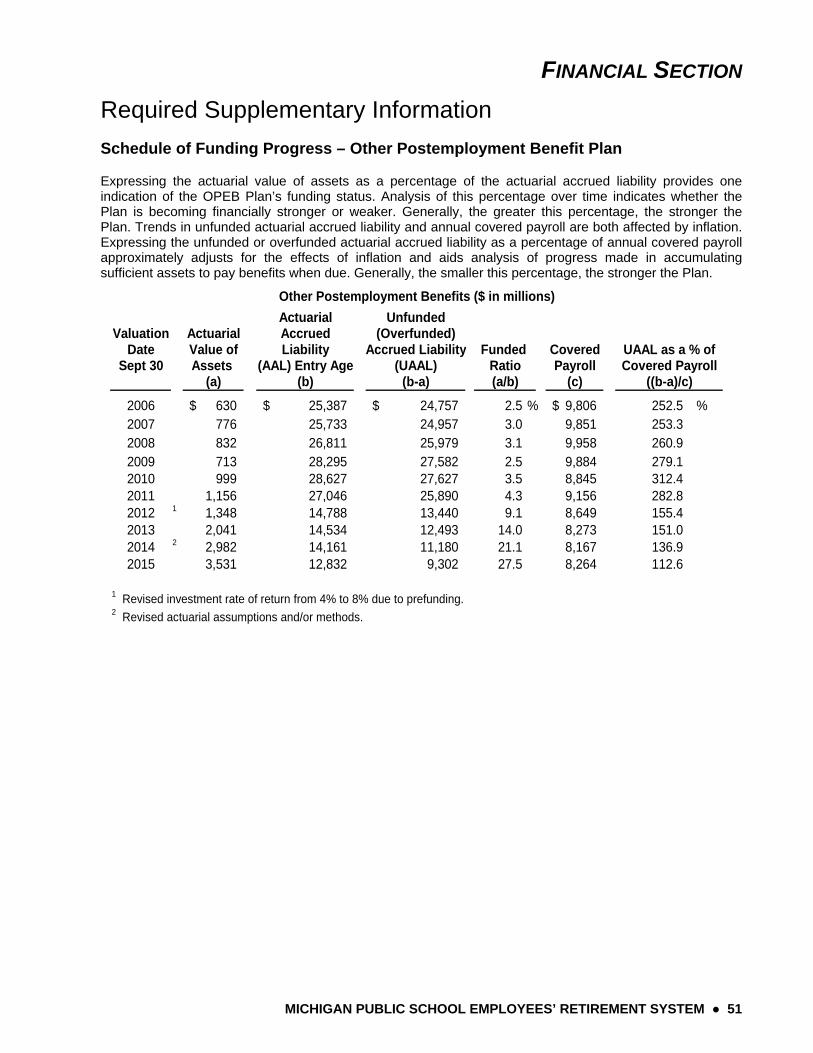
FINANCIAL SECTION
MICHIGAN PUBLIC SCHOOL EMPLOYEES’ RETIREMENT SYSTEM ● 51
Required Supplementary Information
Schedule of Funding Progress – Other Postemployment Benefit Plan
Expressing the actuarial value of assets as a percentage of the actuarial accrued liability provides one indication of the OPEB Plan’s funding status. Analysis of this percentage over time indicates whether the Plan is becoming financially stronger or weaker. Generally, the greater this percentage, the stronger the Plan. Trends in unfunded actuarial accrued liability and annual covered payroll are both affected by inflation. Expressing the unfunded or overfunded actuarial accrued liability as a percentage of annual covered payroll approximately adjusts for the effects of inflation and aids analysis of progress made in accumulating sufficient assets to pay benefits when due. Generally, the smaller this percentage, the stronger the Plan.
Actuarial UnfundedValuation Actuarial Accrued (Overfunded)
Date Value of Liability Accrued Liability CoveredSept 30 Assets (AAL) Entry Age (UAAL) Payroll
(a) (b) (b-a) (c)
2006 630$ 25,387$ 24,757$ 2.5 % 9,806$ 252.5 %2007 776 25,733 24,957 3.0 9,851 253.32008 832 26,811 25,979 3.1 9,958 260.9 2009 713 28,295 27,582 2.5 9,884 279.1 2010 999 28,627 27,627 3.5 8,845 312.4 2011 1,156 27,046 25,890 4.3 9,156 282.8 2012 1 1,348 14,788 13,440 9.1 8,649 155.4 2013 2,041 14,534 12,493 14.0 8,273 151.0 2014 2 2,982 14,161 11,180 21.1 8,167 136.9 2015 3,531 12,832 9,302 27.5 8,264 112.6
1 Revised investment rate of return from 4% to 8% due to prefunding.2 Revised actuarial assumptions and/or methods.
Other Postemployment Benefits ($ in millions)
Funded UAAL as a % ofRatio Covered Payroll(a/b) ((b-a)/c)
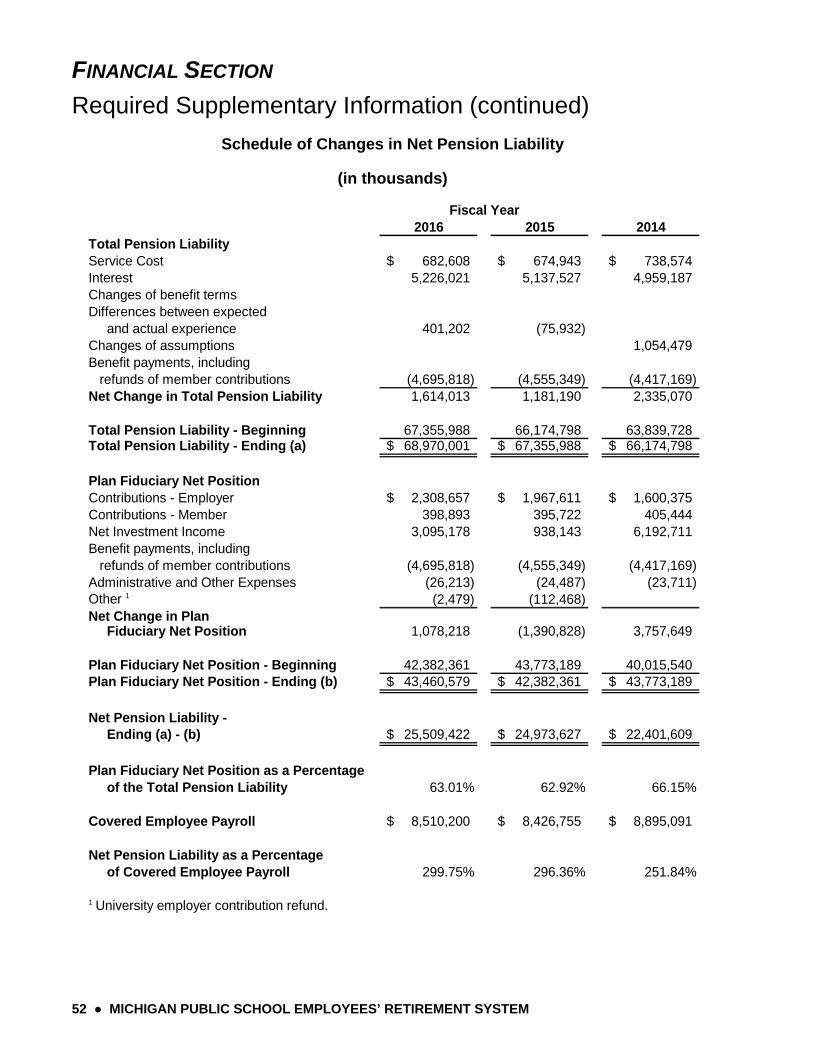
FINANCIAL SECTION
Required Supplementary Information (continued)
52 ● MICHIGAN PUBLIC SCHOOL EMPLOYEES’ RETIREMENT SYSTEM
Schedule of Changes in Net Pension Liability
(in thousands)
2016 2015 2014Total Pension LiabilityService Cost 682,608$ 674,943$ 738,574$ Interest 5,226,021 5,137,527 4,959,187 Changes of benefit termsDifferences between expected and actual experience 401,202 (75,932) Changes of assumptions 1,054,479 Benefit payments, including refunds of member contributions (4,695,818) (4,555,349) (4,417,169) Net Change in Total Pension Liability 1,614,013 1,181,190 2,335,070
Total Pension Liability - Beginning 67,355,988 66,174,798 63,839,728 Total Pension Liability - Ending (a) 68,970,001$ 67,355,988$ 66,174,798$
Plan Fiduciary Net PositionContributions - Employer 2,308,657$ 1,967,611$ 1,600,375$ Contributions - Member 398,893 395,722 405,444 Net Investment Income 3,095,178 938,143 6,192,711 Benefit payments, including refunds of member contributions (4,695,818) (4,555,349) (4,417,169) Administrative and Other Expenses (26,213) (24,487) (23,711) Other 1 (2,479) (112,468) Net Change in Plan Fiduciary Net Position 1,078,218 (1,390,828) 3,757,649
Plan Fiduciary Net Position - Beginning 42,382,361 43,773,189 40,015,540 Plan Fiduciary Net Position - Ending (b) 43,460,579$ 42,382,361$ 43,773,189$
Net Pension Liability - Ending (a) - (b) 25,509,422$ 24,973,627$ 22,401,609$
Plan Fiduciary Net Position as a Percentage of the Total Pension Liability 63.01% 62.92% 66.15%
Covered Employee Payroll 8,510,200$ 8,426,755$ 8,895,091$
Net Pension Liability as a Percentage of Covered Employee Payroll 299.75% 296.36% 251.84%
1 University employer contribution refund.
Fiscal Year
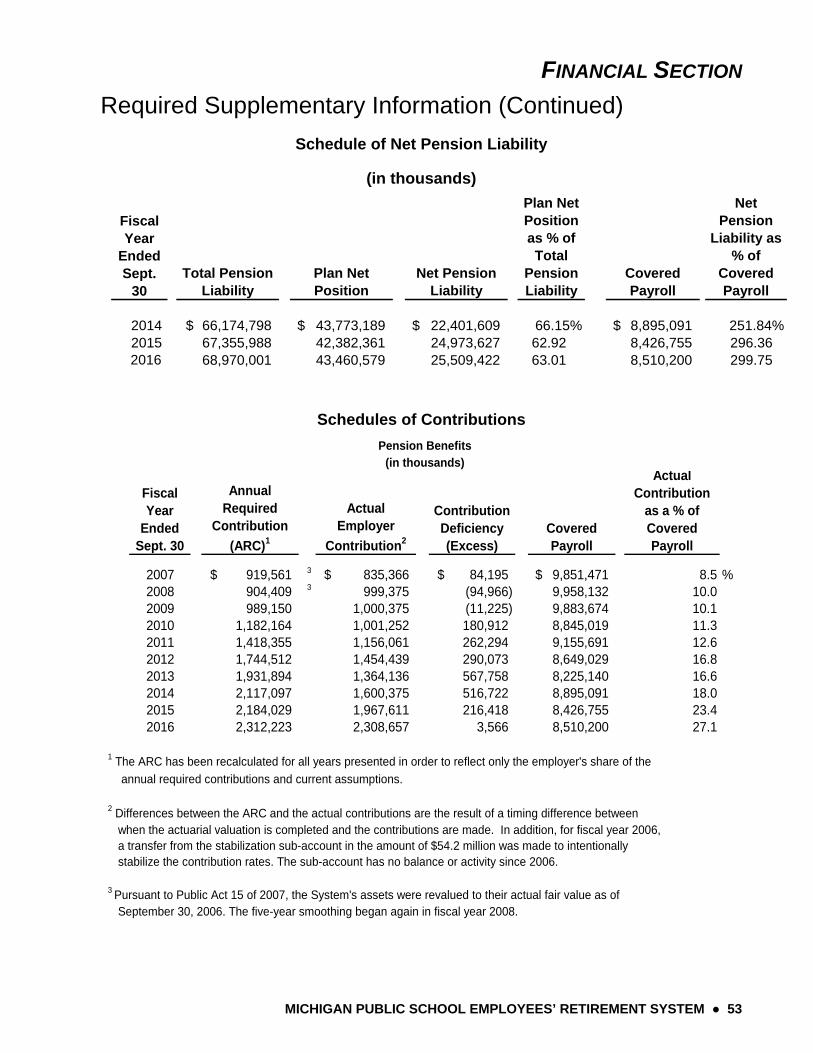
FINANCIAL SECTION
Required Supplementary Information (Continued)
MICHIGAN PUBLIC SCHOOL EMPLOYEES’ RETIREMENT SYSTEM ● 53
Schedule of Net Pension Liability
(in thousands)
Total Pension Liability
Plan Net Position
Net Pension Liability
Plan Net Position as % of Total
Pension Liability
Covered Payroll
Net Pension
Liability as % of
Covered Payroll
2014 66,174,798$ 43,773,189$ 22,401,609$ 66.15% 8,895,091$ 251.84%2015 67,355,988 42,382,361 24,973,627 62.92 8,426,755 296.362016 68,970,001 43,460,579 25,509,422 63.01 8,510,200 299.75
Fiscal Year
Ended Sept.
30
Schedules of Contributions
Fiscal Year
EndedSept. 30
AnnualRequired
Contribution
(ARC)1
ActualEmployer
Contribution2
ContributionDeficiency(Excess)
CoveredPayroll
ActualContribution
as a % ofCovered Payroll
2007 919,561$ 3 835,366$ 84,195$ 9,851,471$ 8.5 %2008 904,409 3 999,375 (94,966) 9,958,132 10.02009 989,150 1,000,375 (11,225) 9,883,674 10.12010 1,182,164 1,001,252 180,912 8,845,019 11.32011 1,418,355 1,156,061 262,294 9,155,691 12.62012 1,744,512 1,454,439 290,073 8,649,029 16.82013 1,931,894 1,364,136 567,758 8,225,140 16.62014 2,117,097 1,600,375 516,722 8,895,091 18.02015 2,184,029 1,967,611 216,418 8,426,755 23.42016 2,312,223 2,308,657 3,566 8,510,200 27.1
1 The ARC has been recalculated for all years presented in order to reflect only the employer's share of the
annual required contributions and current assumptions.
2 Differences between the ARC and the actual contributions are the result of a timing difference between when the actuarial valuation is completed and the contributions are made. In addition, for fiscal year 2006, a transfer from the stabilization sub-account in the amount of $54.2 million was made to intentionally stabilize the contribution rates. The sub-account has no balance or activity since 2006.
3 Pursuant to Public Act 15 of 2007, the System's assets were revalued to their actual fair value as of September 30, 2006. The five-year smoothing began again in fiscal year 2008.
Pension Benefits(in thousands)
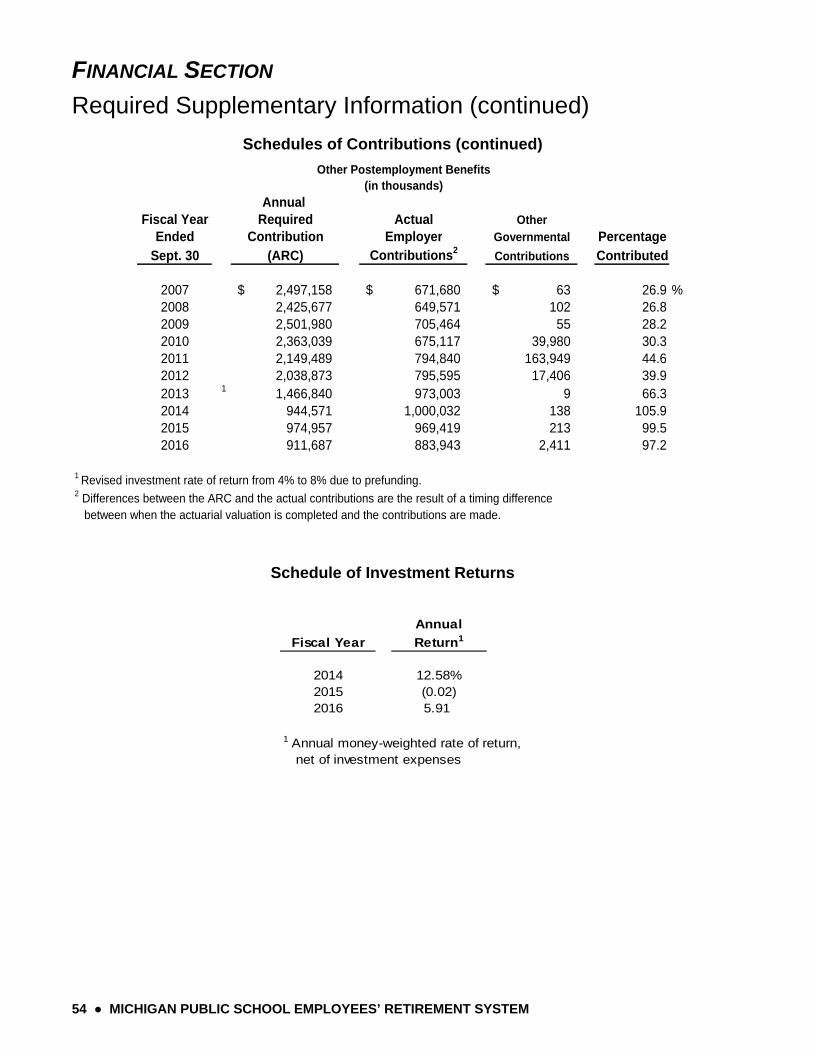
FINANCIAL SECTION
Required Supplementary Information (continued)
54 ● MICHIGAN PUBLIC SCHOOL EMPLOYEES’ RETIREMENT SYSTEM
Schedules of Contributions (continued)
Annual Fiscal Year Required Actual Other
Ended Contribution Employer Governmental PercentageSept. 30 (ARC) Contributions2
Contributions Contributed
2007 2,497,158$ 671,680$ 63$ 26.9 %2008 2,425,677 649,571 102 26.82009 2,501,980 705,464 55 28.22010 2,363,039 675,117 39,980 30.32011 2,149,489 794,840 163,949 44.62012 2,038,873 795,595 17,406 39.92013 1 1,466,840 973,003 9 66.32014 944,571 1,000,032 138 105.92015 974,957 969,419 213 99.52016 911,687 883,943 2,411 97.2
1 Revised investment rate of return from 4% to 8% due to prefunding. 2 Differences between the ARC and the actual contributions are the result of a timing difference between when the actuarial valuation is completed and the contributions are made.
Other Postemployment Benefits(in thousands)
Schedule of Investment Returns
Annual
Fiscal Year Return1
2014 12.58%2015 (0.02)2016 5.91
1 Annual money-weighted rate of return, net of investment expenses
FINANCIAL SECTION
MICHIGAN PUBLIC SCHOOL EMPLOYEES’ RETIREMENT SYSTEM ● 55
NOTE TO REQUIRED SUPPLEMENTARY INFORMATION
NOTE A – DESCRIPTION
Ten year historical trend information designed to provide information about the System’s progress made in accumulating sufficient assets to pay benefits when due is presented in the preceding schedules. Other ten year historical trend information related to the System is presented in the Statistical and Actuarial Sections of the report. This information is presented to enable the reader to assess the progress made by the System in accumulating sufficient assets to pay pension and other postemployment benefits as they become due.
The comparability of trend information is affected by changes in actuarial assumptions, benefit provisions, actuarial funding methods, accounting policies, and other changes. Those changes usually affect trends in contribution requirements and in ratios that use the pension and other postemployment benefit obligations as a factor.
The Schedule of Funding Progress and Schedules of Contributions are reported as historical trend information. The Schedule of Funding Progress is presented to measure the progress being made to accumulate sufficient assets to pay benefits when due. The Schedules of Contributions are presented to show the responsibility of the Employer in meeting the actuarial requirements to maintain the System on a sound financial basis.
The Schedule of Changes in Net Pension Liability, Schedule of Net Pension Liability, Schedule of Contributions, and Schedule of Investment Returns are schedules that are required in implementing GASB Statement No. 67. These schedules are required to show information for ten years; additional years will be displayed as it becomes available. The two schedules of the Net Pension Liability represents in actuarial terms, the accrued liability less the fair value of assets. The Schedule of Contributions is a comparison of the employer’s contributions to the actuarially determined contributions. The Schedule of Investment Returns represents a money-weighted rate of return that expresses investment performance, net of pension plan investment expense, adjusted for the changing amounts actually invested.
The information presented in the Schedule of Contributions was used in the actuarial valuation for purposes of determining actuarially determined contribution rate. Additional information as of the latest actuarial valuation for the pension plan follows.
Valuation:
Actuarially determined contribution amounts as of September 30 each year, which is two years andone day prior to the beginning of the fiscal year in which contributions are reported.
Methods and Assumptions Used to Determine Contributions for Fiscal Year 2016:
Actuarial Cost Method Entry Age, NormalAmortization Method Level Percent of Payroll, Closed
23 Years (attributable to non-window unfunded actuarial accrued liability)and 7 Years (attributable to window unfunded actuarial accrued liability).
Asset Valuation Method 5-Year Smoothed Fair ValueInflation 2.5%Salary Increases 3.5% Wage InflationInvestment Rate of Return (net of investment and administrative expenses) - MIP and Basic Plans 8.0% - Pension Plus Plan 7.0%
Retirement Age Experience-based table of rates that are specific to the type of eligibility conditions.
Mortality RP-2000 Combined Healthy Life Mortality Table, adjusted for mortality improvementsto 2020 using projection scale AA (for men, 140% of the table rates for ages 0-79, 133% of the table rates for ages 80-84, and 121.8% of the table rates for ages over 84were used and for women, 96% of the table rates were used).
Remaining Amortization Period
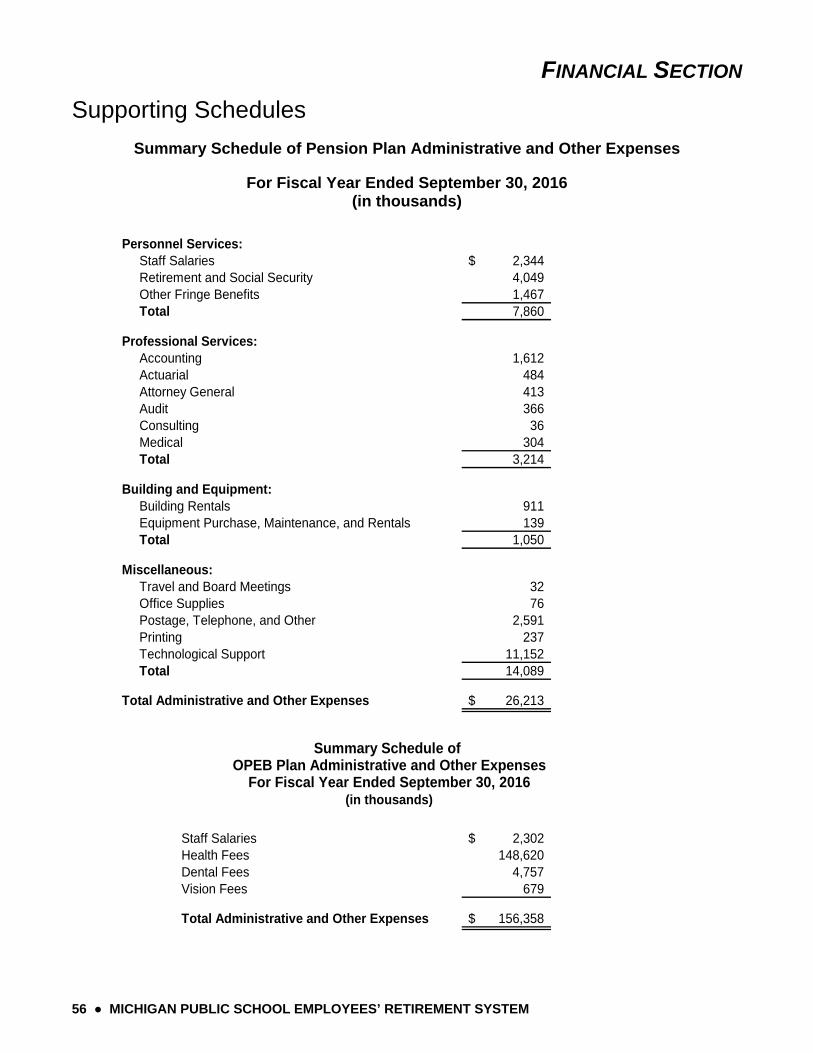
FINANCIAL SECTION
56 ● MICHIGAN PUBLIC SCHOOL EMPLOYEES’ RETIREMENT SYSTEM
Supporting Schedules
Summary Schedule of Pension Plan Administrative and Other Expenses
For Fiscal Year Ended September 30, 2016 (in thousands)
Personnel Services: Staff Salaries 2,344$ Retirement and Social Security 4,049 Other Fringe Benefits 1,467 Total 7,860
Professional Services: Accounting 1,612 Actuarial 484 Attorney General 413 Audit 366 Consulting 36 Medical 304 Total 3,214
Building and Equipment: Building Rentals 911 Equipment Purchase, Maintenance, and Rentals 139 Total 1,050
Miscellaneous: Travel and Board Meetings 32 Office Supplies 76 Postage, Telephone, and Other 2,591 Printing 237 Technological Support 11,152 Total 14,089
Total Administrative and Other Expenses 26,213$
Staff Salaries 2,302$ Health Fees 148,620 Dental Fees 4,757 Vision Fees 679
Total Administrative and Other Expenses 156,358$
(in thousands)
OPEB Plan Administrative and Other ExpensesFor Fiscal Year Ended September 30, 2016
Summary Schedule of
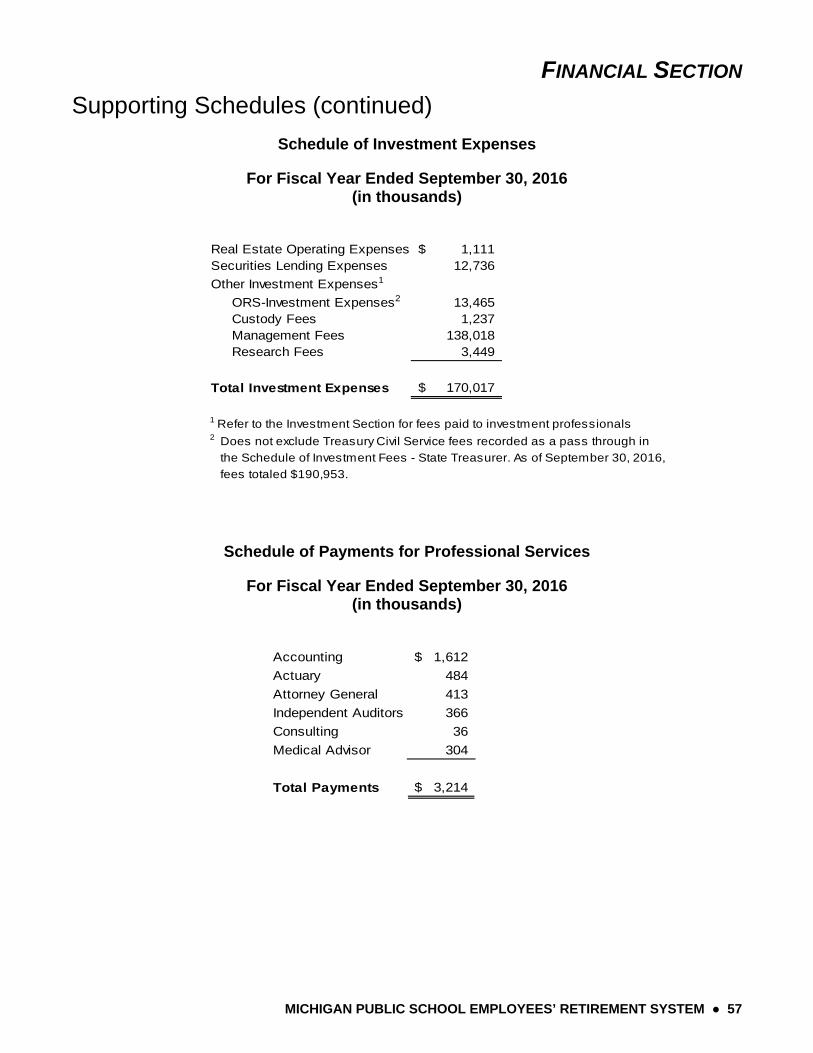
FINANCIAL SECTION
Supporting Schedules (continued)
MICHIGAN PUBLIC SCHOOL EMPLOYEES’ RETIREMENT SYSTEM ● 57
Schedule of Investment Expenses
For Fiscal Year Ended September 30, 2016 (in thousands)
Schedule of Payments for Professional Services
For Fiscal Year Ended September 30, 2016 (in thousands)
Accounting 1,612$
Actuary 484
Attorney General 413
Independent Auditors 366
Consulting 36
Medical Advisor 304
Total Payments 3,214$
Real Estate Operating Expenses 1,111$ Securities Lending Expenses 12,736
Other Investment Expenses1
ORS-Investment Expenses2 13,465 Custody Fees 1,237 Management Fees 138,018 Research Fees 3,449
Total Investment Expenses 170,017$
1 Refer to the Investment Section for fees paid to investment professionals2 Does not exclude Treasury Civil Service fees recorded as a pass through in
the Schedule of Investment Fees - State Treasurer. As of September 30, 2016,
fees totaled $190,953.
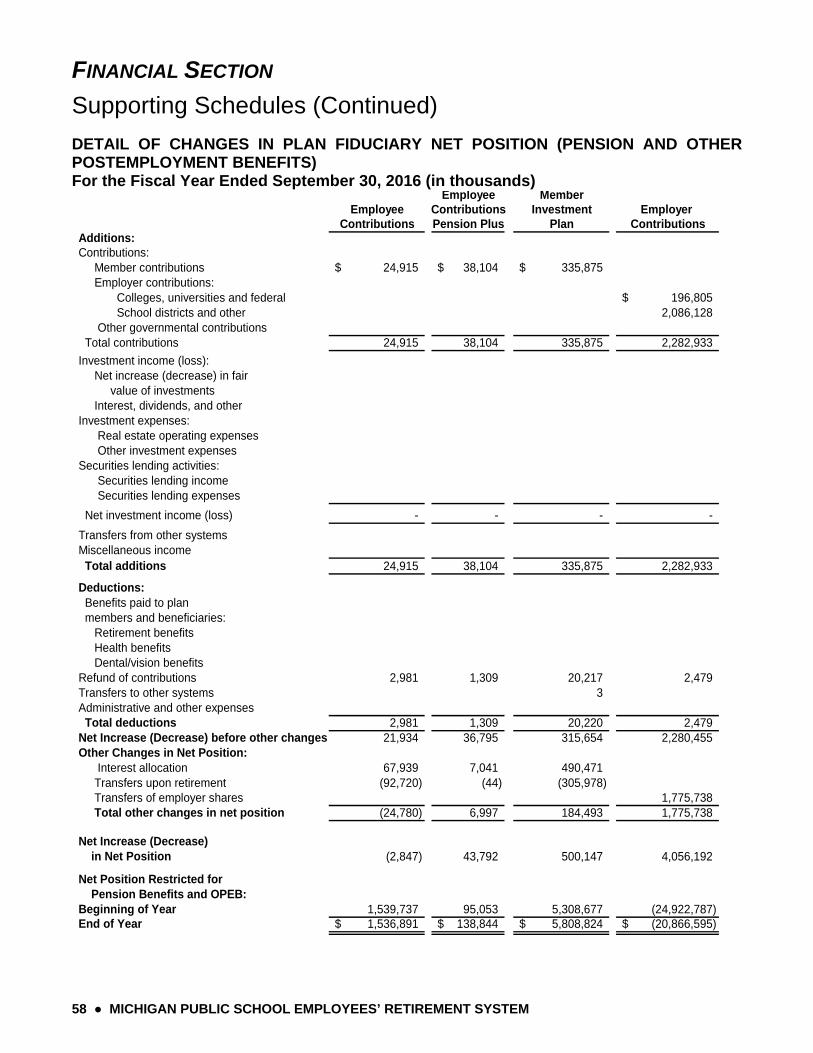
FINANCIAL SECTION
Supporting Schedules (Continued)
58 ● MICHIGAN PUBLIC SCHOOL EMPLOYEES’ RETIREMENT SYSTEM
DETAIL OF CHANGES IN PLAN FIDUCIARY NET POSITION (PENSION AND OTHER POSTEMPLOYMENT BENEFITS) For the Fiscal Year Ended September 30, 2016 (in thousands)
Employee MemberEmployee Contributions Investment Employer
Contributions Pension Plus Plan ContributionsAdditions:Contributions: Member contributions 24,915$ 38,104$ 335,875$ Employer contributions: Colleges, universities and federal 196,805$ School districts and other 2,086,128 Other governmental contributions Total contributions 24,915 38,104 335,875 2,282,933
Investment income (loss): Net increase (decrease) in fair value of investments Interest, dividends, and otherInvestment expenses: Real estate operating expenses Other investment expensesSecurities lending activities: Securities lending income Securities lending expenses
Net investment income (loss) - - - -
Transfers from other systemsMiscellaneous income Total additions 24,915 38,104 335,875 2,282,933
Deductions: Benefits paid to plan members and beneficiaries: Retirement benefits Health benefits Dental/vision benefitsRefund of contributions 2,981 1,309 20,217 2,479 Transfers to other systems 3 Administrative and other expenses Total deductions 2,981 1,309 20,220 2,479 Net Increase (Decrease) before other changes 21,934 36,795 315,654 2,280,455 Other Changes in Net Position: Interest allocation 67,939 7,041 490,471 Transfers upon retirement (92,720) (44) (305,978) Transfers of employer shares 1,775,738 Total other changes in net position (24,780) 6,997 184,493 1,775,738 Net Increase (Decrease) in Net Position (2,847) 43,792 500,147 4,056,192
Net Position Restricted for Pension Benefits and OPEB:Beginning of Year 1,539,737 95,053 5,308,677 (24,922,787) End of Year 1,536,891$ 138,844$ 5,808,824$ (20,866,595)$
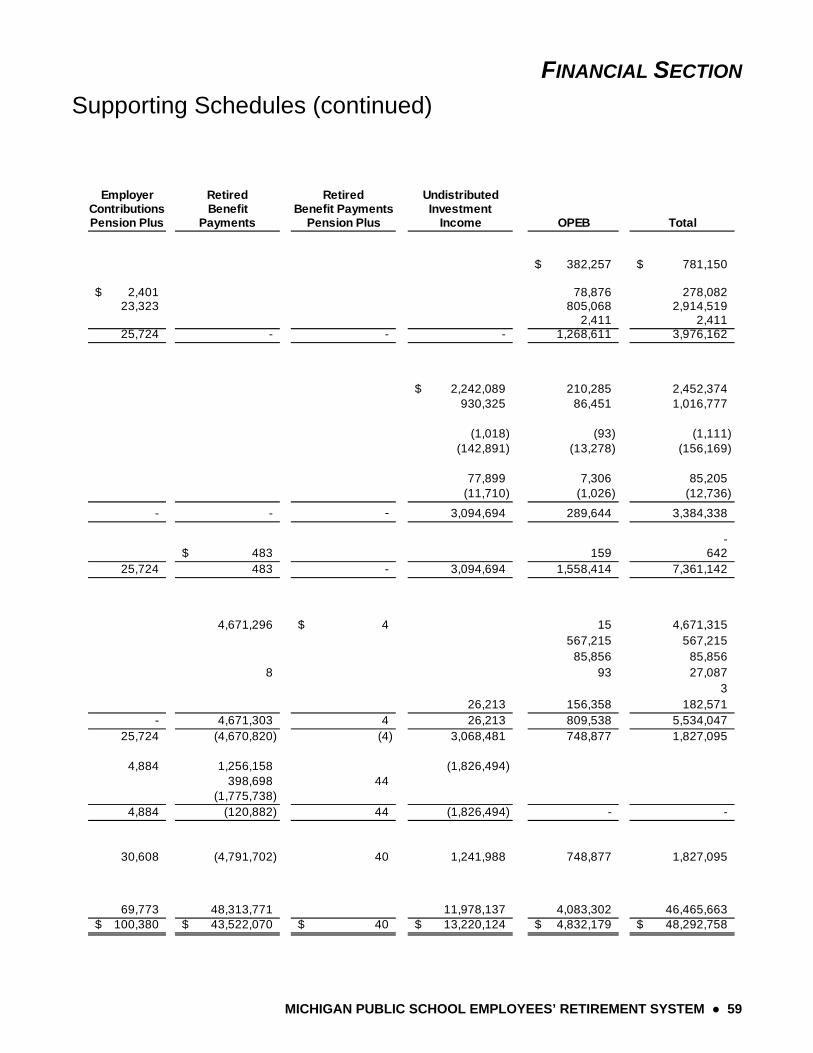
FINANCIAL SECTION
Supporting Schedules (continued)
MICHIGAN PUBLIC SCHOOL EMPLOYEES’ RETIREMENT SYSTEM ● 59
Employer Retired Retired UndistributedContributions Benefit Benefit Payments InvestmentPension Plus Payments Pension Plus Income OPEB Total
382,257$ 781,150$
2,401$ 78,876 278,082 23,323 805,068 2,914,519
2,411 2,411 25,724 - - - 1,268,611 3,976,162
2,242,089$ 210,285 2,452,374 930,325 86,451 1,016,777
(1,018) (93) (1,111) (142,891) (13,278) (156,169)
77,899 7,306 85,205 (11,710) (1,026) (12,736)
- - - 3,094,694 289,644 3,384,338
- 483$ 159 642
25,724 483 - 3,094,694 1,558,414 7,361,142
4,671,296 4$ 15 4,671,315 567,215 567,215
85,856 85,856 8 93 27,087
3 26,213 156,358 182,571
- 4,671,303 4 26,213 809,538 5,534,047 25,724 (4,670,820) (4) 3,068,481 748,877 1,827,095
4,884 1,256,158 (1,826,494) 398,698 44
(1,775,738) 4,884 (120,882) 44 (1,826,494) - -
30,608 (4,791,702) 40 1,241,988 748,877 1,827,095
69,773 48,313,771 11,978,137 4,083,302 46,465,663 100,380$ 43,522,070$ 40$ 13,220,124$ 4,832,179$ 48,292,758$

FINANCIAL SECTION
60 ● MICHIGAN PUBLIC SCHOOL EMPLOYEES’ RETIREMENT SYSTEM
This page was intentionally left blank.

MICHIGAN PUBLIC SCHOOL EMPLOYEES’ RETIREMENT SYSTEM ● 61
INVESTMENT SECTION Prepared by Michigan Department of Treasury, Bureau of Investments
Jon M. Braeutigam, Chief Investment Officer
Report on Investment Activity Asset Allocation
Investment Results List of Largest Stock Holdings List of Largest Bond Holdings Schedule of Investment Fees
Schedule of Investment Commissions Investment Summary

INVESTMENT SECTION
62 ● MICHIGAN PUBLIC SCHOOL EMPLOYEES’ RETIREMENT SYSTEM
Report on Investment Activity
INTRODUCTION
The State Treasurer reports investment activity quarterly to the Investment Advisory Committee (Committee), which reviews the investments, goals, and objectives of the retirement funds and may submit recommendations regarding them to the State Treasurer. The Investment Advisory Committee may also, by a majority vote, direct the State Treasurer to dispose of any holdings that, in the Committee’s judgment, are not suitable for the funds involved, and may, by unanimous vote, direct the State Treasurer to make specific investments.
The Investment Advisory Committee was created by Act 380 of the Public Acts of 1965. The three public members of the five-member committee are appointed by the Governor with the advice and consent of the Senate for three-year terms. The Director of the Department of Licensing and Regulatory Affairs and the Director of the Department of Technology, Management and Budget are ex-officio members. As of September 30, 2016, members of the Committee were as follows: James B. Nicholson (public member), L. Erik Lundberg, CFA (public member), Reginald G. Sanders, CFA, CAIA (public member), Shelly Edgerton (ex-officio member), and David Behen (ex-officio member). The public members serve without pay, but may be paid actual and necessary travel and other expenses.
INVESTMENT POLICY & GOALS
Investment policy states that the fiduciary will operate within standard investment practices of the prudent person and in accordance with Public Employee Retirement System Investment Act 314 of 1965. The fiduciary is authorized to invest in government obligations, corporate obligations, various short-term obligations, corporate (domestic and international) stocks, private equity interests, mutual funds, real estate interests, and other investments subject to specific parameters. Above all, trust fund assets are to be invested for the exclusive benefit of the members of the System, in a fiduciary capacity.
The System’s Proxy Voting Policy sets forth directives on various issues including: Boards of Directors, corporate governance, social issues, corporate restructurings and defenses. All proxies are reviewed and voted in accordance with the System’s policy.
The primary function of the System is to provide retirement, survivor and disability benefits along with health and other postemployment benefits to its members. The State Treasurer is the sole investment fiduciary and custodian of the System’s investments pursuant to State law. The goals of the System are:
Maintain sufficient liquidity to pay benefits. Meet or exceed the actuarial assumption over the long term. Perform in the top half of the public plan universe over the long term Diversify assets to preserve capital and avoid large losses. Exceed individual asset class benchmarks over the long term.
The strategy for achieving these goals is carried out by investing the assets of the System according to a five-year asset allocation model. The System currently invests in seven different asset classes, which provides for a well-diversified portfolio.
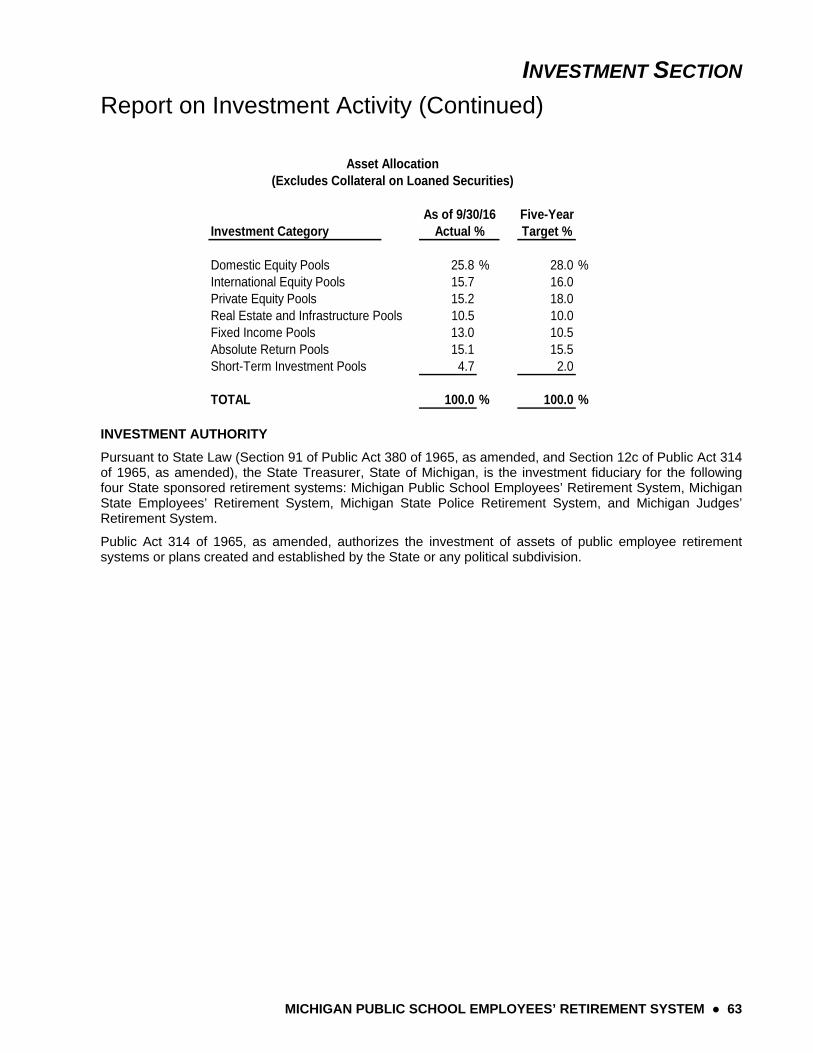
INVESTMENT SECTION
Report on Investment Activity (Continued)
MICHIGAN PUBLIC SCHOOL EMPLOYEES’ RETIREMENT SYSTEM ● 63
ASSET ALLOCATION
Five-YearInvestment Category Target %
Domestic Equity Pools 25.8 % 28.0 %International Equity Pools 15.7 16.0Private Equity Pools 15.2 18.0Real Estate and Infrastructure Pools 10.5 10.0Fixed Income Pools 13.0 10.5Absolute Return Pools 15.1 15.5Short-Term Investment Pools 4.7 2.0
TOTAL 100.0 % 100.0 %
Asset Allocation(Excludes Collateral on Loaned Securities)
As of 9/30/16Actual %
INVESTMENT AUTHORITY
Pursuant to State Law (Section 91 of Public Act 380 of 1965, as amended, and Section 12c of Public Act 314 of 1965, as amended), the State Treasurer, State of Michigan, is the investment fiduciary for the following four State sponsored retirement systems: Michigan Public School Employees’ Retirement System, Michigan State Employees’ Retirement System, Michigan State Police Retirement System, and Michigan Judges’ Retirement System.
Public Act 314 of 1965, as amended, authorizes the investment of assets of public employee retirement systems or plans created and established by the State or any political subdivision.
INVESTMENT SECTION
Report on Investment Activity (Continued)
64 ● MICHIGAN PUBLIC SCHOOL EMPLOYEES’ RETIREMENT SYSTEM
INVESTMENT RESULTS
Total Portfolio Results
For the fiscal year ended September 30, 2016, the total System’s rate of return was 7.6% for the Pension Plan and 7.6% for the OPEB Plan as compiled by State Street Investment Analytics. Annualized rates of return for the Pension Plan for the three, five, and ten year periods ending September 30, 2016 were: 8.5%, 10.2%, and 6.2% respectively.
At its December 2015 meeting, the Federal Open Market Committee announced the decision to raise the federal funds rate by 0.25%. This is the first change in this interest rate in over seven years, and the first hike since mid-2006. At the time, it was anticipated that there would be up to four additional rate hikes during fiscal year 2016; however, the December hike would prove to be the only one. During the early winter months of December, January, and February, risk assets were under great pressure. The U.S. equity benchmark S&P 500 Index fell more than 14% from its high and spreads on high yield bonds widened significantly, especially in companies linked to the energy sector. The price for a barrel of crude oil hit a low in mid-February, having dropped more than $80 per barrel (more than ¾’ths of its value) over the preceding eighteen months. As expected during troubled times, safe haven assets like the 10-year U.S. Treasury rallied. The rate on the U.S. Treasury dropped more than 0.8% from its 2015 high to a 1.6% level, near the lower end of the five year range.
The markets found firmer footing in the late winter months and rallied into the end of the fiscal year. The S&P 500 Index would hit an all-time closing high in August 2016, the price for a barrel of crude oil would rebound more than $20 per barrel by June and hold that level into the end of September, and high yield spreads would persistently grind lower. Paradoxically, the 10-year U.S. Treasury rate continued to fall another 0.3% through July and ended September 2016 at 1.59%.
Through the market gyrations of fiscal year 2016, the fundamentals of the U.S. economy remained modestly positive. Growth in gross domestic product averaged around 1% through the year. The consumer is continuing to do better in fiscal 2016; non-farm payrolls averaged a monthly increase over 200,000, the unemployment rate remained below 5% for most of the year, and wage growth continues to grow higher as well. Like last year, during the late fall the market is looking for a December Fed rate hike and for the interest rate policies to become more normal. Will fiscal year 2017 be a repeat of this fiscal year, or will new information sway the directions of the markets? Time will tell.
Investment return calculations are prepared using a Time-Weighted rate of return.
Domestic Equity Pools
The objective for investments made in domestic equities is to meet or exceed the total return of the S&P 1500 Super Composite for one, three, and five-year periods and a market cycle.
For active management strategies, the objective is to earn returns that exceed the most relevant S&P Index (or the most relevant Russell Index), adjusting for market capitalization and style, for one, three, and five-year periods and a market cycle. Rank above median in a universe of managers possessing a similar market cap and style characteristics.
For index, or passive return strategies, the objective is to return within 20 basis points of the S&P 500 Index, 50 basis points for the S&P 400 mid-cap, and 60 basis points for the S&P 600 small-cap over one, three, and five-year periods and a market cycle.
The pools are invested primarily in equities or equity-related securities of U.S. companies through internal and externally managed strategies. The goal is to build a portfolio of strategies that will provide excess returns relative to the S&P 1500 while providing minimal tracking error to the index. At times a portion of these pools may be invested in exchange traded funds (ETFs) and fixed-income short-term securities with maturities of less than one year.
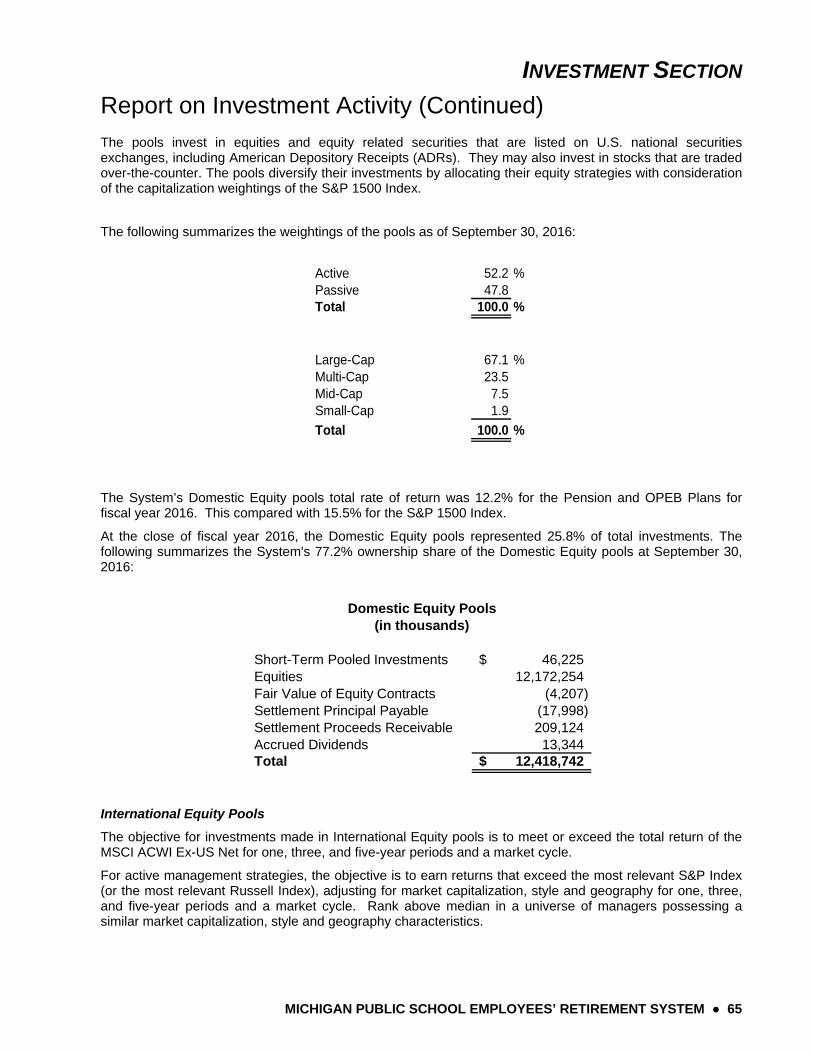
INVESTMENT SECTION
Report on Investment Activity (Continued)
MICHIGAN PUBLIC SCHOOL EMPLOYEES’ RETIREMENT SYSTEM ● 65
The pools invest in equities and equity related securities that are listed on U.S. national securities exchanges, including American Depository Receipts (ADRs). They may also invest in stocks that are traded over-the-counter. The pools diversify their investments by allocating their equity strategies with consideration of the capitalization weightings of the S&P 1500 Index.
The following summarizes the weightings of the pools as of September 30, 2016:
Active 52.2 %Passive 47.8Total 100.0 %
Large-Cap 67.1 %Multi-Cap 23.5Mid-Cap 7.5Small-Cap 1.9
Total 100.0 %
The System’s Domestic Equity pools total rate of return was 12.2% for the Pension and OPEB Plans for fiscal year 2016. This compared with 15.5% for the S&P 1500 Index.
At the close of fiscal year 2016, the Domestic Equity pools represented 25.8% of total investments. The following summarizes the System's 77.2% ownership share of the Domestic Equity pools at September 30, 2016:
Short-Term Pooled Investments 46,225$ Equities 12,172,254 Fair Value of Equity Contracts (4,207) Settlement Principal Payable (17,998) Settlement Proceeds Receivable 209,124 Accrued Dividends 13,344 Total 12,418,742$
Domestic Equity Pools(in thousands)
International Equity Pools
The objective for investments made in International Equity pools is to meet or exceed the total return of the MSCI ACWI Ex-US Net for one, three, and five-year periods and a market cycle.
For active management strategies, the objective is to earn returns that exceed the most relevant S&P Index (or the most relevant Russell Index), adjusting for market capitalization, style and geography for one, three, and five-year periods and a market cycle. Rank above median in a universe of managers possessing a similar market capitalization, style and geography characteristics.
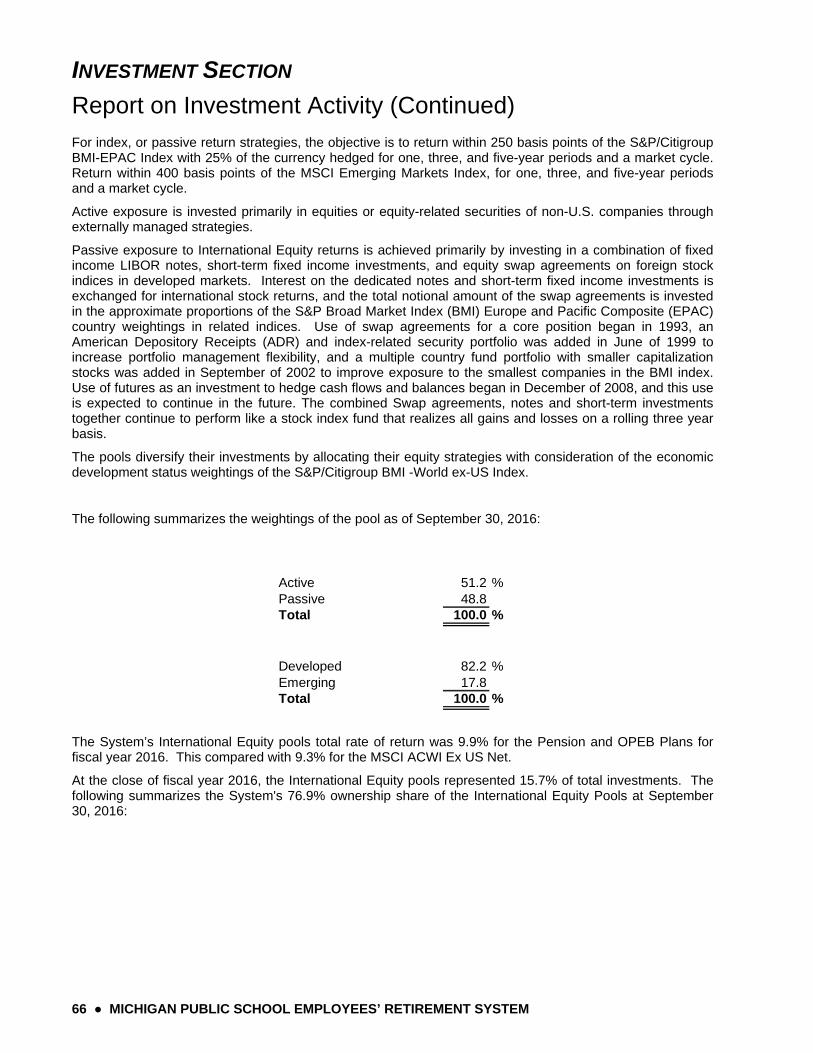
INVESTMENT SECTION
Report on Investment Activity (Continued)
66 ● MICHIGAN PUBLIC SCHOOL EMPLOYEES’ RETIREMENT SYSTEM
For index, or passive return strategies, the objective is to return within 250 basis points of the S&P/Citigroup BMI-EPAC Index with 25% of the currency hedged for one, three, and five-year periods and a market cycle. Return within 400 basis points of the MSCI Emerging Markets Index, for one, three, and five-year periods and a market cycle.
Active exposure is invested primarily in equities or equity-related securities of non-U.S. companies through externally managed strategies.
Passive exposure to International Equity returns is achieved primarily by investing in a combination of fixed income LIBOR notes, short-term fixed income investments, and equity swap agreements on foreign stock indices in developed markets. Interest on the dedicated notes and short-term fixed income investments is exchanged for international stock returns, and the total notional amount of the swap agreements is invested in the approximate proportions of the S&P Broad Market Index (BMI) Europe and Pacific Composite (EPAC) country weightings in related indices. Use of swap agreements for a core position began in 1993, an American Depository Receipts (ADR) and index-related security portfolio was added in June of 1999 to increase portfolio management flexibility, and a multiple country fund portfolio with smaller capitalization stocks was added in September of 2002 to improve exposure to the smallest companies in the BMI index. Use of futures as an investment to hedge cash flows and balances began in December of 2008, and this use is expected to continue in the future. The combined Swap agreements, notes and short-term investments together continue to perform like a stock index fund that realizes all gains and losses on a rolling three year basis.
The pools diversify their investments by allocating their equity strategies with consideration of the economic development status weightings of the S&P/Citigroup BMI -World ex-US Index.
The following summarizes the weightings of the pool as of September 30, 2016:
Active 51.2 %Passive 48.8Total 100.0 %
Developed 82.2 %Emerging 17.8Total 100.0 %
The System’s International Equity pools total rate of return was 9.9% for the Pension and OPEB Plans for fiscal year 2016. This compared with 9.3% for the MSCI ACWI Ex US Net.
At the close of fiscal year 2016, the International Equity pools represented 15.7% of total investments. The following summarizes the System's 76.9% ownership share of the International Equity Pools at September 30, 2016:
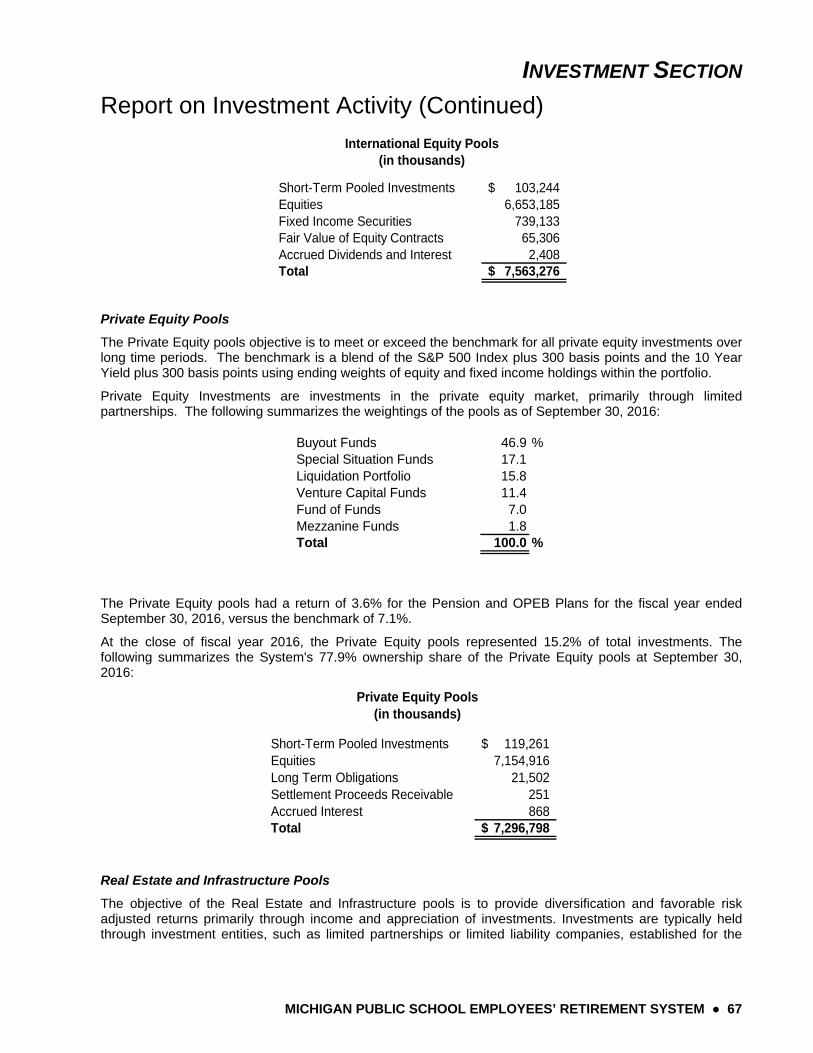
INVESTMENT SECTION
Report on Investment Activity (Continued)
MICHIGAN PUBLIC SCHOOL EMPLOYEES’ RETIREMENT SYSTEM ● 67
Short-Term Pooled Investments 103,244$ Equities 6,653,185 Fixed Income Securities 739,133 Fair Value of Equity Contracts 65,306 Accrued Dividends and Interest 2,408 Total 7,563,276$
International Equity Pools(in thousands)
Private Equity Pools
The Private Equity pools objective is to meet or exceed the benchmark for all private equity investments over long time periods. The benchmark is a blend of the S&P 500 Index plus 300 basis points and the 10 Year Yield plus 300 basis points using ending weights of equity and fixed income holdings within the portfolio.
Private Equity Investments are investments in the private equity market, primarily through limited partnerships. The following summarizes the weightings of the pools as of September 30, 2016:
Buyout Funds 46.9 %Special Situation Funds 17.1Liquidation Portfolio 15.8Venture Capital Funds 11.4Fund of Funds 7.0Mezzanine Funds 1.8Total 100.0 %
The Private Equity pools had a return of 3.6% for the Pension and OPEB Plans for the fiscal year ended September 30, 2016, versus the benchmark of 7.1%.
At the close of fiscal year 2016, the Private Equity pools represented 15.2% of total investments. The following summarizes the System's 77.9% ownership share of the Private Equity pools at September 30, 2016:
Short-Term Pooled Investments 119,261$ Equities 7,154,916 Long Term Obligations 21,502 Settlement Proceeds Receivable 251 Accrued Interest 868 Total 7,296,798$
Private Equity Pools(in thousands)
Real Estate and Infrastructure Pools
The objective of the Real Estate and Infrastructure pools is to provide diversification and favorable risk adjusted returns primarily through income and appreciation of investments. Investments are typically held through investment entities, such as limited partnerships or limited liability companies, established for the
INVESTMENT SECTION
Report on Investment Activity (Continued)
68 ● MICHIGAN PUBLIC SCHOOL EMPLOYEES’ RETIREMENT SYSTEM
specific purpose of owning, leasing, managing, financing, or developing real estate and infrastructure related investments.
The Real Estate and Infrastructure pools diversify its holdings by:
Geography – The pools are invested globally and are diversified geographically so that it is not concentrated in a limited number of markets or geographic areas.
Size and Value – The pools diversify its holdings by size so that it is not concentrated in a limited number of large investments.
Investment Type – The pools are diversified by investment type as summarized below.
Multi-family apartments 34.6 %Hotel 14.0Commercial office buildings 15.9Infrastructure 9.5Industrial warehouse buildings 6.8Retail shopping centers 5.4For Rent Homes 6.4For Sale Homes 5.1Land 1.8Short Term Investments 0.5Total 100.0 %
The Real Estate and Infrastructure pools generated a return of 10.4% for the Pension and OPEB Plans for fiscal year 2016. The two benchmark returns from the National Council of Real Estate Investment Fiduciaries: the National Property Blended Index (less 130 basis points) was 7.8% and the Open-End Diversified Core Equity Index was 9.1%.
At the close of fiscal year 2016, the Real Estate and Infrastructure pools represented 10.5% of total investments. The following summarizes the System’s 77.2% ownership share of the Real Estate and Infrastructure pools at September 30, 2016:
Short-Term Pooled Investments 26,040$ Real Estate Equities 4,555,448 Infrastructure Equities 482,745 Total 5,064,233$
Real Estate and Infrastructure Pools(in thousands)
Fixed Income Pools
The objective for investments made in the Fixed Income pools is to meet or exceed the Barclays Aggregate Bond Index over one, three, and five-year periods and market cycles. Rank above median in a nationally recognized universe of managers possessing a similar style.
For Fixed Income sub-strategies, the objective return is to meet or exceed the most relevant Barclays benchmark index.
The pools are invested primarily in fixed income securities of U.S. companies through internal and externally managed strategies. The goal is to build a portfolio of strategies that will provide excess returns relative to the blended benchmark while providing minimal tracking error to the index. At times a portion of the pools
INVESTMENT SECTION
Report on Investment Activity (Continued)
MICHIGAN PUBLIC SCHOOL EMPLOYEES’ RETIREMENT SYSTEM ● 69
may be invested in exchange traded funds (ETFs) and fixed-income short-term securities with maturities of less than one year.
The pools invest in fixed income and related securities in a diversified portfolio of investment grade corporate issues, treasuries, agencies, government sponsored enterprises and government guaranteed mortgages. The pools diversify its investments by allocating its strategies with consideration of credit risk.
The System’s Fixed Income pools total rate of return was 7.3% for the Pension and OPEB Plans for fiscal year 2016. This compared with 5.2% for the Barclays Aggregate Bond benchmark.
At the close of fiscal year 2016, the Fixed Income pools represented 13.0% of total investments. The following summarizes the System's 76.5% ownership share of the Fixed Income pools at September 30, 2016:
Short-Term Pooled Investments 85,527$ Fixed Income Securities 6,171,684 Settlement Principal Payable (42,680) Settlement Proceeds Receivable 21,416 Accrued interest 22,457 Total 6,258,404$
Fixed Income Pools(in thousands)
Absolute Return Pools
The Absolute Return Pools consist of the Absolute Return Strategies Pool and the Real Return and Opportunistic Investment Pool.
The primary investment objective of the Absolute Return Strategies Pool is to generate a rate of return that meets or exceeds T-bills by 400 basis points net of fees over the one, three, and five-year periods and a market cycle. Also, exceed the appropriate HFN Fund of Funds median net of fees over one, three, and five-year periods and a market cycle.
The Absolute Return Strategies pool rate of return for the fiscal year was -1.7% for the Pension and OPEB Plans versus the benchmark’s -1.3%.
The primary investment objective of the Real Return and Opportunistic Pool is to generate a rate of return that meets or exceeds the increase in the CPI by at least five percent (5%) annually net of fees over one, three, and five-year periods and a market cycle. If a peer universe is available, rank above median in a nationally recognized universe of managers possessing a similar style.
For sub-strategies targeting a commodities index, the objective is to generate a rate of return that meets or exceeds the Dow Jones-AIG Total Return Commodities Index over one, three, and five year periods and a market cycle. Rank above median in a nationally recognized universe of managers possessing a similar style.
The Real Return and Opportunistic Investments pool rate of return for the fiscal year was 5.4% for the Pension and OPEB Plans versus the benchmark’s 7.3%.
INVESTMENT SECTION
Report on Investment Activity (Continued)
70 ● MICHIGAN PUBLIC SCHOOL EMPLOYEES’ RETIREMENT SYSTEM
At the close of fiscal year 2016, the Absolute Return Pools represented 15.1% of total investments. The following summarizes the System's 77.2% ownership share of the Absolute Return Pools at September 30, 2016:
Short-Term Pooled Investments 68,225$ Equities 7,085,971 Long-Term Obligations 77,081 Settlement Principal Payable 40 Accrued Interest and Dividends 2,055 Total 7,233,372$
Absolute Return Pools(in thousands)
Short-Term Investment Pools
The objective of the Short-Term Investment pools is to closely match the return performance of its benchmark, the 30 day Treasury bill. The Short-Term Investment pools return for the fiscal year was 0.7% for the Pension Plan and 0.6% for the OPEB plan versus the benchmark’s 0.2%.
Potential areas of investment are:
Obligations of the United States or its agencies. Banker’s acceptances, commercial accounts, certificates of deposit or depository receipts. Repurchase agreements for the purchase of securities issued by the US government or its agencies. Commercial paper rated at the time of purchase within the two highest classifications established by
not less than two national rating services as determined by the State Treasurer. Short duration investment grade corporate issues.
At the close of fiscal year 2016, the Short-Term Investment pools represented 4.7% of total investments. The following summarizes the System's 73.3% ownership share of the Short Term Investment pools at September 30, 2016:
Short-Term Pooled Investments 1,274,521$ Healthcare Contribution* 553,126 Fixed Income Securities 411,793 Accrued interest 656 Total 2,240,096$
Short-Term Investment Pools(in thousands)
*PA 75 of 2010 required each actively employed member of MPSERS to contribute toward healthcare benefits. Amounts contributed to this account until September 3, 2012 are held and invested separately.
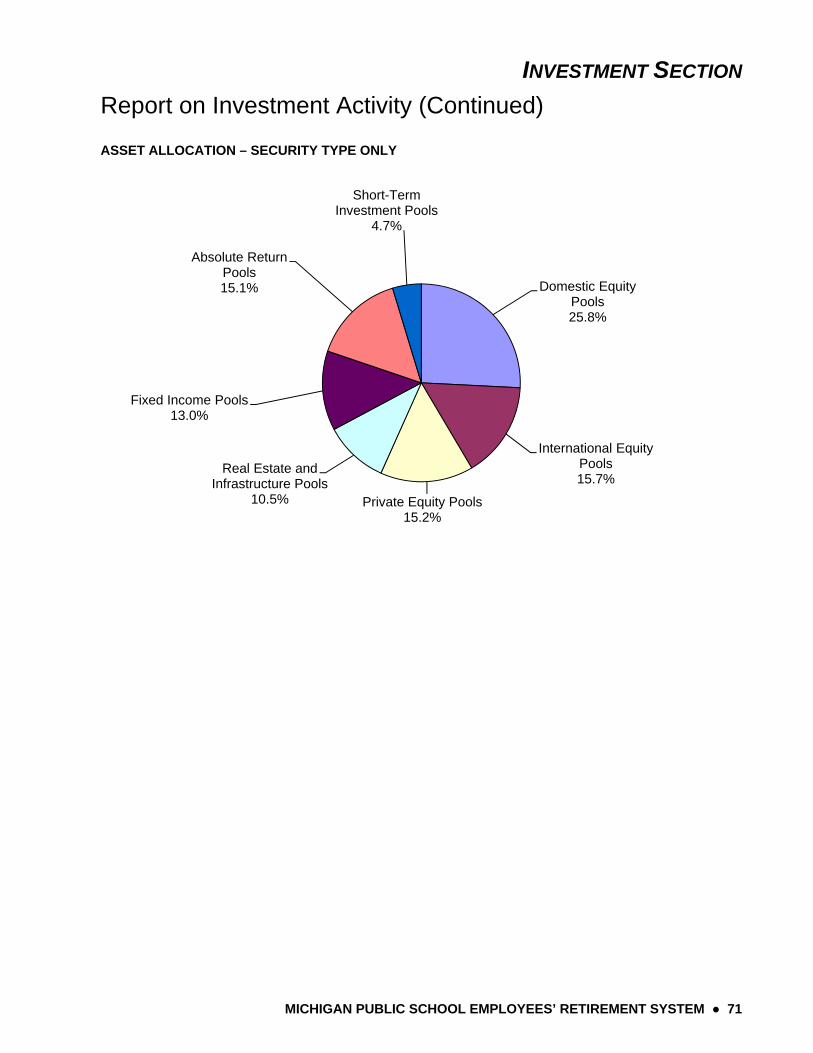
INVESTMENT SECTION
Report on Investment Activity (Continued)
MICHIGAN PUBLIC SCHOOL EMPLOYEES’ RETIREMENT SYSTEM ● 71
ASSET ALLOCATION – SECURITY TYPE ONLY
Domestic Equity Pools 25.8%
International Equity Pools15.7%
Private Equity Pools 15.2%
Real Estate and Infrastructure Pools
10.5%
Fixed Income Pools 13.0%
Absolute Return Pools15.1%
Short-Term Investment Pools
4.7%
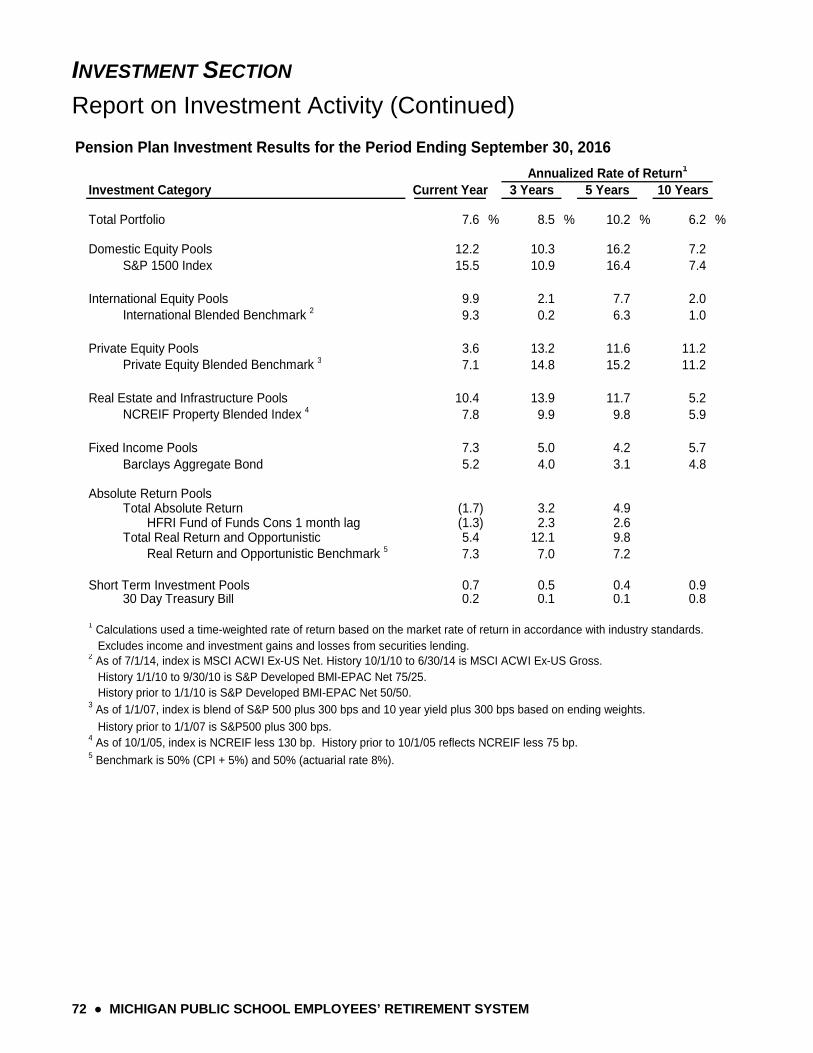
INVESTMENT SECTION
Report on Investment Activity (Continued)
72 ● MICHIGAN PUBLIC SCHOOL EMPLOYEES’ RETIREMENT SYSTEM
Pension Plan Investment Results for the Period Ending September 30, 2016
Annualized Rate of Return1
Investment Category Current Year 3 Years 5 Years 10 Years
Total Portfolio 7.6 % 8.5 % 10.2 % 6.2 %
Domestic Equity Pools 12.2 10.3 16.2 7.2 S&P 1500 Index 15.5 10.9 16.4 7.4
International Equity Pools 9.9 2.1 7.7 2.0 International Blended Benchmark 2 9.3 0.2 6.3 1.0
Private Equity Pools 3.6 13.2 11.6 11.2 Private Equity Blended Benchmark 3 7.1 14.8 15.2 11.2
Real Estate and Infrastructure Pools 10.4 13.9 11.7 5.2 NCREIF Property Blended Index 4 7.8 9.9 9.8 5.9
Fixed Income Pools 7.3 5.0 4.2 5.7 Barclays Aggregate Bond 5.2 4.0 3.1 4.8
Absolute Return Pools Total Absolute Return (1.7) 3.2 4.9 HFRI Fund of Funds Cons 1 month lag (1.3) 2.3 2.6 Total Real Return and Opportunistic 5.4 12.1 9.8 Real Return and Opportunistic Benchmark 5 7.3 7.0 7.2
Short Term Investment Pools 0.7 0.5 0.4 0.9 30 Day Treasury Bill 0.2 0.1 0.1 0.8
1 Calculations used a time-weighted rate of return based on the market rate of return in accordance with industry standards. Excludes income and investment gains and losses from securities lending.2 As of 7/1/14, index is MSCI ACWI Ex-US Net. History 10/1/10 to 6/30/14 is MSCI ACWI Ex-US Gross. History 1/1/10 to 9/30/10 is S&P Developed BMI-EPAC Net 75/25. History prior to 1/1/10 is S&P Developed BMI-EPAC Net 50/50.3 As of 1/1/07, index is blend of S&P 500 plus 300 bps and 10 year yield plus 300 bps based on ending weights.
History prior to 1/1/07 is S&P500 plus 300 bps.
4 As of 10/1/05, index is NCREIF less 130 bp. History prior to 10/1/05 reflects NCREIF less 75 bp.5 Benchmark is 50% (CPI + 5%) and 50% (actuarial rate 8%).
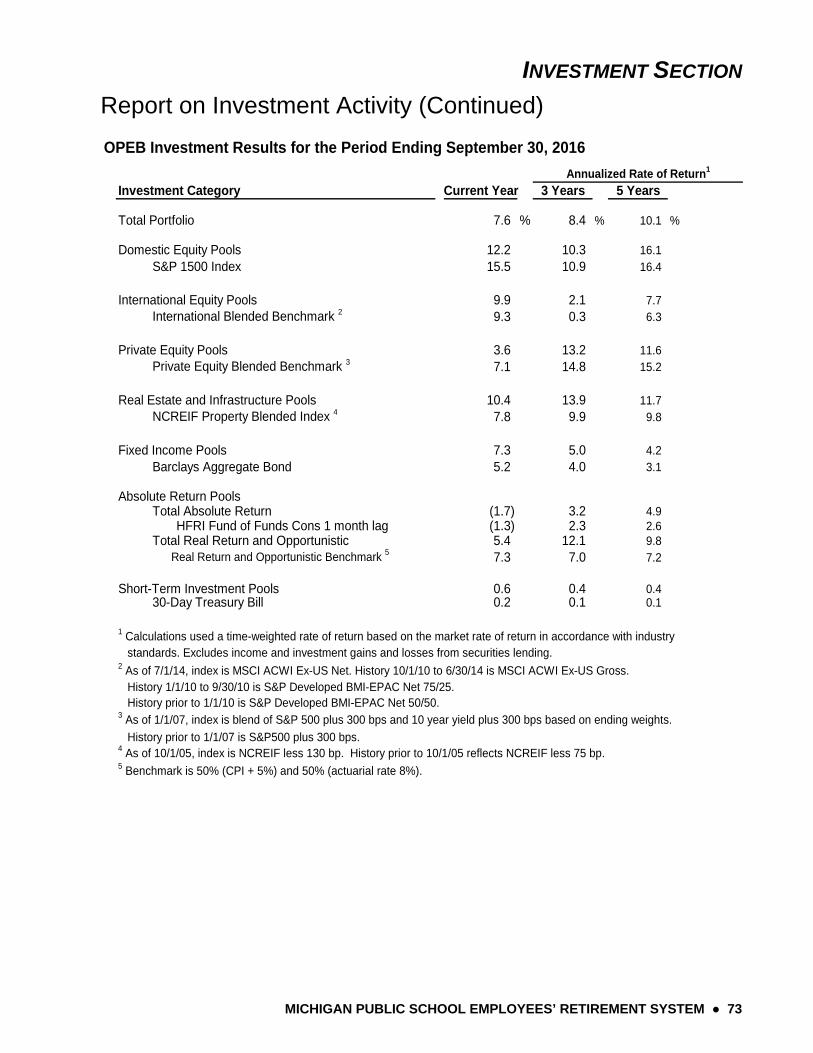
INVESTMENT SECTION
Report on Investment Activity (Continued)
MICHIGAN PUBLIC SCHOOL EMPLOYEES’ RETIREMENT SYSTEM ● 73
OPEB Investment Results for the Period Ending September 30, 2016
Annualized Rate of Return1
Investment Category Current Year 3 Years 5 Years
Total Portfolio 7.6 % 8.4 % 10.1 %
Domestic Equity Pools 12.2 10.3 16.1 S&P 1500 Index 15.5 10.9 16.4
International Equity Pools 9.9 2.1 7.7 International Blended Benchmark 2 9.3 0.3 6.3
Private Equity Pools 3.6 13.2 11.6 Private Equity Blended Benchmark 3 7.1 14.8 15.2
Real Estate and Infrastructure Pools 10.4 13.9 11.7 NCREIF Property Blended Index 4 7.8 9.9 9.8
Fixed Income Pools 7.3 5.0 4.2 Barclays Aggregate Bond 5.2 4.0 3.1
Absolute Return Pools Total Absolute Return (1.7) 3.2 4.9 HFRI Fund of Funds Cons 1 month lag (1.3) 2.3 2.6 Total Real Return and Opportunistic 5.4 12.1 9.8 Real Return and Opportunistic Benchmark 5 7.3 7.0 7.2
Short-Term Investment Pools 0.6 0.4 0.4 30-Day Treasury Bill 0.2 0.1 0.1
1 Calculations used a time-weighted rate of return based on the market rate of return in accordance with industry standards. Excludes income and investment gains and losses from securities lending.2 As of 7/1/14, index is MSCI ACWI Ex-US Net. History 10/1/10 to 6/30/14 is MSCI ACWI Ex-US Gross. History 1/1/10 to 9/30/10 is S&P Developed BMI-EPAC Net 75/25. History prior to 1/1/10 is S&P Developed BMI-EPAC Net 50/50.3 As of 1/1/07, index is blend of S&P 500 plus 300 bps and 10 year yield plus 300 bps based on ending weights.
History prior to 1/1/07 is S&P500 plus 300 bps.
4 As of 10/1/05, index is NCREIF less 130 bp. History prior to 10/1/05 reflects NCREIF less 75 bp.5 Benchmark is 50% (CPI + 5%) and 50% (actuarial rate 8%).
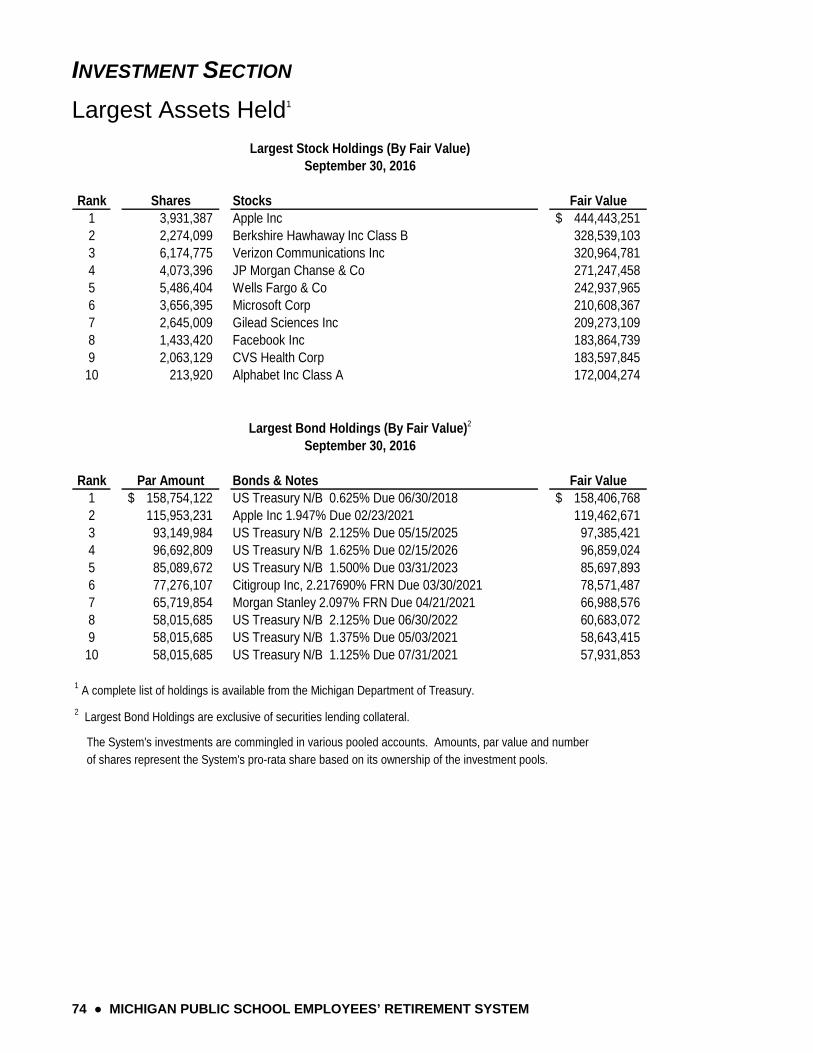
INVESTMENT SECTION
74 ● MICHIGAN PUBLIC SCHOOL EMPLOYEES’ RETIREMENT SYSTEM
Largest Assets Held1
Rank Shares Stocks Fair Value1 3,931,387 Apple Inc 444,443,251$ 2 2,274,099 Berkshire Hawhaway Inc Class B 328,539,103 3 6,174,775 Verizon Communications Inc 320,964,781 4 4,073,396 JP Morgan Chanse & Co 271,247,458 5 5,486,404 Wells Fargo & Co 242,937,965 6 3,656,395 Microsoft Corp 210,608,367 7 2,645,009 Gilead Sciences Inc 209,273,109 8 1,433,420 Facebook Inc 183,864,739 9 2,063,129 CVS Health Corp 183,597,845 10 213,920 Alphabet Inc Class A 172,004,274
Rank Par Amount Bonds & Notes Fair Value1 158,754,122$ US Treasury N/B 0.625% Due 06/30/2018 158,406,768$ 2 115,953,231 Apple Inc 1.947% Due 02/23/2021 119,462,671 3 93,149,984 US Treasury N/B 2.125% Due 05/15/2025 97,385,421 4 96,692,809 US Treasury N/B 1.625% Due 02/15/2026 96,859,024 5 85,089,672 US Treasury N/B 1.500% Due 03/31/2023 85,697,893 6 77,276,107 Citigroup Inc, 2.217690% FRN Due 03/30/2021 78,571,487 7 65,719,854 Morgan Stanley 2.097% FRN Due 04/21/2021 66,988,576 8 58,015,685 US Treasury N/B 2.125% Due 06/30/2022 60,683,072 9 58,015,685 US Treasury N/B 1.375% Due 05/03/2021 58,643,415 10 58,015,685 US Treasury N/B 1.125% Due 07/31/2021 57,931,853
1 A complete list of holdings is available from the Michigan Department of Treasury.
2 Largest Bond Holdings are exclusive of securities lending collateral.
The System's investments are commingled in various pooled accounts. Amounts, par value and number of shares represent the System's pro-rata share based on its ownership of the investment pools.
Largest Stock Holdings (By Fair Value)September 30, 2016
Largest Bond Holdings (By Fair Value)2
September 30, 2016
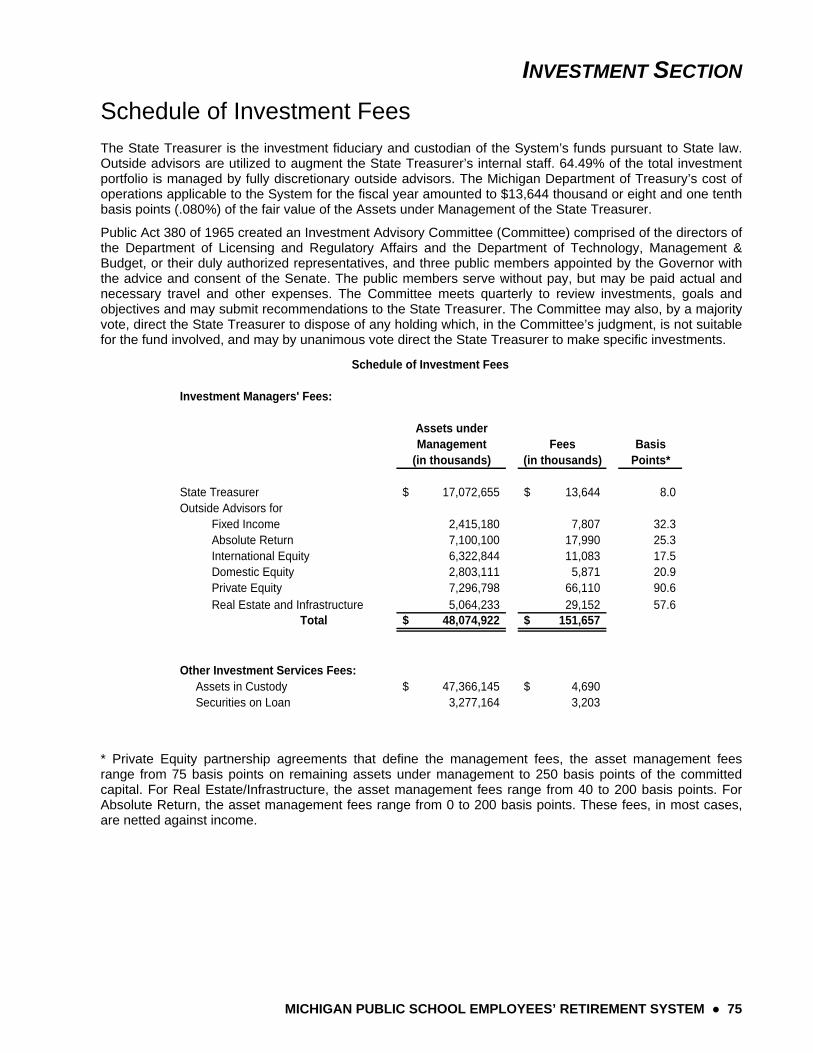
INVESTMENT SECTION
MICHIGAN PUBLIC SCHOOL EMPLOYEES’ RETIREMENT SYSTEM ● 75
Schedule of Investment Fees
The State Treasurer is the investment fiduciary and custodian of the System’s funds pursuant to State law. Outside advisors are utilized to augment the State Treasurer’s internal staff. 64.49% of the total investment portfolio is managed by fully discretionary outside advisors. The Michigan Department of Treasury’s cost of operations applicable to the System for the fiscal year amounted to $13,644 thousand or eight and one tenth basis points (.080%) of the fair value of the Assets under Management of the State Treasurer.
Public Act 380 of 1965 created an Investment Advisory Committee (Committee) comprised of the directors of the Department of Licensing and Regulatory Affairs and the Department of Technology, Management & Budget, or their duly authorized representatives, and three public members appointed by the Governor with the advice and consent of the Senate. The public members serve without pay, but may be paid actual and necessary travel and other expenses. The Committee meets quarterly to review investments, goals and objectives and may submit recommendations to the State Treasurer. The Committee may also, by a majority vote, direct the State Treasurer to dispose of any holding which, in the Committee’s judgment, is not suitable for the fund involved, and may by unanimous vote direct the State Treasurer to make specific investments.
Investment Managers' Fees:
Assets underManagement Fees Basis
(in thousands) (in thousands) Points*
State Treasurer 17,072,655$ 13,644$ 8.0Outside Advisors for Fixed Income 2,415,180 7,807 32.3 Absolute Return 7,100,100 17,990 25.3 International Equity 6,322,844 11,083 17.5 Domestic Equity 2,803,111 5,871 20.9 Private Equity 7,296,798 66,110 90.6
5,064,233 29,152 57.6Total 48,074,922$ 151,657$
Other Investment Services Fees: Assets in Custody 47,366,145$ 4,690$ Securities on Loan 3,277,164 3,203
Real Estate and Infrastructure
Schedule of Investment Fees
* Private Equity partnership agreements that define the management fees, the asset management fees range from 75 basis points on remaining assets under management to 250 basis points of the committed capital. For Real Estate/Infrastructure, the asset management fees range from 40 to 200 basis points. For Absolute Return, the asset management fees range from 0 to 200 basis points. These fees, in most cases, are netted against income.
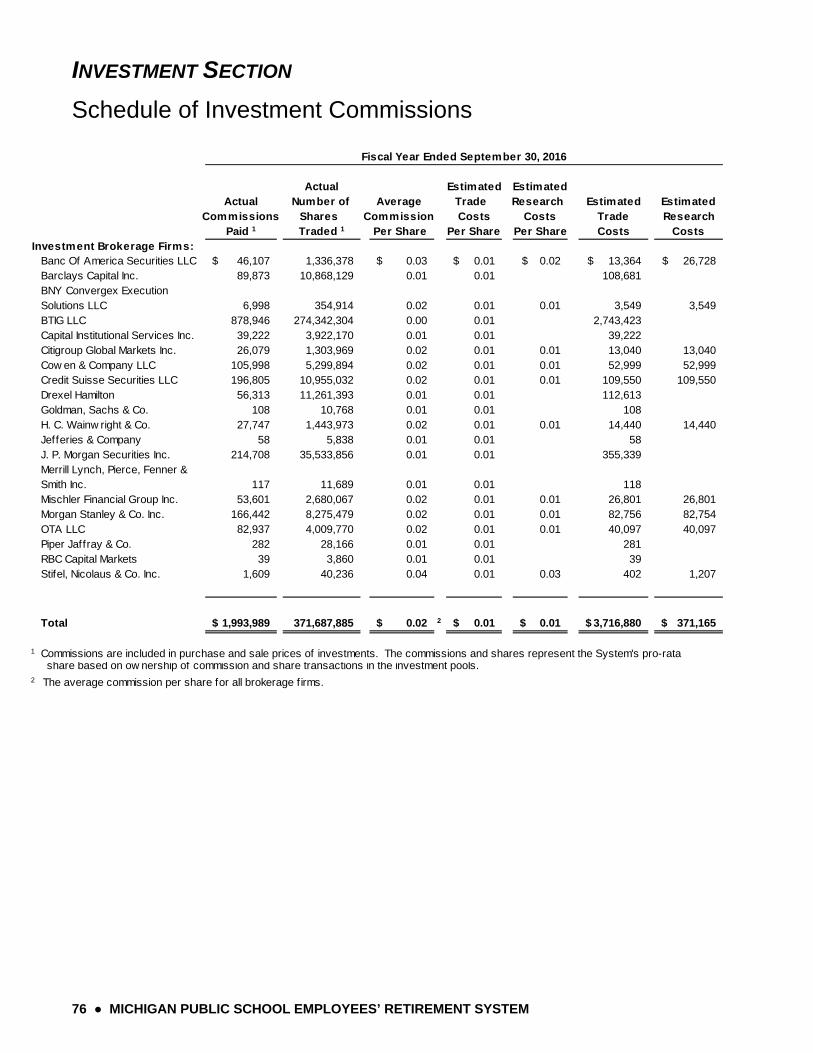
INVESTMENT SECTION
76 ● MICHIGAN PUBLIC SCHOOL EMPLOYEES’ RETIREMENT SYSTEM
Schedule of Investment Commissions
Actual Estimated EstimatedActual Number of Average Trade Research Estimated Estimated
Commissions Shares Commission Costs Costs Trade ResearchPaid 1 Traded 1 Per Share Per Share Per Share Costs Costs
Investment Brokerage Firms:Banc Of America Securities LLC 46,107$ 1,336,378 0.03$ 0.01$ 0.02$ 13,364$ 26,728$ Barclays Capital Inc. 89,873 10,868,129 0.01 0.01 108,681 BNY Convergex Execution Solutions LLC 6,998 354,914 0.02 0.01 0.01 3,549 3,549 BTIG LLC 878,946 274,342,304 0.00 0.01 2,743,423 Capital Institutional Services Inc. 39,222 3,922,170 0.01 0.01 39,222 Citigroup Global Markets Inc. 26,079 1,303,969 0.02 0.01 0.01 13,040 13,040 Cow en & Company LLC 105,998 5,299,894 0.02 0.01 0.01 52,999 52,999 Credit Suisse Securities LLC 196,805 10,955,032 0.02 0.01 0.01 109,550 109,550 Drexel Hamilton 56,313 11,261,393 0.01 0.01 112,613 Goldman, Sachs & Co. 108 10,768 0.01 0.01 108 H. C. Wainw right & Co. 27,747 1,443,973 0.02 0.01 0.01 14,440 14,440 Jefferies & Company 58 5,838 0.01 0.01 58 J. P. Morgan Securities Inc. 214,708 35,533,856 0.01 0.01 355,339 Merrill Lynch, Pierce, Fenner & Smith Inc. 117 11,689 0.01 0.01 118 Mischler Financial Group Inc. 53,601 2,680,067 0.02 0.01 0.01 26,801 26,801 Morgan Stanley & Co. Inc. 166,442 8,275,479 0.02 0.01 0.01 82,756 82,754 OTA LLC 82,937 4,009,770 0.02 0.01 0.01 40,097 40,097 Piper Jaffray & Co. 282 28,166 0.01 0.01 281 RBC Capital Markets 39 3,860 0.01 0.01 39 Stifel, Nicolaus & Co. Inc. 1,609 40,236 0.04 0.01 0.03 402 1,207
Total 1,993,989$ 371,687,885 0.02$ 2 0.01$ 0.01$ 3,716,880$ 371,165$
1 Commissions are included in purchase and sale prices of investments. The commissions and shares represent the System's pro-rata share based on ow nership of commission and share transactions in the investment pools.2 The average commission per share for all brokerage f irms.
Fiscal Year Ended September 30, 2016
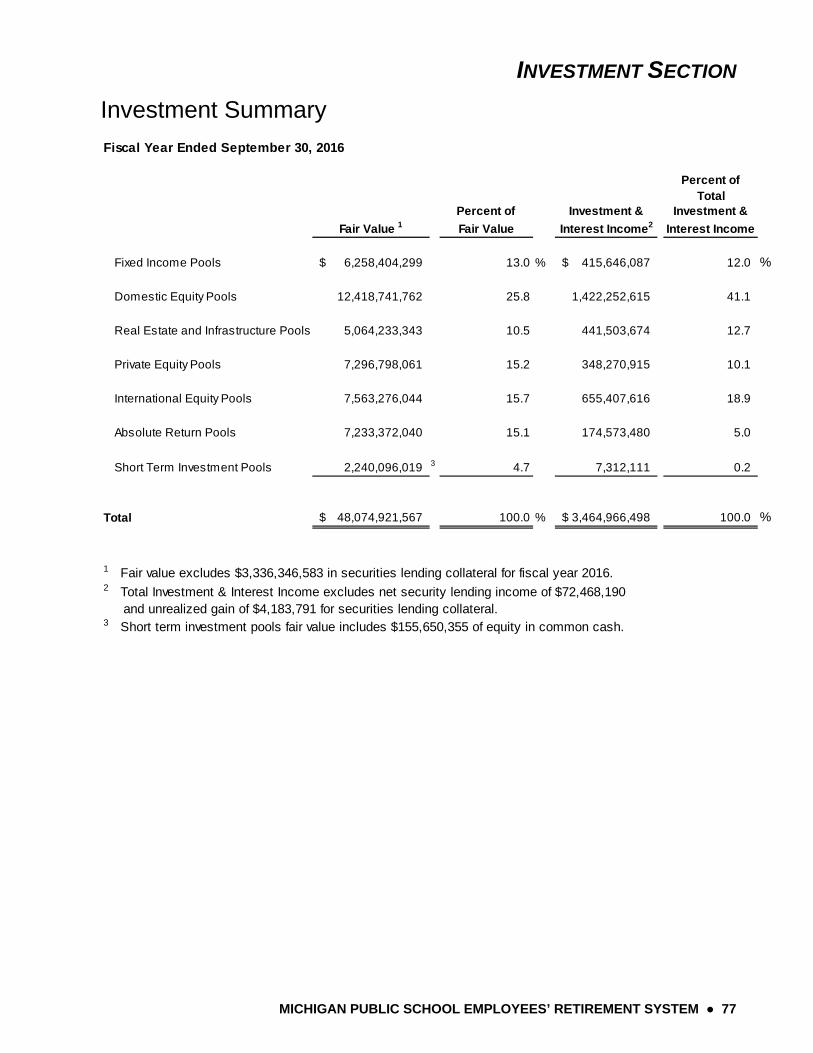
INVESTMENT SECTION
MICHIGAN PUBLIC SCHOOL EMPLOYEES’ RETIREMENT SYSTEM ● 77
Investment Summary
Fiscal Year Ended September 30, 2016
Percent of Total
Percent of Investment & Investment &
Fair Value 1 Fair Value Interest Income2 Interest Income
Fixed Income Pools 6,258,404,299$ 13.0 % 415,646,087$ 12.0 %
Domestic Equity Pools 12,418,741,762 25.8 1,422,252,615 41.1
Real Estate and Infrastructure Pools 5,064,233,343 10.5 441,503,674 12.7
Private Equity Pools 7,296,798,061 15.2 348,270,915 10.1
International Equity Pools 7,563,276,044 15.7 655,407,616 18.9
Absolute Return Pools 7,233,372,040 15.1 174,573,480 5.0
Short Term Investment Pools 2,240,096,019 3 4.7 7,312,111 0.2
Total 48,074,921,567$ 100.0 % 3,464,966,498$ 100.0 %
1 Fair value excludes $3,336,346,583 in securities lending collateral for fiscal year 2016.2 Total Investment & Interest Income excludes net security lending income of $72,468,190 and unrealized gain of $4,183,791 for securities lending collateral.3 Short term investment pools fair value includes $155,650,355 of equity in common cash.

INVESTMENT SECTION
78 ● MICHIGAN PUBLIC SCHOOL EMPLOYEES’ RETIREMENT SYSTEM
This page was intentional left blank.
MICHIGAN PUBLIC SCHOOL EMPLOYEES’ RETIREMENT SYSTEM ● 79
ACTUARIAL SECTION Actuary’s Certification
Summary of Actuarial Assumptions and Methods Schedules of Active Member Valuation Data
Schedules of Changes in the Retirement Rolls Prioritized Solvency Test
Analysis of System Experience Summary of Plan Provisions
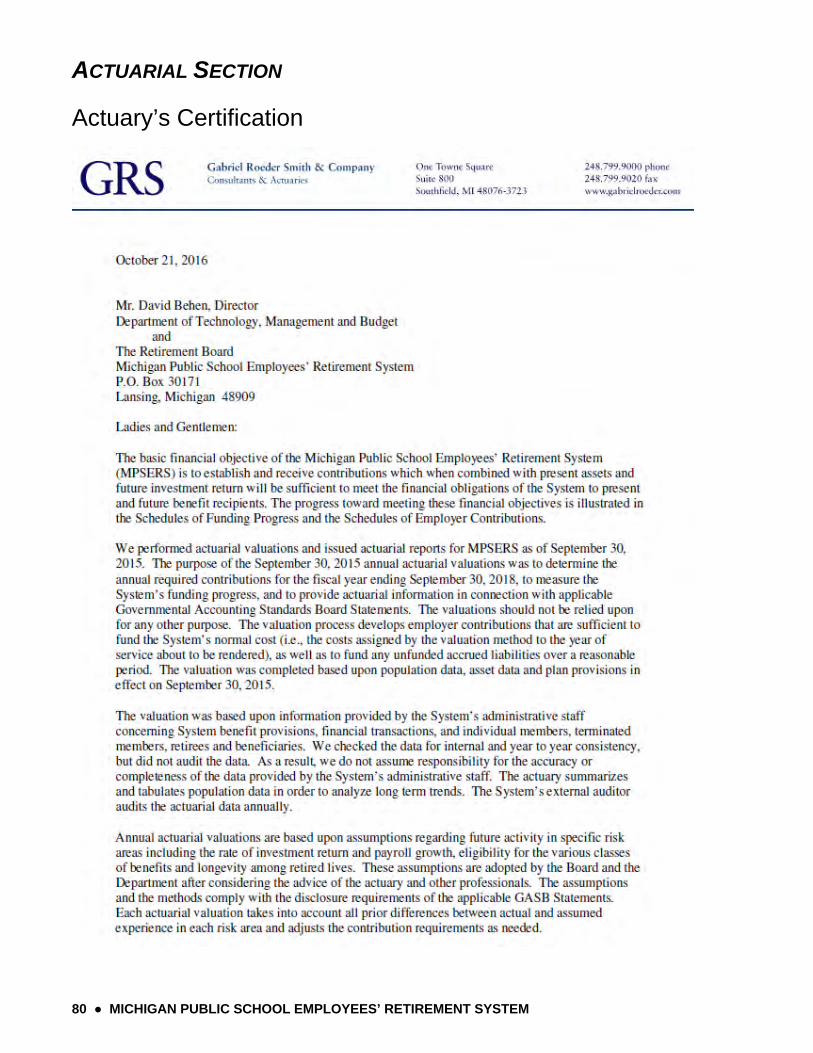
ACTUARIAL SECTION
80 ● MICHIGAN PUBLIC SCHOOL EMPLOYEES’ RETIREMENT SYSTEM
Actuary’s Certification
ACTUARIAL SECTION
Actuary’s Certification (continued)
MICHIGAN PUBLIC SCHOOL EMPLOYEES’ RETIREMENT SYSTEM ● 81
ACTUARIAL SECTION
Actuary’s Certification (continued)
82 ● MICHIGAN PUBLIC SCHOOL EMPLOYEES’ RETIREMENT SYSTEM
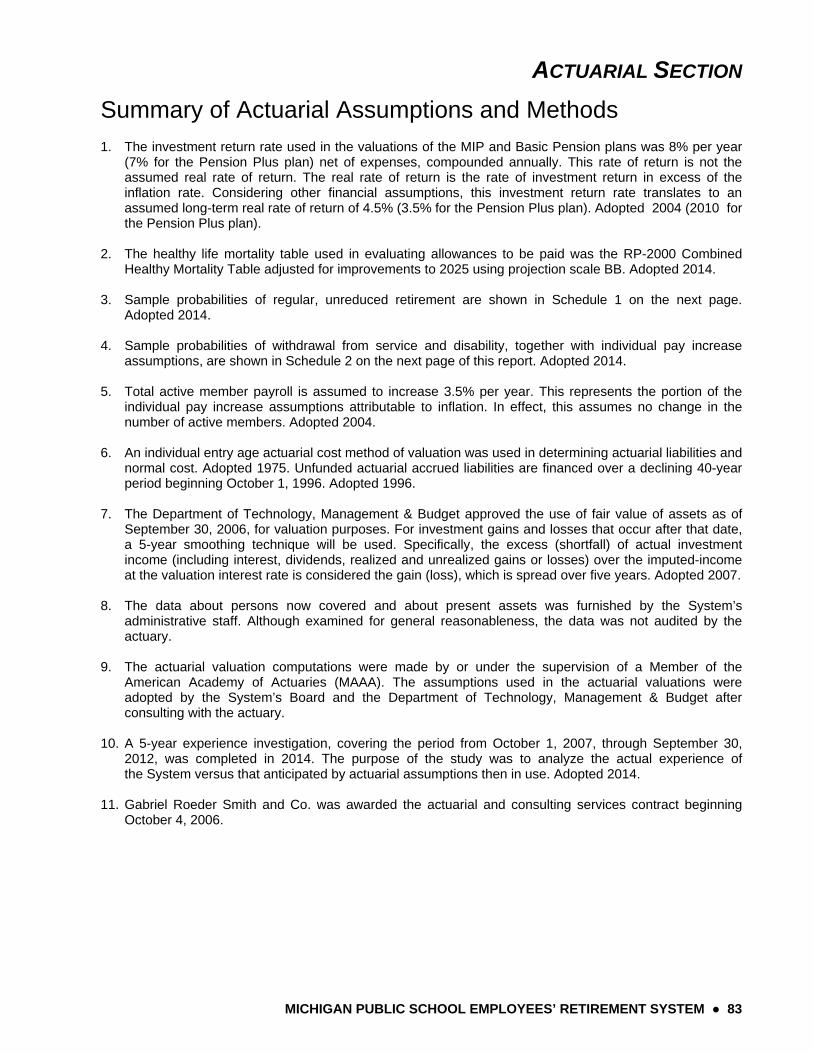
ACTUARIAL SECTION
MICHIGAN PUBLIC SCHOOL EMPLOYEES’ RETIREMENT SYSTEM ● 83
Summary of Actuarial Assumptions and Methods
1. The investment return rate used in the valuations of the MIP and Basic Pension plans was 8% per year (7% for the Pension Plus plan) net of expenses, compounded annually. This rate of return is not the assumed real rate of return. The real rate of return is the rate of investment return in excess of the inflation rate. Considering other financial assumptions, this investment return rate translates to an assumed long-term real rate of return of 4.5% (3.5% for the Pension Plus plan). Adopted 2004 (2010 for the Pension Plus plan).
2. The healthy life mortality table used in evaluating allowances to be paid was the RP-2000 Combined Healthy Mortality Table adjusted for improvements to 2025 using projection scale BB. Adopted 2014.
3. Sample probabilities of regular, unreduced retirement are shown in Schedule 1 on the next page. Adopted 2014.
4. Sample probabilities of withdrawal from service and disability, together with individual pay increase assumptions, are shown in Schedule 2 on the next page of this report. Adopted 2014.
5. Total active member payroll is assumed to increase 3.5% per year. This represents the portion of the individual pay increase assumptions attributable to inflation. In effect, this assumes no change in the number of active members. Adopted 2004.
6. An individual entry age actuarial cost method of valuation was used in determining actuarial liabilities and normal cost. Adopted 1975. Unfunded actuarial accrued liabilities are financed over a declining 40-year period beginning October 1, 1996. Adopted 1996.
7. The Department of Technology, Management & Budget approved the use of fair value of assets as of September 30, 2006, for valuation purposes. For investment gains and losses that occur after that date, a 5-year smoothing technique will be used. Specifically, the excess (shortfall) of actual investment income (including interest, dividends, realized and unrealized gains or losses) over the imputed-income at the valuation interest rate is considered the gain (loss), which is spread over five years. Adopted 2007.
8. The data about persons now covered and about present assets was furnished by the System’s administrative staff. Although examined for general reasonableness, the data was not audited by the actuary.
9. The actuarial valuation computations were made by or under the supervision of a Member of the American Academy of Actuaries (MAAA). The assumptions used in the actuarial valuations were adopted by the System’s Board and the Department of Technology, Management & Budget after consulting with the actuary.
10. A 5-year experience investigation, covering the period from October 1, 2007, through September 30, 2012, was completed in 2014. The purpose of the study was to analyze the actual experience of the System versus that anticipated by actuarial assumptions then in use. Adopted 2014.
11. Gabriel Roeder Smith and Co. was awarded the actuarial and consulting services contract beginning October 4, 2006.
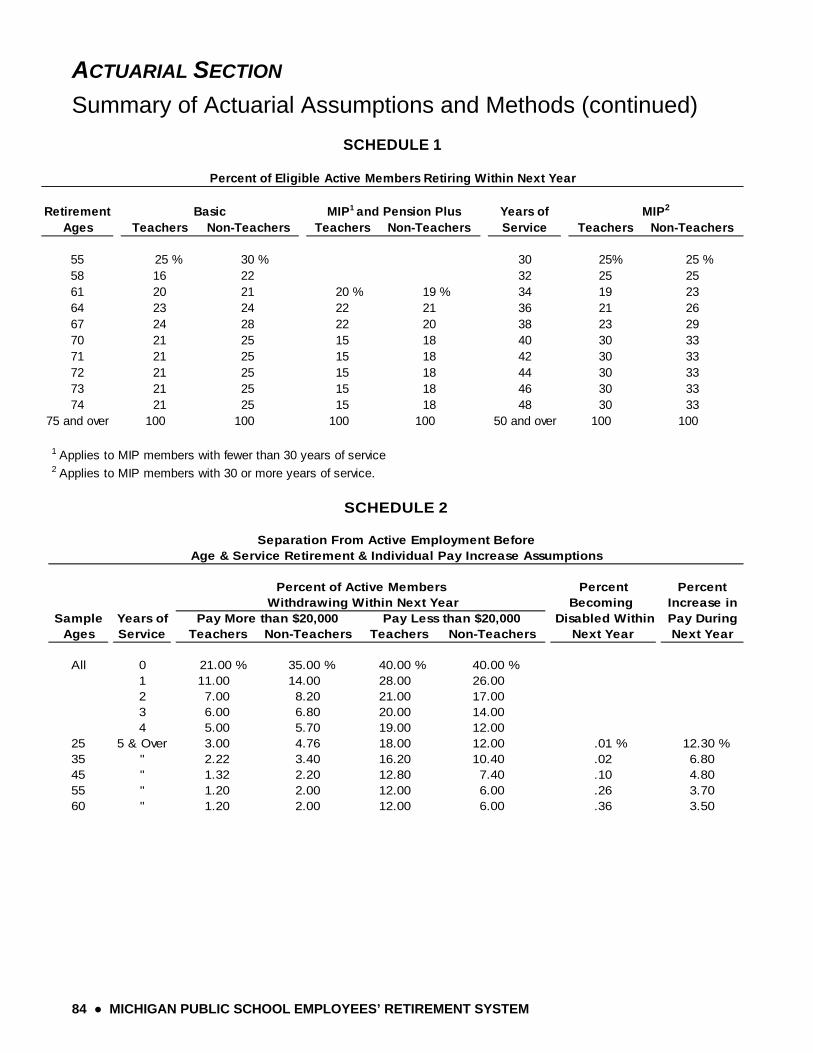
ACTUARIAL SECTION
Summary of Actuarial Assumptions and Methods (continued)
84 ● MICHIGAN PUBLIC SCHOOL EMPLOYEES’ RETIREMENT SYSTEM
Retirement Years ofAges Teachers Non-Teachers Teachers Non-Teachers Service Teachers Non-Teachers
55 25 % 30 % 30 25% 25 %58 16 22 32 25 2561 20 21 20 % 19 % 34 19 2364 23 24 22 21 36 21 2667 24 28 22 20 38 23 2970 21 25 15 18 40 30 3371 21 25 15 18 42 30 3372 21 25 15 18 44 30 3373 21 25 15 18 46 30 3374 21 25 15 18 48 30 33
75 and over 100 100 100 100 50 and over 100 100
1 Applies to MIP members with fewer than 30 years of service
2 Applies to MIP members with 30 or more years of service.
Basic MIP1 and Pension Plus
Percent of Eligible Active Members Retiring Within Next Year
SCHEDULE 1
MIP2
Percent PercentBecoming Increase in
Sample Years of Disabled Within Pay DuringAges Service Teachers Non-Teachers Teachers Non-Teachers Next Year Next Year
All 0 21.00 % 35.00 % 40.00 % 40.00 %1 11.00 14.00 28.00 26.00 2 7.00 8.20 21.00 17.00 3 6.00 6.80 20.00 14.00 4 5.00 5.70 19.00 12.00
25 5 & Over 3.00 4.76 18.00 12.00 .01 % 12.30 %35 " 2.22 3.40 16.20 10.40 .02 6.8045 " 1.32 2.20 12.80 7.40 .10 4.8055 " 1.20 2.00 12.00 6.00 .26 3.7060 " 1.20 2.00 12.00 6.00 .36 3.50
Pay More than $20,000 Pay Less than $20,000
SCHEDULE 2
Separation From Active Employment BeforeAge & Service Retirement & Individual Pay Increase Assumptions
Withdrawing Within Next YearPercent of Active Members
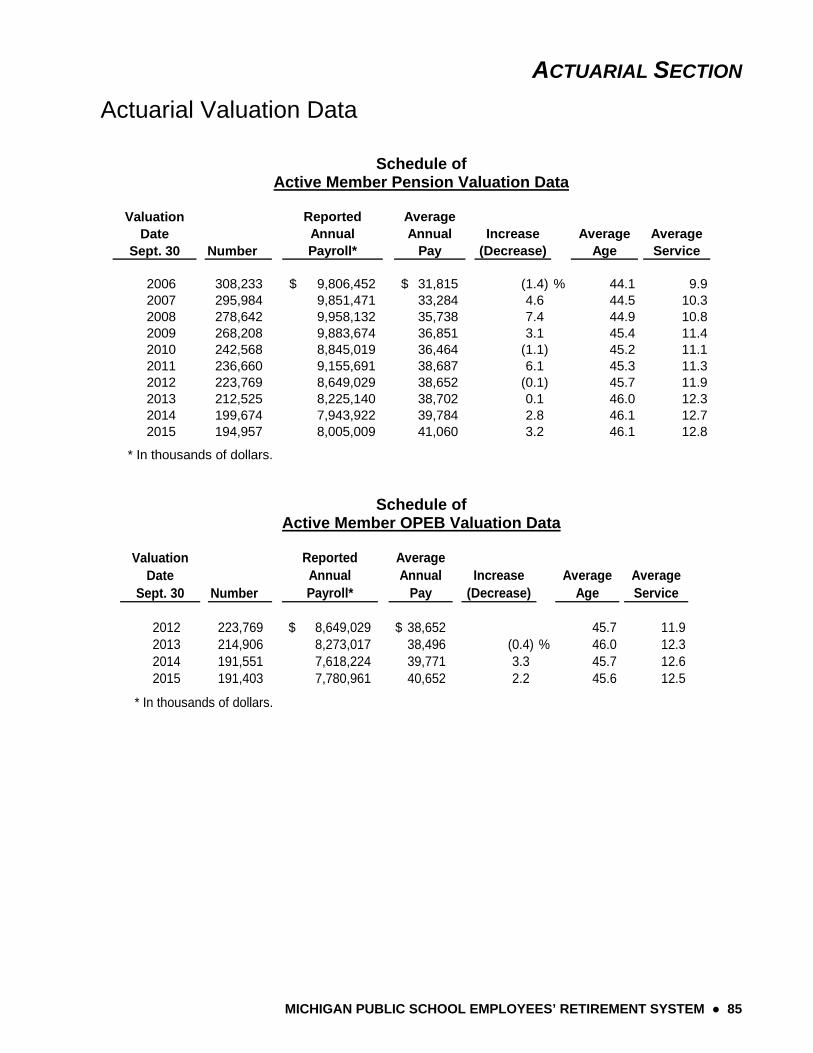
ACTUARIAL SECTION
MICHIGAN PUBLIC SCHOOL EMPLOYEES’ RETIREMENT SYSTEM ● 85
Actuarial Valuation Data
Schedule of Active Member Pension Valuation Data
Number
Reported Annual Payroll*
Average Annual
PayIncrease
(Decrease)Average
AgeAverage Service
2006 308,233 9,806,452$ 31,815$ (1.4) % 44.1 9.92007 295,984 9,851,471 33,284 4.6 44.5 10.32008 278,642 9,958,132 35,738 7.4 44.9 10.82009 268,208 9,883,674 36,851 3.1 45.4 11.42010 242,568 8,845,019 36,464 (1.1) 45.2 11.12011 236,660 9,155,691 38,687 6.1 45.3 11.32012 223,769 8,649,029 38,652 (0.1) 45.7 11.92013 212,525 8,225,140 38,702 0.1 46.0 12.32014 199,674 7,943,922 39,784 2.8 46.1 12.72015 194,957 8,005,009 41,060 3.2 46.1 12.8
* In thousands of dollars.
Valuation Date
Sept. 30
Schedule of Active Member OPEB Valuation Data
Number
Reported Annual Payroll*
Average Annual
PayIncrease
(Decrease)Average
AgeAverage Service
2012 223,769 8,649,029$ 38,652$ 45.7 11.92013 214,906 8,273,017 38,496 (0.4) % 46.0 12.32014 191,551 7,618,224 39,771 3.3 45.7 12.62015 191,403 7,780,961 40,652 2.2 45.6 12.5
* In thousands of dollars.
Valuation Date
Sept. 30
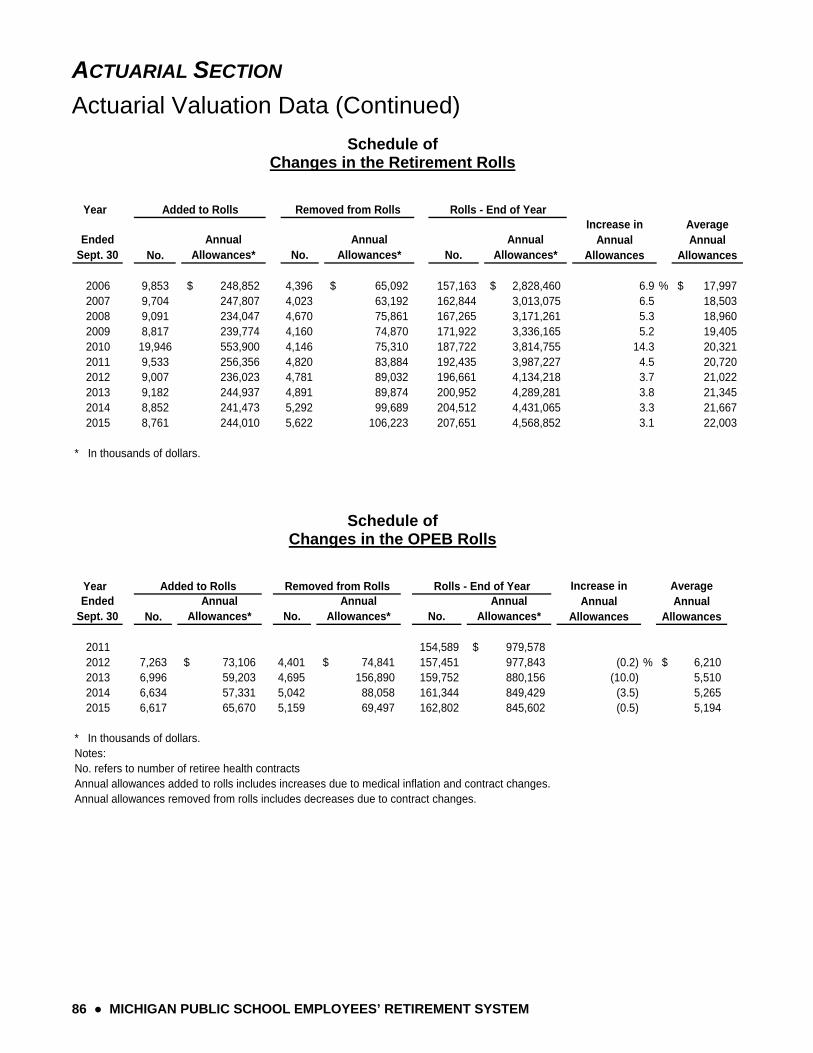
ACTUARIAL SECTION
Actuarial Valuation Data (Continued)
86 ● MICHIGAN PUBLIC SCHOOL EMPLOYEES’ RETIREMENT SYSTEM
Schedule of Changes in the Retirement Rolls
Year
Ended Sept. 30 No.
Annual Allowances* No.
Annual Allowances* No.
Annual Allowances*
2006 9,853 248,852$ 4,396 65,092$ 157,163 2,828,460$ 6.9 % 17,997$ 2007 9,704 247,807 4,023 63,192 162,844 3,013,075 6.5 18,503 2008 9,091 234,047 4,670 75,861 167,265 3,171,261 5.3 18,960 2009 8,817 239,774 4,160 74,870 171,922 3,336,165 5.2 19,405 2010 19,946 553,900 4,146 75,310 187,722 3,814,755 14.3 20,321 2011 9,533 256,356 4,820 83,884 192,435 3,987,227 4.5 20,720 2012 9,007 236,023 4,781 89,032 196,661 4,134,218 3.7 21,022 2013 9,182 244,937 4,891 89,874 200,952 4,289,281 3.8 21,345 2014 8,852 241,473 5,292 99,689 204,512 4,431,065 3.3 21,667 2015 8,761 244,010 5,622 106,223 207,651 4,568,852 3.1 22,003
* In thousands of dollars.
Average Annual
Allowances
Added to Rolls Removed from Rolls Rolls - End of YearIncrease in
Annual Allowances
Schedule of Changes in the OPEB Rolls
Year Ended
Sept. 30 No.Annual
Allowances* No.Annual
Allowances* No.Annual
Allowances*
2011 154,589 979,578$ 2012 7,263 73,106$ 4,401 74,841$ 157,451 977,843 (0.2) % 6,210$ 2013 6,996 59,203 4,695 156,890 159,752 880,156 (10.0) 5,510 2014 6,634 57,331 5,042 88,058 161,344 849,429 (3.5) 5,265 2015 6,617 65,670 5,159 69,497 162,802 845,602 (0.5) 5,194
* In thousands of dollars.Notes:No. refers to number of retiree health contractsAnnual allowances added to rolls includes increases due to medical inflation and contract changes.Annual allowances removed from rolls includes decreases due to contract changes.
Average Annual
Allowances
Added to Rolls Removed from Rolls Rolls - End of Year Increase in Annual
Allowances
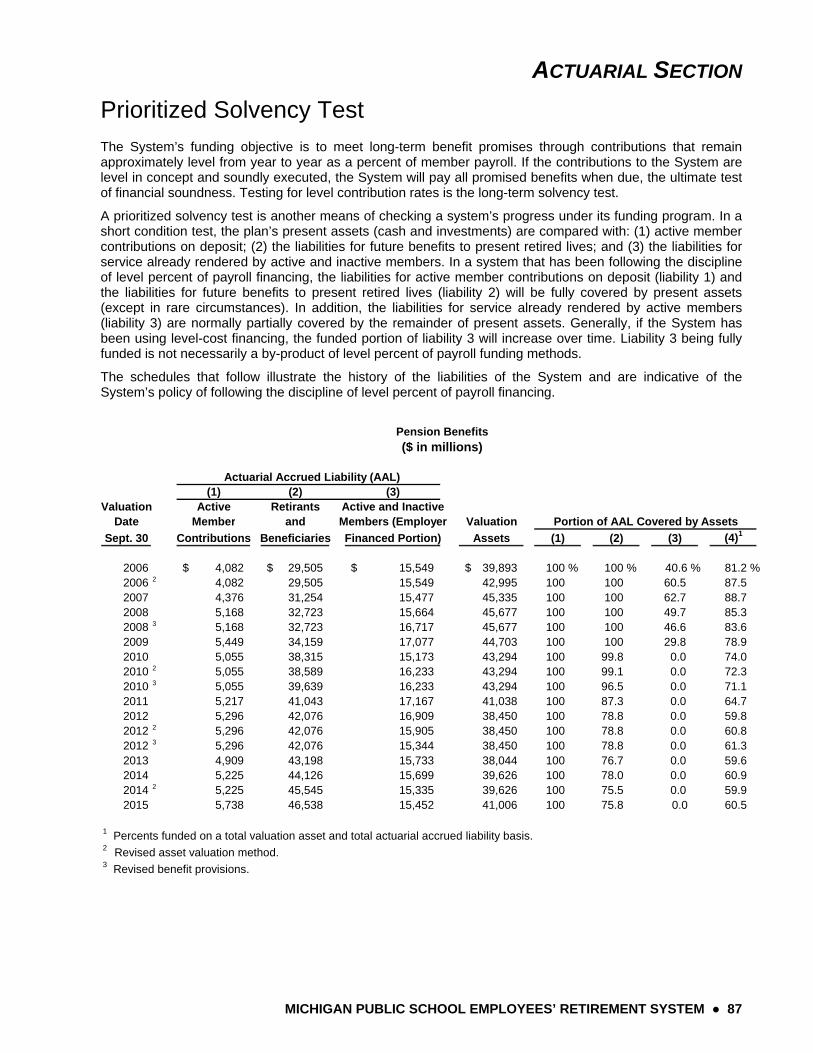
ACTUARIAL SECTION
MICHIGAN PUBLIC SCHOOL EMPLOYEES’ RETIREMENT SYSTEM ● 87
Prioritized Solvency Test
The System’s funding objective is to meet long-term benefit promises through contributions that remain approximately level from year to year as a percent of member payroll. If the contributions to the System are level in concept and soundly executed, the System will pay all promised benefits when due, the ultimate test of financial soundness. Testing for level contribution rates is the long-term solvency test.
A prioritized solvency test is another means of checking a system’s progress under its funding program. In a short condition test, the plan’s present assets (cash and investments) are compared with: (1) active member contributions on deposit; (2) the liabilities for future benefits to present retired lives; and (3) the liabilities for service already rendered by active and inactive members. In a system that has been following the discipline of level percent of payroll financing, the liabilities for active member contributions on deposit (liability 1) and the liabilities for future benefits to present retired lives (liability 2) will be fully covered by present assets (except in rare circumstances). In addition, the liabilities for service already rendered by active members (liability 3) are normally partially covered by the remainder of present assets. Generally, if the System has been using level-cost financing, the funded portion of liability 3 will increase over time. Liability 3 being fully funded is not necessarily a by-product of level percent of payroll funding methods.
The schedules that follow illustrate the history of the liabilities of the System and are indicative of the System’s policy of following the discipline of level percent of payroll financing.
(1) (2) (3)Valuation Active Retirants Active and Inactive
Date Member and Members (Employer Valuation
Sept. 30 Contributions Beneficiaries Financed Portion) Assets (1) (2) (3) (4)1
2006 4,082$ 29,505$ 15,549$ 39,893$ 100 % 100 % 40.6 % 81.2 %2006 2 4,082 29,505 15,549 42,995 100 100 60.5 87.52007 4,376 31,254 15,477 45,335 100 100 62.7 88.72008 5,168 32,723 15,664 45,677 100 100 49.7 85.32008 3 5,168 32,723 16,717 45,677 100 100 46.6 83.62009 5,449 34,159 17,077 44,703 100 100 29.8 78.92010 5,055 38,315 15,173 43,294 100 99.8 0.0 74.02010 2 5,055 38,589 16,233 43,294 100 99.1 0.0 72.32010 3 5,055 39,639 16,233 43,294 100 96.5 0.0 71.12011 5,217 41,043 17,167 41,038 100 87.3 0.0 64.72012 5,296 42,076 16,909 38,450 100 78.8 0.0 59.82012 2 5,296 42,076 15,905 38,450 100 78.8 0.0 60.82012 3 5,296 42,076 15,344 38,450 100 78.8 0.0 61.32013 4,909 43,198 15,733 38,044 100 76.7 0.0 59.62014 5,225 44,126 15,699 39,626 100 78.0 0.0 60.92014 2 5,225 45,545 15,335 39,626 100 75.5 0.0 59.92015 5,738 46,538 15,452 41,006 100 75.8 0.0 60.5
1 Percents funded on a total valuation asset and total actuarial accrued liability basis.2 Revised asset valuation method.3 Revised benefit provisions.
Pension Benefits($ in millions)
Portion of AAL Covered by Assets
Actuarial Accrued Liability (AAL)
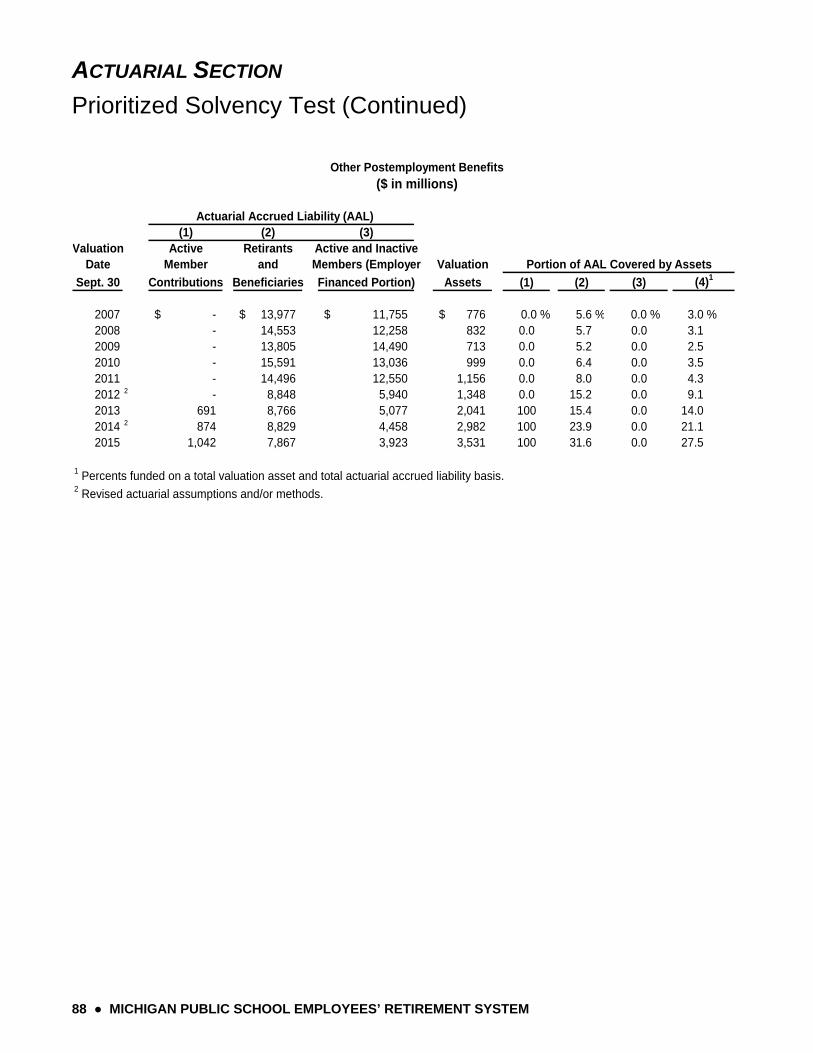
ACTUARIAL SECTION
Prioritized Solvency Test (Continued)
88 ● MICHIGAN PUBLIC SCHOOL EMPLOYEES’ RETIREMENT SYSTEM
(1) (2) (3)Valuation Active Retirants Active and Inactive
Date Member and Members (Employer Valuation
Sept. 30 Contributions Beneficiaries Financed Portion) Assets (1) (2) (3) (4)1
2007 -$ 13,977$ 11,755$ 776$ 0.0 % 5.6 % 0.0 % 3.0 %2008 - 14,553 12,258 832 0.0 5.7 0.0 3.12009 - 13,805 14,490 713 0.0 5.2 0.0 2.52010 - 15,591 13,036 999 0.0 6.4 0.0 3.52011 - 14,496 12,550 1,156 0.0 8.0 0.0 4.32012 2 - 8,848 5,940 1,348 0.0 15.2 0.0 9.12013 691 8,766 5,077 2,041 100 15.4 0.0 14.02014 2 874 8,829 4,458 2,982 100 23.9 0.0 21.12015 1,042 7,867 3,923 3,531 100 31.6 0.0 27.5
1 Percents funded on a total valuation asset and total actuarial accrued liability basis.2 Revised actuarial assumptions and/or methods.
Other Postemployment Benefits($ in millions)
Portion of AAL Covered by Assets
Actuarial Accrued Liability (AAL)
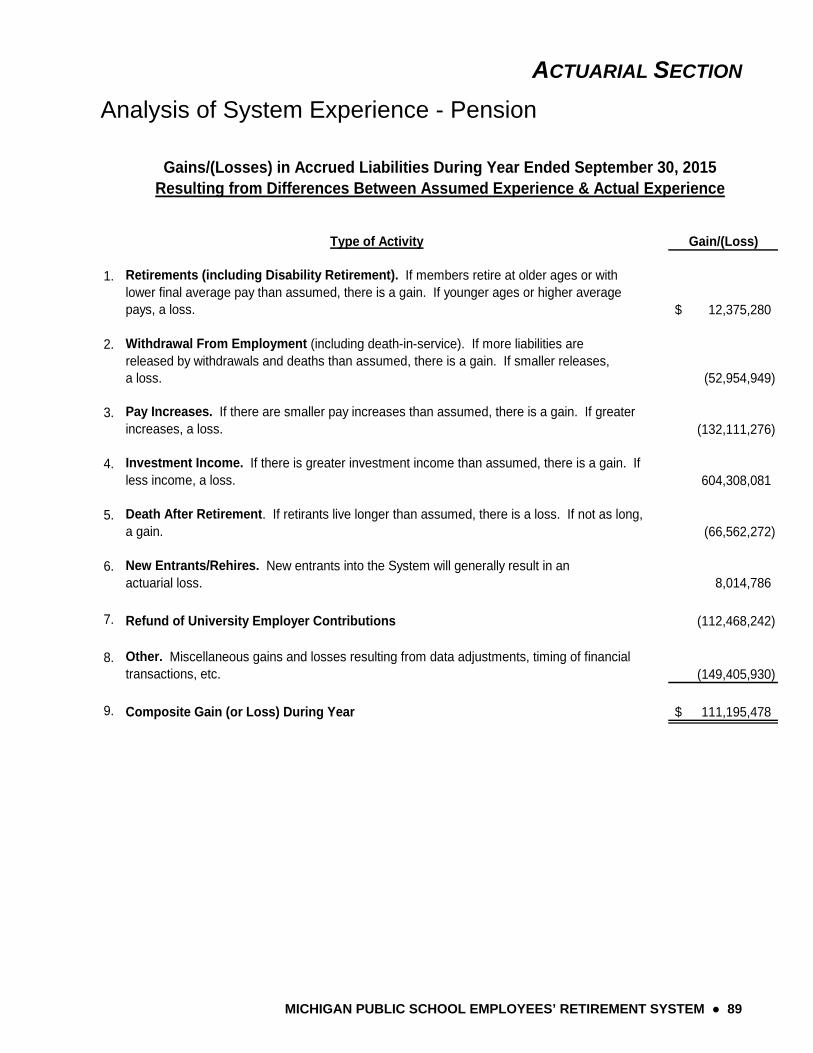
ACTUARIAL SECTION
MICHIGAN PUBLIC SCHOOL EMPLOYEES’ RETIREMENT SYSTEM ● 89
Analysis of System Experience - Pension
Gain/(Loss)
1. Retirements (including Disability Retirement). If members retire at older ages or with lower final average pay than assumed, there is a gain. If younger ages or higher average pays, a loss. 12,375,280$
2. Withdrawal From Employment (including death-in-service). If more liabilities are released by withdrawals and deaths than assumed, there is a gain. If smaller releases,a loss. (52,954,949)
3. Pay Increases. If there are smaller pay increases than assumed, there is a gain. If greater increases, a loss. (132,111,276)
4. Investment Income. If there is greater investment income than assumed, there is a gain. If less income, a loss. 604,308,081
5. Death After Retirement. If retirants live longer than assumed, there is a loss. If not as long, a gain. (66,562,272)
6. New Entrants/Rehires. New entrants into the System will generally result in an actuarial loss. 8,014,786
7. Refund of University Employer Contributions (112,468,242)
8. Other. Miscellaneous gains and losses resulting from data adjustments, timing of financial transactions, etc. (149,405,930)
9. Composite Gain (or Loss) During Year 111,195,478$
Gains/(Losses) in Accrued Liabilities During Year Ended September 30, 2015Resulting from Differences Between Assumed Experience & Actual Experience
Type of Activity
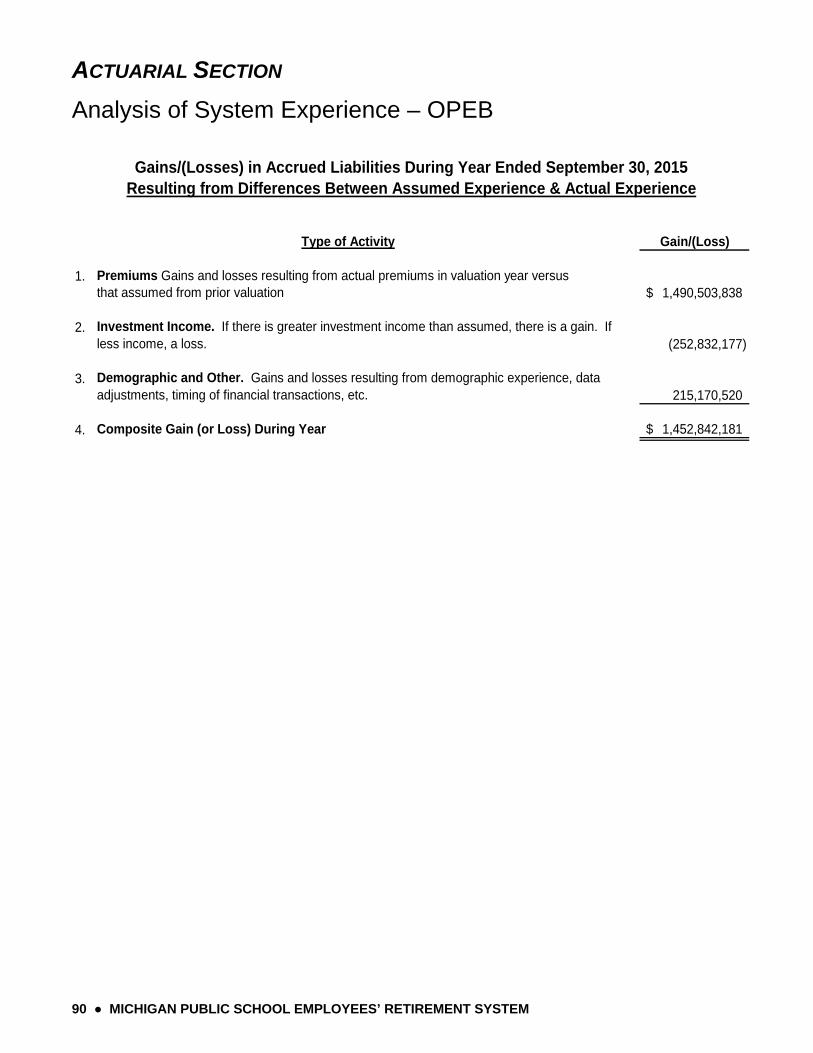
ACTUARIAL SECTION
90 ● MICHIGAN PUBLIC SCHOOL EMPLOYEES’ RETIREMENT SYSTEM
Analysis of System Experience – OPEB
Gain/(Loss)
1. Premiums Gains and losses resulting from actual premiums in valuation year versusthat assumed from prior valuation 1,490,503,838$
2. Investment Income. If there is greater investment income than assumed, there is a gain. If less income, a loss. (252,832,177)
3. Demographic and Other. Gains and losses resulting from demographic experience, data adjustments, timing of financial transactions, etc. 215,170,520
4. Composite Gain (or Loss) During Year 1,452,842,181$
Gains/(Losses) in Accrued Liabilities During Year Ended September 30, 2015Resulting from Differences Between Assumed Experience & Actual Experience
Type of Activity
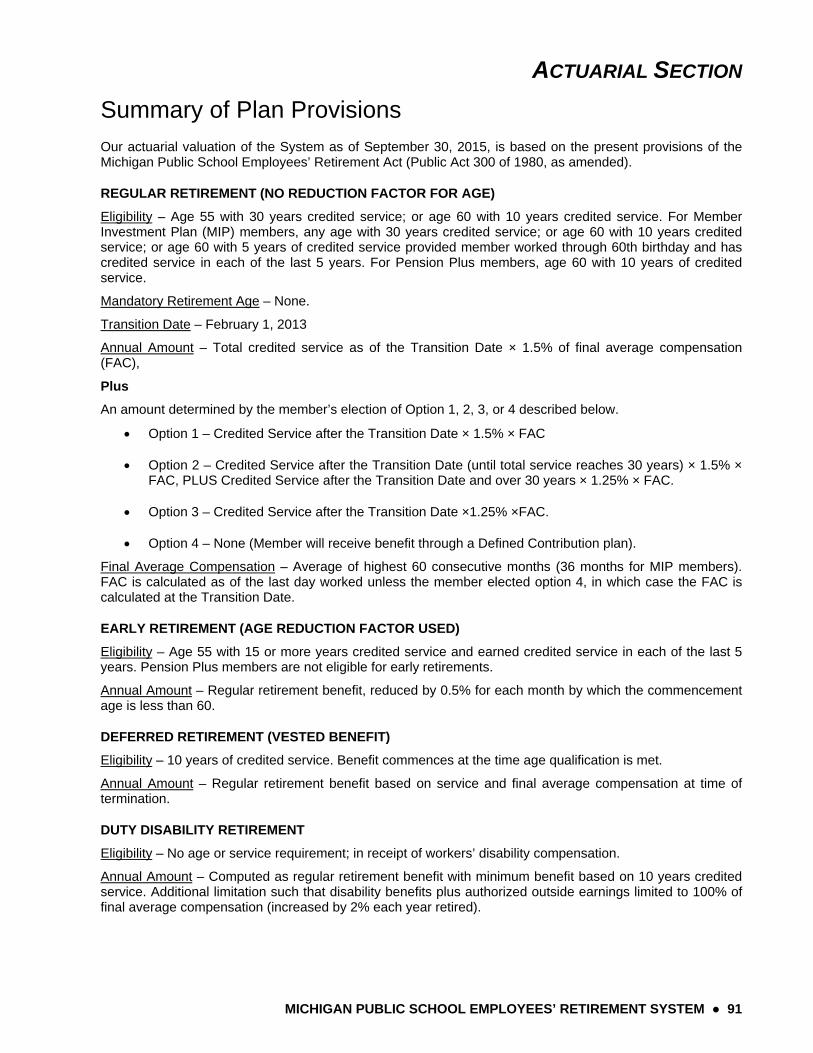
ACTUARIAL SECTION
MICHIGAN PUBLIC SCHOOL EMPLOYEES’ RETIREMENT SYSTEM ● 91
Summary of Plan Provisions
Our actuarial valuation of the System as of September 30, 2015, is based on the present provisions of the Michigan Public School Employees’ Retirement Act (Public Act 300 of 1980, as amended).
REGULAR RETIREMENT (NO REDUCTION FACTOR FOR AGE)
Eligibility – Age 55 with 30 years credited service; or age 60 with 10 years credited service. For Member Investment Plan (MIP) members, any age with 30 years credited service; or age 60 with 10 years credited service; or age 60 with 5 years of credited service provided member worked through 60th birthday and has credited service in each of the last 5 years. For Pension Plus members, age 60 with 10 years of credited service.
Mandatory Retirement Age – None.
Transition Date – February 1, 2013
Annual Amount – Total credited service as of the Transition Date × 1.5% of final average compensation (FAC),
Plus
An amount determined by the member’s election of Option 1, 2, 3, or 4 described below.
Option 1 – Credited Service after the Transition Date × 1.5% × FAC
Option 2 – Credited Service after the Transition Date (until total service reaches 30 years) × 1.5% × FAC, PLUS Credited Service after the Transition Date and over 30 years × 1.25% × FAC.
Option 3 – Credited Service after the Transition Date ×1.25% ×FAC.
Option 4 – None (Member will receive benefit through a Defined Contribution plan).
Final Average Compensation – Average of highest 60 consecutive months (36 months for MIP members). FAC is calculated as of the last day worked unless the member elected option 4, in which case the FAC is calculated at the Transition Date.
EARLY RETIREMENT (AGE REDUCTION FACTOR USED)
Eligibility – Age 55 with 15 or more years credited service and earned credited service in each of the last 5 years. Pension Plus members are not eligible for early retirements.
Annual Amount – Regular retirement benefit, reduced by 0.5% for each month by which the commencement age is less than 60.
DEFERRED RETIREMENT (VESTED BENEFIT)
Eligibility – 10 years of credited service. Benefit commences at the time age qualification is met.
Annual Amount – Regular retirement benefit based on service and final average compensation at time of termination.
DUTY DISABILITY RETIREMENT
Eligibility – No age or service requirement; in receipt of workers’ disability compensation.
Annual Amount – Computed as regular retirement benefit with minimum benefit based on 10 years credited service. Additional limitation such that disability benefits plus authorized outside earnings limited to 100% of final average compensation (increased by 2% each year retired).
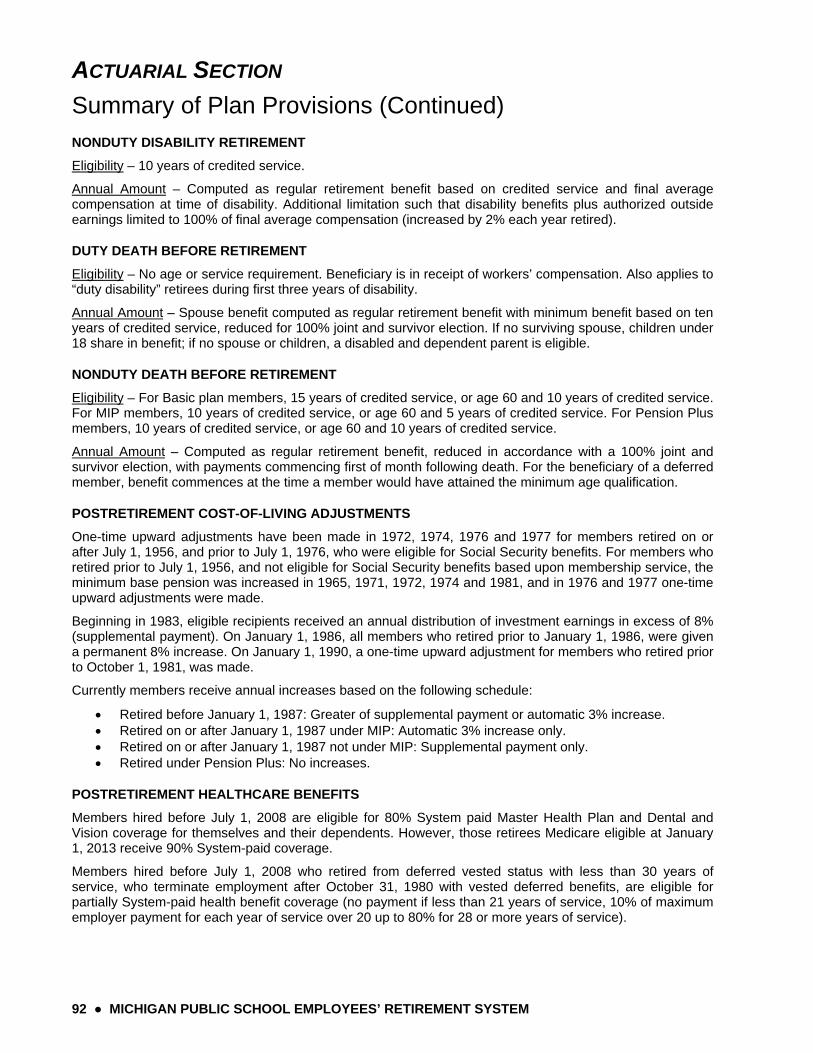
ACTUARIAL SECTION
Summary of Plan Provisions (Continued)
92 ● MICHIGAN PUBLIC SCHOOL EMPLOYEES’ RETIREMENT SYSTEM
NONDUTY DISABILITY RETIREMENT
Eligibility – 10 years of credited service.
Annual Amount – Computed as regular retirement benefit based on credited service and final average compensation at time of disability. Additional limitation such that disability benefits plus authorized outside earnings limited to 100% of final average compensation (increased by 2% each year retired).
DUTY DEATH BEFORE RETIREMENT
Eligibility – No age or service requirement. Beneficiary is in receipt of workers’ compensation. Also applies to “duty disability” retirees during first three years of disability.
Annual Amount – Spouse benefit computed as regular retirement benefit with minimum benefit based on ten years of credited service, reduced for 100% joint and survivor election. If no surviving spouse, children under 18 share in benefit; if no spouse or children, a disabled and dependent parent is eligible.
NONDUTY DEATH BEFORE RETIREMENT
Eligibility – For Basic plan members, 15 years of credited service, or age 60 and 10 years of credited service. For MIP members, 10 years of credited service, or age 60 and 5 years of credited service. For Pension Plus members, 10 years of credited service, or age 60 and 10 years of credited service.
Annual Amount – Computed as regular retirement benefit, reduced in accordance with a 100% joint and survivor election, with payments commencing first of month following death. For the beneficiary of a deferred member, benefit commences at the time a member would have attained the minimum age qualification.
POSTRETIREMENT COST-OF-LIVING ADJUSTMENTS
One-time upward adjustments have been made in 1972, 1974, 1976 and 1977 for members retired on or after July 1, 1956, and prior to July 1, 1976, who were eligible for Social Security benefits. For members who retired prior to July 1, 1956, and not eligible for Social Security benefits based upon membership service, the minimum base pension was increased in 1965, 1971, 1972, 1974 and 1981, and in 1976 and 1977 one-time upward adjustments were made.
Beginning in 1983, eligible recipients received an annual distribution of investment earnings in excess of 8% (supplemental payment). On January 1, 1986, all members who retired prior to January 1, 1986, were given a permanent 8% increase. On January 1, 1990, a one-time upward adjustment for members who retired prior to October 1, 1981, was made.
Currently members receive annual increases based on the following schedule:
Retired before January 1, 1987: Greater of supplemental payment or automatic 3% increase. Retired on or after January 1, 1987 under MIP: Automatic 3% increase only. Retired on or after January 1, 1987 not under MIP: Supplemental payment only. Retired under Pension Plus: No increases.
POSTRETIREMENT HEALTHCARE BENEFITS
Members hired before July 1, 2008 are eligible for 80% System paid Master Health Plan and Dental and Vision coverage for themselves and their dependents. However, those retirees Medicare eligible at January 1, 2013 receive 90% System-paid coverage.
Members hired before July 1, 2008 who retired from deferred vested status with less than 30 years of service, who terminate employment after October 31, 1980 with vested deferred benefits, are eligible for partially System-paid health benefit coverage (no payment if less than 21 years of service, 10% of maximum employer payment for each year of service over 20 up to 80% for 28 or more years of service).
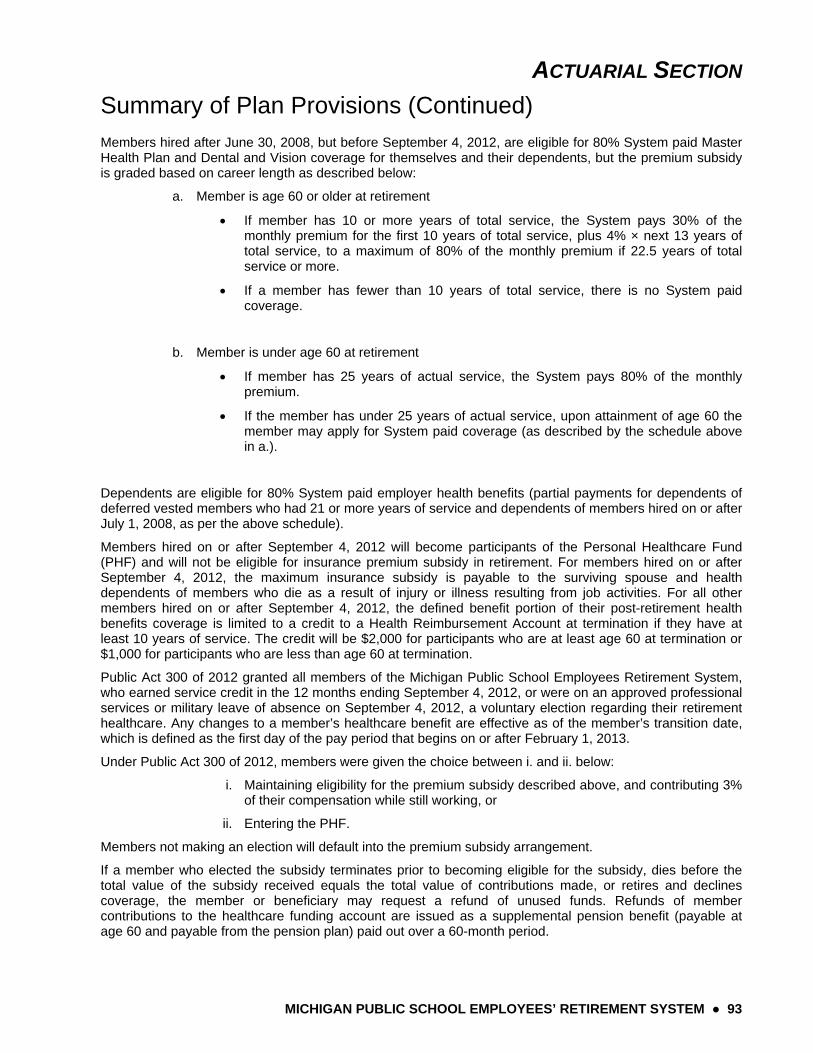
ACTUARIAL SECTION
Summary of Plan Provisions (Continued)
MICHIGAN PUBLIC SCHOOL EMPLOYEES’ RETIREMENT SYSTEM ● 93
Members hired after June 30, 2008, but before September 4, 2012, are eligible for 80% System paid Master Health Plan and Dental and Vision coverage for themselves and their dependents, but the premium subsidy is graded based on career length as described below:
a. Member is age 60 or older at retirement
If member has 10 or more years of total service, the System pays 30% of the monthly premium for the first 10 years of total service, plus 4% × next 13 years of total service, to a maximum of 80% of the monthly premium if 22.5 years of total service or more.
If a member has fewer than 10 years of total service, there is no System paid coverage.
b. Member is under age 60 at retirement
If member has 25 years of actual service, the System pays 80% of the monthly premium.
If the member has under 25 years of actual service, upon attainment of age 60 the member may apply for System paid coverage (as described by the schedule above in a.).
Dependents are eligible for 80% System paid employer health benefits (partial payments for dependents of deferred vested members who had 21 or more years of service and dependents of members hired on or after July 1, 2008, as per the above schedule).
Members hired on or after September 4, 2012 will become participants of the Personal Healthcare Fund (PHF) and will not be eligible for insurance premium subsidy in retirement. For members hired on or after September 4, 2012, the maximum insurance subsidy is payable to the surviving spouse and health dependents of members who die as a result of injury or illness resulting from job activities. For all other members hired on or after September 4, 2012, the defined benefit portion of their post-retirement health benefits coverage is limited to a credit to a Health Reimbursement Account at termination if they have at least 10 years of service. The credit will be $2,000 for participants who are at least age 60 at termination or $1,000 for participants who are less than age 60 at termination.
Public Act 300 of 2012 granted all members of the Michigan Public School Employees Retirement System, who earned service credit in the 12 months ending September 4, 2012, or were on an approved professional services or military leave of absence on September 4, 2012, a voluntary election regarding their retirement healthcare. Any changes to a member’s healthcare benefit are effective as of the member’s transition date, which is defined as the first day of the pay period that begins on or after February 1, 2013.
Under Public Act 300 of 2012, members were given the choice between i. and ii. below:
i. Maintaining eligibility for the premium subsidy described above, and contributing 3% of their compensation while still working, or
ii. Entering the PHF.
Members not making an election will default into the premium subsidy arrangement.
If a member who elected the subsidy terminates prior to becoming eligible for the subsidy, dies before the total value of the subsidy received equals the total value of contributions made, or retires and declines coverage, the member or beneficiary may request a refund of unused funds. Refunds of member contributions to the healthcare funding account are issued as a supplemental pension benefit (payable at age 60 and payable from the pension plan) paid out over a 60-month period.
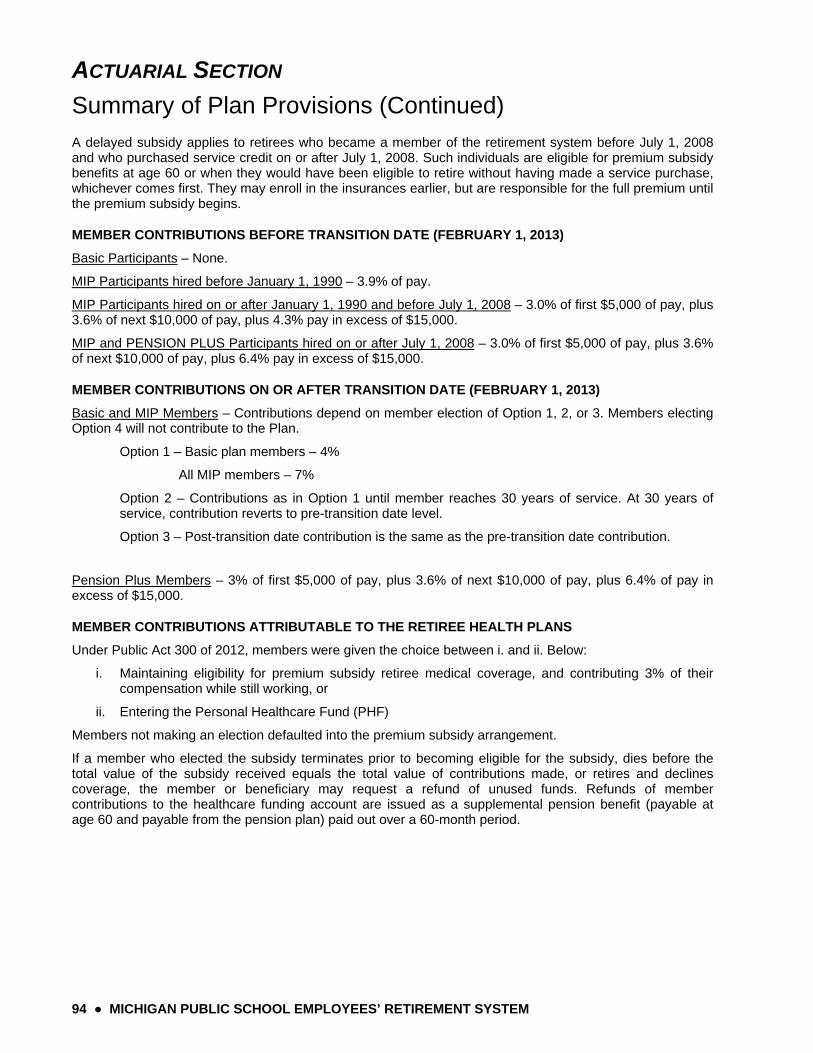
ACTUARIAL SECTION
Summary of Plan Provisions (Continued)
94 ● MICHIGAN PUBLIC SCHOOL EMPLOYEES’ RETIREMENT SYSTEM
A delayed subsidy applies to retirees who became a member of the retirement system before July 1, 2008 and who purchased service credit on or after July 1, 2008. Such individuals are eligible for premium subsidy benefits at age 60 or when they would have been eligible to retire without having made a service purchase, whichever comes first. They may enroll in the insurances earlier, but are responsible for the full premium until the premium subsidy begins.
MEMBER CONTRIBUTIONS BEFORE TRANSITION DATE (FEBRUARY 1, 2013)
Basic Participants – None.
MIP Participants hired before January 1, 1990 – 3.9% of pay.
MIP Participants hired on or after January 1, 1990 and before July 1, 2008 – 3.0% of first $5,000 of pay, plus 3.6% of next $10,000 of pay, plus 4.3% pay in excess of $15,000.
MIP and PENSION PLUS Participants hired on or after July 1, 2008 – 3.0% of first $5,000 of pay, plus 3.6% of next $10,000 of pay, plus 6.4% pay in excess of $15,000.
MEMBER CONTRIBUTIONS ON OR AFTER TRANSITION DATE (FEBRUARY 1, 2013)
Basic and MIP Members – Contributions depend on member election of Option 1, 2, or 3. Members electing Option 4 will not contribute to the Plan.
Option 1 – Basic plan members – 4%
All MIP members – 7%
Option 2 – Contributions as in Option 1 until member reaches 30 years of service. At 30 years of service, contribution reverts to pre-transition date level.
Option 3 – Post-transition date contribution is the same as the pre-transition date contribution.
Pension Plus Members – 3% of first $5,000 of pay, plus 3.6% of next $10,000 of pay, plus 6.4% of pay in excess of $15,000.
MEMBER CONTRIBUTIONS ATTRIBUTABLE TO THE RETIREE HEALTH PLANS
Under Public Act 300 of 2012, members were given the choice between i. and ii. Below:
i. Maintaining eligibility for premium subsidy retiree medical coverage, and contributing 3% of their compensation while still working, or
ii. Entering the Personal Healthcare Fund (PHF)
Members not making an election defaulted into the premium subsidy arrangement.
If a member who elected the subsidy terminates prior to becoming eligible for the subsidy, dies before the total value of the subsidy received equals the total value of contributions made, or retires and declines coverage, the member or beneficiary may request a refund of unused funds. Refunds of member contributions to the healthcare funding account are issued as a supplemental pension benefit (payable at age 60 and payable from the pension plan) paid out over a 60-month period.
MICHIGAN PUBLIC SCHOOL EMPLOYEES’ RETIREMENT SYSTEM ● 95
STATISTICAL SECTION Schedules of Additions by Source Schedules of Deductions by Type
Schedules of Changes in Fiduciary Net Position Schedules of Benefits and Refunds by Type
Schedules of Retired Members by Type of Benefit Schedule of Funding Progress – Pension Plan
Schedule of Other Postemployment Benefits Schedules of Average Benefit Payments
Schedule of Principal Participating Employers Ten Year History of Membership
Schedule of Participating Employers
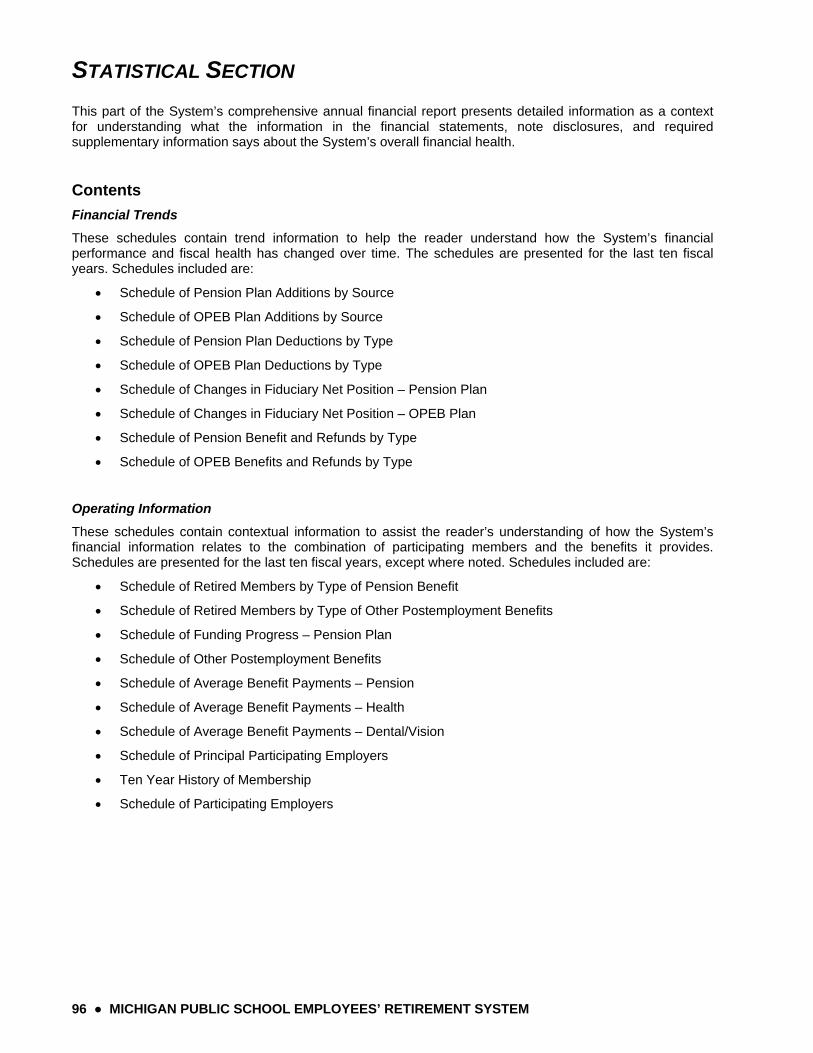
STATISTICAL SECTION
96 ● MICHIGAN PUBLIC SCHOOL EMPLOYEES’ RETIREMENT SYSTEM
This part of the System’s comprehensive annual financial report presents detailed information as a context for understanding what the information in the financial statements, note disclosures, and required supplementary information says about the System’s overall financial health.
Contents
Financial Trends
These schedules contain trend information to help the reader understand how the System’s financial performance and fiscal health has changed over time. The schedules are presented for the last ten fiscal years. Schedules included are:
Schedule of Pension Plan Additions by Source
Schedule of OPEB Plan Additions by Source
Schedule of Pension Plan Deductions by Type
Schedule of OPEB Plan Deductions by Type
Schedule of Changes in Fiduciary Net Position – Pension Plan
Schedule of Changes in Fiduciary Net Position – OPEB Plan
Schedule of Pension Benefit and Refunds by Type
Schedule of OPEB Benefits and Refunds by Type
Operating Information
These schedules contain contextual information to assist the reader’s understanding of how the System’s financial information relates to the combination of participating members and the benefits it provides. Schedules are presented for the last ten fiscal years, except where noted. Schedules included are:
Schedule of Retired Members by Type of Pension Benefit
Schedule of Retired Members by Type of Other Postemployment Benefits
Schedule of Funding Progress – Pension Plan
Schedule of Other Postemployment Benefits
Schedule of Average Benefit Payments – Pension
Schedule of Average Benefit Payments – Health
Schedule of Average Benefit Payments – Dental/Vision
Schedule of Principal Participating Employers
Ten Year History of Membership
Schedule of Participating Employers
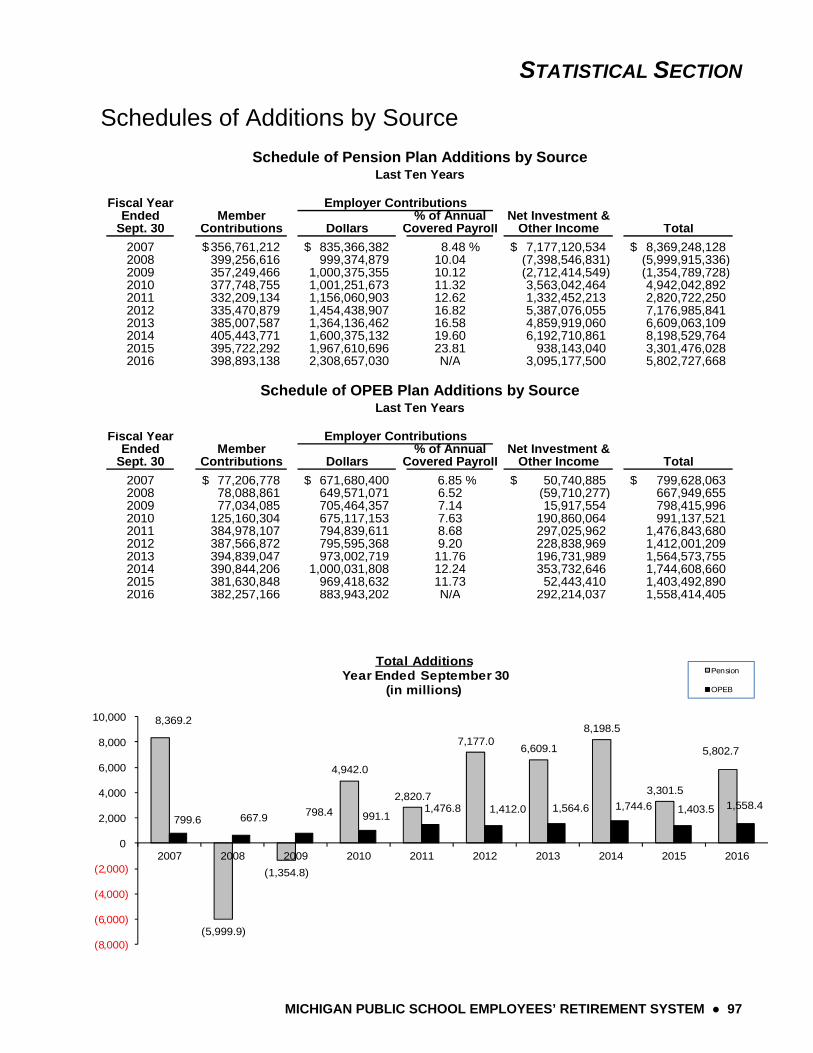
STATISTICAL SECTION
MICHIGAN PUBLIC SCHOOL EMPLOYEES’ RETIREMENT SYSTEM ● 97
Schedules of Additions by Source
Fiscal YearEnded Member % of Annual Net Investment &
Sept. 30 Contributions Dollars Covered Payroll Other Income Total
2007 356,761,212$ 835,366,382$ 8.48 % 7,177,120,534$ 8,369,248,128$ 2008 399,256,616 999,374,879 10.04 (7,398,546,831) (5,999,915,336) 2009 357,249,466 1,000,375,355 10.12 (2,712,414,549) (1,354,789,728) 2010 377,748,755 1,001,251,673 11.32 3,563,042,464 4,942,042,892 2011 332,209,134 1,156,060,903 12.62 1,332,452,213 2,820,722,250 2012 335,470,879 1,454,438,907 16.82 5,387,076,055 7,176,985,841 2013 385,007,587 1,364,136,462 16.58 4,859,919,060 6,609,063,109 2014 405,443,771 1,600,375,132 19.60 6,192,710,861 8,198,529,764 2015 395,722,292 1,967,610,696 23.81 938,143,040 3,301,476,028 2016 398,893,138 2,308,657,030 N/A 3,095,177,500 5,802,727,668
Fiscal Year Ended Member % of Annual Net Investment &
Sept. 30 Contributions Dollars Covered Payroll Other Income Total
2007 77,206,778$ 671,680,400$ 6.85 % 50,740,885$ 799,628,063$ 2008 78,088,861 649,571,071 6.52 (59,710,277) 667,949,655 2009 77,034,085 705,464,357 7.14 15,917,554 798,415,996 2010 125,160,304 675,117,153 7.63 190,860,064 991,137,521 2011 384,978,107 794,839,611 8.68 297,025,962 1,476,843,680 2012 387,566,872 795,595,368 9.20 228,838,969 1,412,001,209 2013 394,839,047 973,002,719 11.76 196,731,989 1,564,573,755 2014 390,844,206 1,000,031,808 12.24 353,732,646 1,744,608,660 2015 381,630,848 969,418,632 11.73 52,443,410 1,403,492,890 2016 382,257,166 883,943,202 N/A 292,214,037 1,558,414,405
Schedule of Pension Plan Additions by Source
Employer Contributions
Schedule of OPEB Plan Additions by Source
Employer Contributions
Last Ten Years
Last Ten Years
8,369.2
(5,999.9)
(1,354.8)
4,942.0
2,820.7
7,177.0 6,609.1
8,198.5
3,301.5
5,802.7
799.6 667.9 798.4 991.1 1,476.8 1,412.0 1,564.6 1,744.6 1,403.5 1,558.4
(8,000)
(6,000)
(4,000)
(2,000)
0
2,000
4,000
6,000
8,000
10,000
2007 2008 2009 2010 2011 2012 2013 2014 2015 2016
Total AdditionsYear Ended September 30
(in millions)
Pension
OPEB
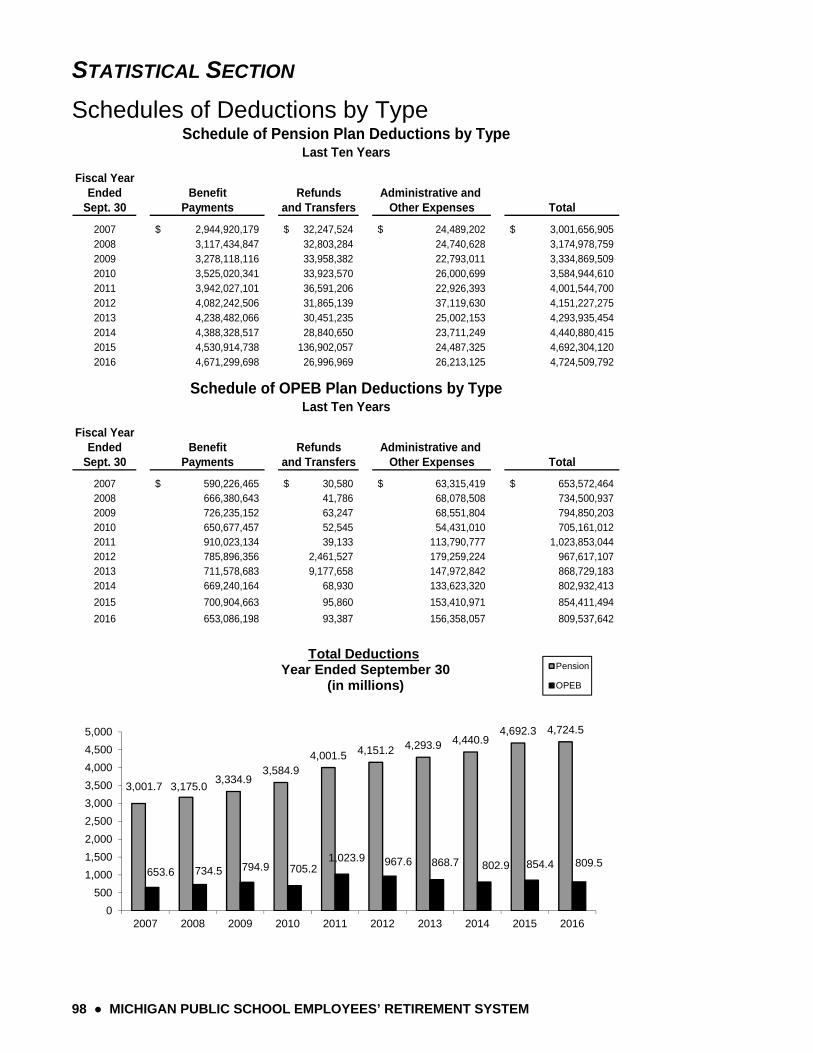
STATISTICAL SECTION
98 ● MICHIGAN PUBLIC SCHOOL EMPLOYEES’ RETIREMENT SYSTEM
Schedules of Deductions by Type
Fiscal YearEnded Benefit Refunds Administrative and
Sept. 30 Payments and Transfers Other Expenses Total
2007 2,944,920,179$ 32,247,524$ 24,489,202$ 3,001,656,905$ 2008 3,117,434,847 32,803,284 24,740,628 3,174,978,759 2009 3,278,118,116 33,958,382 22,793,011 3,334,869,509 2010 3,525,020,341 33,923,570 26,000,699 3,584,944,610 2011 3,942,027,101 36,591,206 22,926,393 4,001,544,700 2012 4,082,242,506 31,865,139 37,119,630 4,151,227,275 2013 4,238,482,066 30,451,235 25,002,153 4,293,935,454 2014 4,388,328,517 28,840,650 23,711,249 4,440,880,415 2015 4,530,914,738 136,902,057 24,487,325 4,692,304,120 2016 4,671,299,698 26,996,969 26,213,125 4,724,509,792
Fiscal YearEnded Benefit Refunds Administrative and
Sept. 30 Payments and Transfers Other Expenses Total
2007 590,226,465$ 30,580$ 63,315,419$ 653,572,464$ 2008 666,380,643 41,786 68,078,508 734,500,937 2009 726,235,152 63,247 68,551,804 794,850,203 2010 650,677,457 52,545 54,431,010 705,161,012 2011 910,023,134 39,133 113,790,777 1,023,853,044 2012 785,896,356 2,461,527 179,259,224 967,617,107 2013 711,578,683 9,177,658 147,972,842 868,729,183 2014 669,240,164 68,930 133,623,320 802,932,413
2015 700,904,663 95,860 153,410,971 854,411,494
2016 653,086,198 93,387 156,358,057 809,537,642
Schedule of Pension Plan Deductions by Type
Schedule of OPEB Plan Deductions by Type
Last Ten Years
Last Ten Years
3,001.7 3,175.0 3,334.9
3,584.9 4,001.5 4,151.2 4,293.9 4,440.9
4,692.3 4,724.5
653.6 734.5 794.9 705.2 1,023.9 967.6 868.7 802.9 854.4 809.5
0
500
1,000
1,500
2,000
2,500
3,000
3,500
4,000
4,500
5,000
2007 2008 2009 2010 2011 2012 2013 2014 2015 2016
Total DeductionsYear Ended September 30
(in millions)
Pension
OPEB

STATISTICAL SECTION
MICHIGAN PUBLIC SCHOOL EMPLOYEES’ RETIREMENT SYSTEM ● 99
This page was intentionally left blank.
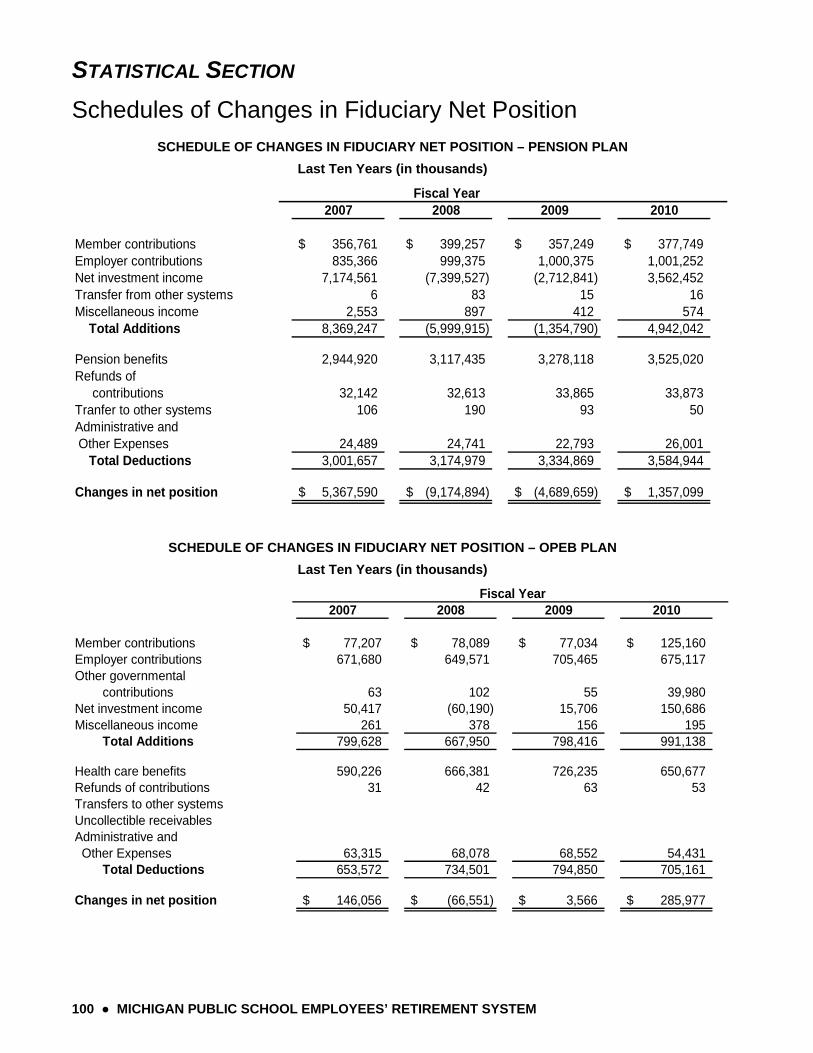
STATISTICAL SECTION
100 ● MICHIGAN PUBLIC SCHOOL EMPLOYEES’ RETIREMENT SYSTEM
Schedules of Changes in Fiduciary Net Position
SCHEDULE OF CHANGES IN FIDUCIARY NET POSITION – PENSION PLAN
Last Ten Years (in thousands)
2007 2008 2009 2010
Member contributions 356,761$ 399,257$ 357,249$ 377,749$ Employer contributions 835,366 999,375 1,000,375 1,001,252 Net investment income 7,174,561 (7,399,527) (2,712,841) 3,562,452 Transfer from other systems 6 83 15 16 Miscellaneous income 2,553 897 412 574 Total Additions 8,369,247 (5,999,915) (1,354,790) 4,942,042
Pension benefits 2,944,920 3,117,435 3,278,118 3,525,020 Refunds of contributions 32,142 32,613 33,865 33,873 Tranfer to other systems 106 190 93 50 Administrative and Other Expenses 24,489 24,741 22,793 26,001 Total Deductions 3,001,657 3,174,979 3,334,869 3,584,944
Changes in net position 5,367,590$ (9,174,894)$ (4,689,659)$ 1,357,099$
Fiscal Year
SCHEDULE OF CHANGES IN FIDUCIARY NET POSITION – OPEB PLAN
Last Ten Years (in thousands)
2007 2008 2009 2010
Member contributions 77,207$ 78,089$ 77,034$ 125,160$ Employer contributions 671,680 649,571 705,465 675,117 Other governmental contributions 63 102 55 39,980 Net investment income 50,417 (60,190) 15,706 150,686 Miscellaneous income 261 378 156 195 Total Additions 799,628 667,950 798,416 991,138
Health care benefits 590,226 666,381 726,235 650,677 Refunds of contributions 31 42 63 53 Transfers to other systemsUncollectible receivablesAdministrative and Other Expenses 63,315 68,078 68,552 54,431 Total Deductions 653,572 734,501 794,850 705,161
Changes in net position 146,056$ (66,551)$ 3,566$ 285,977$
Fiscal Year

STATISTICAL SECTION
MICHIGAN PUBLIC SCHOOL EMPLOYEES’ RETIREMENT SYSTEM ● 101
2011 2012 2013 2014 2015 2016
332,209$ 335,471$ 385,008$ 405,444$ 395,722$ 398,893$ 1,156,061 1,454,439 1,364,136 1,600,375 1,967,611 2,308,657 1,331,744 5,386,497 4,858,563 6,190,449 937,663 3,094,694
5 704 579 1,356 2,262 480 484
2,820,722 7,176,986 6,609,063 8,198,530 3,301,476 5,802,728
3,942,027 4,082,243 4,238,482 4,388,329 4,530,915 4,671,300
36,591 31,865 30,450 28,841 136,901 26,994 2 1 1 3
22,926 37,120 25,002 23,711 24,487 26,213 4,001,546 4,151,228 4,293,935 4,440,880 4,692,304 4,724,510
(1,180,823)$ 3,025,758$ 2,315,128$ 3,757,650$ (1,390,828)$ 1,078,218$
Fiscal Year (continued)
2011 2012 2013 2014 2015 2016
384,978$ 387,567$ 394,839$ 390,844$ 381,631$ 382,257$ 794,840 795,595 973,003 1,000,032 969,419 883,943
163,949 17,406 9 138 213 2,411 132,993 210,642 196,646 353,064 52,064 289,644
85 790 77 531 166 159 1,476,844 1,412,001 1,564,574 1,744,609 1,403,493 1,558,414
910,023 785,896 711,579 669,240 700,904 653,086 39 2,462 1,095 68 96 93
8,083 1 37,551
113,791 141,708 147,973 133,623 153,411 156,358 1,023,853 967,617 868,729 802,932 854,411 809,538
452,991$ 444,384$ 695,845$ 941,676$ 549,081$ 748,877$
Fiscal Year (continued)
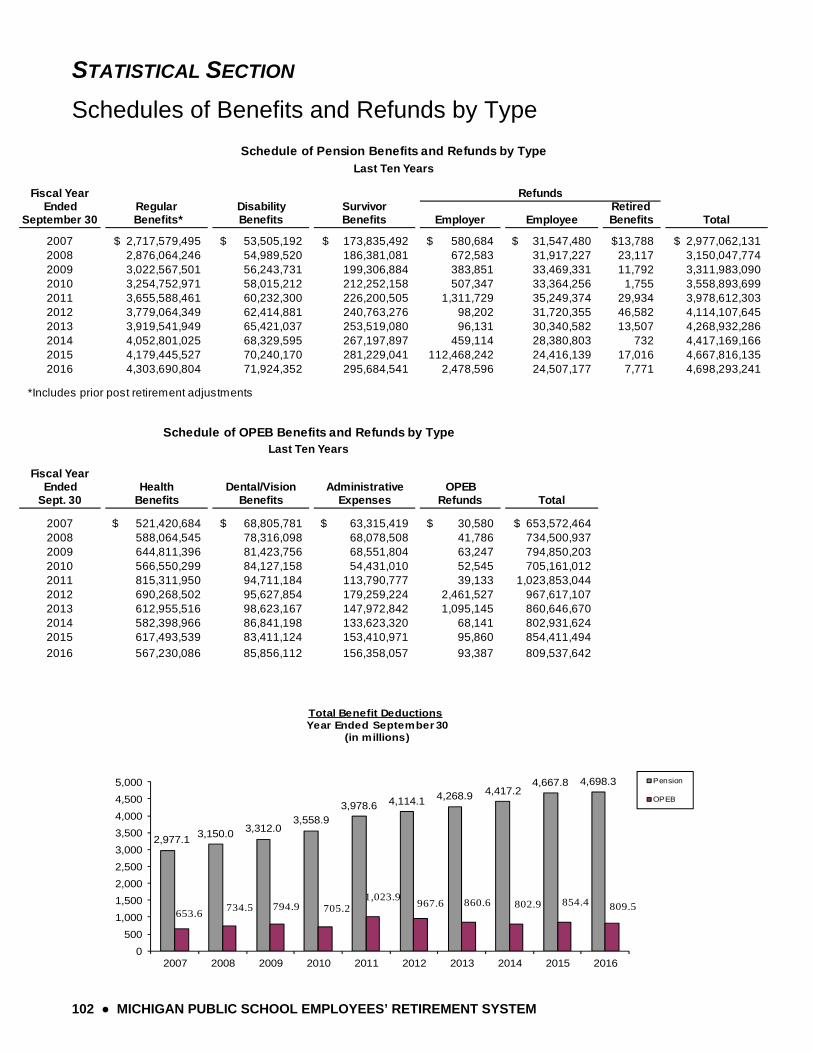
STATISTICAL SECTION
102 ● MICHIGAN PUBLIC SCHOOL EMPLOYEES’ RETIREMENT SYSTEM
Schedules of Benefits and Refunds by Type
Fiscal YearEnded Regular Disability Survivor Retired
September 30 Benefits* Benefits Benefits Employer Employee Benefits Total
2007 2,717,579,495$ 53,505,192$ 173,835,492$ 580,684$ 31,547,480$ 13,788$ 2,977,062,131$ 2008 2,876,064,246 54,989,520 186,381,081 672,583 31,917,227 23,117 3,150,047,774 2009 3,022,567,501 56,243,731 199,306,884 383,851 33,469,331 11,792 3,311,983,090 2010 3,254,752,971 58,015,212 212,252,158 507,347 33,364,256 1,755 3,558,893,699 2011 3,655,588,461 60,232,300 226,200,505 1,311,729 35,249,374 29,934 3,978,612,303 2012 3,779,064,349 62,414,881 240,763,276 98,202 31,720,355 46,582 4,114,107,645 2013 3,919,541,949 65,421,037 253,519,080 96,131 30,340,582 13,507 4,268,932,286 2014 4,052,801,025 68,329,595 267,197,897 459,114 28,380,803 732 4,417,169,166 2015 4,179,445,527 70,240,170 281,229,041 112,468,242 24,416,139 17,016 4,667,816,135 2016 4,303,690,804 71,924,352 295,684,541 2,478,596 24,507,177 7,771 4,698,293,241
*Includes prior post retirement adjustments
Fiscal YearEnded Health Dental/Vision Administrative OPEB
Sept. 30 Benefits Benefits Expenses Refunds Total
2007 521,420,684$ 68,805,781$ 63,315,419$ 30,580$ 653,572,464$ 2008 588,064,545 78,316,098 68,078,508 41,786 734,500,937 2009 644,811,396 81,423,756 68,551,804 63,247 794,850,203 2010 566,550,299 84,127,158 54,431,010 52,545 705,161,012 2011 815,311,950 94,711,184 113,790,777 39,133 1,023,853,0442012 690,268,502 95,627,854 179,259,224 2,461,527 967,617,107 2013 612,955,516 98,623,167 147,972,842 1,095,145 860,646,670 2014 582,398,966 86,841,198 133,623,320 68,141 802,931,624 2015 617,493,539 83,411,124 153,410,971 95,860 854,411,494
2016 567,230,086 85,856,112 156,358,057 93,387 809,537,642
Refunds
Schedule of Pension Benefits and Refunds by Type
Schedule of OPEB Benefits and Refunds by Type
Last Ten Years
Last Ten Years
2,977.1 3,150.0 3,312.0
3,558.9 3,978.6 4,114.1 4,268.9 4,417.2
4,667.8 4,698.3
653.6 734.5 794.9 705.2
1,023.9 967.6 860.6 802.9 854.4 809.5
0
500
1,000
1,500
2,000
2,500
3,000
3,500
4,000
4,500
5,000
2007 2008 2009 2010 2011 2012 2013 2014 2015 2016
Total Benefit DeductionsYear Ended September 30
(in millions)
Pension
OPEB
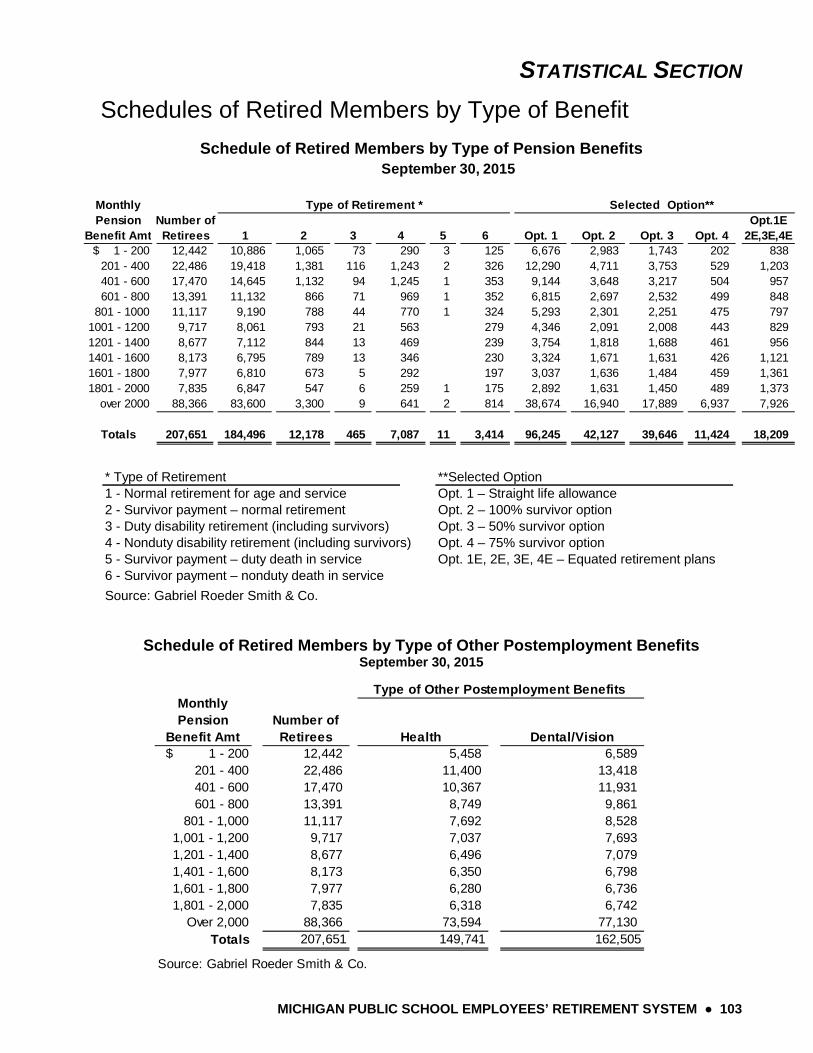
STATISTICAL SECTION
MICHIGAN PUBLIC SCHOOL EMPLOYEES’ RETIREMENT SYSTEM ● 103
Schedules of Retired Members by Type of Benefit
Schedule of Retired Members by Type of Pension Benefits
* Type of Retirement **Selected Option1 - Normal retirement for age and service Opt. 1 – Straight life allowance2 - Survivor payment – normal retirement Opt. 2 – 100% survivor option3 - Duty disability retirement (including survivors) Opt. 3 – 50% survivor option4 - Nonduty disability retirement (including survivors) Opt. 4 – 75% survivor option5 - Survivor payment – duty death in service Opt. 1E, 2E, 3E, 4E – Equated retirement plans6 - Survivor payment – nonduty death in service
Source: Gabriel Roeder Smith & Co.
Schedule of Retired Members by Type of Other Postemployment Benefits September 30, 2015
Number of Retirees Health Dental/Vision
$ 1 - 200 12,442 5,458 6,589 201 - 400 22,486 11,400 13,418 401 - 600 17,470 10,367 11,931 601 - 800 13,391 8,749 9,861
801 - 1,000 11,117 7,692 8,528 1,001 - 1,200 9,717 7,037 7,693 1,201 - 1,400 8,677 6,496 7,079 1,401 - 1,600 8,173 6,350 6,798 1,601 - 1,800 7,977 6,280 6,736 1,801 - 2,000 7,835 6,318 6,742
Over 2,000 88,366 73,594 77,130 Totals 207,651 149,741 162,505
Source: Gabriel Roeder Smith & Co.
Type of Other Postemployment Benefits Monthly Pension
Benefit Amt
MonthlyPension Number of Opt.1E
Benefit Amt Retirees 1 2 3 4 5 6 Opt. 1 Opt. 2 Opt. 3 Opt. 4 2E,3E,4E $ 1 - 200 12,442 10,886 1,065 73 290 3 125 6,676 2,983 1,743 202 838
201 - 400 22,486 19,418 1,381 116 1,243 2 326 12,290 4,711 3,753 529 1,203 401 - 600 17,470 14,645 1,132 94 1,245 1 353 9,144 3,648 3,217 504 957 601 - 800 13,391 11,132 866 71 969 1 352 6,815 2,697 2,532 499 848
801 - 1000 11,117 9,190 788 44 770 1 324 5,293 2,301 2,251 475 797 1001 - 1200 9,717 8,061 793 21 563 279 4,346 2,091 2,008 443 829 1201 - 1400 8,677 7,112 844 13 469 239 3,754 1,818 1,688 461 956 1401 - 1600 8,173 6,795 789 13 346 230 3,324 1,671 1,631 426 1,121 1601 - 1800 7,977 6,810 673 5 292 197 3,037 1,636 1,484 459 1,361 1801 - 2000 7,835 6,847 547 6 259 1 175 2,892 1,631 1,450 489 1,373
over 2000 88,366 83,600 3,300 9 641 2 814 38,674 16,940 17,889 6,937 7,926
Totals 207,651 184,496 12,178 465 7,087 11 3,414 96,245 42,127 39,646 11,424 18,209
September 30, 2015
Type of Retirement * Selected Option**
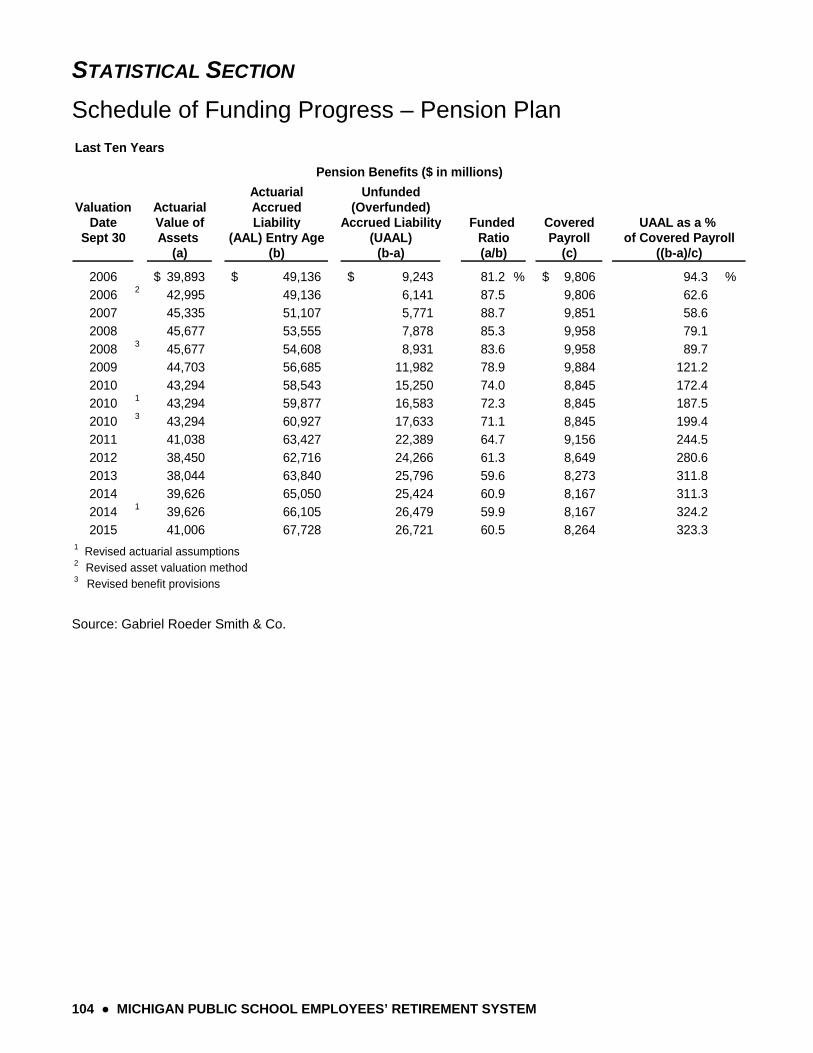
STATISTICAL SECTION
104 ● MICHIGAN PUBLIC SCHOOL EMPLOYEES’ RETIREMENT SYSTEM
Schedule of Funding Progress – Pension Plan
Last Ten Years
Actuarial UnfundedValuation Actuarial Accrued (Overfunded)
Date Value of Liability Accrued Liability CoveredSept 30 Assets (AAL) Entry Age (UAAL) Payroll
(a) (b) (b-a) (c)
2006 39,893$ 49,136$ 9,243$ 81.2 % 9,806$ 94.3 %2006 2 42,995 49,136 6,141 87.5 9,806 62.6 2007 45,335 51,107 5,771 88.7 9,851 58.6 2008 45,677 53,555 7,878 85.3 9,958 79.1 2008 3 45,677 54,608 8,931 83.6 9,958 89.7 2009 44,703 56,685 11,982 78.9 9,884 121.2 2010 43,294 58,543 15,250 74.0 8,845 172.4 2010 1 43,294 59,877 16,583 72.3 8,845 187.5 2010 3 43,294 60,927 17,633 71.1 8,845 199.4 2011 41,038 63,427 22,389 64.7 9,156 244.5 2012 38,450 62,716 24,266 61.3 8,649 280.6 2013 38,044 63,840 25,796 59.6 8,273 311.8 2014 39,626 65,050 25,424 60.9 8,167 311.3 2014 1 39,626 66,105 26,479 59.9 8,167 324.2 2015 41,006 67,728 26,721 60.5 8,264 323.3
1 Revised actuarial assumptions2 Revised asset valuation method3 Revised benefit provisions
Pension Benefits ($ in millions)
Funded UAAL as a % Ratio of Covered Payroll(a/b) ((b-a)/c)
Source: Gabriel Roeder Smith & Co.
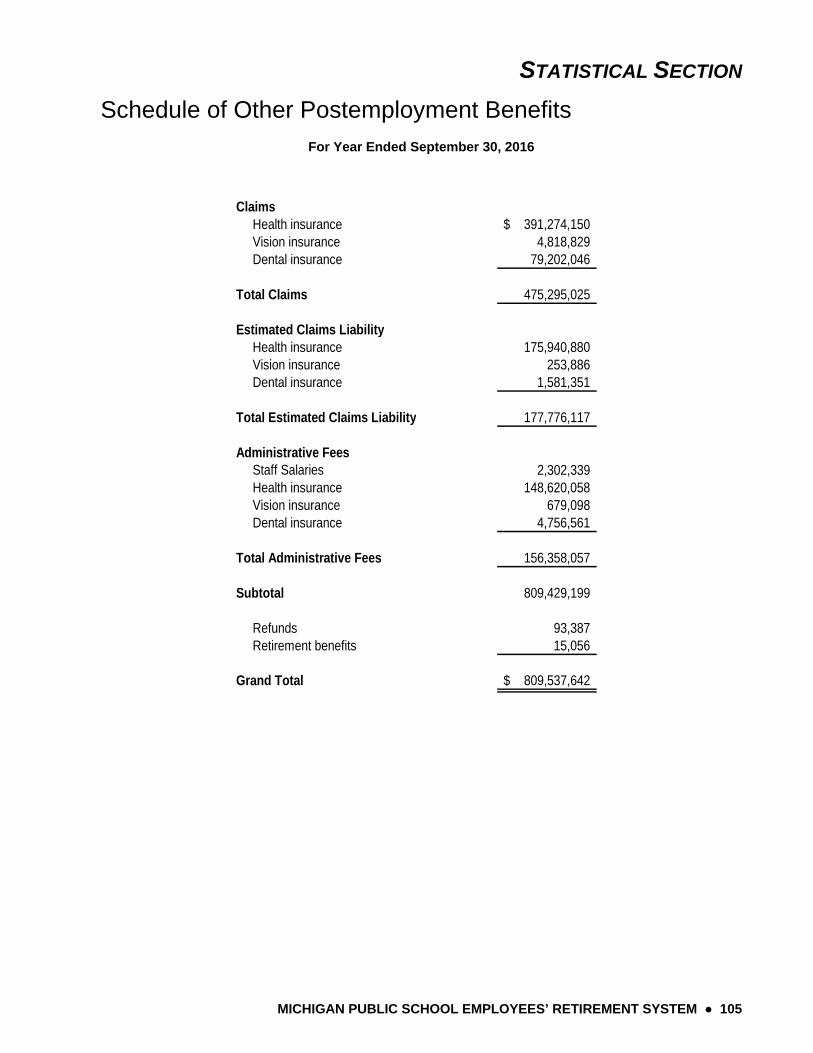
STATISTICAL SECTION
MICHIGAN PUBLIC SCHOOL EMPLOYEES’ RETIREMENT SYSTEM ● 105
Schedule of Other Postemployment Benefits
For Year Ended September 30, 2016
Claims Health insurance 391,274,150$ Vision insurance 4,818,829 Dental insurance 79,202,046
Total Claims 475,295,025
Estimated Claims Liability Health insurance 175,940,880 Vision insurance 253,886 Dental insurance 1,581,351
Total Estimated Claims Liability 177,776,117
Administrative Fees Staff Salaries 2,302,339 Health insurance 148,620,058 Vision insurance 679,098 Dental insurance 4,756,561
Total Administrative Fees 156,358,057
Subtotal 809,429,199
Refunds 93,387 Retirement benefits 15,056
Grand Total 809,537,642$
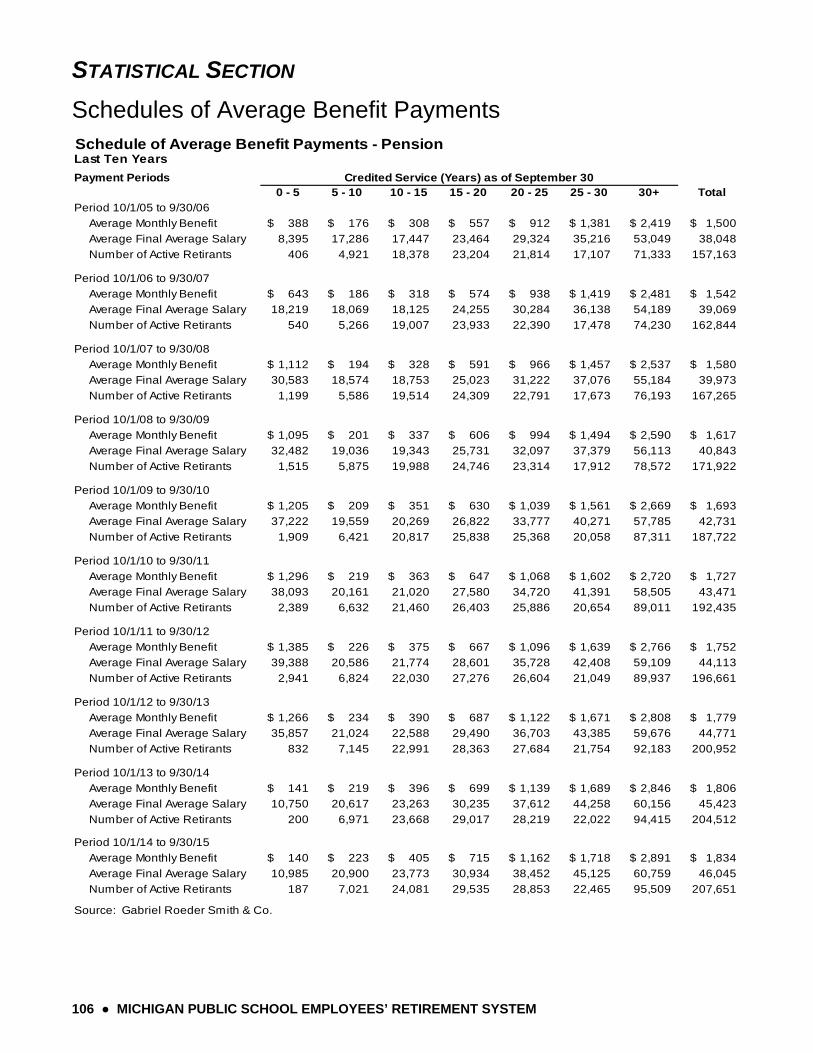
STATISTICAL SECTION
106 ● MICHIGAN PUBLIC SCHOOL EMPLOYEES’ RETIREMENT SYSTEM
Schedules of Average Benefit Payments Schedule of Average Benefit Payments - PensionLast Ten Years
0 - 5 5 - 10 10 - 15 15 - 20 20 - 25 25 - 30 30+ Total
388$ 176$ 308$ 557$ 912$ 1,381$ 2,419$ 1,500$
8,395 17,286 17,447 23,464 29,324 35,216 53,049 38,048
406 4,921 18,378 23,204 21,814 17,107 71,333 157,163
643$ 186$ 318$ 574$ 938$ 1,419$ 2,481$ 1,542$
18,219 18,069 18,125 24,255 30,284 36,138 54,189 39,069
540 5,266 19,007 23,933 22,390 17,478 74,230 162,844
1,112$ 194$ 328$ 591$ 966$ 1,457$ 2,537$ 1,580$
30,583 18,574 18,753 25,023 31,222 37,076 55,184 39,973
1,199 5,586 19,514 24,309 22,791 17,673 76,193 167,265
1,095$ 201$ 337$ 606$ 994$ 1,494$ 2,590$ 1,617$
32,482 19,036 19,343 25,731 32,097 37,379 56,113 40,843
1,515 5,875 19,988 24,746 23,314 17,912 78,572 171,922
1,205$ 209$ 351$ 630$ 1,039$ 1,561$ 2,669$ 1,693$
37,222 19,559 20,269 26,822 33,777 40,271 57,785 42,731
1,909 6,421 20,817 25,838 25,368 20,058 87,311 187,722
1,296$ 219$ 363$ 647$ 1,068$ 1,602$ 2,720$ 1,727$
38,093 20,161 21,020 27,580 34,720 41,391 58,505 43,471
2,389 6,632 21,460 26,403 25,886 20,654 89,011 192,435
1,385$ 226$ 375$ 667$ 1,096$ 1,639$ 2,766$ 1,752$
39,388 20,586 21,774 28,601 35,728 42,408 59,109 44,113
2,941 6,824 22,030 27,276 26,604 21,049 89,937 196,661
1,266$ 234$ 390$ 687$ 1,122$ 1,671$ 2,808$ 1,779$
35,857 21,024 22,588 29,490 36,703 43,385 59,676 44,771
832 7,145 22,991 28,363 27,684 21,754 92,183 200,952
141$ 219$ 396$ 699$ 1,139$ 1,689$ 2,846$ 1,806$
10,750 20,617 23,263 30,235 37,612 44,258 60,156 45,423
200 6,971 23,668 29,017 28,219 22,022 94,415 204,512
140$ 223$ 405$ 715$ 1,162$ 1,718$ 2,891$ 1,834$
10,985 20,900 23,773 30,934 38,452 45,125 60,759 46,045
187 7,021 24,081 29,535 28,853 22,465 95,509 207,651
Source: Gabriel Roeder Smith & Co.
Period 10/1/13 to 9/30/14
Average Monthly Benefit
Average Final Average Salary
Number of Active Retirants
Average Monthly Benefit
Average Final Average Salary
Number of Active Retirants
Period 10/1/10 to 9/30/11
Average Monthly Benefit
Average Final Average Salary
Number of Active Retirants
Period 10/1/12 to 9/30/13
Average Monthly Benefit
Average Final Average Salary
Period 10/1/14 to 9/30/15
Average Monthly Benefit
Average Final Average Salary
Number of Active Retirants
Average Final Average Salary
Payment Periods
Average Monthly Benefit
Average Final Average Salary
Number of Active Retirants
Period 10/1/05 to 9/30/06
Average Monthly Benefit
Period 10/1/06 to 9/30/07
Average Monthly Benefit
Average Final Average Salary
Credited Service (Years) as of September 30
Number of Active Retirants
Number of Active Retirants
Number of Active Retirants
Period 10/1/09 to 9/30/10
Average Monthly Benefit
Period 10/1/08 to 9/30/09
Period 10/1/11 to 9/30/12
Period 10/1/07 to 9/30/08
Average Monthly Benefit
Average Final Average Salary
Number of Active Retirants
Number of Active Retirants
Average Final Average Salary
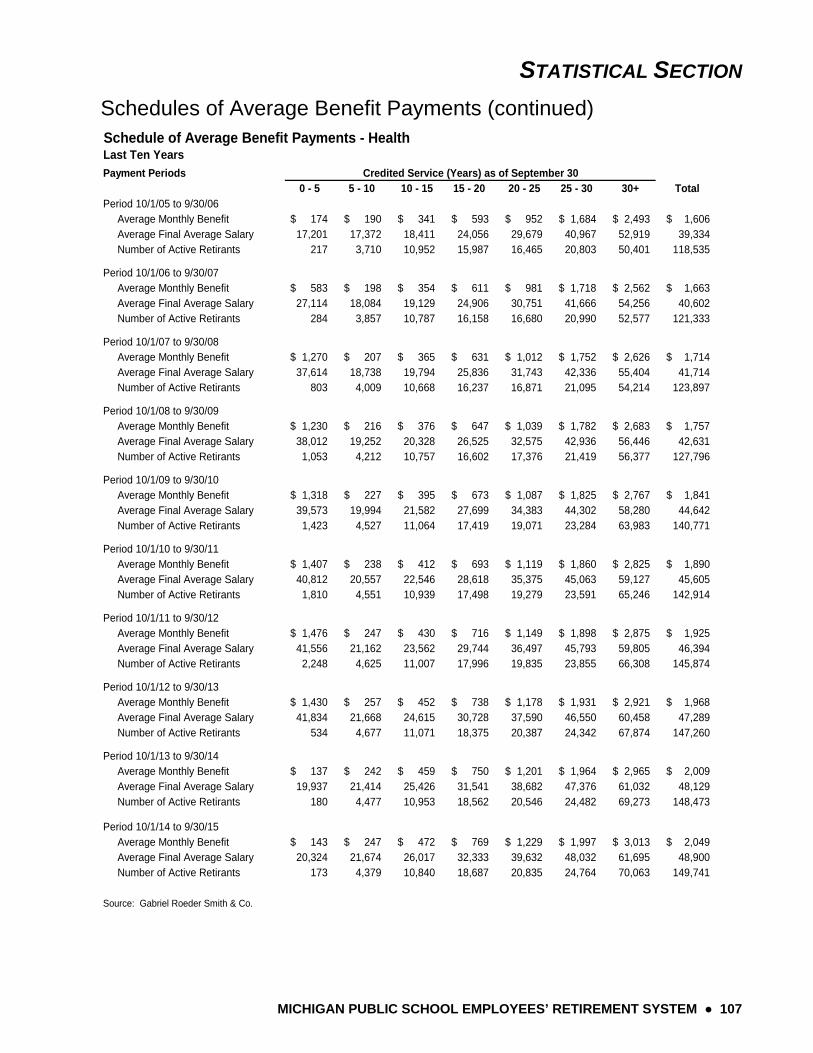
STATISTICAL SECTION
MICHIGAN PUBLIC SCHOOL EMPLOYEES’ RETIREMENT SYSTEM ● 107
Schedules of Average Benefit Payments (continued) Schedule of Average Benefit Payments - HealthLast Ten Years
0 - 5 5 - 10 10 - 15 15 - 20 20 - 25 25 - 30 30+ Total
174$ 190$ 341$ 593$ 952$ 1,684$ 2,493$ 1,606$ 17,201 17,372 18,411 24,056 29,679 40,967 52,919 39,334
217 3,710 10,952 15,987 16,465 20,803 50,401 118,535
583$ 198$ 354$ 611$ 981$ 1,718$ 2,562$ 1,663$ 27,114 18,084 19,129 24,906 30,751 41,666 54,256 40,602
284 3,857 10,787 16,158 16,680 20,990 52,577 121,333
1,270$ 207$ 365$ 631$ 1,012$ 1,752$ 2,626$ 1,714$ 37,614 18,738 19,794 25,836 31,743 42,336 55,404 41,714
803 4,009 10,668 16,237 16,871 21,095 54,214 123,897
1,230$ 216$ 376$ 647$ 1,039$ 1,782$ 2,683$ 1,757$ 38,012 19,252 20,328 26,525 32,575 42,936 56,446 42,631
1,053 4,212 10,757 16,602 17,376 21,419 56,377 127,796
1,318$ 227$ 395$ 673$ 1,087$ 1,825$ 2,767$ 1,841$ 39,573 19,994 21,582 27,699 34,383 44,302 58,280 44,642
1,423 4,527 11,064 17,419 19,071 23,284 63,983 140,771
1,407$ 238$ 412$ 693$ 1,119$ 1,860$ 2,825$ 1,890$ 40,812 20,557 22,546 28,618 35,375 45,063 59,127 45,605
1,810 4,551 10,939 17,498 19,279 23,591 65,246 142,914
1,476$ 247$ 430$ 716$ 1,149$ 1,898$ 2,875$ 1,925$ 41,556 21,162 23,562 29,744 36,497 45,793 59,805 46,394
2,248 4,625 11,007 17,996 19,835 23,855 66,308 145,874
1,430$ 257$ 452$ 738$ 1,178$ 1,931$ 2,921$ 1,968$ 41,834 21,668 24,615 30,728 37,590 46,550 60,458 47,289
534 4,677 11,071 18,375 20,387 24,342 67,874 147,260
137$ 242$ 459$ 750$ 1,201$ 1,964$ 2,965$ 2,009$ 19,937 21,414 25,426 31,541 38,682 47,376 61,032 48,129
180 4,477 10,953 18,562 20,546 24,482 69,273 148,473
143$ 247$ 472$ 769$ 1,229$ 1,997$ 3,013$ 2,049$ 20,324 21,674 26,017 32,333 39,632 48,032 61,695 48,900
173 4,379 10,840 18,687 20,835 24,764 70,063 149,741
Source: Gabriel Roeder Smith & Co.
Period 10/1/13 to 9/30/14 Average Monthly Benefit Average Final Average Salary Number of Active Retirants
Average Monthly Benefit Average Final Average Salary Number of Active Retirants
Period 10/1/10 to 9/30/11 Average Monthly Benefit Average Final Average Salary Number of Active Retirants
Period 10/1/12 to 9/30/13 Average Monthly Benefit Average Final Average Salary
Period 10/1/14 to 9/30/15 Average Monthly Benefit Average Final Average Salary Number of Active Retirants
Average Final Average Salary
Payment Periods
Average Monthly Benefit Average Final Average Salary Number of Active Retirants
Period 10/1/05 to 9/30/06 Average Monthly Benefit
Period 10/1/06 to 9/30/07 Average Monthly Benefit Average Final Average Salary
Credited Service (Years) as of September 30
Number of Active Retirants
Number of Active Retirants
Number of Active Retirants
Period 10/1/09 to 9/30/10 Average Monthly Benefit
Period 10/1/08 to 9/30/09
Period 10/1/11 to 9/30/12
Period 10/1/07 to 9/30/08 Average Monthly Benefit
Average Final Average Salary Number of Active Retirants
Number of Active Retirants
Average Final Average Salary
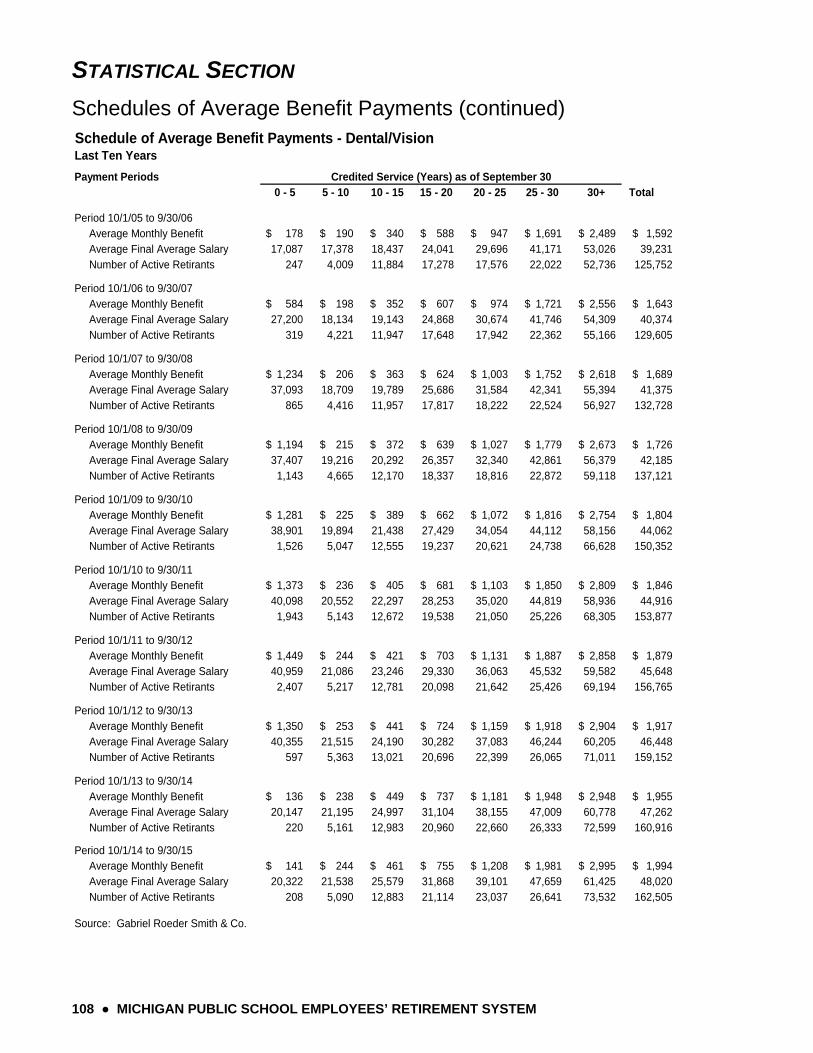
STATISTICAL SECTION
108 ● MICHIGAN PUBLIC SCHOOL EMPLOYEES’ RETIREMENT SYSTEM
Schedules of Average Benefit Payments (continued) Schedule of Average Benefit Payments - Dental/VisionLast Ten Years
0 - 5 5 - 10 10 - 15 15 - 20 20 - 25 25 - 30 30+ Total
178$ 190$ 340$ 588$ 947$ 1,691$ 2,489$ 1,592$ 17,087 17,378 18,437 24,041 29,696 41,171 53,026 39,231
247 4,009 11,884 17,278 17,576 22,022 52,736 125,752
584$ 198$ 352$ 607$ 974$ 1,721$ 2,556$ 1,643$ 27,200 18,134 19,143 24,868 30,674 41,746 54,309 40,374
319 4,221 11,947 17,648 17,942 22,362 55,166 129,605
1,234$ 206$ 363$ 624$ 1,003$ 1,752$ 2,618$ 1,689$ 37,093 18,709 19,789 25,686 31,584 42,341 55,394 41,375
865 4,416 11,957 17,817 18,222 22,524 56,927 132,728
1,194$ 215$ 372$ 639$ 1,027$ 1,779$ 2,673$ 1,726$ 37,407 19,216 20,292 26,357 32,340 42,861 56,379 42,185
1,143 4,665 12,170 18,337 18,816 22,872 59,118 137,121
1,281$ 225$ 389$ 662$ 1,072$ 1,816$ 2,754$ 1,804$ 38,901 19,894 21,438 27,429 34,054 44,112 58,156 44,062
1,526 5,047 12,555 19,237 20,621 24,738 66,628 150,352
1,373$ 236$ 405$ 681$ 1,103$ 1,850$ 2,809$ 1,846$ 40,098 20,552 22,297 28,253 35,020 44,819 58,936 44,916
1,943 5,143 12,672 19,538 21,050 25,226 68,305 153,877
1,449$ 244$ 421$ 703$ 1,131$ 1,887$ 2,858$ 1,879$ 40,959 21,086 23,246 29,330 36,063 45,532 59,582 45,648
2,407 5,217 12,781 20,098 21,642 25,426 69,194 156,765
1,350$ 253$ 441$ 724$ 1,159$ 1,918$ 2,904$ 1,917$ 40,355 21,515 24,190 30,282 37,083 46,244 60,205 46,448
597 5,363 13,021 20,696 22,399 26,065 71,011 159,152
136$ 238$ 449$ 737$ 1,181$ 1,948$ 2,948$ 1,955$ 20,147 21,195 24,997 31,104 38,155 47,009 60,778 47,262
220 5,161 12,983 20,960 22,660 26,333 72,599 160,916
141$ 244$ 461$ 755$ 1,208$ 1,981$ 2,995$ 1,994$ 20,322 21,538 25,579 31,868 39,101 47,659 61,425 48,020
208 5,090 12,883 21,114 23,037 26,641 73,532 162,505
Source: Gabriel Roeder Smith & Co.
Period 10/1/14 to 9/30/15 Average Monthly Benefit Average Final Average Salary Number of Active Retirants
Average Final Average Salary Number of Active Retirants
Period 10/1/07 to 9/30/08 Average Monthly Benefit
Average Final Average Salary Number of Active Retirants
Average Final Average Salary Number of Active Retirants
Period 10/1/08 to 9/30/09 Average Monthly Benefit
Period 10/1/05 to 9/30/06 Average Monthly Benefit Average Final Average Salary Number of Active Retirants
Period 10/1/06 to 9/30/07 Average Monthly Benefit
Period 10/1/09 to 9/30/10 Average Monthly Benefit Average Final Average Salary Number of Active Retirants
Payment Periods Credited Service (Years) as of September 30
Period 10/1/10 to 9/30/11 Average Monthly Benefit Average Final Average Salary Number of Active Retirants
Period 10/1/11 to 9/30/12 Average Monthly Benefit
Period 10/1/13 to 9/30/14 Average Monthly Benefit Average Final Average Salary Number of Active Retirants
Average Final Average Salary Number of Active Retirants
Period 10/1/12 to 9/30/13 Average Monthly Benefit Average Final Average Salary Number of Active Retirants
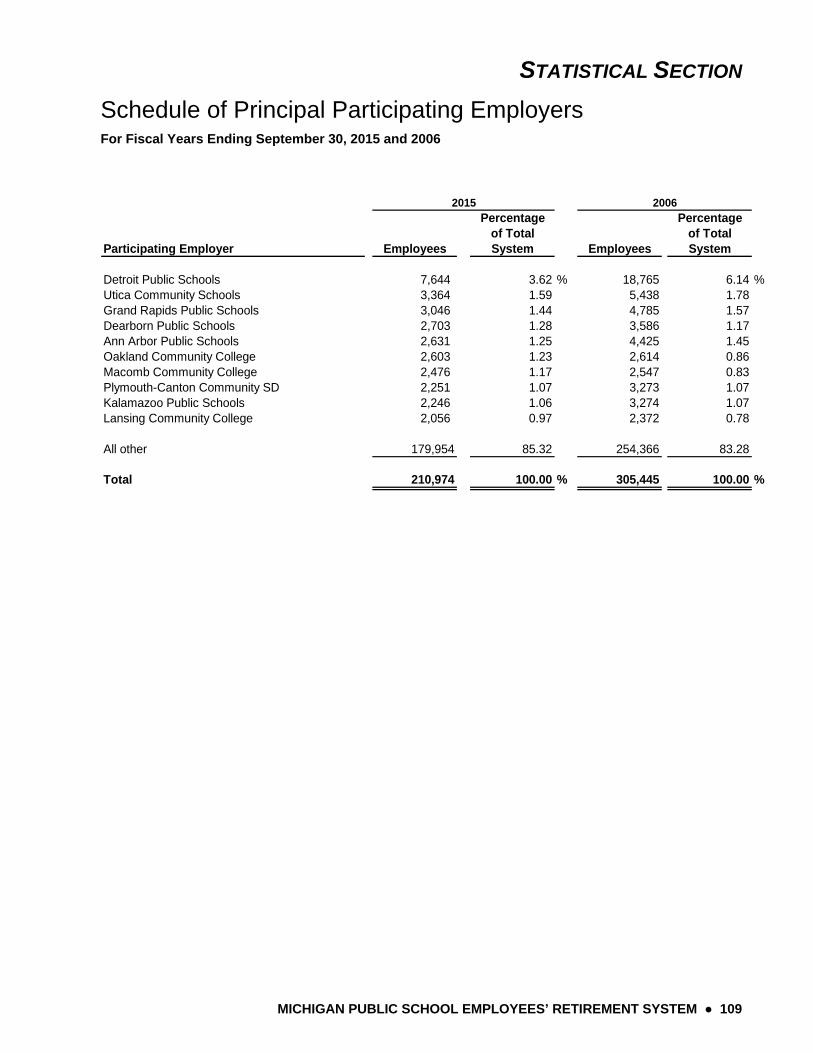
STATISTICAL SECTION
MICHIGAN PUBLIC SCHOOL EMPLOYEES’ RETIREMENT SYSTEM ● 109
Schedule of Principal Participating Employers
For Fiscal Years Ending September 30, 2015 and 2006
Percentage Percentageof Total of Total
Participating Employer Employees System Employees System
Detroit Public Schools 7,644 3.62 % 18,765 6.14 %Utica Community Schools 3,364 1.59 5,438 1.78Grand Rapids Public Schools 3,046 1.44 4,785 1.57Dearborn Public Schools 2,703 1.28 3,586 1.17Ann Arbor Public Schools 2,631 1.25 4,425 1.45Oakland Community College 2,603 1.23 2,614 0.86Macomb Community College 2,476 1.17 2,547 0.83Plymouth-Canton Community SD 2,251 1.07 3,273 1.07Kalamazoo Public Schools 2,246 1.06 3,274 1.07Lansing Community College 2,056 0.97 2,372 0.78
All other 179,954 85.32 254,366 83.28
Total 210,974 100.00 % 305,445 100.00 %
2015 2006
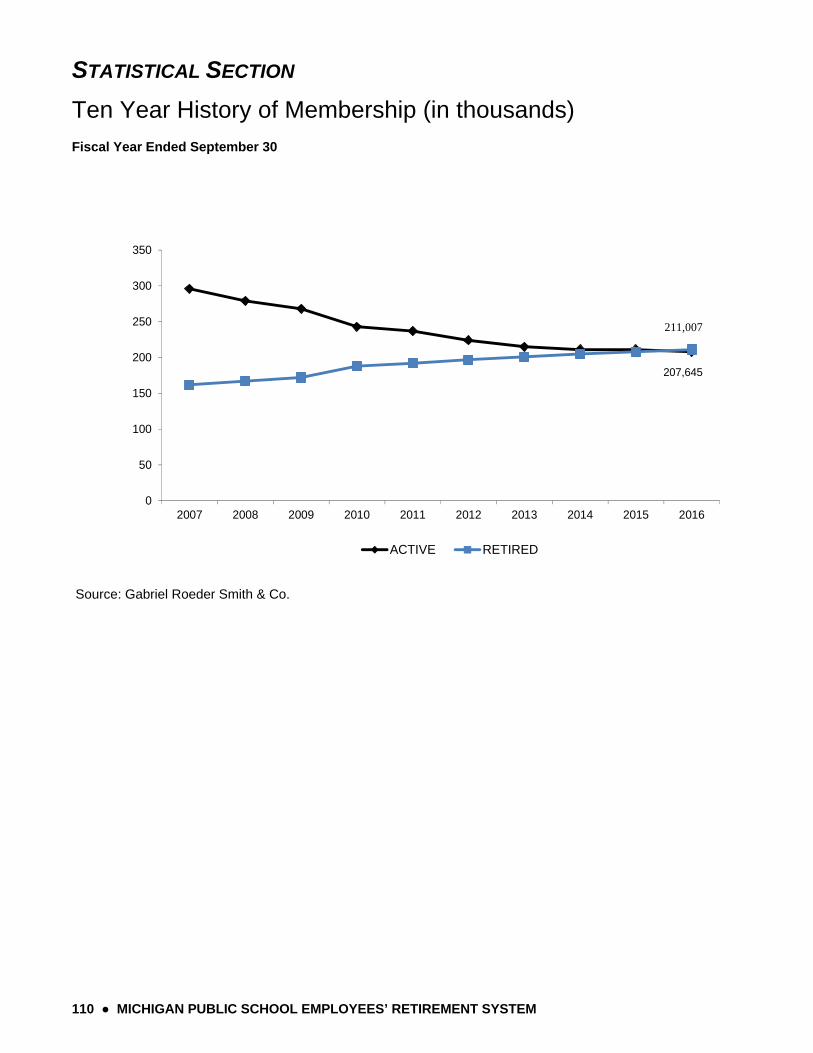
STATISTICAL SECTION
110 ● MICHIGAN PUBLIC SCHOOL EMPLOYEES’ RETIREMENT SYSTEM
Ten Year History of Membership (in thousands)
Fiscal Year Ended September 30
211,007
207,645
0
50
100
150
200
250
300
350
2007 2008 2009 2010 2011 2012 2013 2014 2015 2016
ACTIVE RETIRED
Source: Gabriel Roeder Smith & Co.

STATISTICAL SECTION
MICHIGAN PUBLIC SCHOOL EMPLOYEES’ RETIREMENT SYSTEM ● 111
Schedule of Participating Employers at 9/30/16
Universities:
Central Michigan University Eastern Michigan University Ferris State University Lake Superior State University Michigan Technological University Northern Michigan University Western Michigan University Community Colleges:
Alpena Community College Bay De Noc Community College Charles S Mott Community College Delta College Glen Oaks Community College Gogebic Community College Grand Rapids Community College Henry Ford College Jackson College Kalamazoo Valley Community College Kellogg Community College Kirtland Community College Lake Michigan College Lansing Community College Macomb Community College Mid-Michigan Community College Monroe County Community College Montcalm Community College Muskegon Community College North Central Michigan College Northwestern Michigan College Oakland Community College Schoolcraft Community College Southwestern Michigan College St Clair County Community College Washtenaw Community College Wayne County Community College West Shore Community College Intermediate School Districts:
Allegan Area Educational Service Agency Alpena-Montmorency-Alcona ESD Barry Intermediate School District Bay-Arenac Intermediate School District Berrien RESA Branch Intermediate School District Calhoun Intermediate School District Charlevoix-Emmet Intermediate School District Cheboygan-Otsego-Presque Isle ESD
Clare-Gladwin Intermediate School District Clinton County RESA COOR Intermediate School District Copper Country Intermediate School District Delta-Schoolcraft Intermediate School District Dickinson-Iron Intermediate School District Eastern U P Intermediate School District Eaton Intermediate School District Genesee Intermediate School District Gogebic-Ontonagon Intermediate School District Gratiot-Isabella RESD Hillsdale Intermediate School District Huron Intermediate School District Ingham Intermediate School District Ionia Intermediate School District Iosco RESA Jackson Intermediate School District Kalamazoo RESA Kent Intermediate School District Lapeer Intermediate School District Lenawee Intermediate School District Lewis Cass Intermediate School District Livingston ESA Macomb Intermediate School District Manistee Intermediate School District Marquette-Alger Intermediate School District Mecosta-Osceola Intermediate School District Menominee Intermediate School District Midland County Educational Service Agency Monroe Intermediate School District Montcalm Area Intermediate School District Muskegon Area Intermediate School District Newaygo County RESA Oakland Intermediate School District Ottawa Area Intermediate School District Saginaw Intermediate School District Sanilac Intermediate School District Shiawassee Regional Educational Service District St. Clair County RESA St. Joseph Intermediate School District Traverse Bay Area Intermediate School District Tuscola Intermediate School District Van Buren Intermediate School District Washtenaw Intermediate School District Wayne RESA West Shore Educational Service District Wexford-Missaukee Intermediate School District
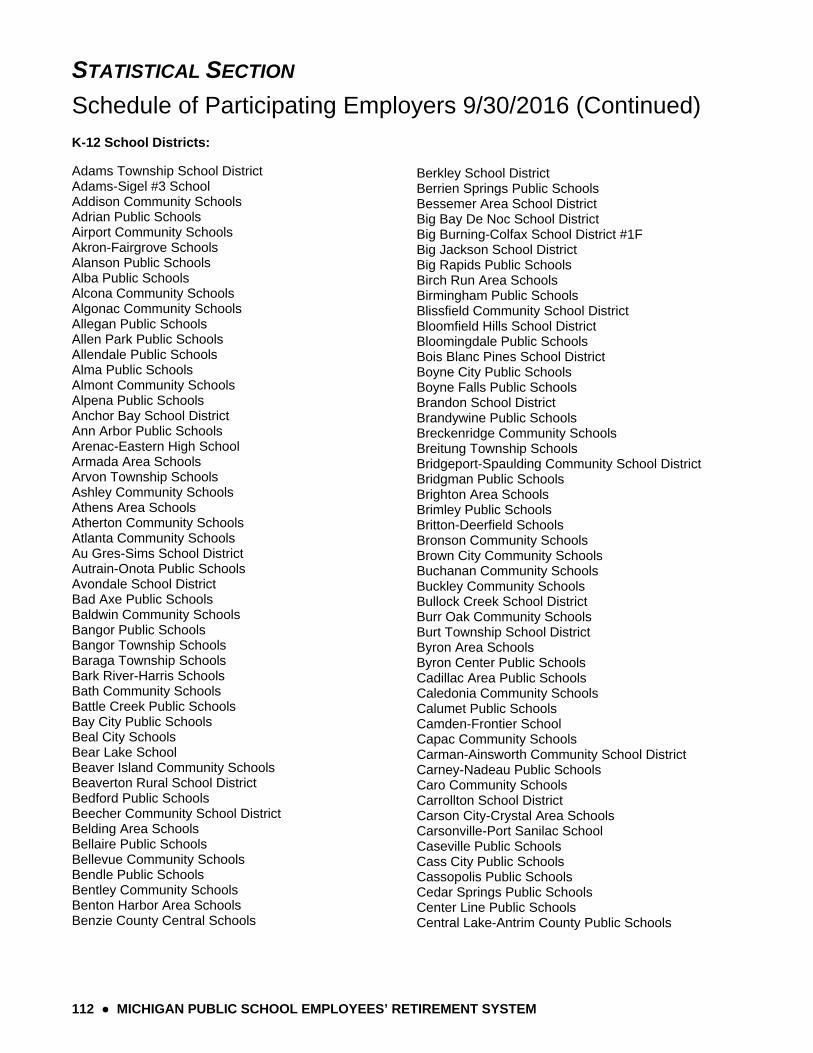
STATISTICAL SECTION
Schedule of Participating Employers 9/30/2016 (Continued)
112 ● MICHIGAN PUBLIC SCHOOL EMPLOYEES’ RETIREMENT SYSTEM
K-12 School Districts:
Adams Township School District Adams-Sigel #3 School Addison Community Schools Adrian Public Schools Airport Community Schools Akron-Fairgrove Schools Alanson Public Schools Alba Public Schools Alcona Community Schools Algonac Community Schools Allegan Public Schools Allen Park Public Schools Allendale Public Schools Alma Public Schools Almont Community Schools Alpena Public Schools Anchor Bay School District Ann Arbor Public Schools Arenac-Eastern High School Armada Area Schools Arvon Township Schools Ashley Community Schools Athens Area Schools Atherton Community Schools Atlanta Community Schools Au Gres-Sims School District Autrain-Onota Public Schools Avondale School District Bad Axe Public Schools Baldwin Community Schools Bangor Public Schools Bangor Township Schools Baraga Township Schools Bark River-Harris Schools Bath Community Schools Battle Creek Public Schools Bay City Public Schools Beal City Schools Bear Lake School Beaver Island Community Schools Beaverton Rural School District Bedford Public Schools Beecher Community School District Belding Area Schools Bellaire Public Schools Bellevue Community Schools Bendle Public Schools Bentley Community Schools Benton Harbor Area Schools Benzie County Central Schools
Berkley School District Berrien Springs Public Schools Bessemer Area School District Big Bay De Noc School District Big Burning-Colfax School District #1F Big Jackson School District Big Rapids Public Schools Birch Run Area Schools Birmingham Public Schools Blissfield Community School District Bloomfield Hills School District Bloomingdale Public Schools Bois Blanc Pines School District Boyne City Public Schools Boyne Falls Public Schools Brandon School District Brandywine Public Schools Breckenridge Community Schools Breitung Township Schools Bridgeport-Spaulding Community School District Bridgman Public Schools Brighton Area Schools Brimley Public Schools Britton-Deerfield Schools Bronson Community Schools Brown City Community Schools Buchanan Community Schools Buckley Community Schools Bullock Creek School District Burr Oak Community Schools Burt Township School District Byron Area Schools Byron Center Public Schools Cadillac Area Public Schools Caledonia Community Schools Calumet Public Schools Camden-Frontier School Capac Community Schools Carman-Ainsworth Community School District Carney-Nadeau Public Schools Caro Community Schools Carrollton School District Carson City-Crystal Area Schools Carsonville-Port Sanilac School Caseville Public Schools Cass City Public Schools Cassopolis Public Schools Cedar Springs Public Schools Center Line Public Schools Central Lake-Antrim County Public Schools

STATISTICAL SECTION
Schedule of Participating Employers 9/30/2016 (Continued)
MICHIGAN PUBLIC SCHOOL EMPLOYEES’ RETIREMENT SYSTEM ● 113
K-12 School Districts (continued):
Central Montcalm Public Schools Centreville Public Schools Charlevoix Public Schools Charlotte Public Schools Chassell Township Schools Cheboygan Area School District Chelsea School District Chesaning-Union Schools Chippewa Hills School District Chippewa Valley Schools Church School Clare Public Schools Clarenceville School District Clarkston Community Schools Clawson City School District Climax-Scotts Community Schools Clinton Community Schools Clintondale Community Schools Clio Area School District Coldwater Community Schools Coleman Community Schools Coloma Community Schools Colon Community School Columbia School District Comstock Park Public Schools Comstock Public Schools Concord Community Schools Constantine Public Schools Coon-Berlin Township School District #3 Coopersville Public Schools Corunna Public Schools Covert Public Schools Crawford-AuSable School District Crawford-Excelsior School District #1 Crestwood School District Croswell-Lexington Schools Dansville Schools Davison Community Schools Dearborn Heights School District #7 Dearborn Public Schools Decatur Public Schools Deckerville Community School District Delton-Kellogg Schools DeTour Area Schools Detroit Public Schools Community District Dewitt Public Schools Dexter Community Schools Dollar Bay-Tamarack School District Dowagiac-Union School District Dryden Community Schools Dundee Community Schools
Durand Area Schools East China School District East Detroit School District East Grand Rapids Public Schools East Jackson Public Schools East Jordan Public Schools East Lansing Public Schools Eaton Rapids Public Schools Eau Claire Public Schools Eccles-Sigel #4 School Ecorse Public Schools Edwardsburg Public Schools Elk Rapids Schools Ellsworth Community Schools Elm River Township Schools Engadine Consolidated School District #4 Escanaba Area Public Schools Essexville-Hampton Public Schools Evart Public Schools Ewen-Trout Creek Consolidated School District Fairview Area Schools Farmington Public Schools Farwell Area Schools Fennville Public Schools Fenton Area Public Schools Ferndale City School District Fitzgerald Public Schools Flat Rock Community Schools Flint Community Schools Flushing Community Schools Forest Area Schools Forest Hills Public Schools Forest Park School District Fowler Public Schools Fowlerville Community Schools Frankenmuth School District Frankfort-Elberta Area Schools Fraser Public Schools Freeland Community Schools Fremont Public Schools Fruitport Community Schools Fulton Schools Galesburg-Augusta Community School District Garden City Public Schools Gaylord Community Schools Genesee School District Gibraltar School District Gladstone Area Schools Gladwin Community Schools Glen Lake Community Schools Glenn-Ganges School District #4
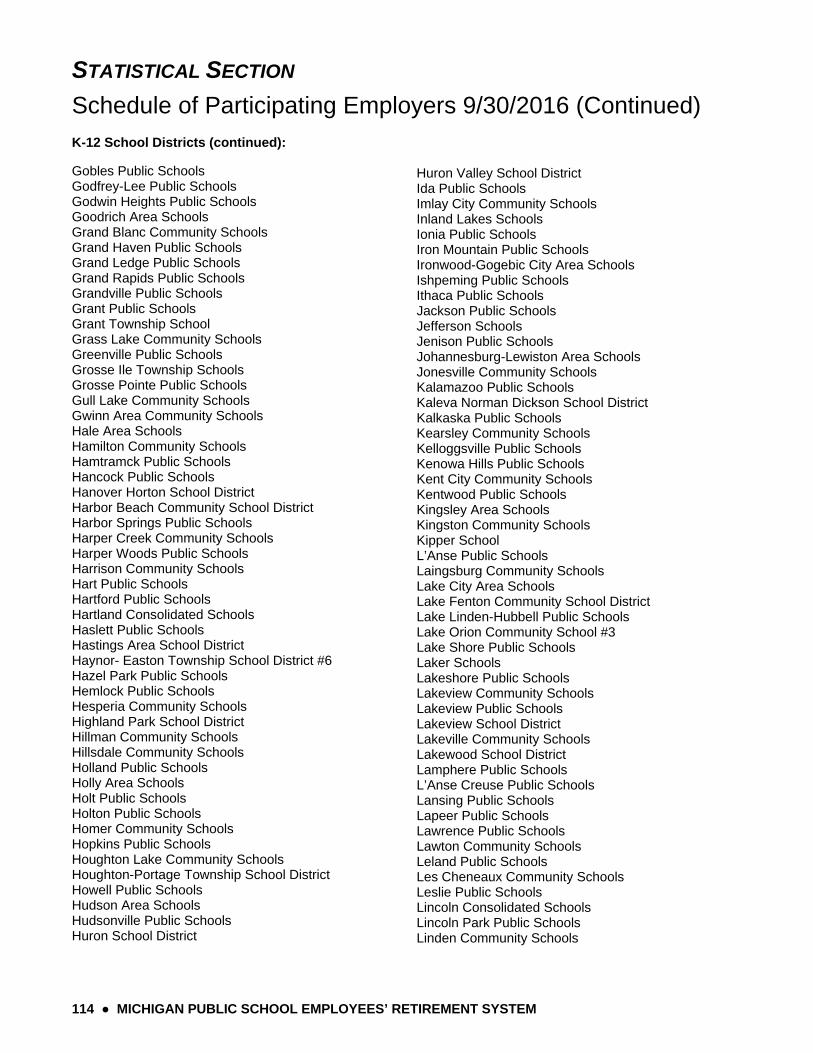
STATISTICAL SECTION
Schedule of Participating Employers 9/30/2016 (Continued)
114 ● MICHIGAN PUBLIC SCHOOL EMPLOYEES’ RETIREMENT SYSTEM
K-12 School Districts (continued):
Gobles Public Schools Godfrey-Lee Public Schools Godwin Heights Public Schools Goodrich Area Schools Grand Blanc Community Schools Grand Haven Public Schools Grand Ledge Public Schools Grand Rapids Public Schools Grandville Public Schools Grant Public Schools Grant Township School Grass Lake Community Schools Greenville Public Schools Grosse Ile Township Schools Grosse Pointe Public Schools Gull Lake Community Schools Gwinn Area Community Schools Hale Area Schools Hamilton Community Schools Hamtramck Public Schools Hancock Public Schools Hanover Horton School District Harbor Beach Community School District Harbor Springs Public Schools Harper Creek Community Schools Harper Woods Public Schools Harrison Community Schools Hart Public Schools Hartford Public Schools Hartland Consolidated Schools Haslett Public Schools Hastings Area School District Haynor- Easton Township School District #6 Hazel Park Public Schools Hemlock Public Schools Hesperia Community Schools Highland Park School District Hillman Community Schools Hillsdale Community Schools Holland Public Schools Holly Area Schools Holt Public Schools Holton Public Schools Homer Community Schools Hopkins Public Schools Houghton Lake Community Schools Houghton-Portage Township School District Howell Public Schools Hudson Area Schools Hudsonville Public Schools Huron School District
Huron Valley School District Ida Public Schools Imlay City Community Schools Inland Lakes Schools Ionia Public Schools Iron Mountain Public Schools Ironwood-Gogebic City Area Schools Ishpeming Public Schools Ithaca Public Schools Jackson Public Schools Jefferson Schools Jenison Public Schools Johannesburg-Lewiston Area Schools Jonesville Community Schools Kalamazoo Public Schools Kaleva Norman Dickson School District Kalkaska Public Schools Kearsley Community Schools Kelloggsville Public Schools Kenowa Hills Public Schools Kent City Community Schools Kentwood Public Schools Kingsley Area Schools Kingston Community Schools Kipper School L’Anse Public Schools Laingsburg Community Schools Lake City Area Schools Lake Fenton Community School District Lake Linden-Hubbell Public Schools Lake Orion Community School #3 Lake Shore Public Schools Laker Schools Lakeshore Public Schools Lakeview Community Schools Lakeview Public Schools Lakeview School District Lakeville Community Schools Lakewood School District Lamphere Public Schools L’Anse Creuse Public Schools Lansing Public Schools Lapeer Public Schools Lawrence Public Schools Lawton Community Schools Leland Public Schools Les Cheneaux Community Schools Leslie Public Schools Lincoln Consolidated Schools Lincoln Park Public Schools Linden Community Schools

STATISTICAL SECTION
Schedule of Participating Employers 9/30/2016 (Continued)
MICHIGAN PUBLIC SCHOOL EMPLOYEES’ RETIREMENT SYSTEM ● 115
K-12 School Districts (continued):
Litchfield Community Schools Livonia Public Schools Lowell Area Schools Ludington Area Schools Mackinaw City Public Schools Mackinac Island Public Schools Madison District Public Schools Madison School District #2 Mancelona Public Schools Manchester Community Schools Manistee Public Schools Manistique Area Schools Manton Consolidated School District Maple Valley Schools Mar Lee School District Marcellus Community Schools Marion Public Schools Marlette Community Schools Marquette Area Public Schools Marshall Public Schools Martin Public Schools Marysville Public Schools Mason Co.-Eastern-Custer #5 School District Mason Consolidated Schools Mason County Central School District Mason Public Schools Mattawan Consolidated Schools Mayville Community Schools McBain Rural Agricultural School Melvindale-Northern Allen Park School District Memphis Community Schools Mendon Community School Menominee Area Public Schools Meridian Public Schools Merrill Community Schools Mesick Consolidated Schools Michigan Center School District Mid Peninsula Schools Midland City Schools Milan Area Schools Millington Community School District Mio-AuSable Schools Mona Shores School District #29 Monroe Public Schools Montabella Community Schools Montague Area Public Schools Montrose Community Schools Moran Township School District Morenci Area Schools Morley-Stanwood Community Schools Morrice Area Schools
Mt Clemens Community Schools Mt Morris Consolidated Schools Mt Pleasant Public Schools Munising Public Schools Muskegon City Public Schools Muskegon Heights City Public Schools Napoleon Comm. School District Negaunee Public Schools New Buffalo Area Schools New Haven Community Schools New Lothrop Area Public Schools Newaygo Public Schools Nice Community Schools Niles Public Schools North Adams-Jerome Public Schools North Branch Area Schools North Central Area Schools North Dickinson School North Huron Schools North LeValley School #2 North Muskegon Public Schools Northport Public Schools Northview Public Schools Northville Public Schools Northwest School District Norway-Vulcan Area Schools Nottawa Community Schools Novi Community School District Oak Park School District Oakridge Public Schools Okemos Public Schools Olivet Community Schools Onaway Area Community Schools Onekama Consolidated Schools Onsted Community Schools Ontonagon Area School District Orchard View Schools Oscoda Area Schools Otsego Public Schools Ovid-Elsie Area Schools Owendale-Gagetown Area Schools Owosso Public Schools Oxford Area Community Schools Parchment School District Paw Paw Public Schools Peck Community Schools Pellston Public Schools Pennfield Public Schools Pentwater Public Schools Perry Public Schools Petoskey Public Schools
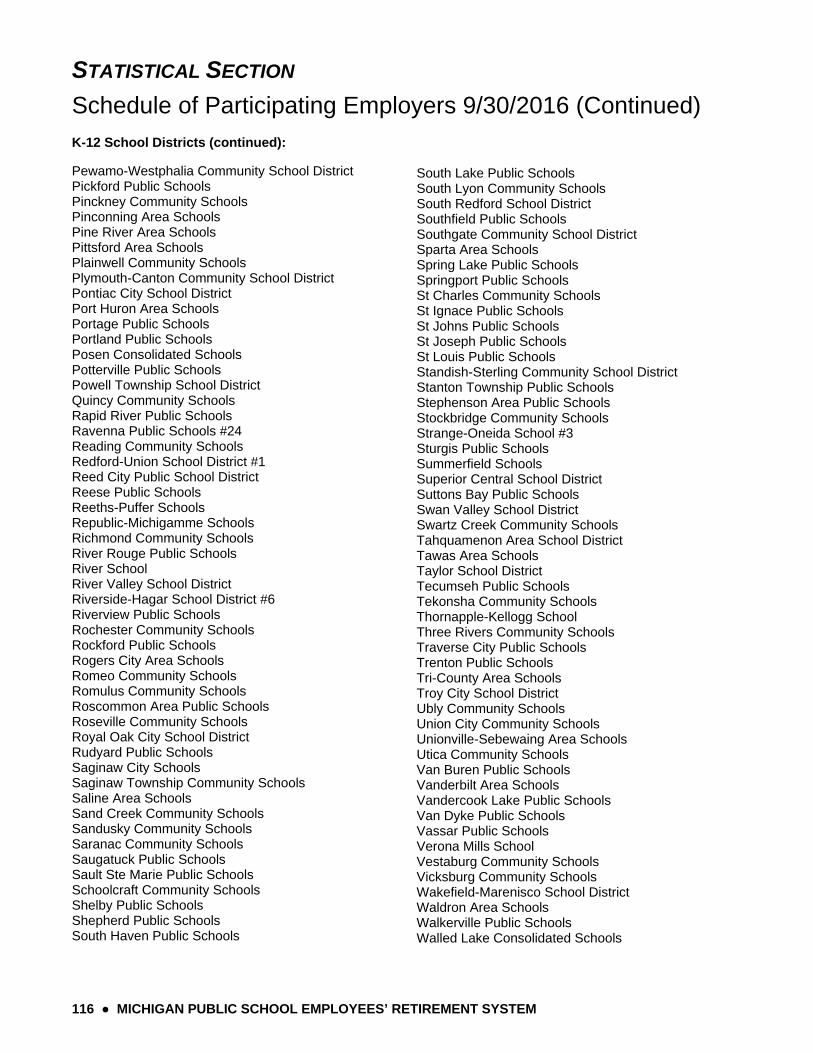
STATISTICAL SECTION
Schedule of Participating Employers 9/30/2016 (Continued)
116 ● MICHIGAN PUBLIC SCHOOL EMPLOYEES’ RETIREMENT SYSTEM
K-12 School Districts (continued):
Pewamo-Westphalia Community School District Pickford Public Schools Pinckney Community Schools Pinconning Area Schools Pine River Area Schools Pittsford Area Schools Plainwell Community Schools Plymouth-Canton Community School District Pontiac City School District Port Huron Area Schools Portage Public Schools Portland Public Schools Posen Consolidated Schools Potterville Public Schools Powell Township School District Quincy Community Schools Rapid River Public Schools Ravenna Public Schools #24 Reading Community Schools Redford-Union School District #1 Reed City Public School District Reese Public Schools Reeths-Puffer Schools Republic-Michigamme Schools Richmond Community Schools River Rouge Public Schools River School River Valley School District Riverside-Hagar School District #6 Riverview Public Schools Rochester Community Schools Rockford Public Schools Rogers City Area Schools Romeo Community Schools Romulus Community Schools Roscommon Area Public Schools Roseville Community Schools Royal Oak City School District Rudyard Public Schools Saginaw City Schools Saginaw Township Community Schools Saline Area Schools Sand Creek Community Schools Sandusky Community Schools Saranac Community Schools Saugatuck Public Schools Sault Ste Marie Public Schools Schoolcraft Community Schools Shelby Public Schools Shepherd Public Schools South Haven Public Schools
South Lake Public Schools South Lyon Community Schools South Redford School District Southfield Public Schools Southgate Community School District Sparta Area Schools Spring Lake Public Schools Springport Public Schools St Charles Community Schools St Ignace Public Schools St Johns Public Schools St Joseph Public Schools St Louis Public Schools Standish-Sterling Community School District Stanton Township Public Schools Stephenson Area Public Schools Stockbridge Community Schools Strange-Oneida School #3 Sturgis Public Schools Summerfield Schools Superior Central School District Suttons Bay Public Schools Swan Valley School District Swartz Creek Community Schools Tahquamenon Area School District Tawas Area Schools Taylor School District Tecumseh Public Schools Tekonsha Community Schools Thornapple-Kellogg School Three Rivers Community Schools Traverse City Public Schools Trenton Public Schools Tri-County Area Schools Troy City School District Ubly Community Schools Union City Community Schools Unionville-Sebewaing Area Schools Utica Community Schools Van Buren Public Schools Vanderbilt Area Schools Vandercook Lake Public Schools Van Dyke Public Schools Vassar Public Schools Verona Mills School Vestaburg Community Schools Vicksburg Community Schools Wakefield-Marenisco School District Waldron Area Schools Walkerville Public Schools Walled Lake Consolidated Schools

STATISTICAL SECTION
Schedule of Participating Employers 9/30/2016 (Continued)
MICHIGAN PUBLIC SCHOOL EMPLOYEES’ RETIREMENT SYSTEM ● 117
K-12 School Districts (continued):
Warren Consolidated Schools Warren Woods Public Schools Waterford School District Watersmeet Township School District Watervliet Public Schools Waverly Community Schools Wayland Union Schools Wayne-Westland Community Schools Webberville Community Schools Wells Township School #18 West Bloomfield Schools West Branch-Rose City Area Schools West Iron County Public Schools West Ottawa Public Schools Western School District Westwood Community Schools Westwood Heights Schools White Cloud Public Schools White Pigeon Community Schools Whitefish Township School Whiteford Agricultural School Whitehall District Schools Whitmore Lake Public Schools Whittemore-Prescott Area Schools Williamston Community Schools Wolverine Community Schools Wood School District #8, Bangor Township Woodhaven-Brownstown School District Wyandotte Public Schools Wyoming Public Schools Yale Public School District Ypsilanti Community Schools Zeeland Public Schools Libraries:
Ann Arbor District Library Bacon Memorial District Library Cheboygan Area Public Library Flint Public Library Grosse Pointe Public Library Hackley Public Library Kalamazoo Public Library Mt Clemens Public Library Public Libraries of Saginaw Willard District Library
Public School Academies:
AGBU Alex & Marie Manoogian School Arts Academy in the Woods Bay-Arenac Community High School Blue Water Middle College Academy Central Academy Countryside Charter School Creative Technologies Academy Da Vinci Institute Dearborn Academy Edison Public School Academy El-Hajj Malik El-Shabazz Academy Grand Rapids Child Discovery Center Greater Heights Academy Henry Ford Academy Holly Academy Honey Creek Community School Joseph K. Lumsden Public School Academy Macomb Academy Martin Luther King, Jr. Public School Academy Michigan Math and Science Academy Muskegon Heights Public School Academy Nah Tah Wahsh Public School Academy North Star Academy Outlook Academy Presque Isle Academy II Relevant Academy of Eaton County Summit Academy Summit Academy North Three Lakes Academy Virtual Learning Academy of St. Clair Walden Green Day School Washtenaw Technical Middle College Waterford Montessori Academy West Village Academy Windover High School Woodland Park Academy
118 ● MICHIGAN PUBLIC SCHOOL EMPLOYEES’ RETIREMENT SYSTEM
ACKNOWLEDGMENTS
The Michigan Public School Employees’ Retirement System Comprehensive Annual Financial Report is prepared by Financial Services, Fiscal Management Division. Staff of the division for the fiscal year 2016 report included:
Management:
Ronald W. Foss, Director Aver Hamilton, Accounting Manager
Accountants:
Kristin Carroll Jingjing Chang Dan Harry Erik Simmer Paula Webb Carol Wheaton
Technical and Support Staff:
Jamin Schroeder
Special thanks are also extended to the Office of Retirement Services personnel, accounting and support personnel throughout Financial Services, Investments Division of Treasury, Department of Community Health cashiering personnel, Office of the Auditor General, Gabriel Roeder Smith & Co., and the staff at the Office of Financial Management. Preparation of this report would not have been possible without the efforts of these individuals.
This report may be viewed online at: www.michigan.gov/ors