Embed Size (px)
Citation preview
Michigan Street Corridor Plan: A Health Impact Assessment
December 2012
Prepared for
City of Grand Rapids Planning Department
Grand Rapids, Michigan
Prepared by
Public Sector Consultants Inc.
Lansing, Michigan
www.pscinc.com
This report was supported by a grant from the Michigan Department of Community Health Division of
Environmental Health, Climate and Health Adaptation Program. The funds were made available to the state
by the Centers for Disease Control and Prevention (CDC) Climate Ready States and Cities Initiative.
Project Team
Erika Arndt, City of Grand Rapids Planning Department
Landon Bartley, City of Grand Rapids Planning Department
Shanna Draheim, Public Sector Consultants
Diane Gibbs, Community Research Institute
Brian Hartl, , Kent County Health Department
Julie Payne, Kent County Health Department
Jeremy Pyne, Community Research Institute
Suzanne Schulz, City of Grand Rapids Planning Department
Jeri Stroupe, Public Sector Consultants
Michigan Street Corridor Steering Committee
City of Grand Rapids
Congregation Ahavas Israel
Consumers Energy
Disability Advocates of Kent County
Dyer-Ives Foundation
Frey Foundation
Fulton Heights Neighborhood Association
Grand Action
Grand Rapids Community College
Grand Rapids Community Foundation
Grand Rapids Public Schools
Grand Valley Metropolitan Council
Grand Valley State University
Greater Grand Rapids Bicycle Coalition
Kent County Health Department
Michigan Department of Transportation
Michigan State Housing Development Authority
Michigan Oaks Neighborhood
Michigan State University College of Human Medicine
Michigan Street Corridor Association
Midtown Neighborhood Association
Neighbors of Belknap Lookout
Saint Mary’s Health Care
Spectrum Health
The Rapid
The Right Place
United States Department of Housing & Urban Development
Van Andel Institute
Michigan Street Corridor Plan Consultants and Staff
Landon Bartley, City of Grand Rapids Planning
Erin Banchoff, City of Grand Rapids Community Development Department
JT ( Jo Anna Trierweiler), Project Innovations
Bob Petko, Progressive AE
Suzanne Schulz, City of Grand Rapids Planning
Brad Strader, LSL Planning
Matt Wendling, WilburSmith Associates
Chris Zull, City of Grand Rapids Traffic Engineering
Contents
INTRODUCTION ........................................................................................................................................... 1
What Is a Health Impact Assessment? ..................................................................................................... 1 Why aN HIA for the Michigan Street Corridor? ......................................................................................... 1 Methodology .............................................................................................................................................. 2
OVERVIEW OF THE MICHIGAN STREET CORRIDOR PLAN .................................................................. 3
About the Study Area ................................................................................................................................ 3 MSCP Process and Alternatives ............................................................................................................... 5
SCREENING AND SCOPING ...................................................................................................................... 8
Screening Health Impact Assessment Needs ........................................................................................... 8 Scoping ..................................................................................................................................................... 9
ASSESSMENT FINDINGS ......................................................................................................................... 11
Overweight and Obesity .......................................................................................................................... 11
Current State of Overweight/Obesity Conditions and Contributing Factors ....................................... 11 Relationship between MSCP Plan Elements and Obesity/Overweight .............................................. 13
Personal Injury ........................................................................................................................................ 14
Current State of Personal Injury/Personal Safety and Contributing Factors ...................................... 14 Relationship between MSCP Plan Elements and Personal Injury ...................................................... 15
Asthma and Heat-related Illness ............................................................................................................. 15
Current State of Asthma or Heat-Related Illness and Contributing Factors ....................................... 15 Relationship between MSCP Plan Elements and Asthma or Heat-Related Illness ............................ 16
RECOMMENDED POLICIES AND INFRASTRUCTURE ELEMENTS .................................................... 19
MONITORING ............................................................................................................................................. 21
REFERENCES ............................................................................................................................................ 22
Prepared by Public Sector Consultants Inc., November 2012 1
Introduction
The purpose of this Health Impact Assessment (HIA) is to examine the potential health benefits and risks
associated with development alternatives for the Michigan Street Corridor Plan (MSCP), a multi-year,
comprehensive effort to plan for continued investment and growth in the Michigan Street Corridor of
downtown Grand Rapids.
WHAT IS A HEALTH IMPACT ASSESSMENT?
An HIA is a “means of assessing the health impacts of policies, plans, and projects in diverse economic
sectors using quantitative, qualitative, and participatory techniques” (WHO 2012). HIAs can help
decision makers evaluate alternative scenarios and better understand ways to prevent disease, injury, and
disparities, and improve public health.
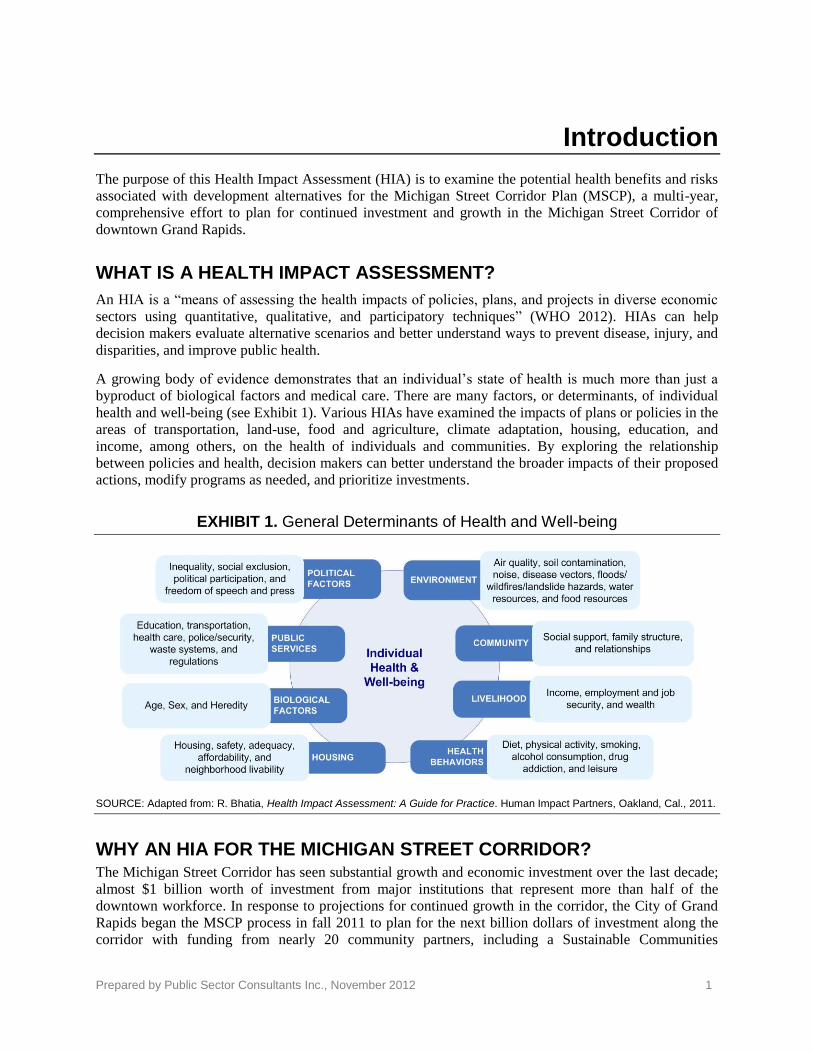
A growing body of evidence demonstrates that an individual’s state of health is much more than just a
byproduct of biological factors and medical care. There are many factors, or determinants, of individual
health and well-being (see Exhibit 1). Various HIAs have examined the impacts of plans or policies in the
areas of transportation, land-use, food and agriculture, climate adaptation, housing, education, and
income, among others, on the health of individuals and communities. By exploring the relationship
between policies and health, decision makers can better understand the broader impacts of their proposed
actions, modify programs as needed, and prioritize investments.
EXHIBIT 1. General Determinants of Health and Well-being
SOURCE: Adapted from: R. Bhatia, Health Impact Assessment: A Guide for Practice. Human Impact Partners, Oakland, Cal., 2011.
WHY AN HIA FOR THE MICHIGAN STREET CORRIDOR? The Michigan Street Corridor has seen substantial growth and economic investment over the last decade;
almost $1 billion worth of investment from major institutions that represent more than half of the
downtown workforce. In response to projections for continued growth in the corridor, the City of Grand
Rapids began the MSCP process in fall 2011 to plan for the next billion dollars of investment along the
corridor with funding from nearly 20 community partners, including a Sustainable Communities
Prepared by Public Sector Consultants Inc., November 2012 2
Challenge grant from the U.S. Department of Housing & Urban Development. Overseen by a 30-member
Steering Committee, the goal of the MSCP is to:
Create a form-based code, identify locations for new mixed-use development, devise a
comprehensive transportation strategy, recognize affordable housing opportunities, and develop a
housing investment program to increase the number of employees, students, and faculty living in
and around the Michigan Street corridor while also assuring the creation and/or preservation of
affordable housing within the area to ensure that Grand Rapids is a livable and sustainable
community (City of Grand Rapids N.d.)
Health considerations were raised by the Steering Committee and stakeholders early in the process as an
important consideration in developing Plan alternatives. This HIA will help the City, and its public and
private partners who will be implementing selected alternatives, understand how choices related to land
use, housing, transportation, infrastructure investment, and growth impact the health and well-being of
residents and visitors in the corridor.
METHODOLOGY
An HIA generally consists of six steps:
1. Screening. Identify projects or policies for which an HIA would be useful, and determine which
aspects of the policy or program to evaluate.
2. Scoping: Determine which health effects to consider and develop a map of pathways to describe
relationships between inputs and outputs (for example, the impact of x on y).
3. Assessment: Identify the appropriate and necessary data sources and methods that will be used to
quantify and describe current or existing conditions. Use available data, resources, and literature
to describe the predicted health impacts.
4. Recommendations: Develop evidence-based recommendations to mitigate negative and
maximize positive health impacts. Prioritize recommendations based on feedback from experts,
the community, and stakeholders.
5. Reporting: Develop the HIA report and present findings and recommendations to relevant
stakeholders, interested parties, and decision makers.
6. Monitoring: Monitor the decisions, implementation, health determinants, and outcomes affected
by the assessment.
This report addresses steps one through five. Once the recommendations from this report and the MSCP
preferred scenario alternatives are implemented, the City of Grand Rapids will monitor health impacts
and outcomes associated with the project.
Prepared by Public Sector Consultants Inc., November 2012 3
Overview of the Michigan Street Corridor Plan
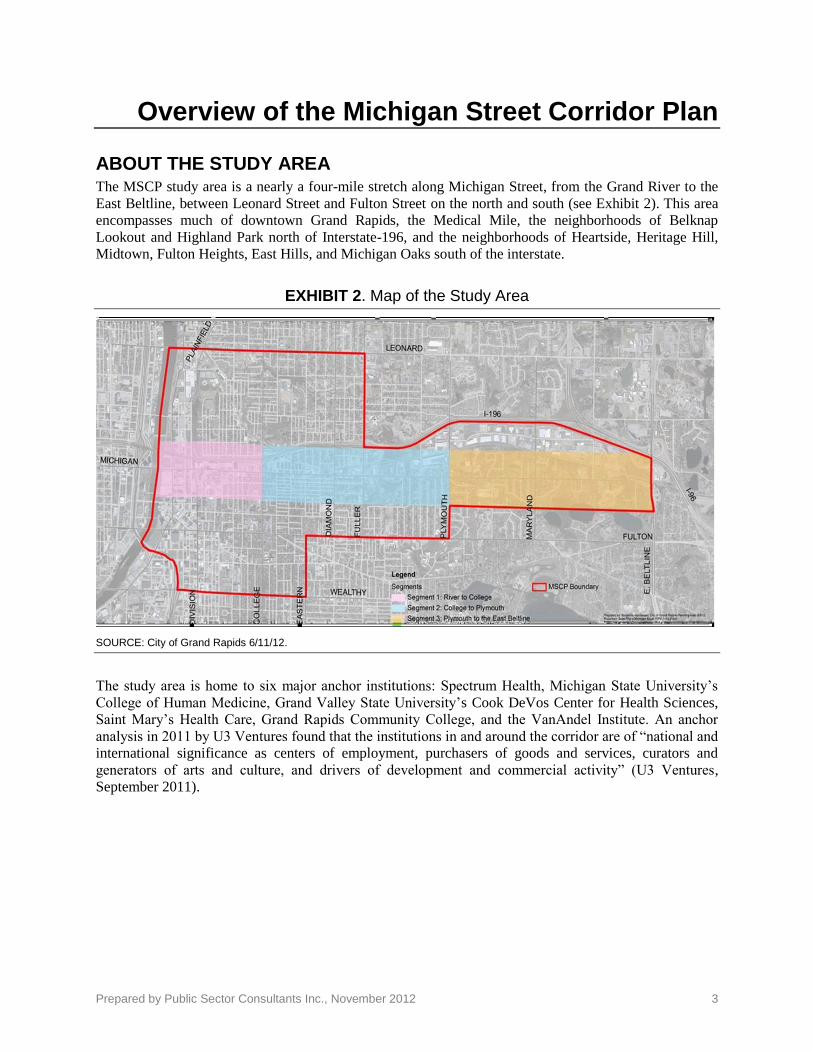
ABOUT THE STUDY AREA The MSCP study area is a nearly a four-mile stretch along Michigan Street, from the Grand River to the
East Beltline, between Leonard Street and Fulton Street on the north and south (see Exhibit 2). This area
encompasses much of downtown Grand Rapids, the Medical Mile, the neighborhoods of Belknap
Lookout and Highland Park north of Interstate-196, and the neighborhoods of Heartside, Heritage Hill,
Midtown, Fulton Heights, East Hills, and Michigan Oaks south of the interstate.
EXHIBIT 2. Map of the Study Area
SOURCE: City of Grand Rapids 6/11/12.
The study area is home to six major anchor institutions: Spectrum Health, Michigan State University’s
College of Human Medicine, Grand Valley State University’s Cook DeVos Center for Health Sciences,
Saint Mary’s Health Care, Grand Rapids Community College, and the VanAndel Institute. An anchor
analysis in 2011 by U3 Ventures found that the institutions in and around the corridor are of “national and
international significance as centers of employment, purchasers of goods and services, curators and
generators of arts and culture, and drivers of development and commercial activity” (U3 Ventures,
September 2011).
Prepared by Public Sector Consultants Inc., November 2012 4
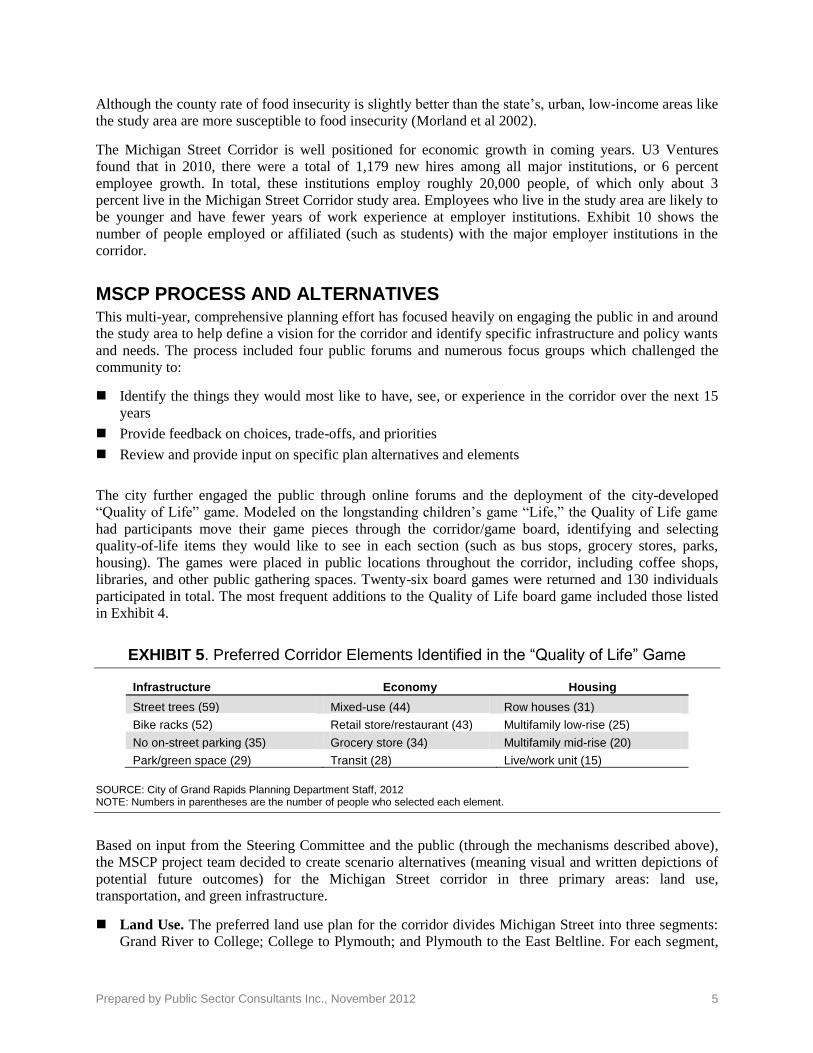
The 3.36-square-mile study area accounts for
7 percent of all the land area of Grand Rapids.
The study area population, however, is more
than 10 percent of the city population. Based
on 2010 Census data, the median age and
education level within the corridor is similar
to the whole city, but the median income is
about 25 percent less than the citywide
median. Corridor residents are also twice as
likely to have no car and walk to work. The
study area is less diverse than Grand Rapids
as a whole, with a smaller percentage of
African Americans and Hispanics. Almost
three-quarters of corridor residents are white
(73 percent), with about 16 percent African
American and almost 10 percent Hispanic
residents. Exhibit 4 summarizes the
demographic character of the study area.
EXHIBIT 4. Study Area Demographics Compared to Greater Grand Rapids
Demographics Study area Grand Rapids
Square miles 3.36 45.28
Total population (Census 2010) 19,233 188,040
Population reporting one race 18,388 180,209
White 72.6% 64.6%
Black or African American 16.3% 20.9%
American Indian and Alaska Native 0.8% 0.7%
Asian 1.5% 1.9%
Native Hawaiian and other Pacific Islander 0.1% 0.1%
Hispanic population 9.6% 15.6%
Some other race 4.3% 7.7%
Median household income 2010 (ESRI) $35,569 $47,496
Median age 2010 (ESRI) 30.9 31.9
% Associate’s or higher degree (ESRI) 39% 35%
% of Workers 16+ who walked to work (Census 2000) 9% 4%
% of Households with no vehicle (Census 2000) 20% 12%
SOURCE: 2010 Census data gathered by Community Research Institute (CRI).
Grand Rapids is located in Kent County, and the county has a higher number of people who qualify for
food assistance than the state average. Food insecurity is defined as the household-level economic and
social condition of limited or uncertain access to adequate food, and the food insecurity rate is the
percentage of the population that experienced food insecurity at some point during the year. The county
food insecurity rate is 15.2 percent among adults and 24.2 percent among children, compared with 18.2
percent in Michigan, and 25.4 percent among Michigan children (MPHI 2011; Feeding America, 2011).
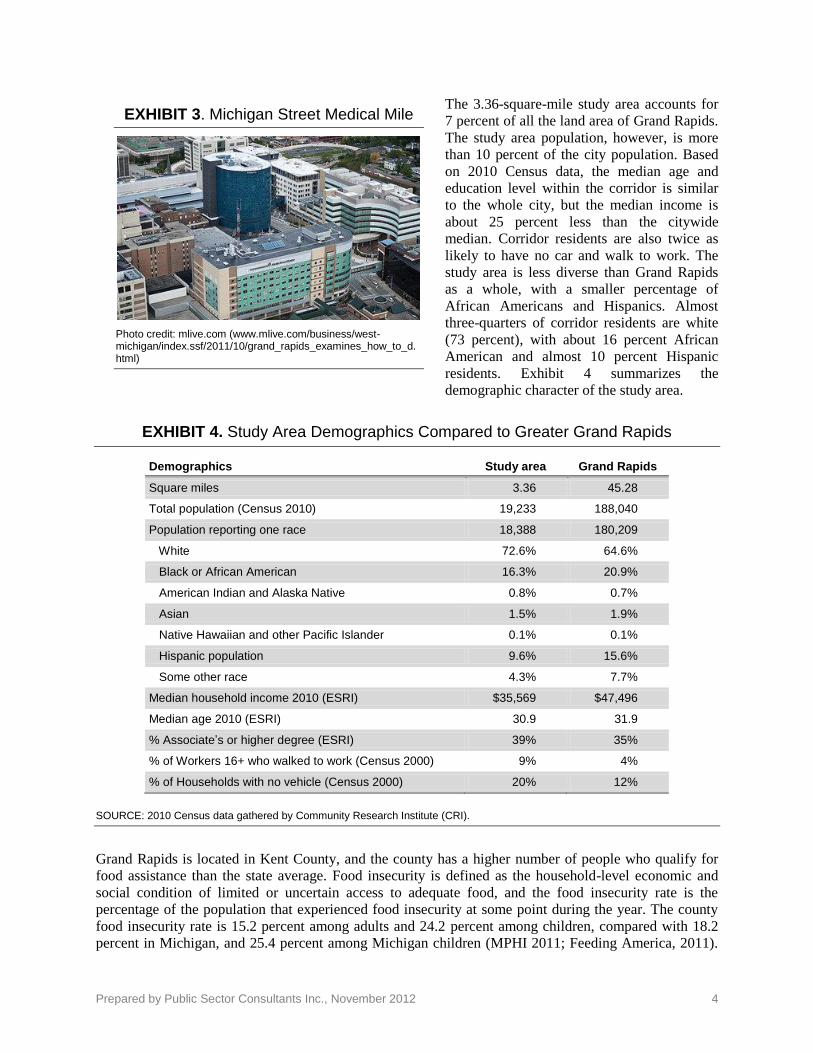
EXHIBIT 3. Michigan Street Medical Mile
Photo credit: mlive.com (www.mlive.com/business/west-michigan/index.ssf/2011/10/grand_rapids_examines_how_to_d.html)
Prepared by Public Sector Consultants Inc., November 2012 5
Although the county rate of food insecurity is slightly better than the state’s, urban, low-income areas like
the study area are more susceptible to food insecurity (Morland et al 2002).
The Michigan Street Corridor is well positioned for economic growth in coming years. U3 Ventures
found that in 2010, there were a total of 1,179 new hires among all major institutions, or 6 percent
employee growth. In total, these institutions employ roughly 20,000 people, of which only about 3
percent live in the Michigan Street Corridor study area. Employees who live in the study area are likely to
be younger and have fewer years of work experience at employer institutions. Exhibit 10 shows the
number of people employed or affiliated (such as students) with the major employer institutions in the
corridor.
MSCP PROCESS AND ALTERNATIVES This multi-year, comprehensive planning effort has focused heavily on engaging the public in and around
the study area to help define a vision for the corridor and identify specific infrastructure and policy wants
and needs. The process included four public forums and numerous focus groups which challenged the
community to:
Identify the things they would most like to have, see, or experience in the corridor over the next 15
years
Provide feedback on choices, trade-offs, and priorities
Review and provide input on specific plan alternatives and elements
The city further engaged the public through online forums and the deployment of the city-developed
“Quality of Life” game. Modeled on the longstanding children’s game “Life,” the Quality of Life game
had participants move their game pieces through the corridor/game board, identifying and selecting
quality-of-life items they would like to see in each section (such as bus stops, grocery stores, parks,
housing). The games were placed in public locations throughout the corridor, including coffee shops,
libraries, and other public gathering spaces. Twenty-six board games were returned and 130 individuals
participated in total. The most frequent additions to the Quality of Life board game included those listed
in Exhibit 4.
EXHIBIT 5. Preferred Corridor Elements Identified in the “Quality of Life” Game
Infrastructure Economy Housing
Street trees (59) Mixed-use (44) Row houses (31)
Bike racks (52) Retail store/restaurant (43) Multifamily low-rise (25)
No on-street parking (35) Grocery store (34) Multifamily mid-rise (20)
Park/green space (29) Transit (28) Live/work unit (15)
SOURCE: City of Grand Rapids Planning Department Staff, 2012 NOTE: Numbers in parentheses are the number of people who selected each element.
Based on input from the Steering Committee and the public (through the mechanisms described above),
the MSCP project team decided to create scenario alternatives (meaning visual and written depictions of
potential future outcomes) for the Michigan Street corridor in three primary areas: land use,
transportation, and green infrastructure.
Land Use. The preferred land use plan for the corridor divides Michigan Street into three segments:
Grand River to College; College to Plymouth; and Plymouth to the East Beltline. For each segment,
Prepared by Public Sector Consultants Inc., November 2012 6
the public identified various land-use characteristics they would like to see. For example, priorities
identified for the Grand River to College segment include commercial and retail mix, institutions, and
high density housing. From College to Plymouth the public also prioritized commercial and retail
mix, but preferred only medium density housing and fewer institutions. In the easternmost segment,
from Plymouth to the Beltline, the priority was low-density housing, followed by commercial and
retail mix. Additional parking was identified as the least desirable use of land east of College Avenue.
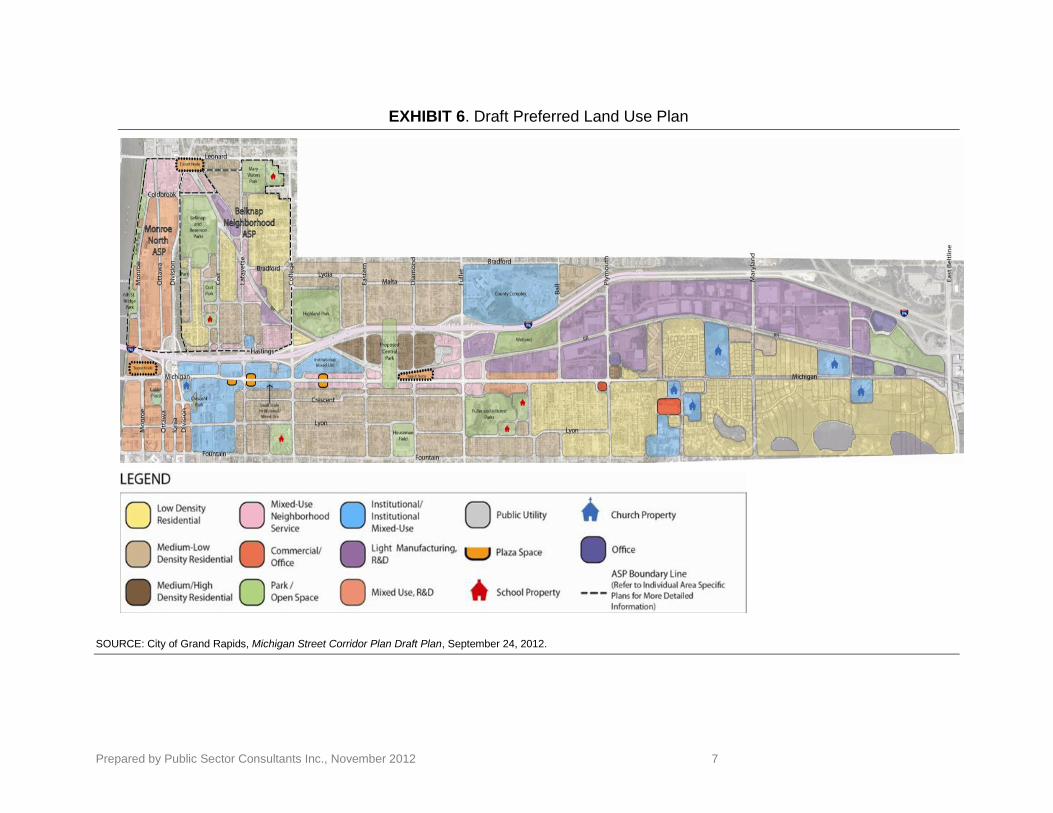
The preferred land use scenario for the corridor, depicted in Exhibit 5, includes expanded light
manufacturing East of Fuller; additional transit hubs on Michigan and Leonard Streets; expanded
mixed-use neighborhoods to Crescent Street; and green infrastructure/pedestrian way expansion.
Transportation. In order of increasing expense, the transportation alternatives the City has
considered include bike routes, wider sidewalks and greenways, conversion of one-way streets to
two-way, 5-to-3 lane conversion, reversible lanes, more turn lanes, medians, roundabouts at major
intersections, rapid bus or transit improvements, and I-196 interstate modifications. Consultants from
Smart Mobility Inc. used an MXD equation to ascertain the number of trips generated as a result of
mixed-use development in the corridor. MXD calculates trip reduction rates as a combination of
walk, bike, transit, and internal auto trips. The alternatives considered in the transportation analysis
included no action; reconfiguration of the Ottawa ramp to I-196; converting Hastings and College to
two-way roads between Lafayette and College and Lyon and Fountain; three-lane Michigan Street
east of Mayfield; and adding 5,000 housing units to the greater downtown area. The results of the
analysis predict a 10–15 percent reduction in trips in the corridor, which was not shown to
significantly impact traffic congestion (Marshall 2012).
The housing scenario Smart Mobility considered suggests relatively small traffic impacts, despite
being four times the current forecast for total downtown housing in 2035. In other words, it’s likely
that auto trips will be shorter and other transportation modes, such as walking or biking, would be
more common downtown. The impact on traffic congestion may not be significant downtown, but is
likely to alleviate some regional congestion. Transportation demand management (TDM) programs
will be considered in conjunction with any roadway reconfigurations. TDM programs typically
increase the number and availability of more sustainable alternatives, incentivize more sustainable
transportation habits, and use full-cost pricing on use of the personal automobile (Nelson 2000).
Green Infrastructure. The draft green infrastructure and connectivity plan designates park/open
space, bicycle routes, bicycle connections to Michigan Street, streetscapes, pedestrian connectors, and
pedestrian enhancements on freeway bridges. There are bicycle routes planned south of the corridor
along Crescent and Lyon Streets and six pedestrian bridge enhancements (City of Grand Rapids,
October 29, 2012).
The City of Grand Rapids selected a preferred land use alternative in early fall 2012, and is in the process
of modeling final transportation scenarios (see Exhibit 6). The City is evaluating the technical feasibility,
and economic and environmental impacts associated with these development alternatives. This HIA
complements the analysis by focusing on some of the potential health impacts of implementing these
scenario alternatives.
Prepared by Public Sector Consultants Inc., November 2012 7
EXHIBIT 6. Draft Preferred Land Use Plan
SOURCE: City of Grand Rapids, Michigan Street Corridor Plan Draft Plan, September 24, 2012.
Prepared by Public Sector Consultants Inc., November 2012 8
Screening and Scoping
SCREENING HEALTH IMPACT ASSESSMENT NEEDS As the MSCP process got under way, the City recognized that proposed development alternatives
must consider the health impacts associated with increased growth and economic and community
infrastructure. Staff from the City’s planning department met with Public Sector Consultants
(PSC), the Kent County Health Department, and Grand Valley State University’s Community
Research Institute (CRI) to discuss whether an HIA would add value, and how it might inform
decision makers regarding proposed corridor development alternatives. All agreed an HIA would
be a worthy pursuit, and agreed to form a project team to lead the HIA and integrate the effort into
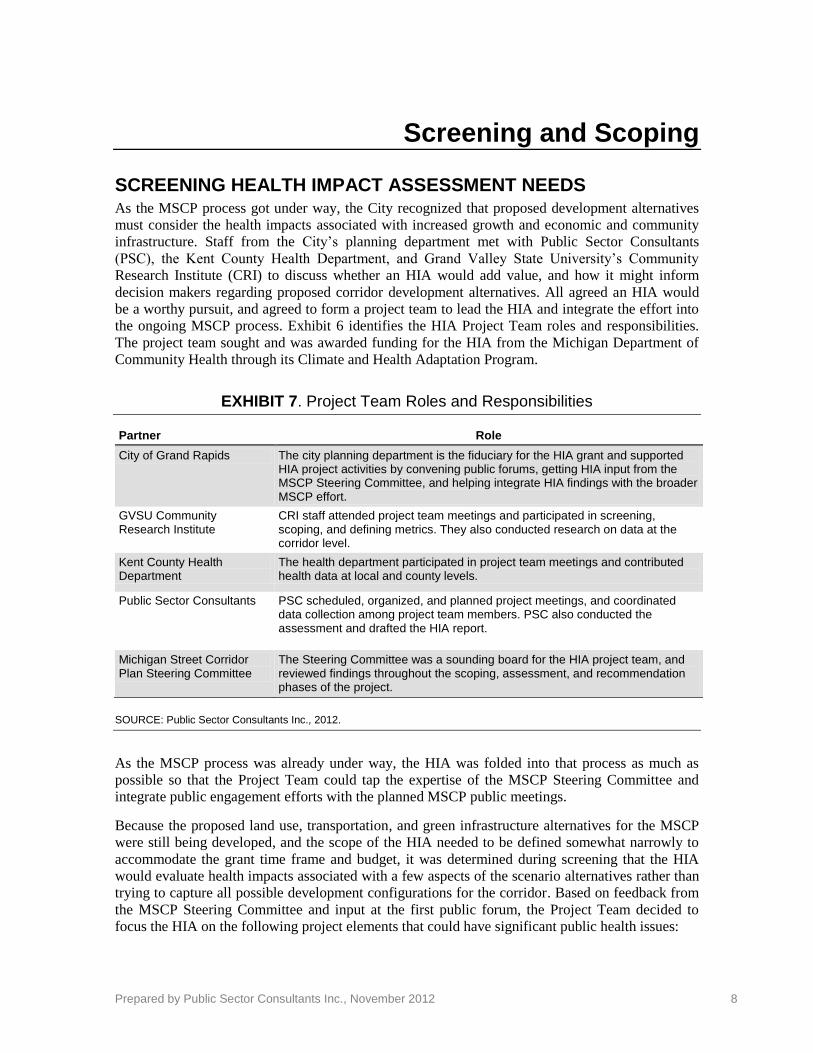
the ongoing MSCP process. Exhibit 6 identifies the HIA Project Team roles and responsibilities.
The project team sought and was awarded funding for the HIA from the Michigan Department of
Community Health through its Climate and Health Adaptation Program.
EXHIBIT 7. Project Team Roles and Responsibilities
Partner Role
City of Grand Rapids The city planning department is the fiduciary for the HIA grant and supported HIA project activities by convening public forums, getting HIA input from the MSCP Steering Committee, and helping integrate HIA findings with the broader MSCP effort.
GVSU Community Research Institute
CRI staff attended project team meetings and participated in screening, scoping, and defining metrics. They also conducted research on data at the corridor level.
Kent County Health Department
The health department participated in project team meetings and contributed health data at local and county levels.
Public Sector Consultants PSC scheduled, organized, and planned project meetings, and coordinated data collection among project team members. PSC also conducted the assessment and drafted the HIA report.
Michigan Street Corridor Plan Steering Committee
The Steering Committee was a sounding board for the HIA project team, and reviewed findings throughout the scoping, assessment, and recommendation phases of the project.
SOURCE: Public Sector Consultants Inc., 2012.
As the MSCP process was already under way, the HIA was folded into that process as much as
possible so that the Project Team could tap the expertise of the MSCP Steering Committee and
integrate public engagement efforts with the planned MSCP public meetings.
Because the proposed land use, transportation, and green infrastructure alternatives for the MSCP
were still being developed, and the scope of the HIA needed to be defined somewhat narrowly to
accommodate the grant time frame and budget, it was determined during screening that the HIA
would evaluate health impacts associated with a few aspects of the scenario alternatives rather than
trying to capture all possible development configurations for the corridor. Based on feedback from
the MSCP Steering Committee and input at the first public forum, the Project Team decided to
focus the HIA on the following project elements that could have significant public health issues:
Prepared by Public Sector Consultants Inc., November 2012 9
Pedestrian-friendly design, even at the expense of other transportation options
Bike-friendly design, even at the expense of other transportation options
Access to affordable fresh foods
Reduction in vehicle emissions by providing alternative transportation options and sufficient
tree canopy cover
SCOPING The scoping phase of this project established the framework for the HIA. In March 2012, the
Project Team met to do a preliminary scoping of the major health issues in and around the
Michigan Street Corridor. They also met with the MSCP Steering Committee to present and
discuss the HIA process and potential health issues identified by the Project Team, and to answer
questions from the committee.
The primary scoping mechanism to identify potential health issues was the second MSCP public
forum in June 2012. This forum, titled “Discovery and Discussion,” was designed to obtain input
from the public on their values related to the three project scenario alternatives: transportation, land
use, and green infrastructure, and the potential health issues associated with each of these scenario
alternatives.
After a brief project overview, forum participants were invited to visit individual stations for each
of these themes. The stations included further project details, and staff at each station solicited
input from the public on their opinions and ideas related to these issues. At the public health
station, PSC staff encouraged participants to rank the four scenario alternative elements included in
the HIA in terms of their importance to improving or protecting health.
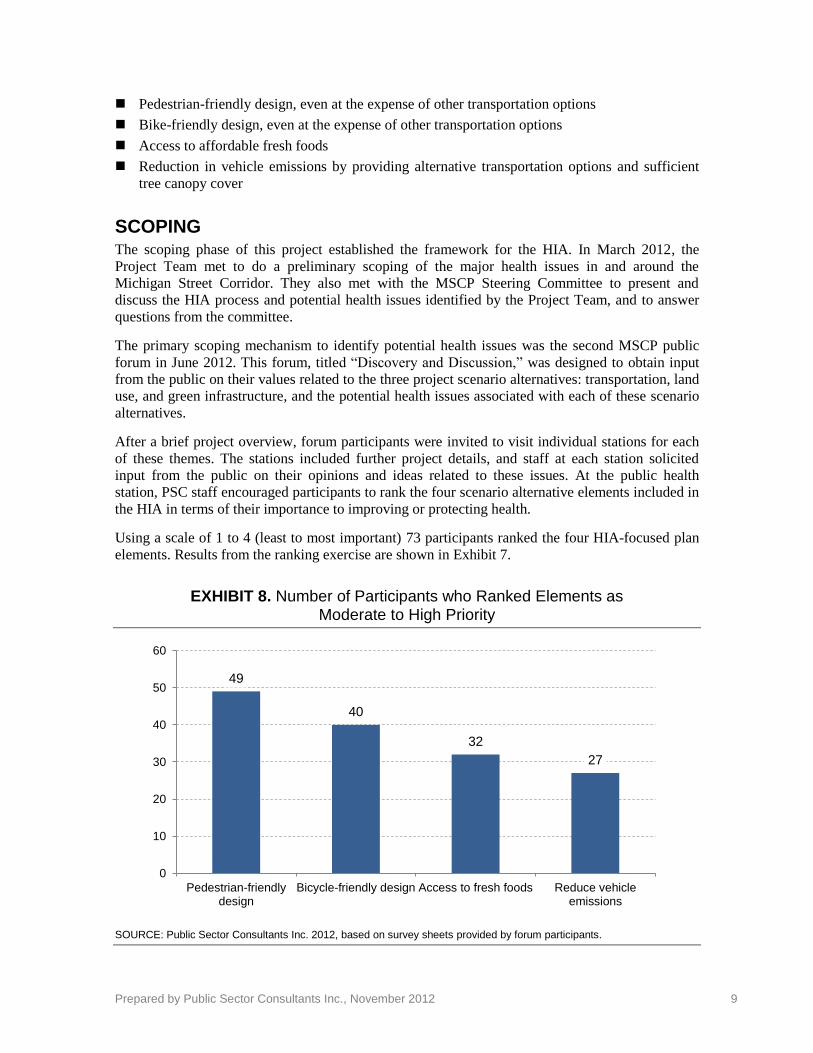
Using a scale of 1 to 4 (least to most important) 73 participants ranked the four HIA-focused plan
elements. Results from the ranking exercise are shown in Exhibit 7.
EXHIBIT 8. Number of Participants who Ranked Elements as Moderate to High Priority
SOURCE: Public Sector Consultants Inc. 2012, based on survey sheets provided by forum participants.
49
40
32
27
0
10
20
30
40
50
60
Pedestrian-friendlydesign
Bicycle-friendly design Access to fresh foods Reduce vehicleemissions
Prepared by Public Sector Consultants Inc., November 2012 10
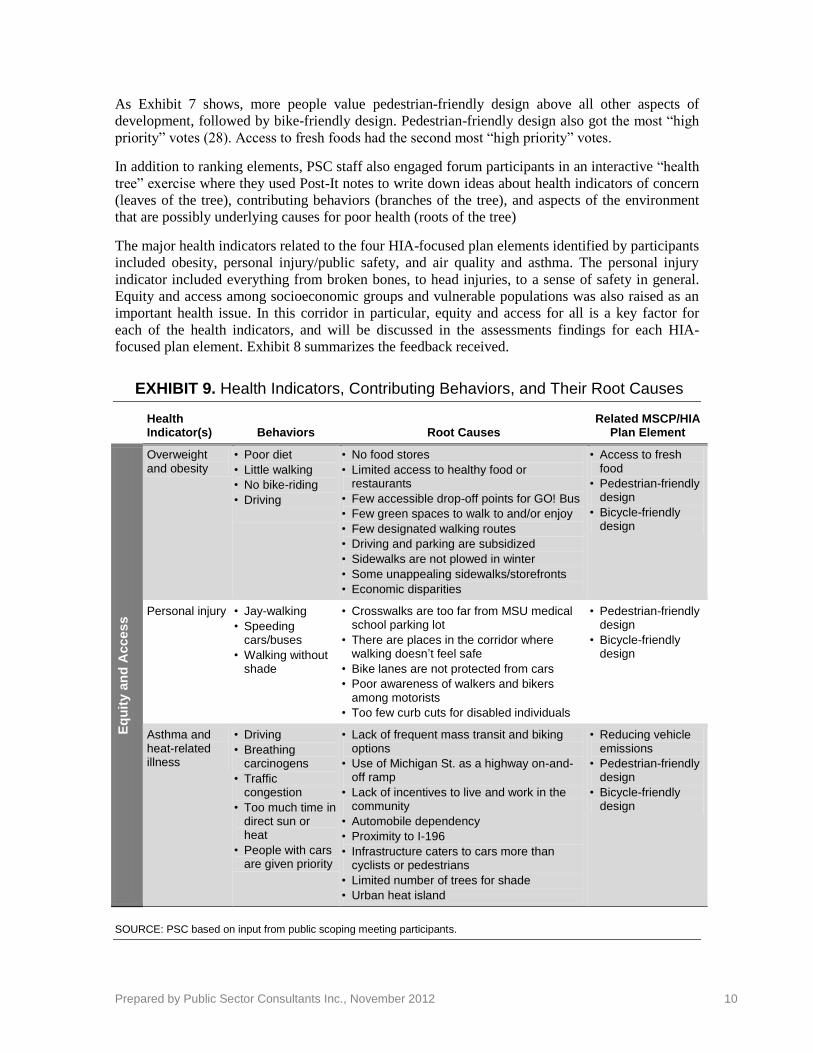
As Exhibit 7 shows, more people value pedestrian-friendly design above all other aspects of
development, followed by bike-friendly design. Pedestrian-friendly design also got the most “high
priority” votes (28). Access to fresh foods had the second most “high priority” votes.
In addition to ranking elements, PSC staff also engaged forum participants in an interactive “health
tree” exercise where they used Post-It notes to write down ideas about health indicators of concern
(leaves of the tree), contributing behaviors (branches of the tree), and aspects of the environment
that are possibly underlying causes for poor health (roots of the tree)
The major health indicators related to the four HIA-focused plan elements identified by participants
included obesity, personal injury/public safety, and air quality and asthma. The personal injury
indicator included everything from broken bones, to head injuries, to a sense of safety in general.
Equity and access among socioeconomic groups and vulnerable populations was also raised as an
important health issue. In this corridor in particular, equity and access for all is a key factor for
each of the health indicators, and will be discussed in the assessments findings for each HIA-
focused plan element. Exhibit 8 summarizes the feedback received.
EXHIBIT 9. Health Indicators, Contributing Behaviors, and Their Root Causes
Health Indicator(s) Behaviors Root Causes
Related MSCP/HIA Plan Element
Eq
uit
y a
nd
Acce
ss
Overweight and obesity
• Poor diet
• Little walking
• No bike-riding
• Driving
• No food stores
• Limited access to healthy food or restaurants
• Few accessible drop-off points for GO! Bus
• Few green spaces to walk to and/or enjoy
• Few designated walking routes
• Driving and parking are subsidized
• Sidewalks are not plowed in winter
• Some unappealing sidewalks/storefronts
• Economic disparities
• Access to fresh food
• Pedestrian-friendly design
• Bicycle-friendly design
Personal injury • Jay-walking
• Speeding cars/buses
• Walking without shade
• Crosswalks are too far from MSU medical school parking lot
• There are places in the corridor where walking doesn’t feel safe
• Bike lanes are not protected from cars
• Poor awareness of walkers and bikers among motorists
• Too few curb cuts for disabled individuals
• Pedestrian-friendly design
• Bicycle-friendly design
Asthma and heat-related illness
• Driving
• Breathing carcinogens
• Traffic congestion
• Too much time in direct sun or heat
• People with cars are given priority
• Lack of frequent mass transit and biking options
• Use of Michigan St. as a highway on-and-off ramp
• Lack of incentives to live and work in the community
• Automobile dependency
• Proximity to I-196
• Infrastructure caters to cars more than cyclists or pedestrians
• Limited number of trees for shade
• Urban heat island
• Reducing vehicle emissions
• Pedestrian-friendly design
• Bicycle-friendly design
SOURCE: PSC based on input from public scoping meeting participants.
Prepared by Public Sector Consultants Inc., November 2012 11
Assessment Findings
The assessment of potential health impacts began with an evaluation of the existing conditions in
the community and corridor. The Project Team assessed existing conditions by researching data on
the three priority health indicators identified through scoping: overweight and obesity; personal
injury; and asthma and heat-related illness, as well as equity and access conditions. Wherever
possible, corridor or City of Grand Rapids data was used, but for some characteristics (particularly
health information) the only data available are at the Kent County level. While we recognize there
are differences between countywide data and city- or corridor-specific data, this HIA was based on
the assumption that county data are sufficiently reflective of city or corridor data for the purposes
of this analysis.
The Project Team then analyzed the potential impacts of the four HIA-focused plan alternatives on
the three priority health indicators using existing literature and studies of similar types of projects.
The findings of the assessment are presented below. Based on the results of the assessment, this
HIA offers some broad recommendations for how the specific, preferred land use, transportation,
and green infrastructure scenario alternatives could be implemented or modified to better protect
the health and well-being of residents and visitors in the corridor.
OVERWEIGHT AND OBESITY
Current State of Overweight/Obesity Conditions and Contributing Factors
Overweight and obesity is a significant issue in Kent County as in the rest of the state and country.
More than one-third of adults (35.4 percent) are overweight in Kent County, and almost another
third (27.7 percent) are obese. About one in ten youth residents are obese (10.5 percent). Men and
African Americans are more likely to be overweight than women and non-African
Americans. About one in five adults (20 percent) are not physically active at all in their free time.
Access to recreational facilities, which can play a role in managing and preventing obesity is
slightly better than in the state as a whole, but is less than the national average; county residents
have access to 12 recreational facilities per 100,000 people, compared with 10 in Michigan and 17
nationwide (MPHI 2011).
There are no data on number of bikes travelling in the corridor or on bike parking availability in the
study area. There are no bike lanes along Michigan Street, although a bike route is planned along
Lyon Street south of and parallel to Michigan Street. There are also wide shoulders along eastern
parts of Michigan Street closer to the beltline, but no formal routes exist in the corridor.
Walkscore.com rates locations on their walkability and car dependence based on proximity to
restaurants, coffee shops, bars, grocers, outdoor places, schools, and retail. The website gives the
city of Grand Rapids a score of 54 out of 100, or “somewhat walkable.” Neighborhoods within the
study area have walkability scores that range from 31 (car-dependent) to 87 (very walkable)
(Walkscore.com, October 2012).
Prepared by Public Sector Consultants Inc., November 2012 12
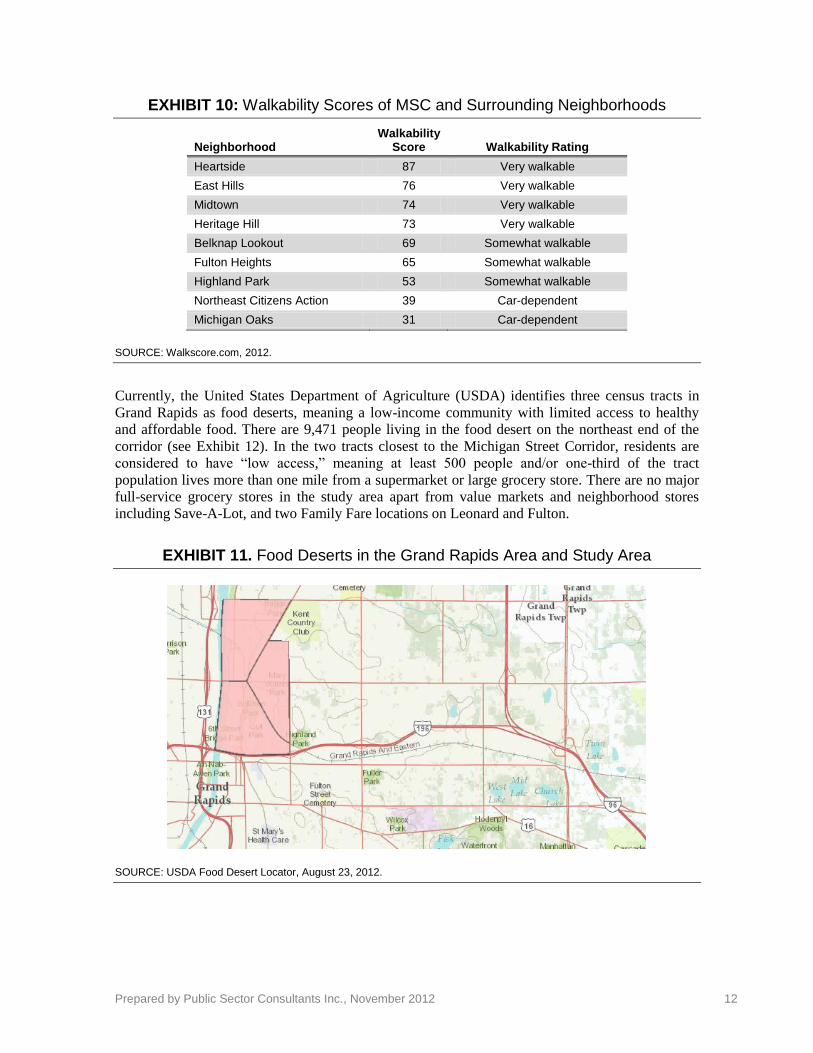
EXHIBIT 10: Walkability Scores of MSC and Surrounding Neighborhoods
Neighborhood Walkability
Score Walkability Rating
Heartside 87 Very walkable
East Hills 76 Very walkable
Midtown 74 Very walkable
Heritage Hill 73 Very walkable
Belknap Lookout 69 Somewhat walkable
Fulton Heights 65 Somewhat walkable
Highland Park 53 Somewhat walkable
Northeast Citizens Action 39 Car-dependent
Michigan Oaks 31 Car-dependent
SOURCE: Walkscore.com, 2012.
Currently, the United States Department of Agriculture (USDA) identifies three census tracts in
Grand Rapids as food deserts, meaning a low-income community with limited access to healthy
and affordable food. There are 9,471 people living in the food desert on the northeast end of the
corridor (see Exhibit 12). In the two tracts closest to the Michigan Street Corridor, residents are
considered to have “low access,” meaning at least 500 people and/or one-third of the tract
population lives more than one mile from a supermarket or large grocery store. There are no major
full-service grocery stores in the study area apart from value markets and neighborhood stores
including Save-A-Lot, and two Family Fare locations on Leonard and Fulton.
EXHIBIT 11. Food Deserts in the Grand Rapids Area and Study Area
SOURCE: USDA Food Desert Locator, August 23, 2012.
Prepared by Public Sector Consultants Inc., November 2012 13
Relationship between MSCP Plan Elements and Obesity/Overweight
As shown in Exhibit 8, incidence of overweight and obesity within the study area population is
related to three of the four HIA-focused Plan elements: bike-friendly design, pedestrian-friendly
design, and access to fresh foods. The relationships between these Plan elements and the
obesity/overweight health indicator are described below.
Pedestrian and Bike-Friendly Design—Increasing Active Commuting in the Corridor
An assumption of the MSCP is that pedestrian- and bike-friendly design elements like wide
sidewalks, sufficient and well-marked street crossings, speed calming devices, natural streetscapes
and roadway buffers, bike lanes, and bike parking will all help to make the corridor a more
welcoming environment for walkers and bikers, and encourage people to choose more active
transportation modes rather than driving.
There is evidence that being physically active can help
lower the risk of obesity, and in turn can lower risk for
other chronic diseases. Physical activity plays a role in
maintaining healthy levels of cholesterol (high-density
lipoprotein cholesterol), triglycerides, blood pressure,
waist circumference, and BMI, all of which are risk
factors for cardiovascular disease. Active travel
(walking and cycling) has been shown to be
significantly related to lower levels of self-reported
obesity and diabetes (Pucher et al. 2010). For each
hour spent in a car per day the odds of obesity
increased 6 percent; for each additional kilometer walked, odds decreased 4.8 percent (Frank et al.
2004). Related research has also shown that time spent being physically active while commuting is
negatively associated with total cholesterol and diastolic blood pressure (Smith 2007).
When bike and pedestrian-friendly design are integrated into mixed, clustered, and transit-oriented
land uses, there is even greater potential for reducing overweight conditions and obesity. A
neighborhood with mixed residential and commercial uses, easy access to a variety of food and
retail options, parks and open space, and good bike and pedestrian infrastructure can lead to more
exercise and less obesity by significantly reducing the need to drive (Handy 1996; Frank et al.
2004; Cervero 1991). One study found that in six large suburban area centers, having a retail
component within an office building reduced vehicle trip rates by 8 percent per employee (Cervero
1991). Another study in Atlanta demonstrated that people who live in walkable neighborhoods are
twice as likely to meet the daily recommended moderate-intensity physical activity as those who
don’t (Frank 2005). Greater walkability is defined as having many walking destinations near home,
a higher residential density, and a greater land-use mix (Trout 1993).
Bike- and pedestrian-friendly design elements can also help capitalize on opportunities for people
to use public transit for commuting. Access to various modes of transportation, including public
transit, provides health benefits by increasing physical activity through walking and biking to
transit stations and expanding access to healthy foods. In fact, residents living near transit stations
are five times more likely to commute via public transit than other residents in a region (Lund et
al. 2004). Almost one-third of people using public transit to commute to work meet the daily
recommended amount of physical activity (Besser and Dannenberg 2005).
Access to Fresh Food—Healthier Eating
Residents in low-income communities are less likely to own a car and are three times less likely to
have a grocery store within their neighborhood than residents of more affluent communities. Non-
Prepared by Public Sector Consultants Inc., November 2012 14
minority and wealthy communities typically have greater access to foods and dietary lifestyles that
lower disease risk (Morland et al. 2002). Low-income and urban residents are more likely to shop
at smaller local stores that typically carry less healthy food (including a lack of produce or
nutritious foods) at higher prices (Morland et al. 2002; Williams and Collins 2001). For example,
one study used a geospatial analysis in four states to compare the number of places to consume
alcoholic beverages and the number of supermarkets in wealthy and low-income neighborhoods,
and in white and minority neighborhoods. Low-income and minority neighborhoods had three
times more places to consume alcohol and a much narrower selection of supermarkets with healthy
food choices available (Morland et al. 2002).
Providing proximate access to fresh, healthy food outlets and ensuring sufficient transportation
options to those locations can help address equity and access issues in low-income communities.
Mapping food access (such as grocery stores and farmer’s markets) and transportation assets can
help identify transportation barriers for accessing fresh food. There are also opportunities to help
locate grocers and farmer’s markets at transit hubs (Vallianatos 2002).
PERSONAL INJURY
Current State of Personal Injury/Personal Safety and Contributing Factors
As in most cities in Michigan, personal injury from automobile accidents is a risk in Grand Rapids.
From 2007 to 2011 there were 1,015 accidents in the study corridor, 736 of which were vehicle-to-
vehicle, 141 vehicle-to-pedestrian, and 139 vehicle-to-bicyclist (City of Grand Rapids Traffic
Engineering Division).
Public safety in Kent county is of significant importance to residents. The Kent County Citizen
Survey showed that nearly all residents (95 percent) said public safety is an important aim of local
government. This was more important than pollution control (91 percent), road maintenance (85
percent), and economic development programs (83 percent).
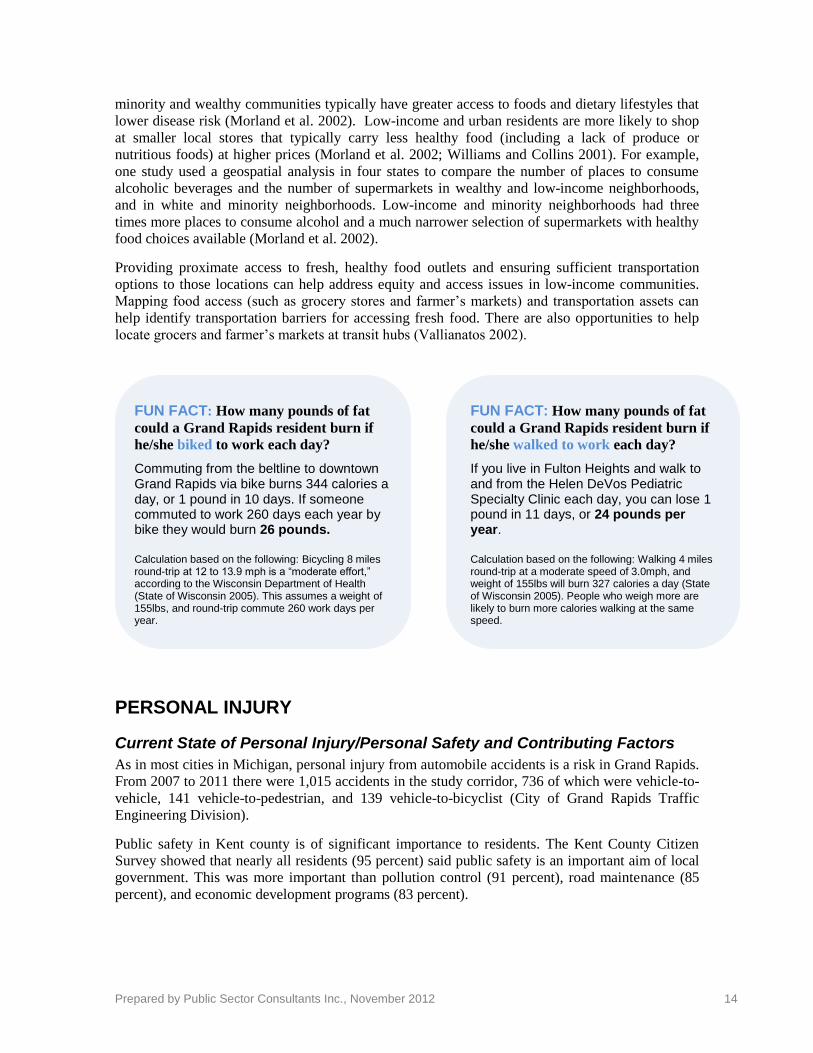
FUN FACT: How many pounds of fat
could a Grand Rapids resident burn if
he/she biked to work each day?
Commuting from the beltline to downtown Grand Rapids via bike burns 344 calories a day, or 1 pound in 10 days. If someone commuted to work 260 days each year by bike they would burn 26 pounds.
Calculation based on the following: Bicycling 8 miles round-trip at 12 to 13.9 mph is a “moderate effort,” according to the Wisconsin Department of Health (State of Wisconsin 2005). This assumes a weight of 155lbs, and round-trip commute 260 work days per year.
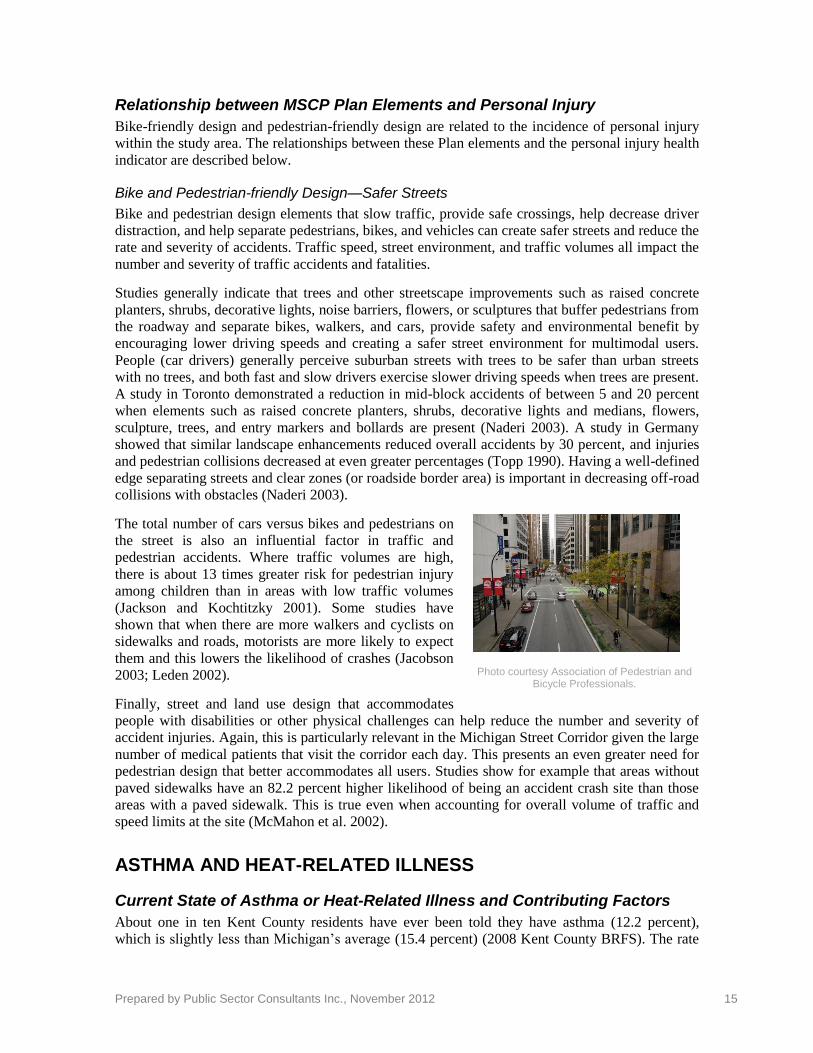
FUN FACT: How many pounds of fat
could a Grand Rapids resident burn if
he/she walked to work each day?
If you live in Fulton Heights and walk to and from the Helen DeVos Pediatric Specialty Clinic each day, you can lose 1 pound in 11 days, or 24 pounds per year.
Calculation based on the following: Walking 4 miles round-trip at a moderate speed of 3.0mph, and weight of 155lbs will burn 327 calories a day (State of Wisconsin 2005). People who weigh more are likely to burn more calories walking at the same speed.
Prepared by Public Sector Consultants Inc., November 2012 15
Relationship between MSCP Plan Elements and Personal Injury
Bike-friendly design and pedestrian-friendly design are related to the incidence of personal injury
within the study area. The relationships between these Plan elements and the personal injury health
indicator are described below.
Bike and Pedestrian-friendly Design—Safer Streets
Bike and pedestrian design elements that slow traffic, provide safe crossings, help decrease driver
distraction, and help separate pedestrians, bikes, and vehicles can create safer streets and reduce the
rate and severity of accidents. Traffic speed, street environment, and traffic volumes all impact the
number and severity of traffic accidents and fatalities.
Studies generally indicate that trees and other streetscape improvements such as raised concrete
planters, shrubs, decorative lights, noise barriers, flowers, or sculptures that buffer pedestrians from
the roadway and separate bikes, walkers, and cars, provide safety and environmental benefit by
encouraging lower driving speeds and creating a safer street environment for multimodal users.
People (car drivers) generally perceive suburban streets with trees to be safer than urban streets
with no trees, and both fast and slow drivers exercise slower driving speeds when trees are present.
A study in Toronto demonstrated a reduction in mid-block accidents of between 5 and 20 percent
when elements such as raised concrete planters, shrubs, decorative lights and medians, flowers,
sculpture, trees, and entry markers and bollards are present (Naderi 2003). A study in Germany
showed that similar landscape enhancements reduced overall accidents by 30 percent, and injuries
and pedestrian collisions decreased at even greater percentages (Topp 1990). Having a well-defined
edge separating streets and clear zones (or roadside border area) is important in decreasing off-road
collisions with obstacles (Naderi 2003).
The total number of cars versus bikes and pedestrians on
the street is also an influential factor in traffic and
pedestrian accidents. Where traffic volumes are high,
there is about 13 times greater risk for pedestrian injury
among children than in areas with low traffic volumes
(Jackson and Kochtitzky 2001). Some studies have
shown that when there are more walkers and cyclists on
sidewalks and roads, motorists are more likely to expect
them and this lowers the likelihood of crashes (Jacobson
2003; Leden 2002).
Finally, street and land use design that accommodates
people with disabilities or other physical challenges can help reduce the number and severity of
accident injuries. Again, this is particularly relevant in the Michigan Street Corridor given the large
number of medical patients that visit the corridor each day. This presents an even greater need for
pedestrian design that better accommodates all users. Studies show for example that areas without
paved sidewalks have an 82.2 percent higher likelihood of being an accident crash site than those
areas with a paved sidewalk. This is true even when accounting for overall volume of traffic and
speed limits at the site (McMahon et al. 2002).
ASTHMA AND HEAT-RELATED ILLNESS
Current State of Asthma or Heat-Related Illness and Contributing Factors
About one in ten Kent County residents have ever been told they have asthma (12.2 percent),
which is slightly less than Michigan’s average (15.4 percent) (2008 Kent County BRFS). The rate
Photo courtesy Association of Pedestrian and Bicycle Professionals.
Prepared by Public Sector Consultants Inc., November 2012 16
of asthma hospitalization from 2004 to 2006 in Kent county was 9.5 per
10,000 people, compared with the state rate of 16.6. The rate among
blacks, however, was almost four times that of whites (25.6 versus 7.2 per
10,000) (Asthma Initiative of Michigan Nd).
The Michigan Department of Environmental Quality, in partnership with
local health departments and other agencies, monitors air quality
throughout the state. There are two primary pollutants that affect
asthma—particulate matter and ground-level ozone. When levels of these
pollutants are predicted to be unhealthy for sensitive groups or worse on the Air Quality Index, the
state and its partners declare Action! Days. The greater Grand Rapids area has had 25 five Action!
Days in 2012, and had eight Action! Days in 2011. This is comparable to the Detroit, Benton
Harbor, and Ann Arbor areas, but well below Lansing and Kalamazoo, which have had one and
two Action! Days, respectively, in 2012 (MDEQ, MIair 2012).
In 2010, traffic counts along Michigan Street from Ottawa to Mayfield ranged from approximately
14,000 to 22,000 vehicles per day. Most traffic is focused in the central area of the corridor
between North Avenue and Sinclair Street near the I-196 interchange at College Ave. There is
public transit via the Rapid bus system that covers sections of Michigan Street (routes 13,19,and
14), but routes serve a very limited distance along the corridor.
In the downtown Grand Rapids area, the tree canopy is between 4 and 25 percent. Moving east
along the Michigan Street Corridor, the tree cover increases to 35 percent and eventually up to 46
percent at the far east end of the corridor. As Exhibit 13 shows, neighborhoods with the lowest
percentages of canopy include Heartside and Belknap Lookout (Vande Bunte, February 6, 2012).
Sun burn, heat exposure, and heat-related illness are associated with a lack of tree canopy in urban
areas.
Relationship between MSCP Plan Elements and Asthma or Heat-Related Illness
The incidence of asthma, respiratory disease, and heat related illness among the study area
population is related to bike-friendly design, pedestrian-friendly design, and vehicle emissions. The
relationships between these Plan elements and the asthma and air quality health indicator are
described below.
Asthma and heat related illness can be impacted by emissions of air pollutants from vehicles in the
corridor. Vehicle emissions can be reduced through greater use of public transportation and ride
sharing, as well as increased use of non-motorized transportation modes such as walking and
biking. Therefore, this health indicator also considers the relationship between bike and pedestrian-
friendly design Lack of shade and extreme temperatures can cause heat-related illness and risk as
well. These could be particular issues in the study corridor given the large vulnerable population of
health/medical patient visitors each day.
Vehicle Emissions—Healthier Air
Vehicles emit air pollutants such as particulate matter, carbon monoxide, volatile organic
compounds and oxides of nitrogen that can impact asthma. Air pollution from roadways is
responsible for millions of respiratory-related restricted activity days, (most of which can be
attributed to particulate matter alone), headaches, chronic respiratory illness, cancer, and premature
death (McCubbin 1995, Jackson and Kochtitzky 2001). “Motor vehicle air quality impacts result in
50-70 million days of restricted levels of activity; 20,000-46,000 cases of chronic respiratory
illness; 40,000 premature deaths” (EPA 2001, p. 28).
Prepared by Public Sector Consultants Inc., November 2012 17
This is a particular issue for vulnerable populations, such as children and low income communities.
Asthma is the leading chronic condition among children in the United States, and it is estimated
that in 2010, seven million children 17 years of age and under currently have asthma (Moorman et
al. 2012). The East Bay Children’s Respiratory Health Study showed that California school
children living within 75 meters of a major road had an increased risk of lifetime asthma, prevalent
asthma, and wheezing. Even in areas with
good regional air quality, local air pollution
from nearby traffic may be associated with
risks to children’s respiratory health (Kim et
al. 2004).
Land-use and transportation policies often do
not protect children or other high-risk
populations from air pollution associated with
traffic from automobiles and proximity to
high-volume roadways. Minorities and low-
income communities typically inherit the risks
associated with poor land-use policy due to
their lack of educated leaders, political power,
and financial resources to afford housing in
more desirable areas (Rhodes 2003).
Land use that promotes proximity between
housing and jobs, such as the housing infrastructure and incentive elements of the MSCP, has been
shown to reduce vehicle miles traveled. Cervero and Duncan found that access to jobs (closer
proximity within a 4 mile radius) has been shown to more effectively reduce vehicle miles traveled
and vehicle hours traveled almost 88 percent more than access to shopping and services, though
both are associated with decreases in miles traveled and time spent traveling (Duncan and Cervero
2006).
As employment in the Michigan Street corridor grows, alternatives that create stronger jobs-
housing balance could help address air pollution and associated health issues. Other communities
have attempted to balance job and housing growth by shifting zoning from commercial to
residential and mandating affordable housing. Palo Alto created a Below Market Rate (BMR)
Program to require at least 10 percent of housing units of new developments of 10 or more units
must be affordable to low- and moderate-income households (Duncan and Cervero 2006).
Tree Canopy—Cooler Temperatures, Cleaner Air
Urban heat islands can be a risk factor for heat-related illnesses, especially among vulnerable
populations such as children and seniors. Heat islands can result from built up areas without shade,
trees, soil, or plants available to absorb the sun’s heat. Studies have shown that parks within cities
can have cooler temperatures by 2 degrees Fahrenheit during the day. The larger the park, and the
more trees it has, the greater the cooling effect (Bowler et al. 2010). Trees are able to filter
pollutants, increase oxygen production, and reduce carbon dioxide. Tree canopies can provide
natural shade, lower temperatures, alter emissions from building energy use, and reduce UV
exposure and the risk of skin cancer. Research has shown that the increase in tree cover from none
to some, versus some to a lot, is much more significant in decreasing exposure to UV-B rays (Grant
et al. 2002; Nowak et al. 2010).
Tree cover can also help address air pollution-related asthma. A study in New York City
demonstrated that children living in areas with more street trees have a lower prevalence of asthma
compared with children living in areas with fewer trees (Lovasi et al. 2008). There is more research
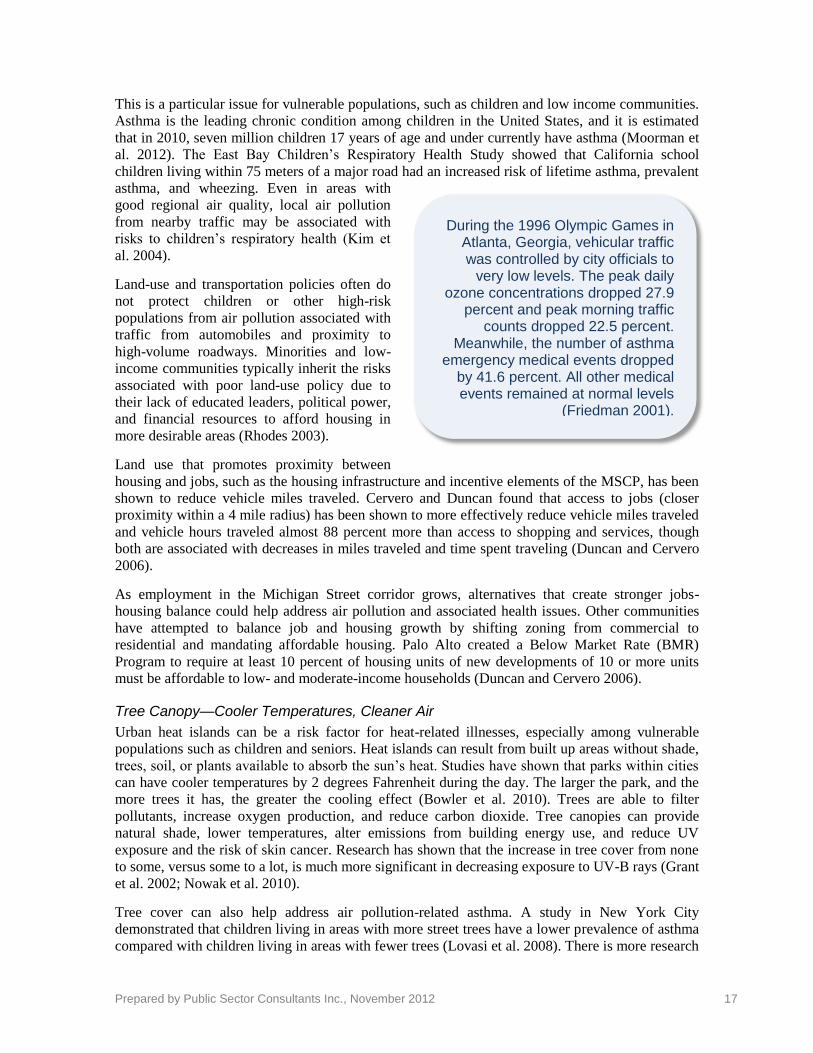
During the 1996 Olympic Games in Atlanta, Georgia, vehicular traffic was controlled by city officials to
very low levels. The peak daily ozone concentrations dropped 27.9
percent and peak morning traffic counts dropped 22.5 percent.
Meanwhile, the number of asthma emergency medical events dropped
by 41.6 percent. All other medical events remained at normal levels
(Friedman 2001).
Prepared by Public Sector Consultants Inc., November 2012 18
needed to evaluate whether a causal relationship exists between the number of trees and asthma.
This planning project in Grand Rapids presents an excellent opportunity to conduct a prospective
evaluation of the impact on early childhood asthma. Planning for more green space and trees
throughout the corridor can save money that would otherwise be spent on air pollution mitigation
(City of Grand Rapids 2011). Landscaping with trees also makes economic sense, since property
values and commercial benefits can increase. One study found that planting trees costs less than
creating more energy efficient appliances or fuel-efficient cars. A pound of CO2 costs .3 to 1.3
cents per tree, 2.5 cents for energy efficiency; and 10 cents for fuel-efficient cars According to
American Forests, a national nonprofit conservation organization, one acre of trees has the
potential to use 2.6 tons of CO2 each year (Alaska Dept. of Natural Resources 1999).
Prepared by Public Sector Consultants Inc., November 2012 19
Recommended Policies and Infrastructure Elements
Based on the findings from the assessment, the land use, transportation, and green infrastructure
scenario alternatives under consideration for the MSCP could provide some significant health
benefits for people living in and visiting the corridor. While each of the proposed alternatives has
various levels of health impacts, some plan elements offer greater opportunities than others.
The draft recommendations for the MSCP below were identified by PSC and the Steering
Committee as those that are evidence-based, feasible, and likely to have the greatest positive
impact on any one or more of the four priority health indicators.
Accommodate all modes of transportation, and especially enhance mobility for individuals
with disabilities. Streets should be for everyone. Use building codes and roadway designs that
promote designs that accommodate people with compromised mobility and disabled
community residents. This will allow for more participation among everyone in the community
and will not isolate certain groups or populations.
Along Michigan Street itself, ensure walkability over bikeability. As neighborhoods become
less dense moving east from downtown, provide mid-block crossings for safe road-crossing.
Surrounding neighborhoods may be the safest and most comfortable place for bicyclists,
keeping them off arterial roads with speeding cars or congested traffic. This will ease stress and
improve safety for bicyclists and drivers alike.
Provide zoning and economic development incentives that attract one or more options for
healthy food access in the corridor. This could include extended hours or facilities for the
existing farmers market and/or helping to locate a full-size, full-
service grocery store in the study area and closest to the northwest
area of food insecurity.
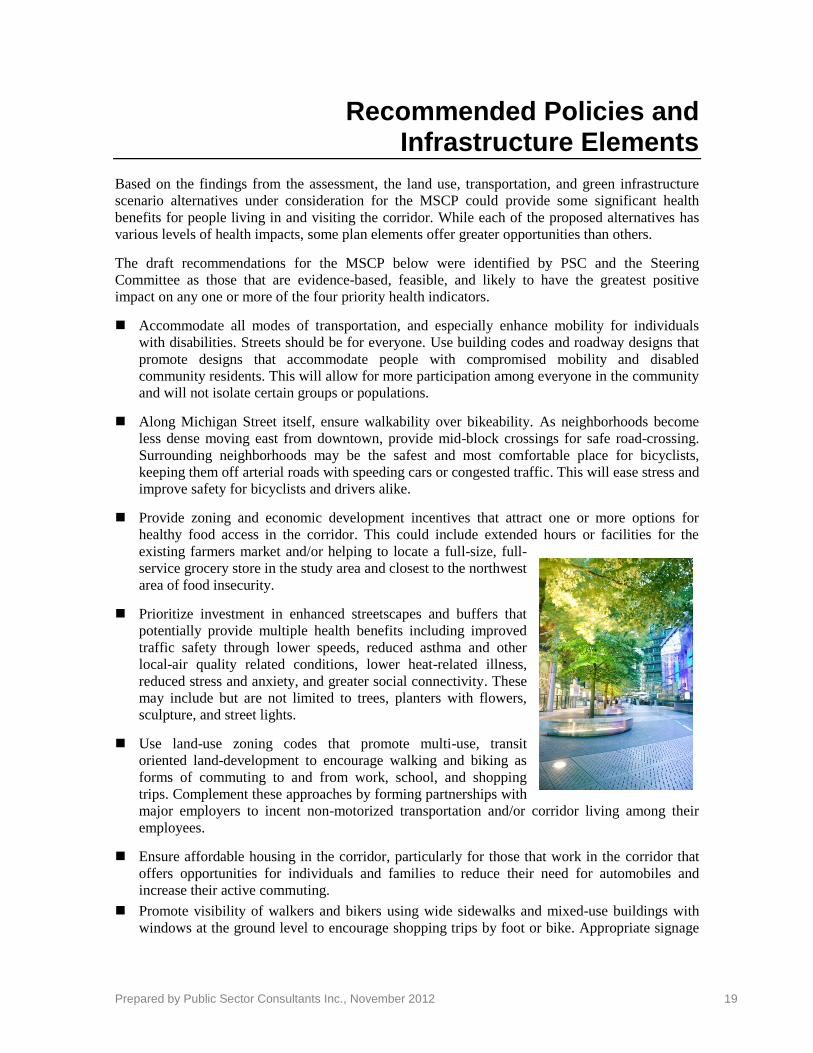
Prioritize investment in enhanced streetscapes and buffers that
potentially provide multiple health benefits including improved
traffic safety through lower speeds, reduced asthma and other
local-air quality related conditions, lower heat-related illness,
reduced stress and anxiety, and greater social connectivity. These
may include but are not limited to trees, planters with flowers,
sculpture, and street lights.
Use land-use zoning codes that promote multi-use, transit
oriented land-development to encourage walking and biking as
forms of commuting to and from work, school, and shopping
trips. Complement these approaches by forming partnerships with
major employers to incent non-motorized transportation and/or corridor living among their
employees.
Ensure affordable housing in the corridor, particularly for those that work in the corridor that
offers opportunities for individuals and families to reduce their need for automobiles and
increase their active commuting.
Promote visibility of walkers and bikers using wide sidewalks and mixed-use buildings with
windows at the ground level to encourage shopping trips by foot or bike. Appropriate signage
Prepared by Public Sector Consultants Inc., November 2012 20
for cycling routes and crosswalks for pedestrians can assist in way-finding and signal motorists
to be aware of people traveling by non-motorized means.
Overall, the final corridor plan should be designed around people first, and automobiles second.
Based on corridor resident preferences and the likely impacts of transportation, land-use, and
housing infrastructure, we suggest all of the above recommendations be considered through a
human experience perspective. By implementing these measures to improve health in the corridor
in conjunction with its sustainability and development planning, the City of Grand Rapids will
provide for a greater quality of life such that more people will want and be able to live, work, and
play within the Michigan Street Corridor.
Prepared by Public Sector Consultants Inc., November 2012 21
Monitoring
As the MSCP planning process continues, the HIA project team will be responsible for integrating
HIA recommendations into the final selected scenario alternatives. As the plan moves into the
implementation phase in the spring of 2013, the Project Team will assess which recommendations
have been implemented and what the impacts are, if any, on the health metrics and indicators
described in this report. This project has already increased awareness among the City of Grand
Rapids, MSCP Steering Committee, and other stakeholders of the broader health implications of
development scenario alternatives. This may lead the City, developers, and funders to ensure that
health impacts are fully integrated into any future plans or projects in the Michigan Street Corridor
or in Grand Rapids.
Prepared by Public Sector Consultants Inc., November 2012 22
References
Alaska Department of Natural Resources, Division of Forestry. 1999. Trees and Forests Improve
the Urban Environment. Available online at:
www.dnr.state.ak.us/forestry/pdfs/Trees_improve_environ.pdf. [Accessed 11-13-12.]
Asthma Initiative of Michigan (AIM). Nd. AIM website. Available at:
http://www.getasthmahelp.org/county-asthma-statistics.aspx?couID=41. [Online, accessed
11/19/12].
Besser L.M., and A.L. Dannenberg. 2005. Walking to Public Transit: Steps to Help Meet Physical
Activity Recommendations. American Journal of Preventative Medicine 29(4): 273-80.
Bhatia, Rajiv. 2011. Health Impact Assessment: A Guide for Practice. Oakland, Calif.: Human
Impact Partners.
Bowler D.E., L. Buyung-Ali, T.M. Knight, and A.S. Pullin. 2010. Urban Greening to Cool Towns
and Cities: A Systematic Review of the Empirical Evidence. Landscape and Urban
Planning 97: 147-55.
Canadian Public Health Association. 2007. Health Effects of Climate Change and Air Pollution.
List from various sources, including Health Canada, Environment Canada, and the David
Suzuki Foundation. Available online at: www.ccah.cpha.ca/effects.htm. [Accessed 11-13-
12.]
Cervero R. 1991. Congestion Relief: The Land Use Alternative. Journal of Planning Education
and Research 10: 119-28.
City of Grand Rapids Planning Department. N.d. Background Information: About the Plan.
Available online at: http://grcity.us/design-and-development-services/Planning-
Department/michiganstreetcorridor/Documents/About%20The%20plan.pdf. [Accessed 11-
13-12.]
_____. October 2011. Green Grand Rapids. Available online at: http://grcity.us/design-and-
development-services/Planning-
Department/Documents/Green_Grand_Rapids_Report_LowRez_2011_10_04.pdf.
[Accessed 11-13-12.]
_____. October 29, 2012. Form and Function Community Forum Presentation. Available online at:
www.slideshare.net/slideshow/embed_code/14971529. [Accessed 11-13-12.]
City of Grand Rapids Traffic Engineering Division. December, 2012. Personal communication.
Cohen R. 2007. The Positive Impacts of Affordable Housing on Health: A Research Summary.
Enterprise Community Partners and The Center for Housing Policy. Available online at:
http://chispahousing.org/docs/The%20Positive%20Impacts%20of%20Affordable%20Hous
ing%20on%20Health.pdf. [Accessed 11-13-12.]
Duncan M., and R. Cervero. 2006. Which Reduces Vehicle Travel More: Jobs-Housing Balance or
Retail-Housing Mixing? Journal of the American Planning Association 72(4): 475-90.
Available online at: www.reconnectingamerica.org/assets/Uploads/UTCT-825.pdf.
[Accessed 11-13-12.]
Prepared by Public Sector Consultants Inc., November 2012 23
Ewing R., L. Frank, and R. Kreutzer. 2006. Understanding the Relationship between Public
Health and the Built Environment: A Report for the LEED-ND Core Committee. Available
online at: www.usgbc.org/ShowFile.aspx?DocumentID=3901. [Accessed 11-13-12.]
Feeding America. Map the Meal Gap: Child Food Insecurity 2011. Available online at:
http://feedingamerica.org/hunger-in-america/hunger-studies/map-the-meal-
gap/~/media/Files/research/map-meal-gap/ChildFoodInsecurity_ExecutiveSummary.ashx.
[Accessed 11-13-12.]
Frank L, M.A. Andresen, and T.L. Schmid. 2004. Obesity Relationships with Community Design,
Physical Activity, and Time Spent in Cars. American Journal of Preventive Medicine
27(2): 87-96.
Frank, L., T. Schmid, J. Sallis et al. 2005. Linking Objectively Measured Physical Activity with
Objectively Measured Urban Form. American Journal of Preventive Medicine 28(2S2):
117-25.
Friedman, M.S. et al. 2001. Impact of Changes in Transportation and Commuting Behaviors during
the 1996 Summer Olympic Games in Atlanta on Air Quality and Childhood Asthma.
JAMA 285: 897-905.
Frumkin, H. 2001. Beyond Toxicity: The Greening of Environmental Health. American Journal of
Preventive Medicine 20: 234–40.
———. 2003. Healthy Places: Exploring the Evidence. American Journal of Public Health 93(9):
1451–56. Available online at
http://www.ncbi.nlm.nih.gov/pmc/articles/PMC1447992/pdf/0931451.pdf.\. [Accessed 11-
13-12.]
Grant R, Heisler G, Gao W. 2002. Estimation of Pedestrian Level UV exposure under trees.
Photochemistry and Photobiology 75(4):369-376.
Handy, S. Understanding the Link between Urban Form and Non-work Traveling Behavior. 1996.
Journal of Planning and Education Research 15: 183-98.
Haughey, R.M. 2003. The Case for Multifamily Housing. 2nd ed. Washington, D.C.: ULI–the
Urban Land Institute.
Jackson, R.J., and C. Kochtitzky. 2001. Creating a Healthy Environment: The Impact of the Built
Environment on Public Health. Sprawl Watch Clearinghouse, Washington, D.C. Available
online at: www.sprawlwatch.org/health.pdf. [Accessed 11-13-12.]
Jacobsen, P.L. 2003. Safety in Numbers: More Walkers and Bicyclists, Safer Walking and
Bicycling. Injury Prevention 9: 205-09. Available online at:
http://injuryprevention.bmj.com/content/9/3/205.full.pdf+html. [Accessed 11-13-12.]
Kim, J.J., S. Smorodinsky, M. Lipsett et al. 2004. Traffic-related Air Pollution and Respiratory
Health: East Bay Children's Respiratory Health Study. American Journal of Respiratory
and Critical Care Medicine 170: 520-26.
Kling, Jeffrey R., Jeffrey B. Liebman, and Lawrence F. Katz. 2006. Experimental Analysis of
Neighborhood Effects. Available online at: www.nber.org/mtopublic/mto_exp.pdf .
[Accessed 11-13-12.]
Prepared by Public Sector Consultants Inc., November 2012 24
Kuo, F.E., W.C. Sullivan, R.L. Coley et al. 1998. Fertile Ground for Community: Inner-City
Neighborhood Common Spaces. American Journal of Community Psychology 26: 823-851.
Available online at:
www.willsull.net/William_Sullivan/Publications_files/Kuo,%20Sullivan,%20Coley,%20B
runson%201998.pdf. [Accessed 11-13-12.]
Leden, L. 2002. Pedestrian Risk Decrease with Pedestrian Flow. A Case Study Based on Data from
Signalised Intersections in Hamilton, Ontario. Accident Analysis and Prevention 34: 457–
64.
Lovasi, G.S., J.W. Quinn, K.M. Neckerman et al. 2008. Children Living in Areas with More Street
Trees Have Lower Prevalence of Asthma. Journal of Epidemiology and Community Health
62: 647-49. Available online at:
www.sfrc.ufl.edu/urbanforestry/Resources/PDF%20downloads/Lovasi_2008.pdf.
[Accessed 11-13-12.]
Lund, Hollie, Robert Cervero, and Richard Willson. January 2004. Travel Characteristics of
Transit-Oriented Development in California. Available:
http://www.bart.gov/docs/planning/travel_of_tod.pdf. [Online, accessed 11/19/12].
Marshall, N. September 2012. Michigan Street Project Modeling Update-Draft. Smart Mobility.
Available: http://grcity.us/design-and-development-services/Planning-
Department/michiganstreetcorridor/Documents/SMI%20Modeling%20update%209-26-
12%20SC%20v3.pdf. [Accessed 11-13-12.]
McCubbin, D., and M. Delucchi. 1999. The Health Costs of Motor-Vehicle–Related Air Pollution.
Journal of Transport Economics and Policy 33(3): 253-86.
McMahon, P., C. Zegeer, C. Duncan et al. February 2002. An Analysis of Factors Contributing to
“Walking Along Roadway” Crashes: Research Study and Guidelines for Sidewalks and
Walkways. Report No. FHWA-RD-01-101. University of North Carolina Highway Safety
Research Center, Chapel Hill, NC. Available online at:
www.walkinginfo.org/pdf/r&d/SidewalkReport.pdf. [Accessed 11-13-12.]
Michigan Department of Community Health (MDCH). 2011. Michigan BRFS Regional & Local
Health Department Estimates, 2008-2010. Available online at:
www.michigan.gov/documents/mdch/2008-
2010_MiBRFS_Reg__LHD_Tables_FINAL_351398_7.pdf. [Accessed 11-13-12.]
Michigan Department of Environmental Quality (MDEQ). MIair Action! Days. Available online
at: www.deqmiair.org/actionday.cfm. [Accessed 11-13-12.]
Michigan Public Health Institute [MPHI]. 2011 Community Health Needs Assessment and Health
Profile. Available online at: www.kentcountychna.org. [Accessed 11-13-12.]
Michigan Traffic Crash Facts. Data Query Tool. City of Grand Rapids. Available online at:
www.michigantrafficcrashfacts.org/datatool/build. [Accessed 11-13-12.]
Moorman JE, Akinbami LJ, Bailey CM, et al. 2012. National Surveillance of Asthma: United
States, 2001–2010. National Center for Health Statistics. Vital Health Stat 3(35).
Available: http://www.cdc.gov/nchs/data/series/sr_03/sr03_035.pdf. [Online, accessed
11/19/12].
Prepared by Public Sector Consultants Inc., November 2012 25
Morland, K., S. Wing, Roux A, Diez et al. 2002. Access to Healthy Foods Limited in Poor
Neighborhoods. American Journal of Preventive Health 22(1): 23-29.
Naderi, J.R. 2003. Landscape Design in the Clear Zone: Effect of Landscape Variables on
Pedestrian Health and Driver Safety. Transportation Research Record 1851: 119-30.
Available online at: http://aggie-
horticulture.tamu.edu/syllabi/435/articles/naderi%20article.pdf. [Accessed 11-13-12.]
Naderi, J.R., B.S. Kweon, and P. Maghelal. February 2008. The Street Tree Effect and Driver
Safety. ITE Journal on the Web. Available online at:
www.naturewithin.info/Roadside/Tree&Driver_ITE.pdf. [Accessed 11-13-12.]
Nelson, Donna C. 2000. Intelligent Transportation Primer. U.S. Federal Highway Administration,
Institute of Transportation Engineers, Washington, D.C.
Nowak, DJ, SM Stein, PB Randler, EJ Greenfield, SJ Comas, MA Carr, and RJ Alig. 2010.
Sustaining America's Urban Trees and Forests: A Forests on the Edge Report. USDA
Forest Service General Technical Report NRS-62. Newtown Square, PA: USDA Forest
Service Northern Research Station. Available:
http://www.fs.fed.us/openspace/fote/reports/nrs-62_sustaining_americas_urban.pdf.
[Online, accessed 11/19/12].
Pretty, J, R. Hine, and J. Peacock. 2006. Green Exercise: The Benefits of Activities in Green
Places. Biologist 53 (3): 143-48.
Pucher J., R. Buehler, D.R. Bassett et al. 2010. Walking and Cycling to Health: A Comparative
Analysis of City, State, and International Data. American Journal of Public Health 100
(10): 1986-92.
Putnam, R.D. 2000. Bowling Alone: The Collapse and Revival of American Community. New
York: Simon and Schuster.
Rhodes, Edwardo Lao. 2003. Environmental Justice in America. Bloomington, Ind.: Indiana
University Press.
Schweitzer J.H., J.W. Kim, and J.R. Mackin. 1999. The Impact of the Built Environment on Crime
and Fear of Crime in Urban Neighborhoods. Journal of Urban Technology 6 (3): 59-83.
Singapore National Crime Prevention Council. 2003. Crime Prevention through Environmental
Design: Guidebook. Available online at: www.ncpc.gov.sg/pdf/CPTED Guidebook.pdf.
[Accessed 11-13-12.]
Smith, L.H., K. Borch-Johnsen, and T. Jørgensen. 2007. Commuting Physical Activity Is
Favorably Associated with Biological Risk Factors for Cardiovascular Disease. European
Journal of Epidemiology 22 (11): 771-79.
State of Wisconsin. 2005. Calories Burned Per Hour. Department of Health and Family Services,
Division of Public Health. Available online at:
www.dhs.wisconsin.gov/health/physicalactivity/pdf_files/caloriesperhour.pdf. [Accessed
11-13-12.]
Stigsdotter, U.K., O. Ekholm, J. Schipperijn et al. 2010. Health Promoting Outdoor Environments -
Associations between Green Space and Health, Health-Related Quality of Life, and Stress
Prepared by Public Sector Consultants Inc., November 2012 26
Based on a Danish National Representative Survey. Scandinavian Journal of Public Health
38 (4): 411-17.
Topp, H.H. 1990. Traffic Safety, Usability and Streetscape Effects of New Design Principles for
Major Urban Roads. Transportation 16: 297–310.
Troutt, D.D. 1993. The Thin Red Line: How the Poor Still Pay More. San Francisco Calif.:
Consumer's Union, West Coast Regional Office.
U3 Ventures. September 2011. Initial Study Findings: Anchor Analysis. Available online at:
http://grcity.us/design-and-development-services/Planning-
Department/michiganstreetcorridor/Documents/9%2028%202011,%20MSCP%20Steering
%20Committe,%20U3%20Ventures%20Initial%20Study%20Findings.pdf. [Accessed 11-
13-12.]
Ulrich, R.S., and D.L. Addoms. 1981. Psychological and Recreational Benefits of a Residential
Park. Journal of Leisure Research 13: 43–65.
U.S. Department of Agriculture (USDA). August 23, 2012. Food Desert Locator. Available online
at: www.ers.usda.gov/data-products/food-desert-locator/go-to-the-locator.aspx. [Accessed
11-13-12.]
U.S. Department of Housing and Urban Development (HUD), Sustainable Communities Regional
Planning Grants. 2012. Available online at:
http://portal.hud.gov/hudportal/HUD?src=/program_offices/sustainable_housing_communi
ties/sustainable_communities_regional_planning_grants. [Accessed 11-13-12.]
U.S. Environmental Protection Agency (EPA). 2001. Our Built and Natural Environments.
Washington, DC: U.S. EPA. EPA 231-R-01-002, p. 28. Available:
http://www.epa.gov/dced/pdf/built.pdf. [Online, accessed 11/20/12].
_____. 1997. Climate Change and Public Health. U.S. Office of Policy, Environmental Protection
Planning and Evaluation Agency. EPA Report 236-F-97_005.
Vallianatos, M., A. Shaffer, and R. Gottlieb. 2002. Transportation and Food: The Importance of
Access. Center for Food and Justice, Urban and Environmental Policy Institute. Available
online at: http://eatbettermovemore.org/sa/pdf/transportation_and_food.pdf. [Accessed 11-
13-12.]
Vande Bunte, Matt. February 6, 2012. Grand Rapids to Plant Trees, Rewrite Tree Laws in Effort to
Increase Urban Canopy. Available online at: www.mlive.com/news/grand-
rapids/index.ssf/2012/02/grand_rapids_to_plant_trees_re.html. [Accessed 11-13-12.]
Walkscore.com. 2012. Cities and Neighborhoods. Available online at:
www.walkscore.com/MI/Grand_Rapids/Heartside. [Accessed 11-13-12.]
Williams, David and Chiquitta Collins. 2001. Racial Residential Segregation: A Fundamental
Cause of
Racial Disparities in Health. Public Health Reports, September–October 2001, Volume 116.
Available: http://www.ncbi.nlm.nih.gov/pmc/articles/PMC1497358/pdf/12042604.pdf.
[Online, accessed 11/18/12].
World Health Organization (WHO). Health Indicators of Sustainable Cities. May 2012.
www.who.int/hia/green_economy/indicators_cities.pdf. [Accessed 11-13-2012.]

Prepared by Public Sector Consultants Inc., November 2012 27
———. 2012. Health Impact Assessment (HIA). Available online at: www.who.int/hia/en/.
[Accessed 11-13-12.]