Embed Size (px)
Citation preview
Mid-Course AdjustmentOverview
Flood Map ModernizationThe Question The Question
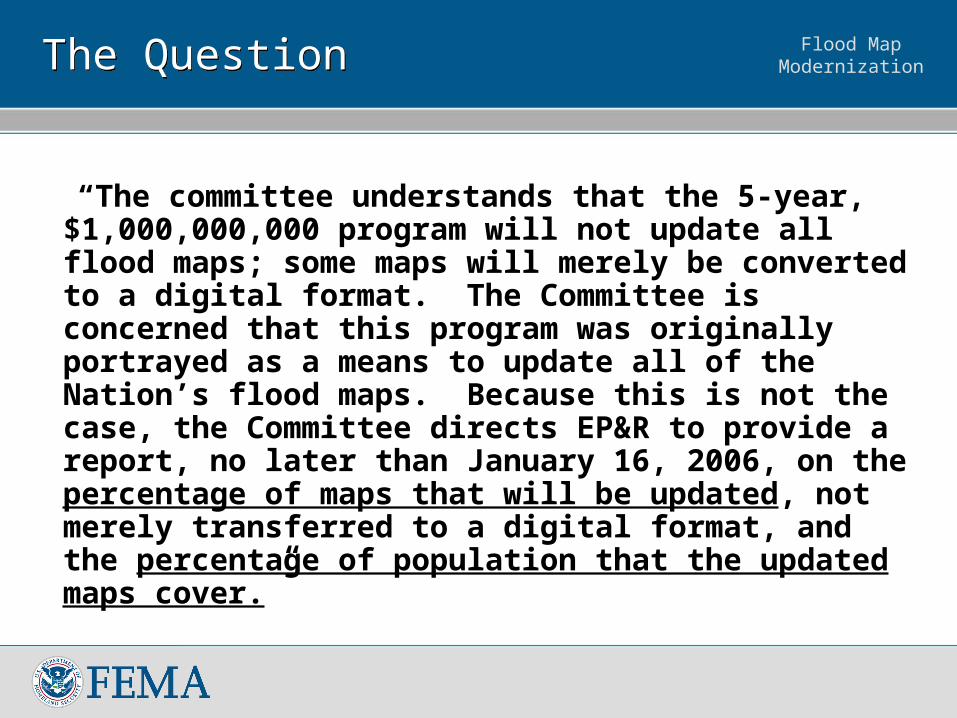
“The committee understands that the 5-year, $1,000,000,000 program will not update all flood maps; some maps will merely be converted to a digital format. The Committee is concerned that this program was originally portrayed as a means to update all of the Nation’s flood maps. Because this is not the case, the Committee directs EP&R to provide a report, no later than January 16, 2006, on the percentage of maps that will be updated, not merely transferred to a digital format, and the percentage of population that the updated maps cover.”
Flood Map Modernization2006 Congressional Report2006 Congressional Report
Delivered to Congress February 2006
Describes the Status of Map Modernization as of Sept 30, 2005
Describes Mid-Course Adjustment
Flood Map Modernization
2006 Mid-Course Adjustment Report2006 Mid-Course Adjustment Report
Detailed description of Mid-Course Adjustment Report
Provides supporting documentation for the Congressional report
Flood Map ModernizationBackgroundBackground
Rationale for Review and Adjustment:
• Midpoint review appropriate on large initiative
• Introduction of floodplain boundary standard
• Stakeholder request for additional engineering
Flood Map ModernizationBackgroundBackground
Rationale for Review and Adjustment:
• Lessons learned from State business plans and recent disasters
• Updates will occur on a sub-county basis prioritized by risk
• The goal of mapping the Nation remains, but is delayed
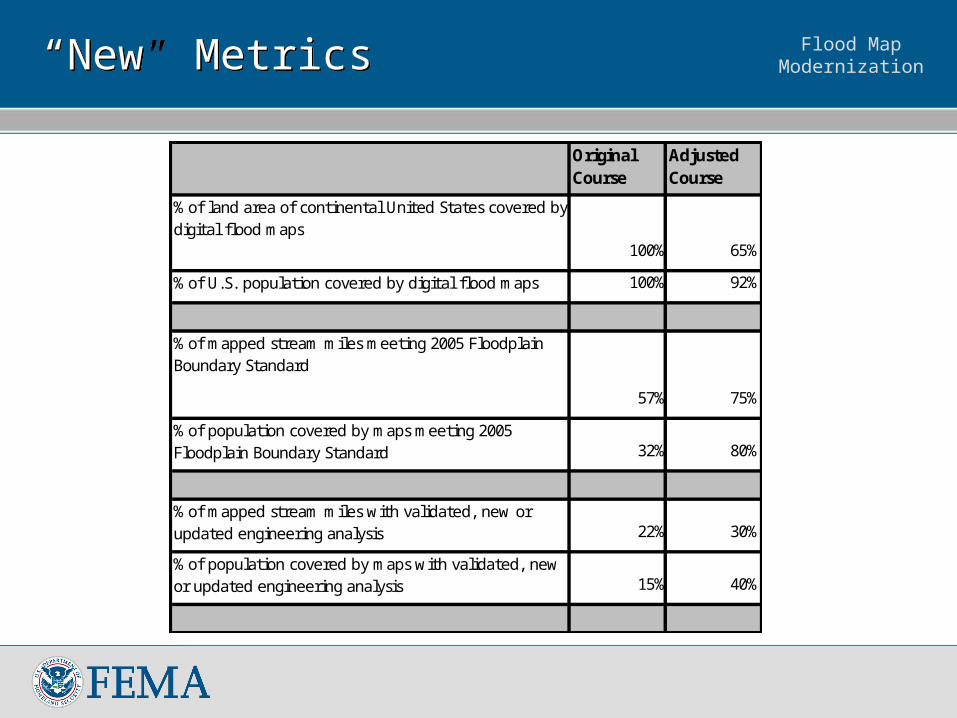
Flood Map Modernization“New” Metrics“New” Metrics
Original Course
Adjusted Course
% of land area of continental United States covered by digital flood maps
100% 65%
% of U.S. population covered by digital flood maps 100% 92%
% of mapped stream miles meeting 2005 Floodplain Boundary Standard
57% 75%
% of population covered by maps meeting 2005 Floodplain Boundary Standard 32% 80%
% of mapped stream miles with validated, new or updated engineering analysis 22% 30%
% of population covered by maps with validated, new or updated engineering analysis 15% 40%
Flood Map ModernizationBenefitsBenefits
• Provide more detail in high risk flood prone areas
• Action is responsive to:
Congress (quality vs. quantity)
Stated Map Coalition positions
Needs as identified through State business planning process
Flood Map ModernizationPotential ImplicationsPotential Implications
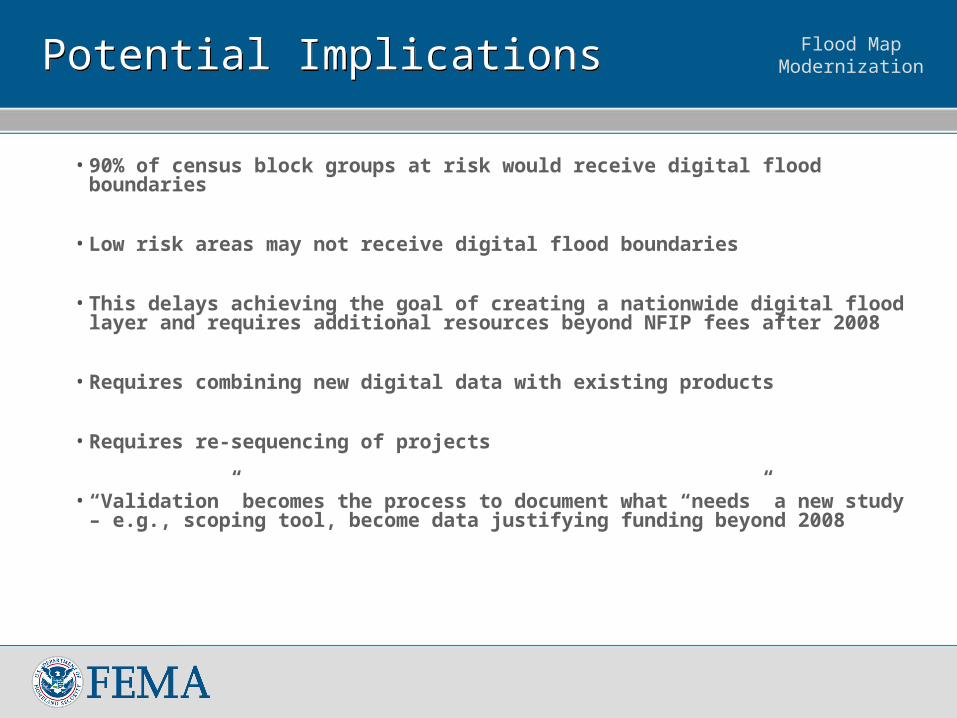
• 90% of census block groups at risk would receive digital flood boundaries
• Low risk areas may not receive digital flood boundaries
• This delays achieving the goal of creating a nationwide digital flood layer and requires additional resources beyond NFIP fees after 2008
• Requires combining new digital data with existing products
• Requires re-sequencing of projects
• “Validation” becomes the process to document what “needs” a new study – e.g., scoping tool, become data justifying funding beyond 2008
Flood Map Modernization
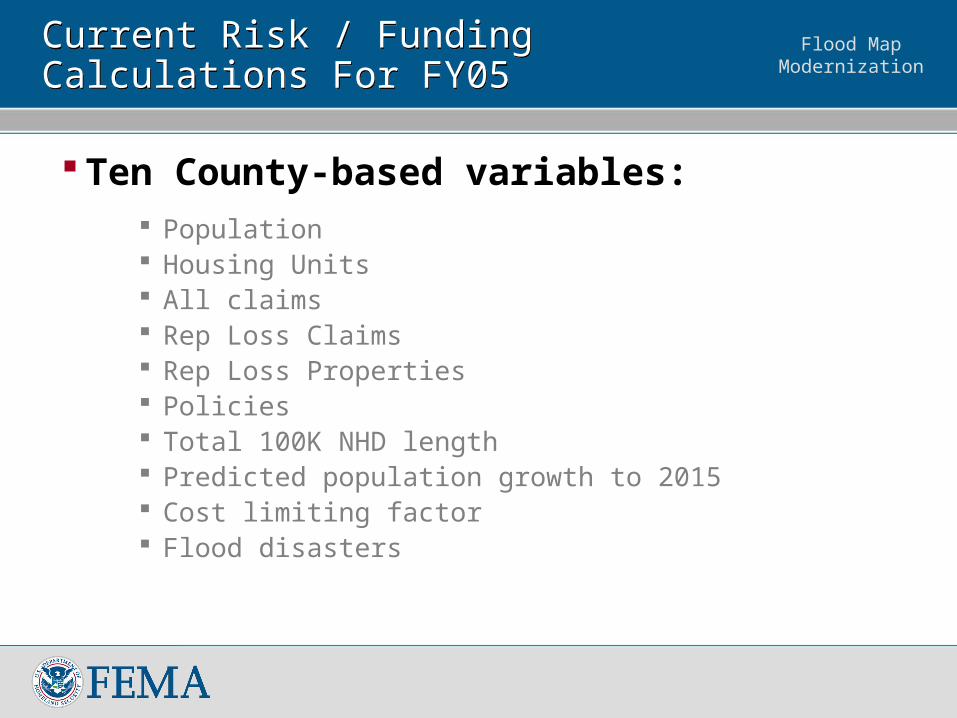
Current Risk / Funding Calculations For FY05Current Risk / Funding Calculations For FY05
Ten County-based variables: Population Housing Units All claims Rep Loss Claims Rep Loss Properties Policies Total 100K NHD length Predicted population growth to 2015 Cost limiting factor Flood disasters
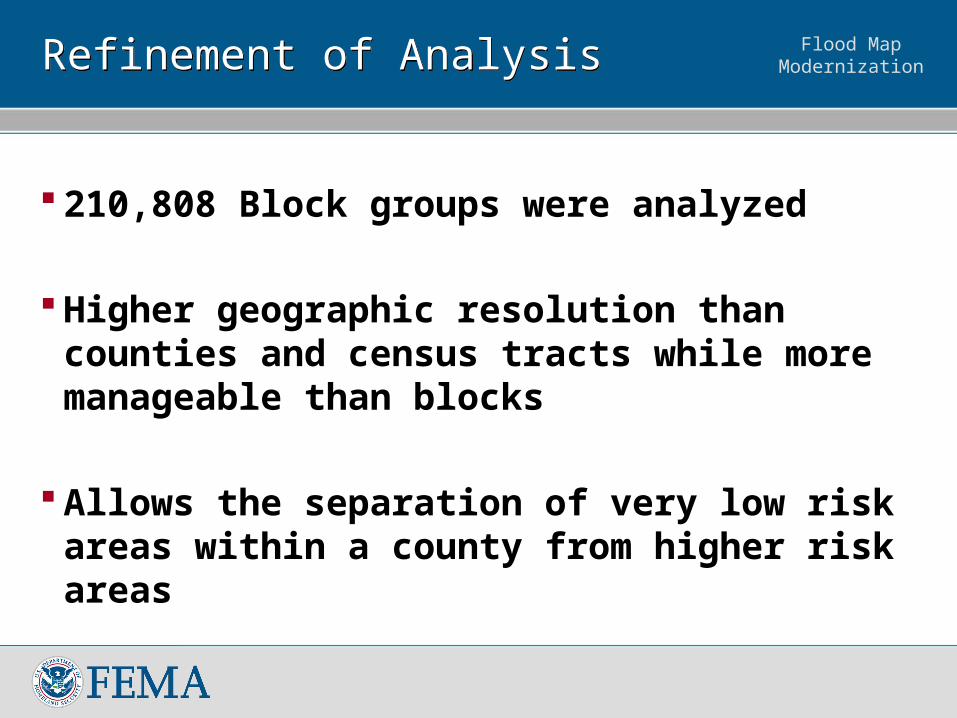
Flood Map ModernizationRefinement of AnalysisRefinement of Analysis
210,808 Block groups were analyzed
Higher geographic resolution than counties and census tracts while more manageable than blocks
Allows the separation of very low risk areas within a county from higher risk areas
Flood Map Modernization
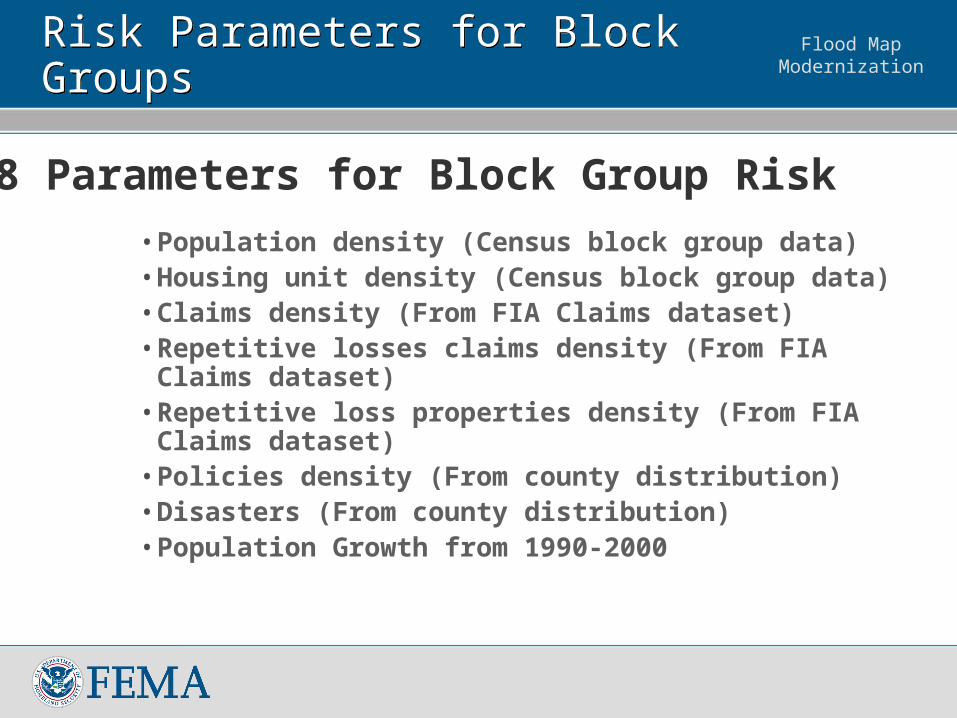
Risk Parameters for Block GroupsRisk Parameters for Block Groups
• Population density (Census block group data)• Housing unit density (Census block group data)• Claims density (From FIA Claims dataset)• Repetitive losses claims density (From FIA Claims
dataset)• Repetitive loss properties density (From FIA Claims
dataset)• Policies density (From county distribution)• Disasters (From county distribution)• Population Growth from 1990-2000
8 Parameters for Block Group Risk
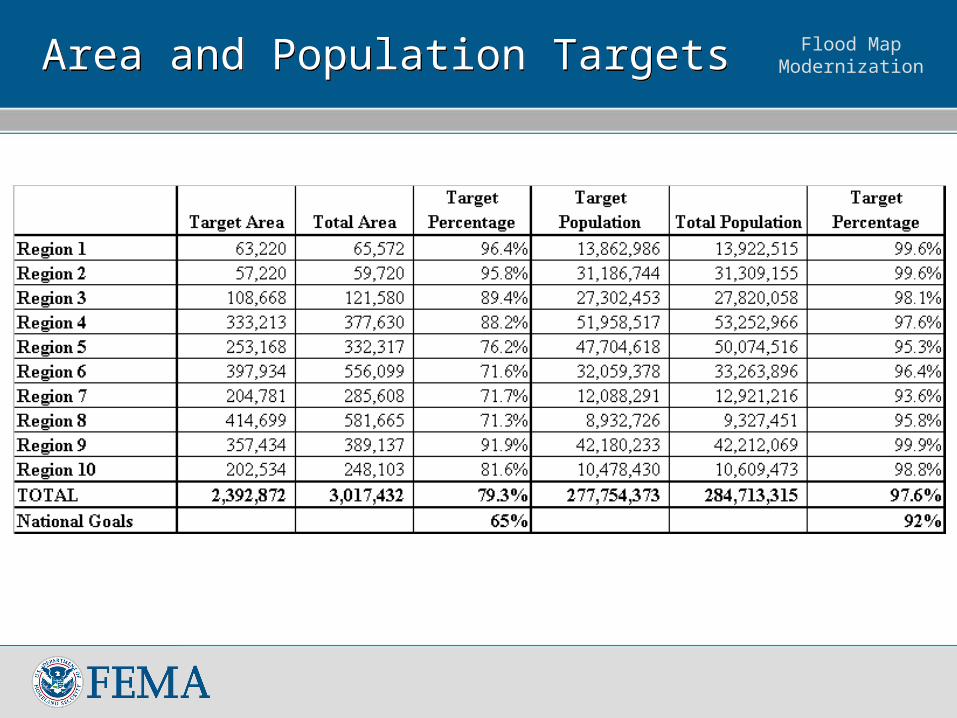
Flood Map ModernizationArea and Population TargetsArea and Population Targets
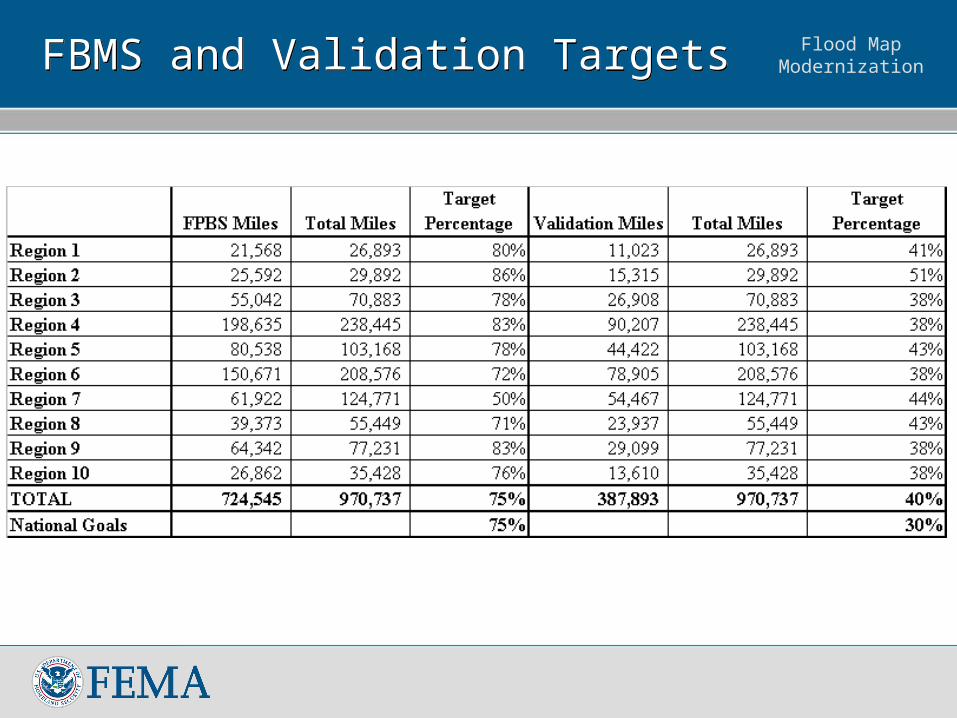
Flood Map ModernizationFBMS and Validation TargetsFBMS and Validation Targets
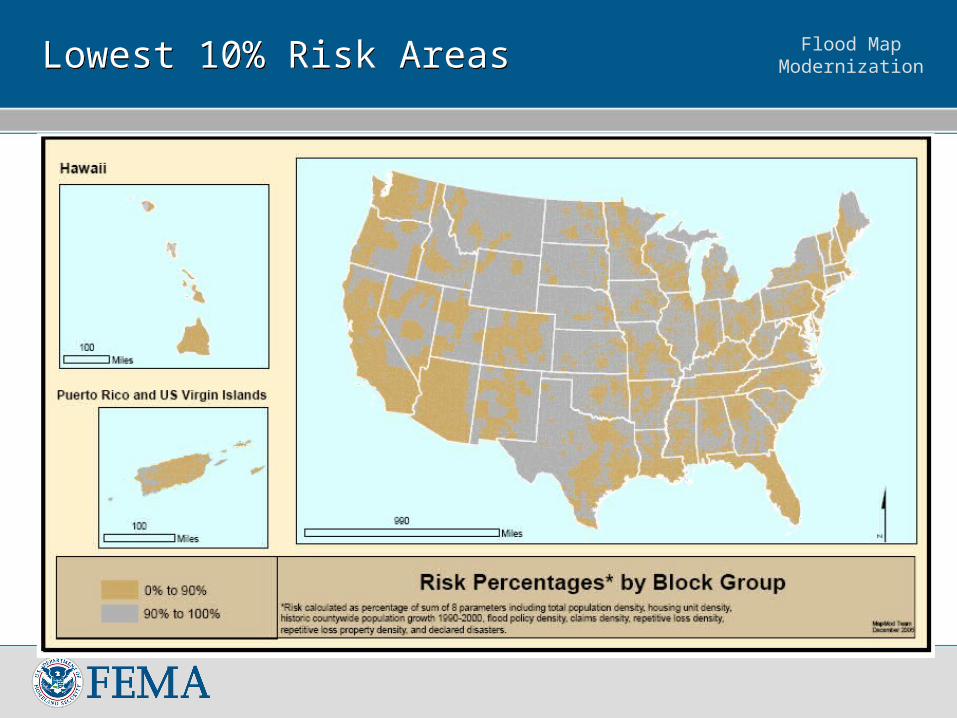
Flood Map ModernizationLowest 10% Risk AreasLowest 10% Risk Areas
Flood Map Modernization
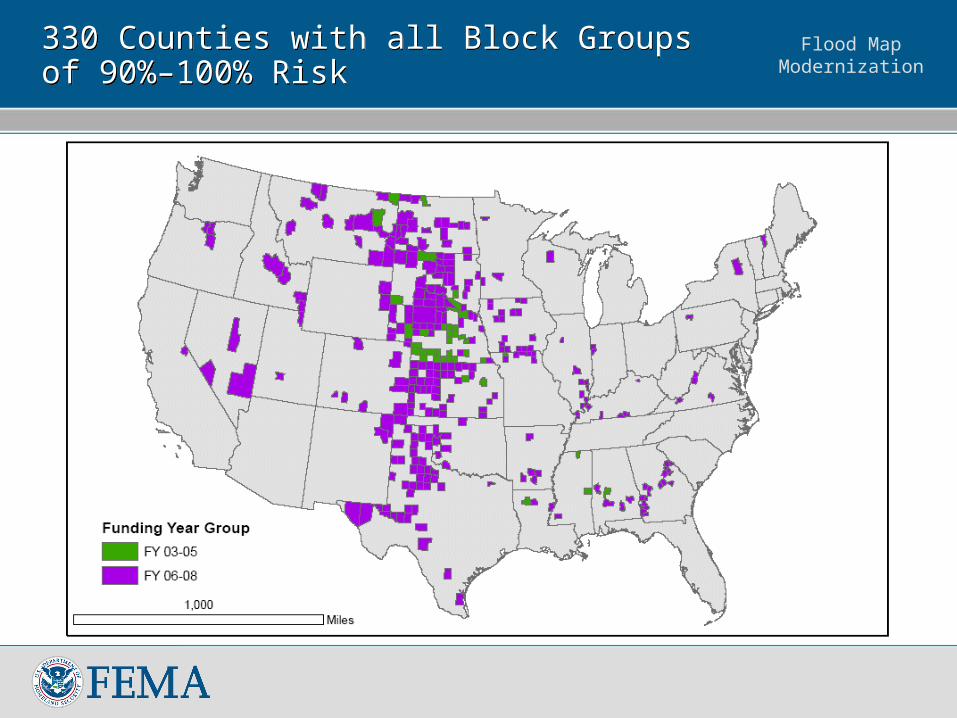
330 Counties with all Block Groups of 90%–100% Risk330 Counties with all Block Groups of 90%–100% Risk
Flood Map Modernization
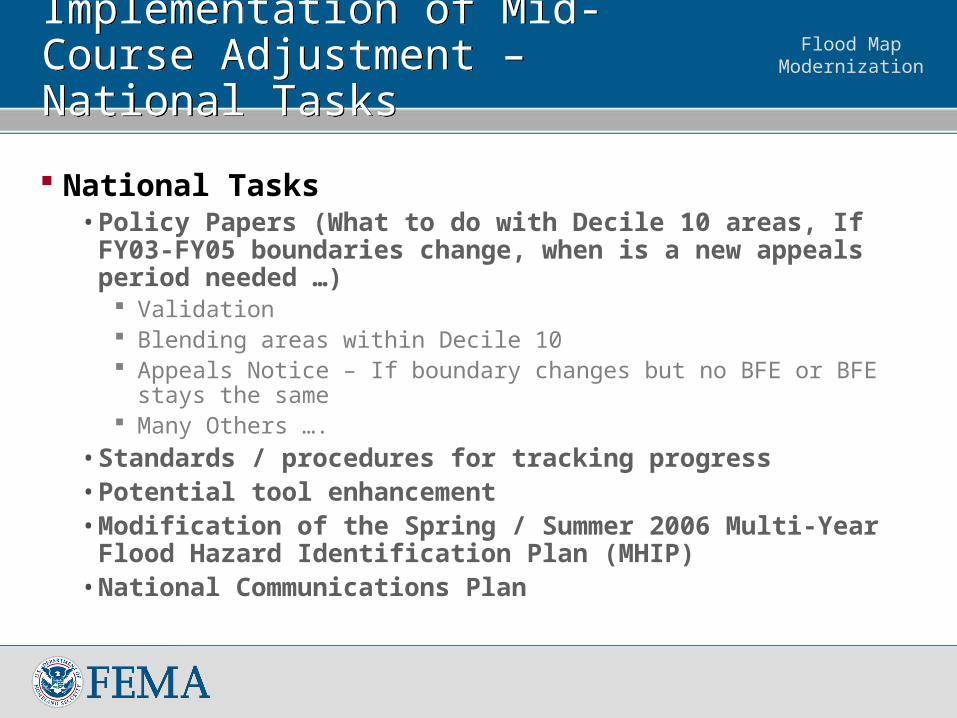
National Tasks• Policy Papers (What to do with Decile 10 areas, If FY03-FY05
boundaries change, when is a new appeals period needed …) Validation Blending areas within Decile 10 Appeals Notice – If boundary changes but no BFE or BFE stays the
same Many Others ….
• Standards / procedures for tracking progress• Potential tool enhancement• Modification of the Spring / Summer 2006 Multi-Year Flood
Hazard Identification Plan (MHIP)• National Communications Plan
Implementation of Mid-Course Adjustment – National TasksImplementation of Mid-Course Adjustment – National Tasks
Flood Map Modernization
Continental area of the Country with digital maps
Population of the Nation Miles of study in FEMA’s Inventory Miles that conform to FPBS Miles that are new / updated / validated
End State National GoalsEnd State National Goals
Flood Map Modernization
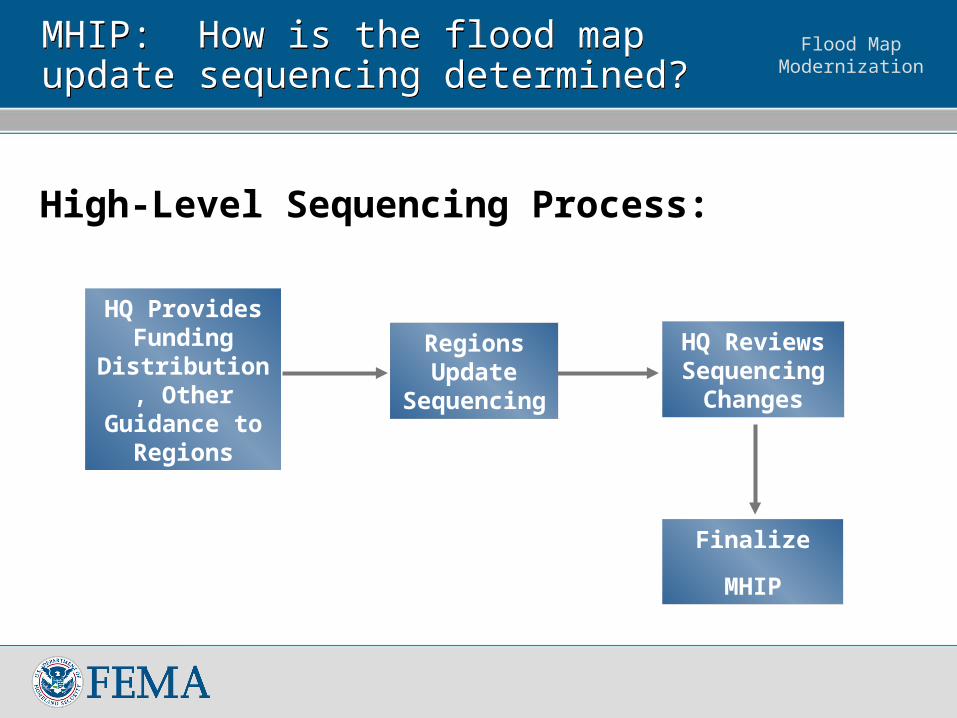
MHIP: How is the flood map update sequencing determined? MHIP: How is the flood map update sequencing determined?
High-Level Sequencing Process:
HQ Provides Funding
Distribution, Other
Guidance to Regions
HQ Reviews Sequencing
Changes
Finalize
MHIP
Regions Update
Sequencing
Flood Map Modernization
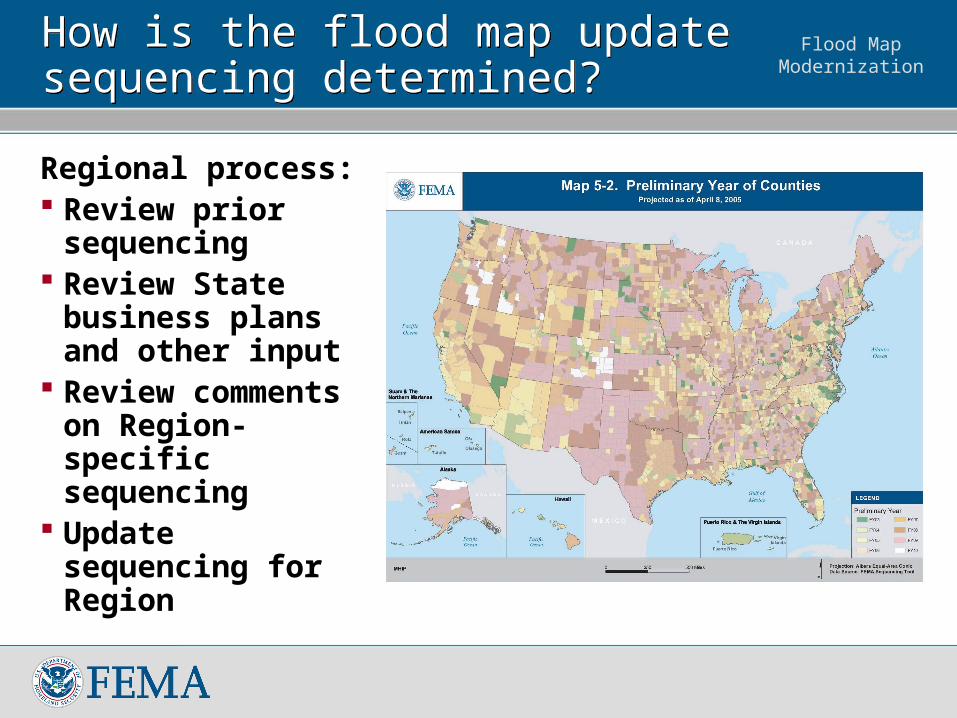
How is the flood map update sequencing determined?How is the flood map update sequencing determined?
Regional process: Review prior
sequencing Review State
business plans and other input
Review comments on Region-specific sequencing
Update sequencing for Region
Flood Map Modernization
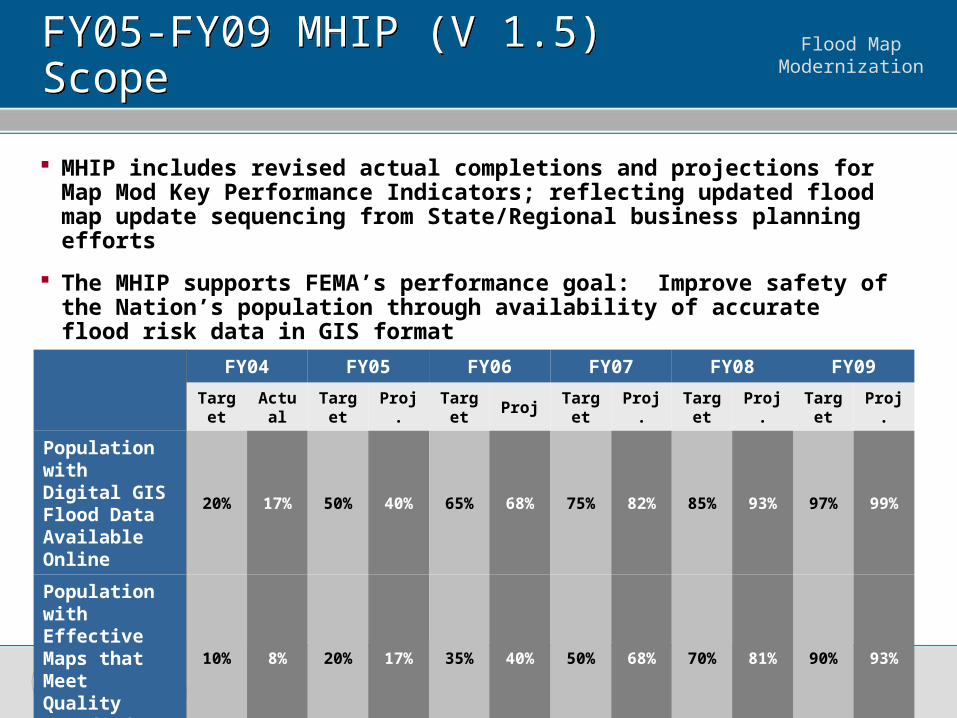
MHIP includes revised actual completions and projections for Map Mod Key Performance Indicators; reflecting updated flood map update sequencing from State/Regional business planning efforts
The MHIP supports FEMA’s performance goal: Improve safety of the Nation’s population through availability of accurate flood risk data in GIS format
FY04 FY05 FY06 FY07 FY08 FY09
Target Actual Target Proj. Target Proj Target Proj. Target Proj. Target Proj.
Population with Digital GIS Flood Data Available Online
20% 17% 50% 40% 65% 68% 75% 82% 85% 93% 97% 99%
Population with Effective Maps that Meet Quality Standards
10% 8% 20% 17% 35% 40% 50% 68% 70% 81% 90% 93%
FY05-FY09 MHIP (V 1.5) ScopeFY05-FY09 MHIP (V 1.5) Scope
Flood Map Modernization
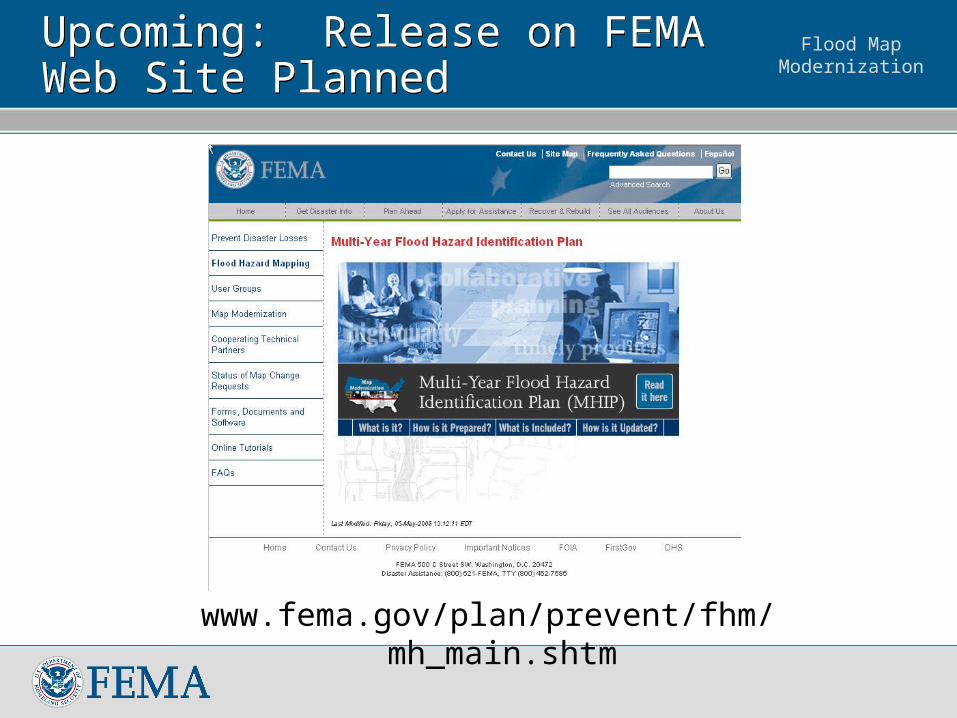
Upcoming: Release on FEMA Web Site PlannedUpcoming: Release on FEMA Web Site Planned
www.fema.gov/plan/prevent/fhm/mh_main.shtm
Flood Map Modernization
Mid-Course Adjustment SummaryMid-Course Adjustment Summary
Regions appear to have adequate funds to allow for implementation
Changes are likely required for FY06
Re-work for 03-05 studies likely
The goal of mapping the Nation remains, but is delayed
Flood Map ModernizationMapping Status ToolsMapping Status Tools
Letter of Final Determination list Appendix A of the MHIP v2.0