Embed Size (px)
Citation preview
Mid-High Frequency Vibroacoustic Modeling and Correlation of Orion Ground Test Articleand Correlation of Orion Ground Test Article
Dr. Indranil DandaroyLockheed Martin Space Systems Company
Human Space Flight Orion ProjectHuman Space Flight, Orion Project19–21 June 2012
1© The Aerospace Corporation 2012
OutlineOutline
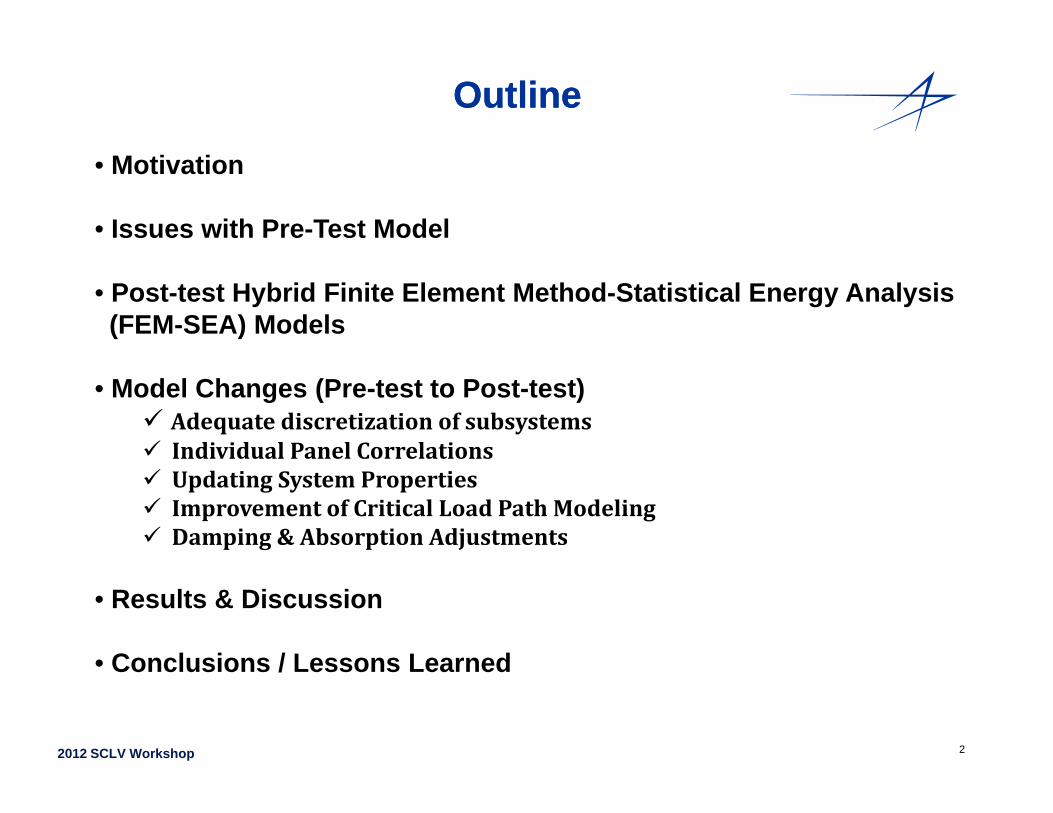
• Motivation
• Issues with Pre-Test Model
• Post-test Hybrid Finite Element Method-Statistical Energy Analysis(FEM-SEA) Models
• Model Changes (Pre-test to Post-test) Adequate discretization of subsystems Individual Panel CorrelationsIndividual Panel Correlations Updating System Properties Improvement of Critical Load Path Modeling Damping & Absorption Adjustments
• Results & Discussion
• Conclusions / Lessons Learned
2
• Conclusions / Lessons Learned
2012 SCLV Workshop
MotivationMotivation
• A full size Ground Test Article (GTA) of Orion Multi-Purpose Crew Vehicle (MPCV) has beentested in the Reverberant Acoustic Lab (RAL) at Lockheed Martin Space SystemsCompany.
• Various configurations of the GTA have been tested in the reverberation chamber subjected to flight-level acoustic excitations and microphone and accelerometer measurements have been taken to understand the complex dynamic load paths in this
hi lvehicle.
• Before the tests were conducted, a preliminary SEA model was built and analyzed toestimate the dynamic response of GTA. However, correlation of test data with pre-test
l i t ti f tanalysis was not satisfactory.
• This presentation describes the model refinement work that was subsequently performed on the GTA SEA vibroacoustic model to improve the correlation and reflect the power flowsth h th d l t lthrough the model more accurately.
• Development of this refined vibroacoustic model and test-analysis correlation hasestablished better modeling practices that will be used for future flight vehicle design and
ifi ti l i l
32012 SCLV Workshop
verification analysis cycles.
3
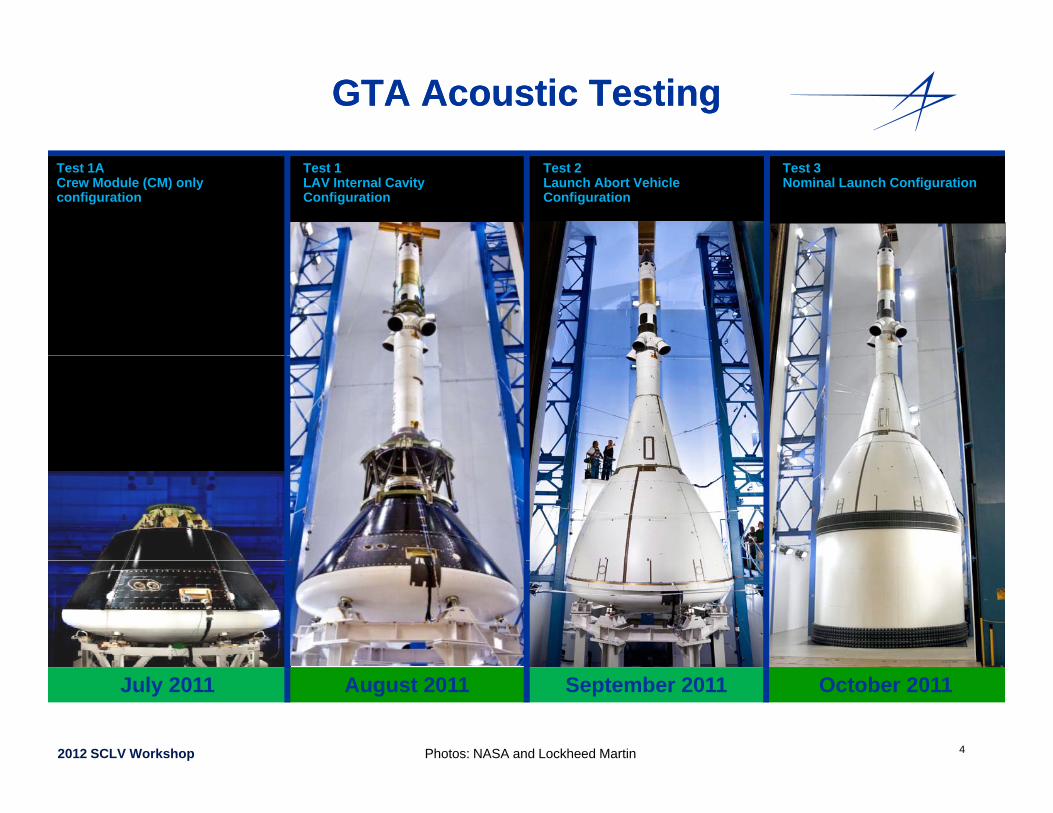
GTA AcousticGTA Acoustic TestingTesting
Test 1LAV Internal Cavity Configuration
Test 1ACrew Module (CM) only configuration
Test 2Launch Abort Vehicle Configuration
Test 3Nominal Launch Configuration
4
July 2011 August 2011 September 2011 October 2011
2012 SCLV Workshop Photos: NASA and Lockheed Martin
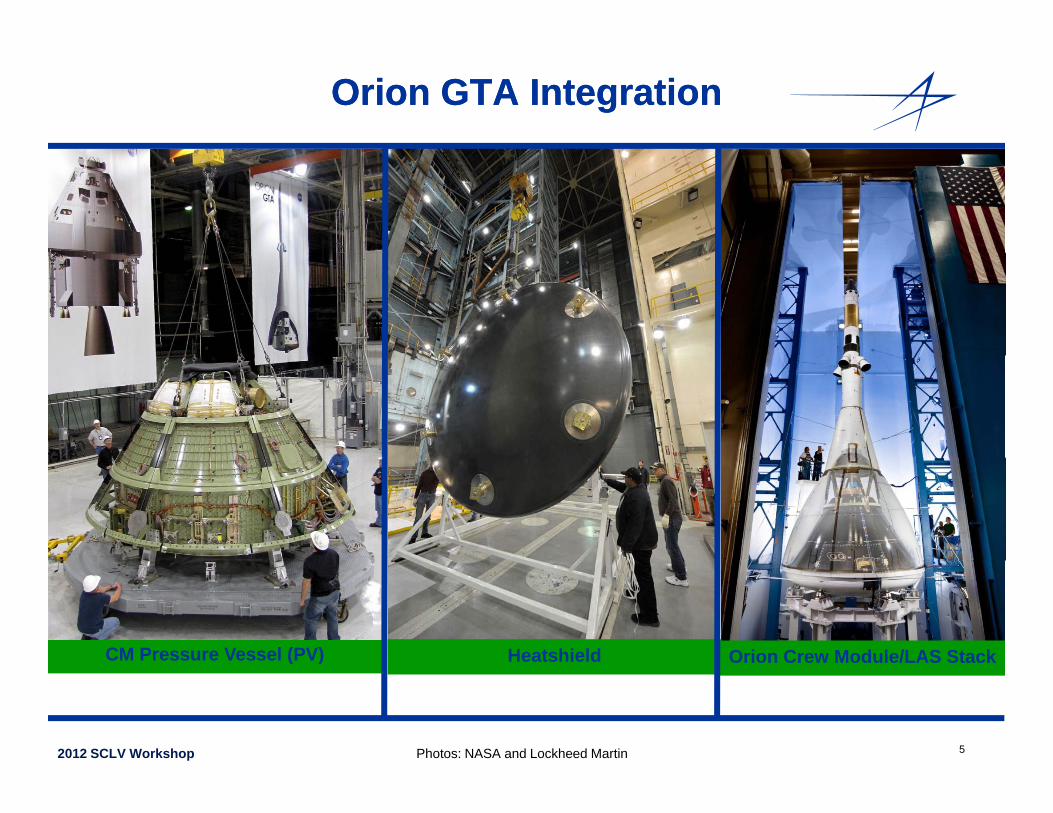
Orion GTA IntegrationOrion GTA Integration
CM Pressure Vessel (PV) Orion Crew Module/LAS StackHeatshield
5
( )
Photos: NASA and Lockheed Martin2012 SCLV Workshop
Issues with PreIssues with Pre--Test ModelTest Model
• Test-Analysis correlation could be better. In addition, there were largedivergences in many subsystem responses between SEA and BoundaryElement Method (BEM)* models.
• Incorrect Segmentation – Several subsystems had poor Modes-In-Band (MIB) especially towards the lower end of the frequency spectrum.
• SEA Panels did not always correlate to their FEM models.
• Significant number of beam subsystems in the model did not reflect the• Significant number of beam subsystems in the model did not reflect thecorrect properties.
• Dynamic loads paths were not modeled correctly in critical areasDynamic loads paths were not modeled correctly in critical areas.
• Structural damping and acoustic absorptions were not representative.
62012 SCLV Workshop
*BEM model is used for Orion vibroacoustic analysis below 300 Hz, SEA/Hybrid is used for > 300 Hz
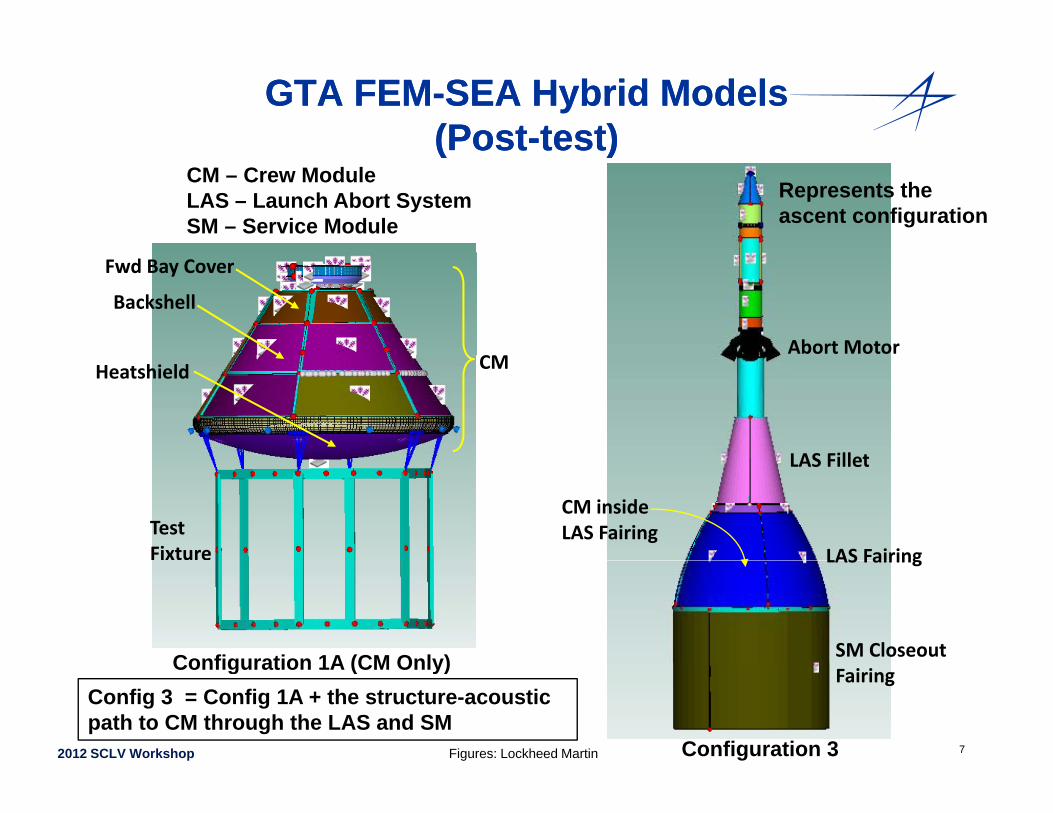
GTA FEMGTA FEM--SEA Hybrid Models SEA Hybrid Models (Post(Post--test)test)( ost( ost test)test)
Represents theascent configuration
CM – Crew ModuleLAS – Launch Abort SystemSM – Service Module
CM
Backshell
Fwd Bay Cover
Abort MotorCMHeatshield
LAS Fillet
Test Fixture LAS Fairing
LAS Fillet
CM inside LAS Fairing
SM Closeout
LAS Fairing
Configuration 1A (CM Only)
72012 SCLV Workshop
FairingConfiguration 1A (CM Only)
Configuration 3
Config 3 = Config 1A + the structure-acoustic path to CM through the LAS and SM
Figures: Lockheed Martin
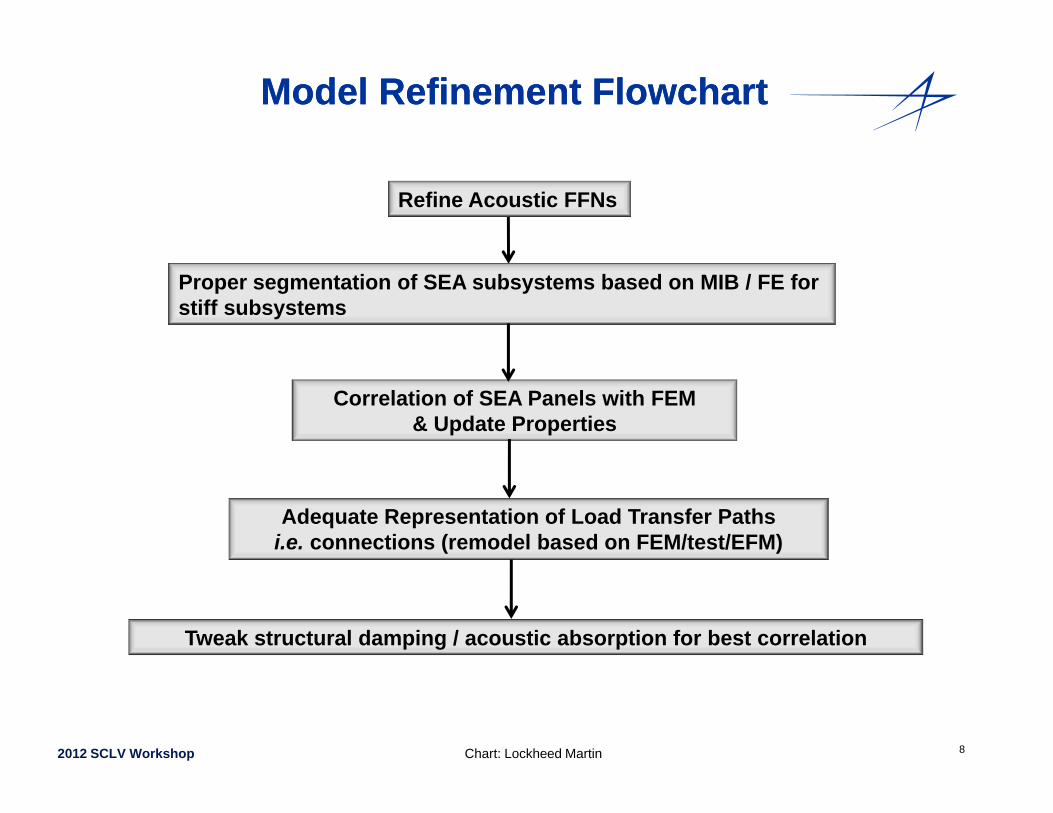
Model Refinement FlowchartModel Refinement Flowchart
Refine Acoustic FFNs
Proper segmentation of SEA subsystems based on MIB / FE for stiff subsystems
Correlation of SEA Panels with FEM& Update Properties
Adequate Representation of Load Transfer Pathsi.e. connections (remodel based on FEM/test/EFM)
Tweak structural damping / acoustic absorption for best correlation
82012 SCLV Workshop Chart: Lockheed Martin
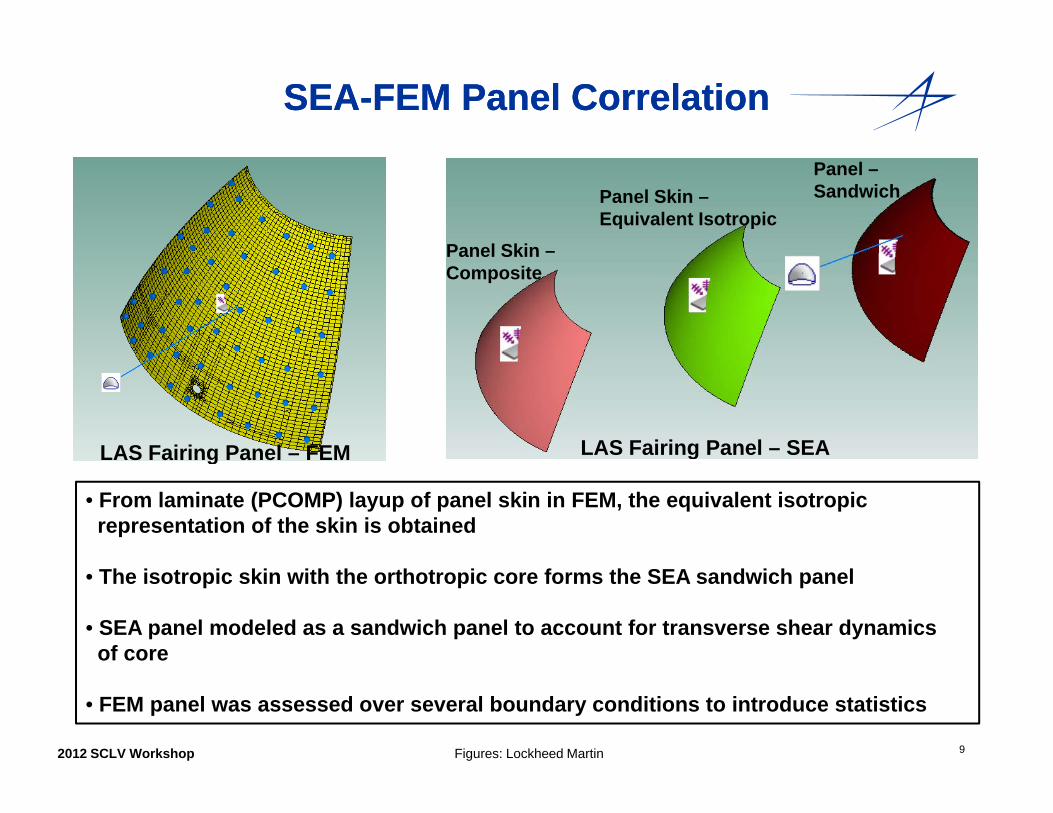
SEASEA--FEM Panel CorrelationFEM Panel Correlation
Panel –SandwichPanel Skin –
Equivalent IsotropicPanel Skin –Panel Skin –Composite
LAS Fairing Panel – FEM LAS Fairing Panel – SEALAS Fairing Panel FEM g
• From laminate (PCOMP) layup of panel skin in FEM, the equivalent isotropic representation of the skin is obtained
• The isotropic skin with the orthotropic core forms the SEA sandwich panel
• SEA panel modeled as a sandwich panel to account for transverse shear dynamics of core
92012 SCLV Workshop
• FEM panel was assessed over several boundary conditions to introduce statistics
Figures: Lockheed Martin
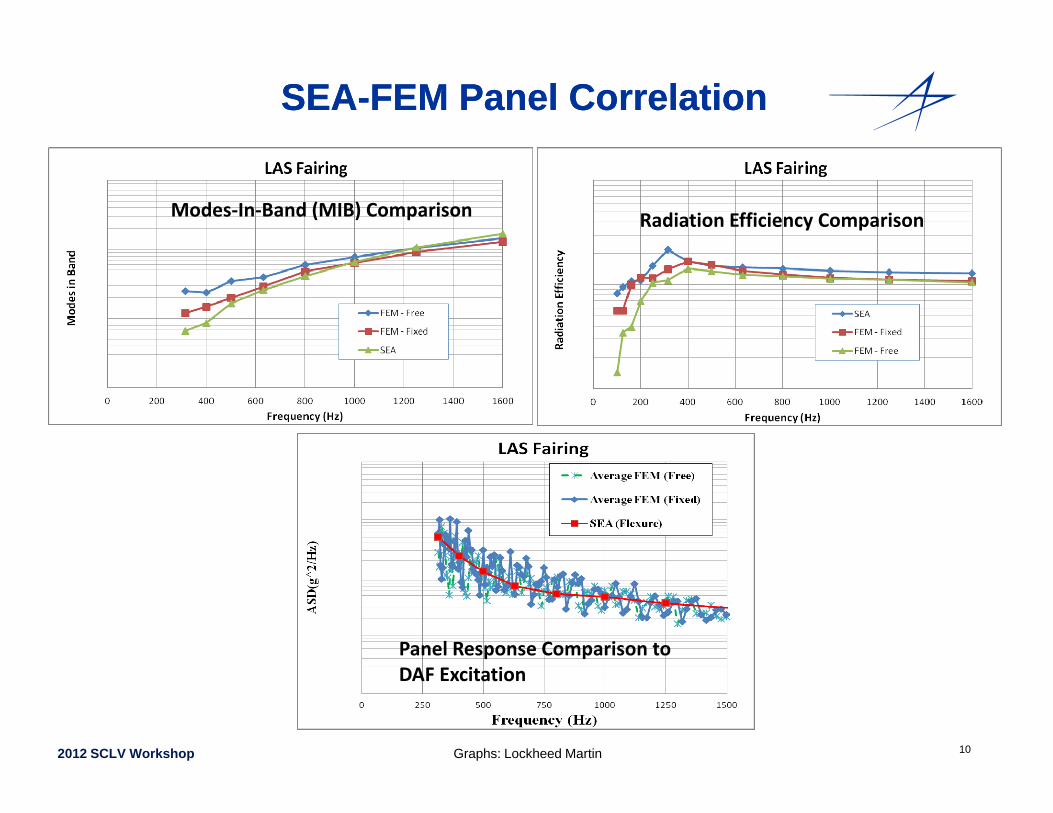
SEASEA--FEM Panel CorrelationFEM Panel Correlation
Radiation Efficiency ComparisonModes‐In‐Band (MIB) Comparison
Panel Response Comparison to
102012 SCLV Workshop
DAF Excitation
Graphs: Lockheed Martin
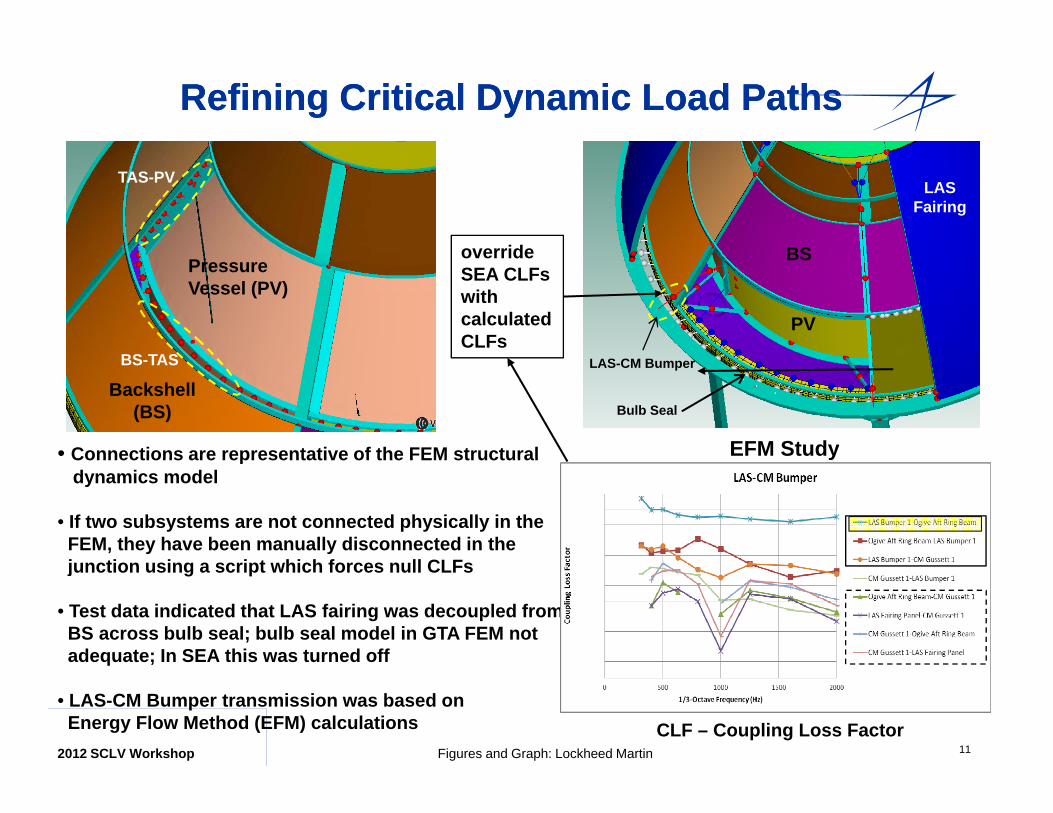
RefiningRefining Critical Dynamic Load Paths Critical Dynamic Load Paths
TAS-PV LAS Fairing
BSoverride
BS TAS
Pressure Vessel (PV)
BS
PV
override SEA CLFs with calculated CLFs
• Connections are representative of the FEM structural
LAS-CM BumperBS-TAS
Bulb SealBackshell
(BS)
EFM StudyConnections are representative of the FEM structuraldynamics model
• If two subsystems are not connected physically in theFEM, they have been manually disconnected in thej ti i i t hi h f ll CLF
y
junction using a script which forces null CLFs
• Test data indicated that LAS fairing was decoupled fromBS across bulb seal; bulb seal model in GTA FEM notadequate; In SEA this was turned off
112011 SCLV Workshop
q ;
• LAS-CM Bumper transmission was based on Energy Flow Method (EFM) calculations
2012 SCLV WorkshopCLF – Coupling Loss Factor
Figures and Graph: Lockheed Martin
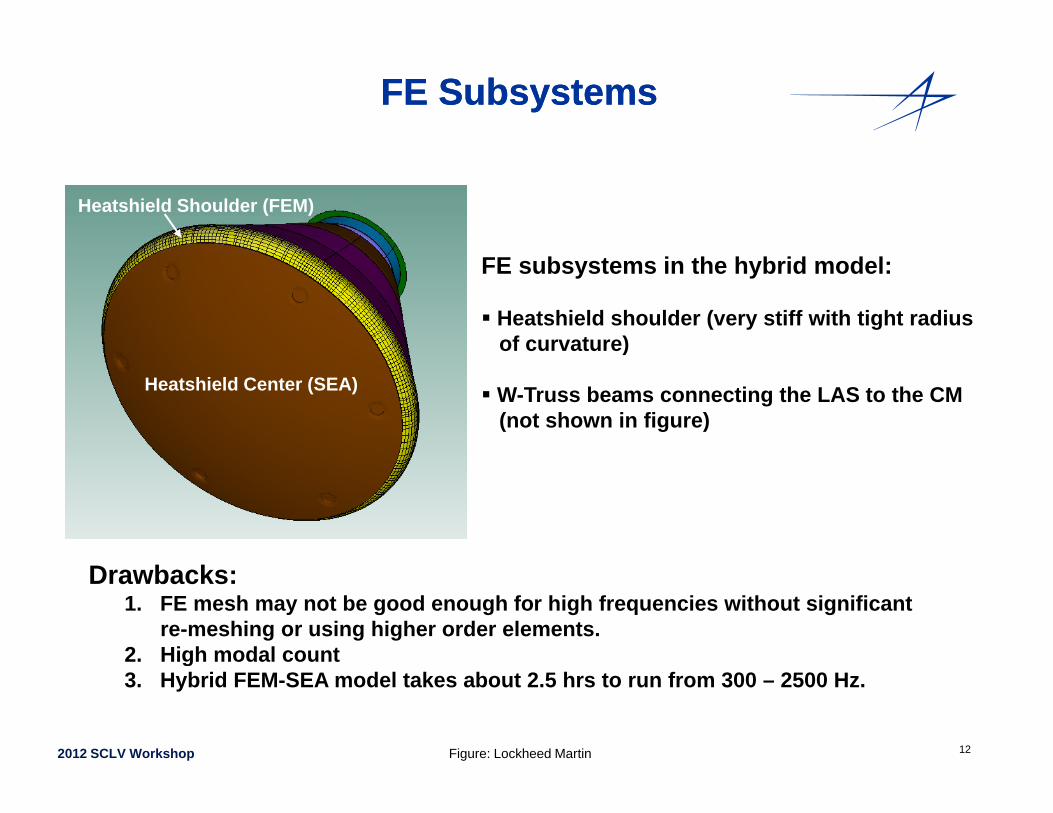
FE SubsystemsFE Subsystems
Heatshield Shoulder (FEM)
FE subsystems in the hybrid model:
Heatshield shoulder (very stiff with tight radiusof curvature)
W-Truss beams connecting the LAS to the CM(not shown in figure)
Heatshield Center (SEA)
HS Shoulder
Drawbacks: 1. FE mesh may not be good enough for high frequencies without significant
re-meshing or using higher order elements.2. High modal count
12
g3. Hybrid FEM-SEA model takes about 2.5 hrs to run from 300 – 2500 Hz.
2012 SCLV Workshop Figure: Lockheed Martin
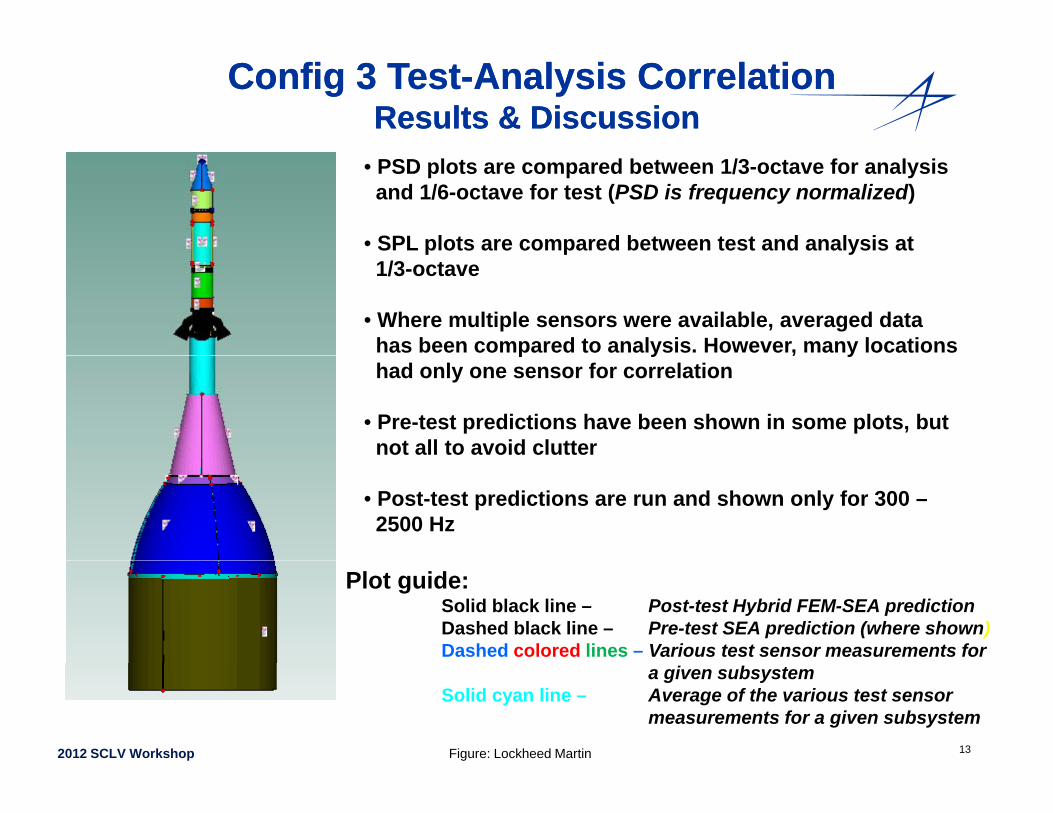
Config 3 TestConfig 3 Test--Analysis Correlation Analysis Correlation Results & DiscussionResults & Discussion
• PSD plots are compared between 1/3-octave for analysisand 1/6-octave for test (PSD is frequency normalized)
• SPL plots are compared between test and analysis at p p y1/3-octave
• Where multiple sensors were available, averaged datahas been compared to analysis. However, many locationsp y , yhad only one sensor for correlation
• Pre-test predictions have been shown in some plots, butnot all to avoid clutter
• Post-test predictions are run and shown only for 300 –2500 Hz
Plot guide:Solid black line – Post-test Hybrid FEM-SEA predictionDashed black line – Pre-test SEA prediction (where shown)Dashed colored lines – Various test sensor measurements for
132012 SCLV Workshop
a given subsystemSolid cyan line – Average of the various test sensor
measurements for a given subsystem
Figure: Lockheed Martin
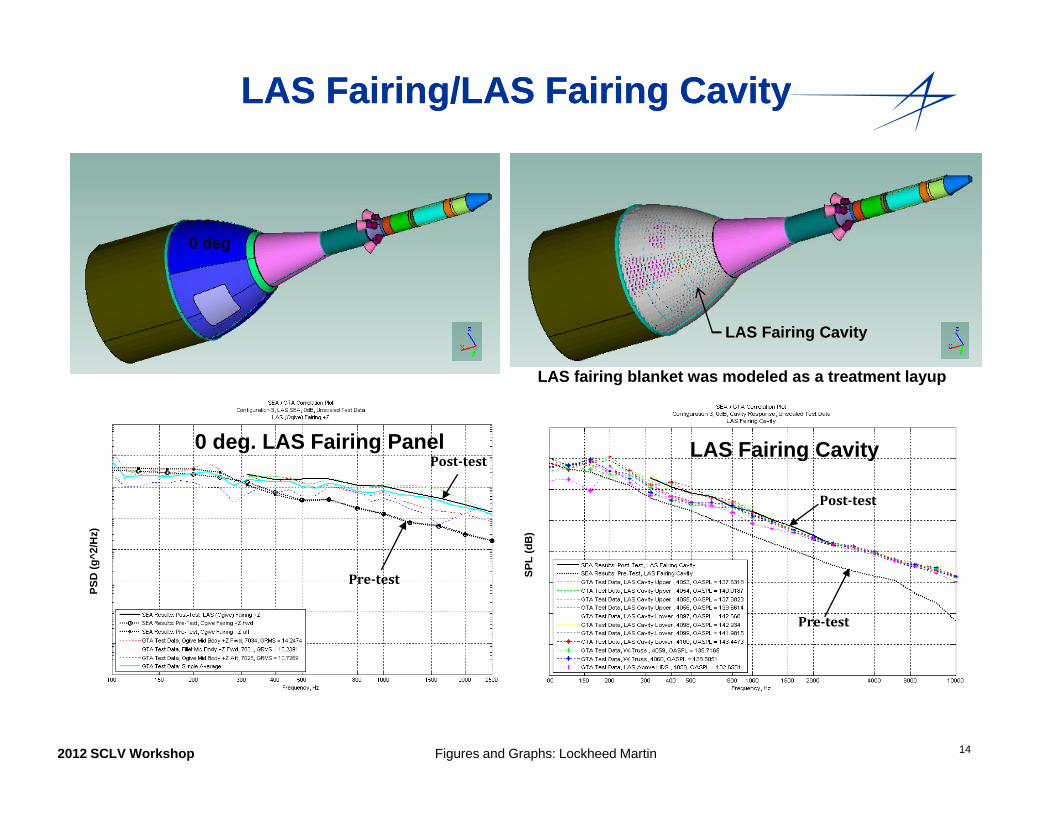
LAS Fairing/LASLAS Fairing/LAS Fairing CavityFairing Cavity
0 deg
LAS Fairing Cavity
LAS Fairing Cavity
LAS fairing blanket was modeled as a treatment layup
0 deg. LAS Fairing PanelP t t t
g y
Posttest
Posttest
L (d
B)
g^2/
Hz)
Pretest
Pretest SPL
PSD
(g
142012 SCLV Workshop Figures and Graphs: Lockheed Martin
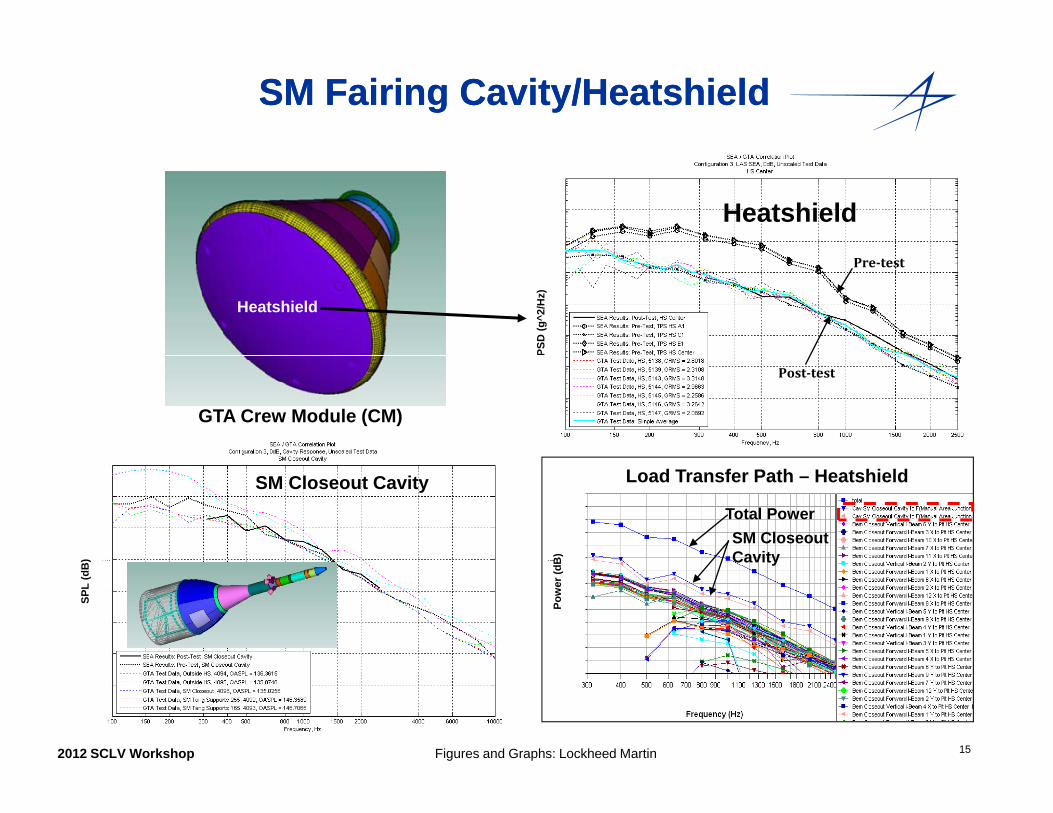
SM Fairing Cavity/HeatshieldSM Fairing Cavity/Heatshield
HeatshieldPretest
Heatshield
PSD
(g^2
/Hz)
Posttest
GTA Crew Module (CM)
SM Closeout Cavity
B))
Load Transfer Path – Heatshield
Total PowerSM Closeout Cavity
Pow
er (d
B
SPL
(dB
) Cavity
152012 SCLV Workshop Figures and Graphs: Lockheed Martin
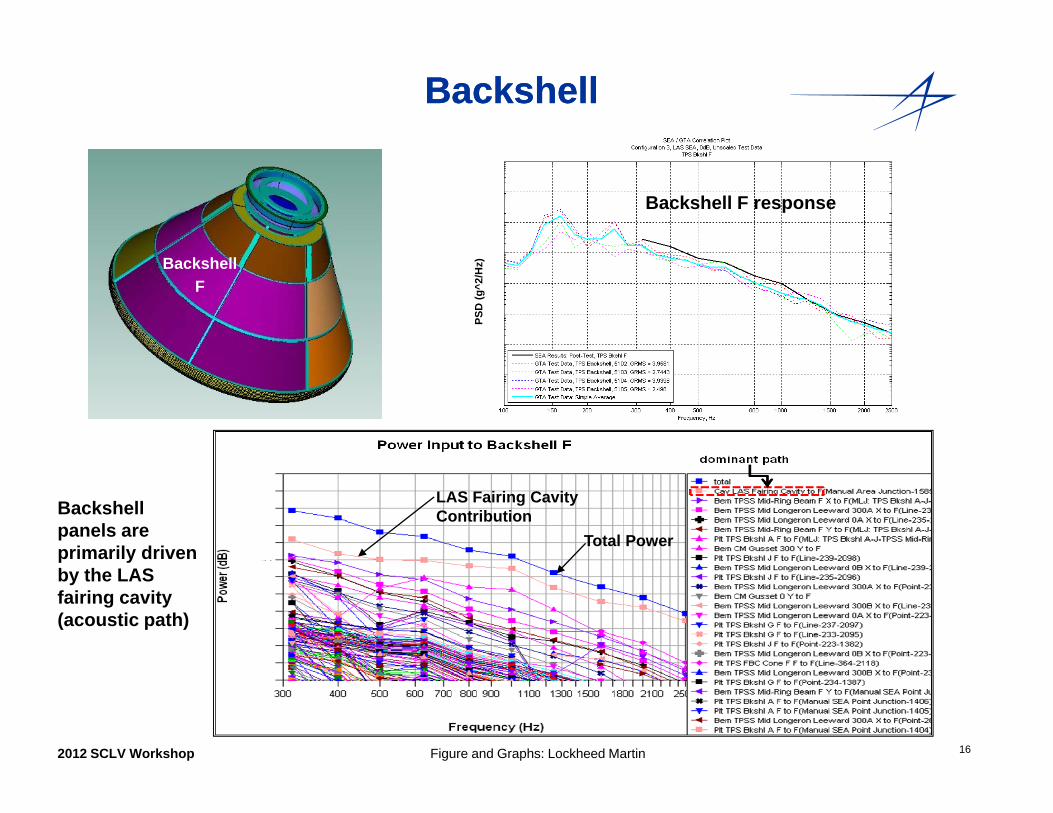
BackshellBackshell
Backshell F response
Backshell F
PSD
(g^2
/Hz)
Total Power
LAS Fairing Cavity ContributionBackshell
panels areprimarily drivenp yby the LASfairing cavity(acoustic path)
162012 SCLV Workshop Figure and Graphs: Lockheed Martin
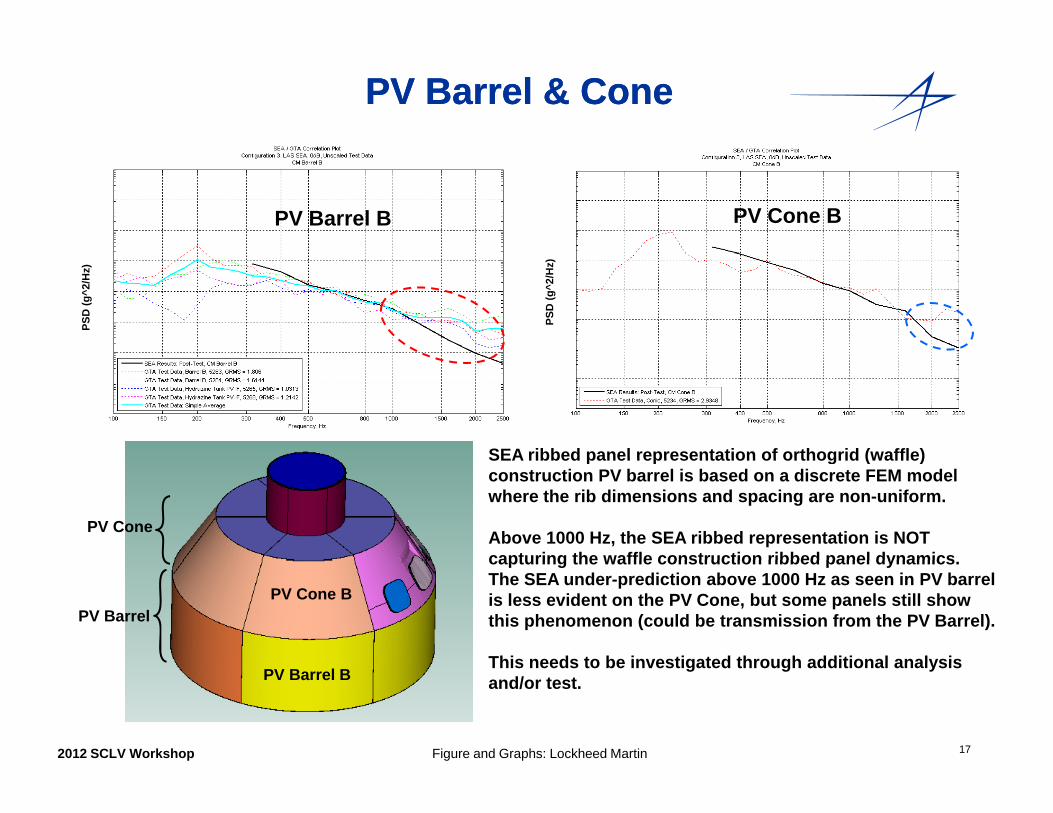
PV Barrel & ConePV Barrel & Cone
PV Barrel B PV Cone B
PSD
(g^2
/Hz)
PSD
(g^2
/Hz)
SEA ribbed panel representation of orthogrid (waffle)
PV Cone
SEA ribbed panel representation of orthogrid (waffle) construction PV barrel is based on a discrete FEM model where the rib dimensions and spacing are non-uniform.
Above 1000 Hz, the SEA ribbed representation is NOT capturing the waffle construction ribbed panel dynamics
PV BarrelPV Cone B
capturing the waffle construction ribbed panel dynamics. The SEA under-prediction above 1000 Hz as seen in PV barrel is less evident on the PV Cone, but some panels still show this phenomenon (could be transmission from the PV Barrel).
This needs to be investigated through additional analysis
172012 SCLV Workshop
PV Barrel BThis needs to be investigated through additional analysis and/or test.
Figure and Graphs: Lockheed Martin
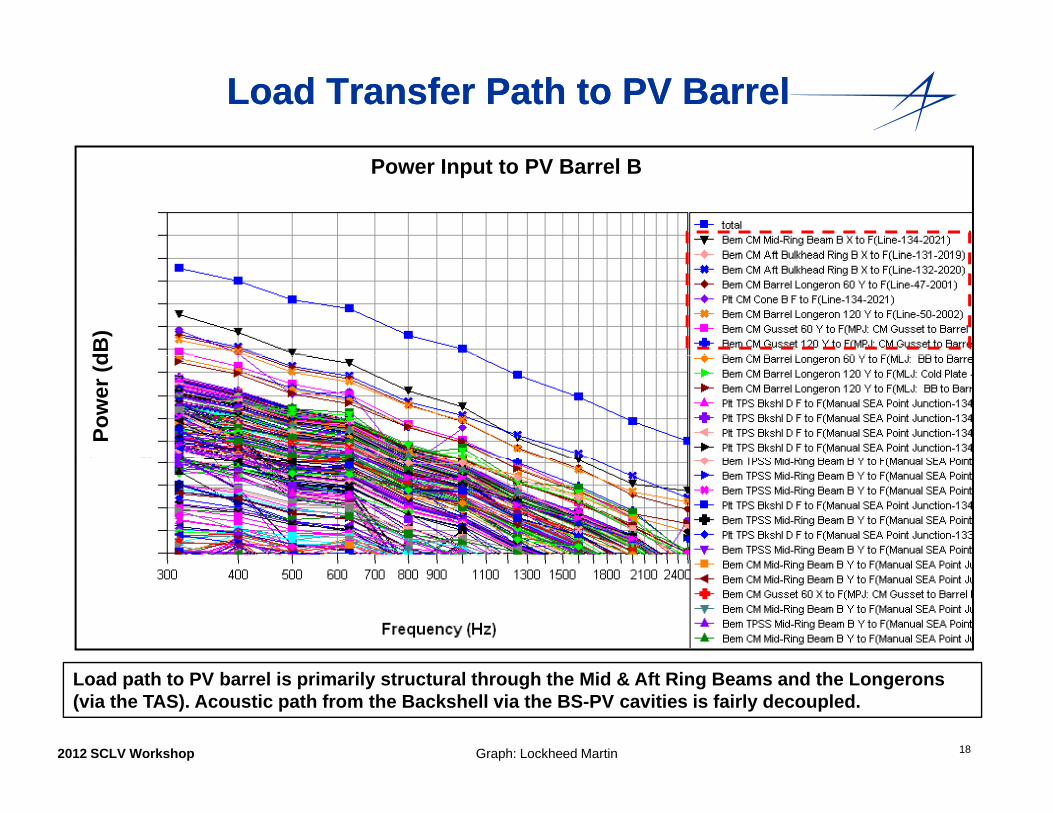
Load Transfer Path to PV BarrelLoad Transfer Path to PV Barrel
Power Input to PV Barrel B
dB)
Pow
er (d
18
Load path to PV barrel is primarily structural through the Mid & Aft Ring Beams and the Longerons (via the TAS). Acoustic path from the Backshell via the BS-PV cavities is fairly decoupled.
2012 SCLV Workshop Graph: Lockheed Martin
ConclusionsConclusions
• A refined and correlated hybrid FE-SEA model has been developed to representthe Orion Ground Test Article (GTA). Several refinements were done to the pre-test model to improve the quality of test-analysis correlation:
Avoidance of too much segmentation in SEA model to avoid poor modes-in-band. A couple subsystems which were very stiff at the lower end of the frequency range of analysis were modeled with FEM, thus making the model a hybrid FEM-SEA y , g yrepresentation.
All important SEA panels were individually correlated with their FEM representationswith the criteria of matching modes-in-band and radiation efficiency. This ensuredgood correlation between the standalone responses to the SEA and FEM versions ofgood correlation between the standalone responses to the SEA and FEM versions of the panel.
Several critical dynamic load transfer paths were remodeled. The EFM module wasused in one critical connection to ascertain the transmission characteristics using ga breakout FEM model.
Adjustments in structural damping and acoustic absorption spectra were made toachieve the best correlation as a final step.
192012 SCLV Workshop
p
ConclusionsConclusions
• Considerable improvement in the quality of correlation with test data from pre-test to post-test has been made.
• The refined vibroacoustic model is not only able to show good match with testdata, but also predicts the dynamic load transfer paths from the external acoustic excitation to the interior of the CM more accurately.
• There is some discrepancy in test-analysis correlation of the PV panel responses due to limitations of the ribbed panel SEA representation inmodeling such a non-uniform layout. Further study is needed to understand hi d fi i i h ib i d lthis deficiency in the vibroacoustic model.
• This model correlation exercise will provide valuable insight for modeling of the flight vehicle.the flight vehicle.
202012 SCLV Workshop
Questions?
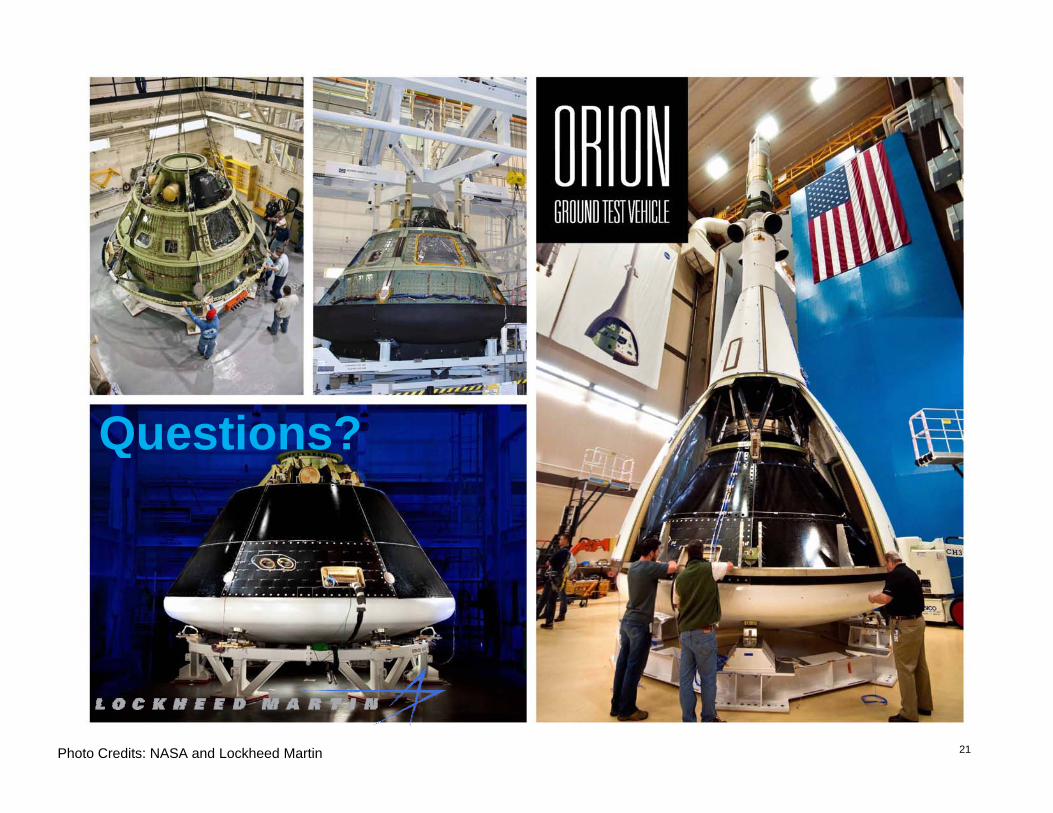
21Photo Credits: NASA and Lockheed Martin