Embed Size (px)
Citation preview
Grade 7 MathematicsVocabulary Word Wall Cards
Mathematics vocabulary word wall cards provide a display of mathematics content words and associated visual cues to assist in vocabulary development. The cards should be used as an instructional tool for teachers and then as a reference for all students.
Number and Number SensePowers of TenScientific NotationComparing Numbers in Scientific NotationRational Numbers Comparing Rational NumbersPerfect SquaresSquare RootAbsolute Value
Computation and EstimationProportionRatio TableScale FactorProportional Reasoning Proportional Reasoning: Using Benchmarks
Measurement and GeometryRectangular PrismVolume of a Rectangular PrismSurface Area of a Rectangular PrismCylinderSimilar FiguresSimilar Figures and ProportionsQuadrilateral RelationshipsParallelogramRhombusRectangleSquareTrapezoidLine of Symmetry
ReflectionTranslation
Probability and StatisticsProbabilityTheoretical ProbabilityExperimental ProbabilityHistogramComparing Graphs: Histogram and Stem and Leaf GraphComparing Graphs: Histogram and Circle GraphComparing Graphs: Histogram and Line Plot
Patterns, Functions and AlgebraSlopeUnit Rate Proportional Relationship: y = mxProportional RelationshipAdditive Relationship: y = x + bAdditive RelationshipGraphing Linear RelationshipsConnecting Representations: Proportional RelationshipConnecting Representations: Additive RelationshipOrder of OperationsVerbal and Algebraic Expressions and EquationsEquationInequality
Virginia Department of Education 2018 Grade 7 Mathematics Vocabulary
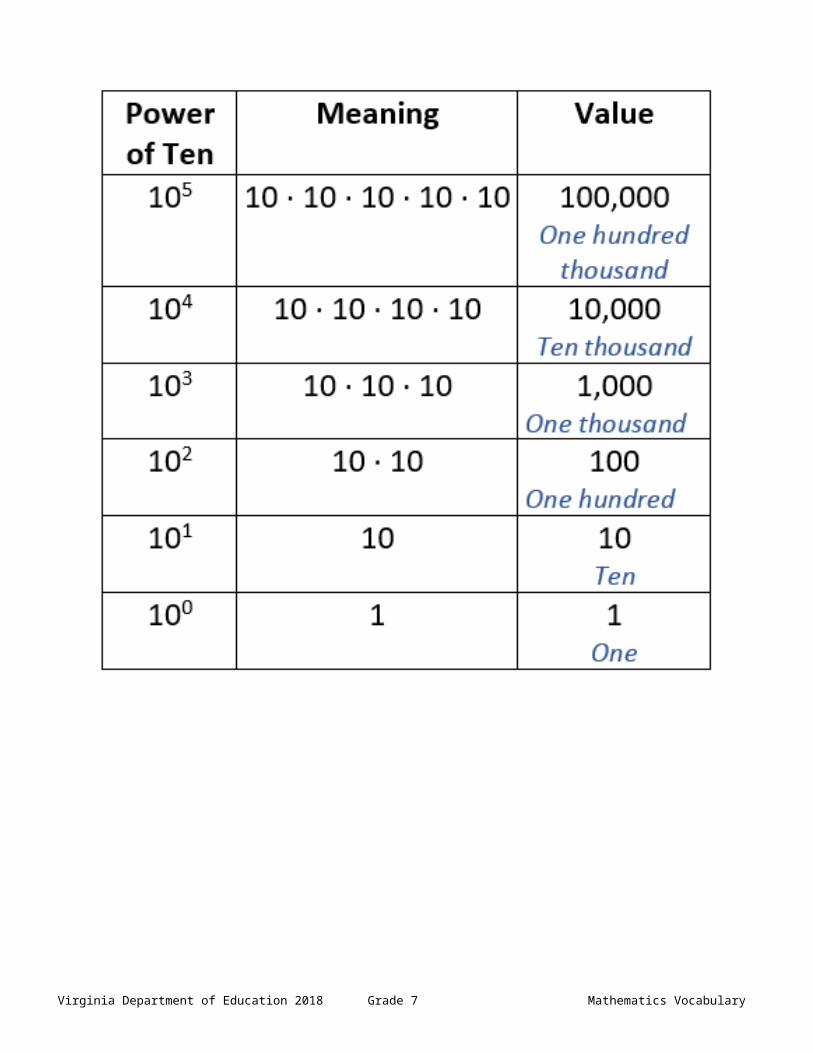
Powers of Ten
Virginia Department of Education 2018 Grade 7 Mathematics Vocabulary
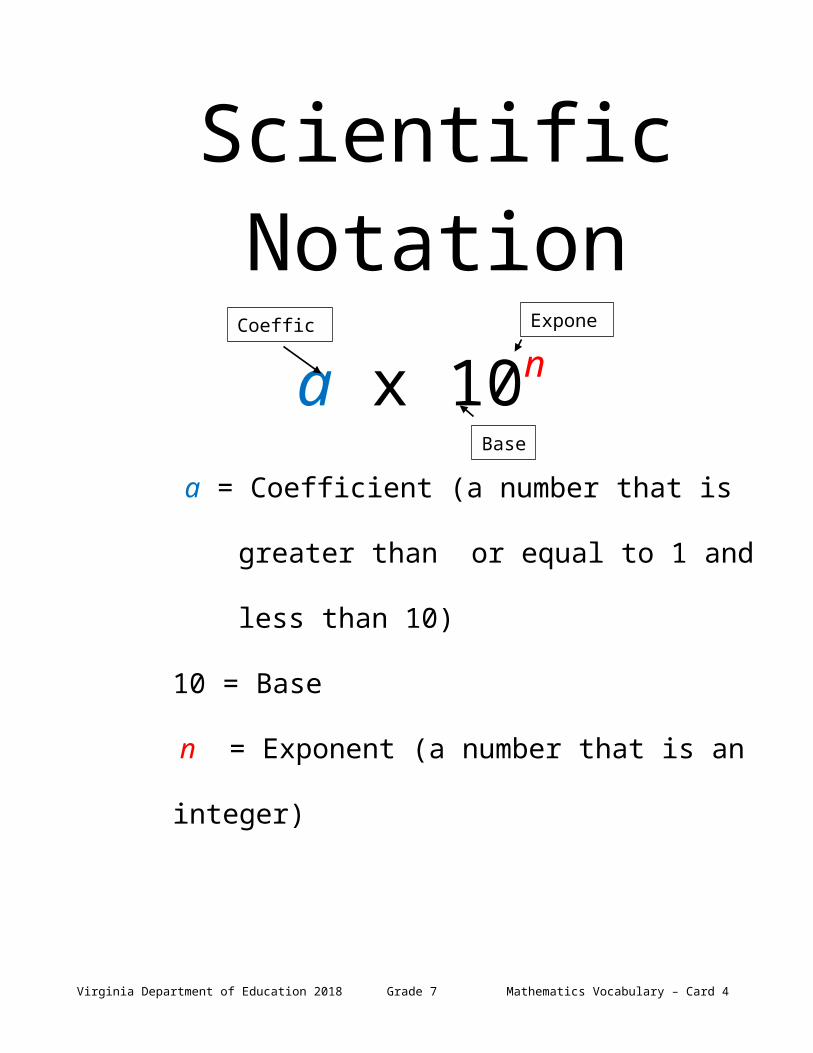
Scientific Notationa x 10n
a = Coefficient (a number that is greater than or
equal to 1 and less than 10)
10 = Base
n = Exponent (a number that is an integer)
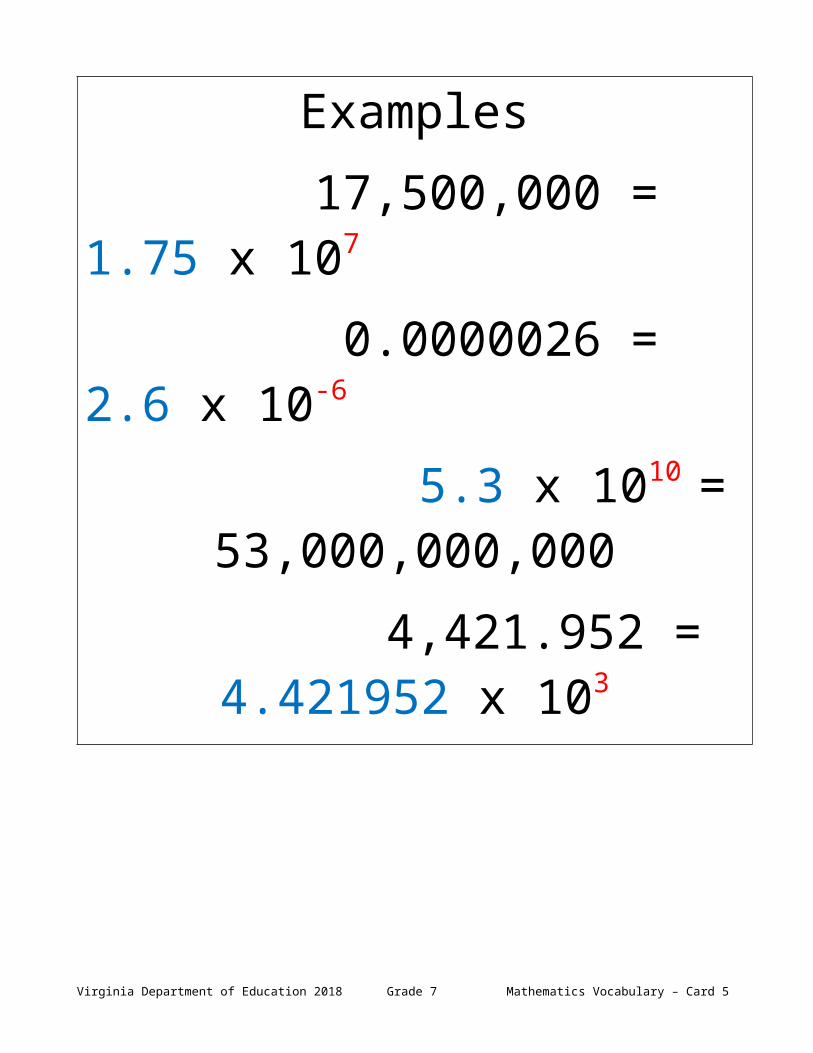
Examples 17,500,000 = 1.75 x 10⁷
0.0000026 = 2.6 x 10⁻⁶
5.3 x 1010 = 53,000,000,000 4,421.952 = 4.421952 x 10³
Virginia Department of Education 2018 Grade 7 Mathematics Vocabulary – Card 3
Coefficient
Base
Exponent
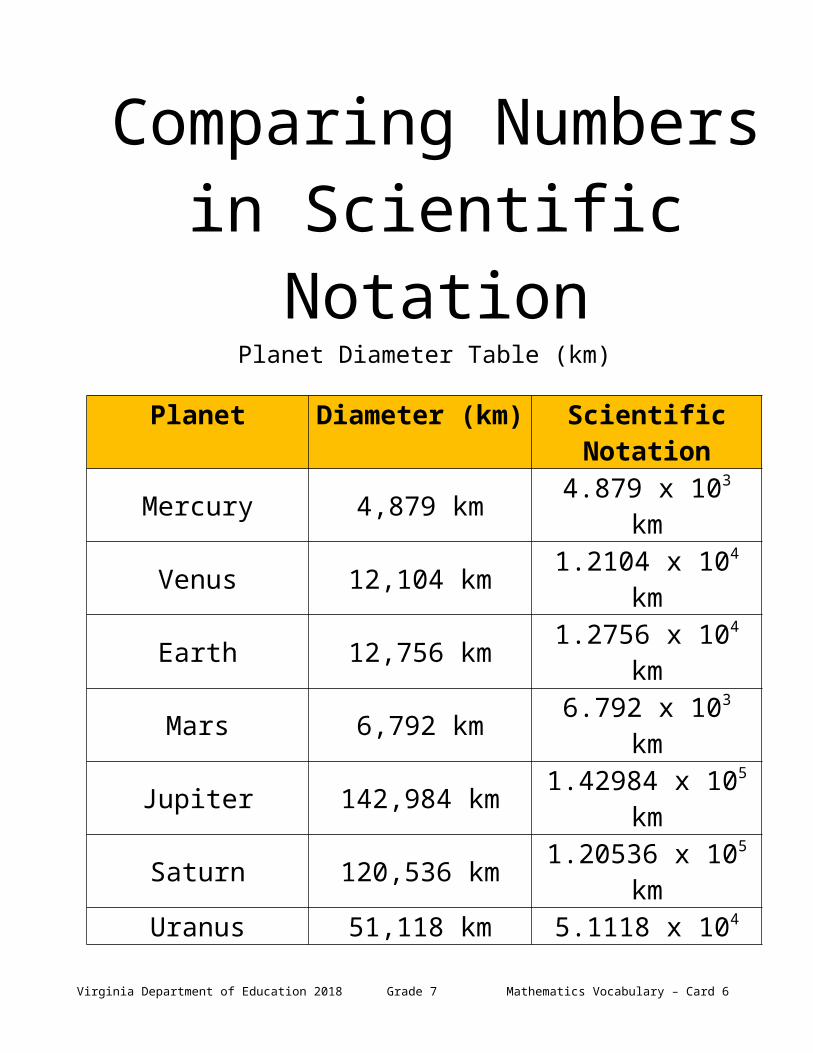
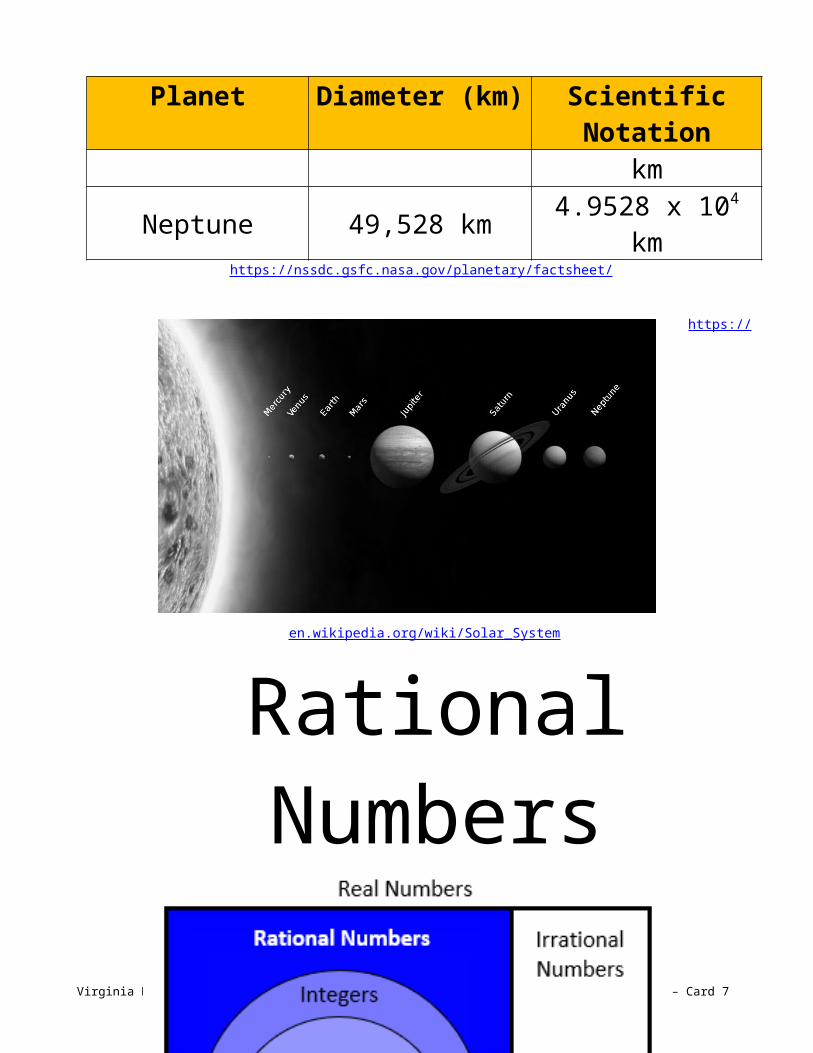
Comparing Numbers in Scientific Notation
Planet Diameter Table (km)
Planet Diameter (km) Scientific NotationMercury 4,879 km 4.879 x 10³ km
Venus 12,104 km 1.2104 x 10⁴ kmEarth 12,756 km 1.2756 x 10⁴ kmMars 6,792 km 6.792 x 10³ km
Jupiter 142,984 km 1.42984 x 10⁵ kmSaturn 120,536 km 1.20536 x 10⁵ kmUranus 51,118 km 5.1118 x 10⁴ km
Neptune 49,528 km 4.9528 x 10⁴ kmhttps://nssdc.gsfc.nasa.gov/planetary/factsheet/
https:// en.wikipedia.org/wiki/ Solar_System
Virginia Department of Education 2018 Grade 7 Mathematics Vocabulary – Card 4
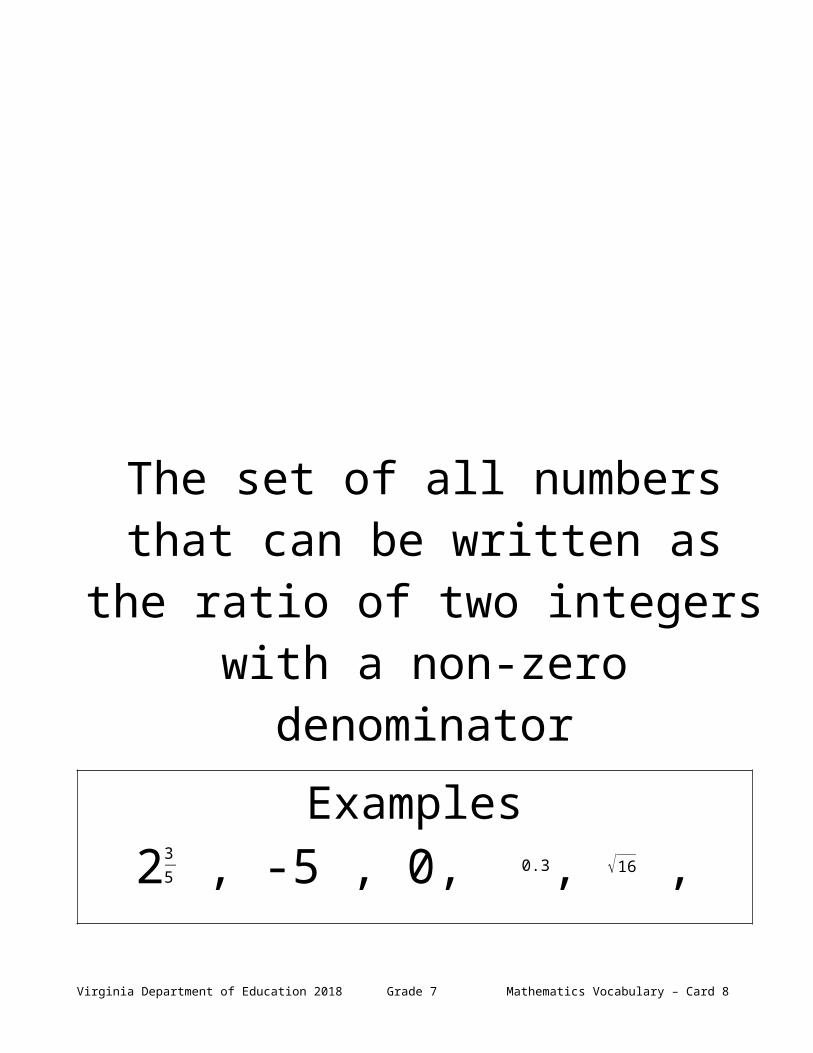
Rational Numbers
The set of all numbers that can be written as the ratio of two integers
with a non-zero denominatorExamples
235 , -5 , 0, 0.3, √16 , , 137
Virginia Department of Education 2018 Grade 7 Mathematics Vocabulary – Card 5
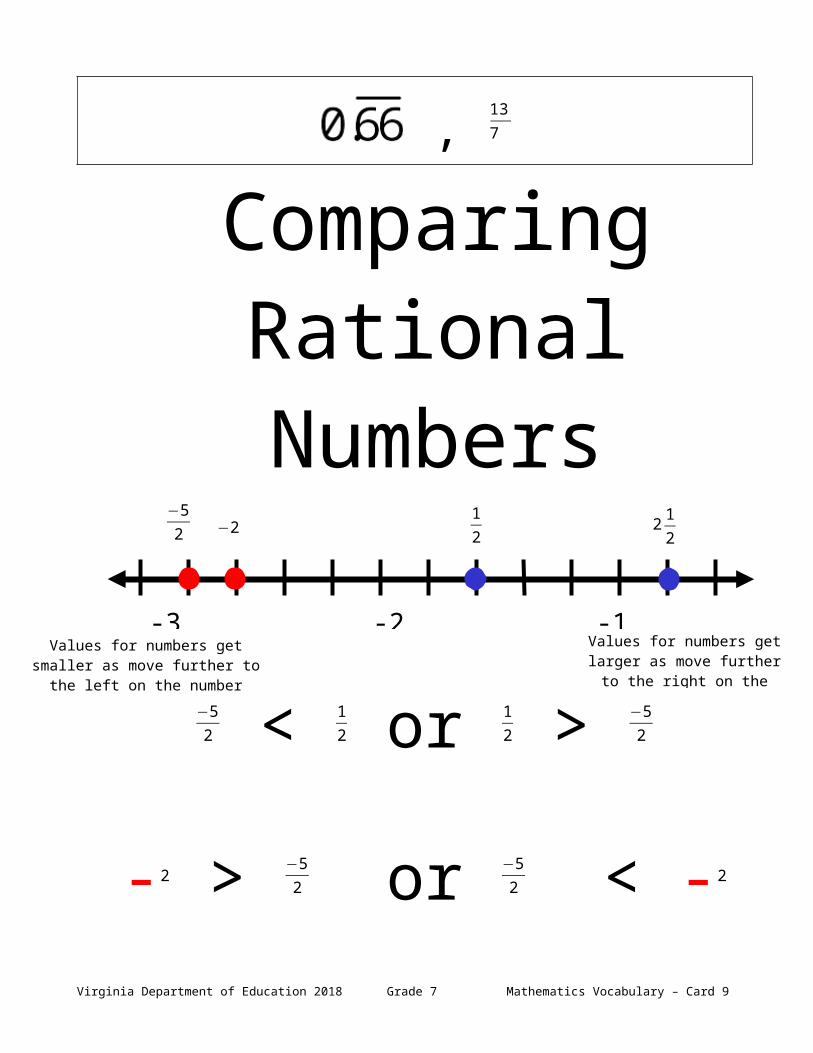
Comparing Rational Numbers
−52 < 12 or 12 > −5
2
-2 > −52 or −5
2 < -2
-2 < 2 12 or 2 12 > -2
Virginia Department of Education 2018 Grade 7 Mathematics Vocabulary – Card 6
-3 -2 -1 0 1 2 3
−52 −2
12 2 1
2
Values for numbers get smaller as move further to the left on the
number line
Values for numbers get larger as move further to the right on the
number line
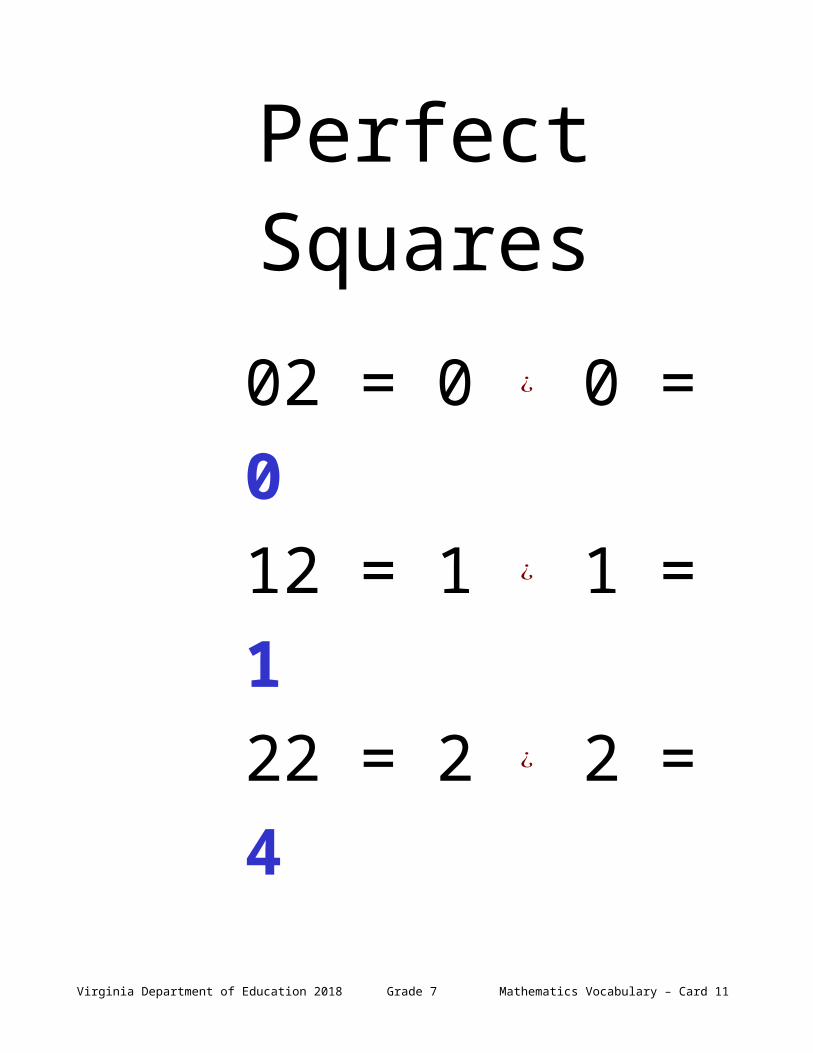
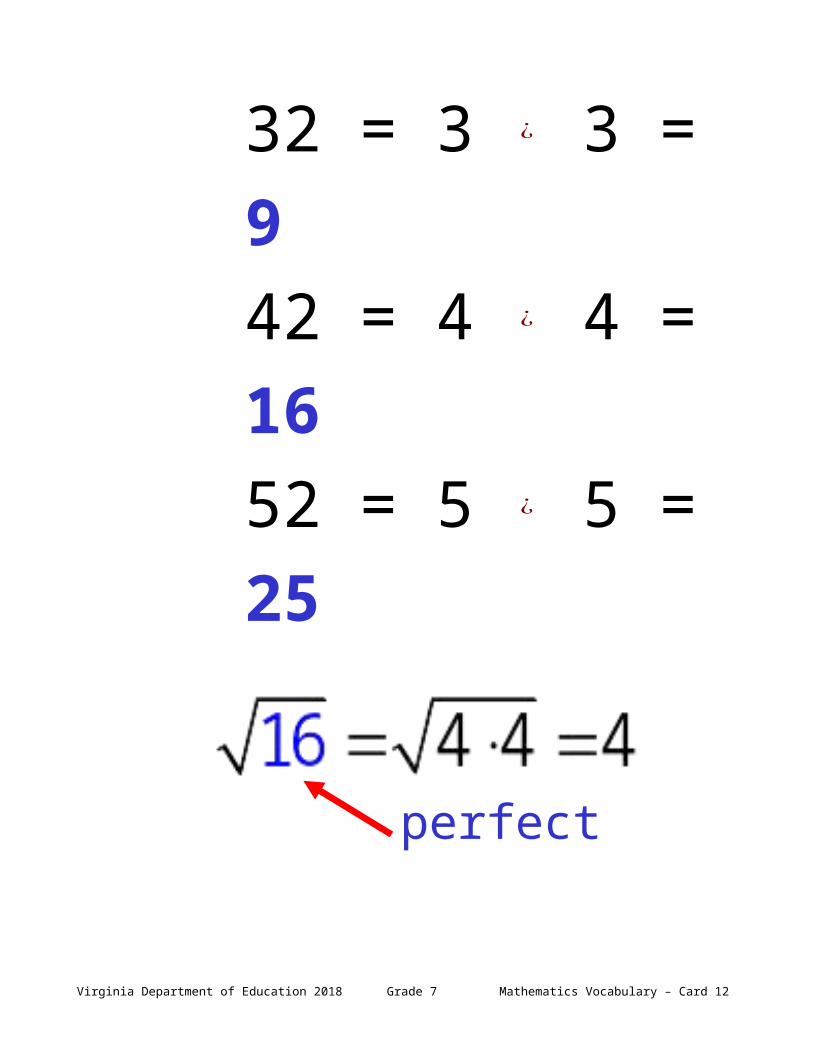
Perfect Squares02 = 0 ¿ 0 = 012 = 1 ¿ 1 = 122 = 2 ¿ 2 = 432 = 3 ¿ 3 = 942 = 4 ¿ 4 = 1652 = 5 ¿ 5 = 25
Virginia Department of Education 2018 Grade 7 Mathematics Vocabulary – Card 7
perfect square
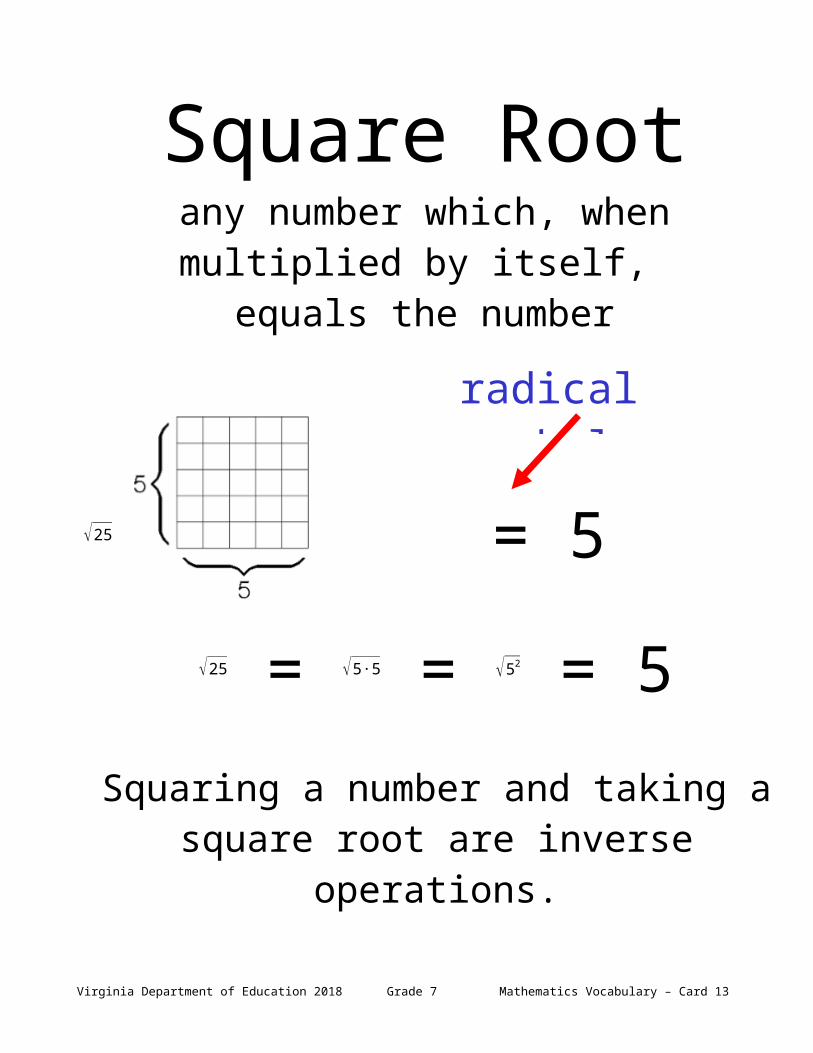
Square Rootany number which, when multiplied by itself,
equals the number
√25 = 5
√25 = √5∙5 = √52 = 5Squaring a number and taking a square root
are inverse operations.
Virginia Department of Education 2018 Grade 7 Mathematics Vocabulary – Card 8
radical symbol
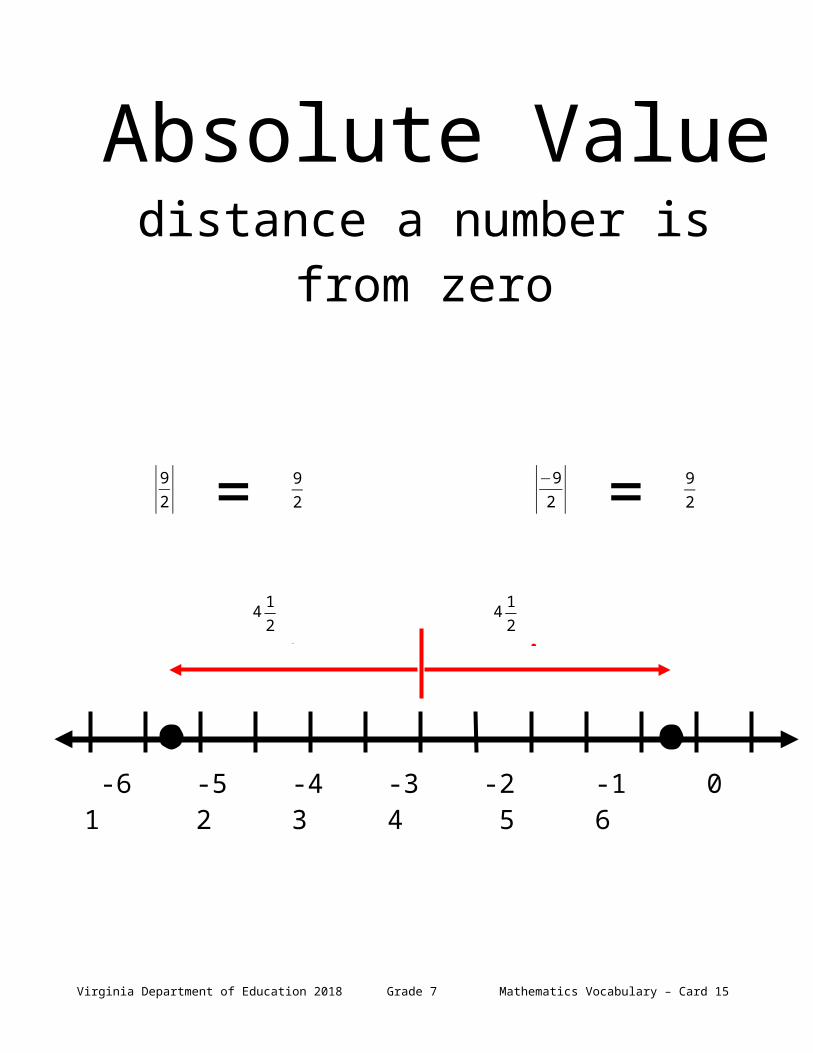
Absolute Valuedistance a number is from zero
|92| = 92 |−92 | = 92
Virginia Department of Education 2018 Grade 7 Mathematics Vocabulary – Card 9
-6 -5 -4 -3 -2 -1 0 1 2 3 4 5 6
4 12 units4 1
2 units
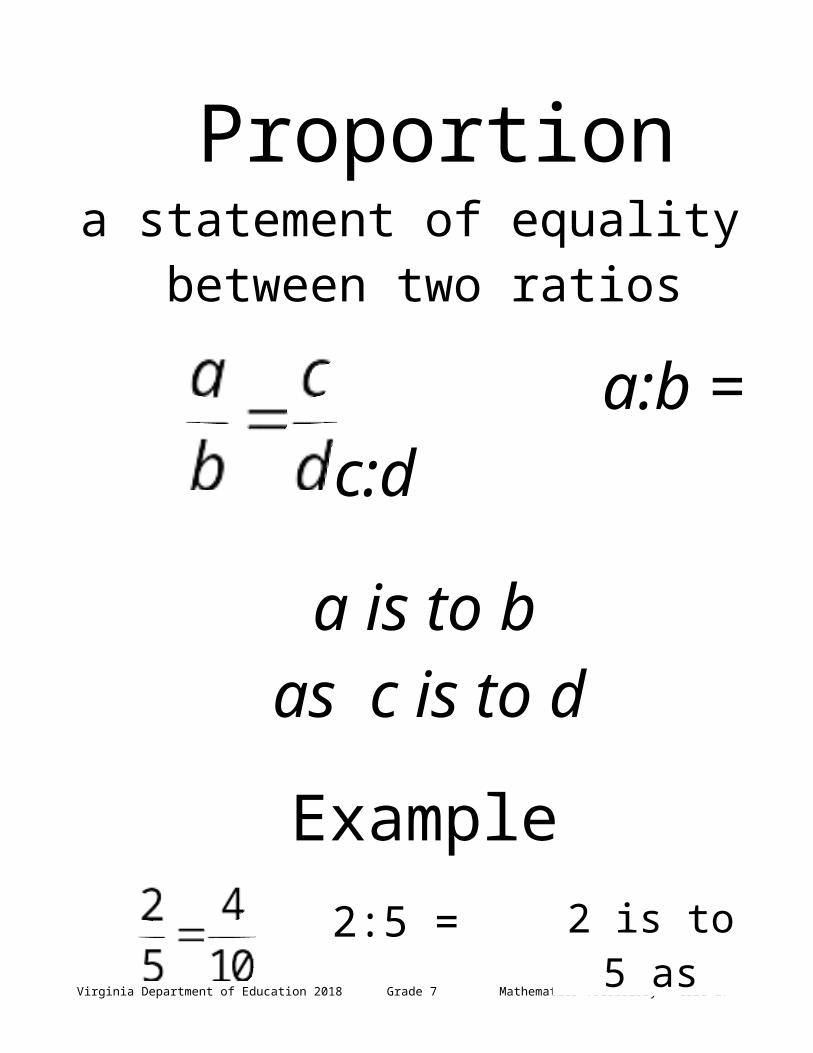
Proportion a statement of equality
between two ratios a:b =
c:d
a is to b as c is to d
Example
Virginia Department of Education 2018 Grade 7 Mathematics Vocabulary – Card 10
2:5 = 4:10 2 is to 5 as4 is to 10
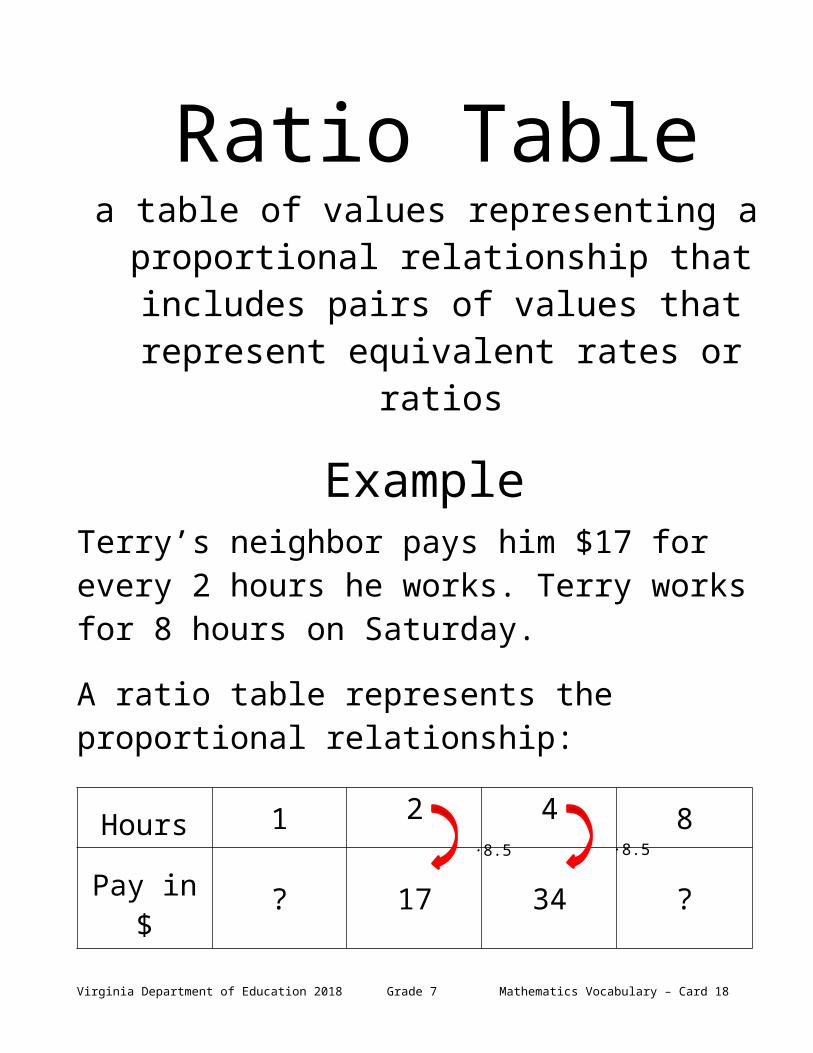
Ratio Tablea table of values representing a proportional relationship that includes pairs of values that
represent equivalent rates or ratios
ExampleTerry’s neighbor pays him $17 for every 2 hours he works. Terry works for 8 hours on Saturday.
A ratio table represents the proportional relationship:
Hours 1 2 4 8
Pay in $ ? 17 34 ?
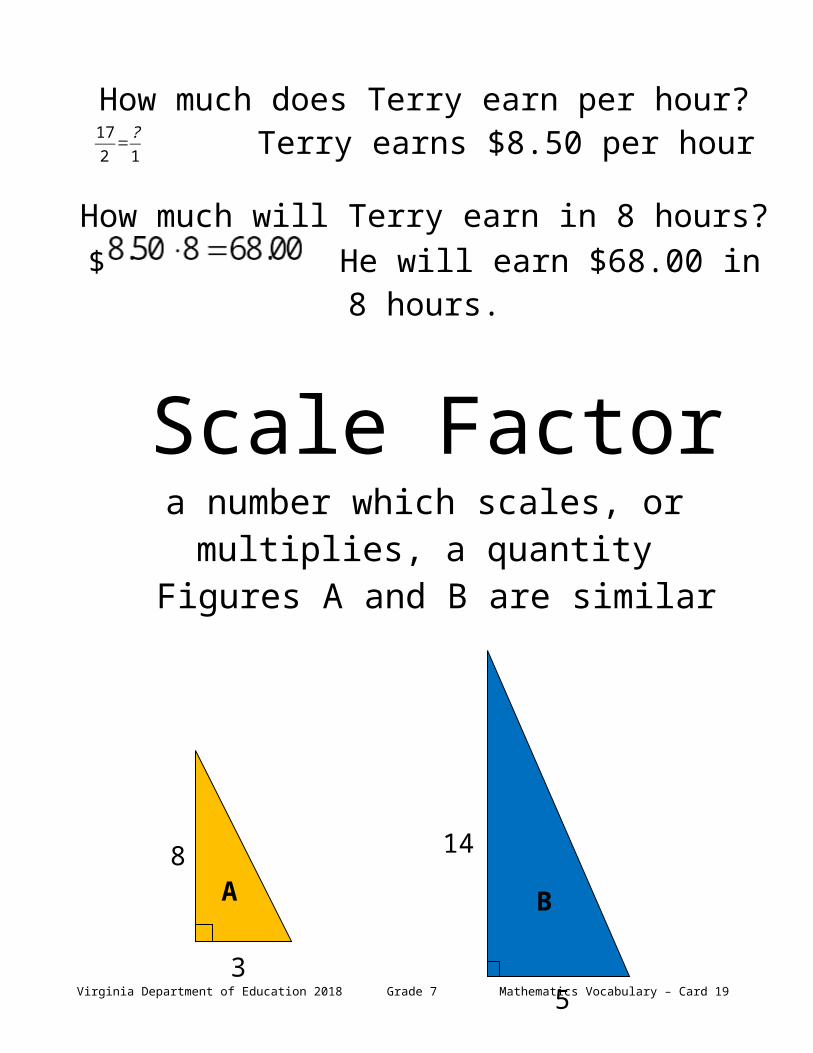
How much does Terry earn per hour?172
=?1 Terry earns $8.50 per hour
How much will Terry earn in 8 hours?$ He will earn $68.00 in 8 hours.
Virginia Department of Education 2018 Grade 7 Mathematics Vocabulary – Card 11
∙8.5 ∙8.5
Scale Factora number which scales, or multiplies, a quantity
Figures A and B are similar
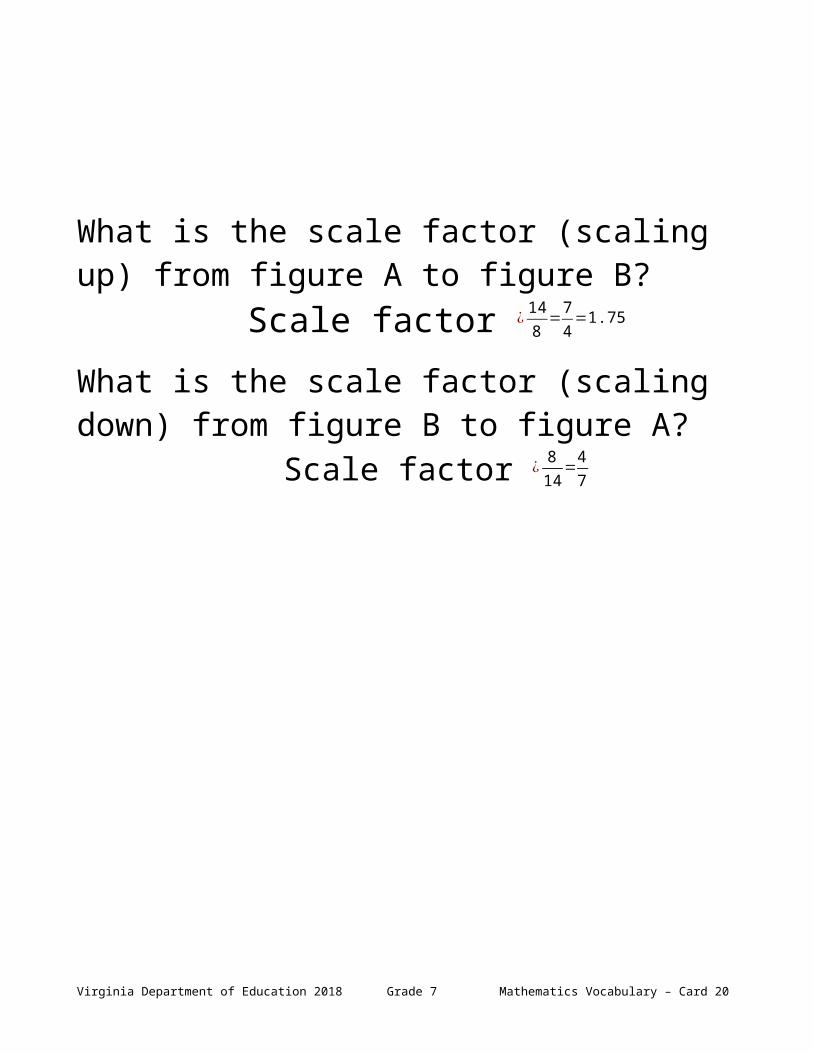
What is the scale factor (scaling up) from figure A to figure B?
Scale factor ¿ 148 =74=1.75
What is the scale factor (scaling down) from figure B to figure A?
Scale factor ¿ 814=47
Virginia Department of Education 2018 Grade 7 Mathematics Vocabulary – Card 12
A
3
8
B
514
14
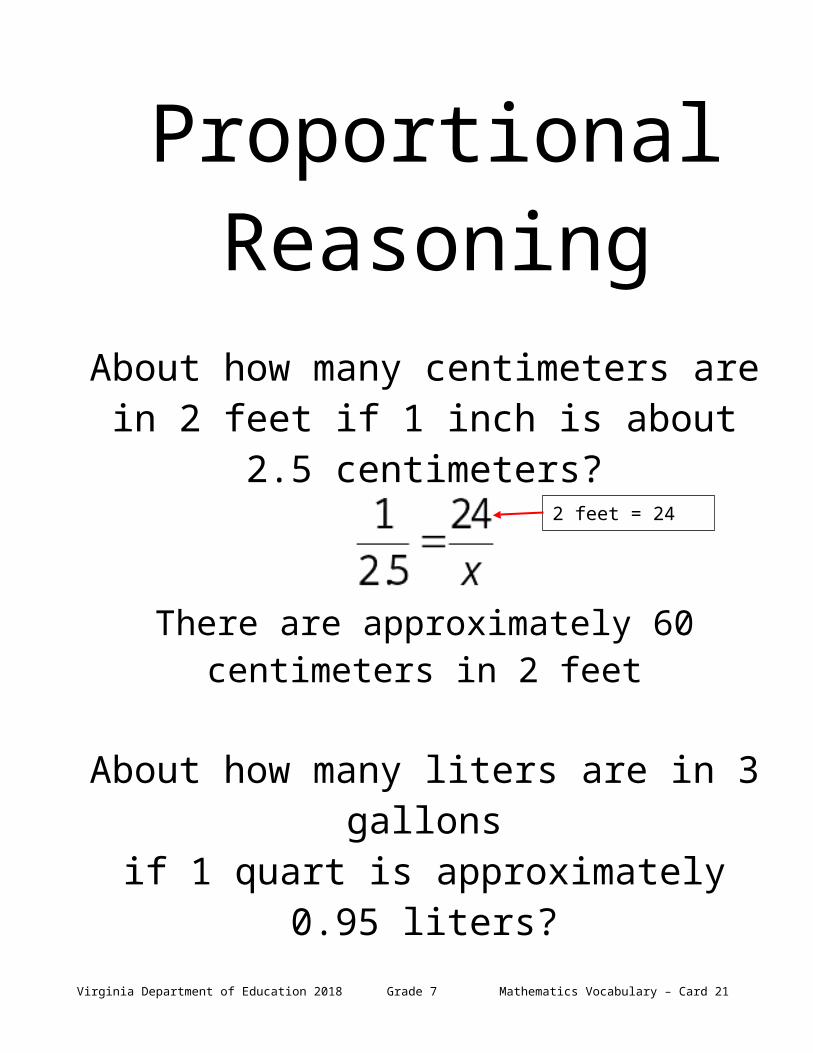
Proportional Reasoning
About how many centimeters are in 2 feet if 1 inch is about 2.5 centimeters?
There are approximately 60 centimeters in 2 feet
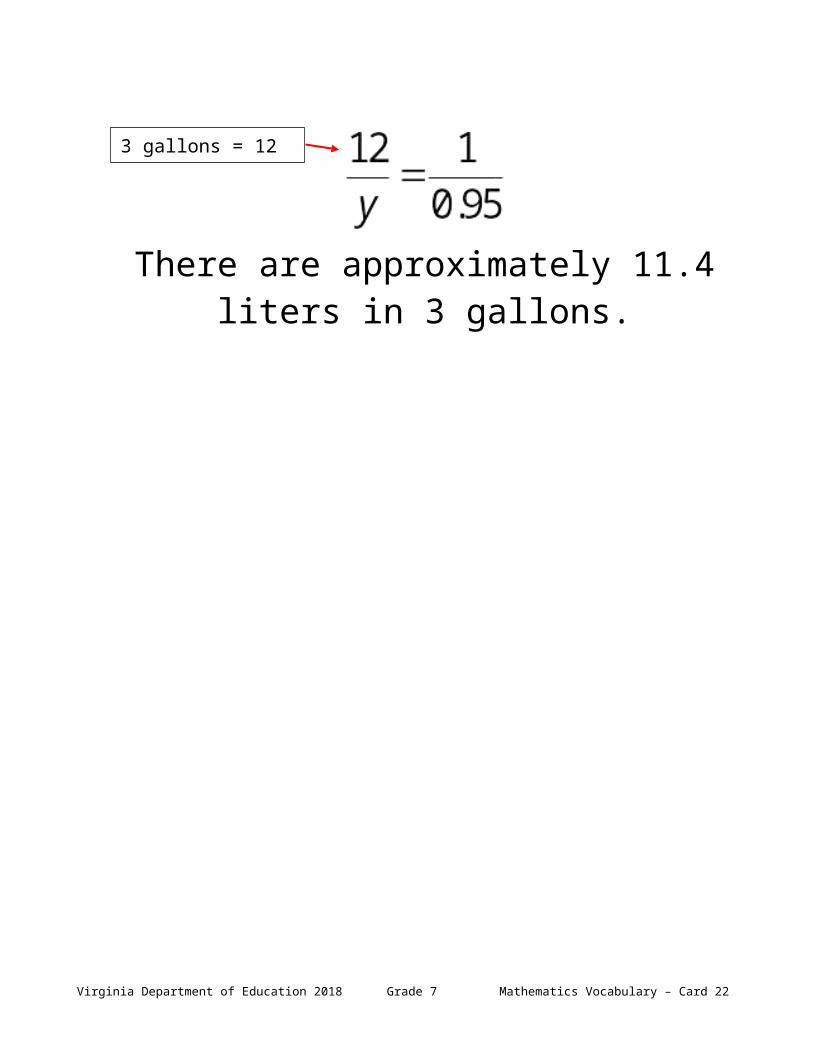
About how many liters are in 3 gallons if 1 quart is approximately 0.95 liters?
There are approximately 11.4 liters in 3 gallons.
Virginia Department of Education 2018 Grade 7 Mathematics Vocabulary – Card 13
2 feet = 24 inches
3 gallons = 12 quarts

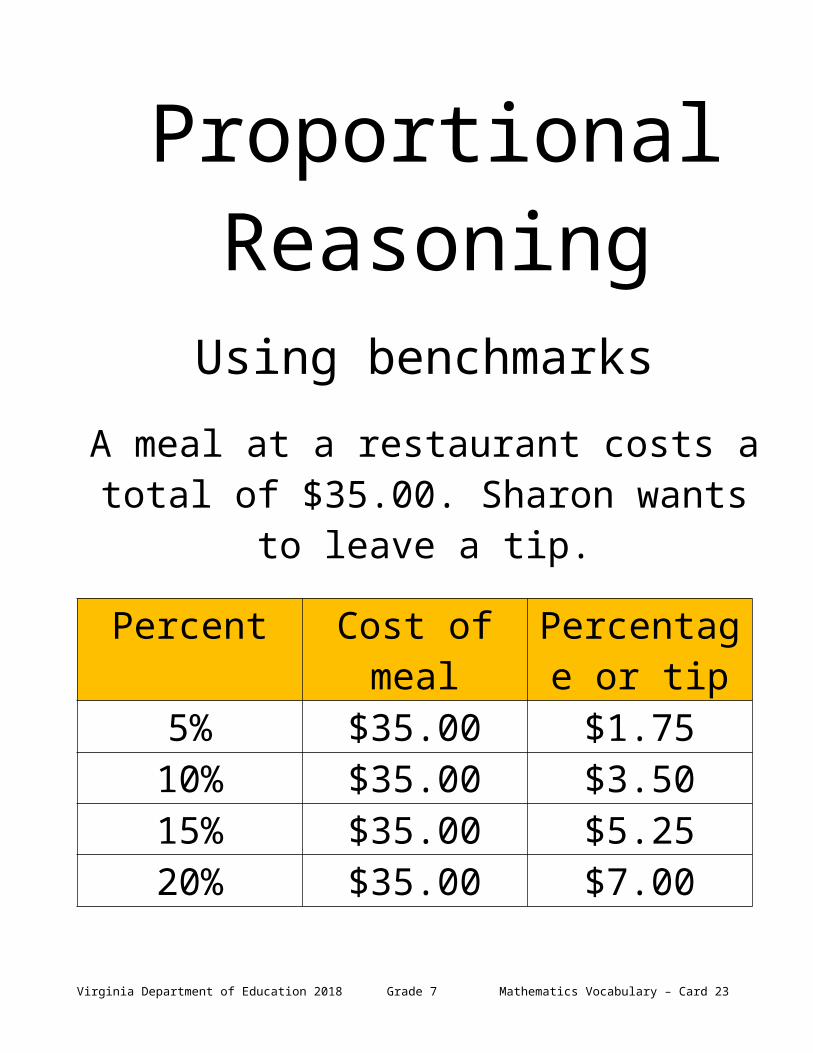
Proportional Reasoning
Using benchmarksA meal at a restaurant costs a total of $35.00.
Sharon wants to leave a tip.
Percent Cost of meal Percentage or tip
5% $35.00 $1.7510% $35.00 $3.5015% $35.00 $5.2520% $35.00 $7.00
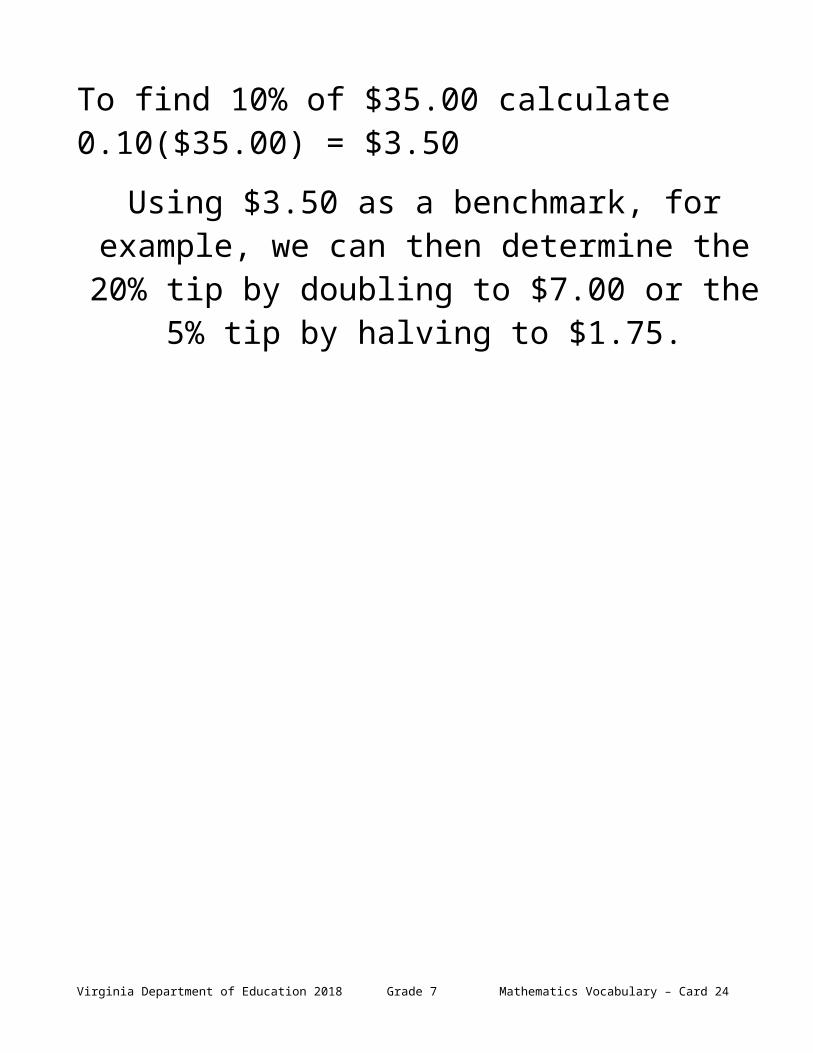
To find 10% of $35.00 calculate 0.10($35.00) = $3.50
Using $3.50 as a benchmark, for example, we can then determine the 20% tip by doubling to $7.00 or
the 5% tip by halving to $1.75.Virginia Department of Education 2018 Grade 7 Mathematics Vocabulary – Card 14
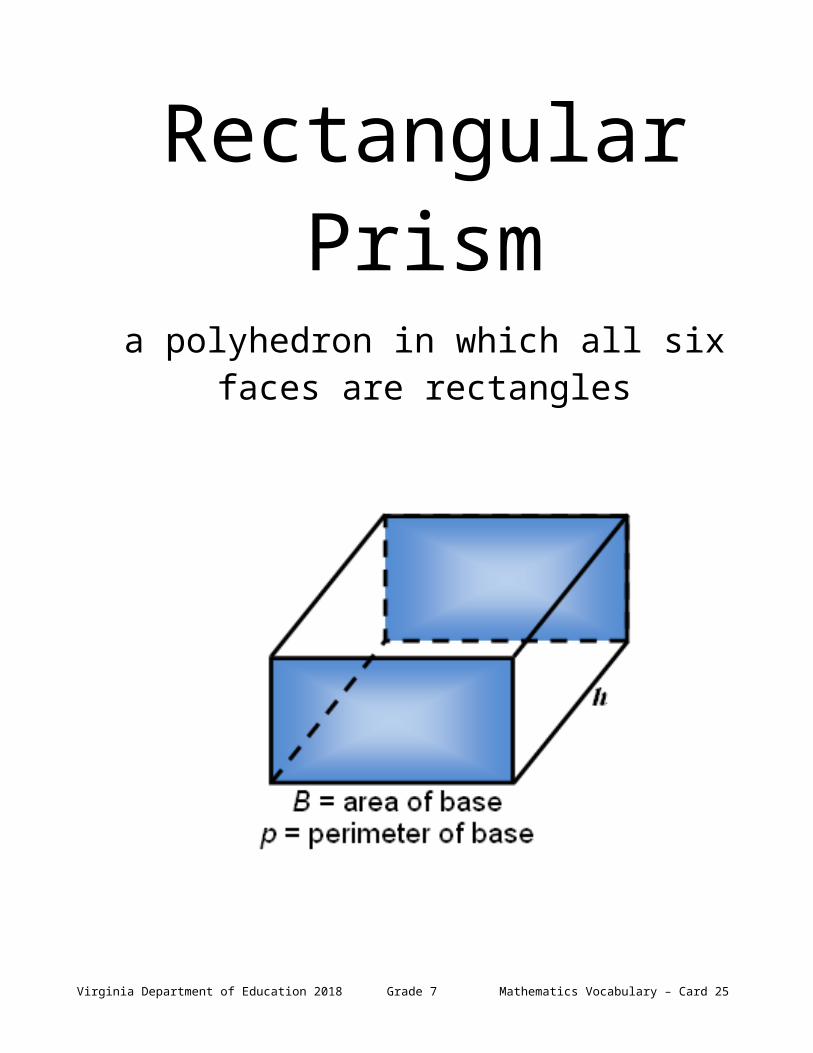
Rectangular Prisma polyhedron in which all six faces are rectangles
Volume = area of the base times the heightV = Bh
Surface area = height times the perimeter plus twice the area of the base
S.A. = hp + 2B
Virginia Department of Education 2018 Grade 7 Mathematics Vocabulary – Card 15

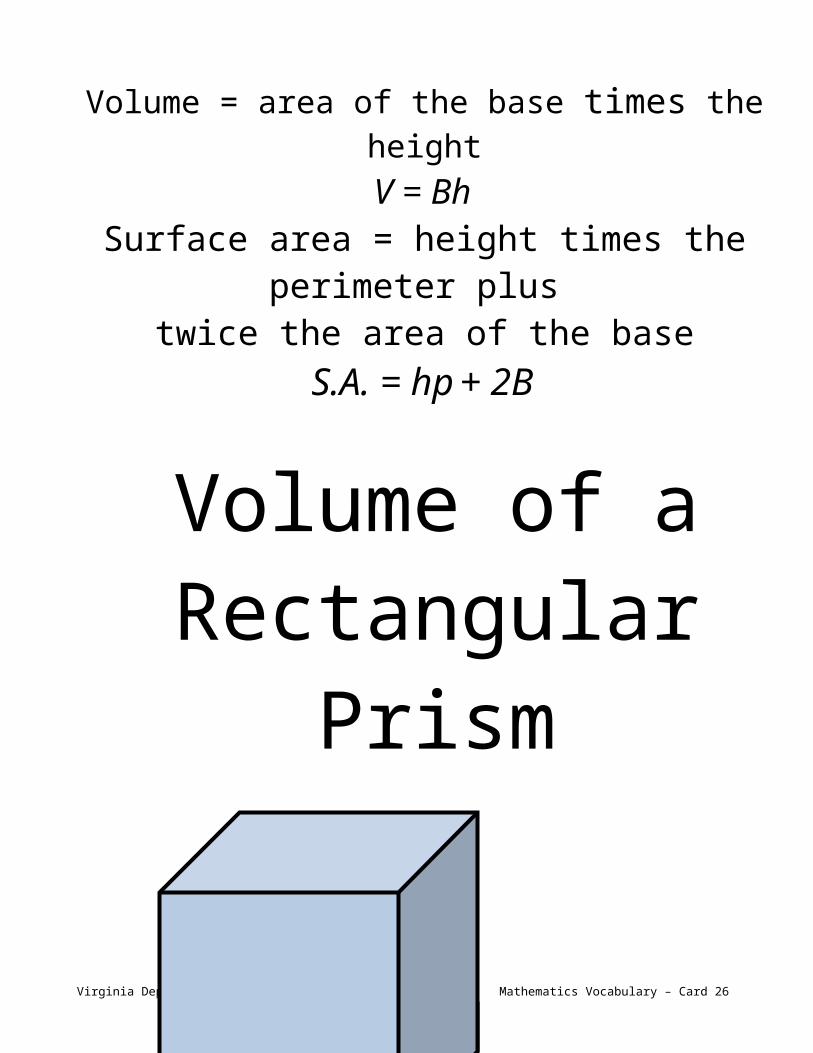
Volume of a Rectangular Prism
Virginia Department of Education 2018 Grade 7 Mathematics Vocabulary – Card 16
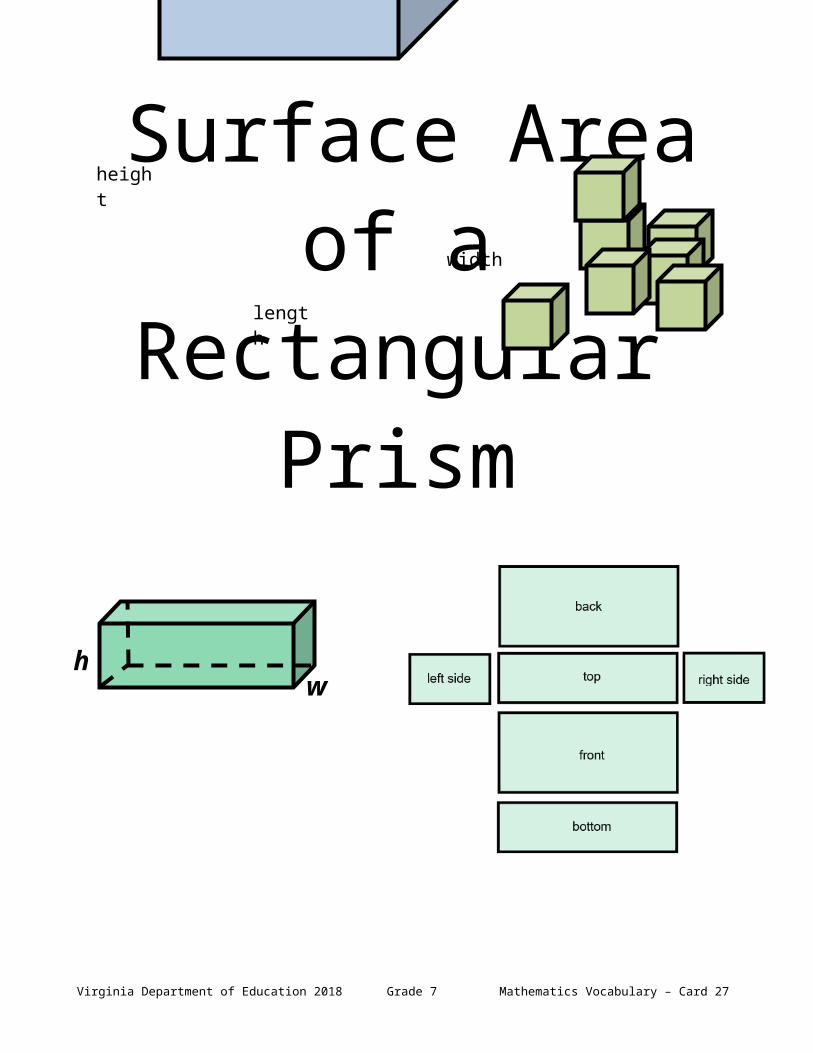
Surface Area of a Rectangular Prism
Virginia Department of Education 2018 Grade 7 Mathematics Vocabulary – Card 17
length
width
height
Volume = length · width · height
V = lwh
wh
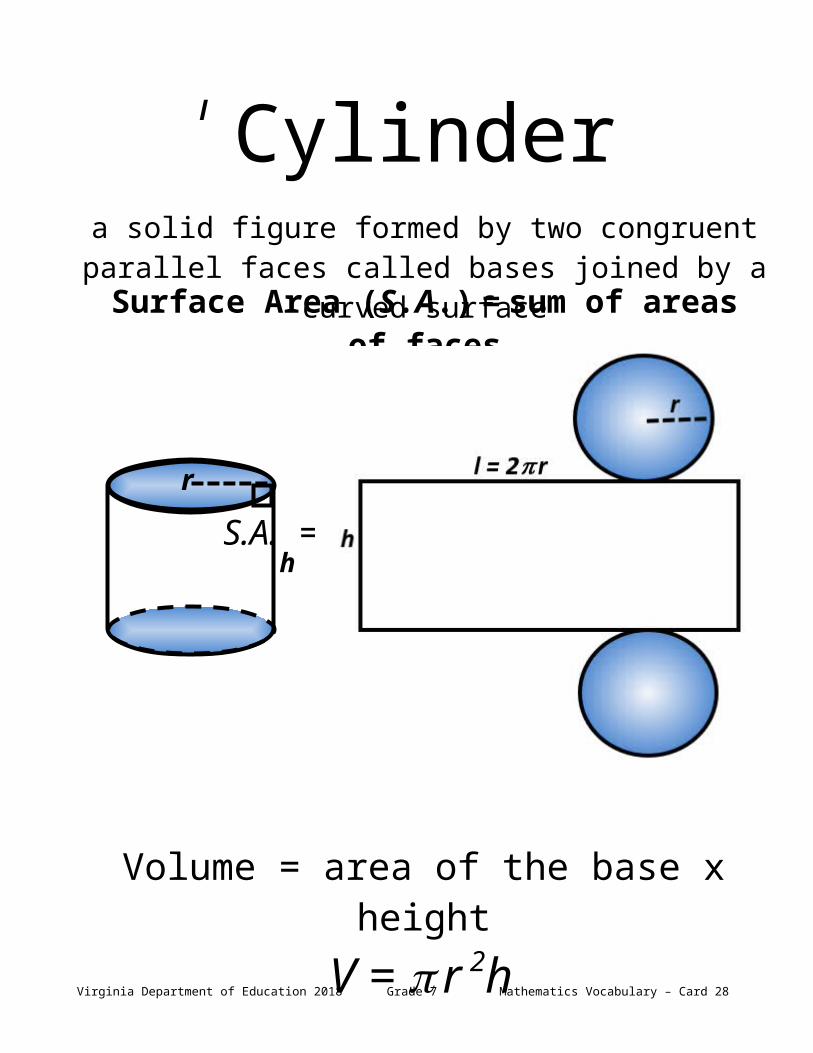
Cylindera solid figure formed by two congruent parallel faces
called bases joined by a curved surface
Virginia Department of Education 2018 Grade 7 Mathematics Vocabulary – Card 18
S.A. = 2lw + 2lh + 2wh
l
Surface Area (S.A.) = sum of areas of faces
Volume = area of the base x heightV = r 2h
S.A. = 2 r 2 + 2 r h
h
r
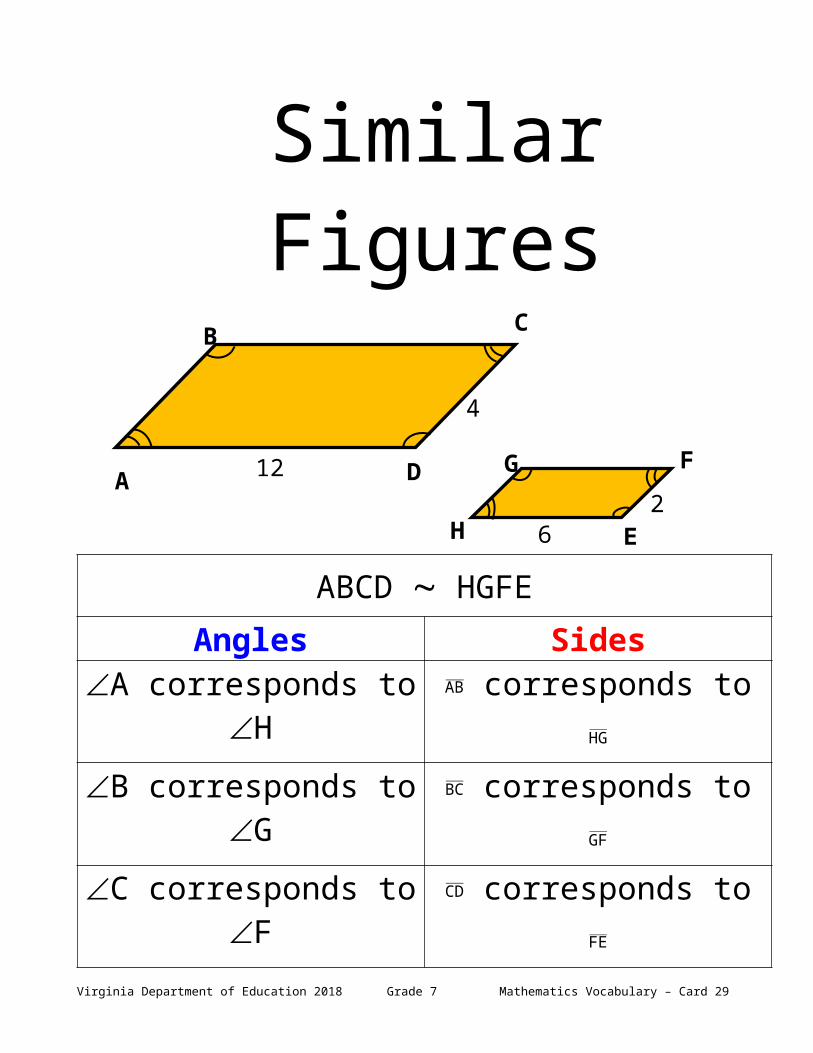
Similar Figures
ABCD HGFEAngles Sides
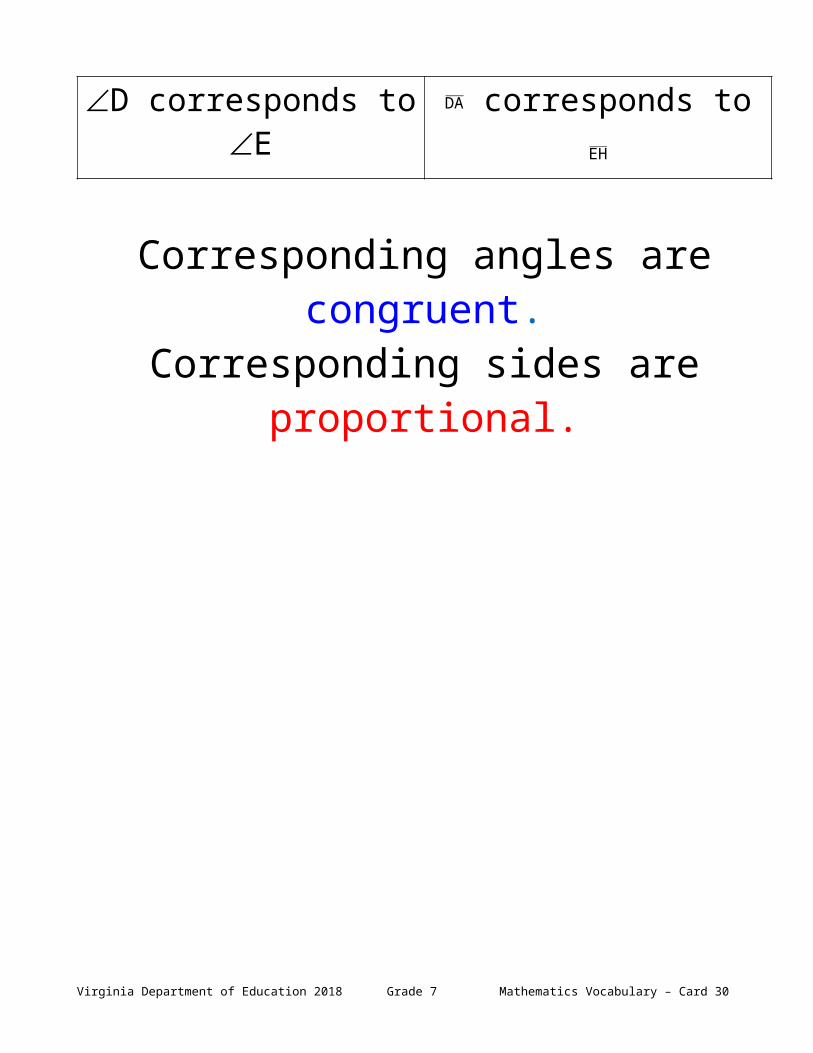
A corresponds to H AB corresponds to HGB corresponds to G BC corresponds to GFC corresponds to F CD corresponds to FED corresponds to E DA corresponds to EH
Corresponding angles are congruent.Corresponding sides are proportional.
Virginia Department of Education 2018 Grade 7 Mathematics Vocabulary – Card 19
12
6
4
2H
G F
E
C
D
B
A
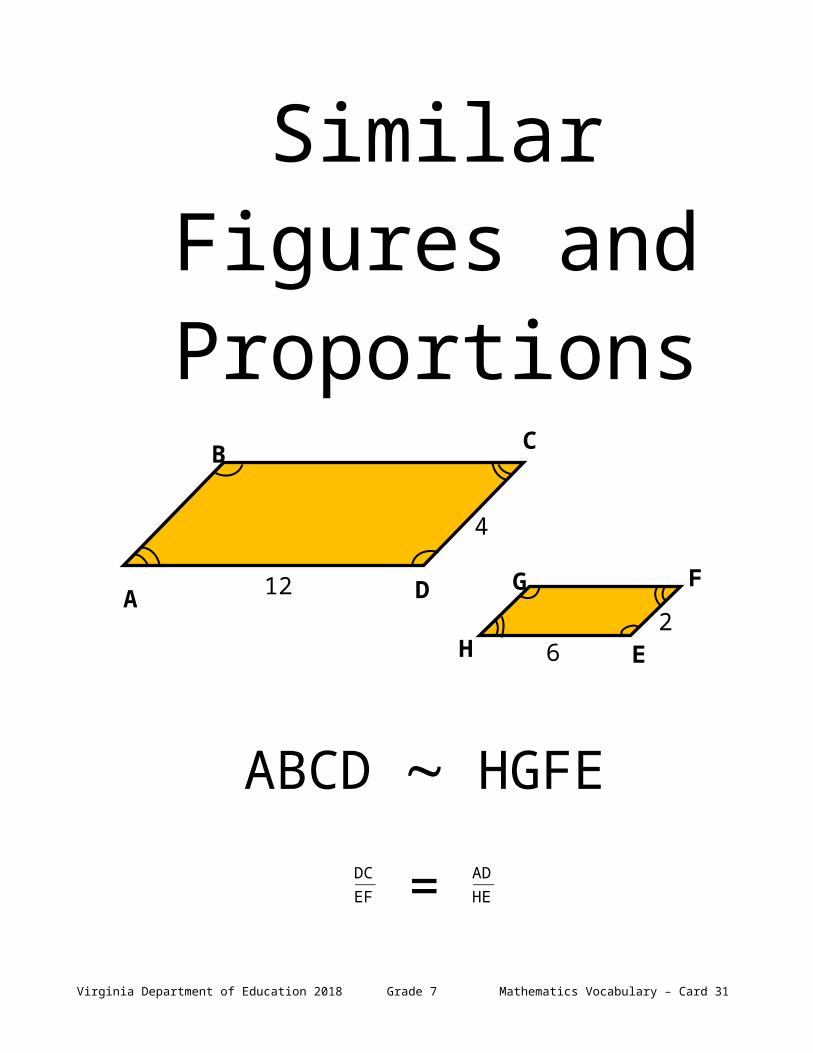
Similar Figures and Proportions
ABCD HGFEDCEF = ADHE
42 = 126
Virginia Department of Education 2018 Grade 7 Mathematics Vocabulary – Card 20
12
6
4
2H
G F
E
C
D
B
A
Quadrilaterals Relationships
Virginia Department of Education 2018 Grade 7 Mathematics Vocabulary – Card 21
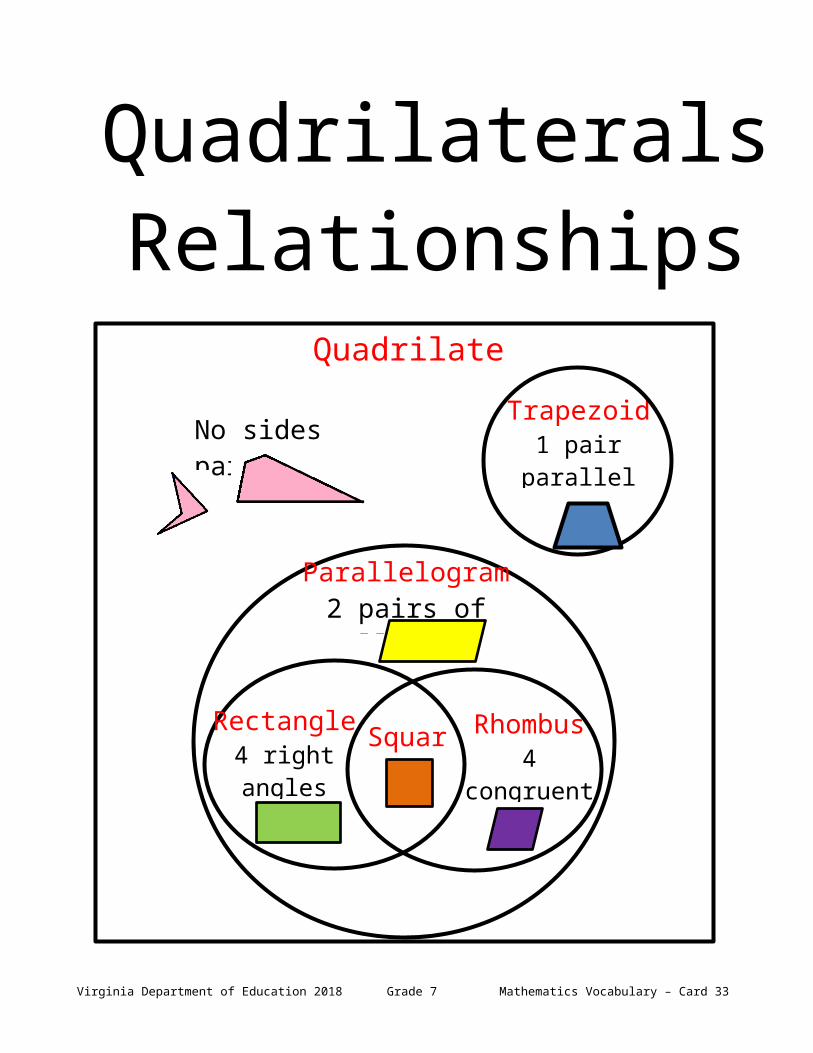
Quadrilaterals
No sides parallelTrapezoid
1 pair parallel sides
Parallelogram2 pairs of parallel sides
Rectangle4 right angles
Rhombus4 congruent
sides
Square
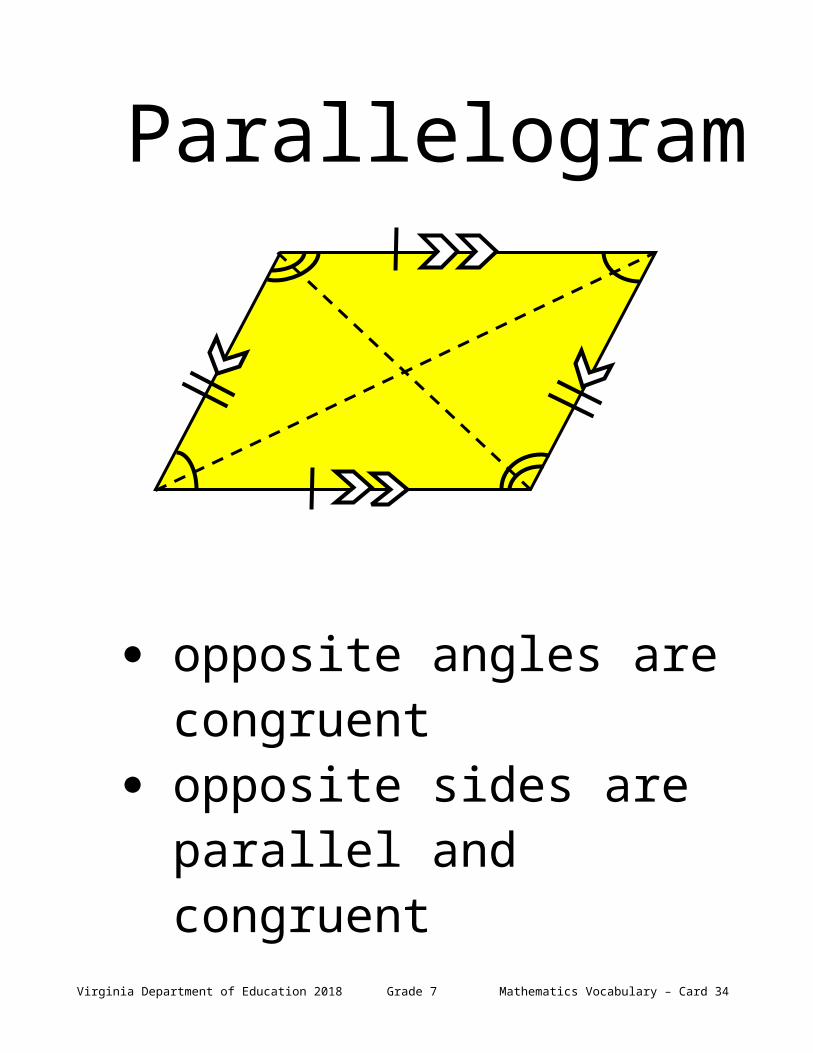
Parallelogram
opposite angles are congruent opposite sides are parallel and
congruent diagonals bisect each other
Virginia Department of Education 2018 Grade 7 Mathematics Vocabulary – Card 22
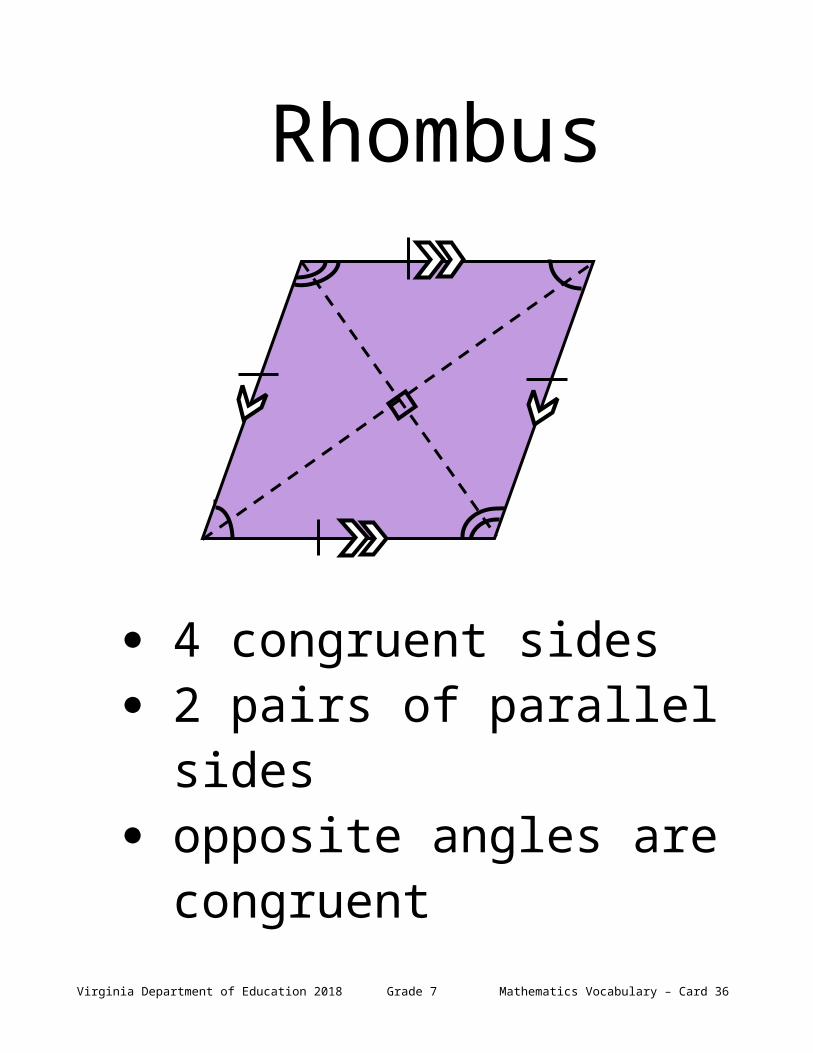
Rhombus
4 congruent sides 2 pairs of parallel sides opposite angles are congruent diagonals bisect each other at
right angles
Virginia Department of Education 2018 Grade 7 Mathematics Vocabulary – Card 23
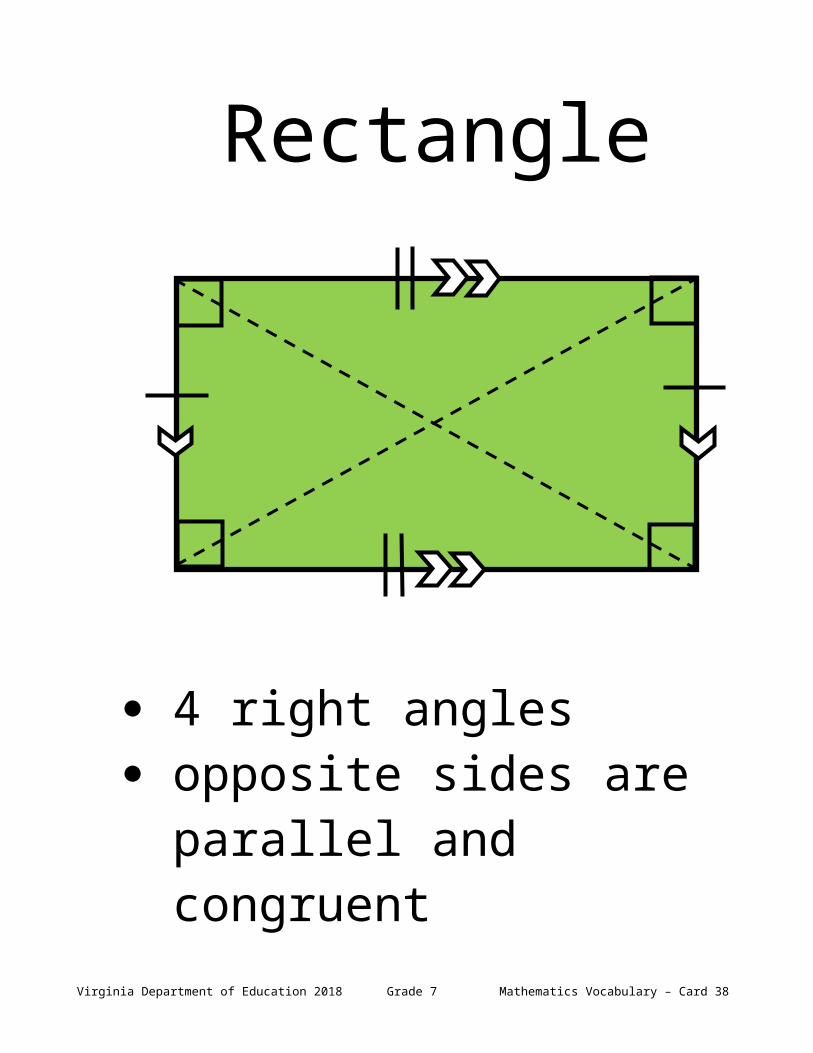
Rectangle
4 right angles opposite sides are parallel and
congruent diagonals are congruent and
bisect each other
Virginia Department of Education 2018 Grade 7 Mathematics Vocabulary – Card 24
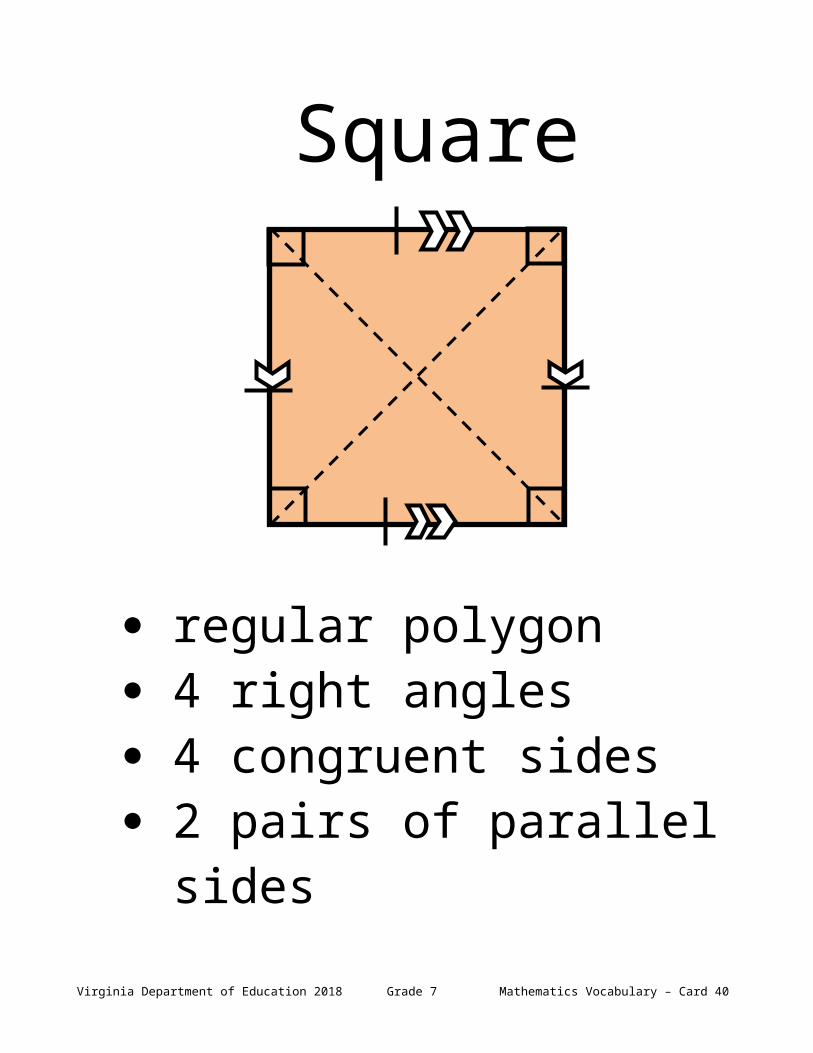
Square
regular polygon 4 right angles 4 congruent sides 2 pairs of parallel sides diagonals are congruent and
bisect each other at right angles
Virginia Department of Education 2018 Grade 7 Mathematics Vocabulary – Card 25
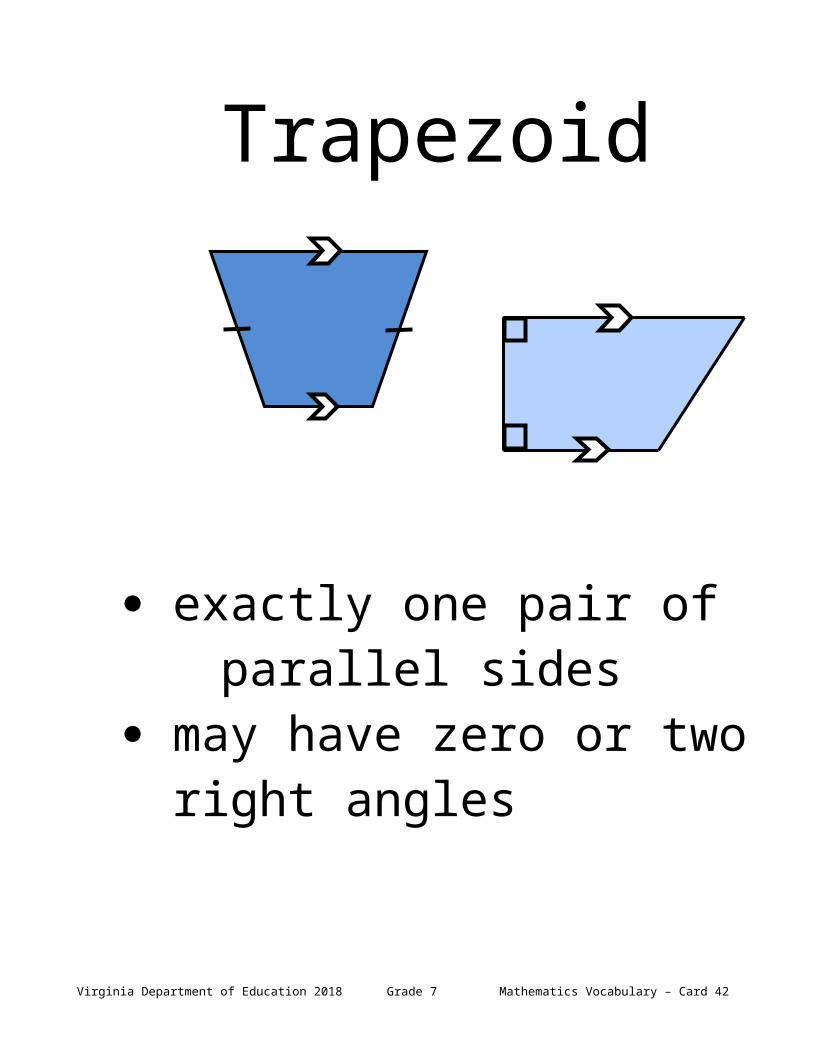
Trapezoid
exactly one pair of parallel sides
may have zero or two right angles
may have zero or one pair of congruent sides
Virginia Department of Education 2018 Grade 7 Mathematics Vocabulary – Card 26
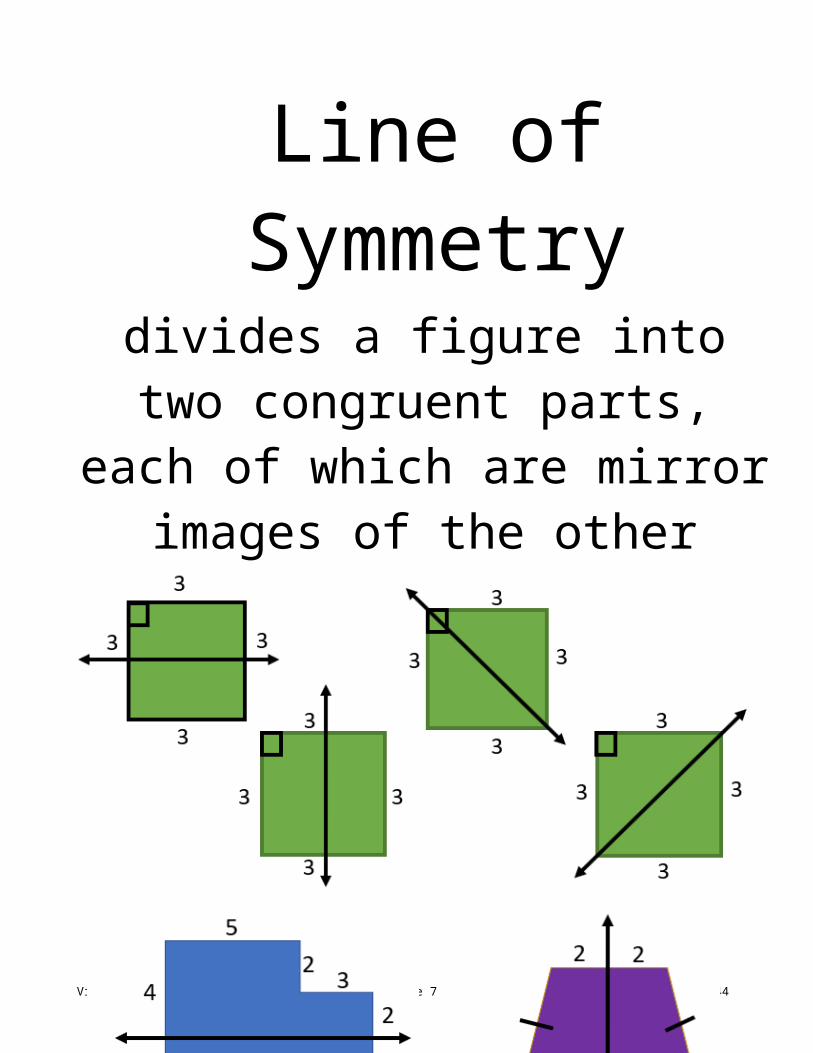
Line of Symmetrydivides a figure into two congruent
parts, each of which are mirror images of the other
Virginia Department of Education 2018 Grade 7 Mathematics Vocabulary – Card 27
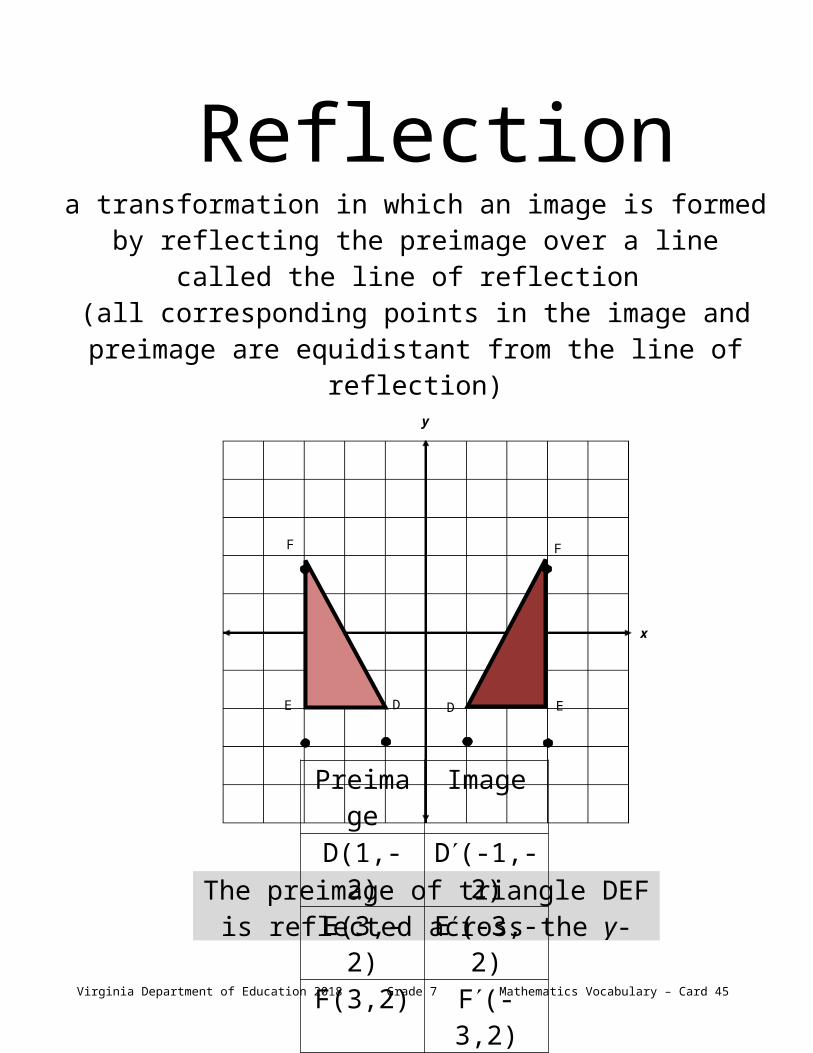
Reflectiona transformation in which an image is formed by reflecting the
preimage over a line called the line of reflection (all corresponding points in the image and preimage are
equidistant from the line of reflection)
Virginia Department of Education 2018 Grade 7 Mathematics Vocabulary – Card 28
F
E D E
F
D
x
y
The preimage of triangle DEF is reflected across the y-axis to create the image D’E’F’
Preimage ImageD(1,-2) D(-1,-2)E(3,-2) E(-3,-2)F(3,2) F(-3,2)
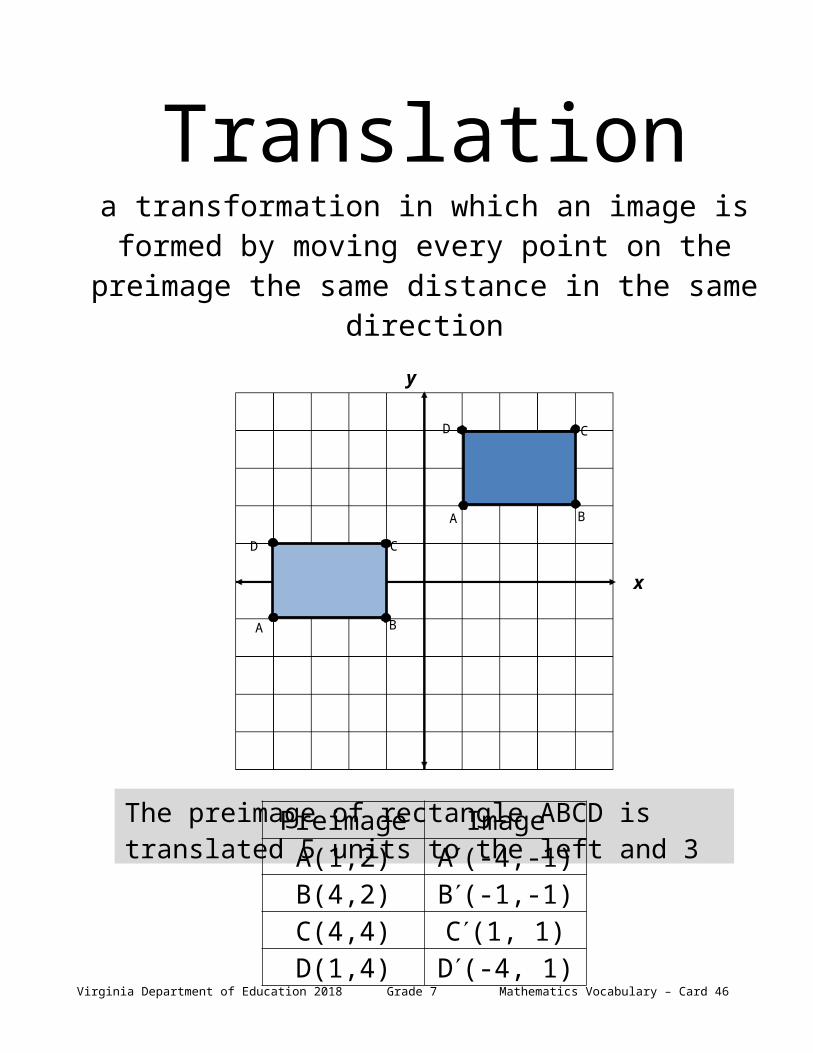
Translationa transformation in which an image is formed by moving
every point on the preimage the same distance in the same direction
Virginia Department of Education 2018 Grade 7 Mathematics Vocabulary – Card 29
y
xCD
A B
The preimage of rectangle ABCD is translated 5 units to the left and 3 units down to create the image A’B’C’D’
D
B
C
A
Preimage ImageA(1,2) A(-4,-1)B(4,2) B(-1,-1)C(4,4) C(1, 1)D(1,4) D(-4, 1)
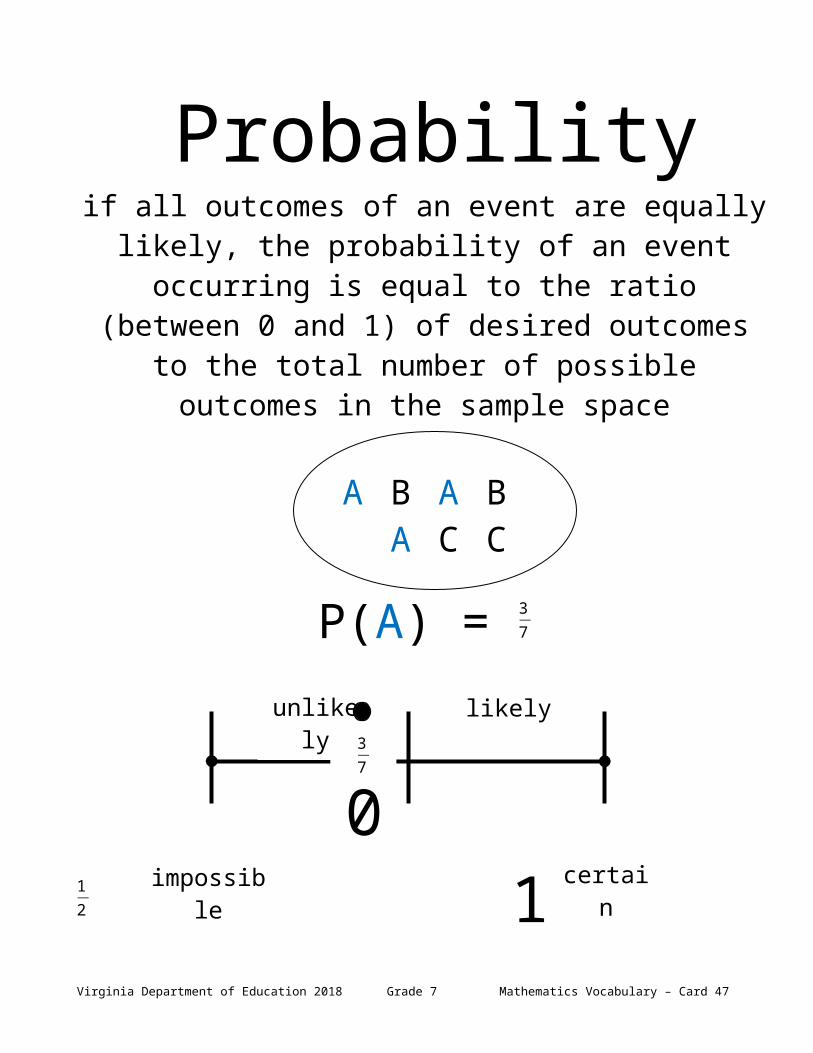
Probabilityif all outcomes of an event are equally likely, the
probability of an event occurring is equal to the ratio (between 0 and 1) of desired outcomes to the total number of possible outcomes in the sample space
A B A BA C C
P(A) = 37
0 12 1
Virginia Department of Education 2018 Grade 7 Mathematics Vocabulary – Card 30
impossible certain
unlikely likely37
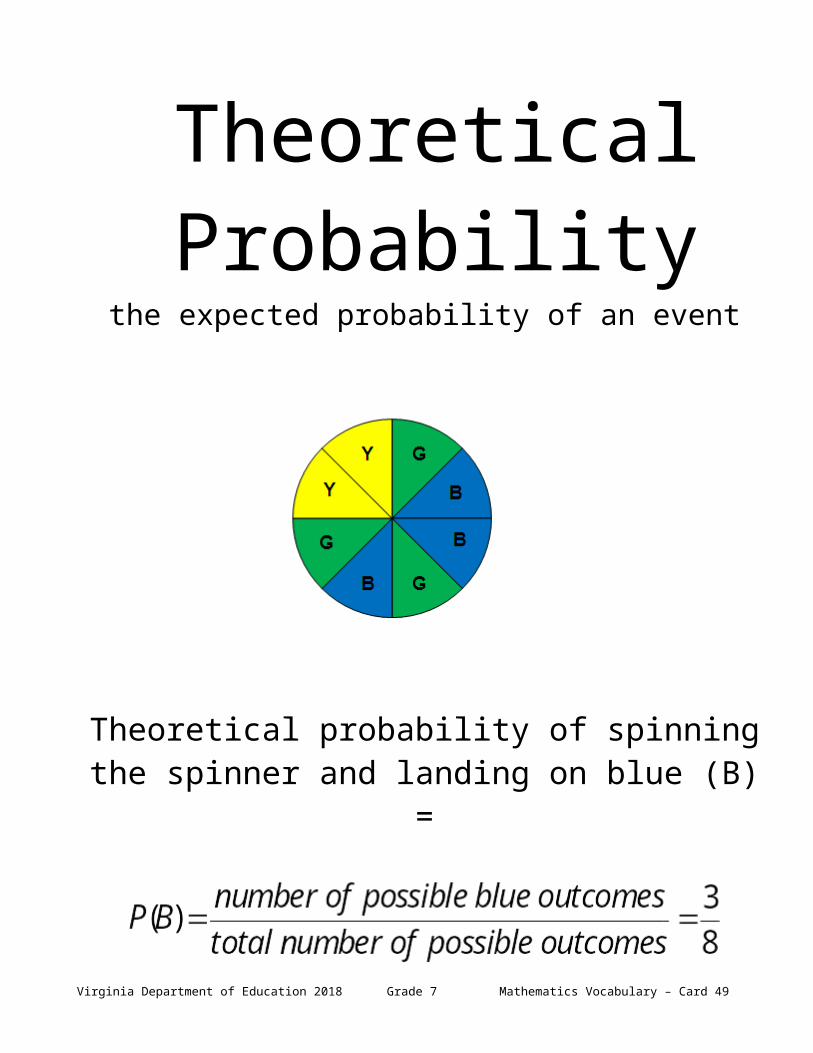
Theoretical Probability
the expected probability of an event
Theoretical probability of spinning the spinner and landing on blue (B) =
Virginia Department of Education 2018 Grade 7 Mathematics Vocabulary – Card 31
Experimental Probability
the probability of an event determined by carrying out a simulation or experiment
Jane spun the spinner 20 times. Her result is shown in the table.
Color NumberYellow (Y) 4Green (G) 6Blue (B) 10
Experimental probability of spinning the spinner and landing on blue =
Virginia Department of Education 2018 Grade 7 Mathematics Vocabulary – Card 32
Histograma graph that provides a visual interpretation of numerical
data by indicating the number of data points that lie within a range of values, called a class or a bin (the
frequency of the data that falls in each class or bin is depicted by the use of a bar)
Virginia Department of Education 2018 Grade 7 Mathematics Vocabulary – Card 33
intervals
frequency
Comparing Graphs
Virginia Department of Education 2018 Grade 7 Mathematics Vocabulary – Card 34
The histogram provides a visual interpretation of numerical data.The stem and leaf chart shows all the data in a set.The stem and leaf chart can be used to find the mean, median or mode.
Comparing Graphs
Virginia Department of Education 2018 Grade 7 Mathematics Vocabulary – Card 35
Neither chart displays the entire data set.The mode and the median can not be found without knowing all the data in a set.The histogram displays trends. The circle graph shows parts to the whole.
Comparing Graphs
Virginia Department of Education 2018 Grade 7 Mathematics Vocabulary – Card 36
The histogram provides a visual interpretation of numerical data.The line plot displays all data in the set.The line plot can be used to find the mean, median, or mode.
Slopea rate of change in a proportional
relationship between two quantities
Slope= change∈ ychange∈x
= vertical changehorizontal change
Virginia Department of Education 2018 Grade 7 Mathematics Vocabulary – Card 37
Unit Rate number of units of the first quantity of a ratio compared
to 1 unit of the second quantity (also called the constant of proportionality)
A student walks 2 miles per hour
Unit rate =
Virginia Department of Education 2018 Grade 7 Mathematics Vocabulary – Card 38
Proportional Relationship
y=mx
(m is the slope)
Example: y = 43 x
Virginia Department of Education 2018 Grade 7 Mathematics Vocabulary – Card 39
m = 43
Proportional Relationship
Points representing a proportional relationship: {(0, 0), (6, 1.5), (10, 2.5),
(20, 5), and (24, 6)}.
The slope, rate of change, or ratio of y to x isyx = 1.56 = 2.510 = 520 = 624 = 14 = 0.25
The equation representing the proportional relationship of y to x is
y=mx or y = 14x or y = 0.25x.
Virginia Department of Education 2018 Grade 7 Mathematics Vocabulary – Card 40
Additive Relationship
a relationship between two quantities in which one quantity is a result of adding a value to the other quantity
y=x+b
(b is the y-intercept)
Example: y = x + (-2)
Virginia Department of Education 2018 Grade 7 Mathematics Vocabulary – Card 41
b = -2
(0,-2)
x y-3 -5-2 -4-1 -30 -21 -12 03 1
Additive Relationship
Tomas is three years younger than his sister, Maria. The table represents their ages at various times.
Maria (x) 4 5 6 11Tomas (y) 1 2 3 8
The difference in their ages is always -3.
The equation representing the relationship between their ages is
y = x + (-3) or y = x - 3
Virginia Department of Education 2018 Grade 7 Mathematics Vocabulary – Card 42
–3
Graphing Linear Relationships
Virginia Department of Education 2018 Grade 7 Mathematics Vocabulary – Card 43
1
2(2,4)
1 2 3 4 5 6 7 8 9 10
1 2 3 4 5 6 7
y
x
Slope = 2 = vertical changehorizontal change
=21
Graph the line representing the proportional relationship with
slope of 2 and passing through the point (2,4).
Graph the line representing the additive relationship with slope
of 2 and passing through the point (0,4).
y
x1 2 3 4 5 6 7
1 2
3
4
5
6 7
8
9
10
(0,4)
21
Connecting Representations
Proportional Relationship
The total distance Sam walks depends on how long he walks. If he walks at a rate of 2.1 mph, show multiple
representations of the relationship.
Virginia Department of Education 2018 Grade 7 Mathematics Vocabulary – Card 44
The scale on the x-axis needs to be moved over a little to the right.
1 2
3
4
5
6 7
8
9
10
1 2 3 4 5 6 7
Connecting Representations
Additive Relationship
Janice started with $5 in her piggybank. If she adds $1 each week, show the total amount in her piggybank any week using multiple representations.
Virginia Department of Education 2018 Grade 7 Mathematics Vocabulary – Card 45
a = w + 5
a
w1 2 3 4 5 6 7
1 2
3
4
5
6
7 8
9
10
w a0 51 62 75 10
Order of Operations
Grouping Symbols
Exponents
Multiplicationor Division
Addition Subtraction
Virginia Department of Education 2018 Grade 7 Mathematics Vocabulary – Card 46
Left to
right
Left to
right
( ) √❑||
[ ] ❑❑
Verbal and Algebraic Expressions and
EquationsVerbal Algebraic
A number multiplied by 5 5n
The sum of negative two and a number
-2 + n
The sum of five times a number and two is five
5y + 2 = 5
Negative three is one-fifth of a number increased by
negative three fifths-3 = 15x + (−3
5 )
Virginia Department of Education 2018 Grade 7 Mathematics Vocabulary – Card 47

Equationa mathematical sentence stating that two
expressions are equal
2.76 + 3 = n + 2.76
3x + (-5.1) = 3 34
Virginia Department of Education 2018 Grade 7 Mathematics Vocabulary – Card 48
6 + 2x = 10
Virginia Department of Education 2018 Grade 7 Mathematics Vocabulary – Card 49

Inequality
Virginia Department of Education 2018 Grade 7 Mathematics Vocabulary – Card 50
Example 2 −3(n−4)<0
−3n+12<0
−3n+12−12<0−12
−3n←12
−3n−3
>−12−3
n>4
Example 1 −3 r ≤7.5−3 r−3
≥ 7.5−3
r ≥−2.5
Example 3 x−7−3
≥4
−3 ∙ x−7−3
≤−3 ∙4
x−7≤−12x−7+7≤−12+7
x≤−5