Embed Size (px)
Citation preview
MiHpt Membrane Interface Probe
+ Hydraulic Profiling Tool
Tom Christy, PE Wes McCall, PG Dan Pipp, Chemist Geoprobe Systems®
Anders Christensen Klaus Weber NIRAS, Denmark
Mads Terkelsen Danish Capital Region
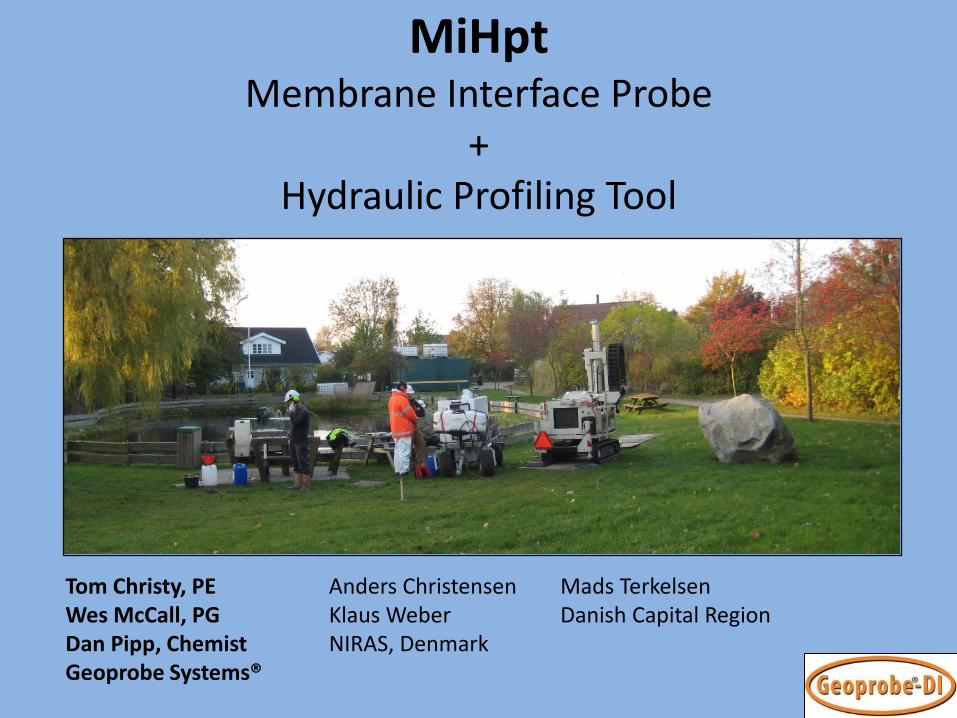
Outline
• How Does MIP Work ? MIP Log • How Does HPT Work? HPT Log • The Combined MiHpt Probe & Log • Cross Sections with MiHpt logs • Developing a Conceptual Site Model
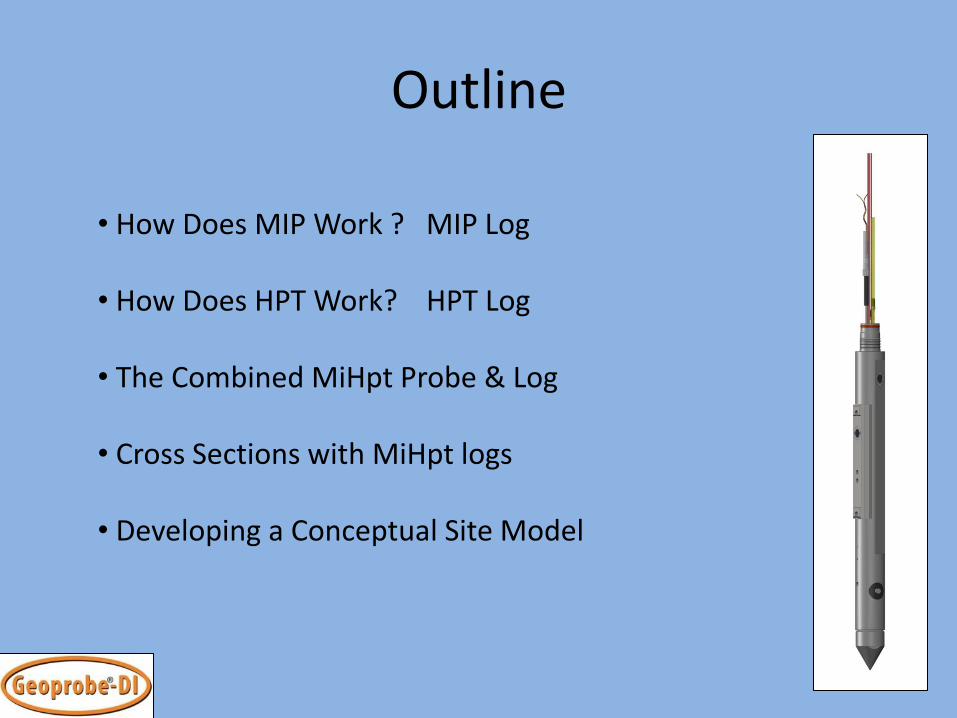
EC Dipole
Heater Block
The MIP Probe
Membrane
Trunkline Connections
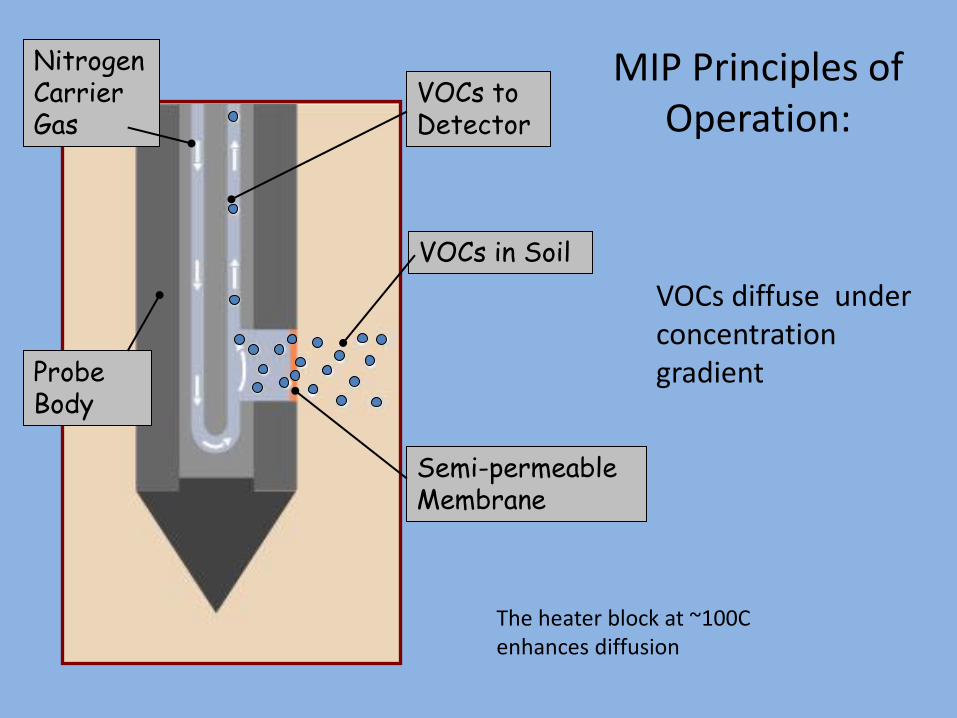
VOCs to Detector
VOCs in Soil
Semi-permeable Membrane
Probe Body
Nitrogen Carrier Gas
VOCs diffuse under concentration gradient
MIP Principles of Operation:
The heater block at ~100C enhances diffusion
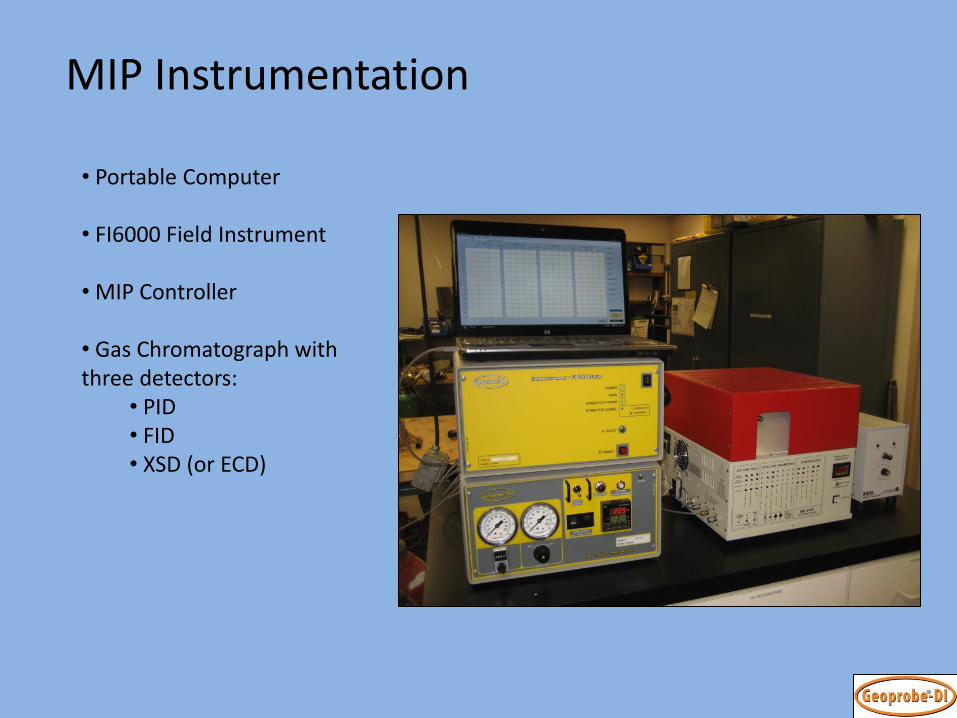
MIP Instrumentation
• Portable Computer • FI6000 Field Instrument • MIP Controller • Gas Chromatograph with three detectors:
• PID • FID • XSD (or ECD)
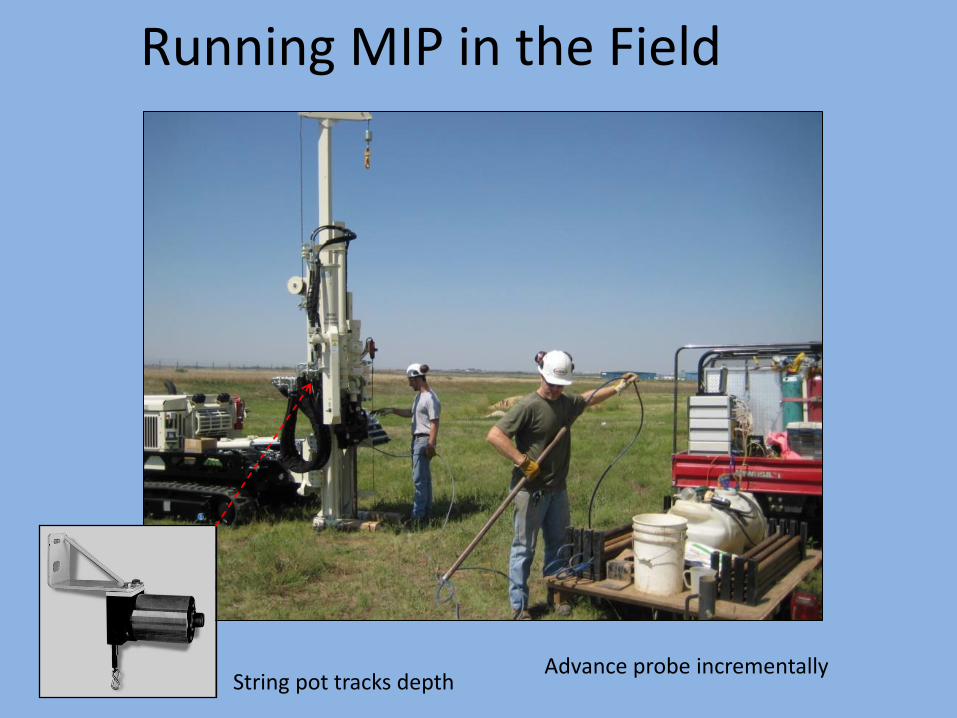
Running MIP in the Field
Advance probe incrementally String pot tracks depth
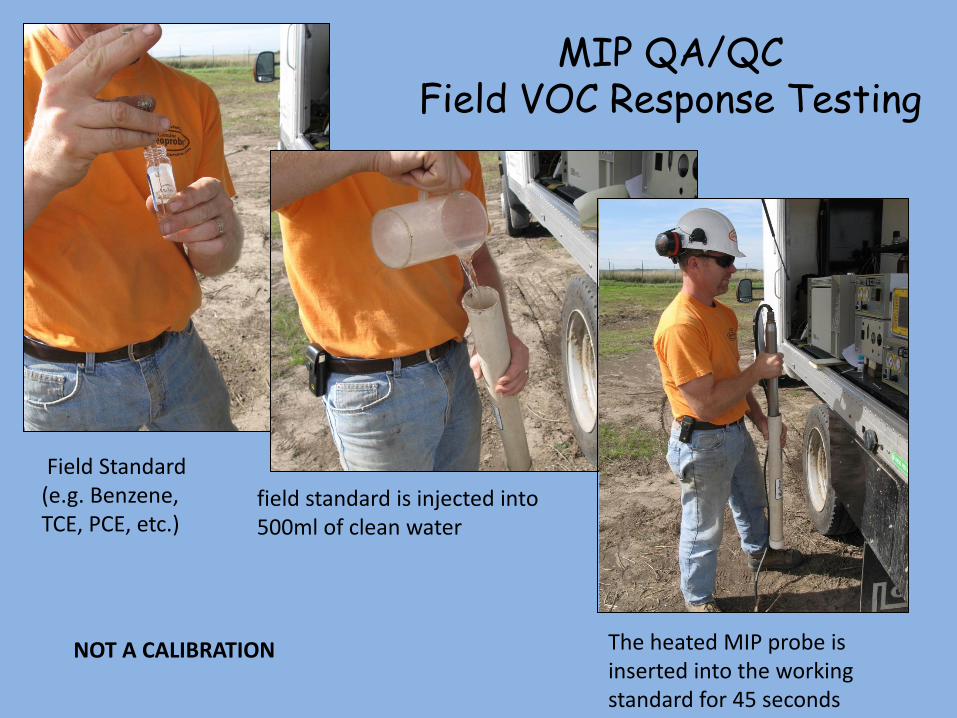
MIP QA/QC Field VOC Response Testing
Field Standard (e.g. Benzene, TCE, PCE, etc.)
field standard is injected into 500ml of clean water
The heated MIP probe is inserted into the working standard for 45 seconds
NOT A CALIBRATION
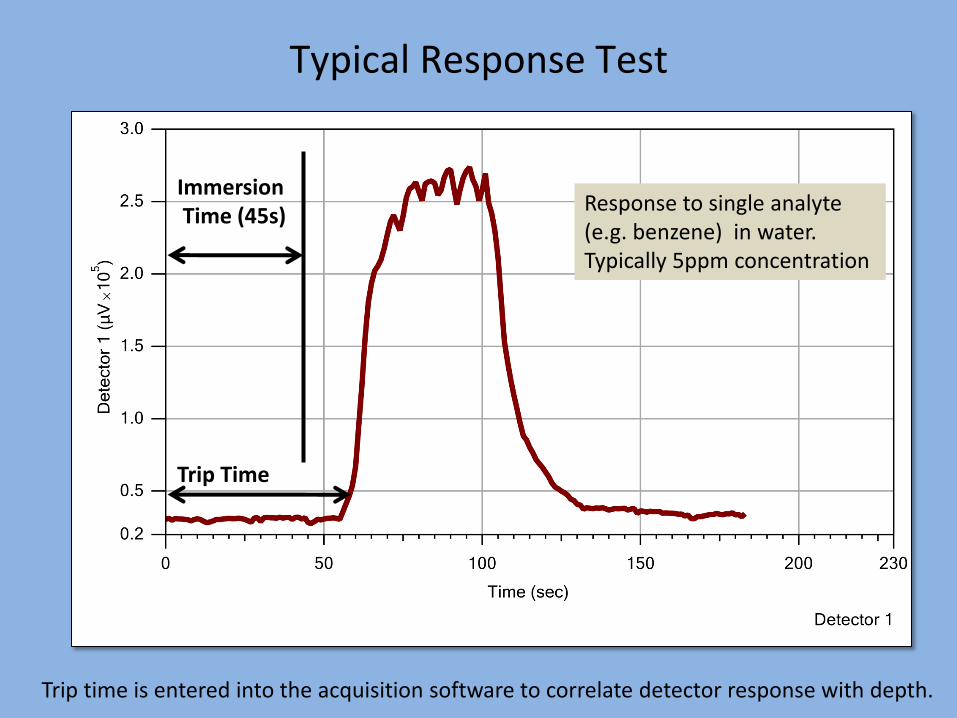
Typical Response Test
Trip Time
Immersion Time (45s)
Response to single analyte (e.g. benzene) in water. Typically 5ppm concentration
Trip time is entered into the acquisition software to correlate detector response with depth.
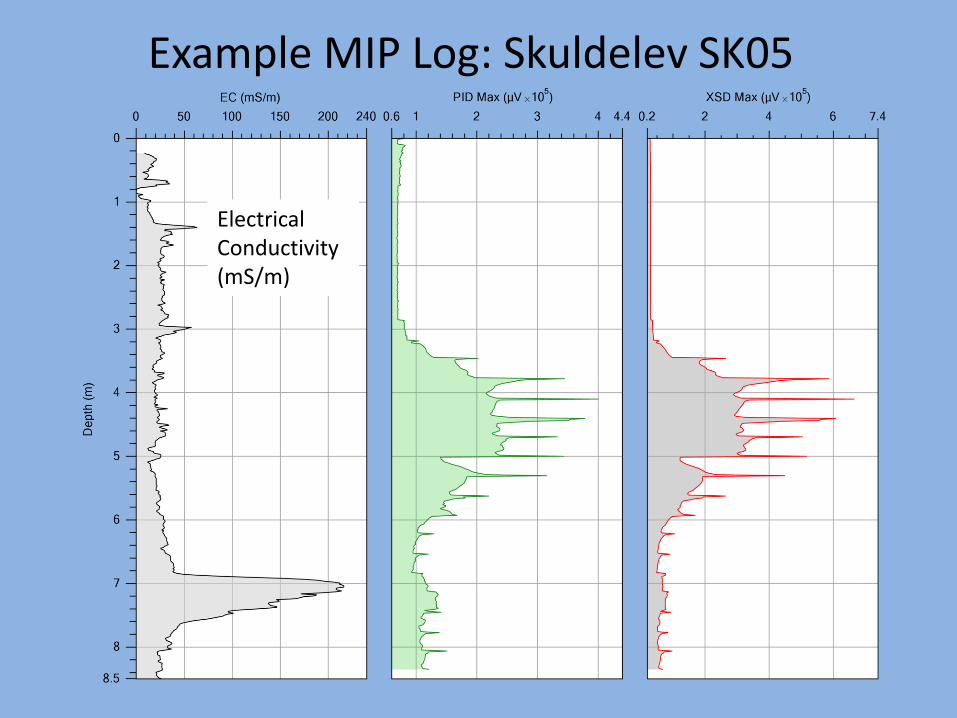
Example MIP Log: Skuldelev SK05
Electrical Conductivity (mS/m)
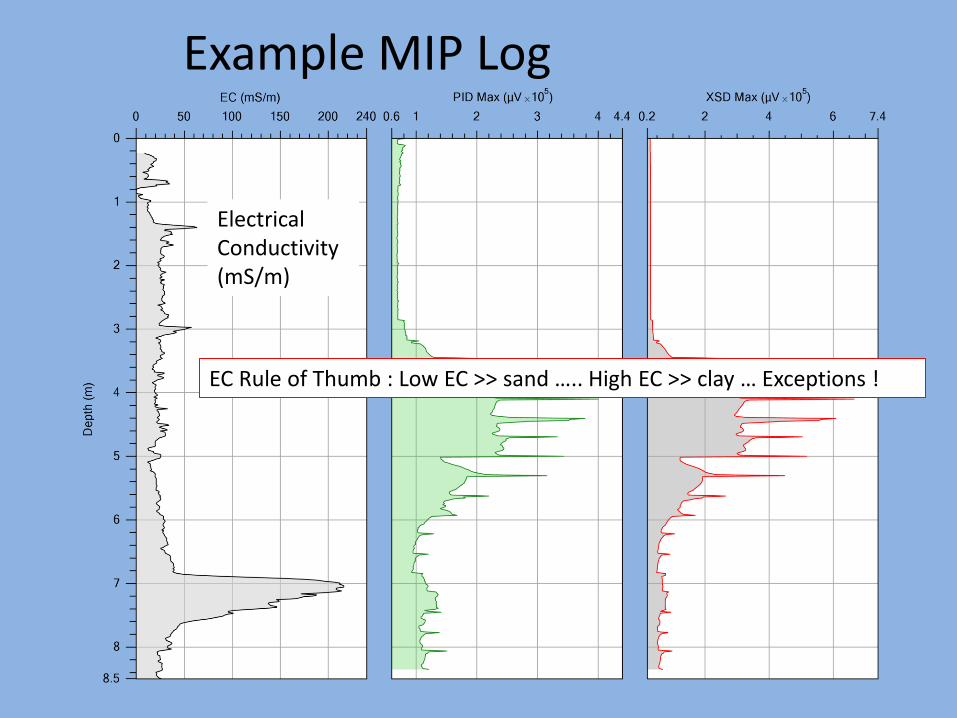
Example MIP Log
Electrical Conductivity (mS/m)
EC Rule of Thumb : Low EC >> sand ….. High EC >> clay … Exceptions !
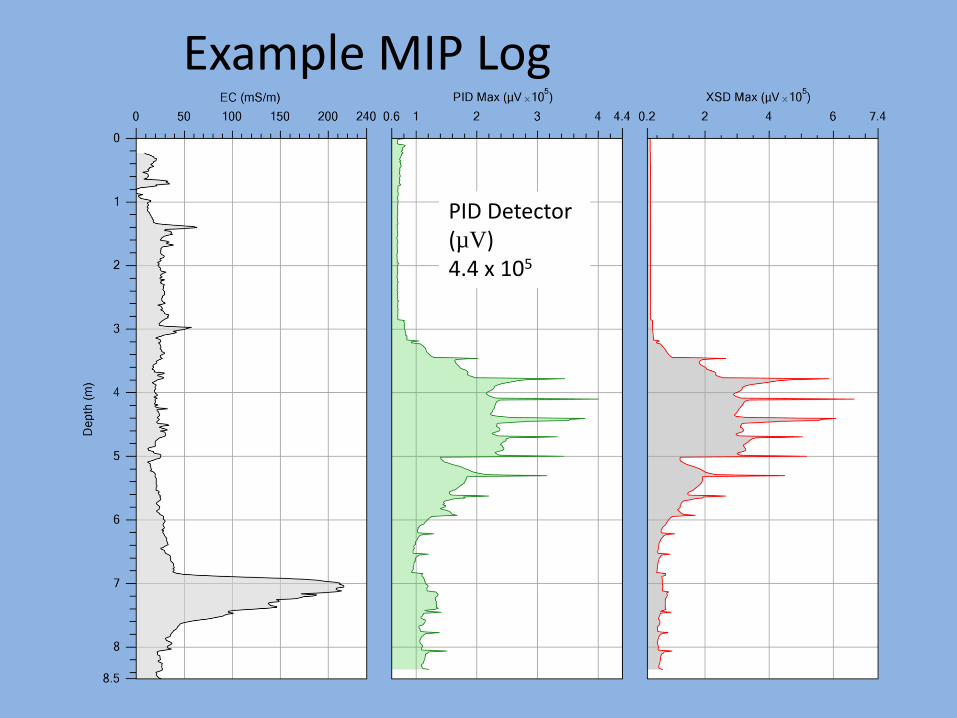
Example MIP Log
PID Detector (µV) 4.4 x 10⁵
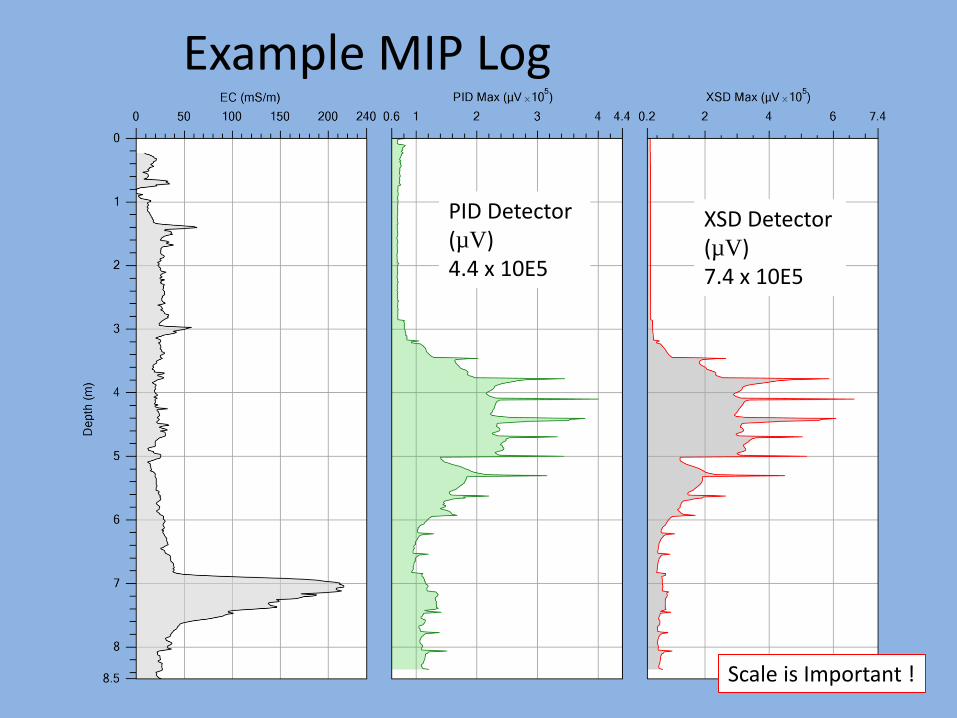
Example MIP Log
PID Detector (µV) 4.4 x 10E5
XSD Detector (µV) 7.4 x 10E5
Scale is Important !
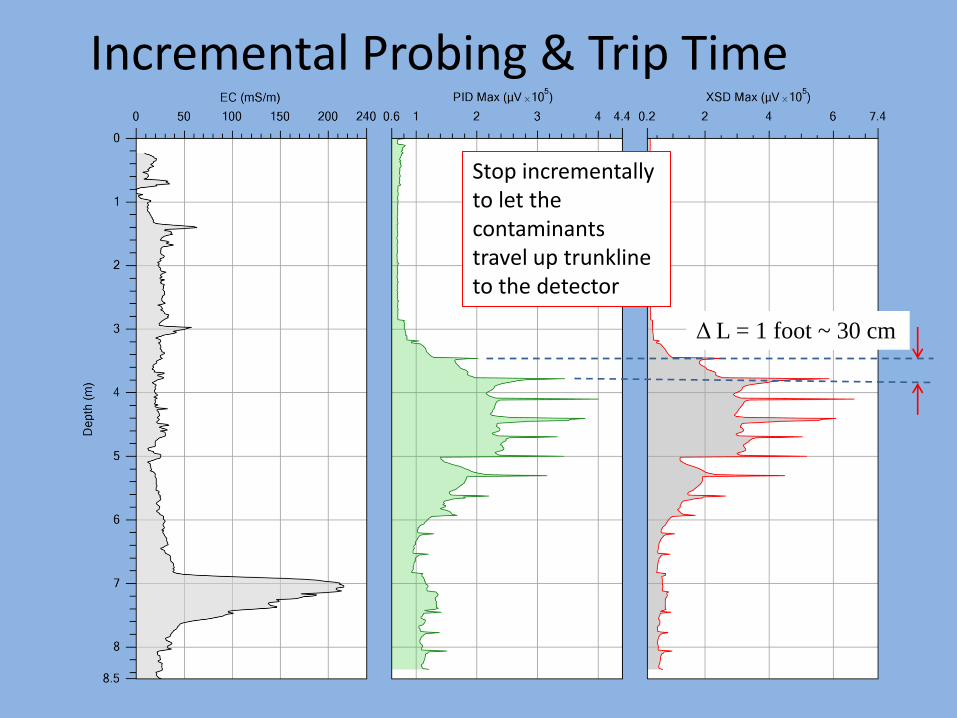
Incremental Probing & Trip Time
Stop incrementally to let the contaminants travel up trunkline to the detector
Δ L = 1 foot ~ 30 cm
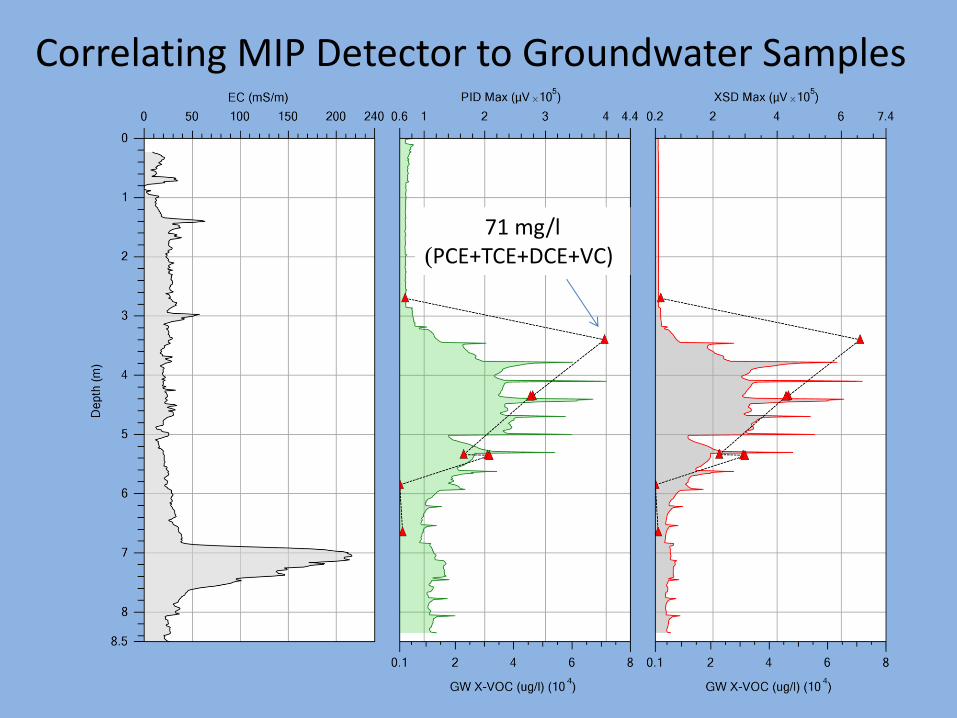
Correlating MIP Detector to Groundwater Samples
71 mg/l (PCE+TCE+DCE+VC)
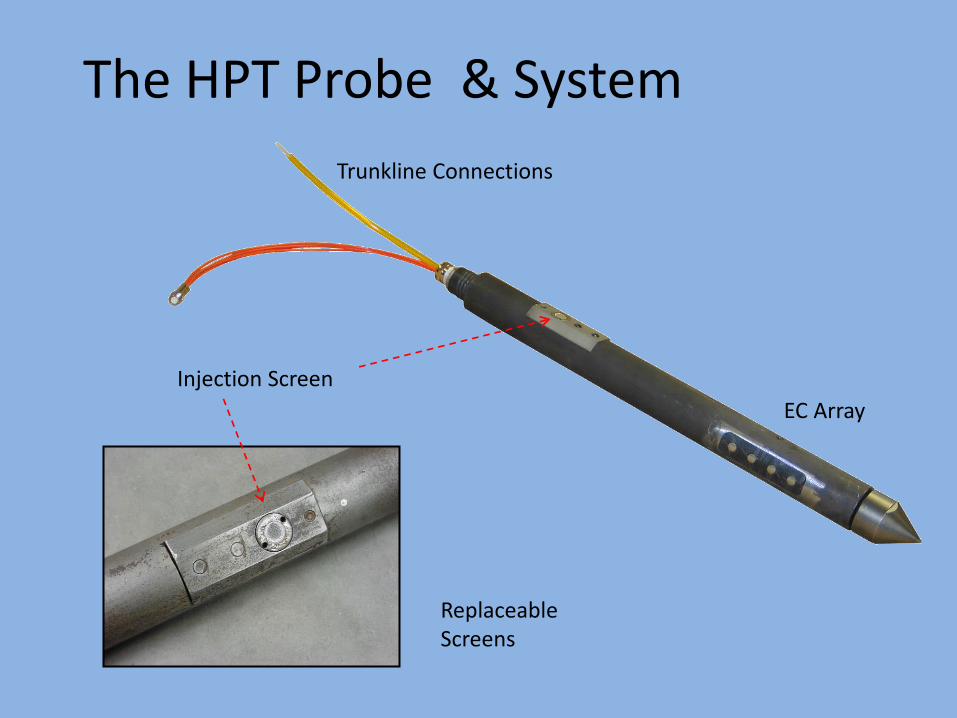
The HPT Probe & System
Injection Screen
EC Array
Trunkline Connections
Replaceable Screens
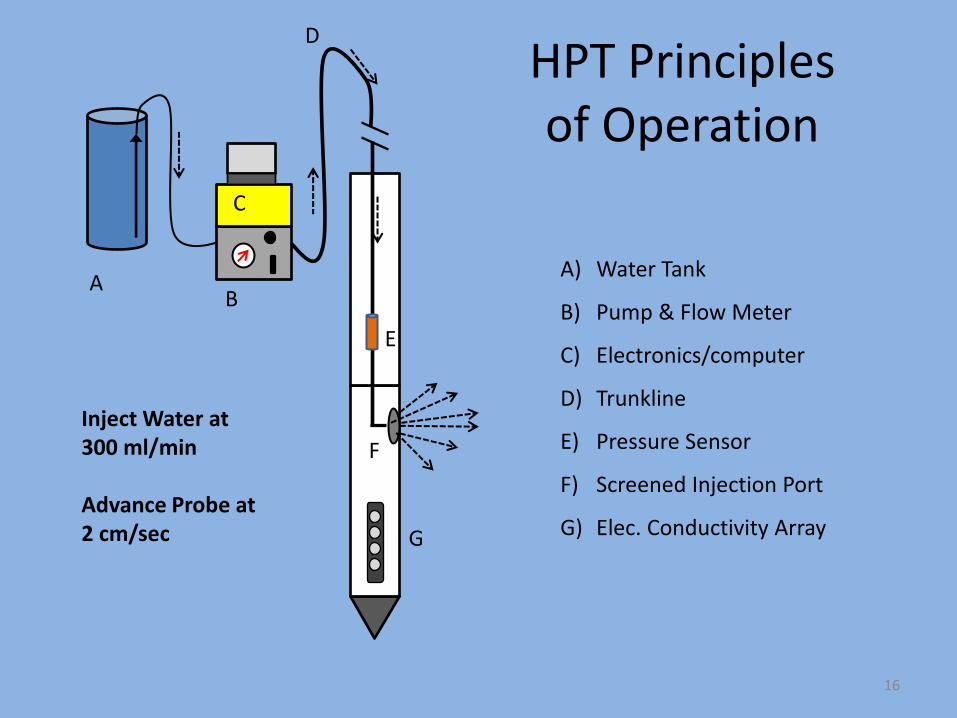
HPT Principles of Operation
A) Water Tank
B) Pump & Flow Meter
C) Electronics/computer
D) Trunkline
E) Pressure Sensor
F) Screened Injection Port
G) Elec. Conductivity Array
Inject Water at 300 ml/min Advance Probe at 2 cm/sec
A B
C
D
E
F
G
16
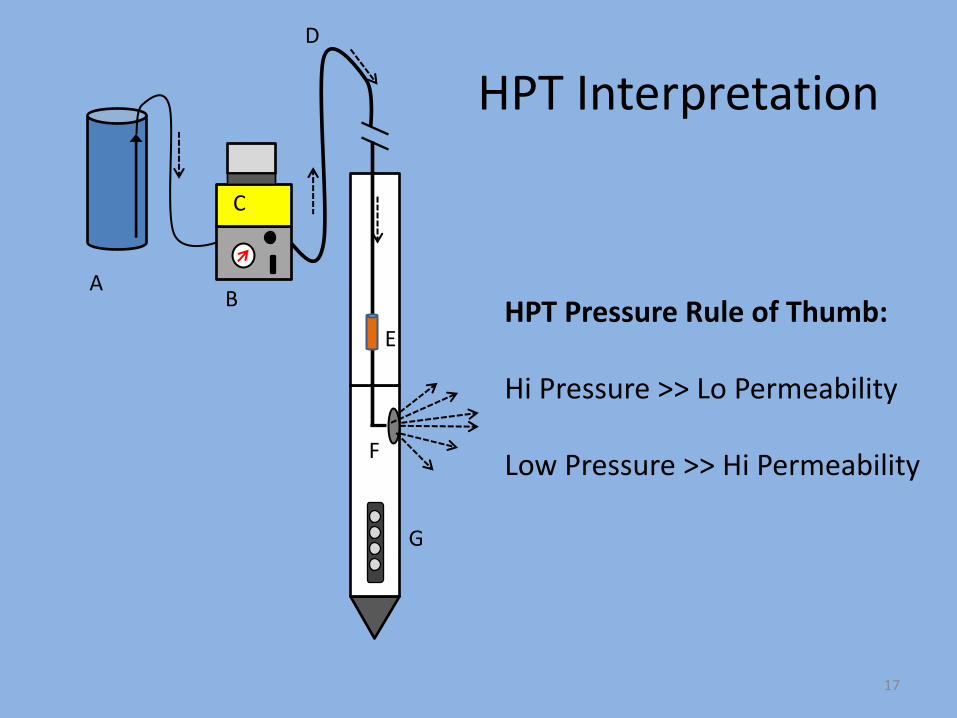
HPT Interpretation
A B
C
D
E
F
G
17
HPT Pressure Rule of Thumb: Hi Pressure >> Lo Permeability Low Pressure >> Hi Permeability
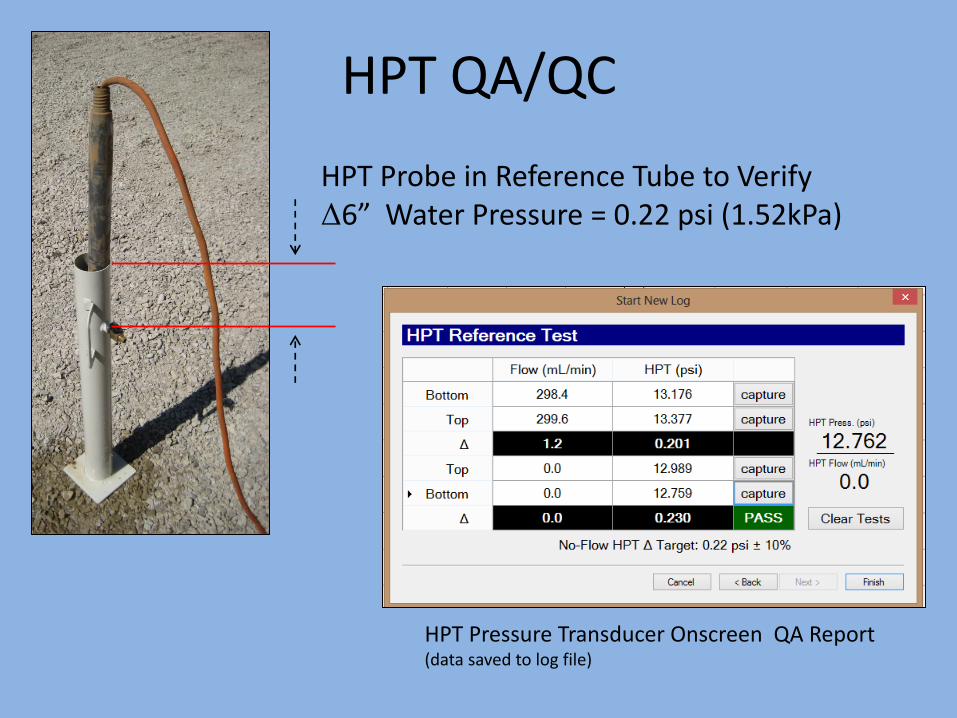
HPT QA/QC
HPT Pressure Transducer Onscreen QA Report (data saved to log file)
HPT Probe in Reference Tube to Verify Δ6” Water Pressure = 0.22 psi (1.52kPa)
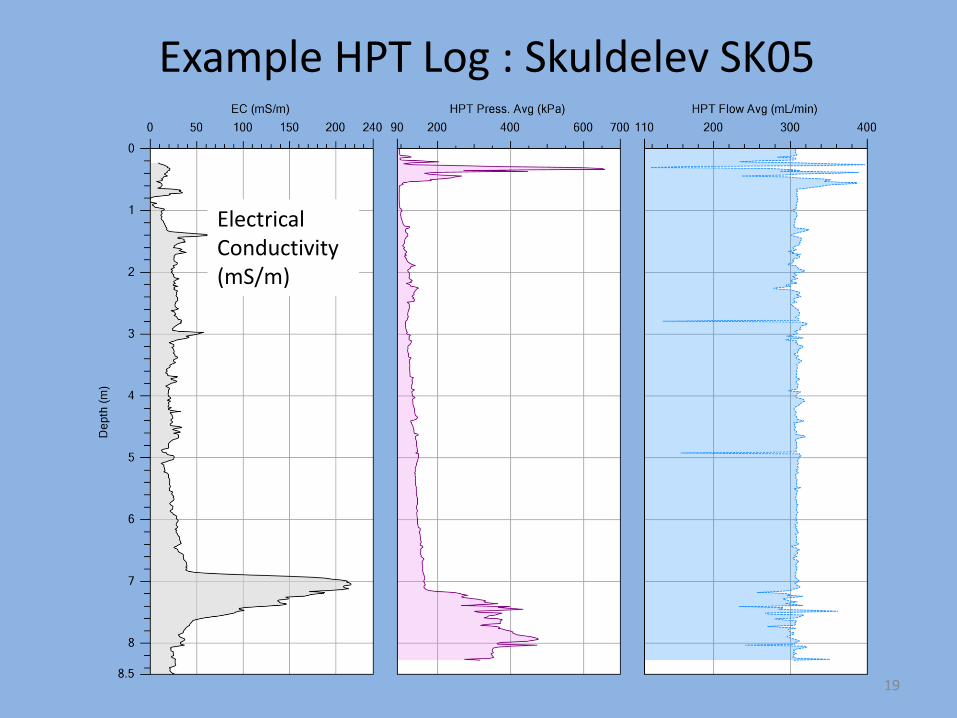
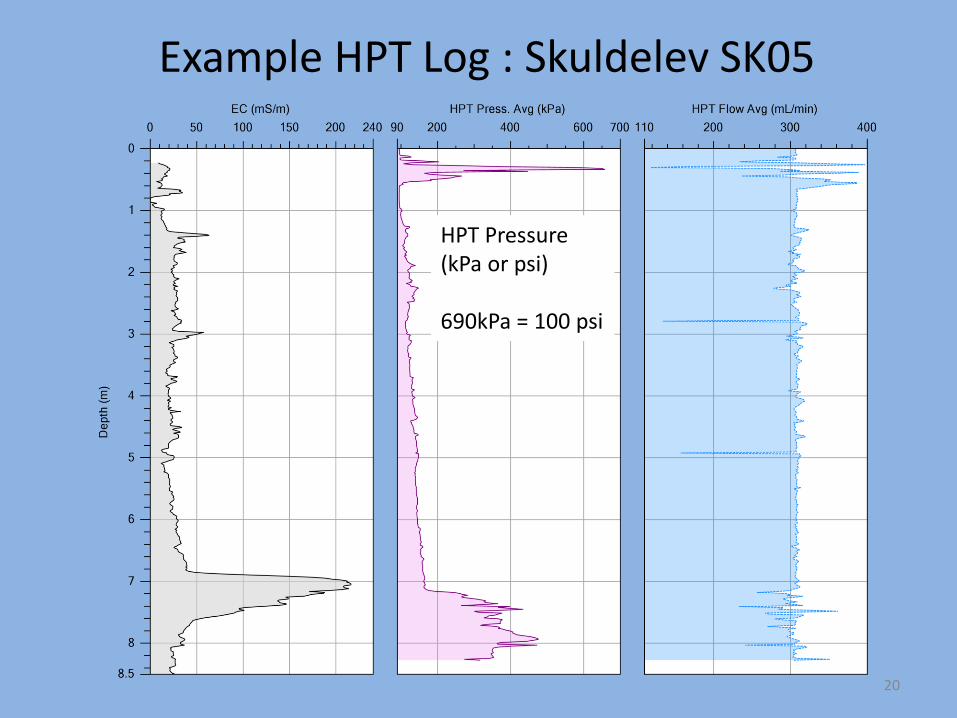
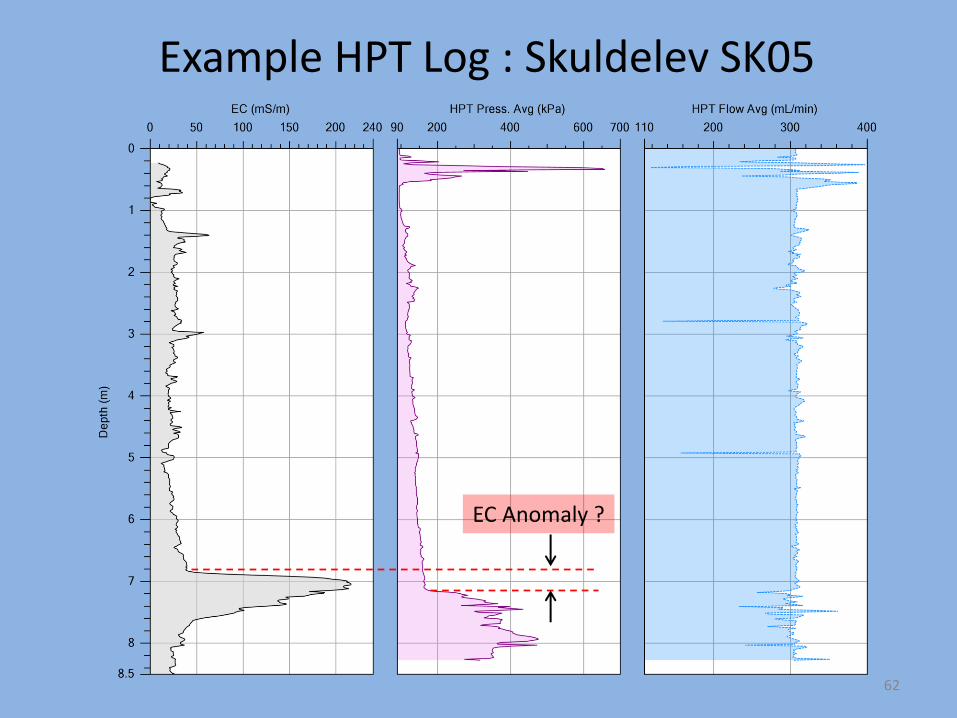
Example HPT Log : Skuldelev SK05
19
Electrical Conductivity (mS/m)
20
HPT Pressure (kPa or psi) 690kPa = 100 psi
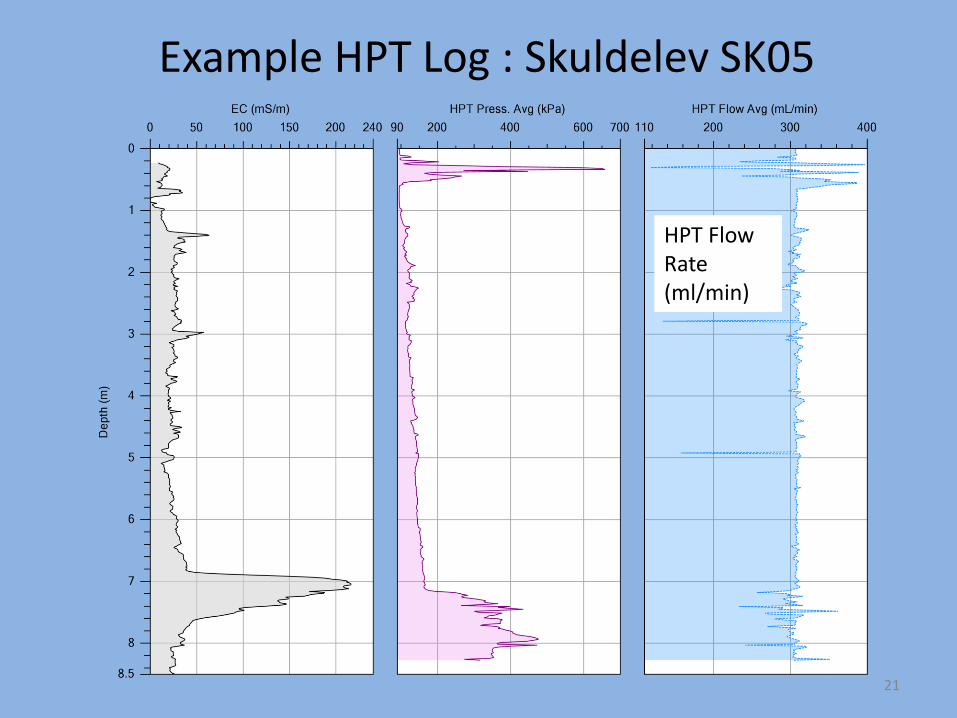
Example HPT Log : Skuldelev SK05
21
HPT Flow Rate (ml/min)
Example HPT Log : Skuldelev SK05
22
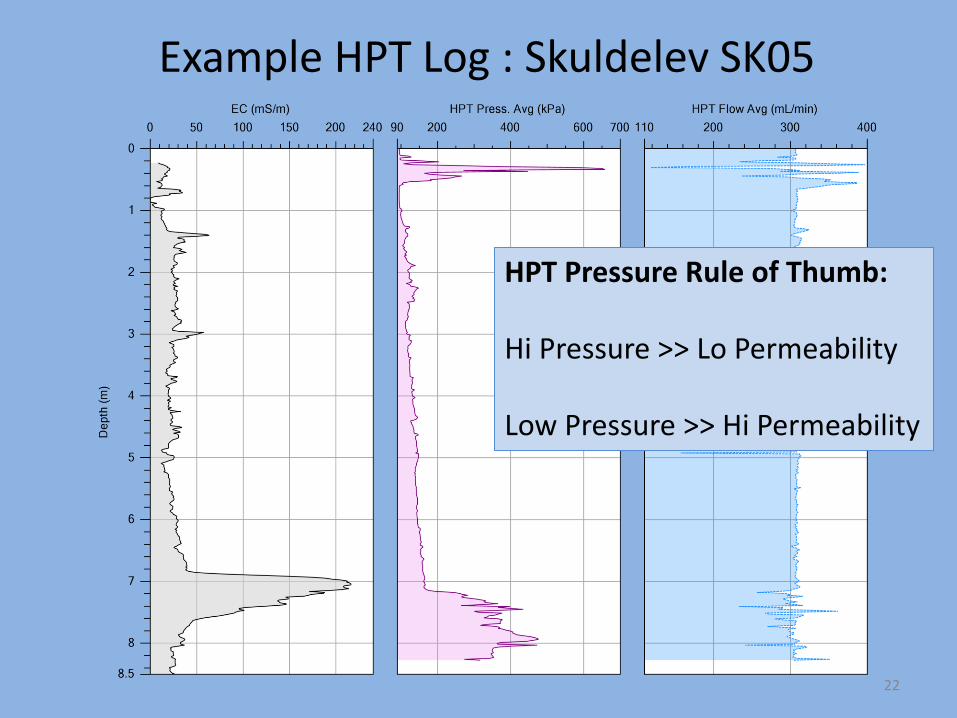
Example HPT Log : Skuldelev SK05
HPT Pressure Rule of Thumb: Hi Pressure >> Lo Permeability Low Pressure >> Hi Permeability
23
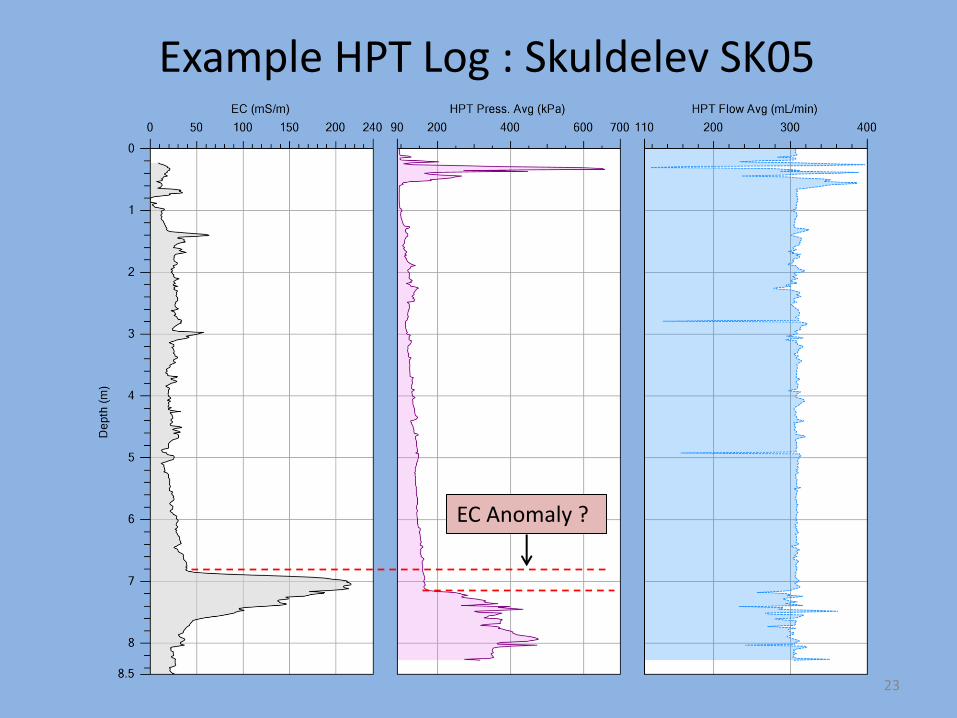
Example HPT Log : Skuldelev SK05
EC Anomaly ?
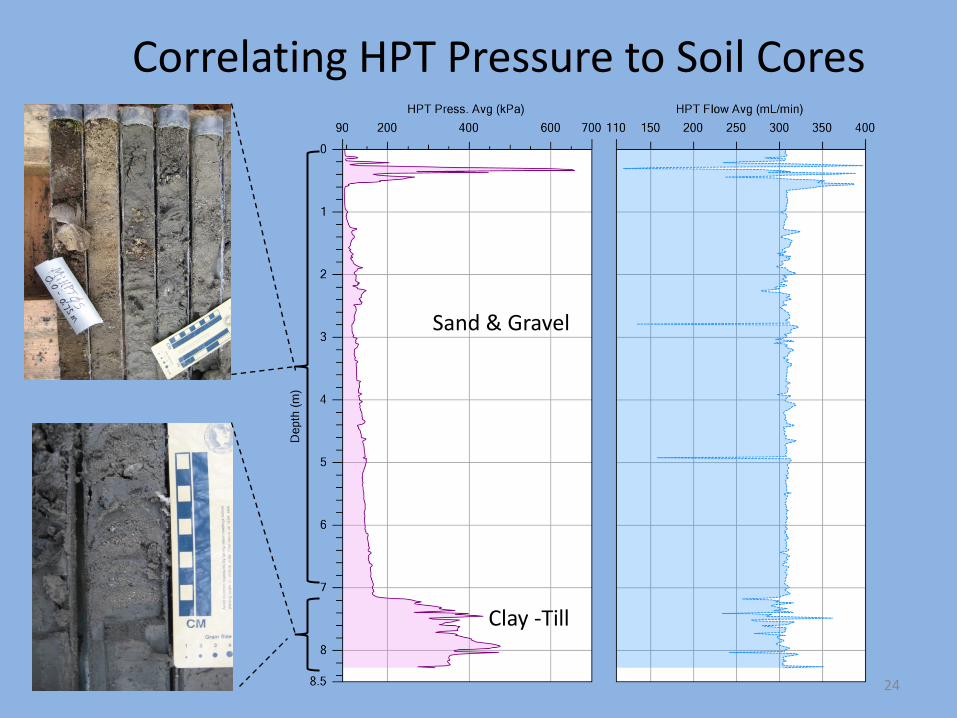
Correlating HPT Pressure to Soil Cores
24
Sand & Gravel
Clay -Till
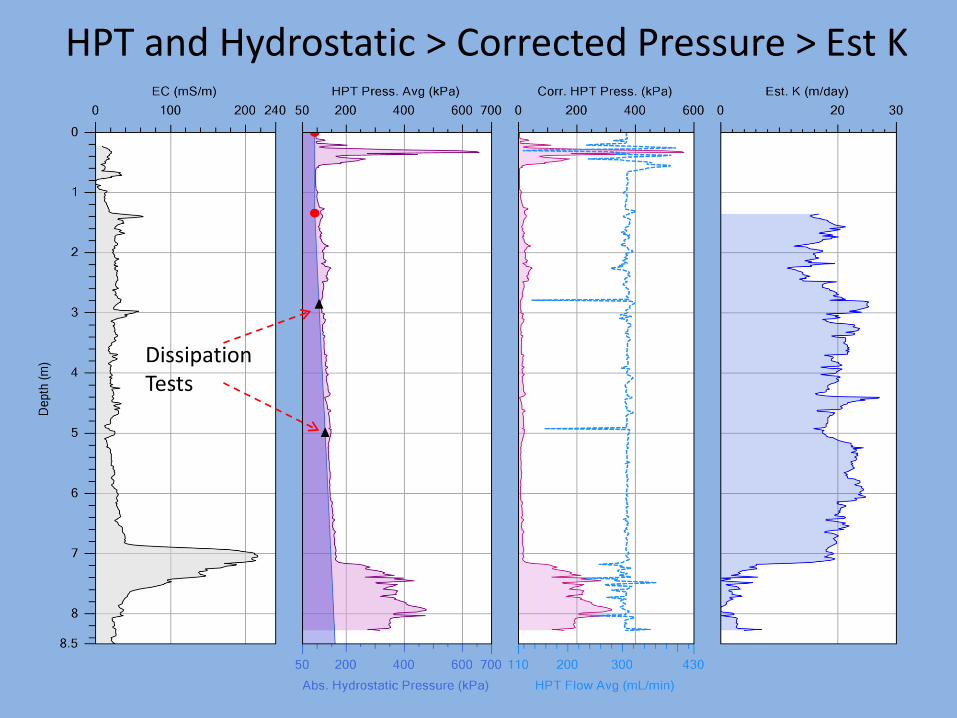
HPT and Hydrostatic > Corrected Pressure > Est K
Dissipation Tests
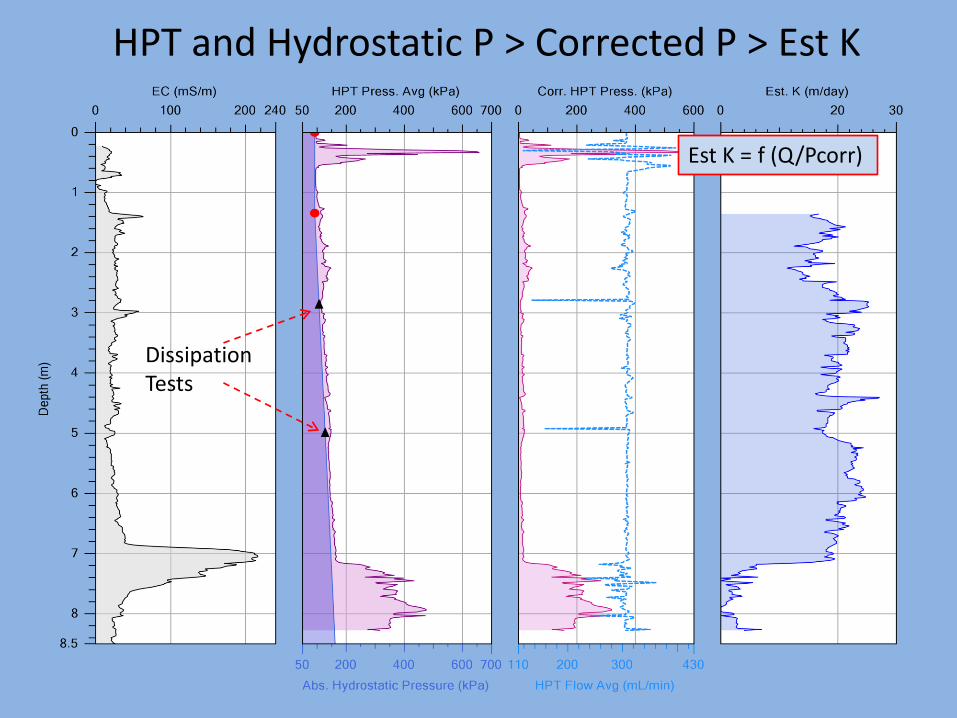
HPT and Hydrostatic P > Corrected P > Est K
Dissipation Tests
Est K = f (Q/Pcorr)
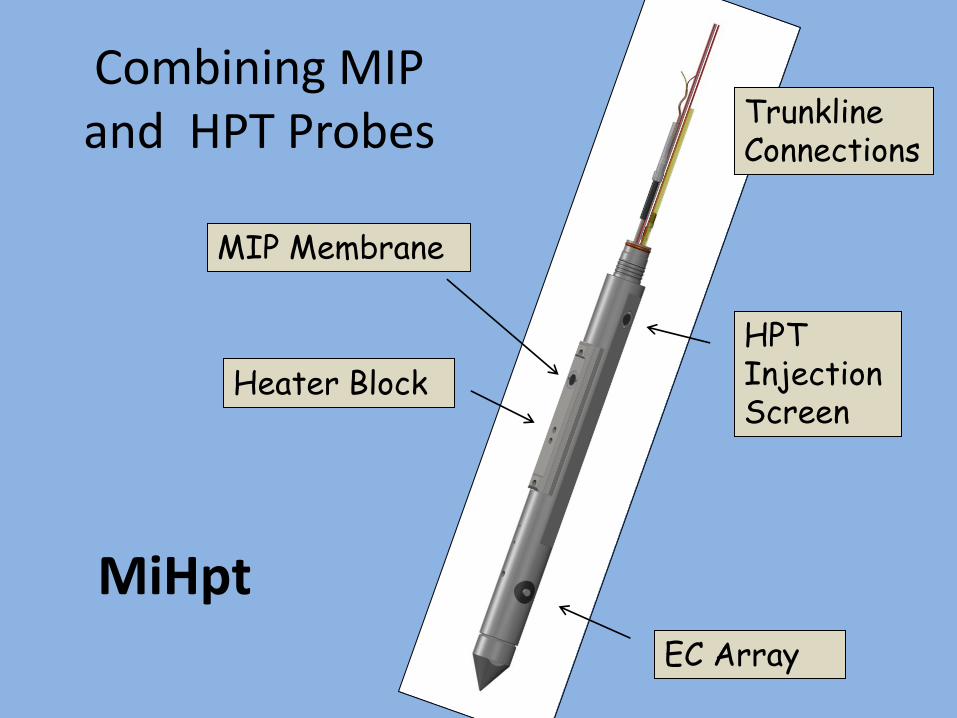
Combining MIP and HPT Probes
EC Array
Heater Block
MIP Membrane
Trunkline Connections
HPT Injection Screen
MiHpt
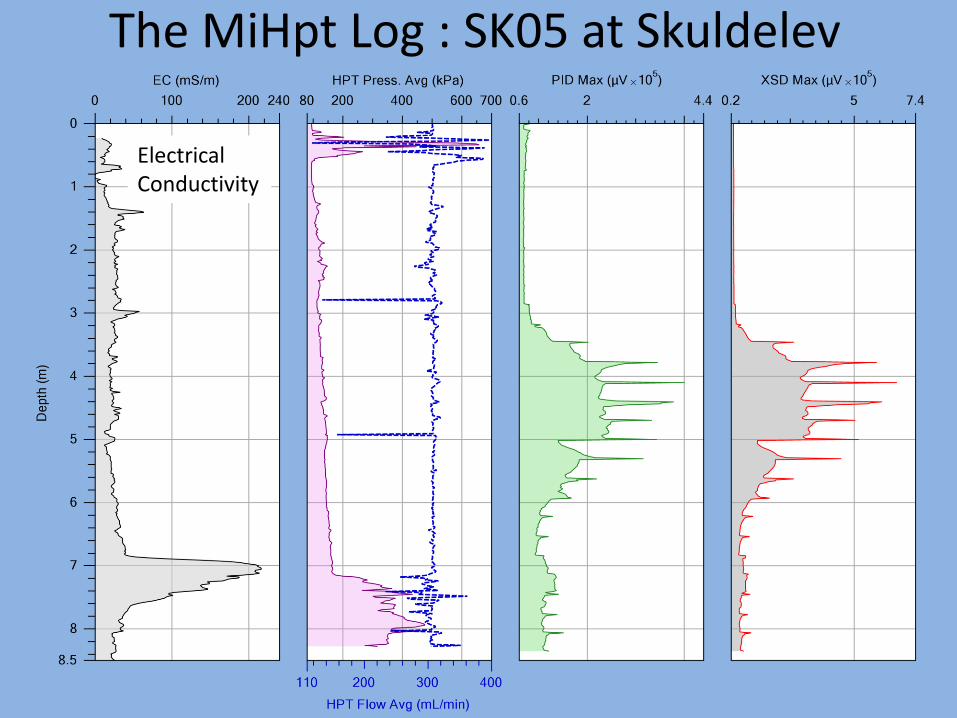
The MiHpt Log : SK05 at Skuldelev
Electrical Conductivity
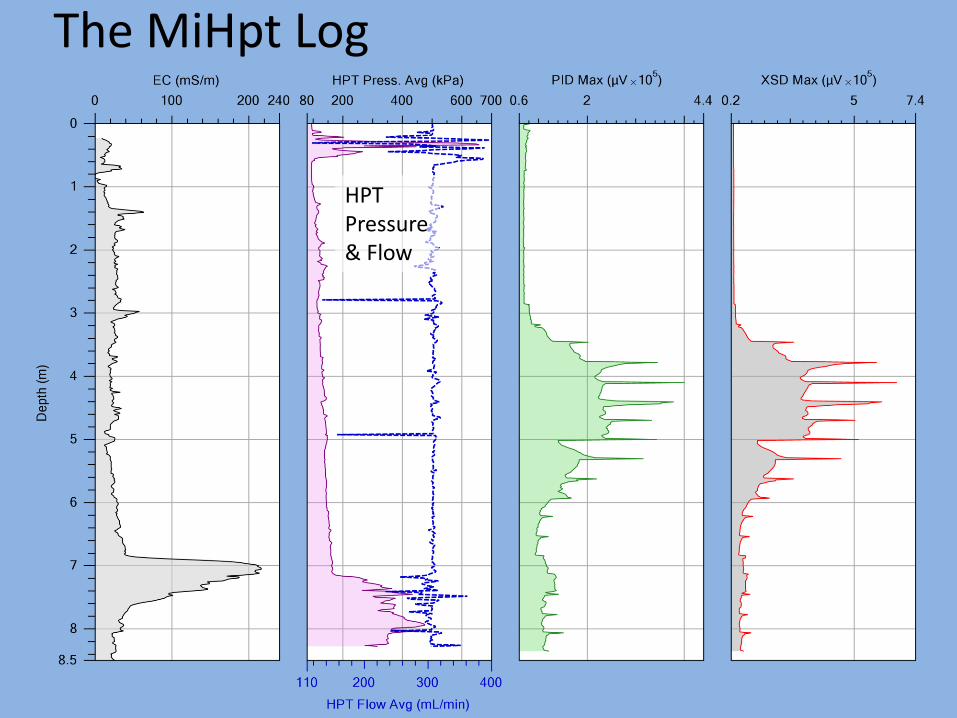
The MiHpt Log
HPT Pressure & Flow
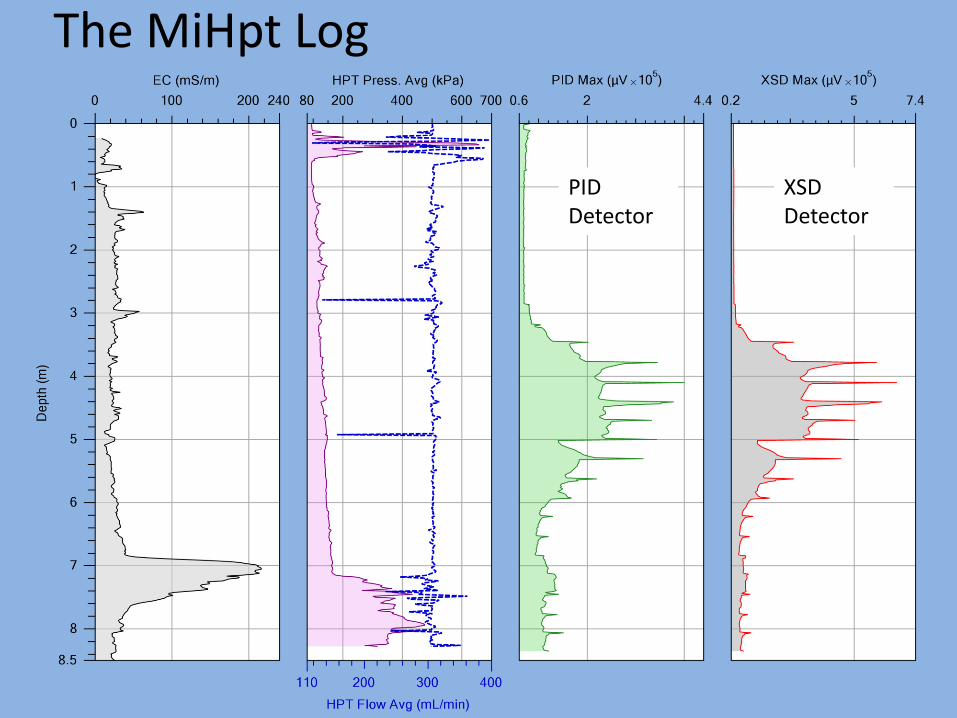
The MiHpt Log
PID Detector
XSD Detector
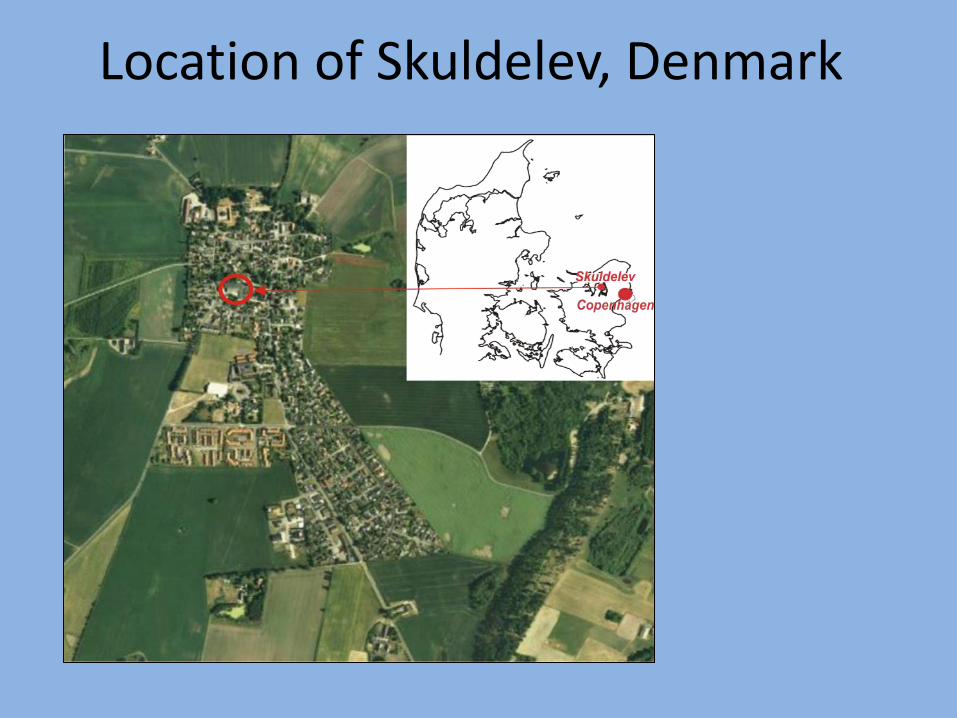
Location of Skuldelev, Denmark
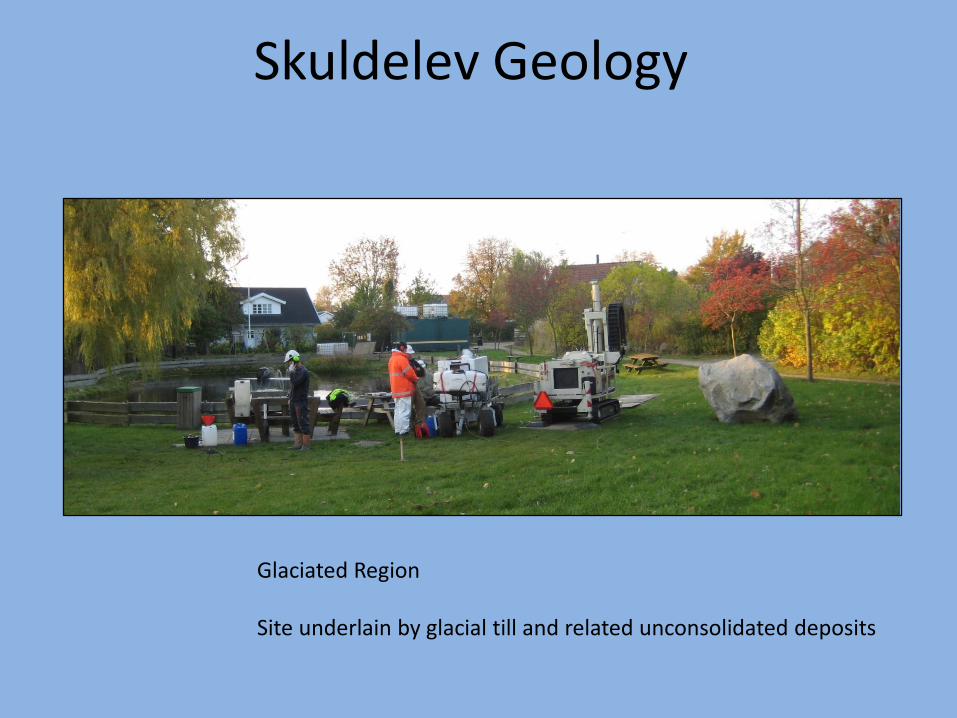
Skuldelev Geology
Glaciated Region Site underlain by glacial till and related unconsolidated deposits
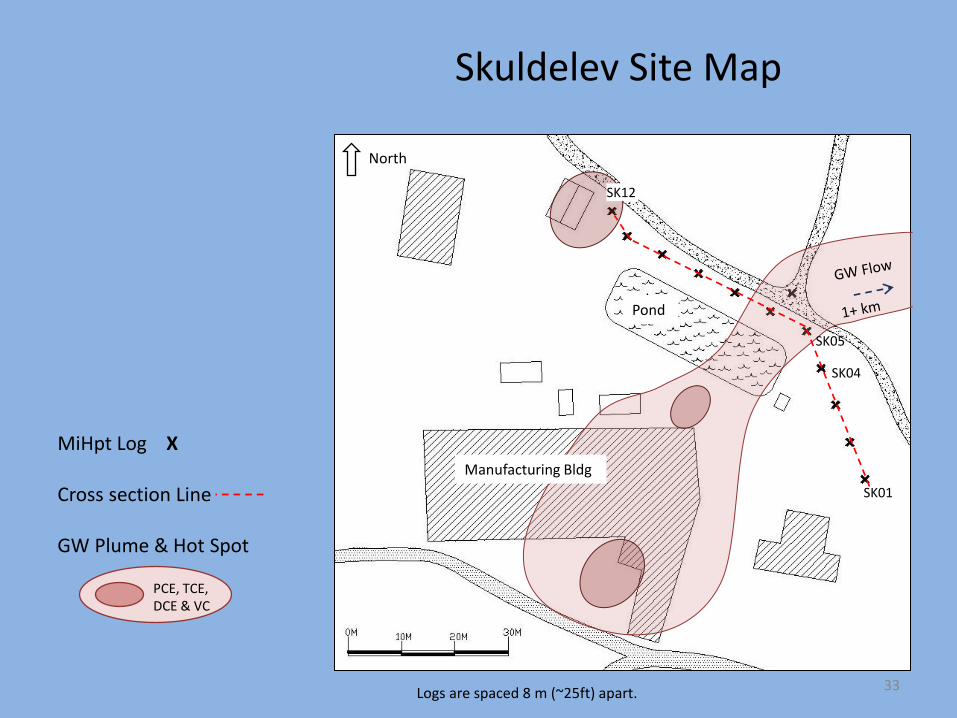
Skuldelev Site Map
Pond
Manufacturing Bldg
SK01
SK05
SK04
SK12
MiHpt Log X
Cross section Line
GW Plume & Hot Spot
North
Logs are spaced 8 m (~25ft) apart.
PCE, TCE, DCE & VC
33
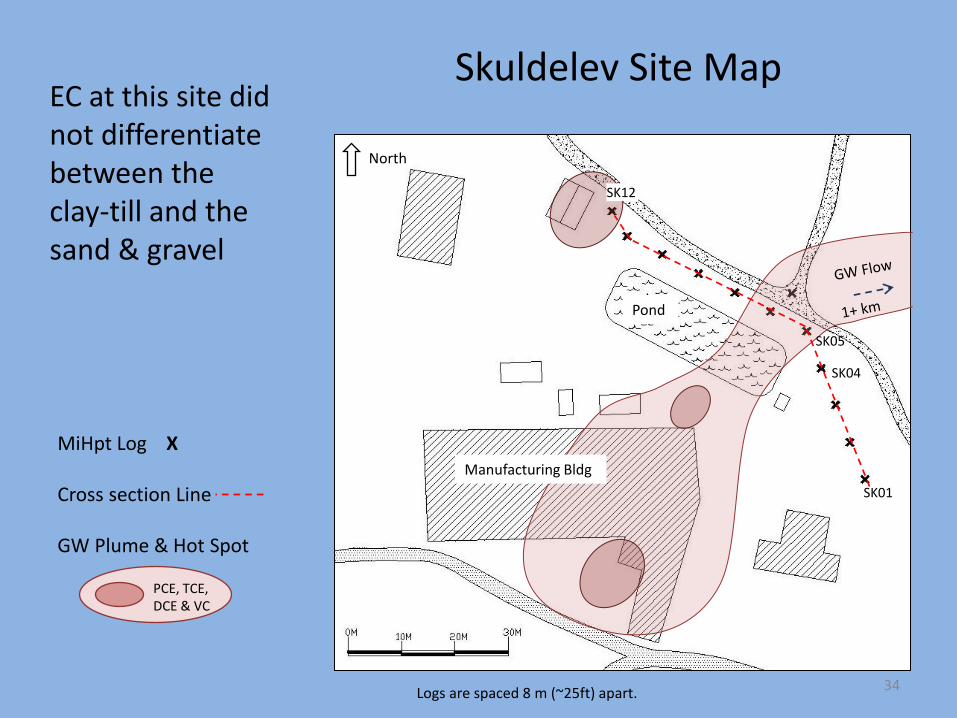
Skuldelev Site Map
Pond
Manufacturing Bldg
SK01
SK05
SK04
SK12
MiHpt Log X
Cross section Line
GW Plume & Hot Spot
North
Logs are spaced 8 m (~25ft) apart.
PCE, TCE, DCE & VC
34
EC at this site did not differentiate between the clay-till and the sand & gravel
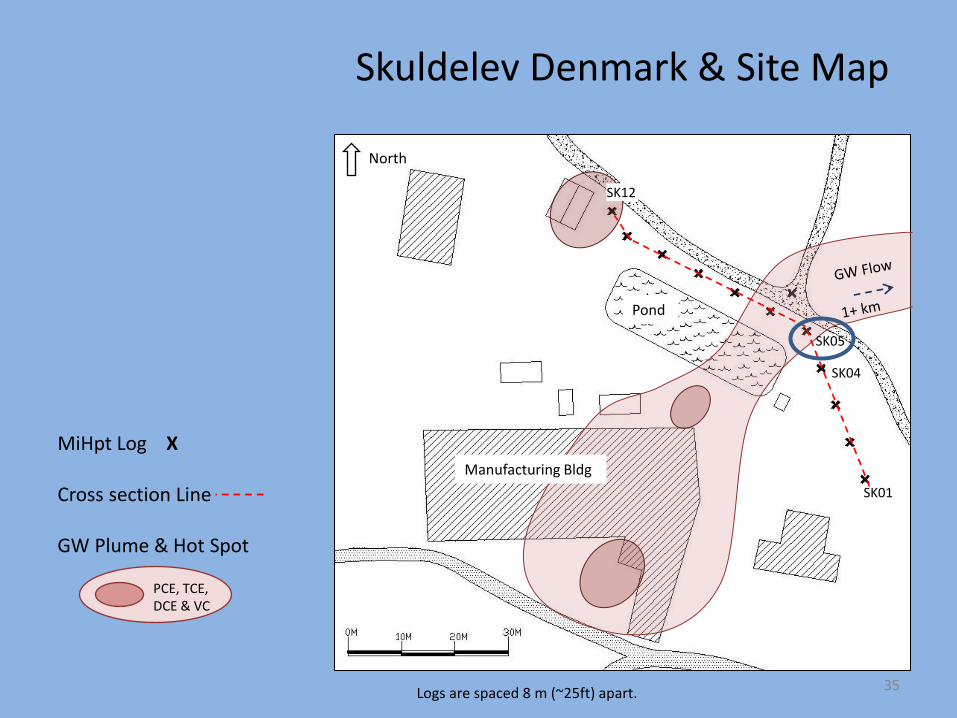
Skuldelev Denmark & Site Map
Pond
Manufacturing Bldg
SK01
SK05
SK04
SK12
MiHpt Log X
Cross section Line
GW Plume & Hot Spot
North
Logs are spaced 8 m (~25ft) apart.
PCE, TCE, DCE & VC
35
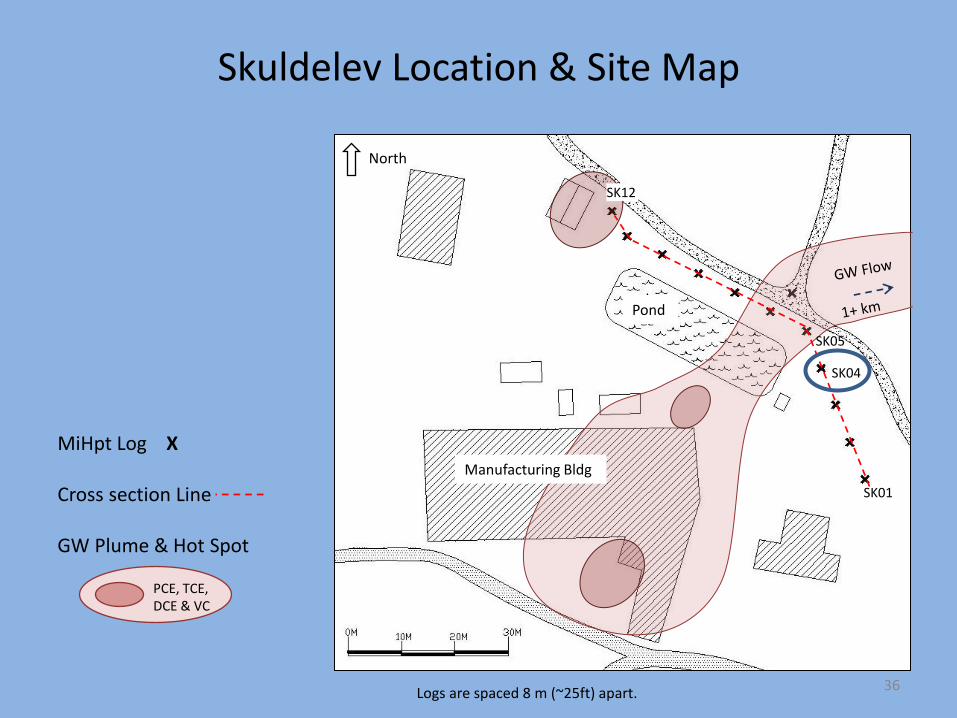
Skuldelev Location & Site Map
Pond
Manufacturing Bldg
SK01
SK05
SK04
SK12
MiHpt Log X
Cross section Line
GW Plume & Hot Spot
North
Logs are spaced 8 m (~25ft) apart.
PCE, TCE, DCE & VC
36
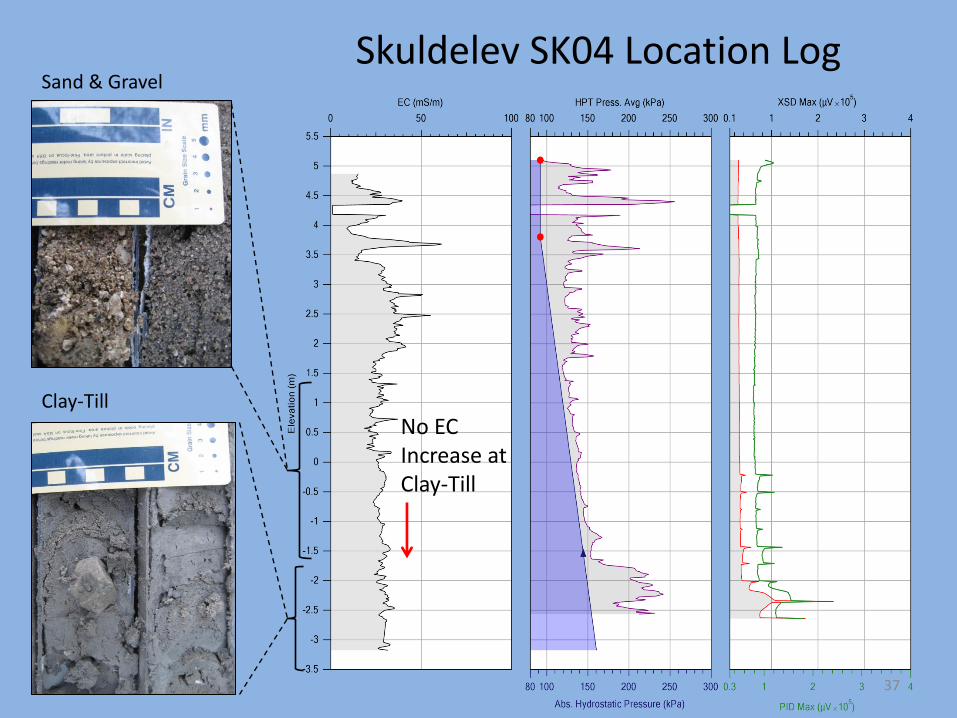
Skuldelev SK04 Location Log Sand & Gravel
Clay-Till
37
No EC Increase at Clay-Till
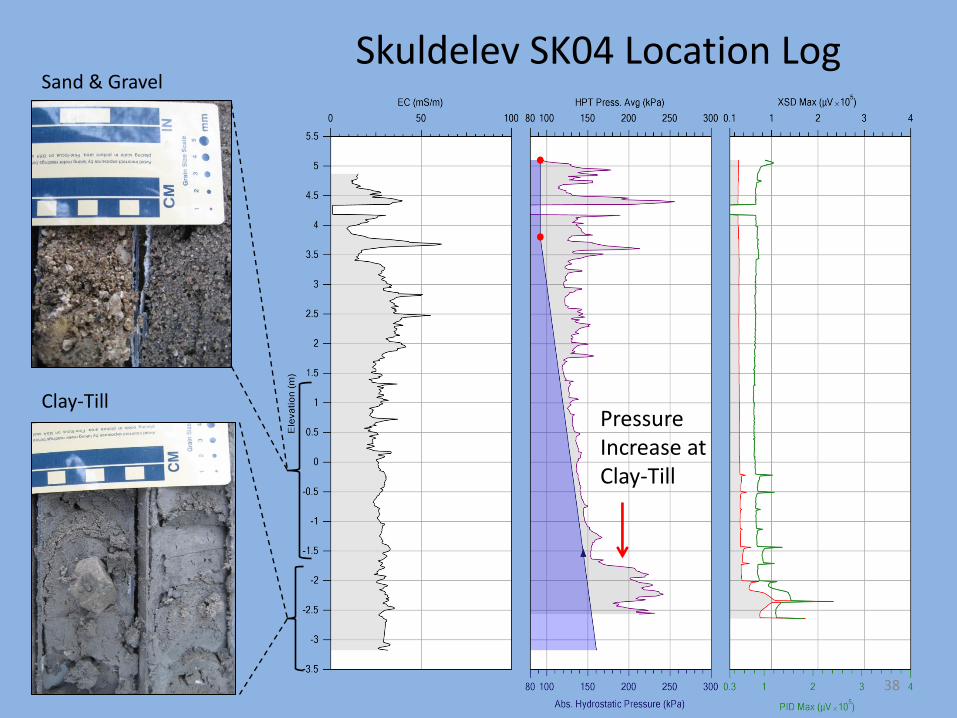
Skuldelev SK04 Location Log Sand & Gravel
Clay-Till
38
Pressure Increase at Clay-Till
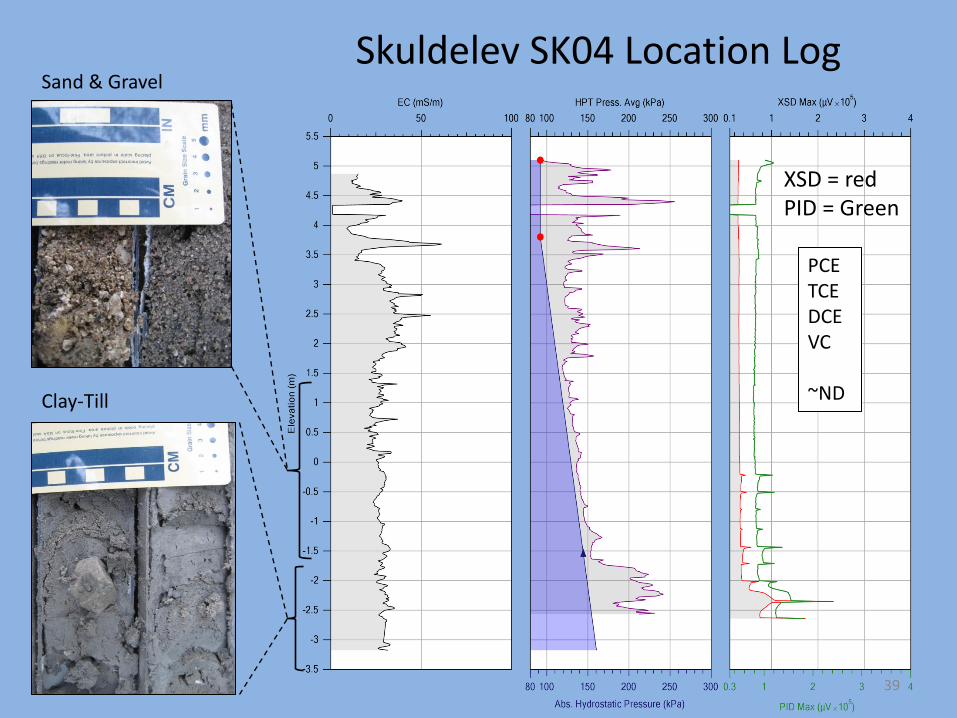
Skuldelev SK04 Location Log Sand & Gravel
Clay-Till
PCE TCE DCE VC ~ND
39
XSD = red PID = Green
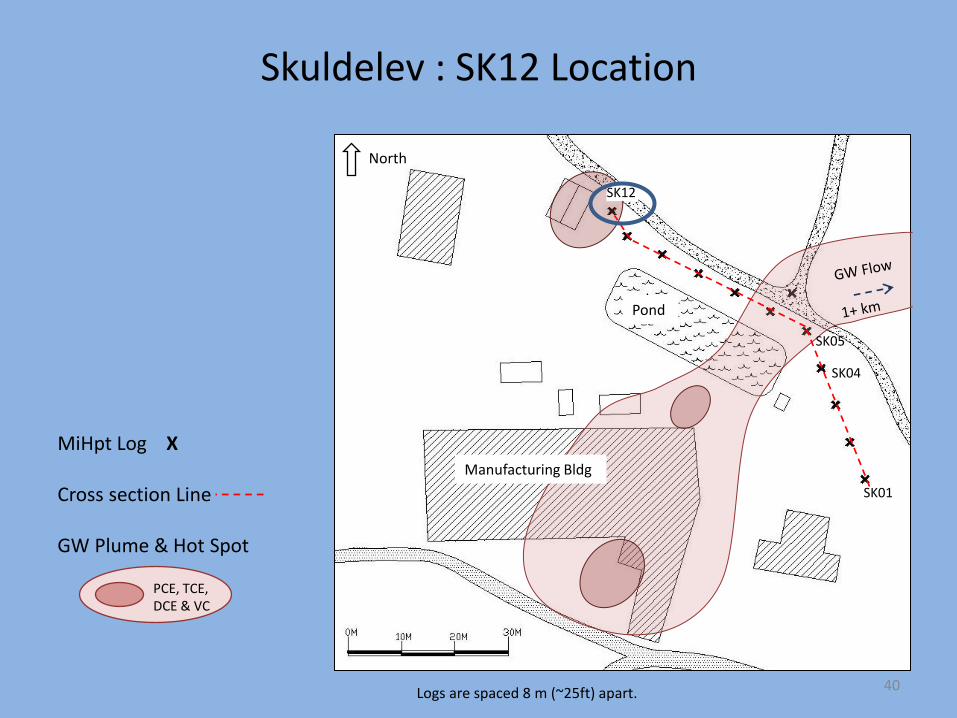
Skuldelev : SK12 Location
Pond
Manufacturing Bldg
SK01
SK05
SK04
SK12
MiHpt Log X
Cross section Line
GW Plume & Hot Spot
North
Logs are spaced 8 m (~25ft) apart.
PCE, TCE, DCE & VC
40
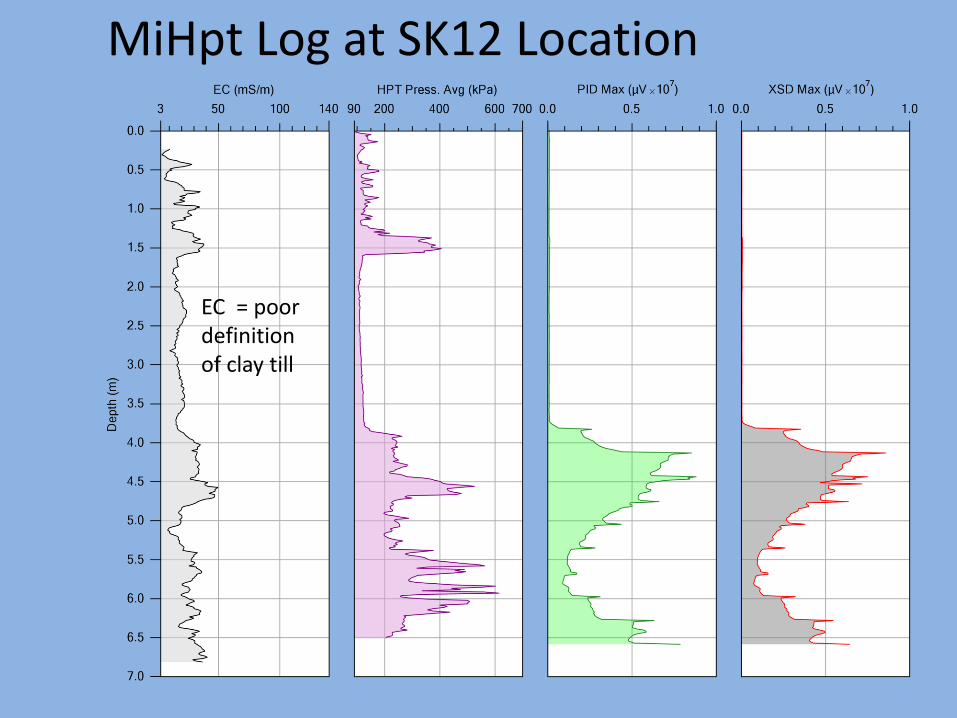
MiHpt Log at SK12 Location
EC = poor definition of clay till
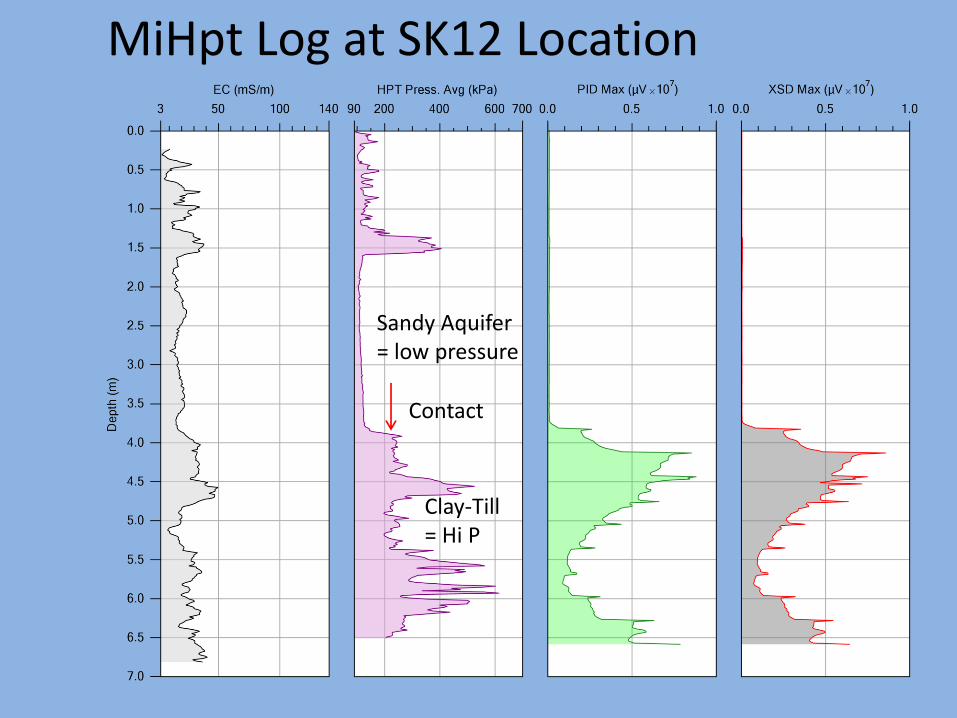
MiHpt Log at SK12 Location
Sandy Aquifer = low pressure
Clay-Till = Hi P
Contact
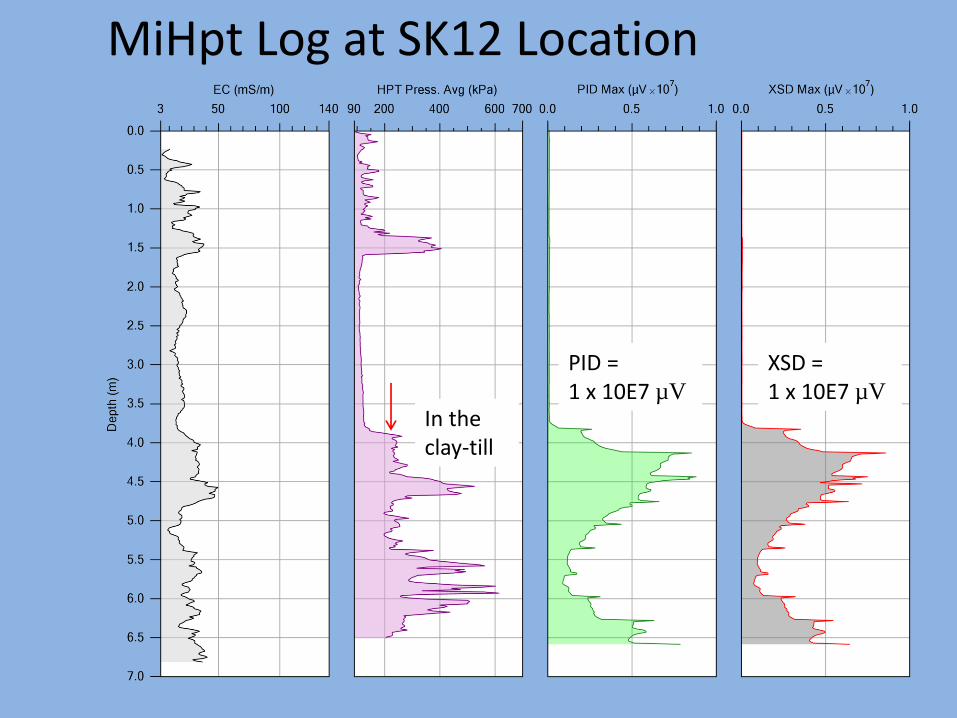
MiHpt Log at SK12 Location
PID = 1 x 10E7 µV
XSD = 1 x 10E7 µV
In the clay-till
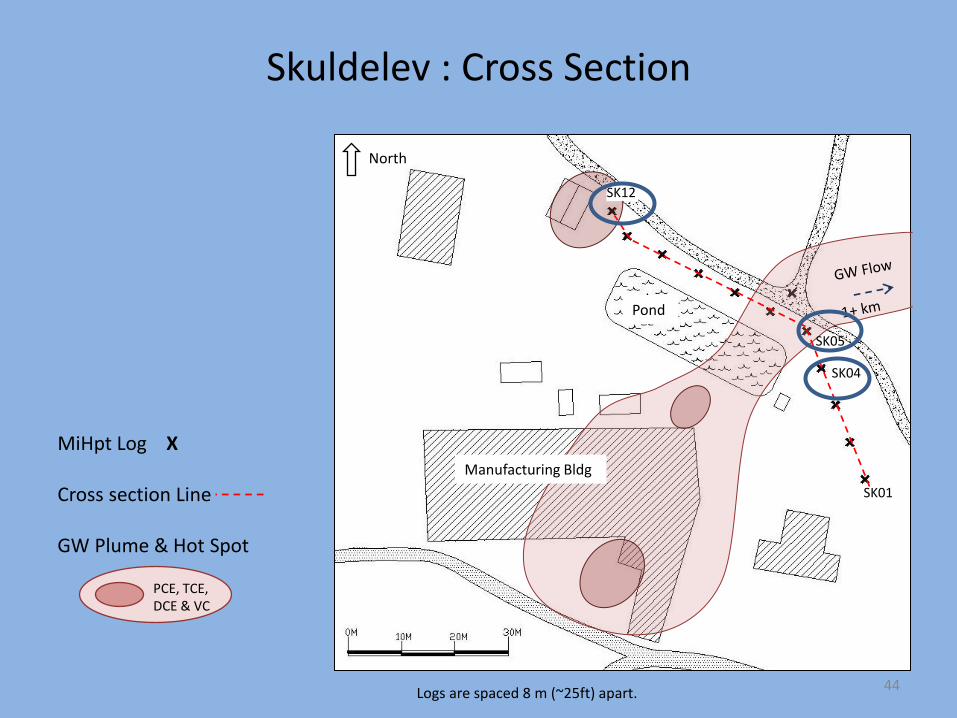
Skuldelev : Cross Section
Pond
Manufacturing Bldg
SK01
SK05
SK04
SK12
MiHpt Log X
Cross section Line
GW Plume & Hot Spot
North
Logs are spaced 8 m (~25ft) apart.
PCE, TCE, DCE & VC
44
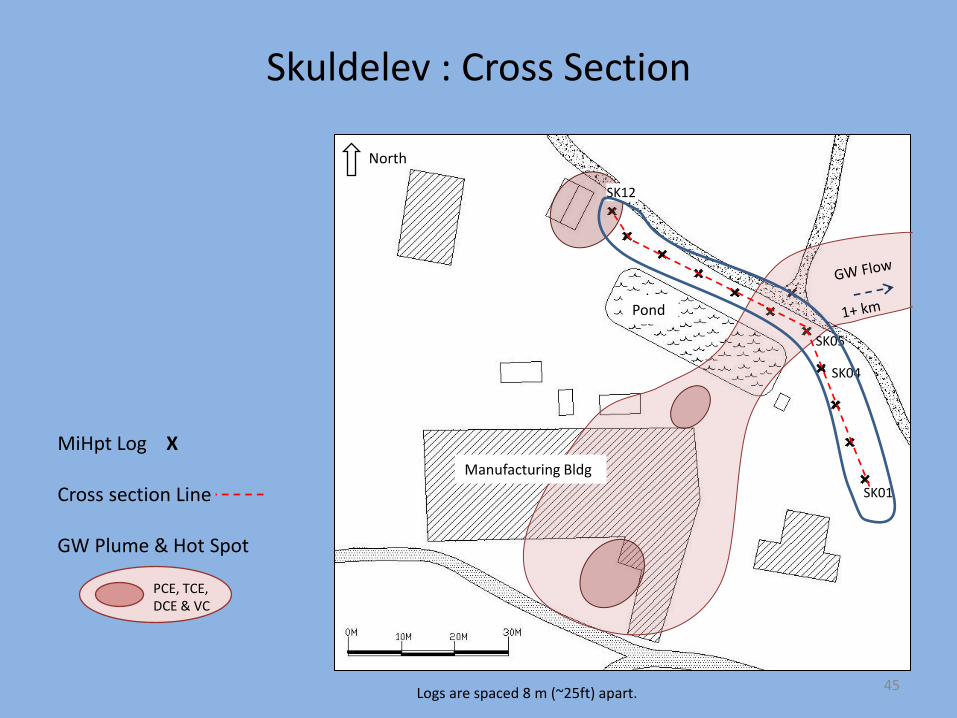
Skuldelev : Cross Section
Pond
Manufacturing Bldg
SK01
SK05
SK04
SK12
MiHpt Log X
Cross section Line
GW Plume & Hot Spot
North
Logs are spaced 8 m (~25ft) apart.
PCE, TCE, DCE & VC
45
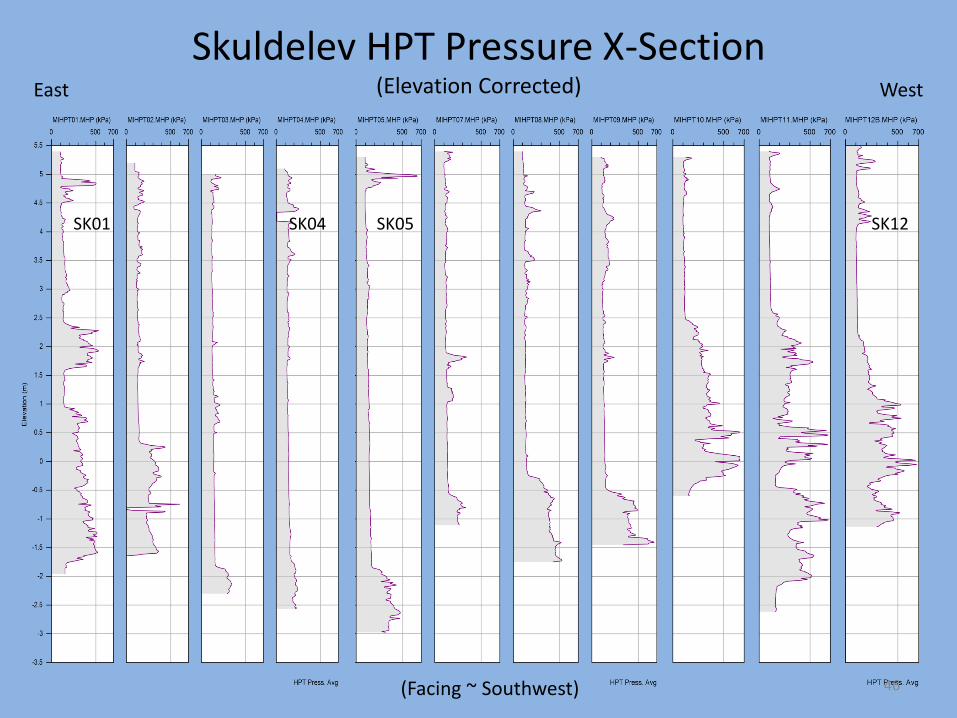
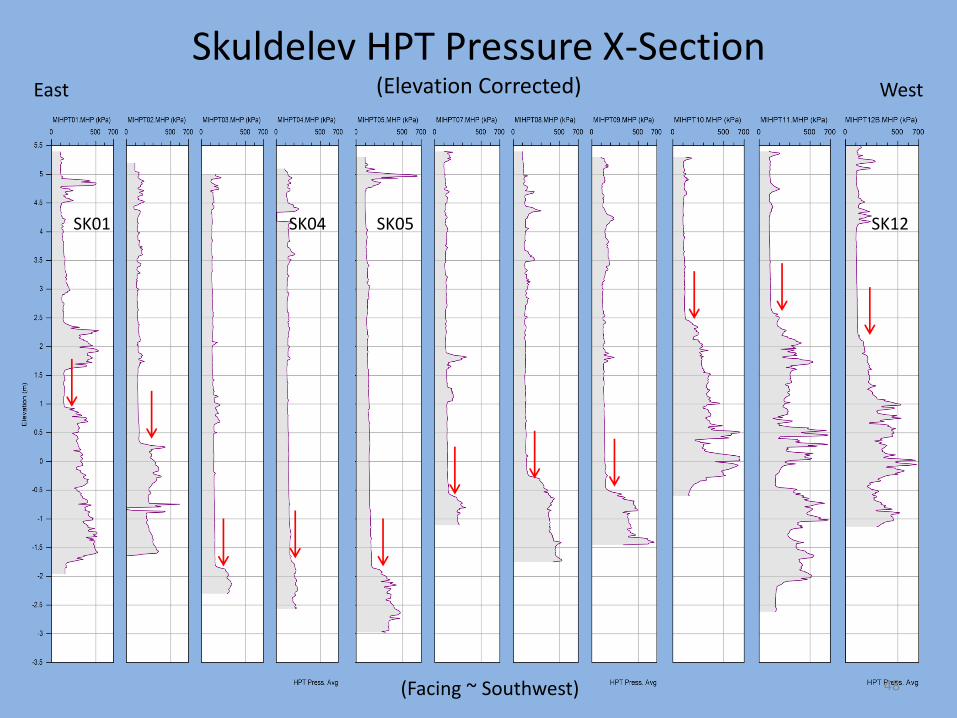
Skuldelev HPT Pressure X-Section (Elevation Corrected)
SK01 SK12 SK05 SK04
East West
(Facing ~ Southwest) 46
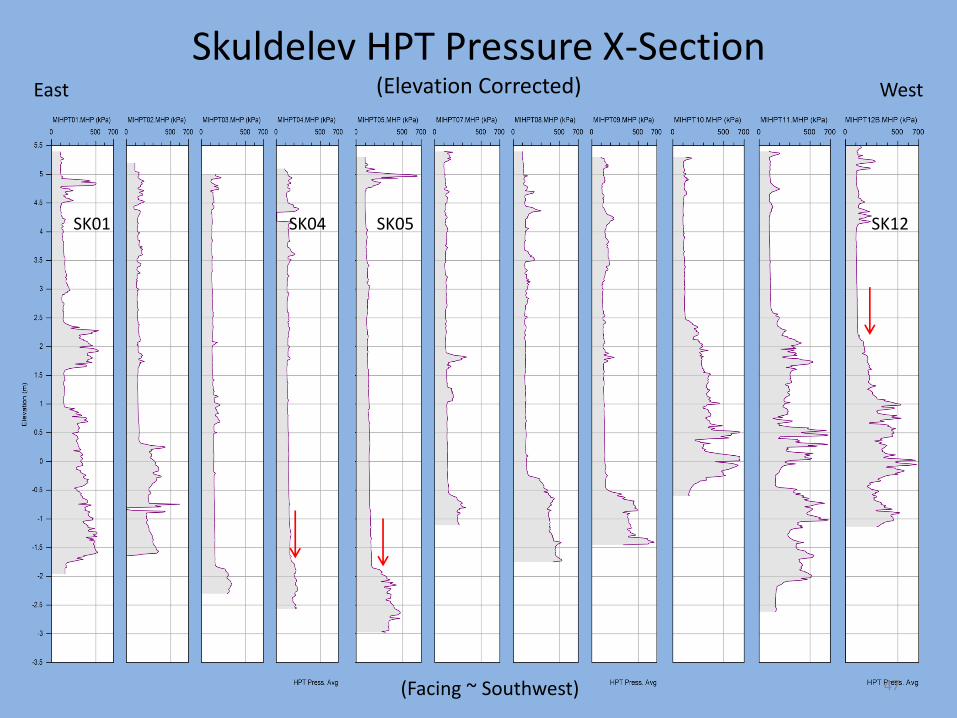
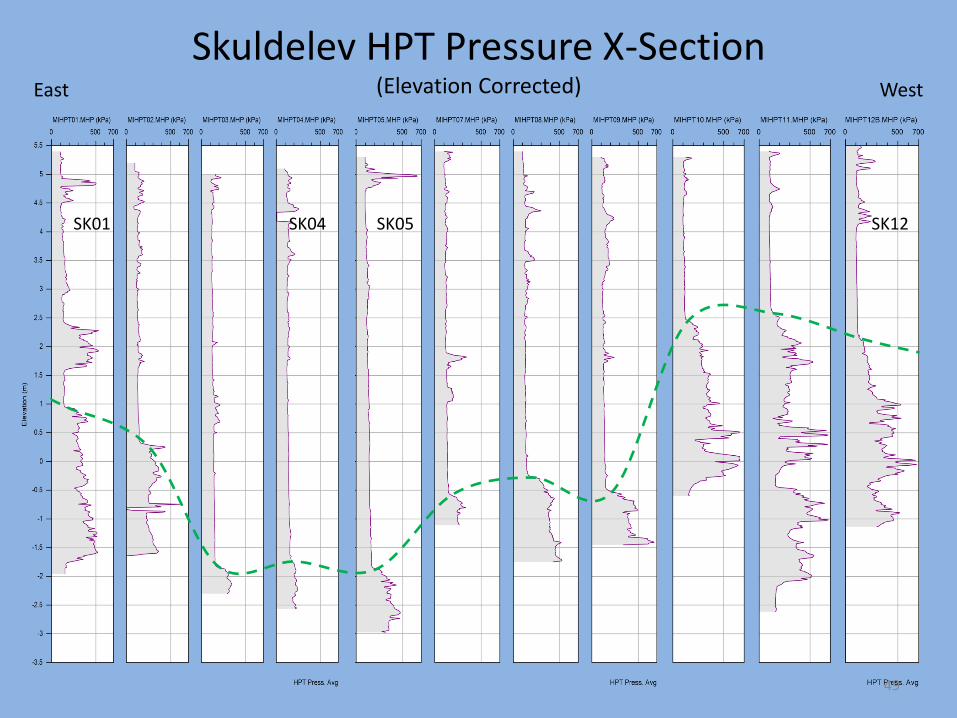
Skuldelev HPT Pressure X-Section (Elevation Corrected)
SK01 SK12 SK05 SK04
East West
(Facing ~ Southwest) 47
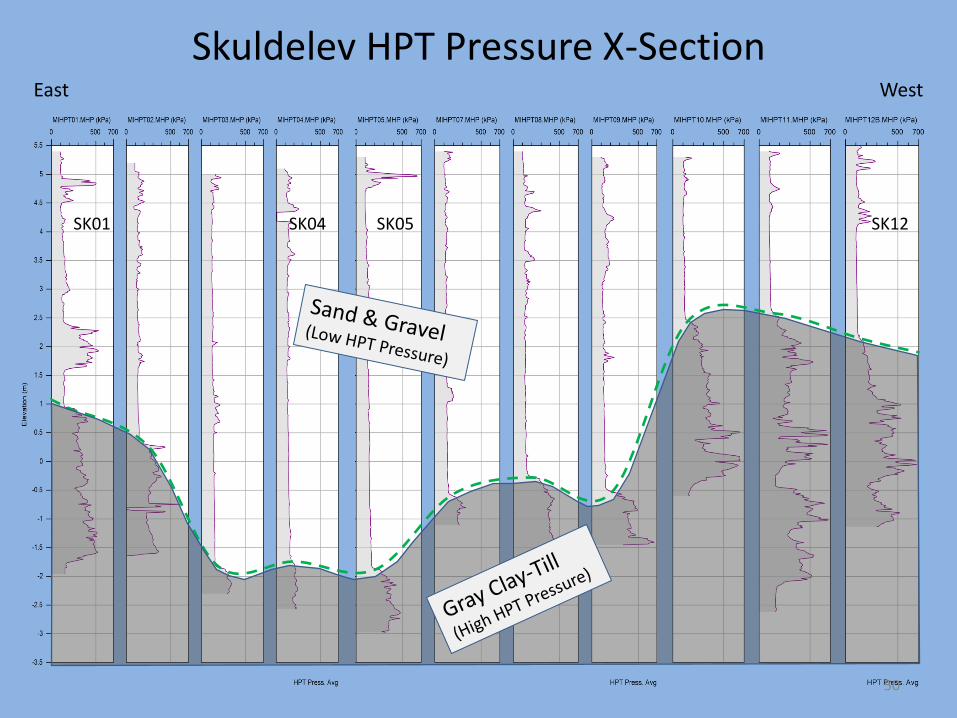
Skuldelev HPT Pressure X-Section (Elevation Corrected)
SK01 SK12 SK05 SK04
East West
(Facing ~ Southwest) 48
Skuldelev HPT Pressure X-Section (Elevation Corrected)
SK01 SK12 SK05 SK04
East West
49
Skuldelev HPT Pressure X-Section
SK01 SK12 SK05 SK04
East West
50
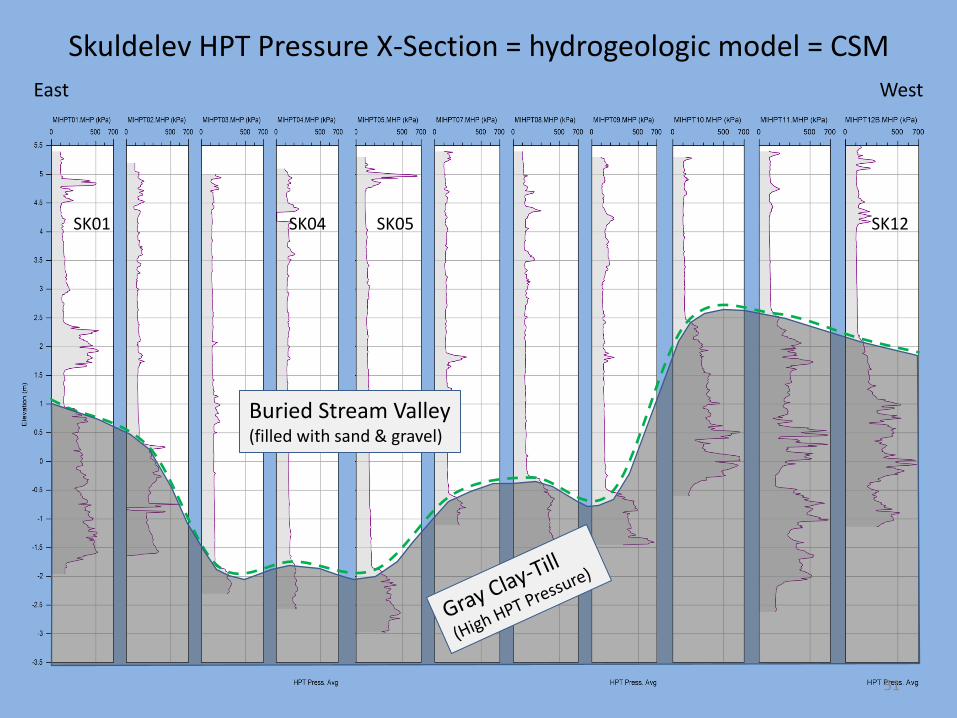
Skuldelev HPT Pressure X-Section = hydrogeologic model = CSM
Buried Stream Valley (filled with sand & gravel)
SK01 SK12 SK05 SK04
East West
51
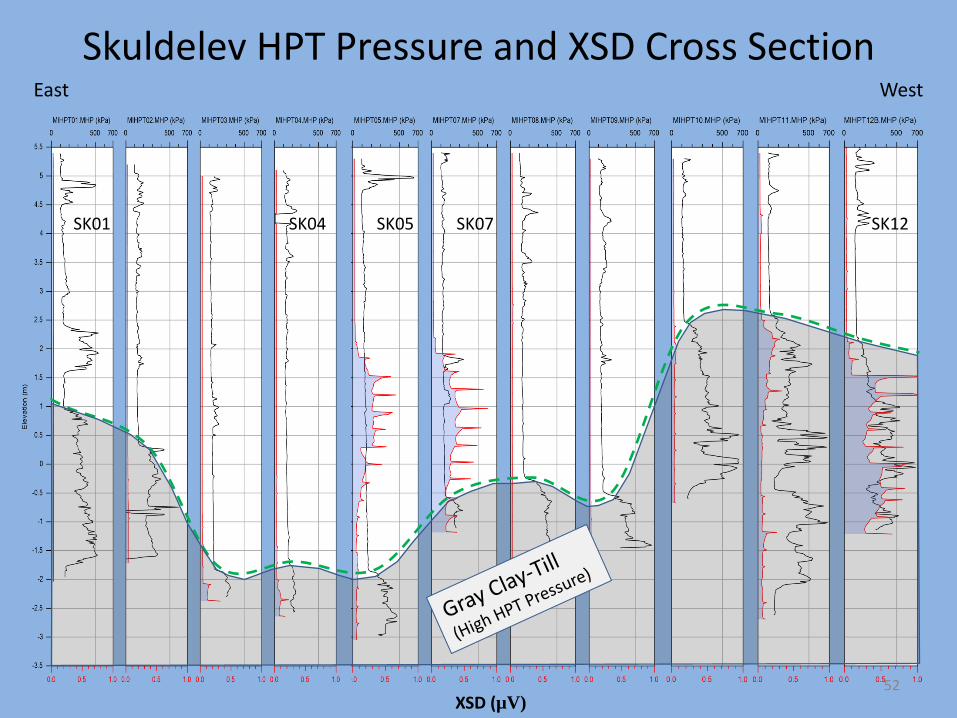
Skuldelev HPT Pressure and XSD Cross Section
SK01 SK12 SK05 SK04
West East
XSD (µV)
SK07
52
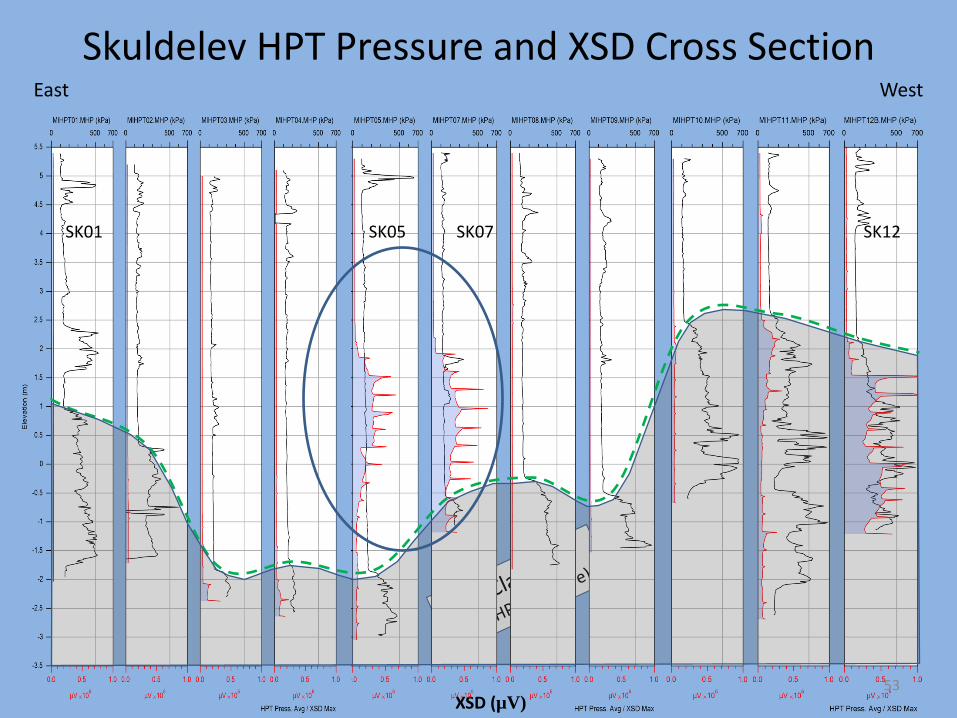
Skuldelev HPT Pressure and XSD Cross Section
SK01 SK12 SK05 SK04
West East
XSD (µV)
SK07
53
SK01 SK12 SK05 SK07
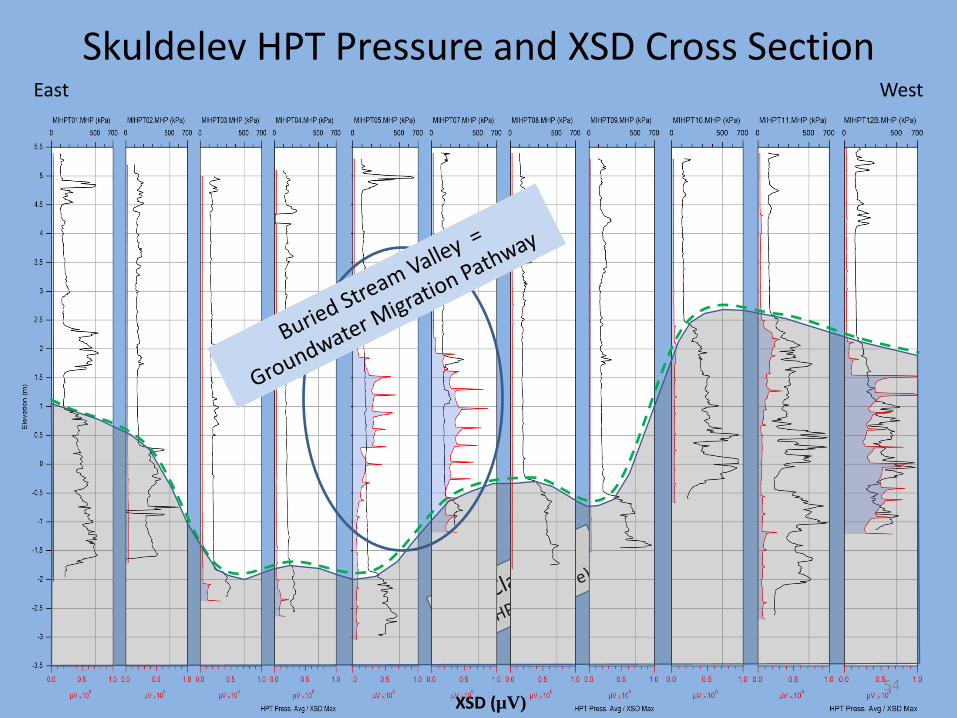
Skuldelev HPT Pressure and XSD Cross Section
SK01 SK12 SK05 SK04
West East
XSD (µV)
SK07
54
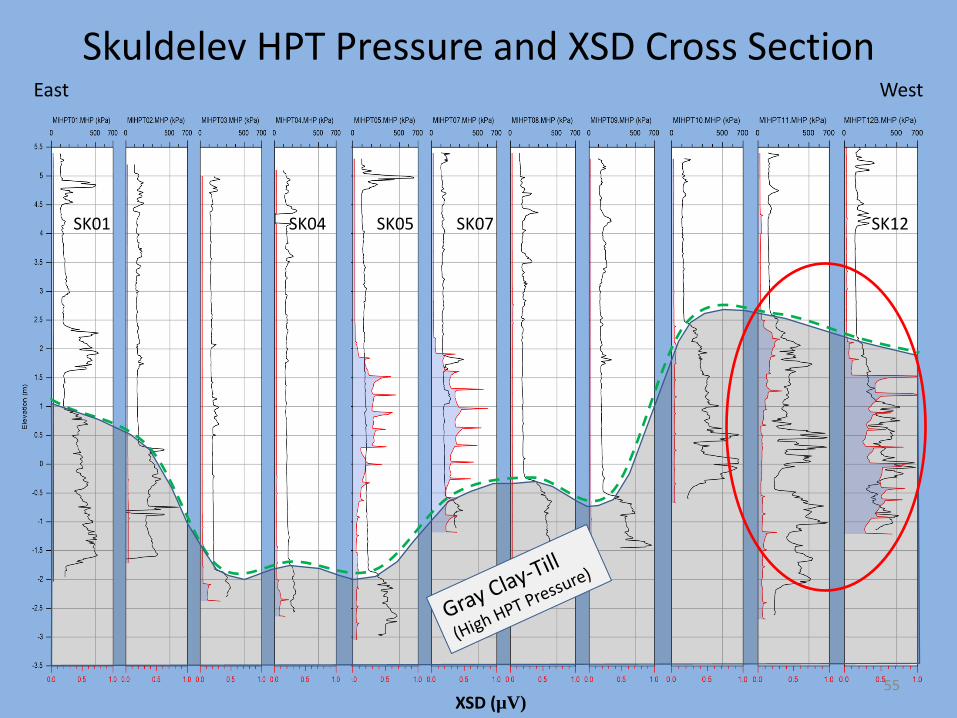
Skuldelev HPT Pressure and XSD Cross Section
SK01 SK12 SK05 SK04
West East
XSD (µV)
SK07
55
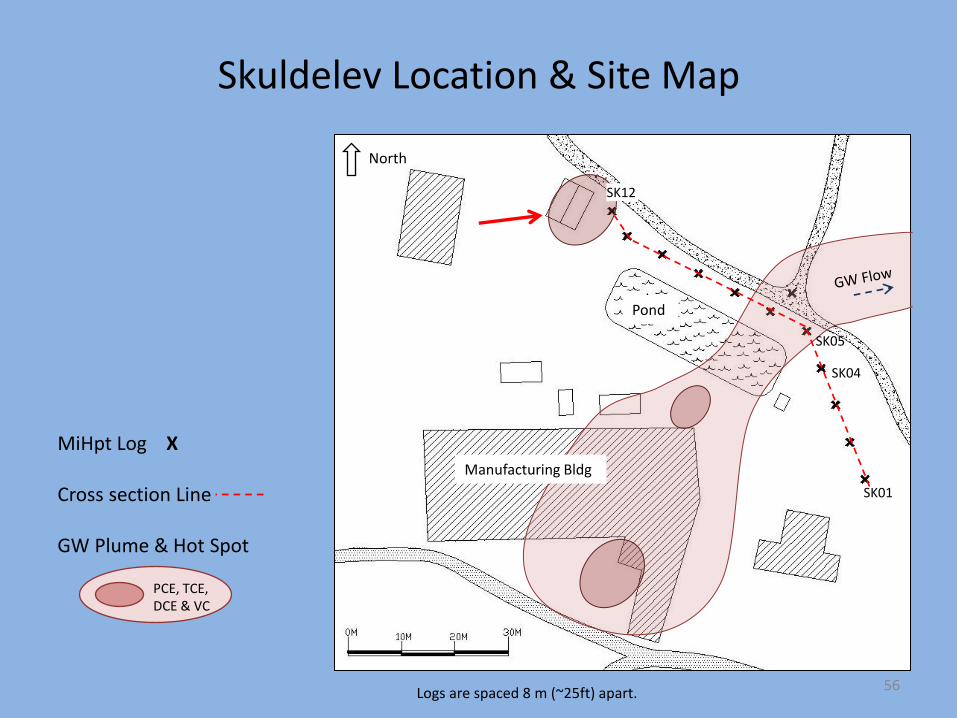
Skuldelev Location & Site Map
Pond
Manufacturing Bldg
SK01
SK05
SK04
SK12
MiHpt Log X
Cross section Line
GW Plume & Hot Spot
North
Logs are spaced 8 m (~25ft) apart.
PCE, TCE, DCE & VC
56
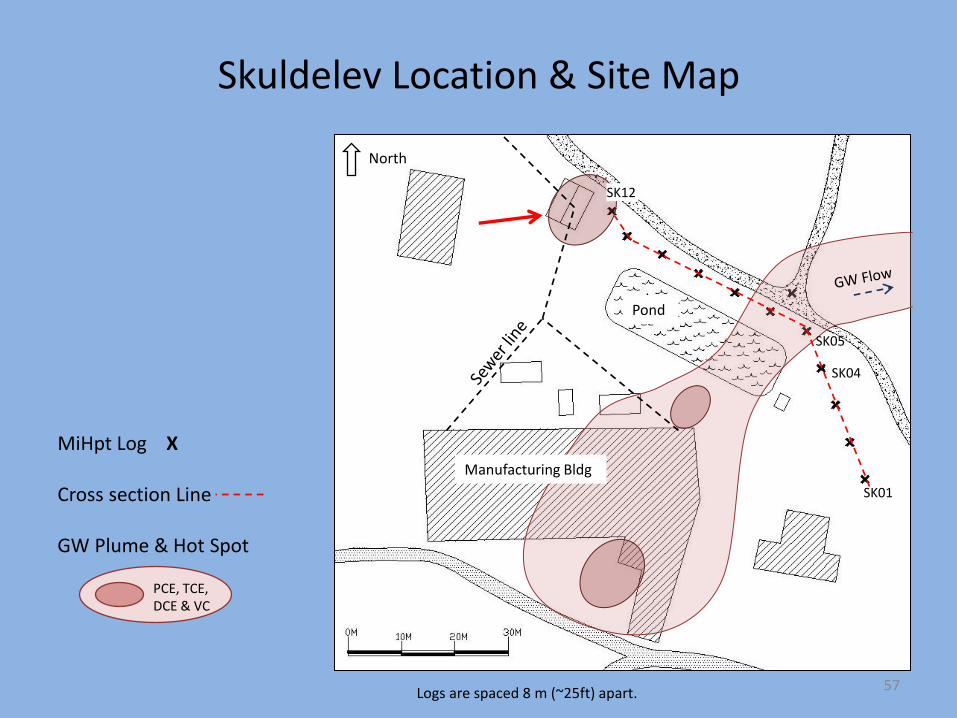
Skuldelev Location & Site Map
Pond
Manufacturing Bldg
SK01
SK05
SK04
SK12
MiHpt Log X
Cross section Line
GW Plume & Hot Spot
North
Logs are spaced 8 m (~25ft) apart.
PCE, TCE, DCE & VC
57
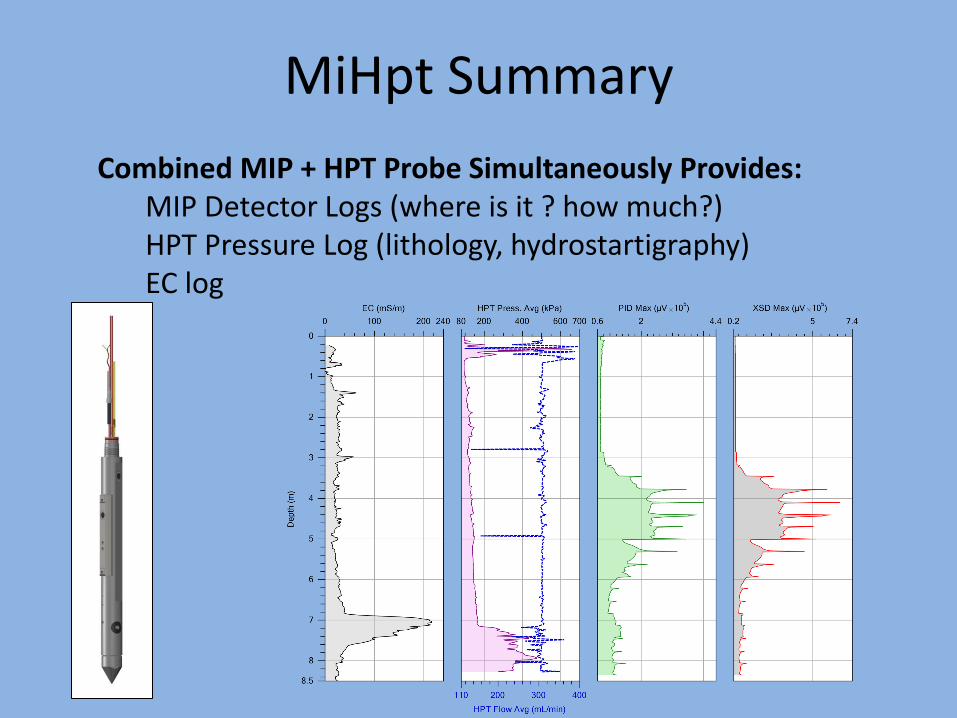
MiHpt Summary
Combined MIP + HPT Probe Simultaneously Provides: MIP Detector Logs (where is it ? how much?) HPT Pressure Log (lithology, hydrostartigraphy) EC log
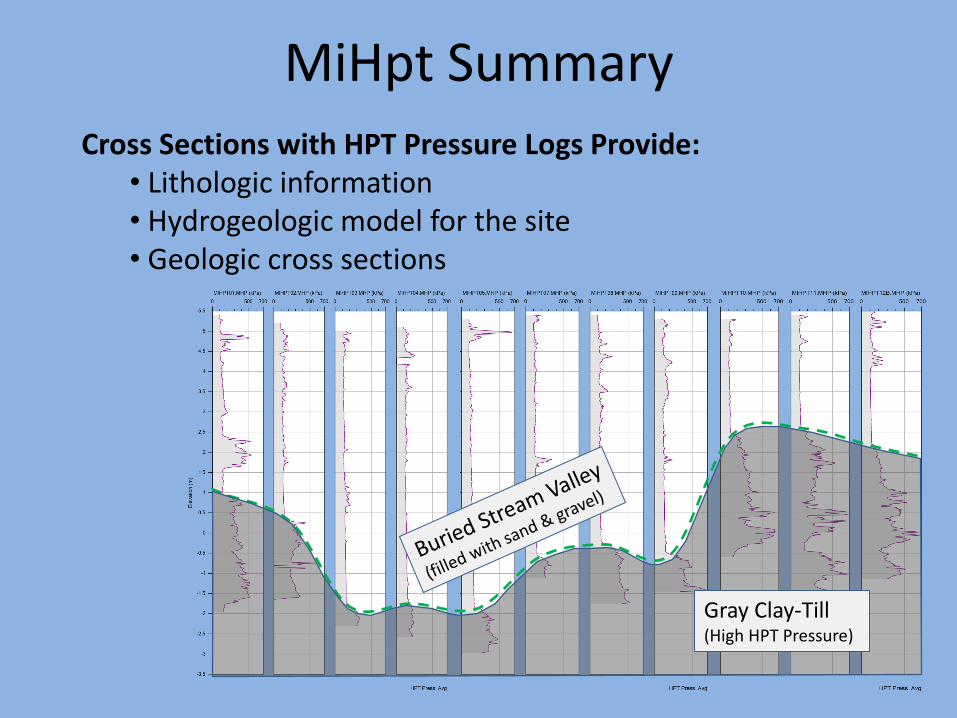
MiHpt Summary
Cross Sections with HPT Pressure Logs Provide: • Lithologic information • Hydrogeologic model for the site • Geologic cross sections
Gray Clay-Till (High HPT Pressure)
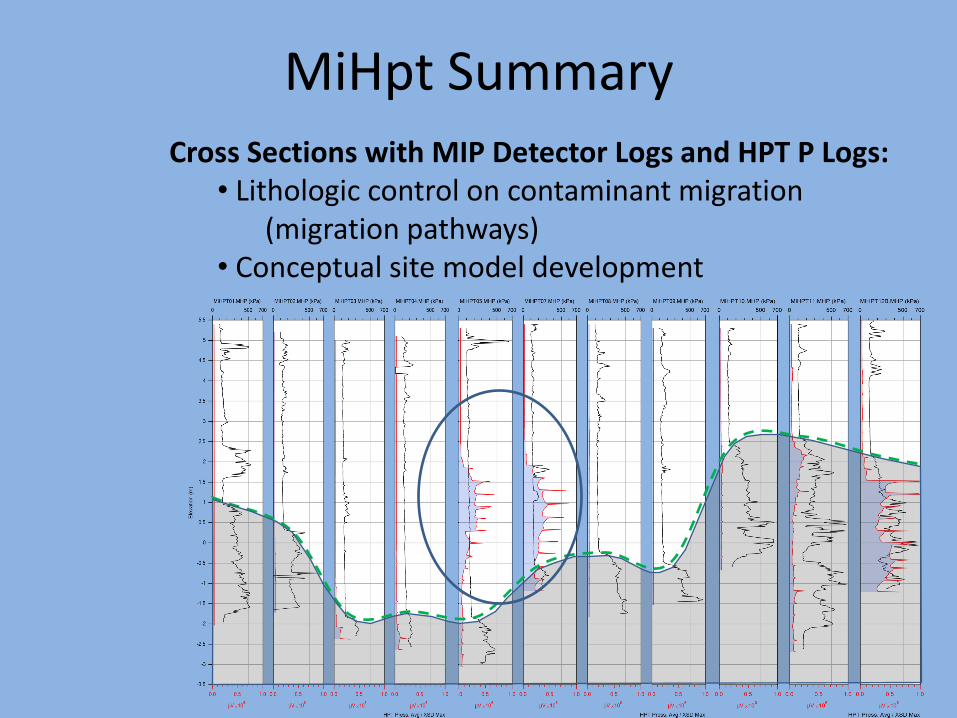
MiHpt Summary Cross Sections with MIP Detector Logs and HPT P Logs:
• Lithologic control on contaminant migration (migration pathways) • Conceptual site model development
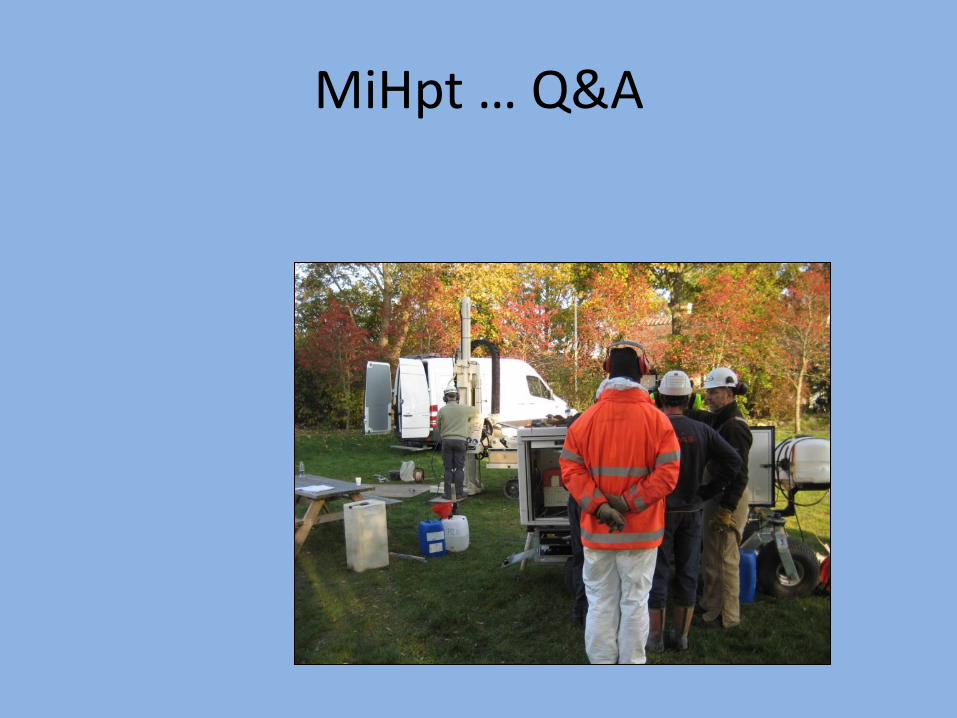
MiHpt … Q&A
62
EC Anomaly ?
Example HPT Log : Skuldelev SK05
0
1
2
3
4
5
6
7
8
0 50 100 150 200 250
De
pth
(m
ete
rs)
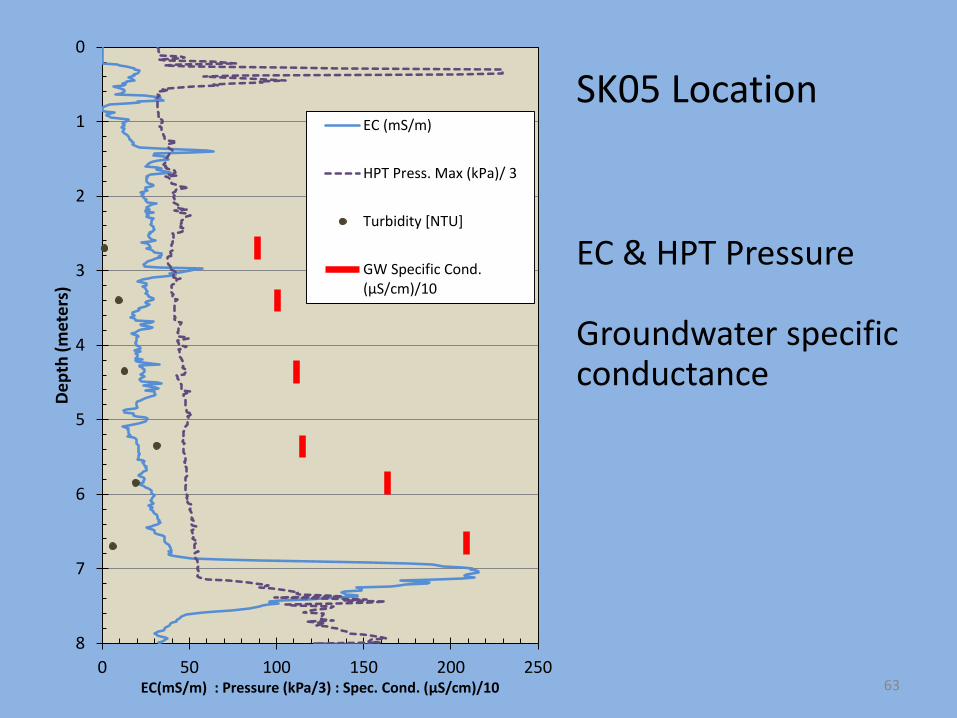
EC(mS/m) : Pressure (kPa/3) : Spec. Cond. (µS/cm)/10
EC (mS/m)
HPT Press. Max (kPa)/ 3
Turbidity [NTU]
GW Specific Cond.(µS/cm)/10
SK05 Location EC & HPT Pressure Groundwater specific conductance
63
Skuldelev Location & Site Map
Pond
Manufacturing Bldg
SK01
SK05
SK04
SK12
MiHpt Log X
Cross section Line
GW Plume & Hot Spot
Persulfate Injection
North
Logs are spaced 8 m (~25ft) apart.
PCE, TCE, DCE & VC
64
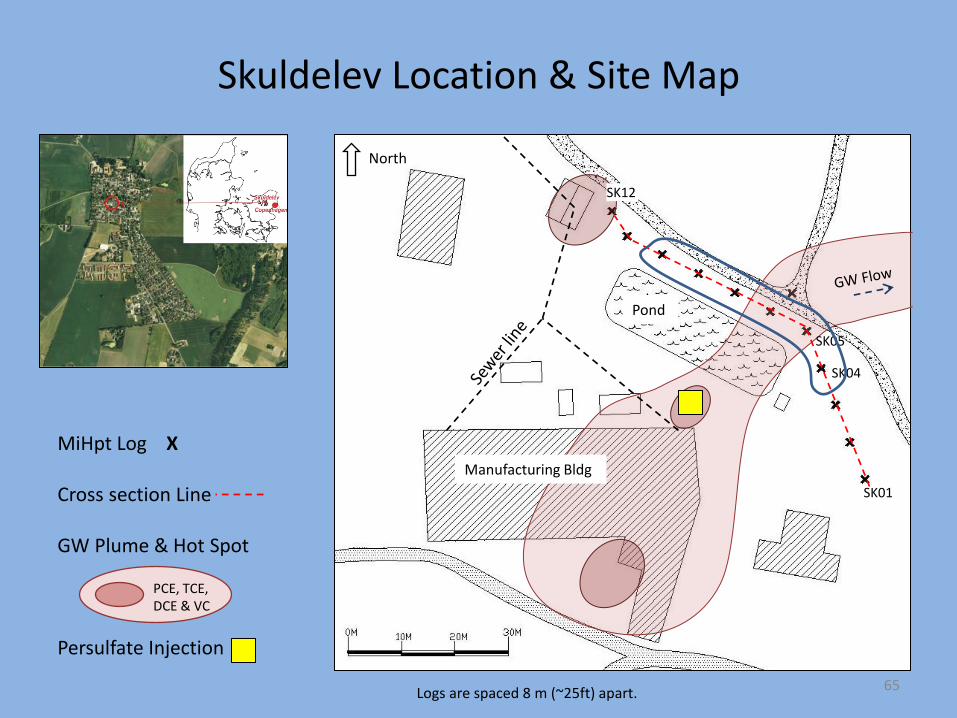
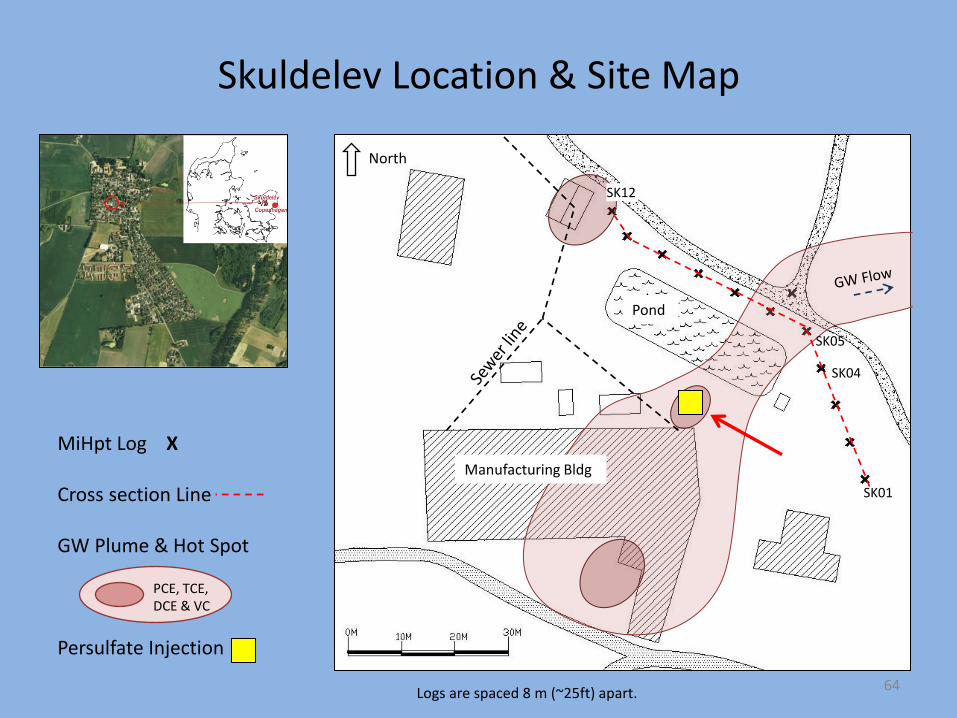
Skuldelev Location & Site Map
Pond
Manufacturing Bldg
SK01
SK05
SK04
SK12
MiHpt Log X
Cross section Line
GW Plume & Hot Spot
Persulfate Injection
North
Logs are spaced 8 m (~25ft) apart.
PCE, TCE, DCE & VC
65
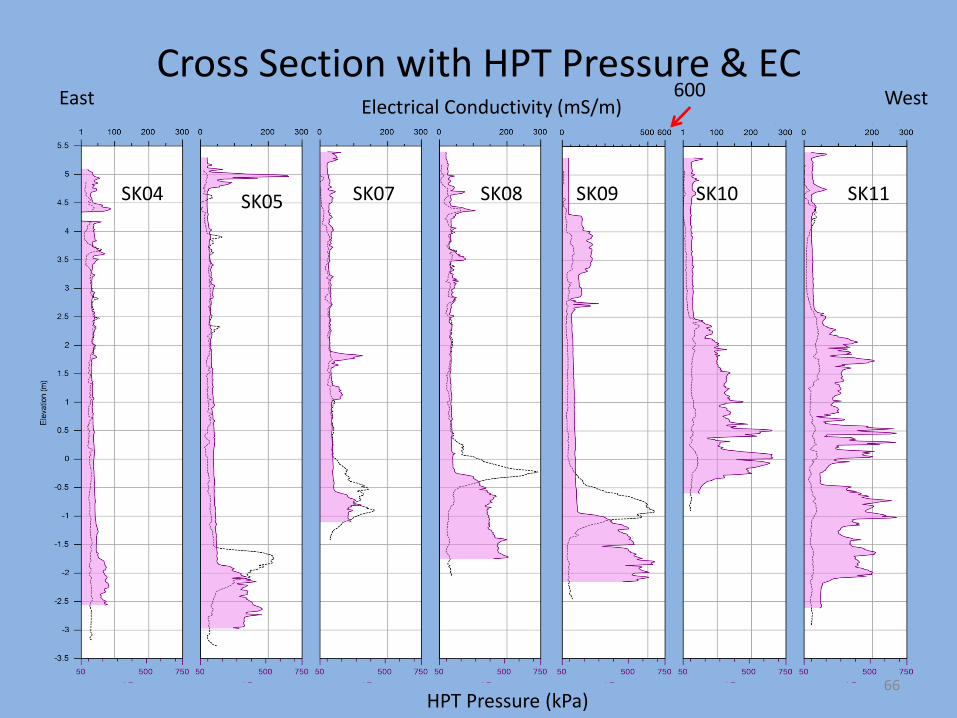
Electrical Conductivity (mS/m)
Cross Section with HPT Pressure & EC
SK04 SK05 SK07 SK10 SK09 SK08 SK11
600 East West
HPT Pressure (kPa) 66
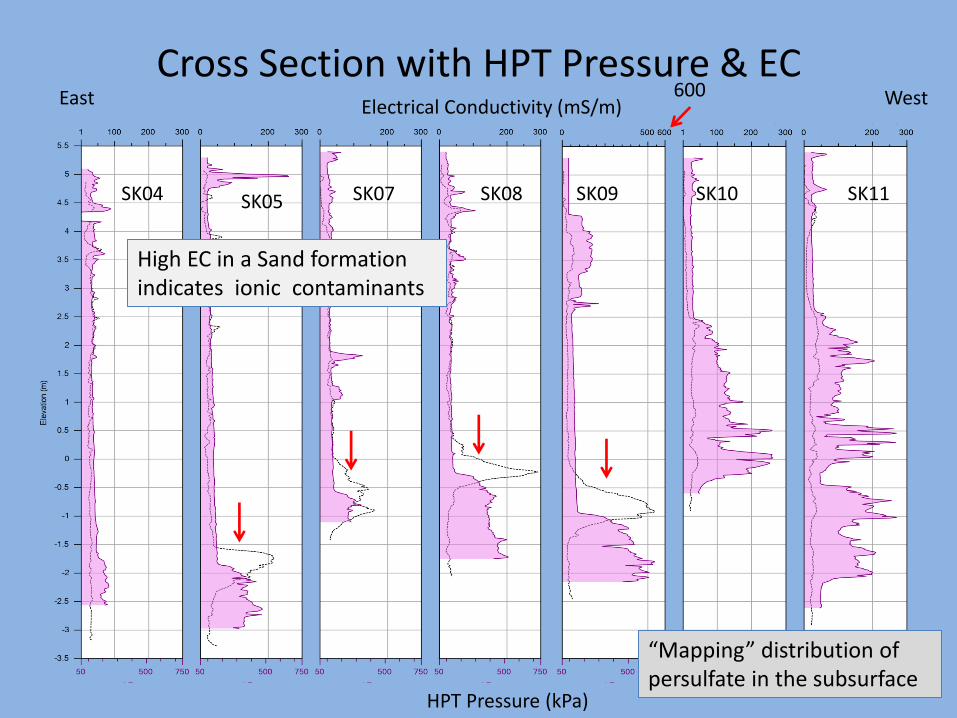
Electrical Conductivity (mS/m)
Cross Section with HPT Pressure & EC
SK04 SK05 SK07 SK10 SK09 SK08 SK11
600 East West
HPT Pressure (kPa)
High EC in a Sand formation indicates ionic contaminants
67
“Mapping” distribution of persulfate in the subsurface
Estimating Hydraulic Conductivity (K) from HPT Pressure and Flow Logs
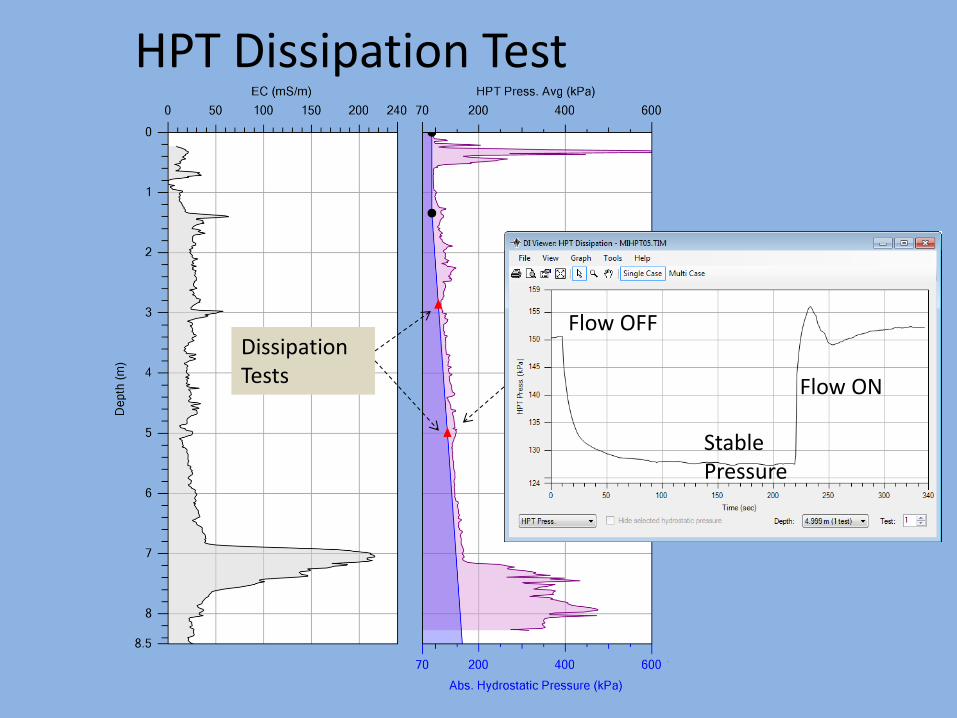
HPT Dissipation Test
Dissipation Tests
Flow OFF
Flow ON
Stable Pressure
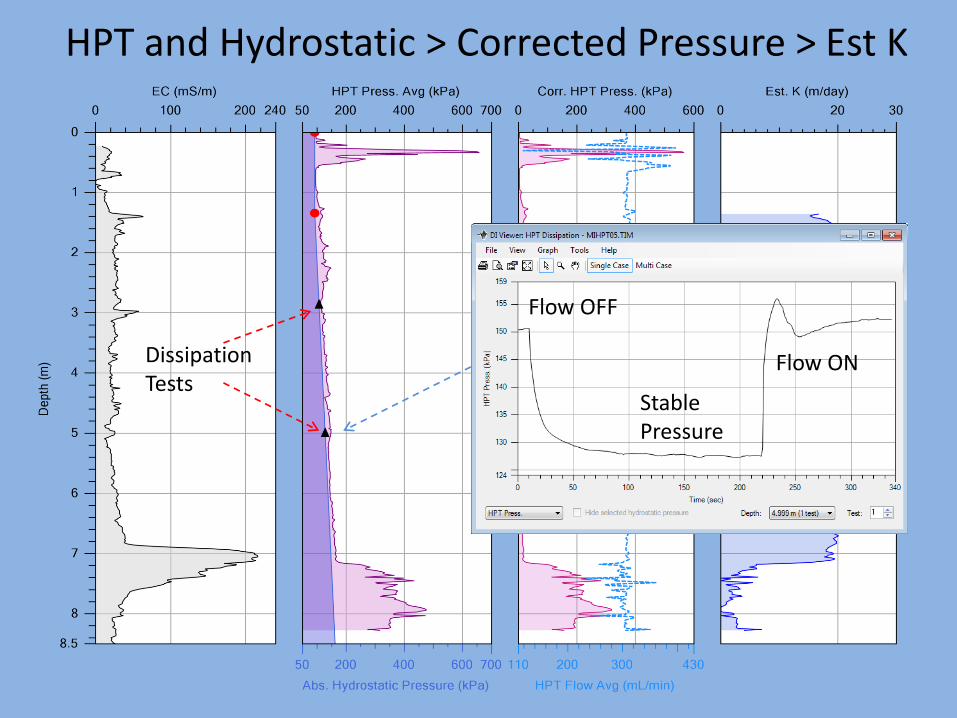
HPT and Hydrostatic > Corrected Pressure > Est K
Dissipation Tests
Flow OFF
Flow ON
Stable Pressure
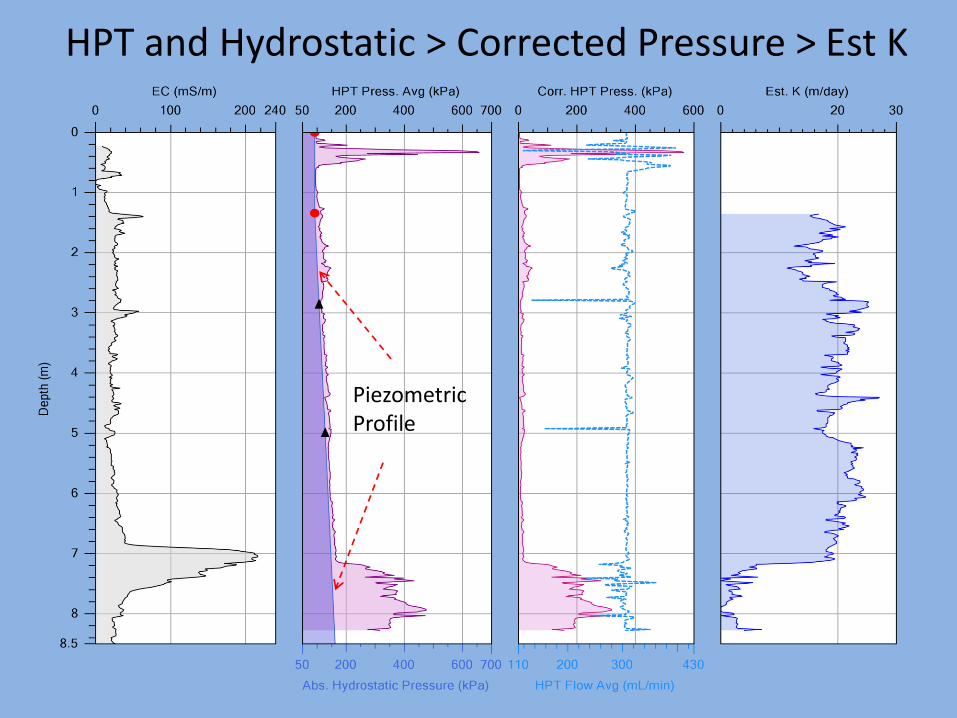
HPT and Hydrostatic > Corrected Pressure > Est K
Piezometric Profile
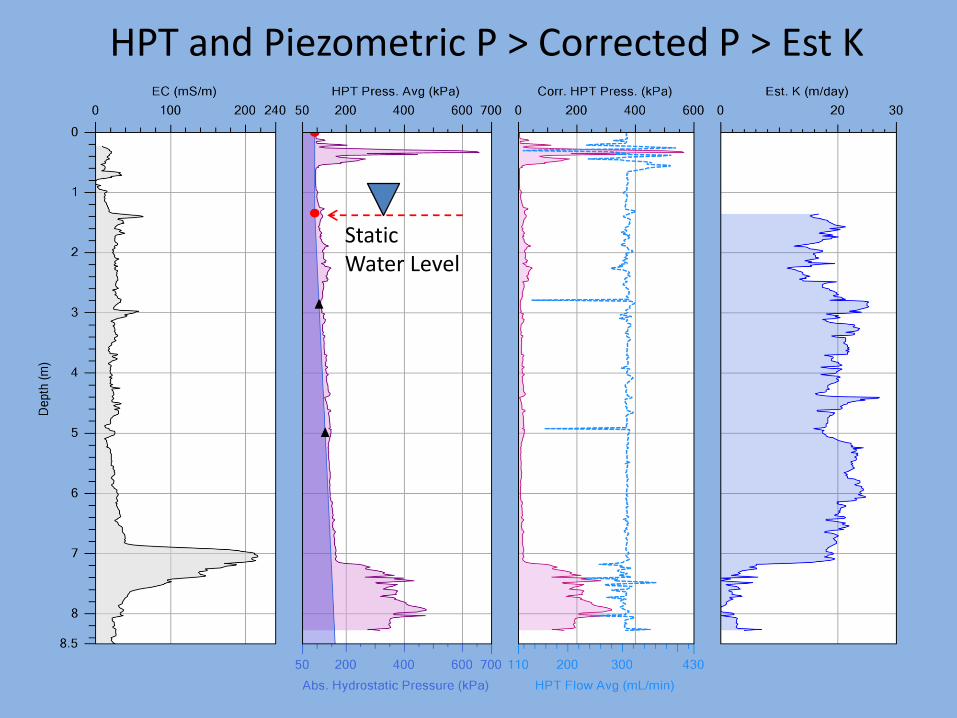
HPT and Piezometric P > Corrected P > Est K
Static Water Level
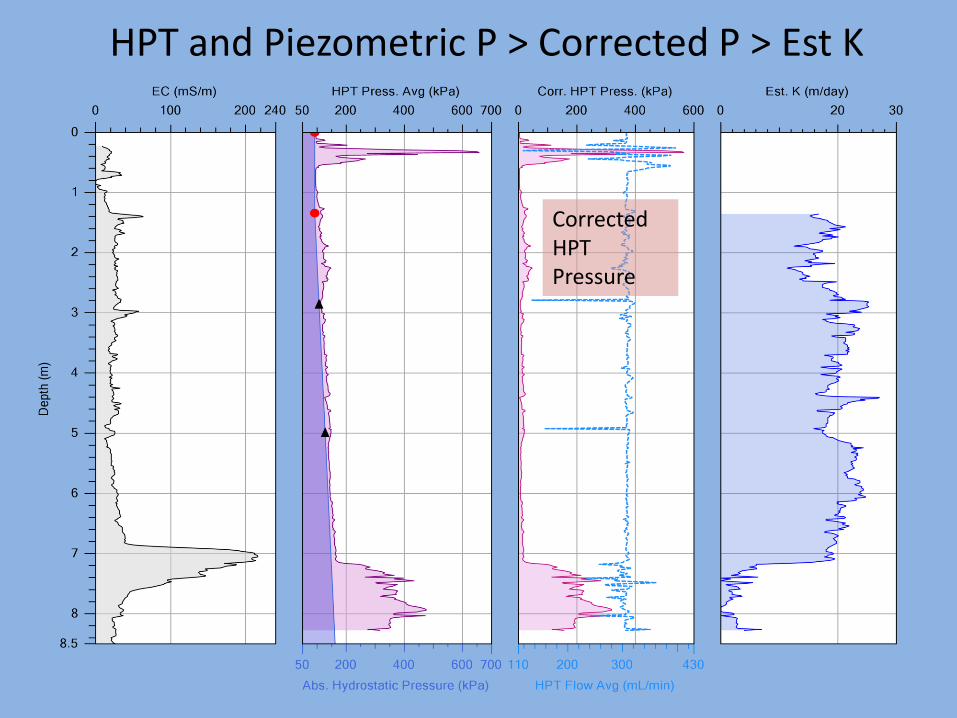
HPT and Piezometric P > Corrected P > Est K
Corrected HPT Pressure
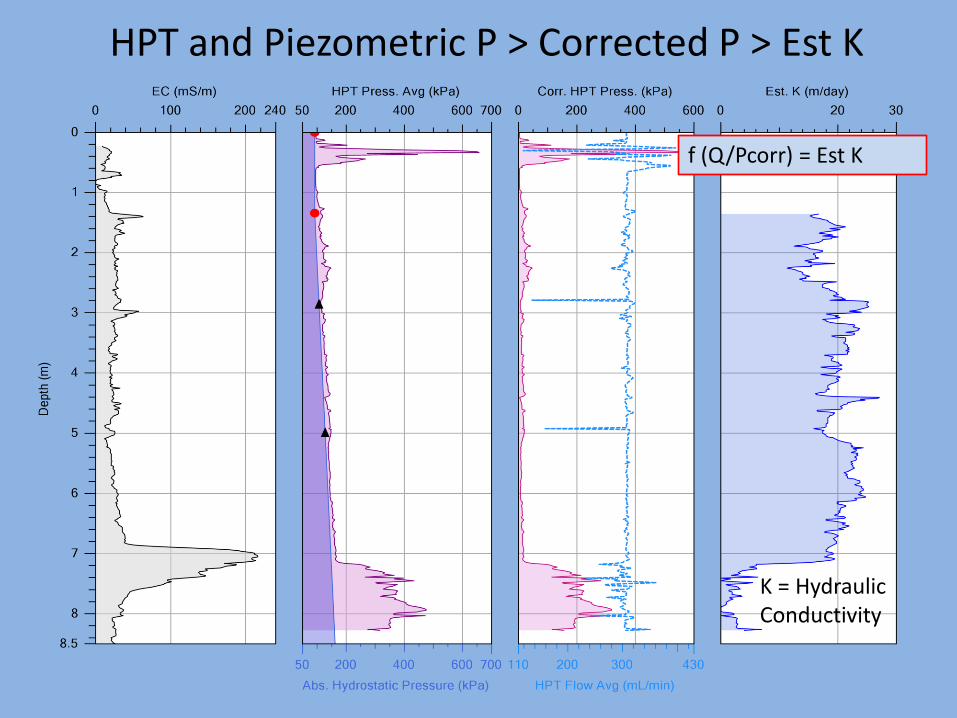
HPT and Piezometric P > Corrected P > Est K
f (Q/Pcorr) = Est K
K = Hydraulic Conductivity