Embed Size (px)
Citation preview
Minda Industries Ltd.Investor Presentation – May 2019
2/62 / 462/40
This presentation and the accompanying slides (the “Presentation”), has been prepared by Minda Industries Limited (the “Company”), solely forinformation purposes and do not constitute any offer, recommendation or invitation to purchase or subscribe for any securities, and shall not form thebasis or be relied on in connection with any contract or binding commitment whatsoever. No offering of securities of the Company will be made exceptby means of a statutory offering document containing detailed information about the Company.
This Presentation has been prepared by the Company based on information and data which the Company considers reliable, but the Company makes norepresentation or warranty, express or implied, whatsoever, and no reliance shall be placed on, the truth, accuracy, completeness, fairness andreasonableness of the contents of this Presentation. This Presentation may not be all inclusive and may not contain all of the information that you mayconsider material. Any liability in respect of the contents of, or any omission from, this Presentation is expressly excluded.
Certain matters discussed in this Presentation may contain statements regarding the Company’s market opportunity and business prospects that areindividually and collectively forward-looking statements. Such forward-looking statements are not guarantees of future performance and are subject toknown and unknown risks, uncertainties and assumptions that are difficult to predict. These risks and uncertainties include, but are not limited to, theperformance of the Indian economy and of the economies of various international markets, the performance of the auto ancilliary industry in India andworld-wide, competition, the company’s ability to successfully implement its strategy, the Company’s future levels of growth and expansion,technological implementation, changes and advancements, changes in revenue, income or cash flows, the Company’s market preferences and itsexposure to market risks, as well as other risks. The Company’s actual results, levels of activity, performance or achievements could differ materially andadversely from results expressed in or implied by this Presentation. The Company assumes no obligation to update any forward-looking informationcontained in this Presentation. Any forward-looking statements and projections made by third parties included in this Presentation are not adopted bythe Company and the Company is not responsible for such third party statements and projections.
Safe Harbor
3/63 / 463/40
Quarterly UpdatePresentation
4/64 / 464/40
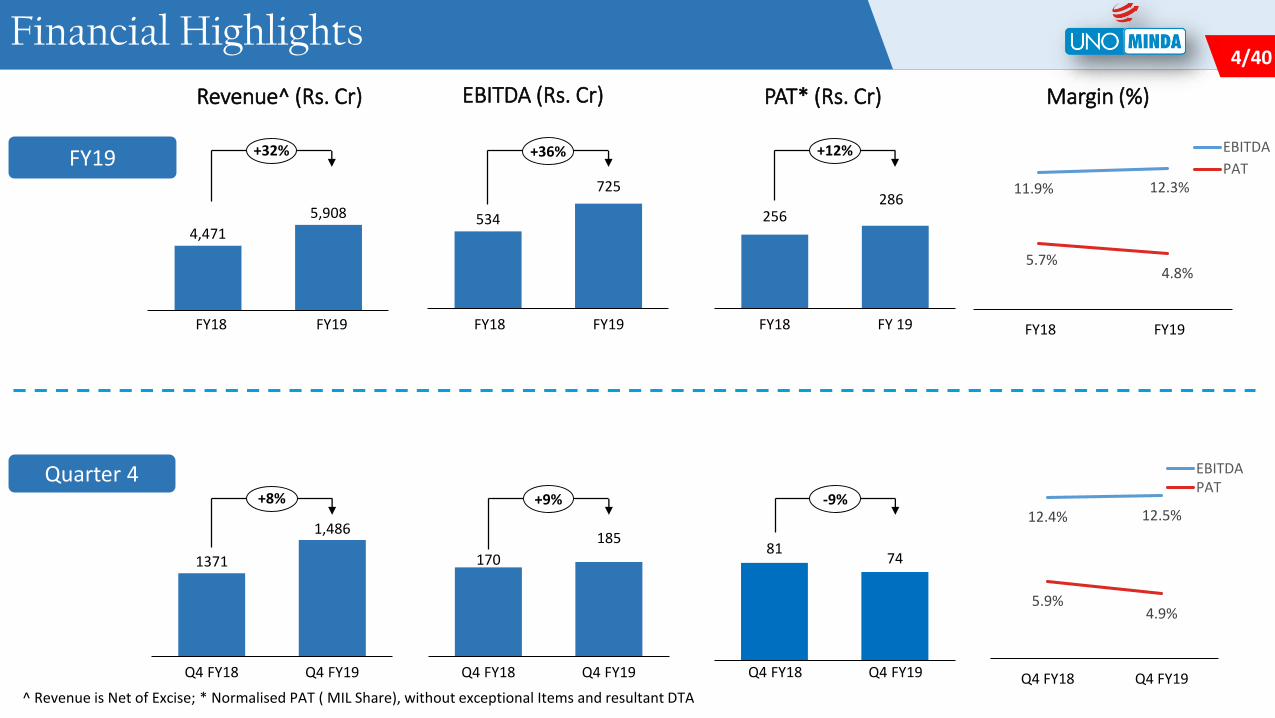
12.4% 12.5%
5.9%4.9%
Q4 FY18 Q4 FY19
EBITDAPAT
Financial Highlights
1371
1,486
Q4 FY18 Q4 FY19
+8%
170
185
Q4 FY18 Q4 FY19
+9%
^ Revenue is Net of Excise; * Normalised PAT ( MIL Share), without exceptional Items and resultant DTA
11.9% 12.3%
5.7%4.8%
FY18 FY19
EBITDA
PAT
4,471
5,908
FY19FY18
+32%
534
725
FY18 FY19
+36%
Quarter 4
FY19
Revenue^ (Rs. Cr) EBITDA (Rs. Cr) PAT* (Rs. Cr) Margin (%)
8174
Q4 FY18 Q4 FY19
-9%
256286
FY 19FY18
+12%
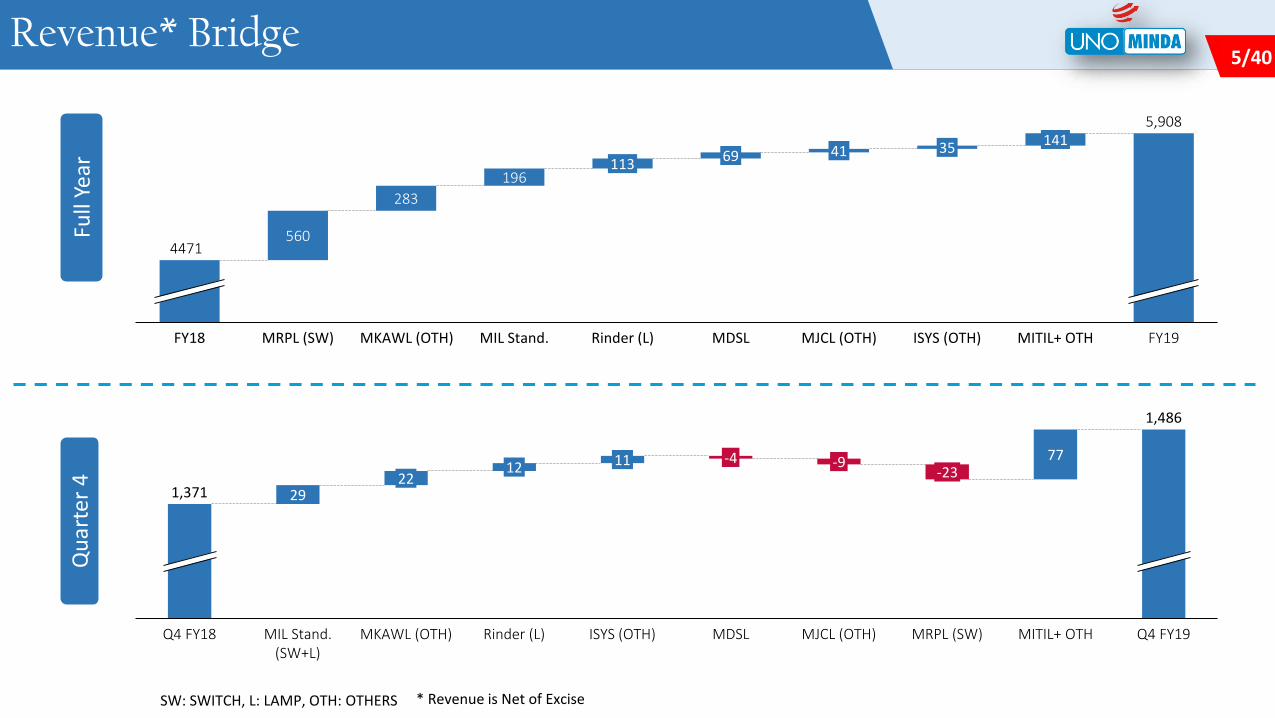
5/65 / 465/40Revenue* Bridge
SW: SWITCH, L: LAMP, OTH: OTHERS * Revenue is Net of Excise
29
7712
22
MIL Stand. (SW+L)
-4
MJCL (OTH)
1,371
Q4 FY18
-9
MKAWL (OTH) Rinder (L) ISYS (OTH) MRPL (SW) MITIL+ OTH Q4 FY19
-23
MDSL
1,486
11
Qu
arte
r 4
560
283
196
Rinder (L)MRPL (SW) MKAWL (OTH)FY18
41
ISYS (OTH)MDSL FY19
69113
141
4471
MITIL+ OTH
35
MIL Stand. MJCL (OTH)
5,908
Full
Year
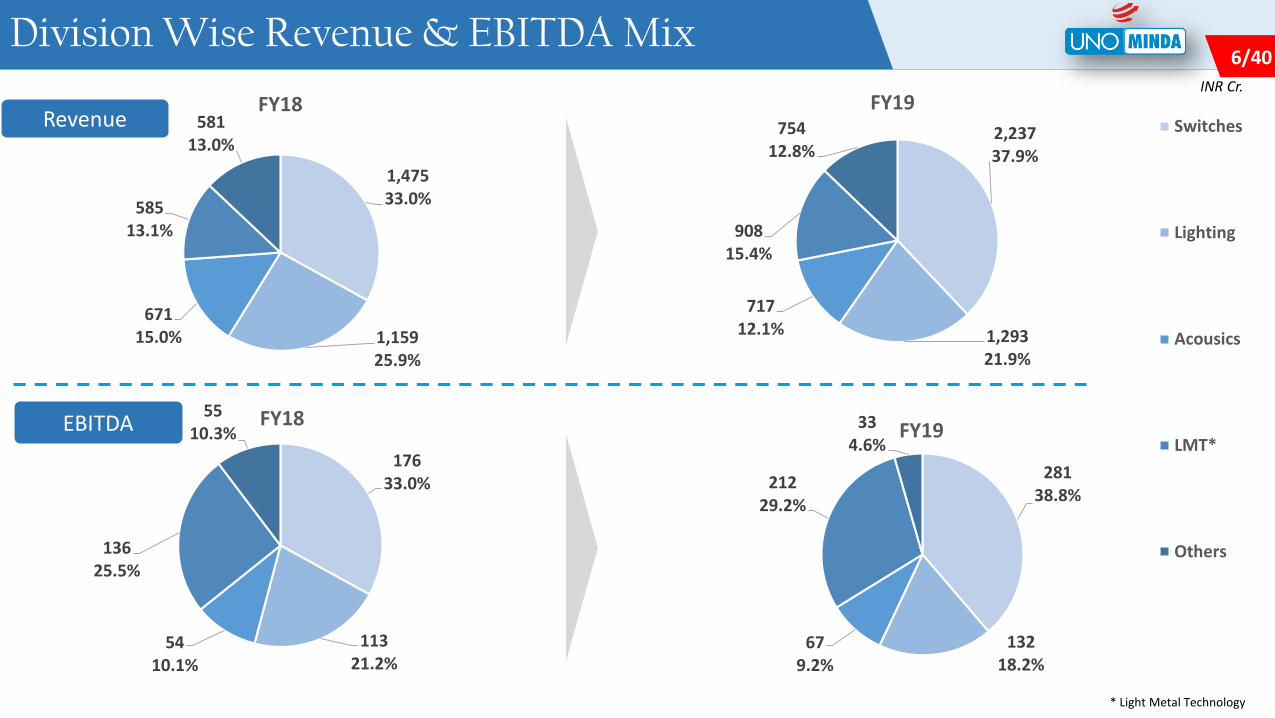
6/66 / 466/40Division Wise Revenue & EBITDA Mix
1,47533.0%
1,15925.9%
67115.0%
58513.1%
58113.0%
FY182,23737.9%
1,29321.9%
71712.1%
90815.4%
75412.8%
FY19Switches
Lighting
Acousics
LMT*
Others
17633.0%
11321.2%
5410.1%
13625.5%
5510.3%
FY18
28138.8%
13218.2%
679.2%
21229.2%
334.6%
FY19
* Revenue is Net of Excise
Revenue
EBITDA
INR Cr.
* Light Metal Technology
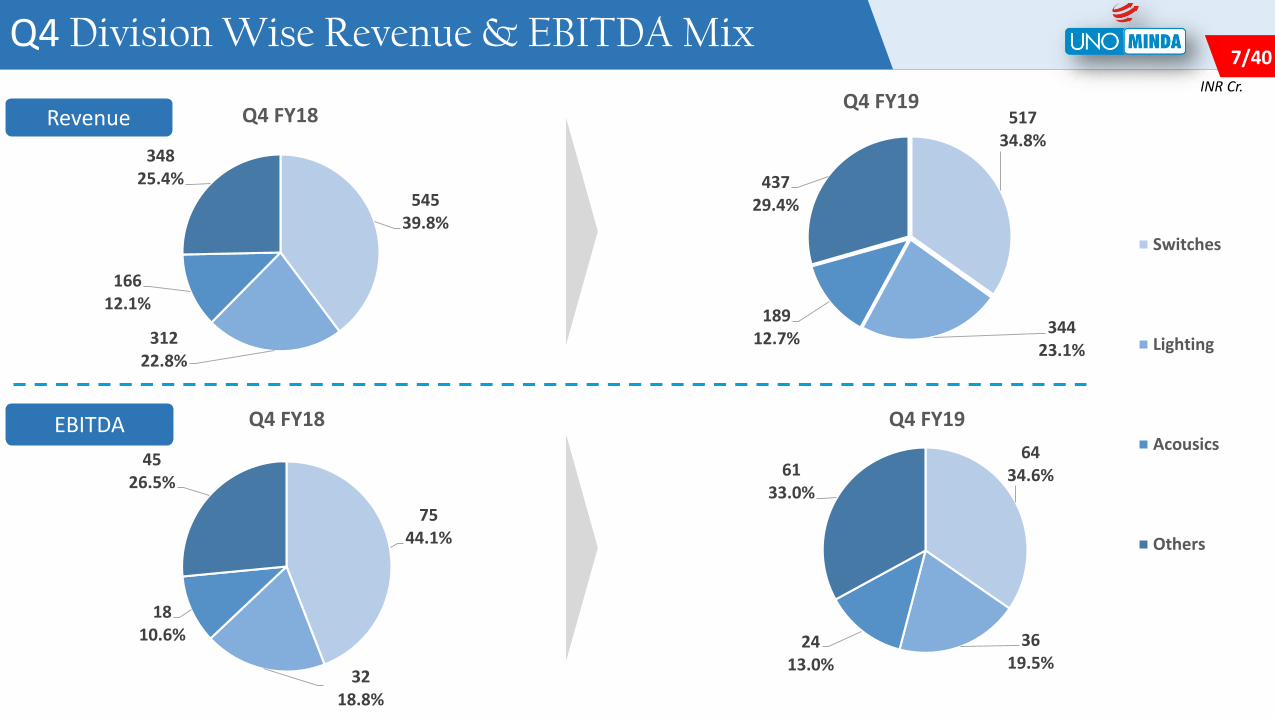
7/67 / 467/40Q4 Division Wise Revenue & EBITDA Mix
54539.8%
31222.8%
16612.1%
34825.4%
Q4 FY18 51734.8%
34423.1%
18912.7%
43729.4%
Q4 FY19
Switches
Lighting
Acousics
Others
7544.1%
3218.8%
1810.6%
4526.5%
Q4 FY18
6434.6%
3619.5%
2413.0%
6133.0%
Q4 FY19
Revenue
EBITDA
INR Cr.
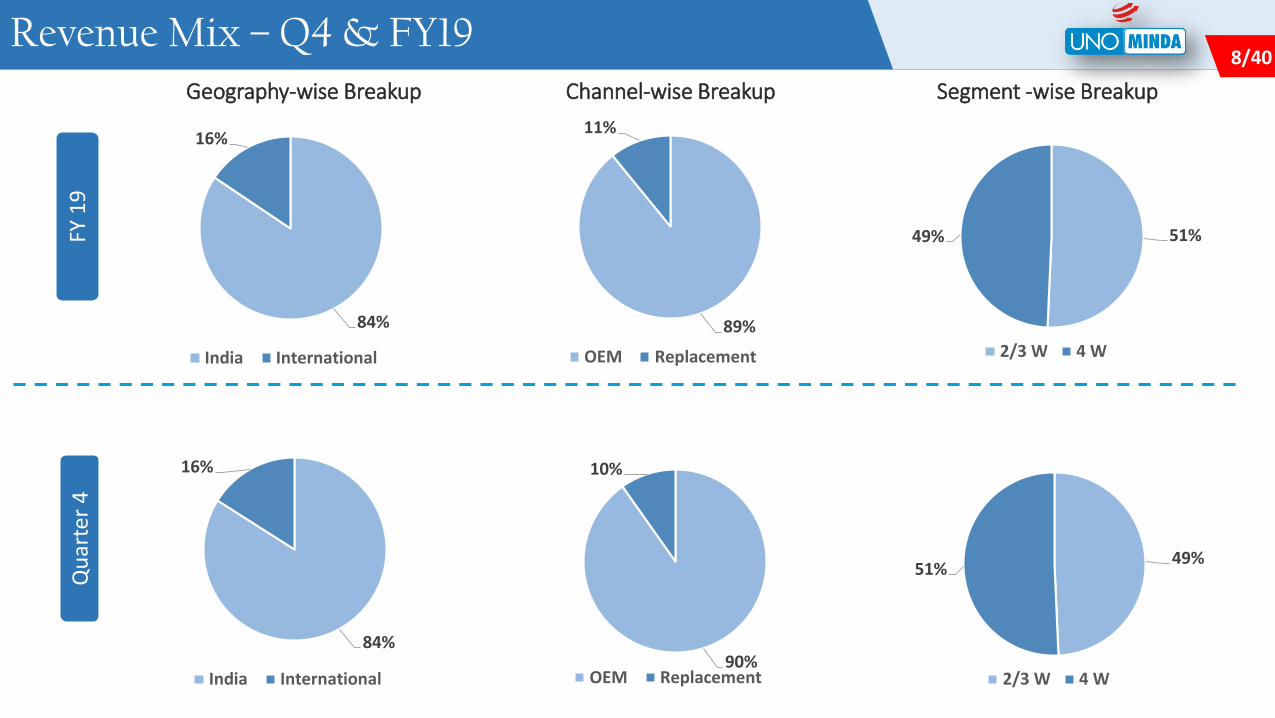
8/68 / 468/40Revenue Mix – Q4 & FY19
Channel-wise BreakupGeography-wise Breakup Segment -wise BreakupQ
uar
ter
4
84%
16%
India International90%
10%
OEM Replacement
49%51%
2/3 W 4 W
84%
16%
India International
FY 1
9
89%
11%
OEM Replacement
51%49%
2/3 W 4 W
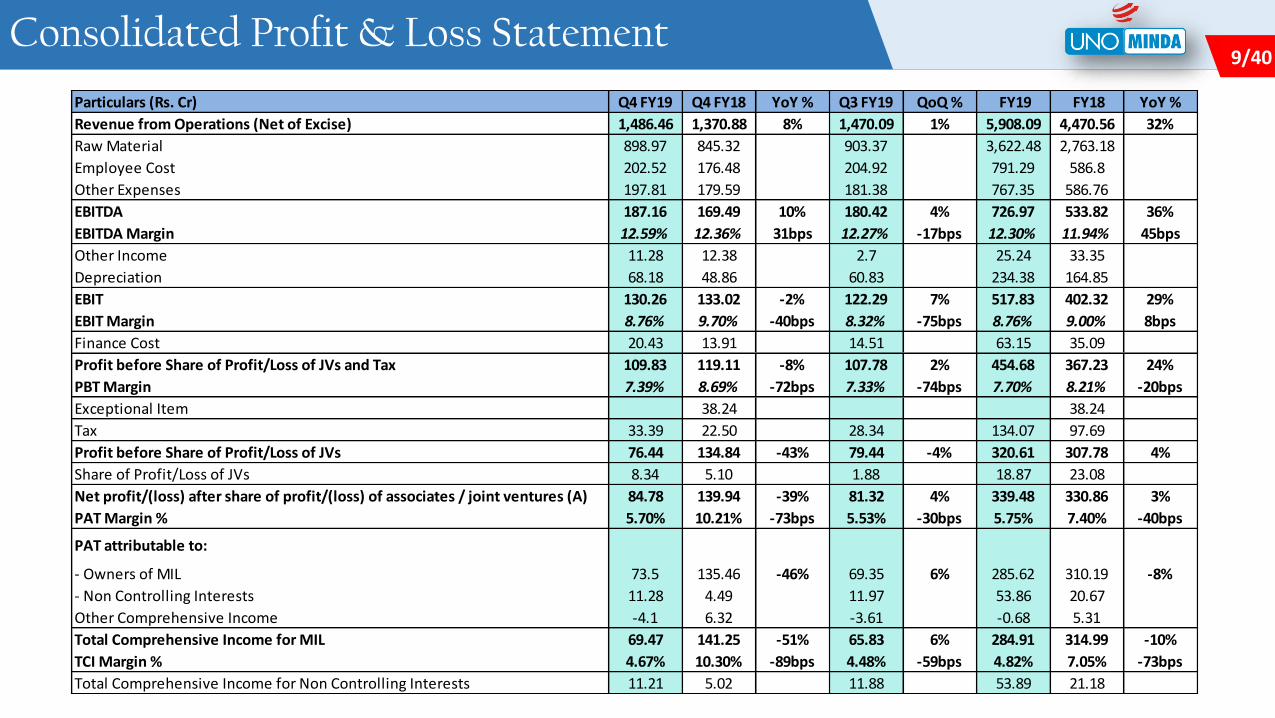
9/69 / 469/40Consolidated Profit & Loss Statement
Particulars (Rs. Cr) Q4 FY19 Q4 FY18 YoY % Q3 FY19 QoQ % FY19 FY18 YoY %
Revenue from Operations (Net of Excise) 1,486.46 1,370.88 8% 1,470.09 1% 5,908.09 4,470.56 32%
Raw Material 898.97 845.32 903.37 3,622.48 2,763.18
Employee Cost 202.52 176.48 204.92 791.29 586.8
Other Expenses 197.81 179.59 181.38 767.35 586.76
EBITDA 187.16 169.49 10% 180.42 4% 726.97 533.82 36%
EBITDA Margin 12.59% 12.36% 31bps 12.27% -17bps 12.30% 11.94% 45bps
Other Income 11.28 12.38 2.7 25.24 33.35
Depreciation 68.18 48.86 60.83 234.38 164.85
EBIT 130.26 133.02 -2% 122.29 7% 517.83 402.32 29%
EBIT Margin 8.76% 9.70% -40bps 8.32% -75bps 8.76% 9.00% 8bps
Finance Cost 20.43 13.91 14.51 63.15 35.09
Profit before Share of Profit/Loss of JVs and Tax 109.83 119.11 -8% 107.78 2% 454.68 367.23 24%
PBT Margin 7.39% 8.69% -72bps 7.33% -74bps 7.70% 8.21% -20bps
Exceptional Item 38.24 38.24
Tax 33.39 22.50 28.34 134.07 97.69
Profit before Share of Profit/Loss of JVs 76.44 134.84 -43% 79.44 -4% 320.61 307.78 4%
Share of Profit/Loss of JVs 8.34 5.10 1.88 18.87 23.08
Net profit/(loss) after share of profit/(loss) of associates / joint ventures (A) 84.78 139.94 -39% 81.32 4% 339.48 330.86 3%
PAT Margin % 5.70% 10.21% -73bps 5.53% -30bps 5.75% 7.40% -40bps
PAT attributable to:
- Owners of MIL 73.5 135.46 -46% 69.35 6% 285.62 310.19 -8%
- Non Controlling Interests 11.28 4.49 11.97 53.86 20.67
Other Comprehensive Income -4.1 6.32 -3.61 -0.68 5.31
Total Comprehensive Income for MIL 69.47 141.25 -51% 65.83 6% 284.91 314.99 -10%
TCI Margin % 4.67% 10.30% -89bps 4.48% -59bps 4.82% 7.05% -73bps
Total Comprehensive Income for Non Controlling Interests 11.21 5.02 11.88 53.89 21.18
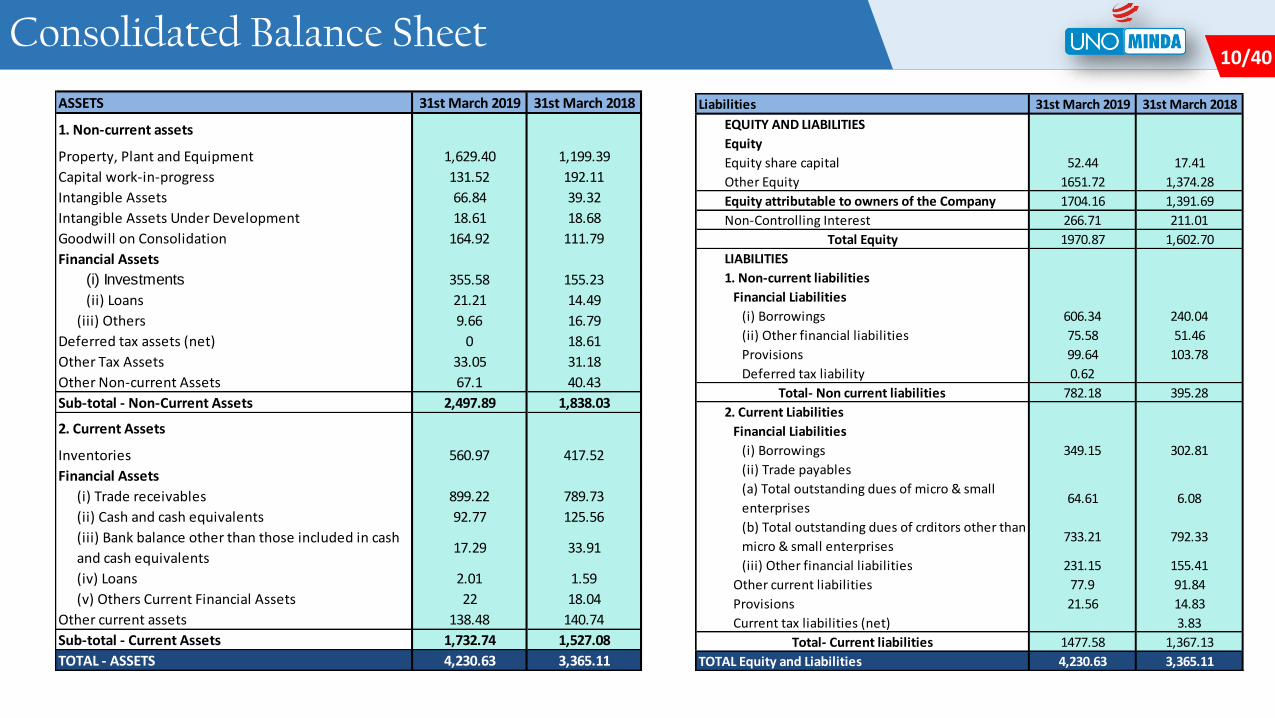
10/610 / 4610/40Consolidated Balance Sheet
ASSETS 31st March 2019 31st March 2018
1. Non-current assets
Property, Plant and Equipment 1,629.40 1,199.39
Capital work-in-progress 131.52 192.11
Intangible Assets 66.84 39.32
Intangible Assets Under Development 18.61 18.68
Goodwill on Consolidation 164.92 111.79
Financial Assets
(i) Investments 355.58 155.23
(ii) Loans 21.21 14.49
(iii) Others 9.66 16.79
Deferred tax assets (net) 0 18.61
Other Tax Assets 33.05 31.18
Other Non-current Assets 67.1 40.43
Sub-total - Non-Current Assets 2,497.89 1,838.03
2. Current Assets
Inventories 560.97 417.52
Financial Assets
(i) Trade receivables 899.22 789.73
(ii) Cash and cash equivalents 92.77 125.56
(iii) Bank balance other than those included in cash
and cash equivalents17.29 33.91
(iv) Loans 2.01 1.59
(v) Others Current Financial Assets 22 18.04
Other current assets 138.48 140.74
Sub-total - Current Assets 1,732.74 1,527.08
TOTAL - ASSETS 4,230.63 3,365.11
Liabilities 31st March 2019 31st March 2018
EQUITY AND LIABILITIES
Equity
Equity share capital 52.44 17.41
Other Equity 1651.72 1,374.28
Equity attributable to owners of the Company 1704.16 1,391.69
Non-Controlling Interest 266.71 211.01
Total Equity 1970.87 1,602.70
LIABILITIES
1. Non-current liabilities
Financial Liabilities
(i) Borrowings 606.34 240.04
(ii) Other financial liabilities 75.58 51.46
Provisions 99.64 103.78
Deferred tax liability 0.62
Total- Non current liabilities 782.18 395.28
2. Current Liabilities
Financial Liabilities
(i) Borrowings 349.15 302.81
(ii) Trade payables
(a) Total outstanding dues of micro & small
enterprises64.61 6.08
(b) Total outstanding dues of crditors other than
micro & small enterprises733.21 792.33
(iii) Other financial liabilities 231.15 155.41
Other current liabilities 77.9 91.84
Provisions 21.56 14.83
Current tax liabilities (net) 3.83
Total- Current liabilities 1477.58 1,367.13
TOTAL Equity and Liabilities 4,230.63 3,365.11
11/611 / 4611/40
About Us
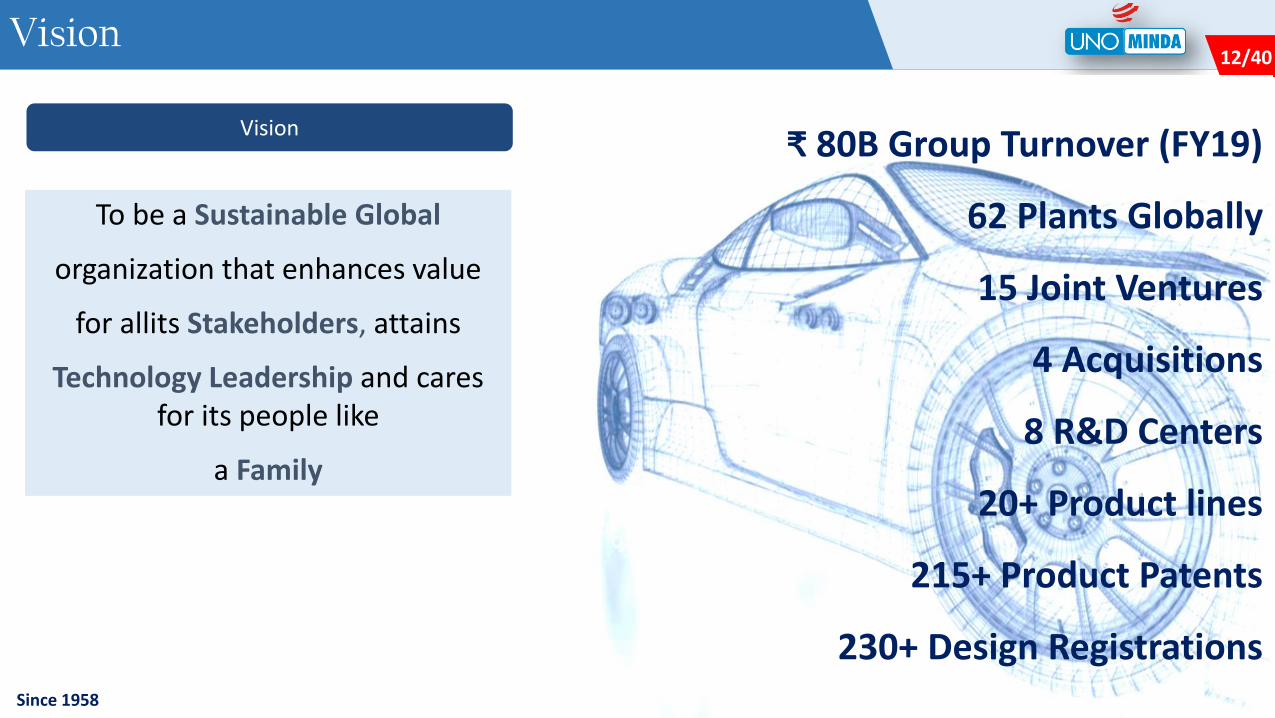
12/612 / 4612/40Vision
Vision
To be a Sustainable Global
organization that enhances value
for allits Stakeholders, attains
Technology Leadership and cares for its people like
a Family
₹ 80B Group Turnover (FY19)
62 Plants Globally
15 Joint Ventures
4 Acquisitions
8 R&D Centers
20+ Product lines
215+ Product Patents
230+ Design RegistrationsSince 1958
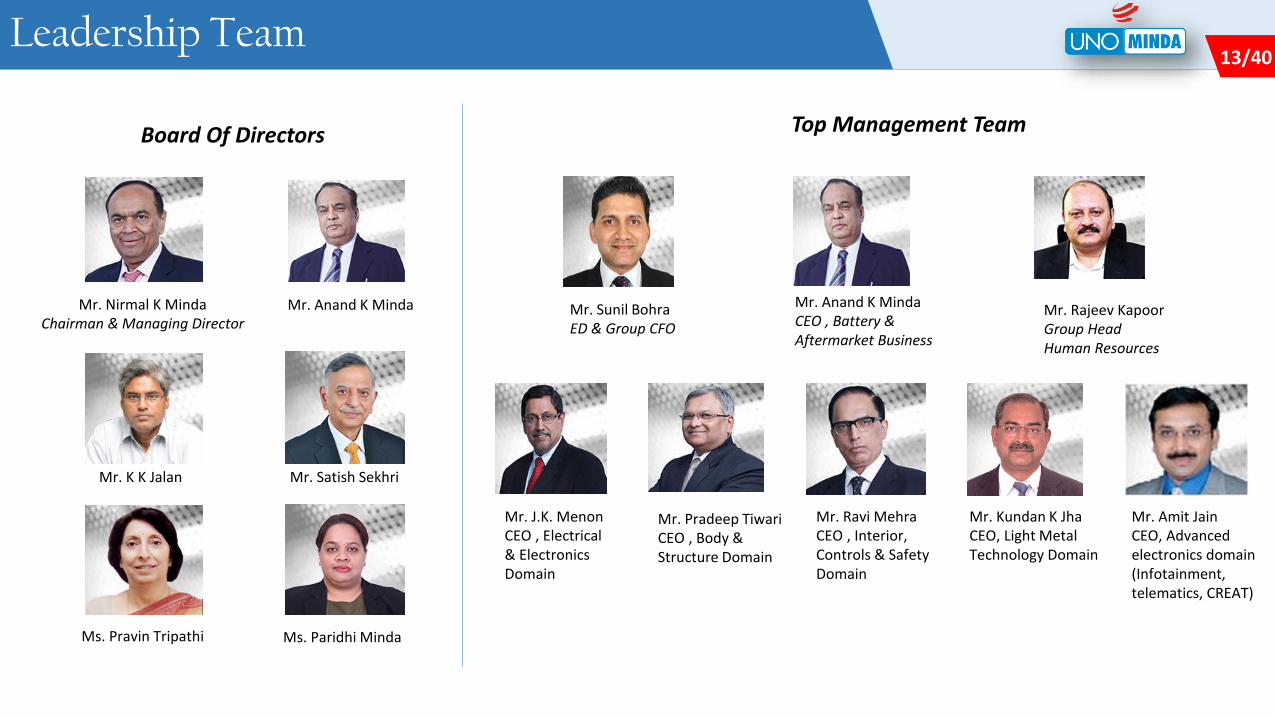
13/613 / 4613/40
Mr. Nirmal K MindaChairman & Managing Director
Mr. Anand K Minda
Mr. Satish SekhriMr. K K Jalan
Ms. Pravin Tripathi
Mr. Sunil BohraED & Group CFO
Mr. Anand K MindaCEO , Battery & Aftermarket Business
Mr. J.K. MenonCEO , Electrical& Electronics Domain
Mr. Ravi MehraCEO , Interior,Controls & Safety Domain
Mr. Pradeep TiwariCEO , Body & Structure Domain
Mr. Kundan K JhaCEO, Light Metal Technology Domain
Mr. Rajeev KapoorGroup HeadHuman Resources
Board Of Directors Top Management Team
Leadership Team
Mr. Amit JainCEO, Advanced electronics domain (Infotainment, telematics, CREAT)
Ms. Paridhi Minda
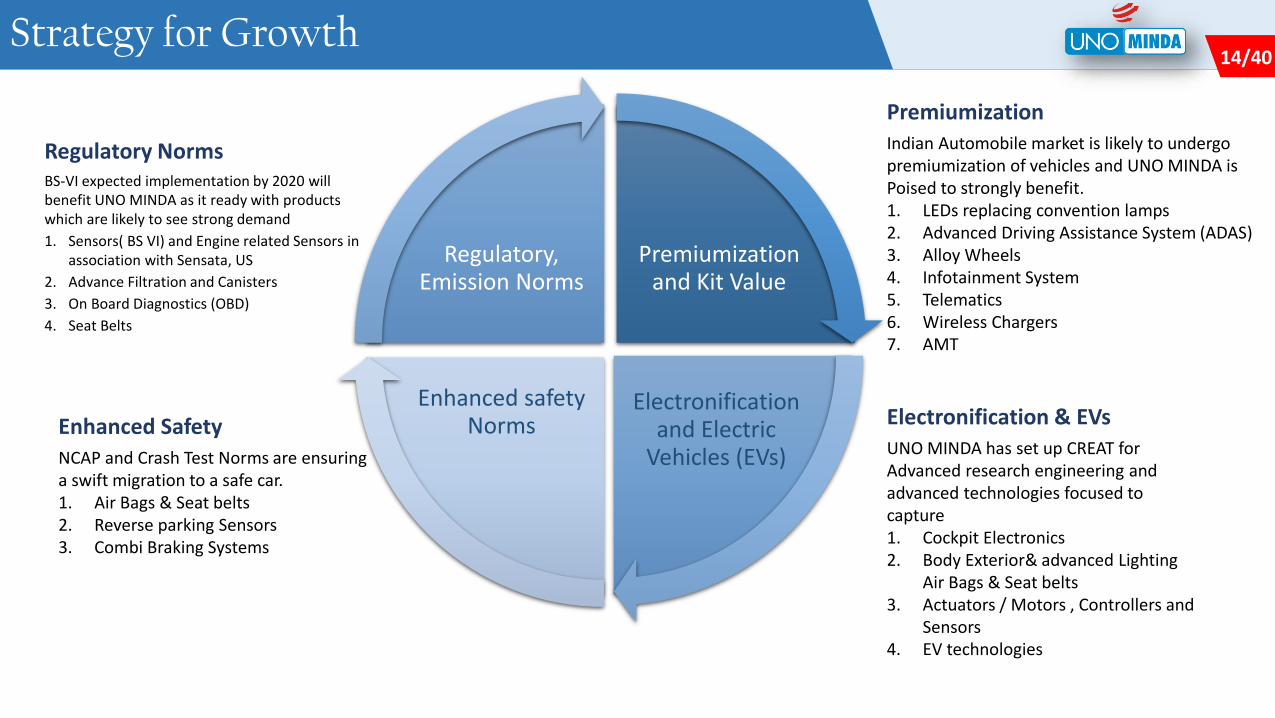
14/614 / 4614/40Strategy for Growth
Regulatory NormsBS-VI expected implementation by 2020 will benefit UNO MINDA as it ready with products which are likely to see strong demand
1. Sensors( BS VI) and Engine related Sensors in association with Sensata, US
2. Advance Filtration and Canisters
3. On Board Diagnostics (OBD)
4. Seat Belts
PremiumizationIndian Automobile market is likely to undergo premiumization of vehicles and UNO MINDA is Poised to strongly benefit.1. LEDs replacing convention lamps2. Advanced Driving Assistance System (ADAS)3. Alloy Wheels4. Infotainment System5. Telematics6. Wireless Chargers7. AMT
Premiumization and Kit Value
Electronification and Electric
Vehicles (EVs)
Enhanced safety Norms
Regulatory, Emission Norms
Enhanced SafetyNCAP and Crash Test Norms are ensuring a swift migration to a safe car.1. Air Bags & Seat belts2. Reverse parking Sensors3. Combi Braking Systems
Electronification & EVsUNO MINDA has set up CREAT for Advanced research engineering and advanced technologies focused to capture 1. Cockpit Electronics2. Body Exterior& advanced Lighting
Air Bags & Seat belts3. Actuators / Motors , Controllers and
Sensors4. EV technologies
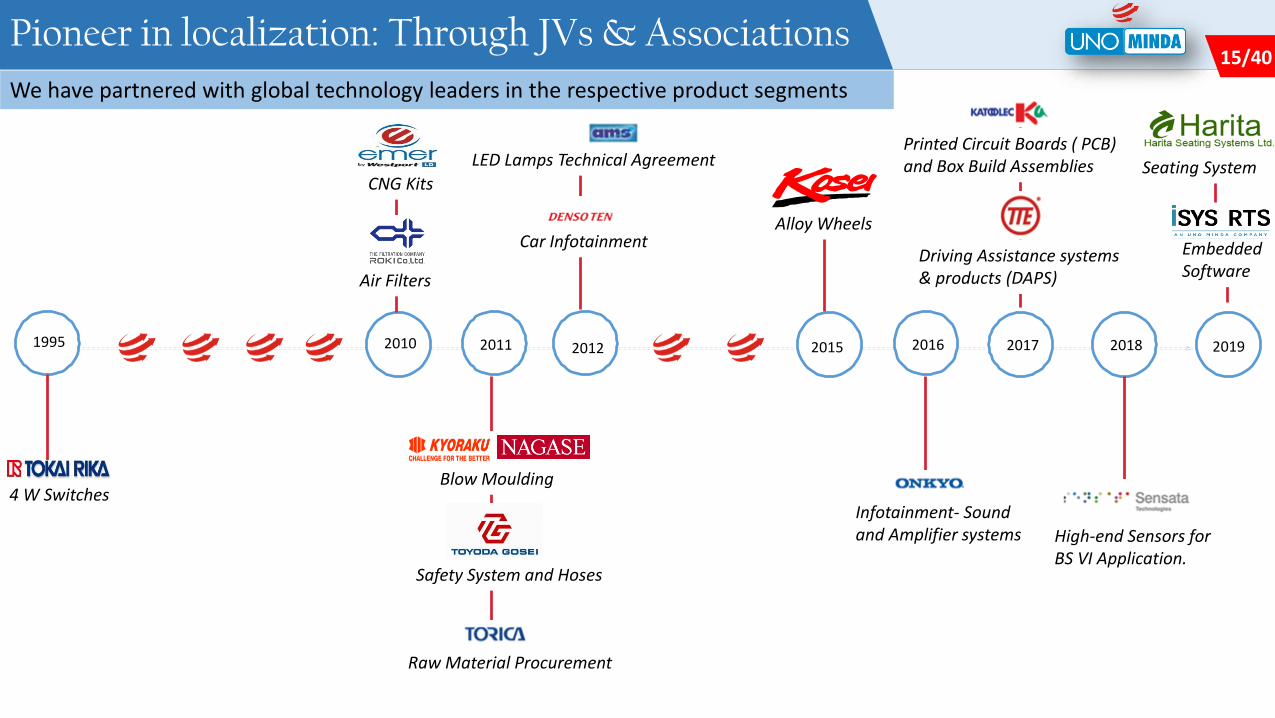
15/615 / 4615/40Pioneer in localization: Through JVs & Associations
We have partnered with global technology leaders in the respective product segments
1995 2010 2011 2012 2015 2016 2017 2018 2019
4 W Switches
CNG Kits
Air Filters
Blow Moulding
Safety System and Hoses
Raw Material Procurement
Car Infotainment
LED Lamps Technical Agreement
Alloy Wheels
Infotainment- Sound and Amplifier systems
Printed Circuit Boards ( PCB) and Box Build Assemblies
Driving Assistance systems & products (DAPS)
High-end Sensors for BS VI Application.
Embedded Software
Seating System
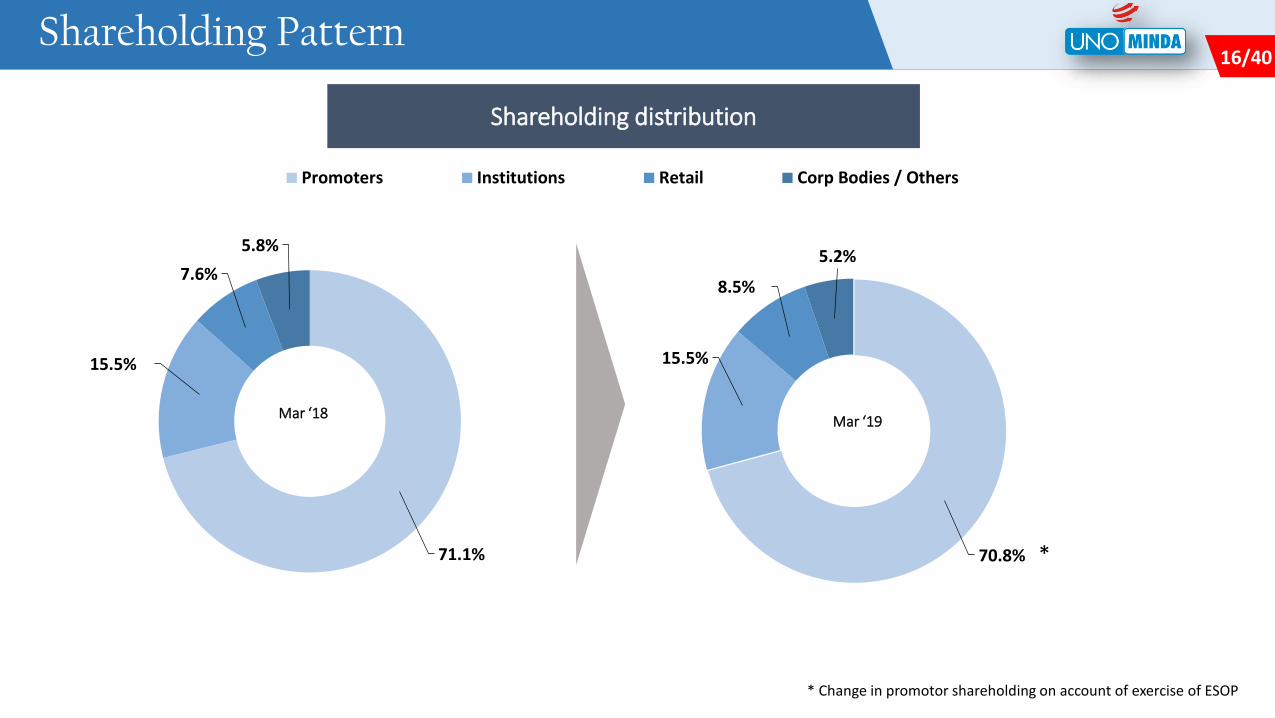
16/616 / 4616/40
70.8%
15.5%
8.5%
5.2%
Promoters Institutions Retail Corp Bodies / Others
71.1%
15.5%
7.6%
5.8%
Shareholding distribution
Mar ‘18Mar ‘19
Shareholding Pattern
* Change in promotor shareholding on account of exercise of ESOP
*
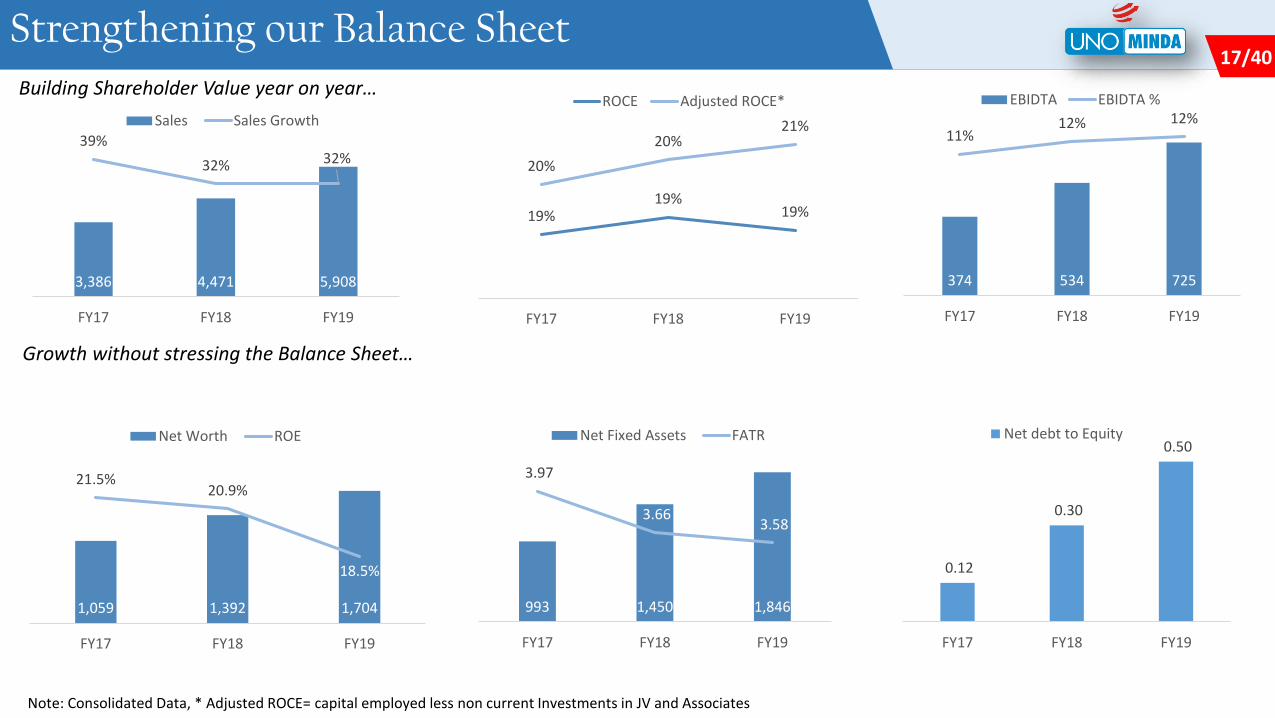
17/617 / 4617/40Strengthening our Balance SheetBuilding Shareholder Value year on year…
Growth without stressing the Balance Sheet…
Note: Consolidated Data, * Adjusted ROCE= capital employed less non current Investments in JV and Associates
374 534 725
11%12% 12%
FY17 FY18 FY19
EBIDTA EBIDTA %
3,386 4,471 5,908
39%
32% 32%
FY17 FY18 FY19
Sales Sales Growth
0.12
0.30
0.50
FY17 FY18 FY19
Net debt to Equity
993 1,450 1,846
3.97
3.66 3.58
FY17 FY18 FY19
Net Fixed Assets FATR
1,059 1,392 1,704
21.5%20.9%
18.5%
FY17 FY18 FY19
Net Worth ROE
19%19%
19%
20%
20%21%
FY17 FY18 FY19
ROCE Adjusted ROCE*
18/618 / 4618/40
Business Overview
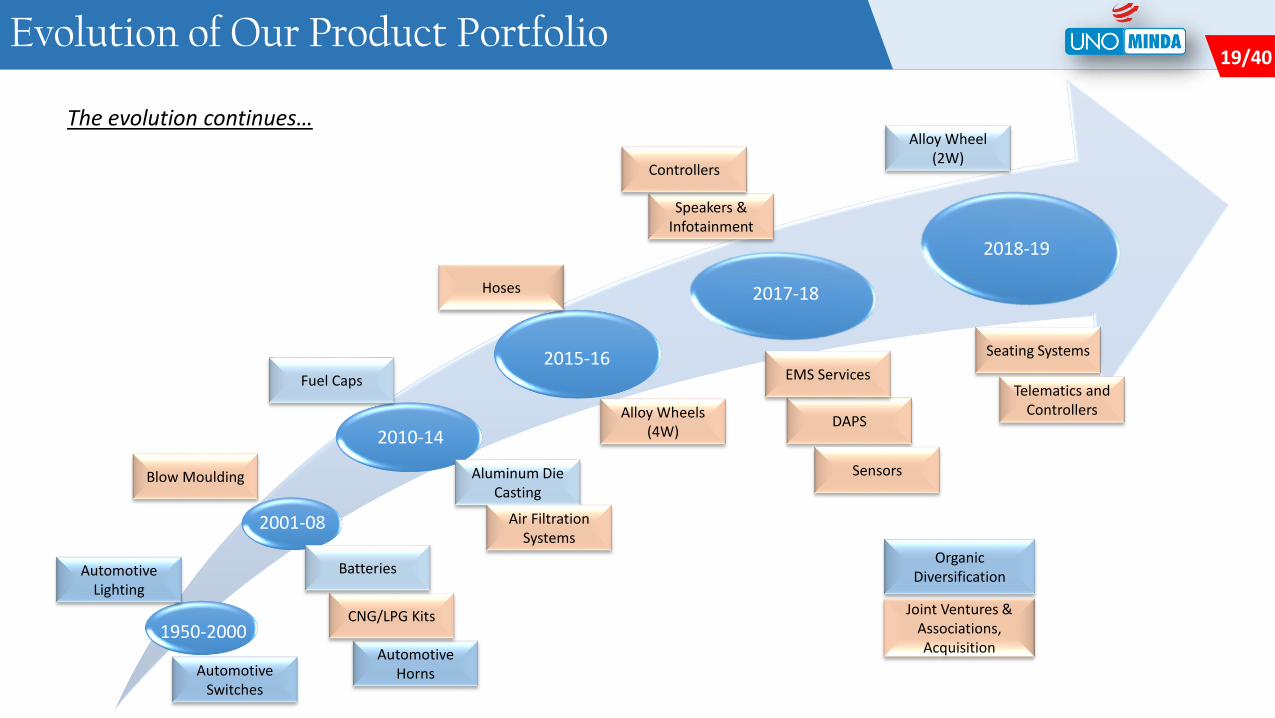
19/619 / 4619/40Evolution of Our Product Portfolio
-
-
1950-2000Automotive
Horns
CNG/LPG Kits
Batteries
Blow Moulding
Hoses
Automotive Switches
Automotive Lighting
2001-08
2010-14
Aluminum Die Casting
Fuel Caps
Air Filtration Systems
2015-16
2017-18
Alloy Wheels (4W)
Speakers & Infotainment
DAPS
The evolution continues…
EMS Services
Joint Ventures & Associations, Acquisition
Organic Diversification
Controllers
Sensors
Seating Systems
Telematics and Controllers
Alloy Wheel (2W)
2018-19
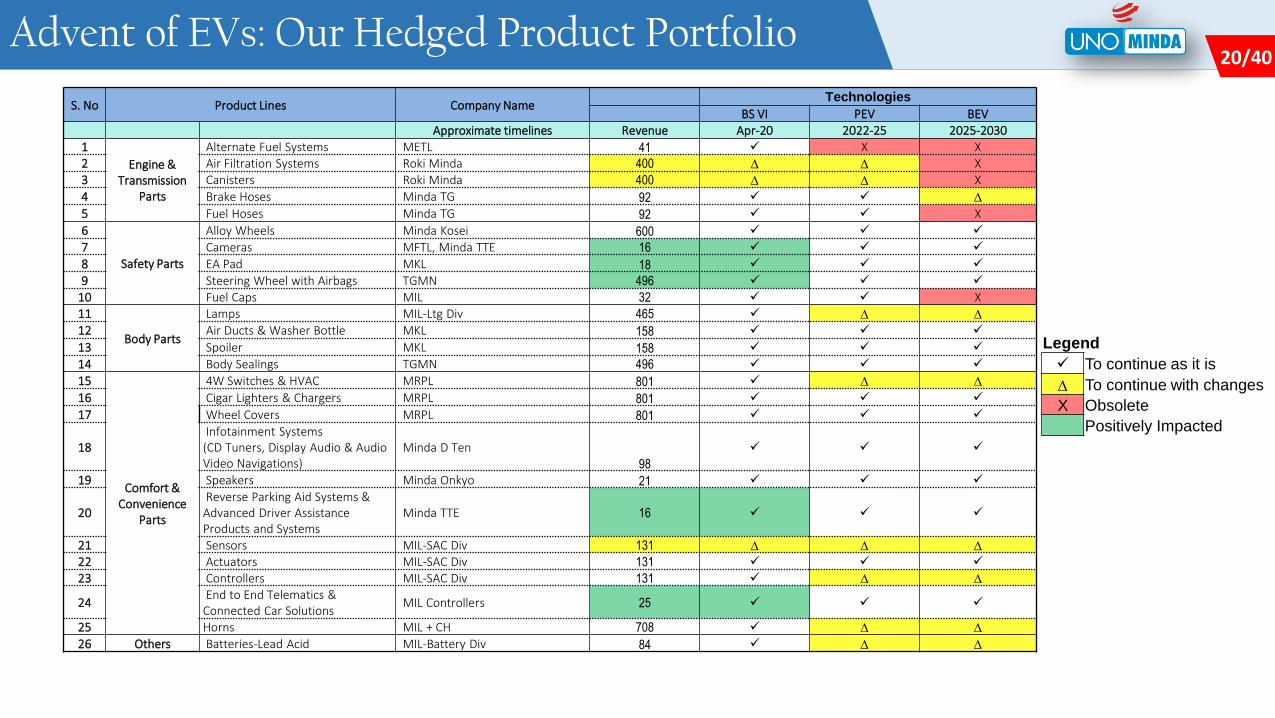
20/620 / 4620/40Advent of EVs: Our Hedged Product Portfolio
S. No Product Lines Company NameTechnologies
BS VI PEV BEVApproximate timelines Revenue Apr-20 2022-25 2025-2030
1
Engine & Transmission
Parts
Alternate Fuel Systems METL 41 X X2 Air Filtration Systems Roki Minda 400 D D X3 Canisters Roki Minda 400 D D X
4 Brake Hoses Minda TG 92 D
5 Fuel Hoses Minda TG 92 X
6
Safety Parts
Alloy Wheels Minda Kosei 600
7 Cameras MFTL, Minda TTE 16
8 EA Pad MKL 18
9 Steering Wheel with Airbags TGMN 496
10 Fuel Caps MIL 32 X11
Body Parts
Lamps MIL-Ltg Div 465 D D
12 Air Ducts & Washer Bottle MKL 158
13 Spoiler MKL 158
14 Body Sealings TGMN 496
15
Comfort & Convenience
Parts
4W Switches & HVAC MRPL 801 D D
16 Cigar Lighters & Chargers MRPL 801
17 Wheel Covers MRPL 801
18Infotainment Systems
(CD Tuners, Display Audio & Audio Video Navigations)
Minda D Ten
98
19 Speakers Minda Onkyo 21
20Reverse Parking Aid Systems &
Advanced Driver Assistance Products and Systems
Minda TTE 16
21 Sensors MIL-SAC Div 131 D D D
22 Actuators MIL-SAC Div 131
23 Controllers MIL-SAC Div 131 D D
24End to End Telematics &
Connected Car Solutions MIL Controllers 25
25 Horns MIL + CH 708 D D
26 Others Batteries-Lead Acid MIL-Battery Div 84 D D
Legend
To continue as it is
D To continue with changes
X Obsolete
Positively Impacted
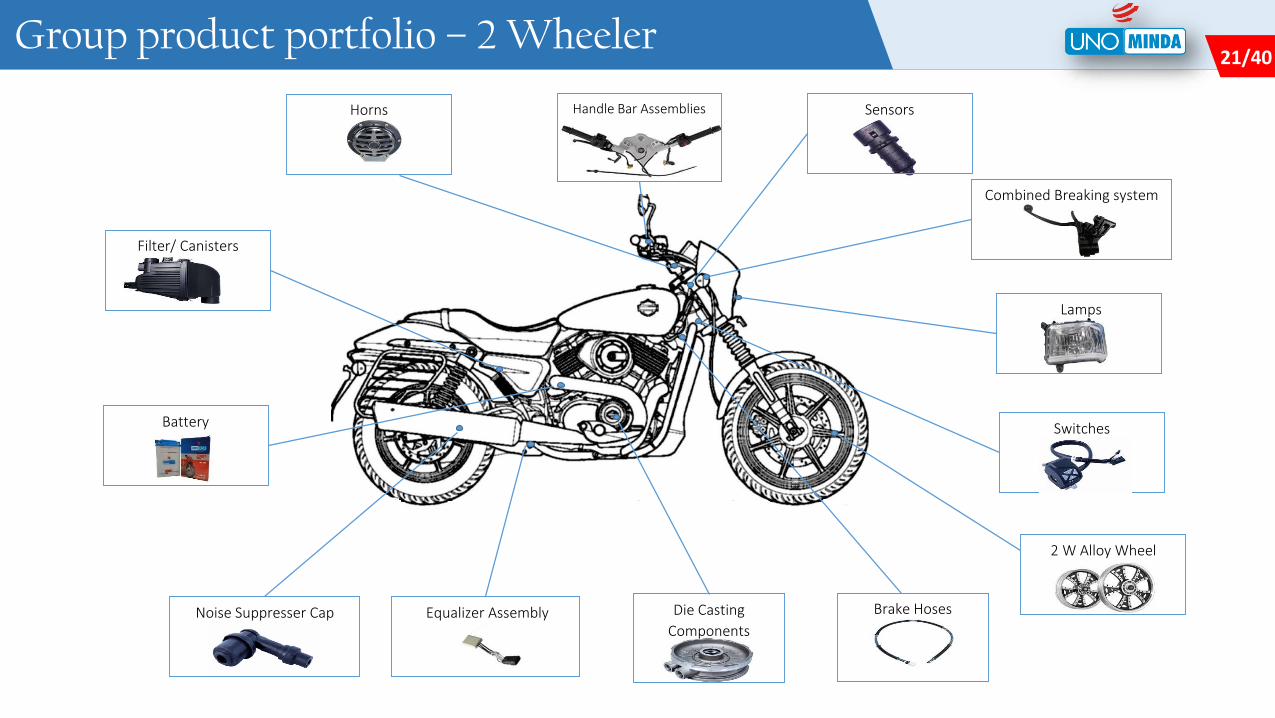
21/621 / 4621/40Group product portfolio – 2 Wheeler
Handle Bar Assemblies
Die Casting
Components
Switches
Equalizer AssemblyNoise Suppresser Cap
Sensors
Lamps
Battery
Filter/ Canisters
Horns
Brake Hoses
Combined Breaking system
2 W Alloy Wheel
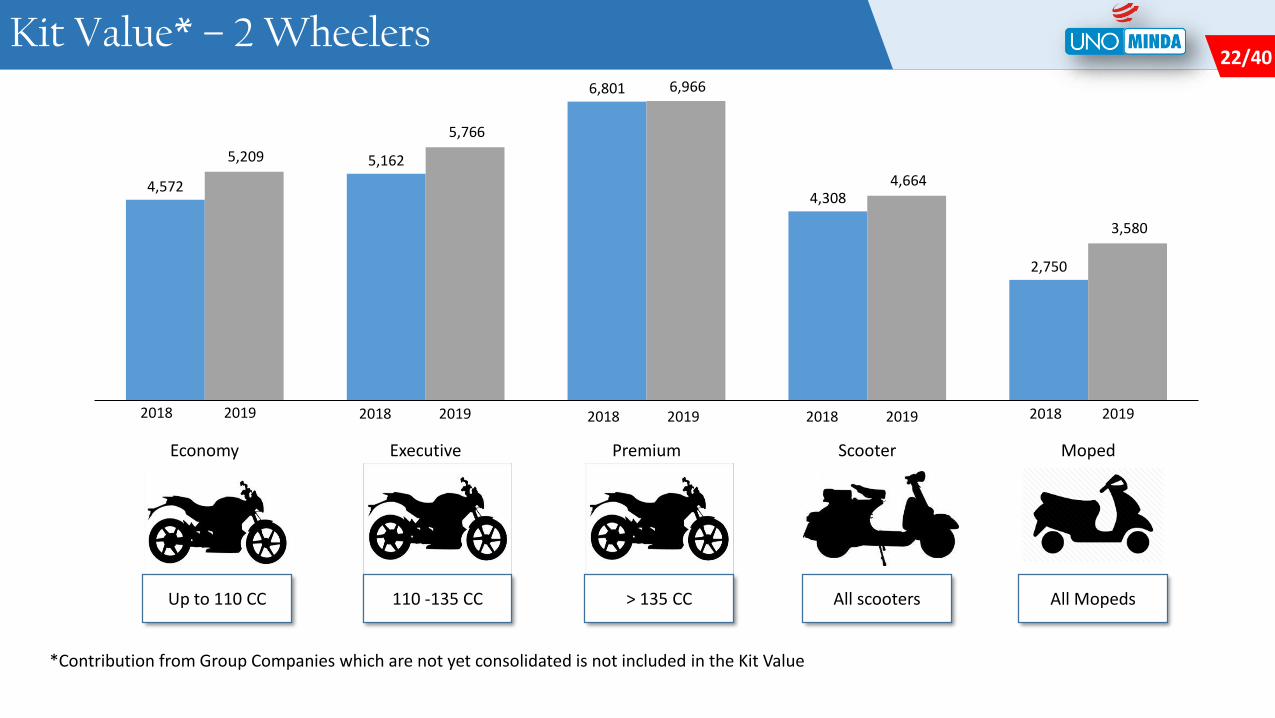
22/622 / 4622/40Kit Value* – 2 Wheelers
Up to 110 CC
4,572
5,162
6,801
4,308
2,750
5,209
5,766
6,966
4,664
3,580
Scooter MopedEconomy Executive Premium
110 -135 CC > 135 CC All scooters All Mopeds
*Contribution from Group Companies which are not yet consolidated is not included in the Kit Value
2018 2019 2018 2019 2018 2019 2018 2019 2018 2019
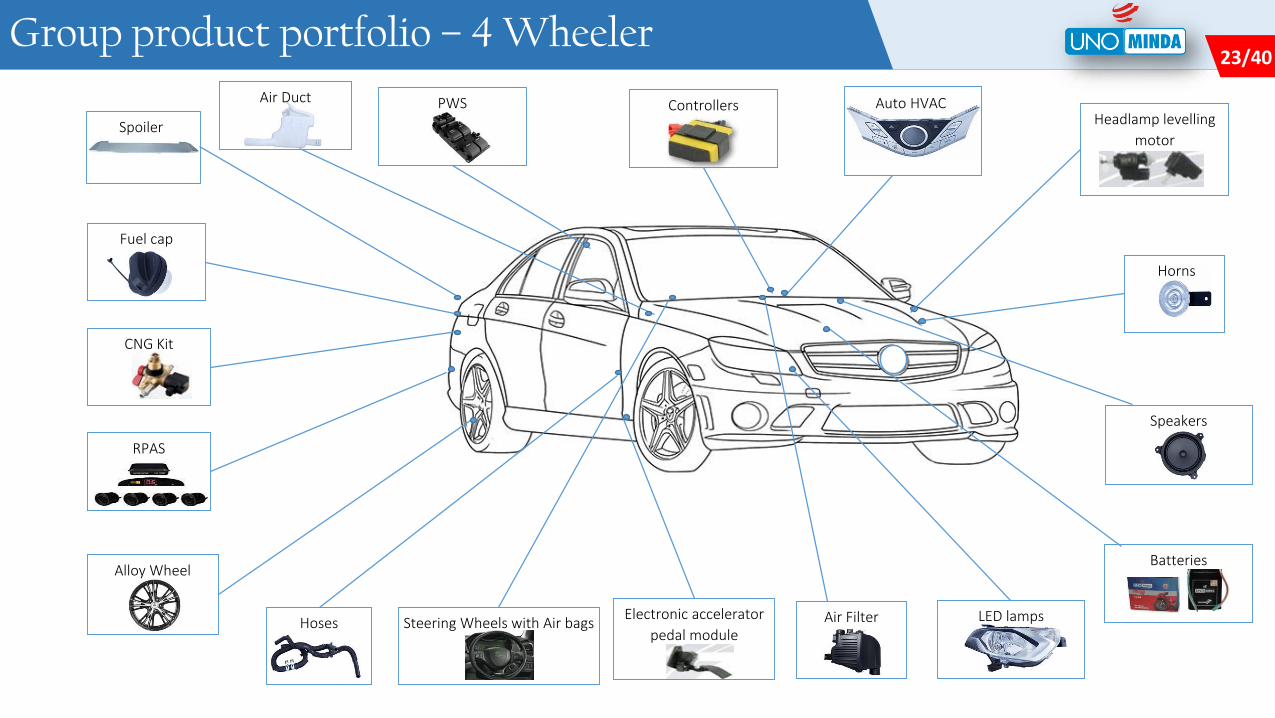
23/623 / 4623/40Group product portfolio – 4 Wheeler
Batteries
PWS Auto HVAC
Horns
RPAS
Headlamp levelling
motor
Electronic accelerator
pedal module
Spoiler
CNG Kit
LED lamps
Fuel cap
Hoses
Alloy Wheel
Speakers
Air FilterSteering Wheels with Air bags
ControllersAir Duct
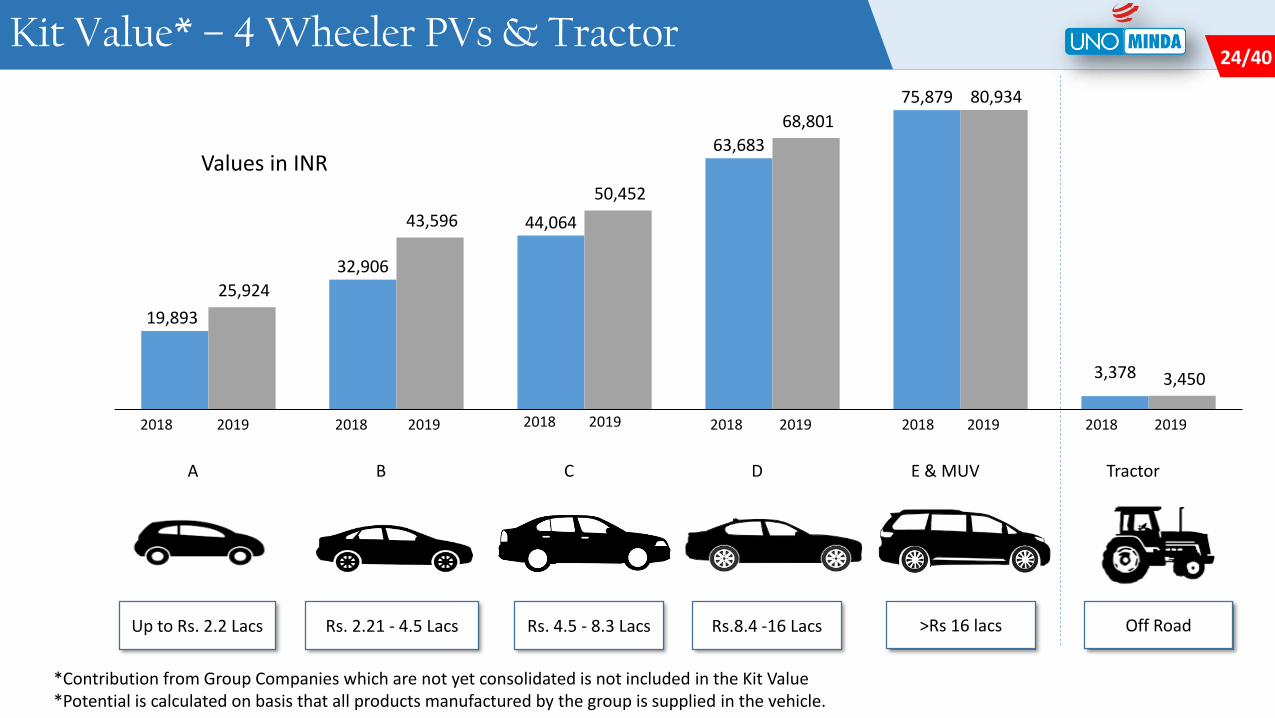
24/624 / 4624/40Kit Value* – 4 Wheeler PVs & Tractor
Up to Rs. 2.2 Lacs
19,893
32,906
44,064
63,683
75,879
3,378
25,924
43,596
50,452
68,801
80,934
3,450
TractorBA DC E & MUV
Rs. 2.21 - 4.5 Lacs Rs. 4.5 - 8.3 Lacs Rs.8.4 -16 Lacs >Rs 16 lacs Off Road
*Contribution from Group Companies which are not yet consolidated is not included in the Kit Value*Potential is calculated on basis that all products manufactured by the group is supplied in the vehicle.
Values in INR
2018 2019 2018 2019 2018 2019 2018 2019 2018 2019 2018 2019
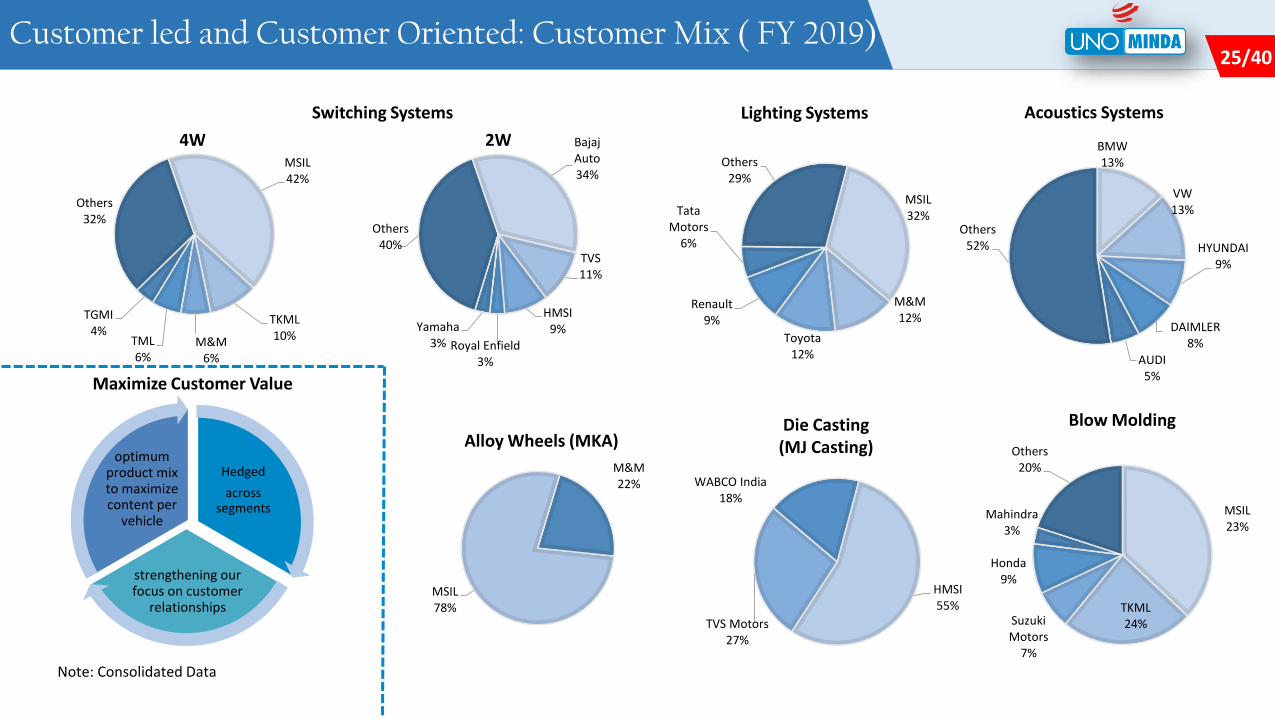
25/625 / 4625/40Customer led and Customer Oriented: Customer Mix ( FY 2019)
Maximize Customer Value
Note: Consolidated Data
Bajaj Auto34%
TVS11%
HMSI9%
Royal Enfield3%
Yamaha3%
Others40%
Switching Systems
MSIL32%
M&M12%
Toyota 12%
Renault 9%
Tata Motors
6%
Others29%
Lighting Systems
BMW13%
VW13%
HYUNDAI9%
DAIMLER8%
AUDI5%
Others52%
Acoustics Systems
MSIL78%
M&M22%
HMSI55%
TVS Motors27%
WABCO India18%
MSIL 23%
TKML24%Suzuki
Motors7%
Honda 9%
Mahindra3%
Others20%
Blow MoldingAlloy Wheels (MKA)
Die Casting (MJ Casting)
Hedged
across segments
strengthening our focus on customer
relationships
optimum product mix to maximize content per
vehicle
MSIL42%
TKML10%M&M
6%
TML6%
TGMI4%
Others32%
4W 2W
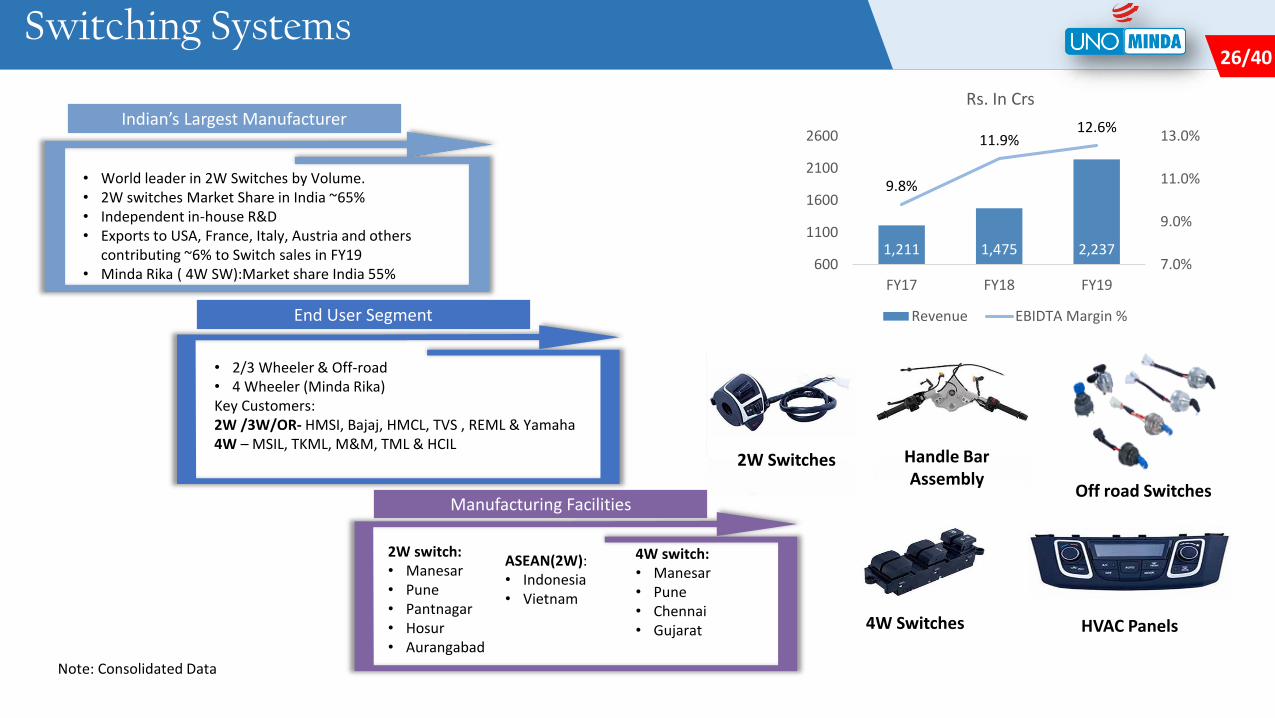
26/626 / 4626/40Switching Systems
1,211 1,475 2,237
9.8%
11.9%12.6%
7.0%
9.0%
11.0%
13.0%
600
1100
1600
2100
2600
FY17 FY18 FY19
Rs. In Crs
Revenue EBIDTA Margin %
• World leader in 2W Switches by Volume. • 2W switches Market Share in India ~65% • Independent in-house R&D• Exports to USA, France, Italy, Austria and others
contributing ~6% to Switch sales in FY19• Minda Rika ( 4W SW):Market share India 55%
• 2/3 Wheeler & Off-road• 4 Wheeler (Minda Rika)Key Customers: 2W /3W/OR- HMSI, Bajaj, HMCL, TVS , REML & Yamaha4W – MSIL, TKML, M&M, TML & HCIL
End User Segment
Indian’s Largest Manufacturer
2W switch:• Manesar• Pune• Pantnagar• Hosur• Aurangabad
Manufacturing Facilities
Note: Consolidated Data
ASEAN(2W):• Indonesia• Vietnam
Off road Switches
2W Switches Handle Bar Assembly
4W Switches HVAC Panels
4W switch:• Manesar• Pune• Chennai• Gujarat
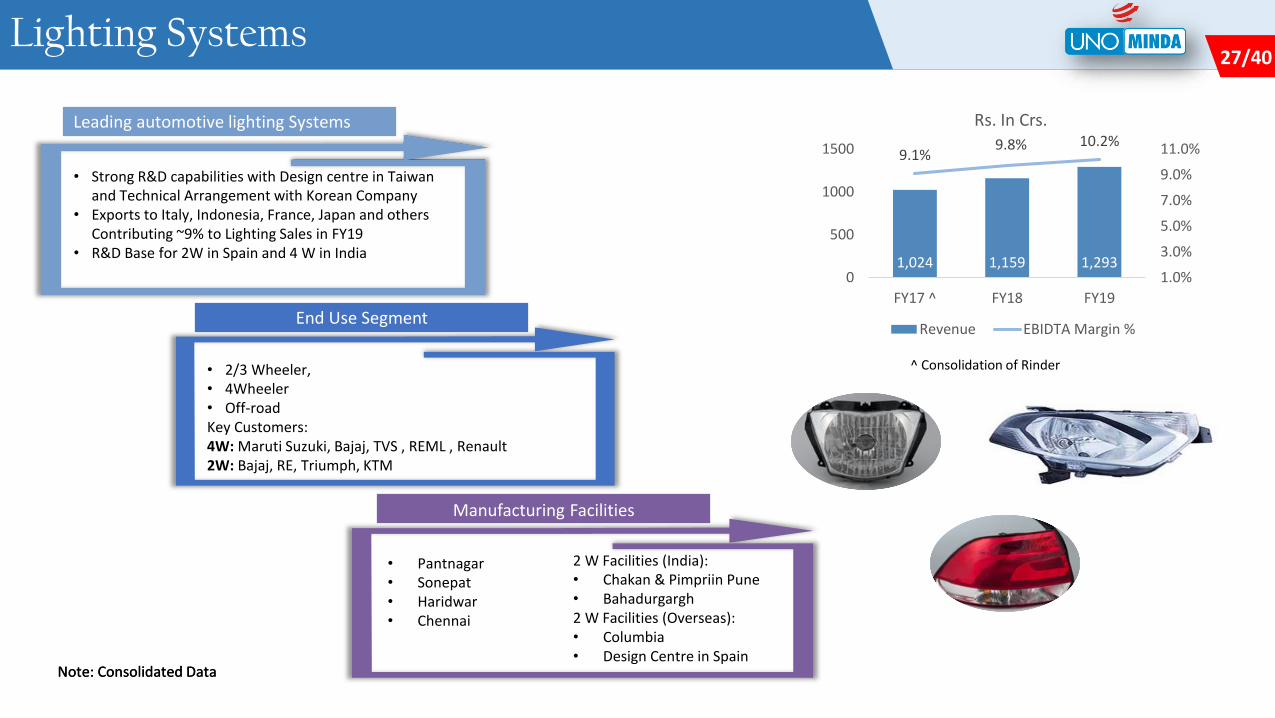
27/627 / 4627/40Lighting Systems
1,024 1,159 1,293
9.1%9.8% 10.2%
1.0%
3.0%
5.0%
7.0%
9.0%
11.0%
0
500
1000
1500
FY17 ^ FY18 FY19
Rs. In Crs.
Revenue EBIDTA Margin %
Note: Consolidated Data
• Strong R&D capabilities with Design centre in Taiwan and Technical Arrangement with Korean Company
• Exports to Italy, Indonesia, France, Japan and others Contributing ~9% to Lighting Sales in FY19
• R&D Base for 2W in Spain and 4 W in India
End Use Segment
Leading automotive lighting Systems
Manufacturing Facilities
Note: Consolidated Data
• Pantnagar• Sonepat• Haridwar• Chennai
• 2/3 Wheeler, • 4Wheeler • Off-roadKey Customers:4W: Maruti Suzuki, Bajaj, TVS , REML , Renault2W: Bajaj, RE, Triumph, KTM
2 W Facilities (India):• Chakan & Pimpriin Pune• Bahadurgargh2 W Facilities (Overseas):• Columbia• Design Centre in Spain
^ Consolidation of Rinder
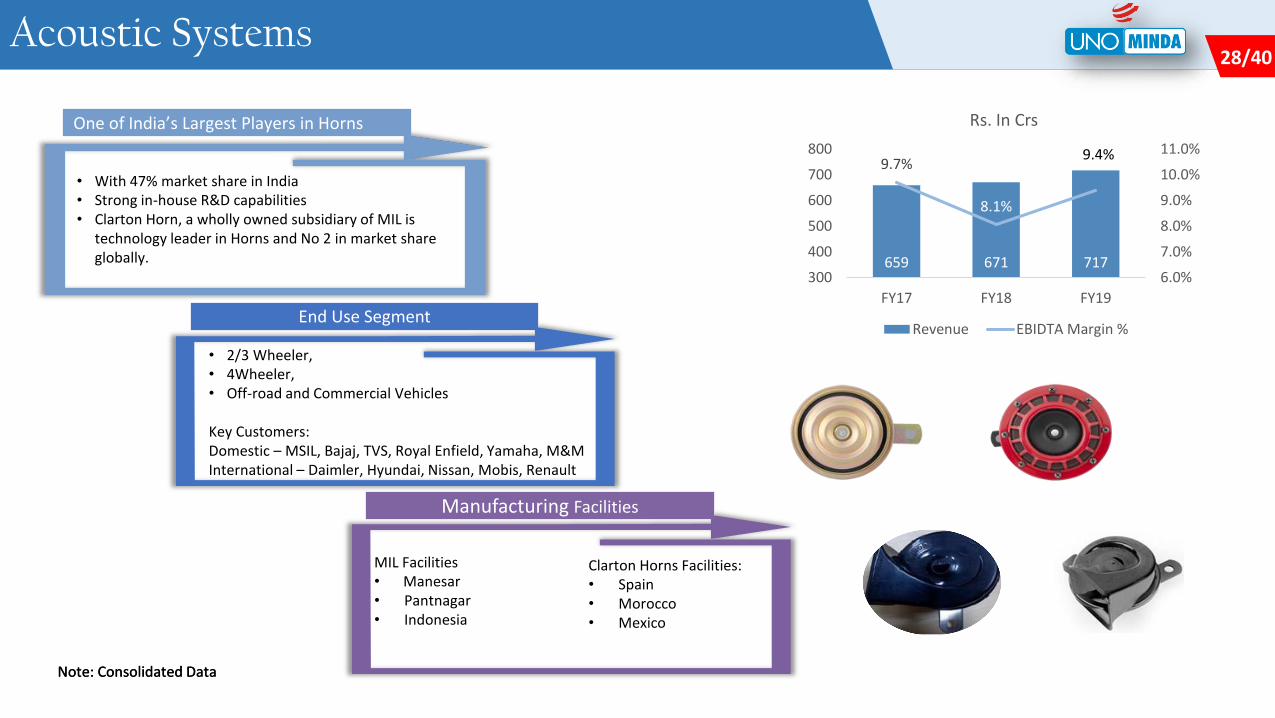
28/628 / 4628/40Acoustic Systems
659 671 717
9.7%
8.1%
9.4%
6.0%
7.0%
8.0%
9.0%
10.0%
11.0%
300
400
500
600
700
800
FY17 FY18 FY19
Rs. In Crs
Revenue EBIDTA Margin %
Note: Consolidated Data
End Use Segment
One of India’s Largest Players in Horns
Manufacturing Facilities
Note: Consolidated Data
• With 47% market share in India• Strong in-house R&D capabilities • Clarton Horn, a wholly owned subsidiary of MIL is
technology leader in Horns and No 2 in market share globally.
• 2/3 Wheeler, • 4Wheeler,• Off-road and Commercial Vehicles
Key Customers:Domestic – MSIL, Bajaj, TVS, Royal Enfield, Yamaha, M&MInternational – Daimler, Hyundai, Nissan, Mobis, Renault
MIL Facilities• Manesar• Pantnagar• Indonesia
Clarton Horns Facilities:• Spain • Morocco• Mexico
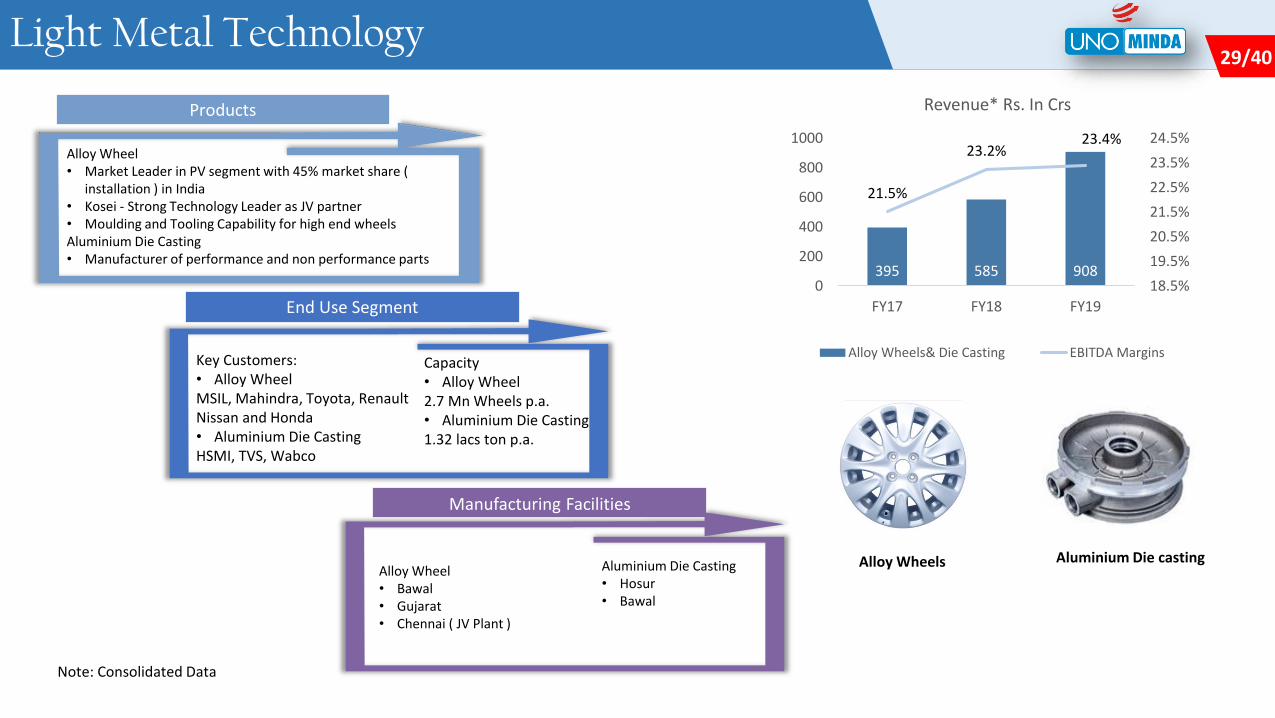
29/629 / 4629/40Light Metal Technology
Note: Consolidated Data
End Use Segment
Products
Manufacturing Facilities
Alloy Wheel• Bawal• Gujarat• Chennai ( JV Plant )
Key Customers:• Alloy WheelMSIL, Mahindra, Toyota, Renault Nissan and Honda• Aluminium Die CastingHSMI, TVS, Wabco
Alloy Wheels
395 585 908
21.5%
23.2%23.4%
18.5%
19.5%
20.5%
21.5%
22.5%
23.5%
24.5%
0
200
400
600
800
1000
FY17 FY18 FY19
Alloy Wheels& Die Casting EBITDA Margins
Revenue* Rs. In Crs
Aluminium Die Casting• Hosur• Bawal
Alloy Wheel• Market Leader in PV segment with 45% market share (
installation ) in India• Kosei - Strong Technology Leader as JV partner • Moulding and Tooling Capability for high end wheelsAluminium Die Casting• Manufacturer of performance and non performance parts
Capacity• Alloy Wheel2.7 Mn Wheels p.a.• Aluminium Die Casting1.32 lacs ton p.a.
Aluminium Die casting
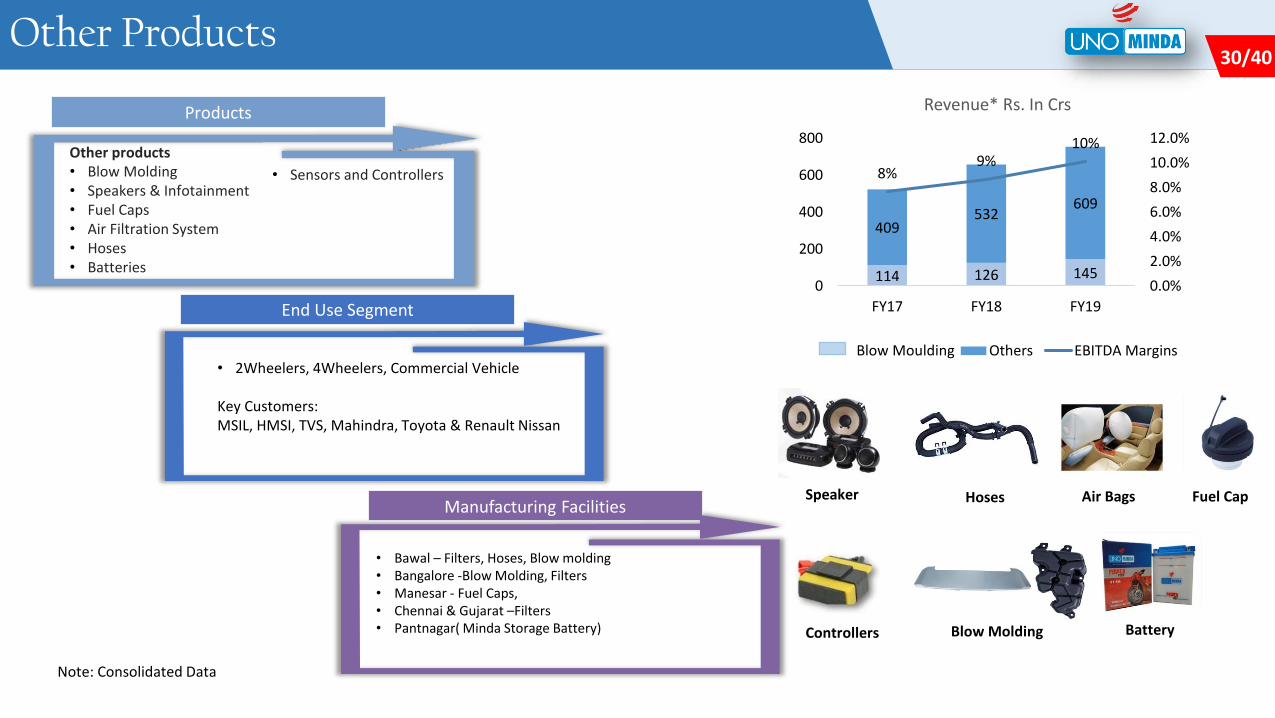
30/630 / 4630/40Other Products
Note: Consolidated Data
End Use Segment
Products
Manufacturing FacilitiesSpeaker Fuel CapHoses
Battery
• Bawal – Filters, Hoses, Blow molding• Bangalore -Blow Molding, Filters• Manesar - Fuel Caps, • Chennai & Gujarat –Filters• Pantnagar( Minda Storage Battery)
• 2Wheelers, 4Wheelers, Commercial Vehicle
Key Customers:MSIL, HMSI, TVS, Mahindra, Toyota & Renault Nissan
Other products• Blow Molding• Speakers & Infotainment• Fuel Caps• Air Filtration System• Hoses• Batteries
114 126 145
409532
609
8%9%
10%
0.0%
2.0%
4.0%
6.0%
8.0%
10.0%
12.0%
0
200
400
600
800
FY17 FY18 FY19
Others EBITDA MarginsBlow Moulding
Revenue* Rs. In Crs
Air Bags
Blow Molding
• Sensors and Controllers
Controllers
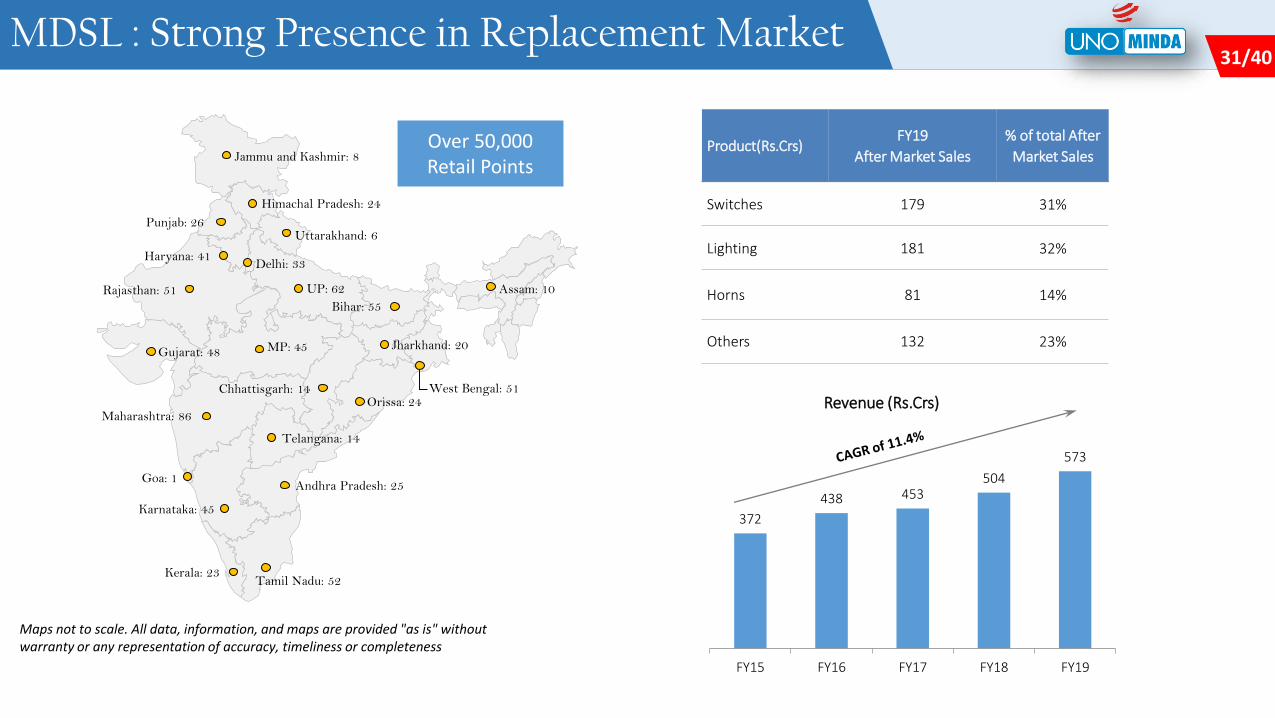
31/631 / 4631/40MDSL : Strong Presence in Replacement Market
372
438 453504
573
FY15 FY16 FY17 FY18 FY19
Revenue (Rs.Crs)
Product(Rs.Crs)FY19
After Market Sales
% of total After
Market Sales
Switches 179 31%
Lighting 181 32%
Horns 81 14%
Others 132 23%
Maps not to scale. All data, information, and maps are provided "as is" without warranty or any representation of accuracy, timeliness or completeness
Andhra Pradesh: 25
Gujarat: 48
Maharashtra: 86
Delhi: 33
Kerala: 23
MP: 45
Orissa: 24
Rajasthan: 51
Tamil Nadu: 52
West Bengal: 51
Bihar: 55
Chhattisgarh: 14
Goa: 1
Haryana: 41
Himachal Pradesh: 24
Jammu and Kashmir: 8
Jharkhand: 20
Karnataka: 45
UP: 62
Uttarakhand: 6Punjab: 26
Telangana: 14
Assam: 10
Over 50,000 Retail Points
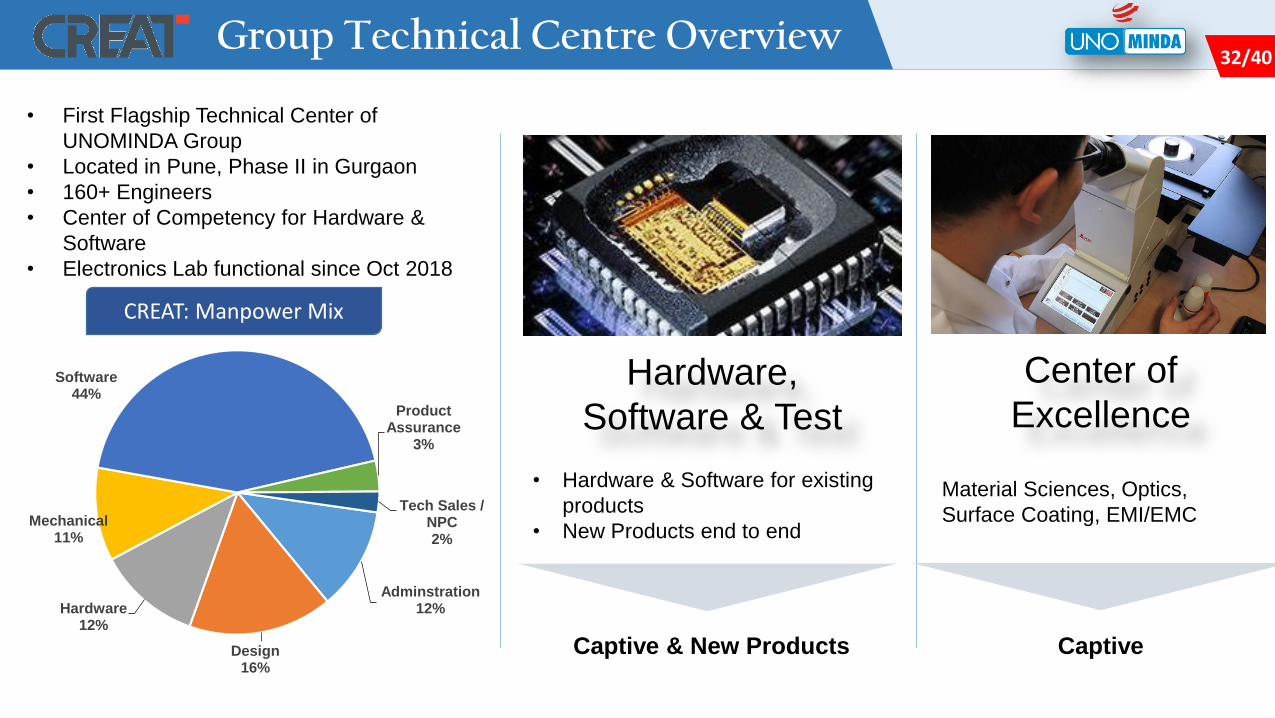
32/632 / 4632/40Group Technical Centre Overview
Adminstration12%
Design16%
Hardware 12%
Mechanical11%
Software44%
Product Assurance
3%
Tech Sales / NPC2%
Hardware,
Software & Test
Center of
Excellence
Captive & New Products Captive
• Hardware & Software for existing
products
• New Products end to end
Material Sciences, Optics,
Surface Coating, EMI/EMC
• First Flagship Technical Center of
UNOMINDA Group
• Located in Pune, Phase II in Gurgaon
• 160+ Engineers
• Center of Competency for Hardware &
Software
• Electronics Lab functional since Oct 2018
CREAT: Manpower Mix
33/633 / 4633/40
Historical Financials
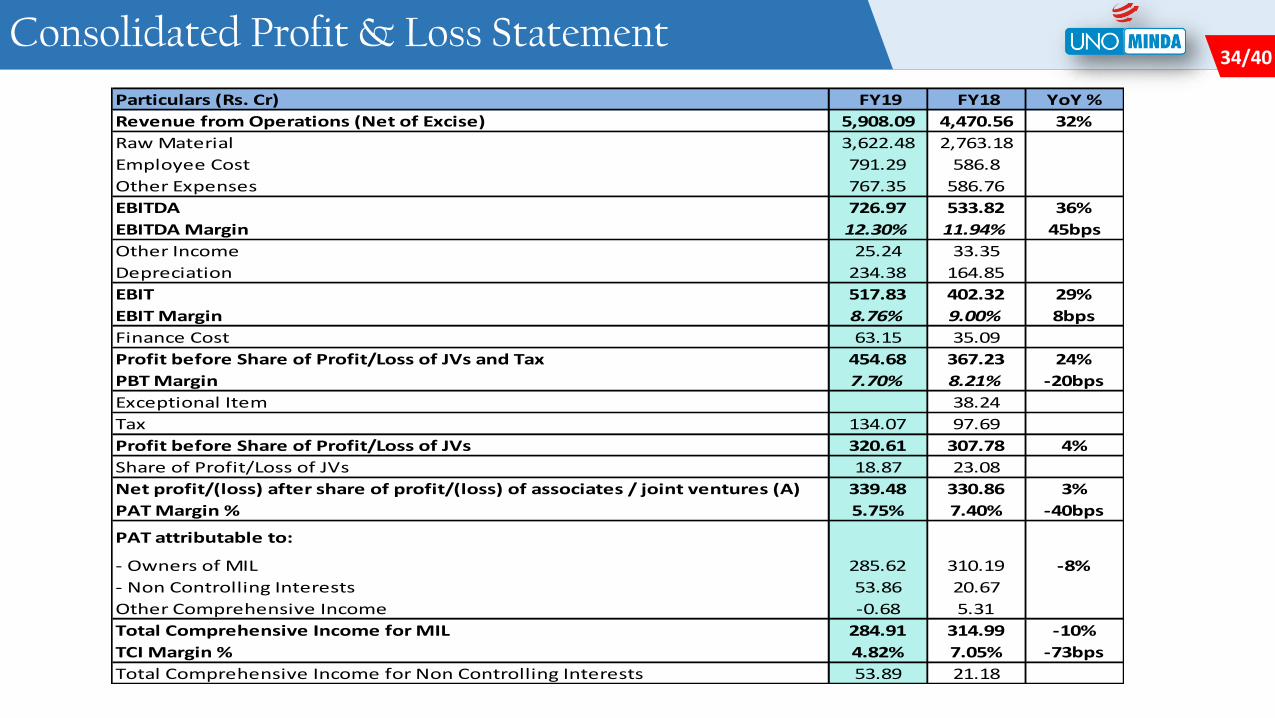
34/634 / 4634/40Consolidated Profit & Loss Statement
Particulars (Rs. Cr) FY19 FY18 YoY %
Revenue from Operations (Net of Excise) 5,908.09 4,470.56 32%
Raw Material 3,622.48 2,763.18
Employee Cost 791.29 586.8
Other Expenses 767.35 586.76
EBITDA 726.97 533.82 36%
EBITDA Margin 12.30% 11.94% 45bps
Other Income 25.24 33.35
Depreciation 234.38 164.85
EBIT 517.83 402.32 29%
EBIT Margin 8.76% 9.00% 8bps
Finance Cost 63.15 35.09
Profit before Share of Profit/Loss of JVs and Tax 454.68 367.23 24%
PBT Margin 7.70% 8.21% -20bps
Exceptional Item 38.24
Tax 134.07 97.69
Profit before Share of Profit/Loss of JVs 320.61 307.78 4%
Share of Profit/Loss of JVs 18.87 23.08
Net profit/(loss) after share of profit/(loss) of associates / joint ventures (A) 339.48 330.86 3%
PAT Margin % 5.75% 7.40% -40bps
PAT attributable to:
- Owners of MIL 285.62 310.19 -8%
- Non Controlling Interests 53.86 20.67
Other Comprehensive Income -0.68 5.31
Total Comprehensive Income for MIL 284.91 314.99 -10%
TCI Margin % 4.82% 7.05% -73bps
Total Comprehensive Income for Non Controlling Interests 53.89 21.18

35/635 / 4635/40Consolidated Balance Sheet
ASSETS 31st March 2019 31st March 2018
1. Non-current assets
Property, Plant and Equipment 1,629.40 1,199.39
Capital work-in-progress 131.52 192.11
Intangible Assets 66.84 39.32
Intangible Assets Under Development 18.61 18.68
Goodwill on Consolidation 164.92 111.79
Financial Assets
(i) Investments 355.58 155.23
(ii) Loans 21.21 14.49
(iii) Others 9.66 16.79
Deferred tax assets (net) 0 18.61
Other Tax Assets 33.05 31.18
Other Non-current Assets 67.1 40.43
Sub-total - Non-Current Assets 2,497.89 1,838.03
2. Current Assets
Inventories 560.97 417.52
Financial Assets
(i) Trade receivables 899.22 789.73
(ii) Cash and cash equivalents 92.77 125.56
(iii) Bank balance other than those included in cash
and cash equivalents17.29 33.91
(iv) Loans 2.01 1.59
(v) Others Current Financial Assets 22 18.04
Other current assets 138.48 140.74
Sub-total - Current Assets 1,732.74 1,527.08
TOTAL - ASSETS 4,230.63 3,365.11
Liabilities 31st March 2019 31st March 2018
EQUITY AND LIABILITIES
Equity
Equity share capital 52.44 17.41
Other Equity 1651.72 1,374.28
Equity attributable to owners of the Company 1704.16 1,391.69
Non-Controlling Interest 266.71 211.01
Total Equity 1970.87 1,602.70
LIABILITIES
1. Non-current liabilities
Financial Liabilities
(i) Borrowings 606.34 240.04
(ii) Other financial liabilities 75.58 51.46
Provisions 99.64 103.78
Deferred tax liability 0.62
Total- Non current liabilities 782.18 395.28
2. Current Liabilities
Financial Liabilities
(i) Borrowings 349.15 302.81
(ii) Trade payables
(a) Total outstanding dues of micro & small
enterprises64.61 6.08
(b) Total outstanding dues of crditors other than
micro & small enterprises733.21 792.33
(iii) Other financial liabilities 231.15 155.41
Other current liabilities 77.9 91.84
Provisions 21.56 14.83
Current tax liabilities (net) 3.83
Total- Current liabilities 1477.58 1,367.13
TOTAL Equity and Liabilities 4,230.63 3,365.11
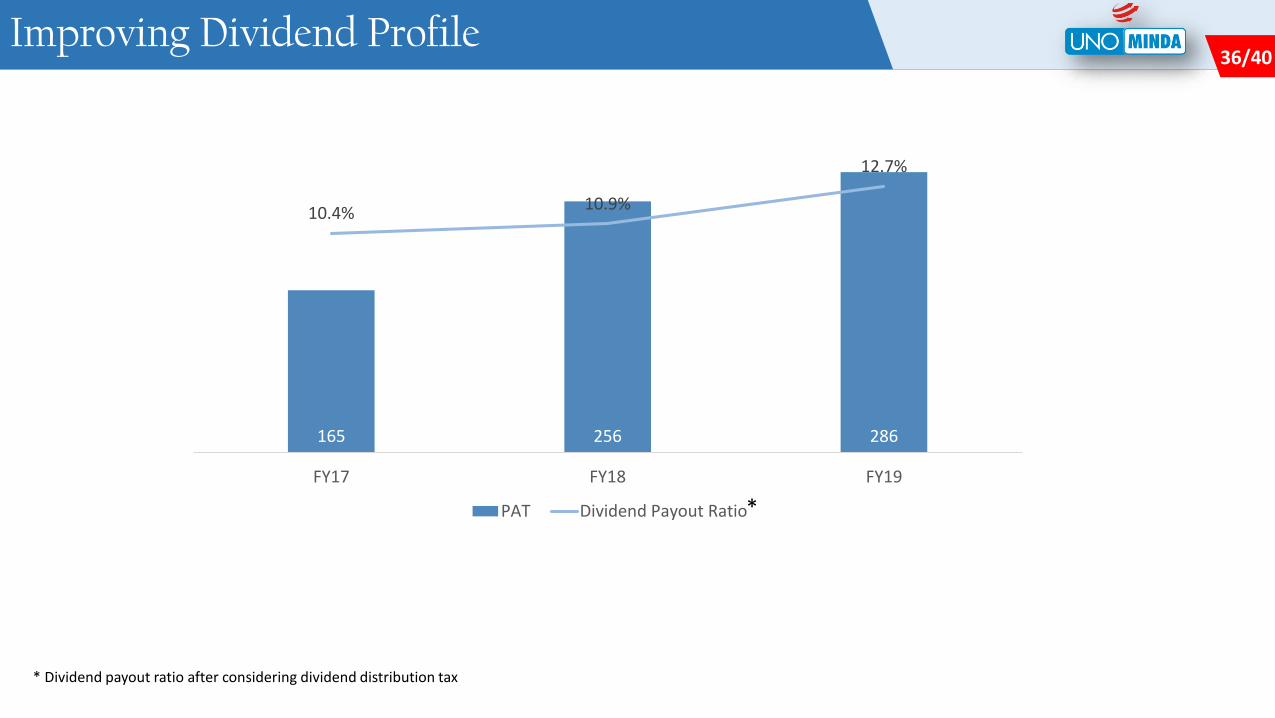
36/636 / 4636/40Improving Dividend Profile
165 256 286
10.4%10.9%
12.7%
FY17 FY18 FY19
PAT Dividend Payout Ratio
* Dividend payout ratio after considering dividend distribution tax
*
37/637 / 4637/40
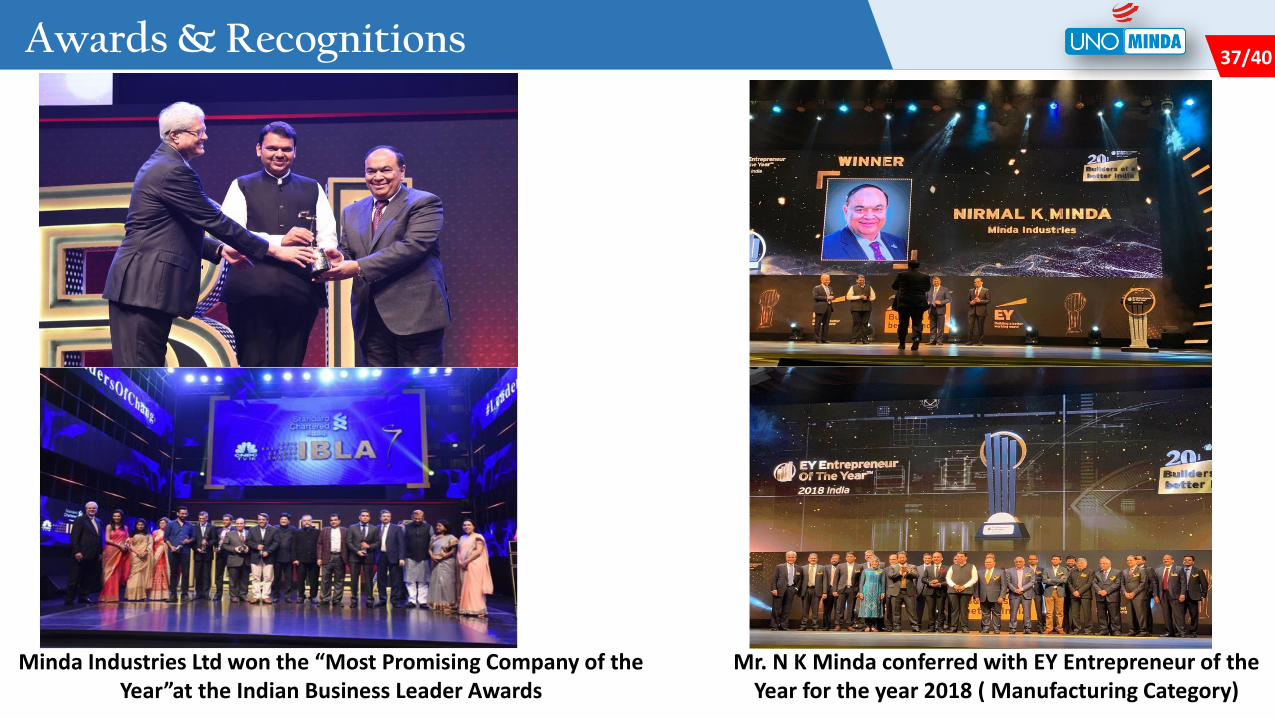
Minda Industries Ltd won the “Most Promising Company of the Year”at the Indian Business Leader Awards
Mr. N K Minda conferred with EY Entrepreneur of the Year for the year 2018 ( Manufacturing Category)
Awards & Recognitions
38/638 / 4638/40
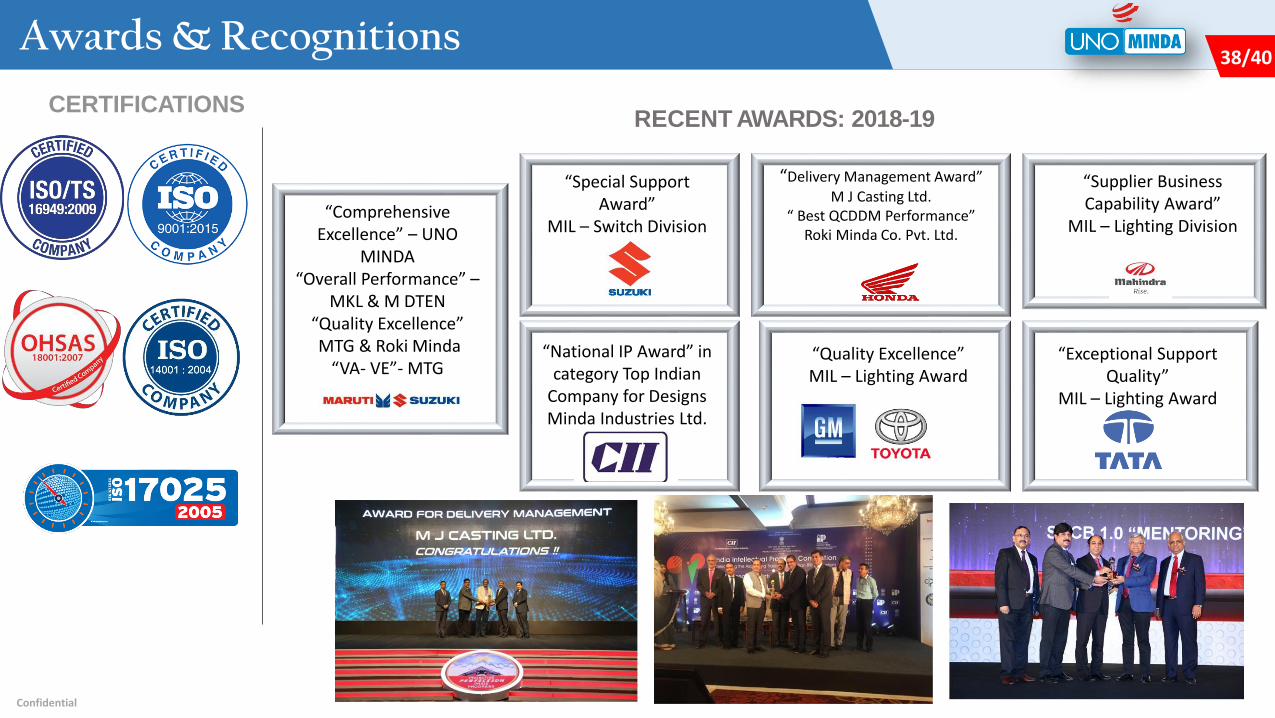
CERTIFICATIONSRECENT AWARDS: 2018-19
Confidential
“Special Support Award”
MIL – Switch Division
“Delivery Management Award”M J Casting Ltd.
“ Best QCDDM Performance”Roki Minda Co. Pvt. Ltd.
“Supplier Business Capability Award”
MIL – Lighting Division
“National IP Award” in category Top Indian
Company for Designs Minda Industries Ltd.
“Quality Excellence”MIL – Lighting Award
“Exceptional Support Quality”
MIL – Lighting Award
“Comprehensive Excellence” – UNO
MINDA“Overall Performance” –
MKL & M DTEN “Quality Excellence”MTG & Roki Minda
“VA- VE”- MTG
Awards & Recognitions
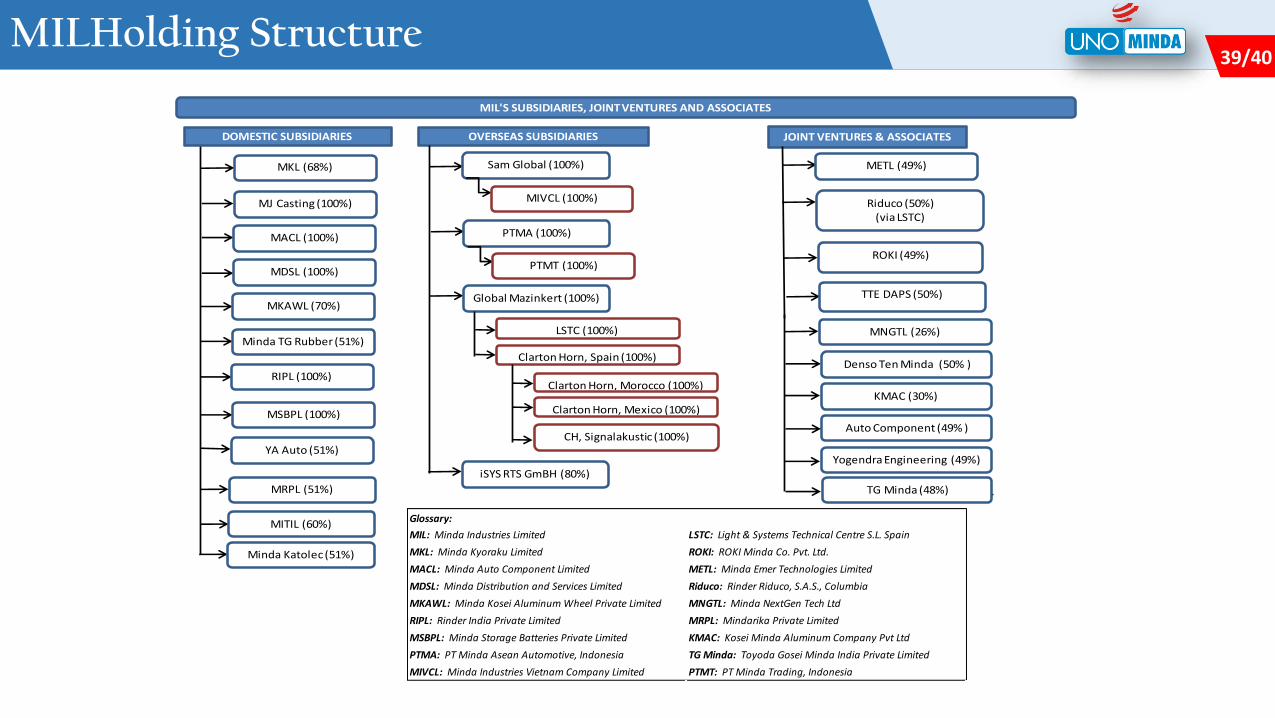
39/639 / 4639/40MILHolding Structure
Glossary:
MIL: Minda Industries Limited LSTC: Light & Systems Technical Centre S.L. Spain
MKL: Minda Kyoraku Limited ROKI: ROKI Minda Co. Pvt. Ltd.
MACL: Minda Auto Component Limited METL: Minda Emer Technologies Limited
MDSL: Minda Distribution and Services Limited Riduco: Rinder Riduco, S.A.S., Columbia
MKAWL: Minda Kosei Aluminum Wheel Private Limited MNGTL: Minda NextGen Tech Ltd
RIPL: Rinder India Private Limited MRPL: Mindarika Private Limited
MSBPL: Minda Storage Batteries Private Limited KMAC: Kosei Minda Aluminum Company Pvt Ltd
PTMA: PT Minda Asean Automotive, Indonesia TG Minda: Toyoda Gosei Minda India Private Limited
MIVCL: Minda Industries Vietnam Company Limited PTMT: PT Minda Trading, Indonesia
MIL'S SUBSIDIARIES, JOINT VENTURES AND ASSOCIATES
DOMESTIC SUBSIDIARIES
MKL (68%)
MJ Casting (100%)
MACL (100%)
MDSL (100%)
MKAWL (70%)
Minda TG Rubber (51%)
RIPL (100%)
MSBPL (100%)
OVERSEAS SUBSIDIARIES
Sam Global (100%)
MIVCL (100%)
PTMA (100%)
PTMT (100%)
Global Mazinkert (100%)
LSTC (100%)
Clarton Horn, Spain (100%)
Clarton Horn, Morocco (100%)
Clarton Horn, Mexico (100%)
CH, Signalakustic (100%)
JOINT VENTURES & ASSOCIATES
METL (49%)
Riduco (50%)(via LSTC)
MNGTL (26%)
KMAC (30%)
Auto Component (49% )
Yogendra Engineering (49%)YA Auto (51%)
ROKI (49%)
TG Minda (48%)MRPL (51%)
Denso Ten Minda (50% )
MITIL (60%)
Minda Katolec (51%)
TTE DAPS (50%)
iSYS RTS GmBH (80%)
40/640 / 4640/40
For further information, please contact:
Company : Investor Relations Advisors :
Minda Industries Ltd.CIN : L74899DL1992PLC050333Mr. Tripurari KumarDGM Strategy & [email protected]
www.unominda.com
Strategic Growth Advisors Pvt. Ltd.CIN : U74140MH2010PTC204285Mr. Jigar Kavaiya+91 99206 [email protected]
www.sgapl.net
Contact Us