Embed Size (px)
Citation preview
Government of Western AustraliaDepartment of Mines, Industry Regulation and Safety
WESTERN AUSTRALIAN MINERAL AND PETROLEUM
STATISTICS DIGEST
WESTERN AUSTRALIAN MINERAL AND PETROLEUM STATISTICS DIGEST 2017–18
Disclaimer
Information provided in this digest is made available without charge, as a public service, in good faith. The information provided is derived from sources believed to be reliable and accurate at the time of publication. However, use of the information in the digest is at your own risk. The digest is provided solely on the basis that users will be responsible for making their own assessment of the information provided therein and users are advised to verify all representations, statements and information for decisions that concern the conduct of business that involves monetary or operational consequences.
Each user waives and releases the Department of Mines, Industry Regulation and Safety and the State of Western Australia and its servants to the full extent permitted by law from all and any claims relating to the use of the material in the digest. In no event shall the Department of Mines, Industry Regulation and Safety or the State of Western Australia be liable for any incidental or consequential damages arising from any use or reliance on any material in this digest.
Prices and values provided are in Australian dollars, unless otherwise stated. There may be some discrepancies in percentages owing to the rounding of values.
Copyright © 2018
Copyright in this document is reserved to the State of Western Australia. Reproduction except in accordance with copyright law is prohibited.
Cover photo: Copyright Woodside Energy Ltd
Government of Western AustraliaDepartment of Mines, Industry Regulation and Safety
WESTERN AUSTRALIAN MINERAL AND PETROLEUM STATISTICS DIGEST 2017–18 1
CONTENTS
FOREWORD __________________________________________________________________________________ 3
OVERVIEW ___________________________________________________________________________________ 4
AVAILABILITY OF DETAILED RESOURCE DATA _______________________________________________ 8
1 INDUSTRY ACTIVITY _______________________________________________________________________ 9
1.1 MINERAL TITLES ________________________________________________________________________ 9
1.2 PETROLEUM TITLES ____________________________________________________________________ 9
1.3 EXPLORATION ___________________________________________________________________________ 10
1.4 INVESTMENT ACTIVITY _________________________________________________________________ 12
1.5 PRINCIPAL MINING PROJECTS __________________________________________________________ 14
1.6 EMPLOYMENT ___________________________________________________________________________ 14
1.7 ROYALTIES ______________________________________________________________________________ 17
2 COMMODITY REVIEW _____________________________________________________________________ 19
2.1 IRON ORE ________________________________________________________________________________ 19
2.2 PETROLEUM ____________________________________________________________________________ 22
2.3 GOLD ____________________________________________________________________________________ 29
2.4 ALUMINA AND BAUXITE _________________________________________________________________ 32
2.5 NICKEL __________________________________________________________________________________ 34
2.6 BASE METALS ___________________________________________________________________________ 36
2.7 MINERAL SANDS ________________________________________________________________________ 37
2.8 LITHIUM _________________________________________________________________________________ 38
2.9 OTHER __________________________________________________________________________________ 40
WESTERN AUSTRALIAN MINERAL AND PETROLEUM STATISTICS DIGEST 2017–18WESTERN AUSTRALIAN MINERAL AND PETROLEUM STATISTICS DIGEST 2017–182
WESTERN AUSTRALIAN MINERAL AND PETROLEUM STATISTICS DIGEST 2017–18WESTERN AUSTRALIAN MINERAL AND PETROLEUM STATISTICS DIGEST 2017–18 3
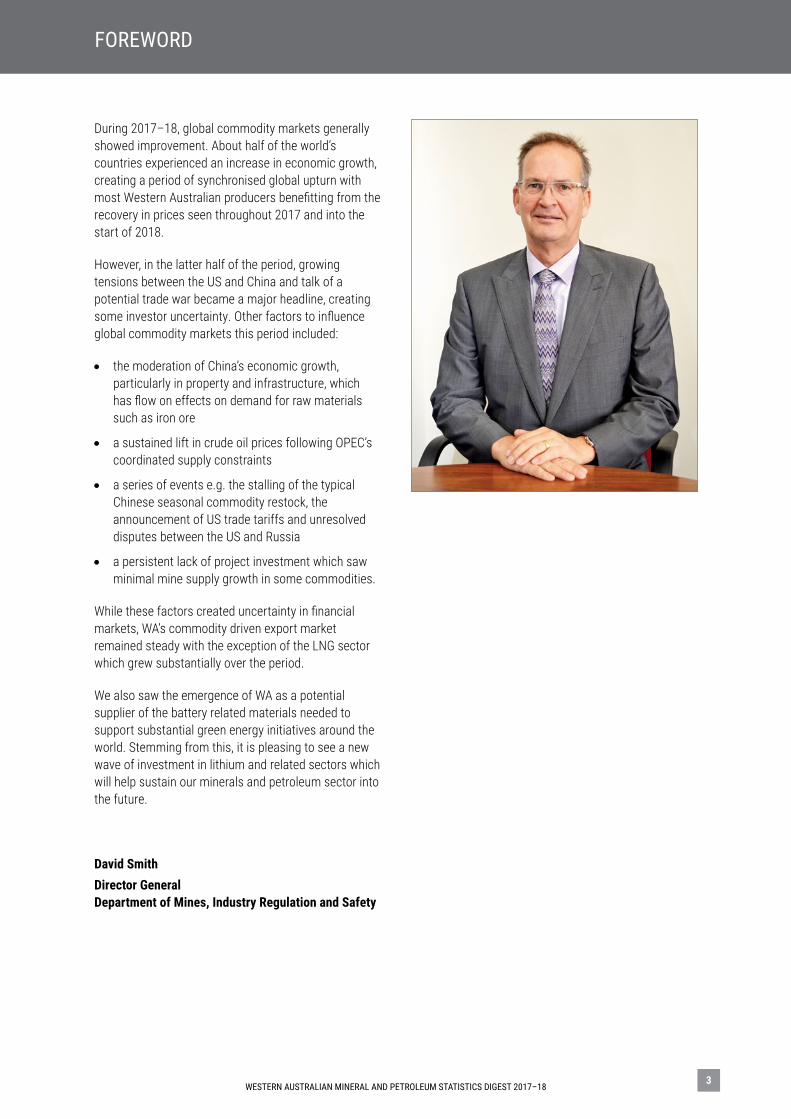
FOREWORD
During 2017–18, global commodity markets generally showed improvement. About half of the world’s countries experienced an increase in economic growth, creating a period of synchronised global upturn with most Western Australian producers benefitting from the recovery in prices seen throughout 2017 and into the start of 2018.
However, in the latter half of the period, growing tensions between the US and China and talk of a potential trade war became a major headline, creating some investor uncertainty. Other factors to influence global commodity markets this period included:
• the moderation of China’s economic growth, particularly in property and infrastructure, which has flow on effects on demand for raw materials such as iron ore
• a sustained lift in crude oil prices following OPEC’s coordinated supply constraints
• a series of events e.g. the stalling of the typical Chinese seasonal commodity restock, the announcement of US trade tariffs and unresolved disputes between the US and Russia
• a persistent lack of project investment which saw minimal mine supply growth in some commodities.
While these factors created uncertainty in financial markets, WA’s commodity driven export market remained steady with the exception of the LNG sector which grew substantially over the period.
We also saw the emergence of WA as a potential supplier of the battery related materials needed to support substantial green energy initiatives around the world. Stemming from this, it is pleasing to see a new wave of investment in lithium and related sectors which will help sustain our minerals and petroleum sector into the future.
David SmithDirector General Department of Mines, Industry Regulation and Safety

WESTERN AUSTRALIAN MINERAL AND PETROLEUM STATISTICS DIGEST 2017–18WESTERN AUSTRALIAN MINERAL AND PETROLEUM STATISTICS DIGEST 2017–184
OVERVIEW
For much of 2017–18 some optimism returned to the global commodity market, with the volatility of previous years easing across a number of commodities. However, political tensions played a part in the latter half of the year with the threat of a trade war between the US and China affecting the strength of some markets in mid-2018.
Locally, the Australian dollar was up slightly from an average of 75 US cents in 2016–17 to 77 US cents in 2017–18. Generally, global commodity prices held up well with the financial year average price of most commodities increasing on the gains made in 2016–17. Iron ore was an exception to this trend.
In 2017–18, Western Australia’s (WA’s) mineral and petroleum industry reported sales of just less than $115 billion. The bulk of the $10 billion increase on 2016–17 was the result of increased LNG volumes and improvement in the petroleum sector more broadly.
Mineral sector highlightsMineral commodities still dominate the State’s resources sector, accounting for 77 per cent, or $88 billion, of total sales value. Iron ore was by far the most valuable commodity, accounting for 70 per cent of mineral sales and 54 per cent of overall sales.
Iron ore recorded sales valued at $61.7 billion in 2017–18, down slightly (3 per cent) on the previous year. Record sales volumes of almost 826 million tonnes were not enough to offset the lower prices received by WA producers.
Gold sales volumes increased for the third year in a row to reach a record 212 tonnes (7.5 million ounces) in 2017–18. Increased volumes combined with strong gold prices to deliver a 5 per cent increase in the value of the sector, from $10.9 billion in 2016–17 to $11.4 billion in 2017–18.
Alumina and bauxite sales accounted for 7.5 per cent of mineral sales and 6 per cent of total sales. Sales volumes increased more than 4 per cent year–on–year, attributable to a substantial increase in bauxite sales, which offset a decrease in alumina sales. This meant that the value of the sector increased 30 per cent to $6.6 billion in 2017–18.
WA’s nickel sector has struggled in recent years, with the value of the sector declining year-on-year since 2010–11. However, in 2017–18, fortunes turned with the value of the sector increasing 26 per cent from $2.1 billion in 2016–17 to $2.6 billion in 2017–18.
The remaining minerals sales values comprised:
• Base metal sales of $1.6 billion (up 16 per cent)
• Coal sales of $332 million (down 1.9 per cent)
• Cobalt sales of $514 million (up 115 per cent)
• Mineral sands sales of $358 million (down 29 per cent)
• Salt sales of $301 million (up 3 per cent)
• Spodumene sales of $1.6 billion (up 167 per cent).
Petroleum sector highlightsThe petroleum sector, which comprises crude oil, condensate, LNG, natural gas and LPG, accounted for 23 per cent of the total value of WA’s mineral and petroleum sales in 2017–18. This made it the second most valuable sector after iron ore.
The sector was valued at $26.6 billion in 2017–18, an increase of 39 per cent from $19.2 billion in 2016–17.
LNG remains WA’s most valuable petroleum product, accounting for almost 17 per cent of all mineral and petroleum sales in 2017–18. The value of LNG sales rose more than $6 billion from $12.7 billion in 2016–17 to $19.1 billion in 2017–18.
The volume of LNG produced in WA increased 45 per cent during the five years to 2016–17 and a further 32 per cent in 2017–18. This followed the start-up of several new LNG projects marking the last of the “mega” LNG investment projects to reach production.
In 2017–18, crude oil volumes were down 11 per cent to 4.8 gigalitres (GL), while condensate production increased 18 per cent to 7.1GL. Improvements in the prices received by WA producers contributed to the increase in the value of crude oil and condensate sales, which rose for the first time in seven years from $4.3 billion in 2016–17 to $5.6 billion in 2017–18.
WESTERN AUSTRALIAN MINERAL AND PETROLEUM STATISTICS DIGEST 2017–18WESTERN AUSTRALIAN MINERAL AND PETROLEUM STATISTICS DIGEST 2017–18 5
-20
0
20
40
60
80
100
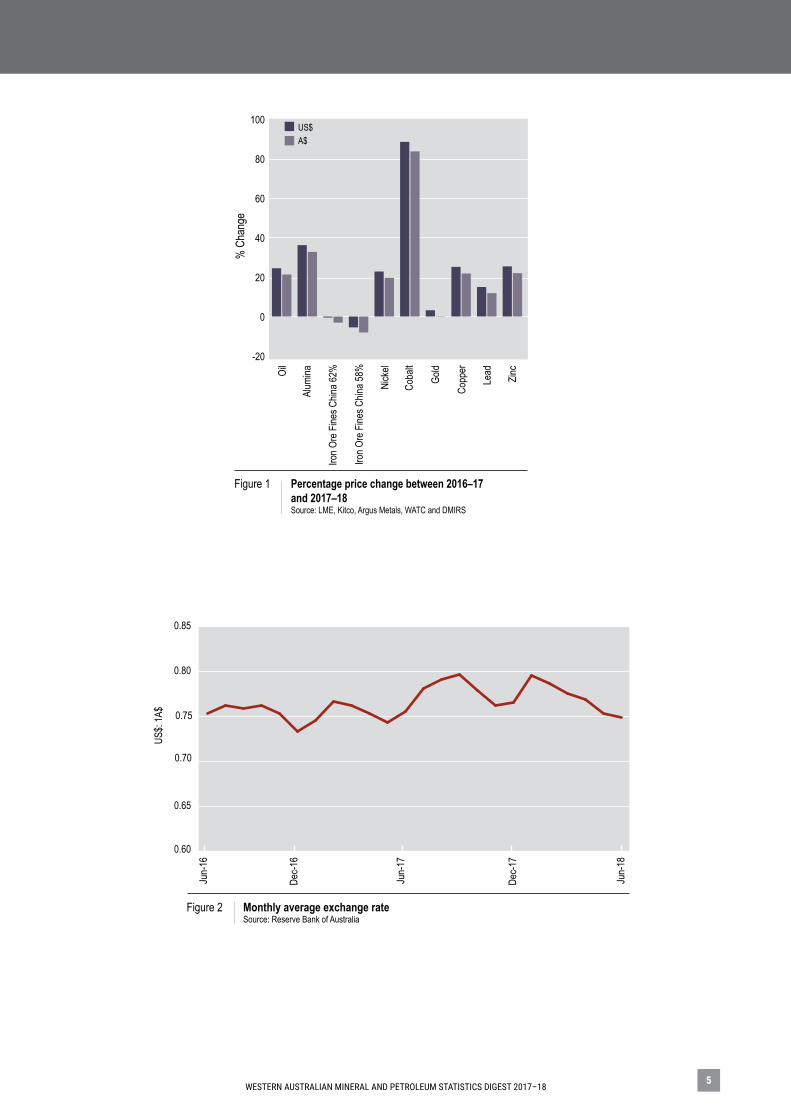
Figure 1 Percentage price change between 2016–17 and 2017–18 Source: LME, Kitco, Argus Metals, WATC and DMIRS
% C
hang
e
US$A$
Zinc
Lead
Copp
er
Gold
Coba
lt
Nick
el
Iron O
re F
ines C
hina 5
8%
Iron O
re F
ines C
hina 6
2%
Alum
inaOil
Figure 2 Monthly average exchange rate Source: Reserve Bank of Australia
0.60
0.65
0.70
0.75
0.80
0.85
US$:
1A$
Jun-
16
Dec-1
6
Jun-
17
Dec-1
7
Jun-
18
WESTERN AUSTRALIAN MINERAL AND PETROLEUM STATISTICS DIGEST 2017–18WESTERN AUSTRALIAN MINERAL AND PETROLEUM STATISTICS DIGEST 2017–186
40
45
50
55
60
65
70
'"Trade-weighted index" is the average value of A$ in relation to the currencies of Australia's major trading partners.
Jun-
16
Dec-1
6
Jun-
17
Dec-1
7
Jun-
18
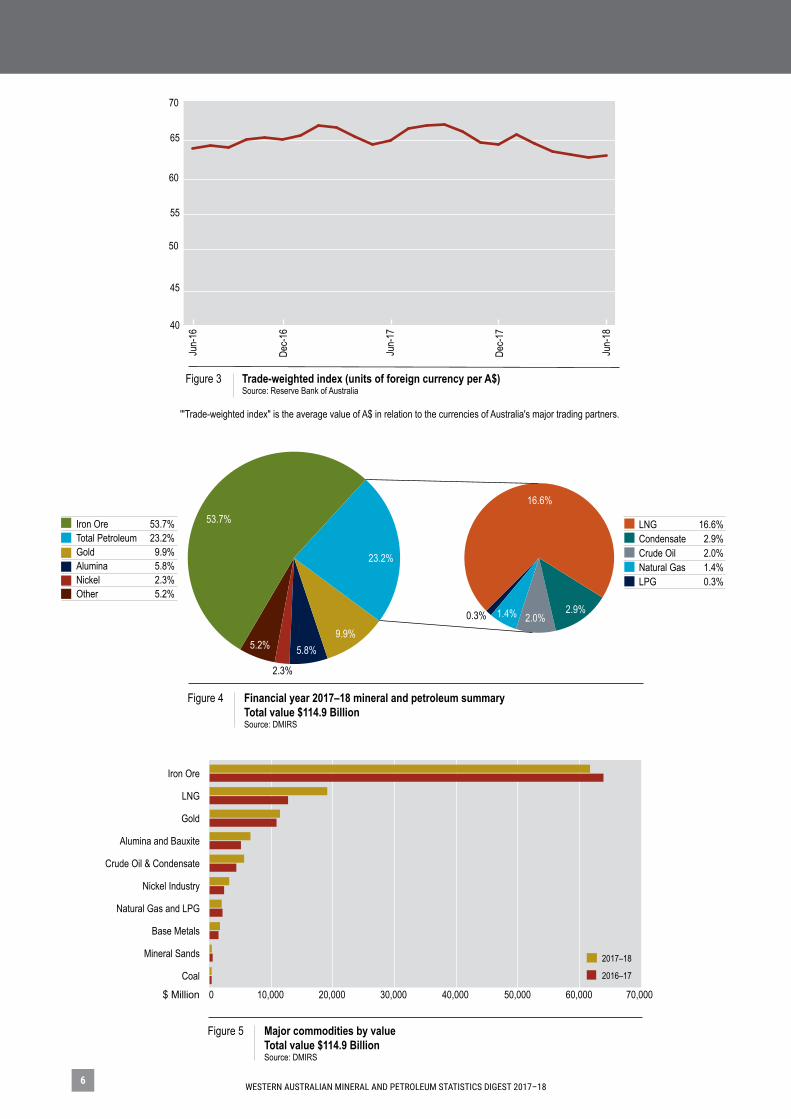
Figure 3 Trade-weighted index (units of foreign currency per A$) Source: Reserve Bank of Australia
Figure 4 Financial year 2017–18 mineral and petroleum summary Total value $114.9 Billion Source: DMIRS
LNG 16.6%Condensate 2.9%Crude Oil 2.0%Natural Gas 1.4%LPG 0.3%
53.7%
2.3%
9.9%
16.6%
2.9%2.0%0.3% 1.4%
5.8%5.2%
23.2%
Iron Ore 53.7%Total Petroleum 23.2%Gold 9.9%Alumina 5.8%Nickel 2.3%Other 5.2%
Figure 5 Major commodities by value Total value $114.9 Billion Source: DMIRS
0 10,000 20,000 30,000 40,000 50,000 60,000 70,000
Coal
Mineral Sands
Base Metals
Natural Gas and LPG
Nickel Industry
Crude Oil & Condensate
Alumina and Bauxite
Gold
LNG
Iron Ore
2017–18
2016–17
$ Million
WESTERN AUSTRALIAN MINERAL AND PETROLEUM STATISTICS DIGEST 2017–18WESTERN AUSTRALIAN MINERAL AND PETROLEUM STATISTICS DIGEST 2017–18 7
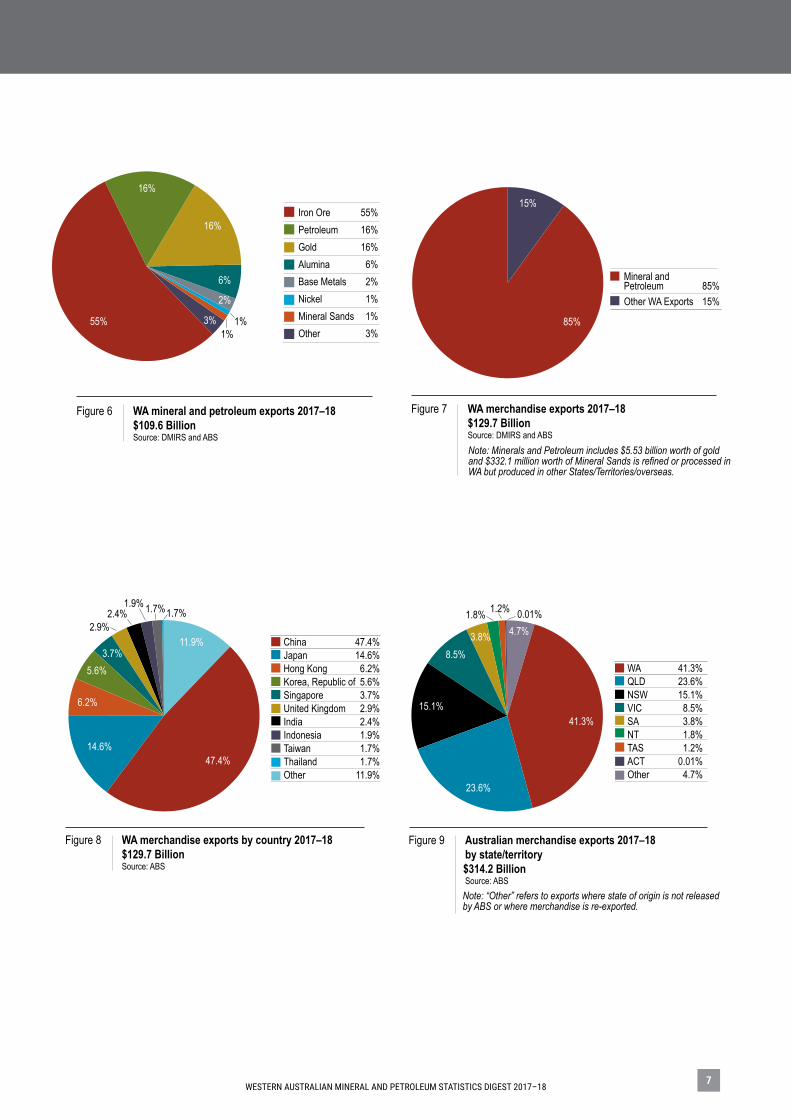
Figure 6 WA mineral and petroleum exports 2017–18 $109.6 Billion Source: DMIRS and ABS
Iron Ore 55%Petroleum 16%Gold 16%Alumina 6%Base Metals 2%Nickel 1%Mineral Sands 1%Other 3%
55%
16%
1%
6%
3%
2%
16%
1%
Figure 7 WA merchandise exports 2017–18 $129.7 Billion Source: DMIRS and ABS
Mineral andPetroleum 85%Other WA Exports 15%
15%
85%
Note: Minerals and Petroleum includes $5.53 billion worth of goldand $332.1 million worth of Mineral Sands is refined or processed in WA but produced in other States/Territories/overseas.
Figure 8 WA merchandise exports by country 2017–18 $129.7 Billion Source: ABS
China 47.4%Japan 14.6%Hong Kong 6.2%Korea, Republic of 5.6%Singapore 3.7%United Kingdom 2.9%India 2.4%Indonesia 1.9%Taiwan 1.7%Thailand 1.7%Other 11.9%
47.4%
6.2%
5.6%
14.6%
3.7%
1.7%1.9%2.4%
2.9%1.7%
11.9%
Figure 9 Australian merchandise exports 2017–18 by state/territory $314.2 Billion Source: ABS
WA 41.3%QLD 23.6%NSW 15.1%VIC 8.5%SA 3.8%NT 1.8%TAS 1.2%ACT 0.01%Other 4.7%
23.6%
8.5%
4.7%1.8% 1.2%
15.1%41.3%
3.8%
Note: “Other” refers to exports where state of origin is not released by ABS or where merchandise is re-exported.
0.01%
WESTERN AUSTRALIAN MINERAL AND PETROLEUM STATISTICS DIGEST 2017–18WESTERN AUSTRALIAN MINERAL AND PETROLEUM STATISTICS DIGEST 2017–18WESTERN AUSTRALIAN MINERAL AND PETROLEUM STATISTICS DIGEST 2017–188
AVAILABILITY OF DETAILED RESOURCE DATA
The department publishes detailed resource data on its website. Three separate Excel files are available:
1. Major commodities – this file contains information about the scale and scope of WA’s mineral and petroleum industry, as well as detailed information about the State’s major commodities, including sales value and volumes, prices, exports and production, compared to the rest of Australia.
2. Economic indicators – this file contains information about how the State’s mineral and petroleum industry contributes to the economy through exploration and investment, employment and royalty receipts.
3. Spatial and regional – this file contains information about mining and petroleum tenements and how the value of mineral and petroleum sales is distributed across the State.
Throughout this digest you will find references indicating where in the resource data files to find more detailed information about the topics discussed. These hints are identified by this symbol:
WESTERN AUSTRALIAN MINERAL AND PETROLEUM STATISTICS DIGEST 2017–18 9WESTERN AUSTRALIAN MINERAL AND PETROLEUM STATISTICS DIGEST 2017–18WESTERN AUSTRALIAN MINERAL AND PETROLEUM STATISTICS DIGEST 2017–18
0
100
200
300
400
500
600
Jun-
18
May-1
8
Apr-1
8
Mar-1
8
Feb-
18
Jan-
18
Dec-1
7
Nov-1
7
Oct-1
7
Sep-
17
Aug-
17
Jul- 1
7
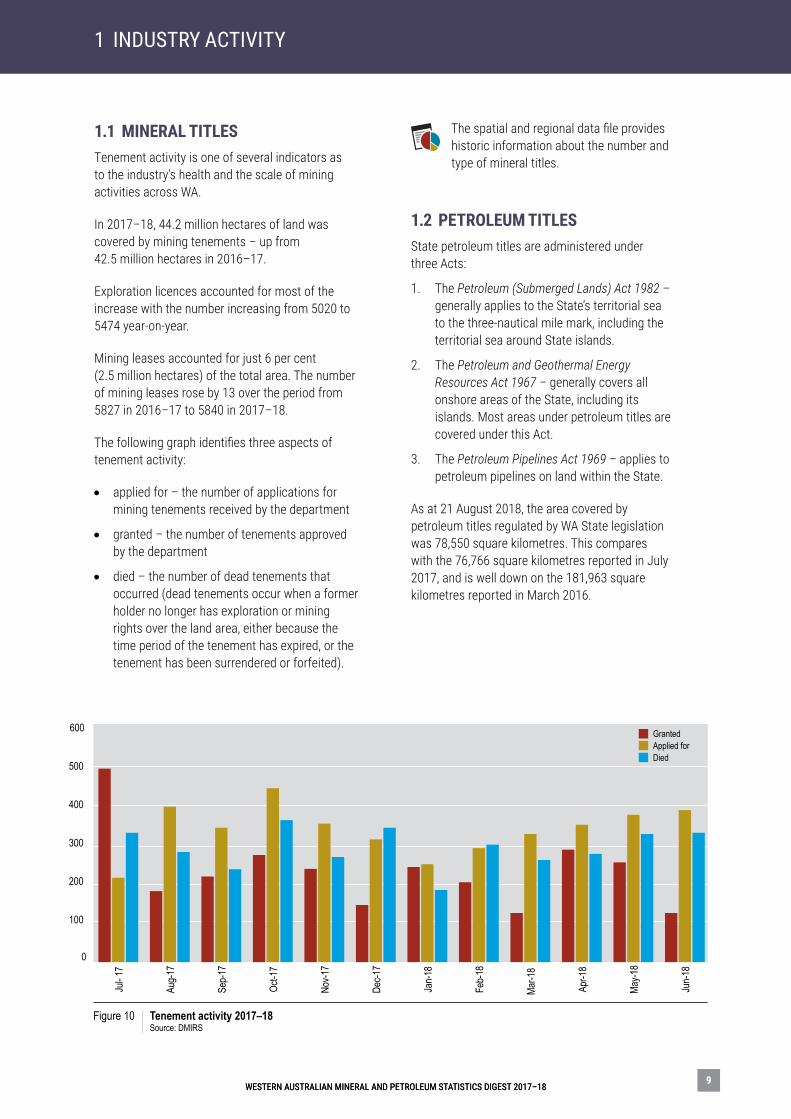
Figure 10 Tenement activity 2017–18 Source: DMIRS
GrantedApplied forDied
1 INDUSTRY ACTIVITY
1.1 MINERAL TITLES Tenement activity is one of several indicators as to the industry’s health and the scale of mining activities across WA.
In 2017–18, 44.2 million hectares of land was covered by mining tenements – up from 42.5 million hectares in 2016–17.
Exploration licences accounted for most of the increase with the number increasing from 5020 to 5474 year-on-year.
Mining leases accounted for just 6 per cent (2.5 million hectares) of the total area. The number of mining leases rose by 13 over the period from 5827 in 2016–17 to 5840 in 2017–18.
The following graph identifies three aspects of tenement activity:
• applied for – the number of applications for mining tenements received by the department
• granted – the number of tenements approved by the department
• died – the number of dead tenements that occurred (dead tenements occur when a former holder no longer has exploration or mining rights over the land area, either because the time period of the tenement has expired, or the tenement has been surrendered or forfeited).
The spatial and regional data file provides historic information about the number and type of mineral titles.
1.2 PETROLEUM TITLES State petroleum titles are administered under three Acts:
1. The Petroleum (Submerged Lands) Act 1982 – generally applies to the State’s territorial sea to the three-nautical mile mark, including the territorial sea around State islands.
2. The Petroleum and Geothermal Energy Resources Act 1967 – generally covers all onshore areas of the State, including its islands. Most areas under petroleum titles are covered under this Act.
3. The Petroleum Pipelines Act 1969 – applies to petroleum pipelines on land within the State.
As at 21 August 2018, the area covered by petroleum titles regulated by WA State legislation was 78,550 square kilometres. This compares with the 76,766 square kilometres reported in July 2017, and is well down on the 181,963 square kilometres reported in March 2016.
WESTERN AUSTRALIAN MINERAL AND PETROLEUM STATISTICS DIGEST 2017–18WESTERN AUSTRALIAN MINERAL AND PETROLEUM STATISTICS DIGEST 2017–1810
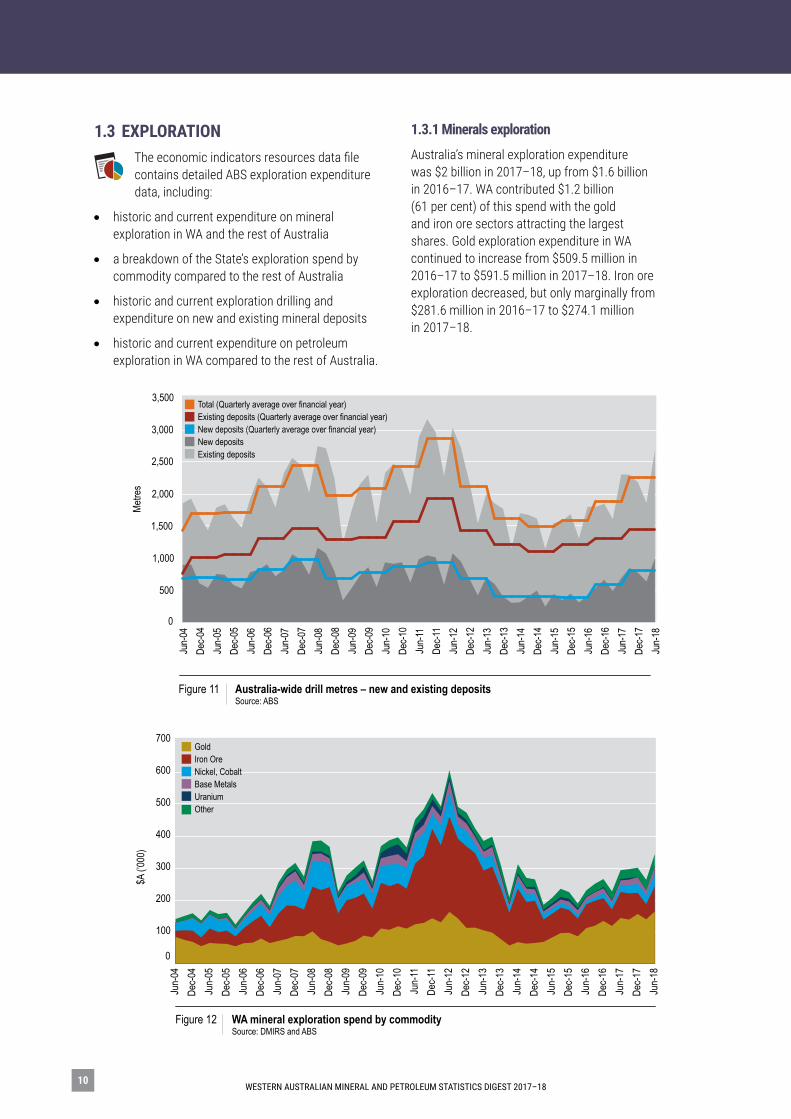
1.3 EXPLORATION The economic indicators resources data file contains detailed ABS exploration expenditure data, including:
• historic and current expenditure on mineral exploration in WA and the rest of Australia
• a breakdown of the State’s exploration spend by commodity compared to the rest of Australia
• historic and current exploration drilling and expenditure on new and existing mineral deposits
• historic and current expenditure on petroleum exploration in WA compared to the rest of Australia.
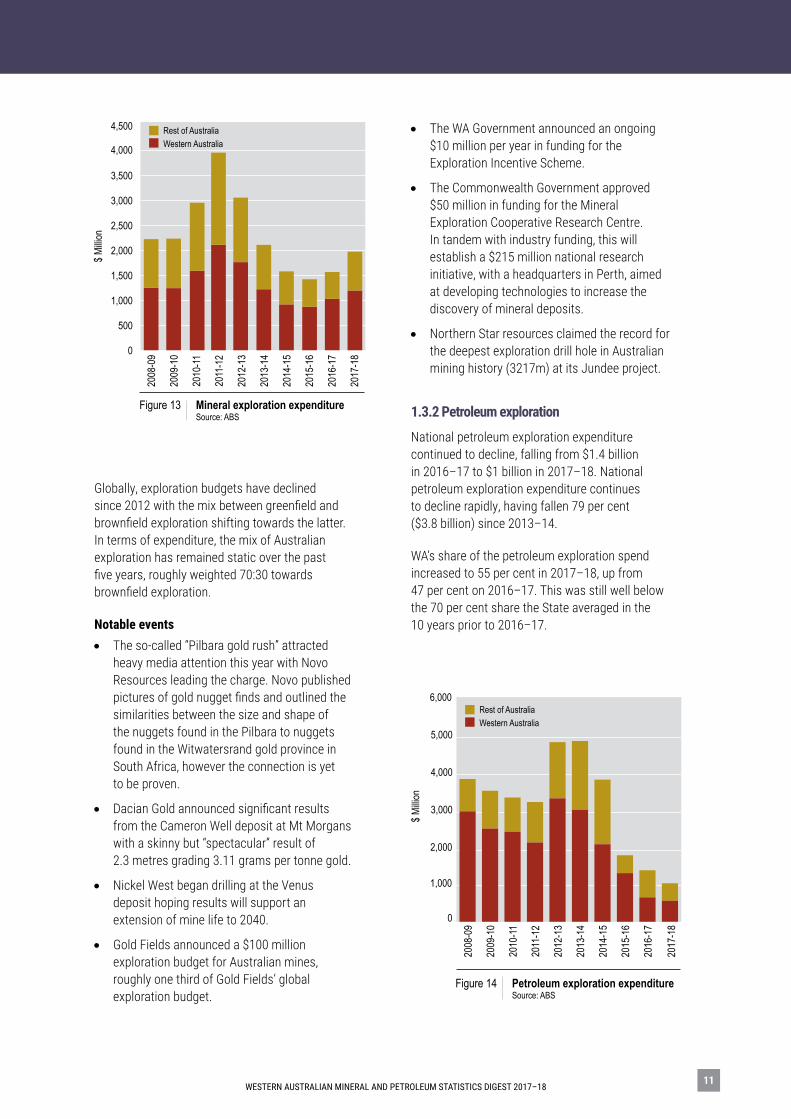
1.3.1 Minerals exploration
Australia’s mineral exploration expenditure was $2 billion in 2017–18, up from $1.6 billion in 2016–17. WA contributed $1.2 billion (61 per cent) of this spend with the gold and iron ore sectors attracting the largest shares. Gold exploration expenditure in WA continued to increase from $509.5 million in 2016–17 to $591.5 million in 2017–18. Iron ore exploration decreased, but only marginally from $281.6 million in 2016–17 to $274.1 million in 2017–18.
Jun-
18De
c-17
Jun-
17De
c-16
Jun-
16De
c-15
Jun-
15De
c-14
Jun-
14De
c-13
Jun-
13De
c-12
Jun-
12De
c-11
Jun-
11De
c-10
Jun-
10De
c-09
Jun-
09De
c-08
Jun-
08De
c-07
Jun-
07De
c-06
Jun-
06De
c-05
Jun-
05De
c-04
Jun-
04
0
500
1,000
1,500
2,000
2,500
3,000
3,500 Total (Quarterly average over financial year)Existing deposits (Quarterly average over financial year)New deposits (Quarterly average over financial year)New depositsExisting deposits
Figure 11 Australia-wide drill metres – new and existing deposits Source: ABS
Metre
s
GoldIron OreNickel, CobaltBase MetalsUraniumOther
Figure 12 WA mineral exploration spend by commodity Source: DMIRS and ABS
0
100
200
300
400
500
600
700
Jun-
18De
c-17
Jun-
17De
c-16
Jun-
16De
c-15
Jun-
15De
c-14
Jun-
14De
c-13
Jun-
13De
c-12
Jun-
12De
c-11
Jun-
11De
c-10
Jun-
10De
c-09
Jun-
09De
c-08
Jun-
08De
c-07
Jun-
07De
c-06
Jun-
06De
c-05
Jun-
05De
c-04
Jun-
04
$A (’0
00)
WESTERN AUSTRALIAN MINERAL AND PETROLEUM STATISTICS DIGEST 2017–18WESTERN AUSTRALIAN MINERAL AND PETROLEUM STATISTICS DIGEST 2017–18 11
Globally, exploration budgets have declined since 2012 with the mix between greenfield and brownfield exploration shifting towards the latter. In terms of expenditure, the mix of Australian exploration has remained static over the past five years, roughly weighted 70:30 towards brownfield exploration.
Notable events• The so-called “Pilbara gold rush” attracted
heavy media attention this year with Novo Resources leading the charge. Novo published pictures of gold nugget finds and outlined the similarities between the size and shape of the nuggets found in the Pilbara to nuggets found in the Witwatersrand gold province in South Africa, however the connection is yet to be proven.
• Dacian Gold announced significant results from the Cameron Well deposit at Mt Morgans with a skinny but “spectacular” result of 2.3 metres grading 3.11 grams per tonne gold.
• Nickel West began drilling at the Venus deposit hoping results will support an extension of mine life to 2040.
• Gold Fields announced a $100 million exploration budget for Australian mines, roughly one third of Gold Fields’ global exploration budget.
• The WA Government announced an ongoing $10 million per year in funding for the Exploration Incentive Scheme.
• The Commonwealth Government approved $50 million in funding for the Mineral Exploration Cooperative Research Centre. In tandem with industry funding, this will establish a $215 million national research initiative, with a headquarters in Perth, aimed at developing technologies to increase the discovery of mineral deposits.
• Northern Star resources claimed the record for the deepest exploration drill hole in Australian mining history (3217m) at its Jundee project.
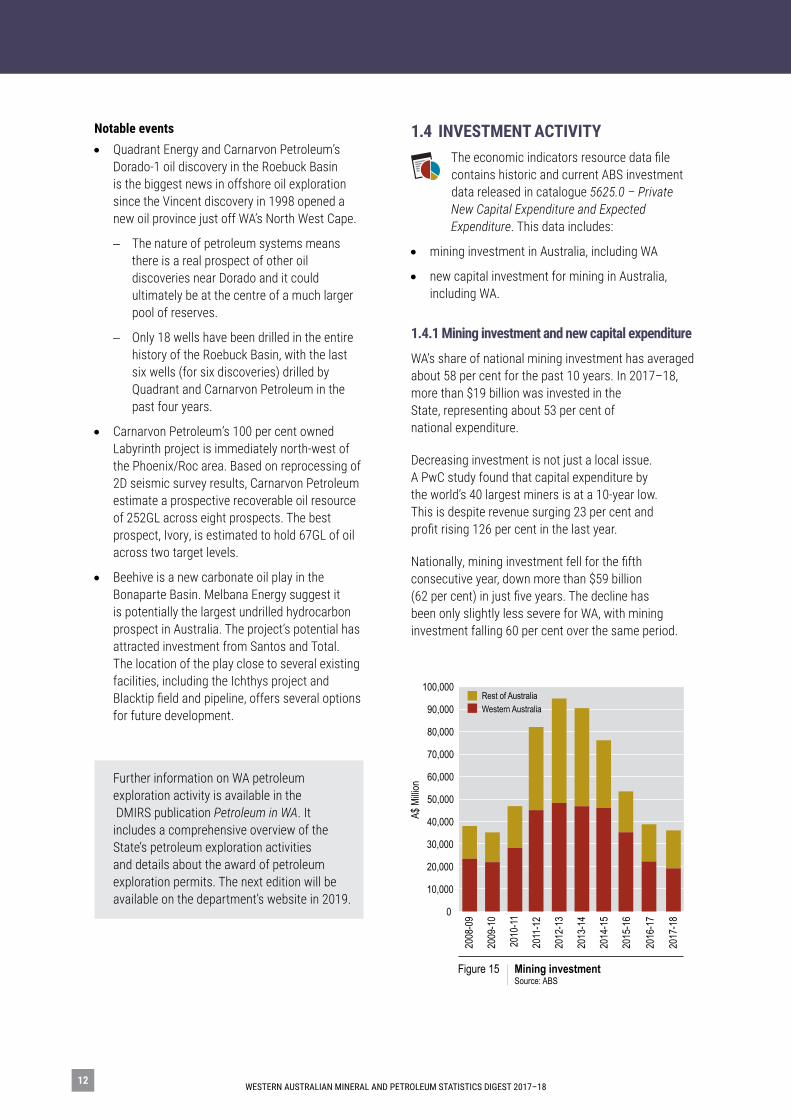
1.3.2 Petroleum exploration
National petroleum exploration expenditure continued to decline, falling from $1.4 billion in 2016–17 to $1 billion in 2017–18. National petroleum exploration expenditure continues to decline rapidly, having fallen 79 per cent ($3.8 billion) since 2013–14.
WA’s share of the petroleum exploration spend increased to 55 per cent in 2017–18, up from 47 per cent on 2016–17. This was still well below the 70 per cent share the State averaged in the 10 years prior to 2016–17.
Figure 13 Mineral exploration expenditure Source: ABS
$ Milli
on
0
500
1,000
1,500
2,000
2,500
3,000
3,500
4,000
4,500 Rest of AustraliaWestern Australia
2012
-13
2013
-14
2014
-15
2015
-16
2011
-12
2010
-11
2009
-10
2008
-09
2017
-18
2016
-17
Figure 14 Petroleum exploration expenditure Source: ABS
0
1,000
2,000
3,000
4,000
5,000
6,000
2016
-17
2017
-18
2015
-16
2014
-15
2013
-14
2012
-13
2011
-12
2010
-11
2009
-10
2008
-09
Rest of AustraliaWestern Australia
$ Milli
on
WESTERN AUSTRALIAN MINERAL AND PETROLEUM STATISTICS DIGEST 2017–18WESTERN AUSTRALIAN MINERAL AND PETROLEUM STATISTICS DIGEST 2017–1812
Notable events• Quadrant Energy and Carnarvon Petroleum’s
Dorado-1 oil discovery in the Roebuck Basin is the biggest news in offshore oil exploration since the Vincent discovery in 1998 opened a new oil province just off WA’s North West Cape.
- The nature of petroleum systems means there is a real prospect of other oil discoveries near Dorado and it could ultimately be at the centre of a much larger pool of reserves.
- Only 18 wells have been drilled in the entire history of the Roebuck Basin, with the last six wells (for six discoveries) drilled by Quadrant and Carnarvon Petroleum in the past four years.
• Carnarvon Petroleum’s 100 per cent owned Labyrinth project is immediately north-west of the Phoenix/Roc area. Based on reprocessing of 2D seismic survey results, Carnarvon Petroleum estimate a prospective recoverable oil resource of 252GL across eight prospects. The best prospect, Ivory, is estimated to hold 67GL of oil across two target levels.
• Beehive is a new carbonate oil play in the Bonaparte Basin. Melbana Energy suggest it is potentially the largest undrilled hydrocarbon prospect in Australia. The project’s potential has attracted investment from Santos and Total. The location of the play close to several existing facilities, including the Ichthys project and Blacktip field and pipeline, offers several options for future development.
Further information on WA petroleum exploration activity is available in the DMIRS publication Petroleum in WA. It includes a comprehensive overview of the State’s petroleum exploration activities and details about the award of petroleum exploration permits. The next edition will be available on the department’s website in 2019.
1.4 INVESTMENT ACTIVITY The economic indicators resource data file contains historic and current ABS investment data released in catalogue 5625.0 – Private New Capital Expenditure and Expected Expenditure. This data includes:
• mining investment in Australia, including WA
• new capital investment for mining in Australia, including WA.
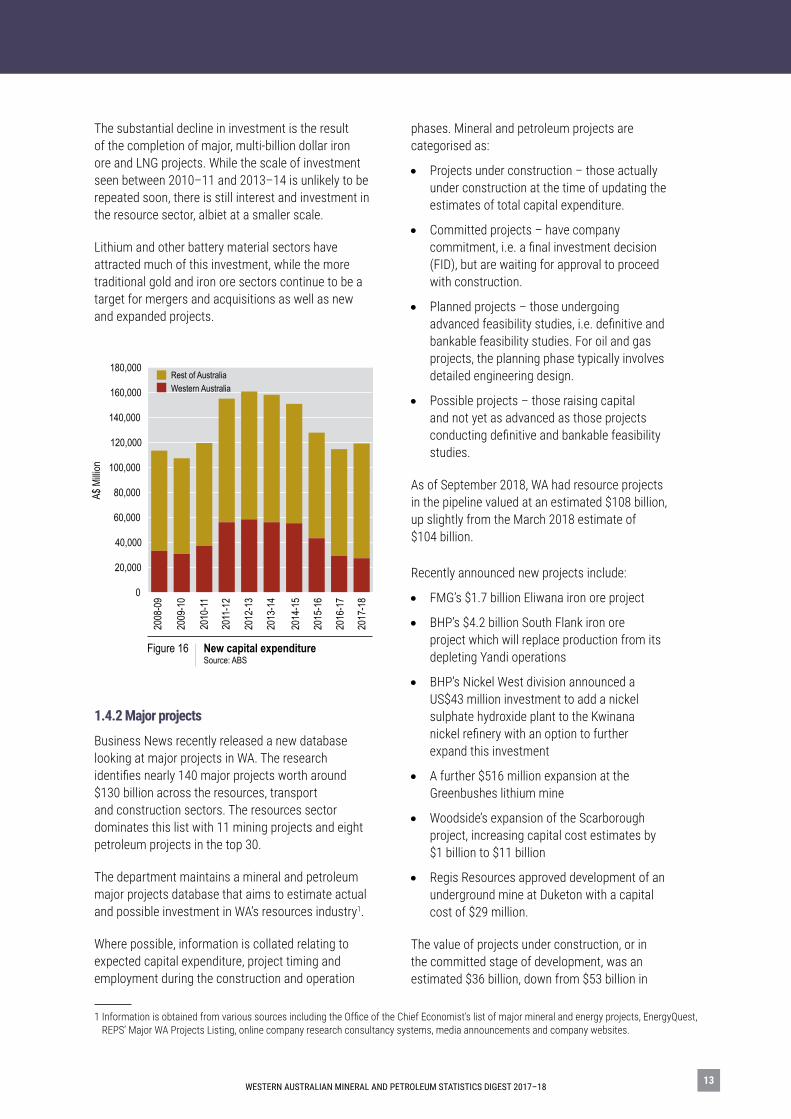
1.4.1 Mining investment and new capital expenditure
WA’s share of national mining investment has averaged about 58 per cent for the past 10 years. In 2017–18, more than $19 billion was invested in the State, representing about 53 per cent of national expenditure.
Decreasing investment is not just a local issue. A PwC study found that capital expenditure by the world’s 40 largest miners is at a 10-year low. This is despite revenue surging 23 per cent and profit rising 126 per cent in the last year.
Nationally, mining investment fell for the fifth consecutive year, down more than $59 billion (62 per cent) in just five years. The decline has been only slightly less severe for WA, with mining investment falling 60 per cent over the same period.
Figure 15 Mining investment Source: ABS
A$ M
illion
0
10,000
20,000
30,000
40,000
50,000
60,000
70,000
80,000
90,000
100,000Rest of AustraliaWestern Australia
2017
-18
2016
-17
2015
-16
2014
-15
2013
-14
2012
-13
2011
-12
2010
-11
2009
-10
2008
-09
WESTERN AUSTRALIAN MINERAL AND PETROLEUM STATISTICS DIGEST 2017–18WESTERN AUSTRALIAN MINERAL AND PETROLEUM STATISTICS DIGEST 2017–18 13
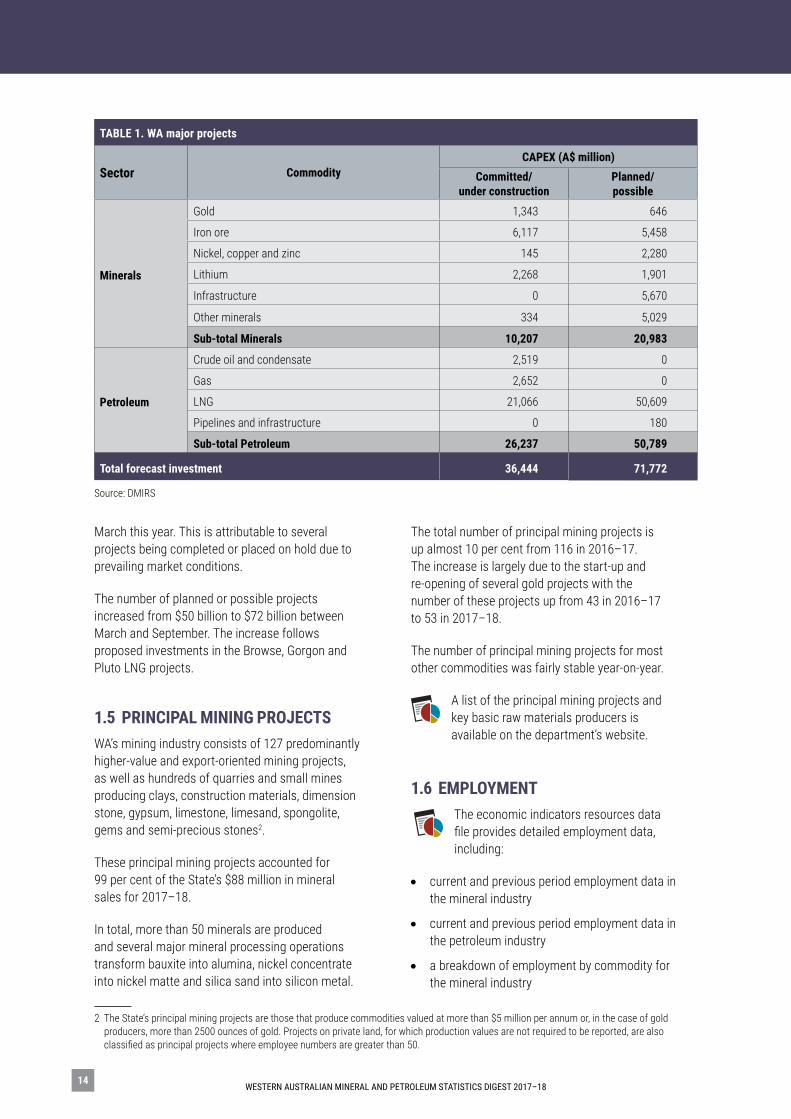
Figure 16 New capital expenditure Source: ABS
A$ M
illion
0
20,000
40,000
60,000
80,000
100,000
120,000
140,000
160,000
180,000Rest of AustraliaWestern Australia
2012
-13
2013
-14
2014
-15
2015
-16
2011
-12
2010
-11
2009
-10
2008
-09
2017
-18
2016
-17
The substantial decline in investment is the result of the completion of major, multi-billion dollar iron ore and LNG projects. While the scale of investment seen between 2010–11 and 2013–14 is unlikely to be repeated soon, there is still interest and investment in the resource sector, albiet at a smaller scale.
Lithium and other battery material sectors have attracted much of this investment, while the more traditional gold and iron ore sectors continue to be a target for mergers and acquisitions as well as new and expanded projects.
1.4.2 Major projects
Business News recently released a new database looking at major projects in WA. The research identifies nearly 140 major projects worth around $130 billion across the resources, transport and construction sectors. The resources sector dominates this list with 11 mining projects and eight petroleum projects in the top 30.
The department maintains a mineral and petroleum major projects database that aims to estimate actual and possible investment in WA’s resources industry1.
Where possible, information is collated relating to expected capital expenditure, project timing and employment during the construction and operation
phases. Mineral and petroleum projects are categorised as:
• Projects under construction – those actually under construction at the time of updating the estimates of total capital expenditure.
• Committed projects – have company commitment, i.e. a final investment decision (FID), but are waiting for approval to proceed with construction.
• Planned projects – those undergoing advanced feasibility studies, i.e. definitive and bankable feasibility studies. For oil and gas projects, the planning phase typically involves detailed engineering design.
• Possible projects – those raising capital and not yet as advanced as those projects conducting definitive and bankable feasibility studies.
As of September 2018, WA had resource projects in the pipeline valued at an estimated $108 billion, up slightly from the March 2018 estimate of $104 billion.
Recently announced new projects include:
• FMG’s $1.7 billion Eliwana iron ore project
• BHP’s $4.2 billion South Flank iron ore project which will replace production from its depleting Yandi operations
• BHP’s Nickel West division announced a US$43 million investment to add a nickel sulphate hydroxide plant to the Kwinana nickel refinery with an option to further expand this investment
• A further $516 million expansion at the Greenbushes lithium mine
• Woodside’s expansion of the Scarborough project, increasing capital cost estimates by $1 billion to $11 billion
• Regis Resources approved development of an underground mine at Duketon with a capital cost of $29 million.
The value of projects under construction, or in the committed stage of development, was an estimated $36 billion, down from $53 billion in
1 Information is obtained from various sources including the Office of the Chief Economist’s list of major mineral and energy projects, EnergyQuest, REPS’ Major WA Projects Listing, online company research consultancy systems, media announcements and company websites.
WESTERN AUSTRALIAN MINERAL AND PETROLEUM STATISTICS DIGEST 2017–18WESTERN AUSTRALIAN MINERAL AND PETROLEUM STATISTICS DIGEST 2017–1814
TABLE 1. WA major projects
Sector CommodityCAPEX (A$ million)
Committed/ under construction
Planned/ possible
Minerals
Gold 1,343 646
Iron ore 6,117 5,458
Nickel, copper and zinc 145 2,280
Lithium 2,268 1,901
Infrastructure 0 5,670
Other minerals 334 5,029
Sub-total Minerals 10,207 20,983
Petroleum
Crude oil and condensate 2,519 0
Gas 2,652 0
LNG 21,066 50,609
Pipelines and infrastructure 0 180
Sub-total Petroleum 26,237 50,789
Total forecast investment 36,444 71,772
Source: DMIRS
March this year. This is attributable to several projects being completed or placed on hold due to prevailing market conditions.
The number of planned or possible projects increased from $50 billion to $72 billion between March and September. The increase follows proposed investments in the Browse, Gorgon and Pluto LNG projects.
1.5 PRINCIPAL MINING PROJECTSWA’s mining industry consists of 127 predominantly higher-value and export-oriented mining projects, as well as hundreds of quarries and small mines producing clays, construction materials, dimension stone, gypsum, limestone, limesand, spongolite, gems and semi-precious stones2.
These principal mining projects accounted for 99 per cent of the State’s $88 million in mineral sales for 2017–18.
In total, more than 50 minerals are produced and several major mineral processing operations transform bauxite into alumina, nickel concentrate into nickel matte and silica sand into silicon metal.
The total number of principal mining projects is up almost 10 per cent from 116 in 2016–17. The increase is largely due to the start-up and re-opening of several gold projects with the number of these projects up from 43 in 2016–17 to 53 in 2017–18.
The number of principal mining projects for most other commodities was fairly stable year-on-year.
A list of the principal mining projects and key basic raw materials producers is available on the department’s website.
1.6 EMPLOYMENT The economic indicators resources data
file provides detailed employment data, including:
• current and previous period employment data in the mineral industry
• current and previous period employment data in the petroleum industry
• a breakdown of employment by commodity for the mineral industry
2 The State’s principal mining projects are those that produce commodities valued at more than $5 million per annum or, in the case of gold producers, more than 2500 ounces of gold. Projects on private land, for which production values are not required to be reported, are also classified as principal projects where employee numbers are greater than 50.
WESTERN AUSTRALIAN MINERAL AND PETROLEUM STATISTICS DIGEST 2017–18WESTERN AUSTRALIAN MINERAL AND PETROLEUM STATISTICS DIGEST 2017–18 15
0
20,000
40,000
60,000
80,000
100,000
120,000
2017
-18
2016
-17
2015
-16
2014
-15
2013
-14
2012
-13
2011
-12
2010
-11
2009
-10
2008
-09
2007
-08
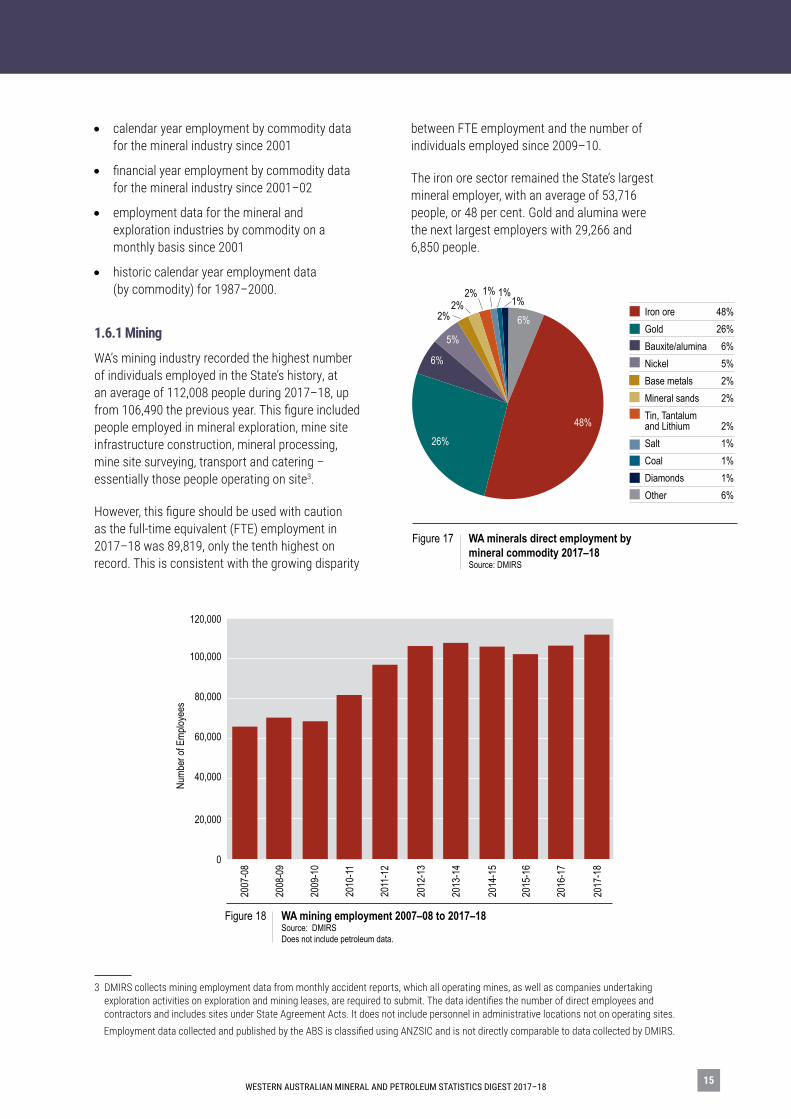
Figure 18 WA mining employment 2007–08 to 2017–18 Source: DMIRS Does not include petroleum data.
Num
ber o
f Emp
loyee
s
Figure 17 WA minerals direct employment by mineral commodity 2017–18 Source: DMIRS
26%
48%
6%
5%
Iron ore 48%Gold 26%Bauxite/alumina 6%Nickel 5%Base metals 2%Mineral sands 2%Tin, Tantalum and Lithium 2%Salt 1%Coal 1%Diamonds 1%Other 6%
6%
1%2%1%
1%2%
2%
• calendar year employment by commodity data for the mineral industry since 2001
• financial year employment by commodity data for the mineral industry since 2001–02
• employment data for the mineral and exploration industries by commodity on a monthly basis since 2001
• historic calendar year employment data (by commodity) for 1987–2000.
1.6.1 Mining
WA’s mining industry recorded the highest number of individuals employed in the State’s history, at an average of 112,008 people during 2017–18, up from 106,490 the previous year. This figure included people employed in mineral exploration, mine site infrastructure construction, mineral processing, mine site surveying, transport and catering – essentially those people operating on site3.
However, this figure should be used with caution as the full-time equivalent (FTE) employment in 2017–18 was 89,819, only the tenth highest on record. This is consistent with the growing disparity
between FTE employment and the number of individuals employed since 2009–10.
The iron ore sector remained the State’s largest mineral employer, with an average of 53,716 people, or 48 per cent. Gold and alumina were the next largest employers with 29,266 and 6,850 people.
3 DMIRS collects mining employment data from monthly accident reports, which all operating mines, as well as companies undertaking exploration activities on exploration and mining leases, are required to submit. The data identifies the number of direct employees and contractors and includes sites under State Agreement Acts. It does not include personnel in administrative locations not on operating sites.
Employment data collected and published by the ABS is classified using ANZSIC and is not directly comparable to data collected by DMIRS.
WESTERN AUSTRALIAN MINERAL AND PETROLEUM STATISTICS DIGEST 2017–18WESTERN AUSTRALIAN MINERAL AND PETROLEUM STATISTICS DIGEST 2017–1816
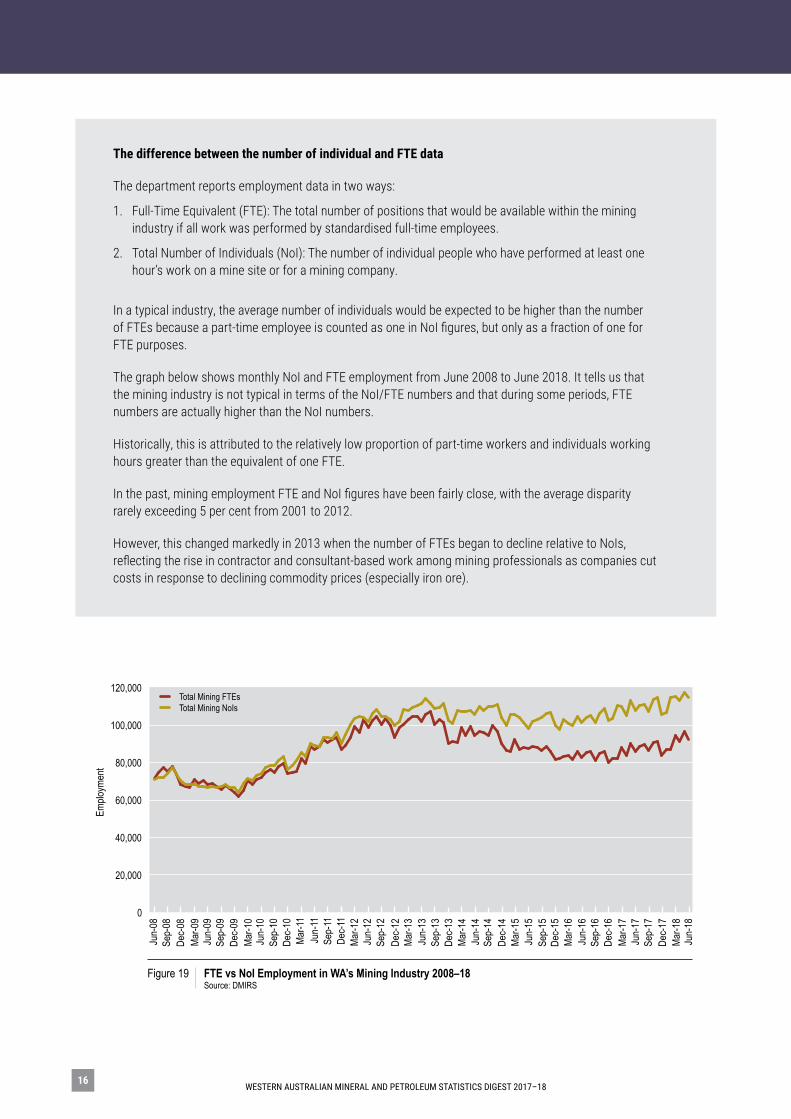
The difference between the number of individual and FTE data
The department reports employment data in two ways:
1. Full-Time Equivalent (FTE): The total number of positions that would be available within the mining industry if all work was performed by standardised full-time employees.
2. Total Number of Individuals (NoI): The number of individual people who have performed at least one hour’s work on a mine site or for a mining company.
In a typical industry, the average number of individuals would be expected to be higher than the number of FTEs because a part-time employee is counted as one in NoI figures, but only as a fraction of one for FTE purposes.
The graph below shows monthly NoI and FTE employment from June 2008 to June 2018. It tells us that the mining industry is not typical in terms of the NoI/FTE numbers and that during some periods, FTE numbers are actually higher than the NoI numbers.
Historically, this is attributed to the relatively low proportion of part-time workers and individuals working hours greater than the equivalent of one FTE.
In the past, mining employment FTE and NoI figures have been fairly close, with the average disparity rarely exceeding 5 per cent from 2001 to 2012.
However, this changed markedly in 2013 when the number of FTEs began to decline relative to NoIs, reflecting the rise in contractor and consultant-based work among mining professionals as companies cut costs in response to declining commodity prices (especially iron ore).
Figure 19 FTE vs NoI Employment in WA’s Mining Industry 2008–18 Source: DMIRS
0
20,000
40,000
60,000
80,000
100,000
120,000Ju
n-18
Mar-1
8De
c-17
Sep-
17Ju
n-17
Mar-1
7De
c-16
Sep-
16Ju
n-16
Mar-1
6De
c-15
Sep-
15Ju
n-15
Mar-1
5De
c-14
Sep-
14Ju
n-14
Mar-1
4De
c-13
Sep-
13Ju
n-13
Mar-1
3De
c-12
Sep-
12Ju
n-12
Mar-1
2De
c-11
Sep-
11Ju
n-11
Mar-1
1De
c-10
Sep-
10Ju
n-10
Mar-1
0De
c-09
Sep-
09Ju
n-09
Mar-0
9De
c-08
Sep-
08Ju
n-08
Emplo
ymen
t
Total Mining FTEsTotal Mining NoIs
WESTERN AUSTRALIAN MINERAL AND PETROLEUM STATISTICS DIGEST 2017–18WESTERN AUSTRALIAN MINERAL AND PETROLEUM STATISTICS DIGEST 2017–18 17
1.6.2 Petroleum
The average number of people employed by the State’s onshore petroleum sector improved slightly on the previous year, from 1203 to 1253.4 The data represents the average number of people employed at operating sites, including contractor employees.
The Dampier to Bunbury Natural Gas Pipeline is regularly the State’s largest petroleum employer with an average of 299 people employed in 2017–18.
1.7 ROYALTIES Royalties for all minerals and petroleum produced on State land and in State waters are paid into the Government’s Consolidated Revenue Fund. The State also receives about 65 per cent of the royalties from the petroleum produced by the North West Shelf Project, in the form of Commonwealth grants, in accordance with an agreement between the WA and Australian Governments.
The WA Government received royalty revenue from the State’s mineral and petroleum producers totalling $5.8 billion in 2017–18, a small increase of 1.6 per cent on 2016–175.
Iron ore provided the bulk of collections (77 per cent) for 2017–18, however this was down 3 per cent on the previous year’s receipts. Consistent with the better market conditions seen in the gold sector, contributions rose almost 4 per cent to $273 million in 2017–18.
Petroleum royalty receipts were down for a second consecutive year. After declining almost 53 per cent in 2015–16, the decline was a more modest 6.4 per cent in 2017–18 with $3.2 million in receipts. The State also received $682 million in grants for the North West Shelf project, an increase of 19 per cent on 2017–18.
The figure reported in this digest is the “royalty receipts” for the relevant period, i.e. the cash that was actually received by the State Government during 2017–18. This means that the royalty receipts are offset from sales value figures by one quarter and include the June, September, December 2017 quarters and the March 2018 quarter.
For commodities subject to an ad-valorum royalty rate, e.g. iron ore, the royalty payable is calculated from the gross sales value less any allowable deductions. For commodities on a specific rate, e.g. construction materials, the royalty payable is calculated on a per tonne basis.
The economic indicators resources data file contains:
• a breakdown of royalty receipts per commodity for the most recent calendar and financial year
• historic royalty receipts and North West Shelf grants from 1984–present.
4 This figure comprises only operations subject to State petroleum legislation, and excludes LNG operations and land based service operations.
5 Included in the State’s royalty receipts for iron ore is an additional lease rental amount, which is currently applied under iron ore State Agreement Acts and the Mining Act. The rate is 25 cents per tonne. In the case of some older Agreement Acts, the rate is 25 cents per imperial ton. The additional lease rental applies to iron ore obtained from a mining lease following 15 years from the date the iron ore was first obtained from the mining tenement, by the lessee.

WESTERN AUSTRALIAN MINERAL AND PETROLEUM STATISTICS DIGEST 2017–18WESTERN AUSTRALIAN MINERAL AND PETROLEUM STATISTICS DIGEST 2017–18WESTERN AUSTRALIAN MINERAL AND PETROLEUM STATISTICS DIGEST 2017–1818
TABLE 2. Royalty receipts and North West Shelf grants 2016–17 and 2017–18
Commodity 2016–17 Total A$
2017–18 Total A$
2017–18 growth A$ %
Alumina 81,082,000 99,232,000 18,150,000 22.4%
Copper, Lead & Zinc 59,916,000 70,778,000 10,862,000 18.1%
Diamonds 13,020,000 12,094,000 -926,000 -7.1%
Gold 262,874,000 272,771,000 9,897,000 3.8%
Mineral sands 14,317,000 12,291,000 -2,026,000 -14.2%
Iron ore 4,619,551,000 4,476,871,000 -142,680,000 -3.1%
Nickel 49,169,000 56,958,000 7,789,000 15.8%
Petroleum * 3,432,000 3,212,000 -220,000 -6.4%
Other 68,541,000 148,350,000 79,809,000 116.4%
Total royalty receipts 5,171,902,000 5,152,557,000 -19,345,000 -0.4%
North West Shelf Grants 573,000,000 681,965,000 108,965,000 19.0%
Total revenue 5,744,902,000 5,834,522,000 89,620,000 1.6%
Note: All royalty revenue shown above is paid into the State’s Consolidated Revenue Fund. Added to the table, shown separately, is the State’s share of the North West Shelf project royalty payments to the Commonwealth (which are provided as a grant from the Commonwealth to the State).
* Includes the Commonwealth’s share of royalties collected under the Western Australian Petroleum Submerged Land Act (PSLA).
Figure 20 Royalty receipts and North West Shelf grants 2017–18 $5.8 Billion Source: DMIRS and Department of Treasury
Other 6.9%
North West
Shelf
Grants 1
1.7%
Iron ore76.7%
Gold 4.7%
Nickel1.0%
Alumina1.7%
Other 2.5%
Petroleum*0.1%
Mineral sands0.2%
Diamonds0.2%
Copper, Lead & Zinc
1.2%
WESTERN AUSTRALIAN MINERAL AND PETROLEUM STATISTICS DIGEST 2017–18 19WESTERN AUSTRALIAN MINERAL AND PETROLEUM STATISTICS DIGEST 2017–18WESTERN AUSTRALIAN MINERAL AND PETROLEUM STATISTICS DIGEST 2017–18
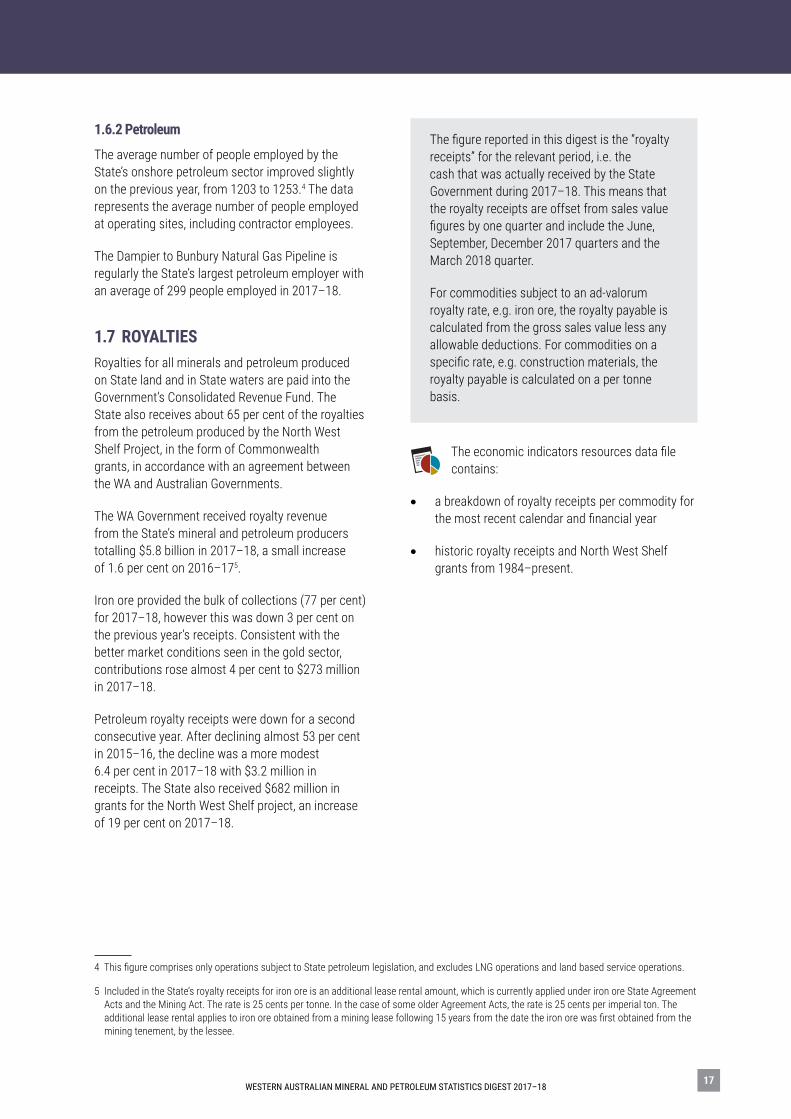
Figure 21 Iron ore price Source: Argus Metals
0
20
40
60
80
100
120
140
160
180
$/ton
ne
62% Fines CFR China US$/t62% Fines CFR China A$/t
Sep-
13
Dec-1
3
Mar-1
4
Jun-
14
Sep-
14
Dec-1
4
Mar-1
5
Jun-
15
Sep-
15
Dec-1
5
Mar-1
6
Jun-
16
Sep-
16
Dec-1
6
Mar-1
7
Jun-
17
Sep-
17
Dec-1
7
Mar-1
8
Jun-
18
58% Fines CFR China US$/t58% Fines CFR China A$/t
2 COMMODITY REVIEW
2.1 IRON ORE PricingThe average annual iron ore price decreased slightly from US$69.55 per tonne in 2016–17 to US$69.21 per tonne in 2017–18. Due to movements in the US-Australian dollar exchange rate, this meant a decrease in the Australian dollar annual average from $92.12 per tonne to $89.23 per tonne over the same period.
Iron ore price spread
The iron ore price spread remained a topic of conversation in 2017–18.
While the ‘benchmark’ iron ore price is for 62 per cent iron content ore, the grade of iron ore used in steelmaking usually ranges between 58 to 65 per cent iron content. Premiums and discounts are applied to the price paid for higher and lower grade ores.
The gap that emerged in early 2017 remained in effect, with the 58 per cent iron ore price averaging US$55.27 over the year.
The discounts are linked with high coking coal prices and penalties for high alumina content in iron ore supplies. Steelmakers need to use more metallurgical coal in the blast furnace when smelting iron ore of high alumina content. The rising levels of alumina
content in the global supply chain points towards a greater demand for higher grade iron ore supplies.
High steel prices, and China’s ongoing government push to improve air quality through increasingly stringent air pollution policies, are expected to maintain the price premium for high grade iron ore and discounts for impurities contained in iron ore, namely alumina and silica.
While WA typically hosts mid-quality iron ore reserves (close to the 62 per cent benchmark), there are a number of producers operating lower grade mines, which may be exposed to persistently lower prices.
Quantity and valueWA’s iron ore sales reached a record 826 million tonnes in 2017–18, an increase of almost 8.5 per cent on 2016–17. Iron ore sales have increased year-in-year-out, with annual volumes growing 161 per cent in the last 10 years alone.
In 2017–18, iron ore volumes increased mostly due to production growth by Rio Tinto following the ramp up of the 10Mtpa Silvergrass mine, as well as the continued ramp up of Roy Hill and CITIC Pacific’s Sino Iron project. This growth was enough to more than offset lower production from Mineral Resources, Cleveland-Cliffs and Atlas Iron.
WESTERN AUSTRALIAN MINERAL AND PETROLEUM STATISTICS DIGEST 2017–18WESTERN AUSTRALIAN MINERAL AND PETROLEUM STATISTICS DIGEST 2017–1820
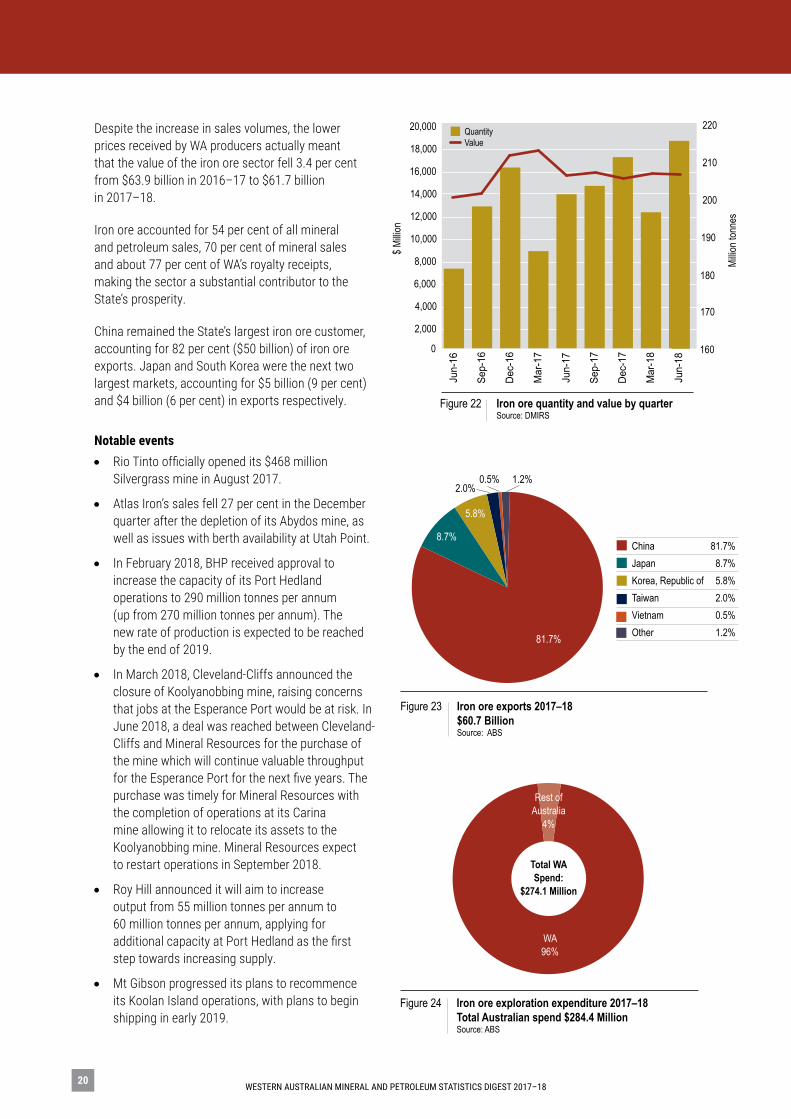
Despite the increase in sales volumes, the lower prices received by WA producers actually meant that the value of the iron ore sector fell 3.4 per cent from $63.9 billion in 2016–17 to $61.7 billion in 2017–18.
Iron ore accounted for 54 per cent of all mineral and petroleum sales, 70 per cent of mineral sales and about 77 per cent of WA’s royalty receipts, making the sector a substantial contributor to the State’s prosperity.
China remained the State’s largest iron ore customer, accounting for 82 per cent ($50 billion) of iron ore exports. Japan and South Korea were the next two largest markets, accounting for $5 billion (9 per cent) and $4 billion (6 per cent) in exports respectively.
Notable events• Rio Tinto officially opened its $468 million
Silvergrass mine in August 2017.
• Atlas Iron’s sales fell 27 per cent in the December quarter after the depletion of its Abydos mine, as well as issues with berth availability at Utah Point.
• In February 2018, BHP received approval to increase the capacity of its Port Hedland operations to 290 million tonnes per annum (up from 270 million tonnes per annum). The new rate of production is expected to be reached by the end of 2019.
• In March 2018, Cleveland-Cliffs announced the closure of Koolyanobbing mine, raising concerns that jobs at the Esperance Port would be at risk. In June 2018, a deal was reached between Cleveland-Cliffs and Mineral Resources for the purchase of the mine which will continue valuable throughput for the Esperance Port for the next five years. The purchase was timely for Mineral Resources with the completion of operations at its Carina mine allowing it to relocate its assets to the Koolyanobbing mine. Mineral Resources expect to restart operations in September 2018.
• Roy Hill announced it will aim to increase output from 55 million tonnes per annum to 60 million tonnes per annum, applying for additional capacity at Port Hedland as the first step towards increasing supply.
• Mt Gibson progressed its plans to recommence its Koolan Island operations, with plans to begin shipping in early 2019.
Millio
n ton
nes
$ Milli
onFigure 22 Iron ore quantity and value by quarter Source: DMIRS
160
170
180
190
200
210
220
Jun-
18
Mar
-18
Dec-
17
Sep-
17
Jun-
17
Mar
-17
Dec-
16
Sep-
16
Jun-
16
0
2,000
4,000
6,000
8,000
10,000
12,000
14,000
16,000
18,000
20,000 QuantityValue
Figure 23 Iron ore exports 2017–18 $60.7 Billion Source: ABS
5.8%
81.7%
8.7%
2.0%0.5%
China 81.7%Japan 8.7%Korea, Republic of 5.8%Taiwan 2.0%Vietnam 0.5%Other 1.2%
1.2%
Figure 24 Iron ore exploration expenditure 2017–18 Total Australian spend $284.4 Million Source: ABS
Rest ofAustralia
4%
WA96%
Total WASpend:
$274.1 Million
WESTERN AUSTRALIAN MINERAL AND PETROLEUM STATISTICS DIGEST 2017–18WESTERN AUSTRALIAN MINERAL AND PETROLEUM STATISTICS DIGEST 2017–18 21
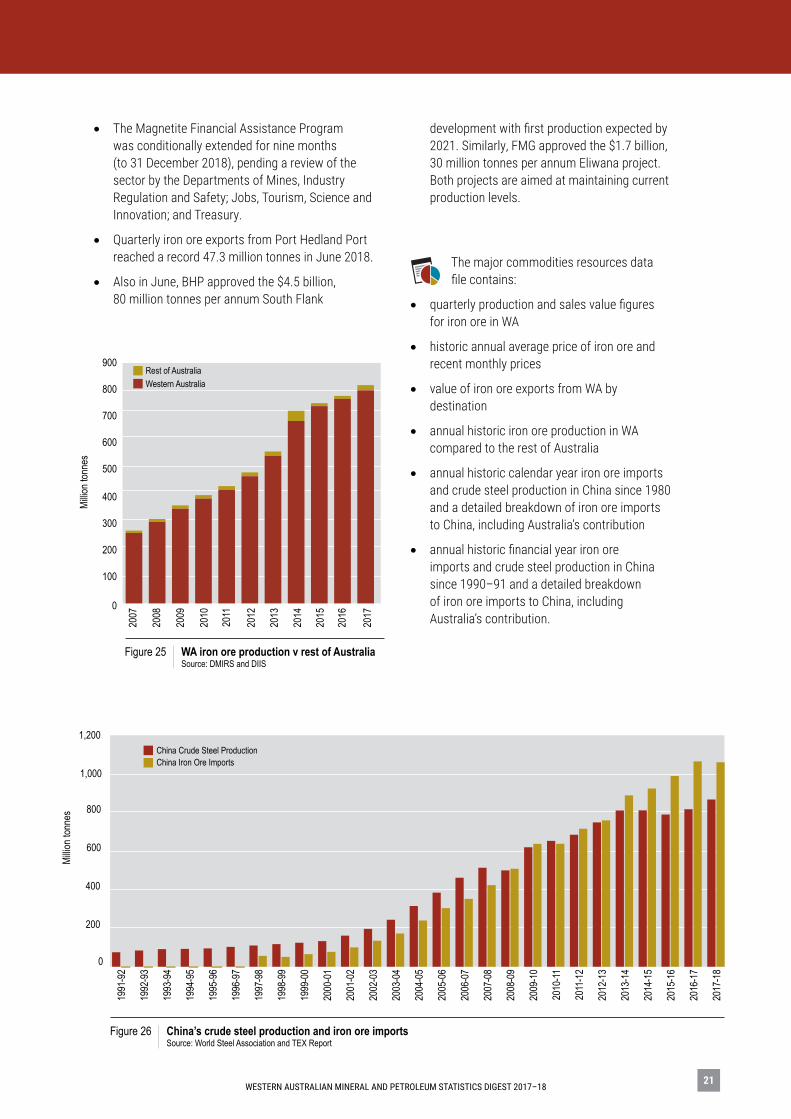
• The Magnetite Financial Assistance Program was conditionally extended for nine months (to 31 December 2018), pending a review of the sector by the Departments of Mines, Industry Regulation and Safety; Jobs, Tourism, Science and Innovation; and Treasury.
• Quarterly iron ore exports from Port Hedland Port reached a record 47.3 million tonnes in June 2018.
• Also in June, BHP approved the $4.5 billion, 80 million tonnes per annum South Flank
0
200
400
600
800
1,000
1,200
2017
-18
2016
-17
2015
-16
2014
-15
2013
-14
2012
-13
2011
-12
2010
-11
2009
-10
2008
-09
2007
-08
2006
-07
2005
-06
2004
-05
2003
-04
2002
-03
2001
-02
2000
-01
1999
-00
1998
-99
1997
-98
1996
-97
1995
-96
1994
-95
1993
-94
1992
-93
1991
-92
Figure 26 China’s crude steel production and iron ore imports Source: World Steel Association and TEX Report
Millio
n ton
nes
China Crude Steel ProductionChina Iron Ore Imports
0
100
200
300
400
500
600
700
800
900
Millio
n ton
nes
Rest of AustraliaWestern Australia
Figure 25 WA iron ore production v rest of Australia Source: DMIRS and DIIS
2007
2008
2009
2010
2011
2017
2016
2015
2014
2013
2012
development with first production expected by 2021. Similarly, FMG approved the $1.7 billion, 30 million tonnes per annum Eliwana project. Both projects are aimed at maintaining current production levels.
The major commodities resources data file contains:
• quarterly production and sales value figures for iron ore in WA
• historic annual average price of iron ore and recent monthly prices
• value of iron ore exports from WA by destination
• annual historic iron ore production in WA compared to the rest of Australia
• annual historic calendar year iron ore imports and crude steel production in China since 1980 and a detailed breakdown of iron ore imports to China, including Australia’s contribution
• annual historic financial year iron ore imports and crude steel production in China since 1990–91 and a detailed breakdown of iron ore imports to China, including Australia’s contribution.
WESTERN AUSTRALIAN MINERAL AND PETROLEUM STATISTICS DIGEST 2017–18WESTERN AUSTRALIAN MINERAL AND PETROLEUM STATISTICS DIGEST 2017–1822
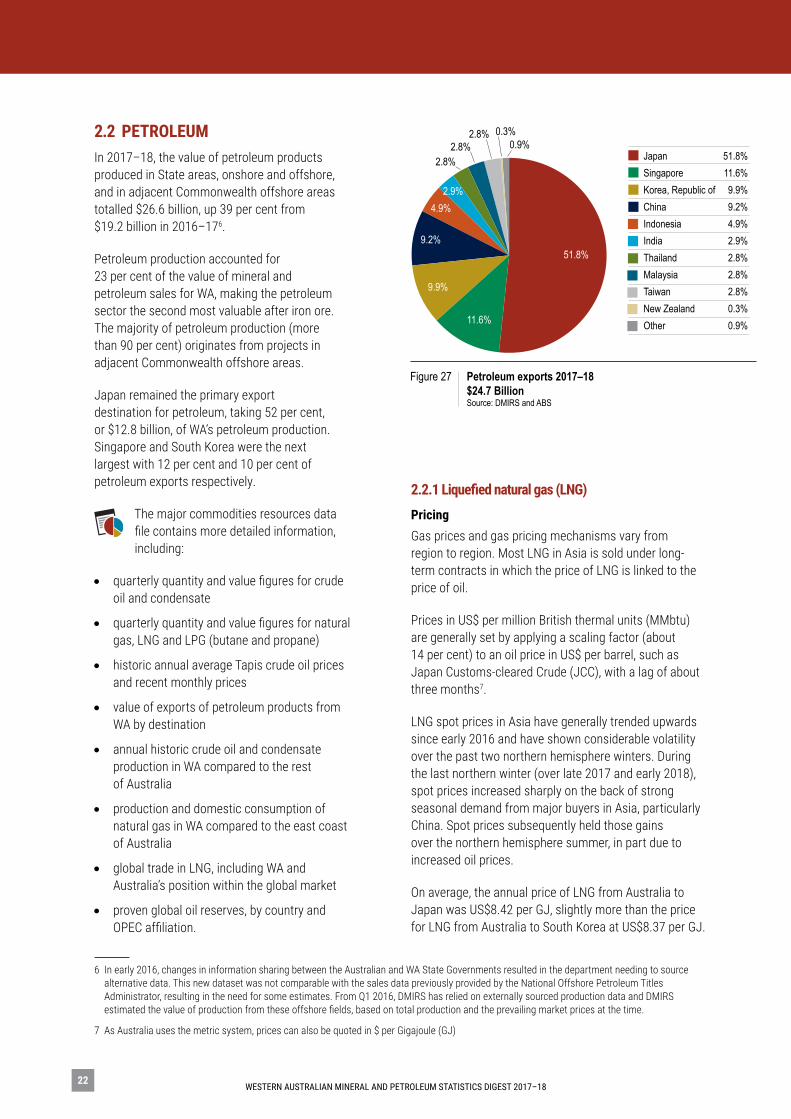
Figure 27 Petroleum exports 2017–18 $24.7 Billion Source: DMIRS and ABS
Japan 51.8%Singapore 11.6%Korea, Republic of 9.9%China 9.2%Indonesia 4.9%India 2.9%Thailand 2.8%Malaysia 2.8%Taiwan 2.8%New Zealand 0.3%Other 0.9%11.6%
4.9%2.9%
2.8%2.8%
2.8% 0.3%0.9%
9.9%
9.2%51.8%
2.2 PETROLEUM In 2017–18, the value of petroleum products produced in State areas, onshore and offshore, and in adjacent Commonwealth offshore areas totalled $26.6 billion, up 39 per cent from $19.2 billion in 2016–176.
Petroleum production accounted for 23 per cent of the value of mineral and petroleum sales for WA, making the petroleum sector the second most valuable after iron ore. The majority of petroleum production (more than 90 per cent) originates from projects in adjacent Commonwealth offshore areas.
Japan remained the primary export destination for petroleum, taking 52 per cent, or $12.8 billion, of WA’s petroleum production. Singapore and South Korea were the next largest with 12 per cent and 10 per cent of petroleum exports respectively.
The major commodities resources data file contains more detailed information, including:
• quarterly quantity and value figures for crude oil and condensate
• quarterly quantity and value figures for natural gas, LNG and LPG (butane and propane)
• historic annual average Tapis crude oil prices and recent monthly prices
• value of exports of petroleum products from WA by destination
• annual historic crude oil and condensate production in WA compared to the rest of Australia
• production and domestic consumption of natural gas in WA compared to the east coast of Australia
• global trade in LNG, including WA and Australia’s position within the global market
• proven global oil reserves, by country and OPEC affiliation.
2.2.1 Liquefied natural gas (LNG)
PricingGas prices and gas pricing mechanisms vary from region to region. Most LNG in Asia is sold under long-term contracts in which the price of LNG is linked to the price of oil.
Prices in US$ per million British thermal units (MMbtu) are generally set by applying a scaling factor (about 14 per cent) to an oil price in US$ per barrel, such as Japan Customs-cleared Crude (JCC), with a lag of about three months7.
LNG spot prices in Asia have generally trended upwards since early 2016 and have shown considerable volatility over the past two northern hemisphere winters. During the last northern winter (over late 2017 and early 2018), spot prices increased sharply on the back of strong seasonal demand from major buyers in Asia, particularly China. Spot prices subsequently held those gains over the northern hemisphere summer, in part due to increased oil prices.
On average, the annual price of LNG from Australia to Japan was US$8.42 per GJ, slightly more than the price for LNG from Australia to South Korea at US$8.37 per GJ.
6 In early 2016, changes in information sharing between the Australian and WA State Governments resulted in the department needing to source alternative data. This new dataset was not comparable with the sales data previously provided by the National Offshore Petroleum Titles Administrator, resulting in the need for some estimates. From Q1 2016, DMIRS has relied on externally sourced production data and DMIRS estimated the value of production from these offshore fields, based on total production and the prevailing market prices at the time.
7 As Australia uses the metric system, prices can also be quoted in $ per Gigajoule (GJ)
WESTERN AUSTRALIAN MINERAL AND PETROLEUM STATISTICS DIGEST 2017–18WESTERN AUSTRALIAN MINERAL AND PETROLEUM STATISTICS DIGEST 2017–18 23
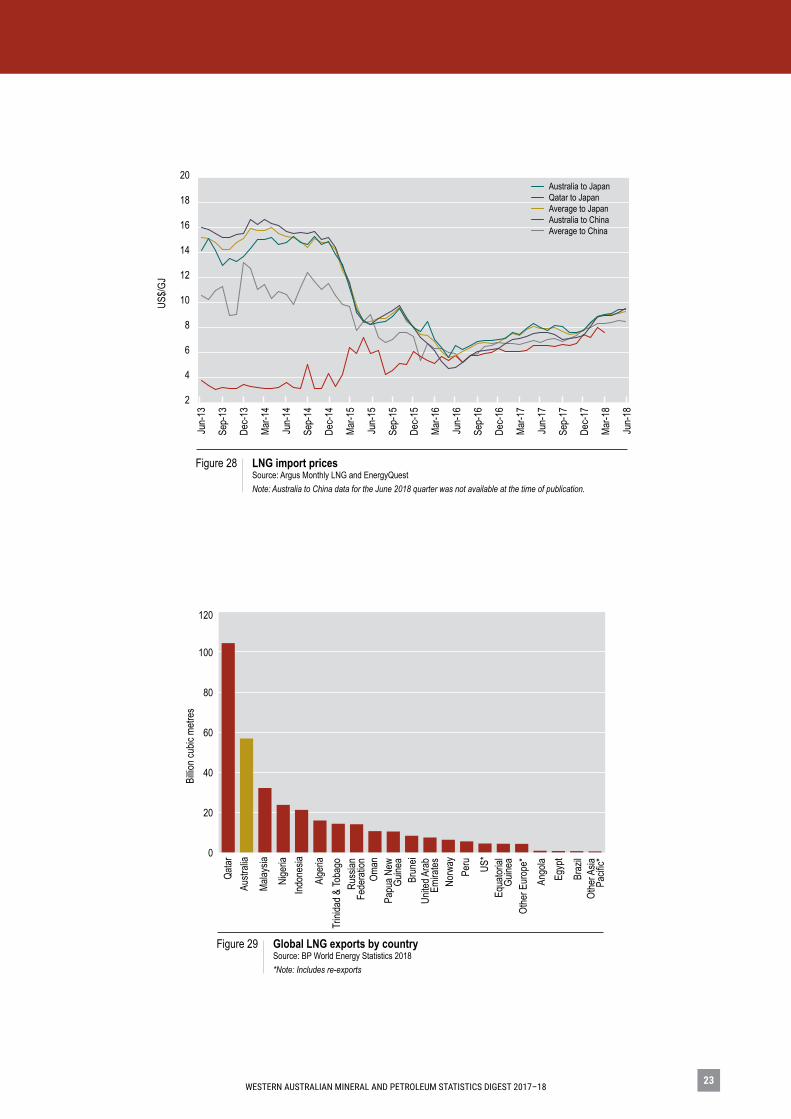
Figure 28 LNG import prices Source: Argus Monthly LNG and EnergyQuest Note: Australia to China data for the June 2018 quarter was not available at the time of publication.
2
4
6
8
10
12
14
16
18
20US
$/GJ
Australia to Japan Qatar to Japan Average to Japan Australia to ChinaAverage to China
Jun-
13
Sep-
13
Dec-1
3
Mar-1
4
Jun-
14
Sep-
14
Dec-1
4
Mar-1
5
Jun-
15
Sep-
15
Dec-1
5
Mar-1
6
Jun-
16
Sep-
16
Dec-1
6
Mar-1
7
Jun-
17
Sep-
17
Dec-1
7
Mar-1
8
Jun-
18
0
20
40
60
80
100
120
Figure 29 Global LNG exports by country Source: BP World Energy Statistics 2018 *Note: Includes re-exports
Billio
n cub
ic me
tres
Norw
ay
Equa
torial
Guine
a
Peru
Ango
la
Othe
r Asia
Pac
ific*
US*
Brun
ei
Oman
Russ
ianFe
dera
tion
Papu
a New
Guine
a
Unite
d Ara
b E
mira
tes
Alge
riaTr
inida
d & To
bago
Indon
esia
Nige
ria
Austr
alia
Malay
sia
Qatar
Egyp
t
Braz
il
Othe
r Eur
ope*
WESTERN AUSTRALIAN MINERAL AND PETROLEUM STATISTICS DIGEST 2017–18WESTERN AUSTRALIAN MINERAL AND PETROLEUM STATISTICS DIGEST 2017–1824
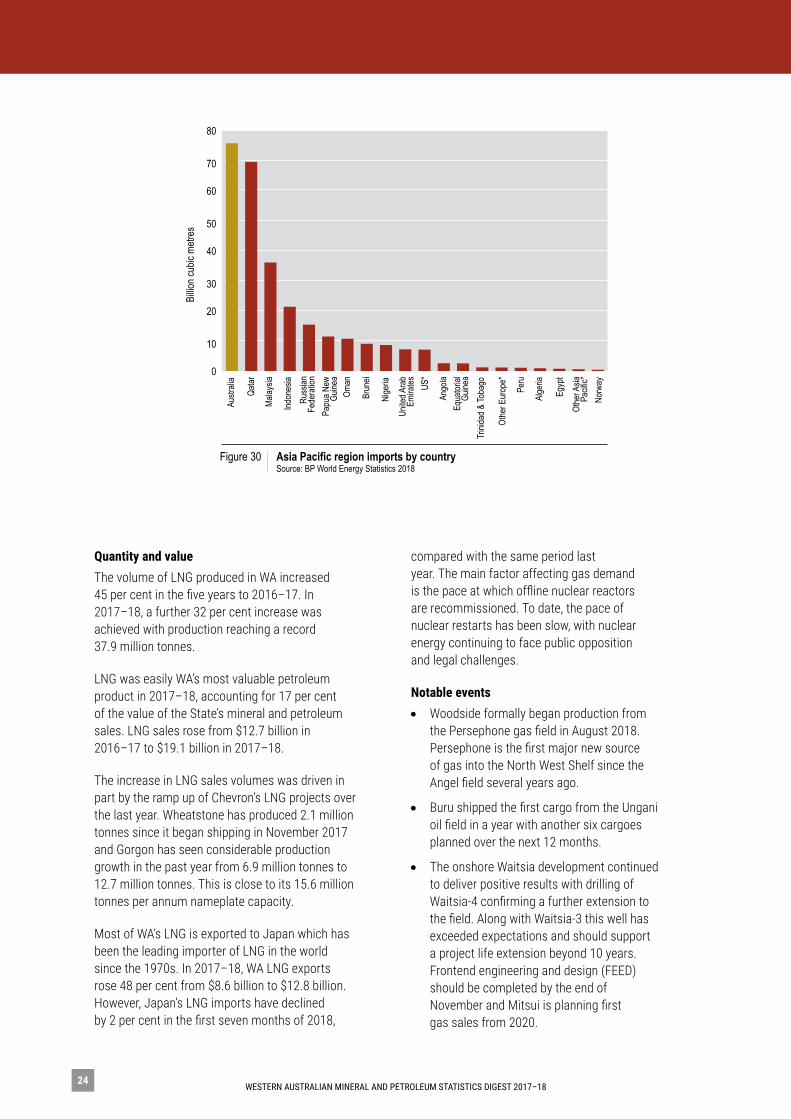
Quantity and valueThe volume of LNG produced in WA increased 45 per cent in the five years to 2016–17. In 2017–18, a further 32 per cent increase was achieved with production reaching a record 37.9 million tonnes.
LNG was easily WA’s most valuable petroleum product in 2017–18, accounting for 17 per cent of the value of the State’s mineral and petroleum sales. LNG sales rose from $12.7 billion in 2016–17 to $19.1 billion in 2017–18.
The increase in LNG sales volumes was driven in part by the ramp up of Chevron’s LNG projects over the last year. Wheatstone has produced 2.1 million tonnes since it began shipping in November 2017 and Gorgon has seen considerable production growth in the past year from 6.9 million tonnes to 12.7 million tonnes. This is close to its 15.6 million tonnes per annum nameplate capacity.
Most of WA’s LNG is exported to Japan which has been the leading importer of LNG in the world since the 1970s. In 2017–18, WA LNG exports rose 48 per cent from $8.6 billion to $12.8 billion. However, Japan’s LNG imports have declined by 2 per cent in the first seven months of 2018,
compared with the same period last year. The main factor affecting gas demand is the pace at which offline nuclear reactors are recommissioned. To date, the pace of nuclear restarts has been slow, with nuclear energy continuing to face public opposition and legal challenges.
Notable events• Woodside formally began production from
the Persephone gas field in August 2018. Persephone is the first major new source of gas into the North West Shelf since the Angel field several years ago.
• Buru shipped the first cargo from the Ungani oil field in a year with another six cargoes planned over the next 12 months.
• The onshore Waitsia development continued to deliver positive results with drilling of Waitsia-4 confirming a further extension to the field. Along with Waitsia-3 this well has exceeded expectations and should support a project life extension beyond 10 years. Frontend engineering and design (FEED) should be completed by the end of November and Mitsui is planning first gas sales from 2020.
0
10
20
30
40
50
60
70
80
Nor
way
Othe
r Asia
Pa
cific*
Egy
pt
Alge
ria
Per
u
Othe
r Eur
ope*
Trini
dad &
Toba
go
Equ
atoria
l Gu
inea
Ang
ola
US*
Unit
ed A
rab
Emira
tes
Nige
ria
Bru
nei
Oma
n
Pap
ua N
ew
Guine
a
Rus
sian
Fede
ratio
n
Indo
nesia
Mala
ysia
Qata
r
Aus
tralia
Figure 30 Asia Pacific region imports by country Source: BP World Energy Statistics 2018
Billio
n cub
ic me
tres
WESTERN AUSTRALIAN MINERAL AND PETROLEUM STATISTICS DIGEST 2017–18WESTERN AUSTRALIAN MINERAL AND PETROLEUM STATISTICS DIGEST 2017–18 25
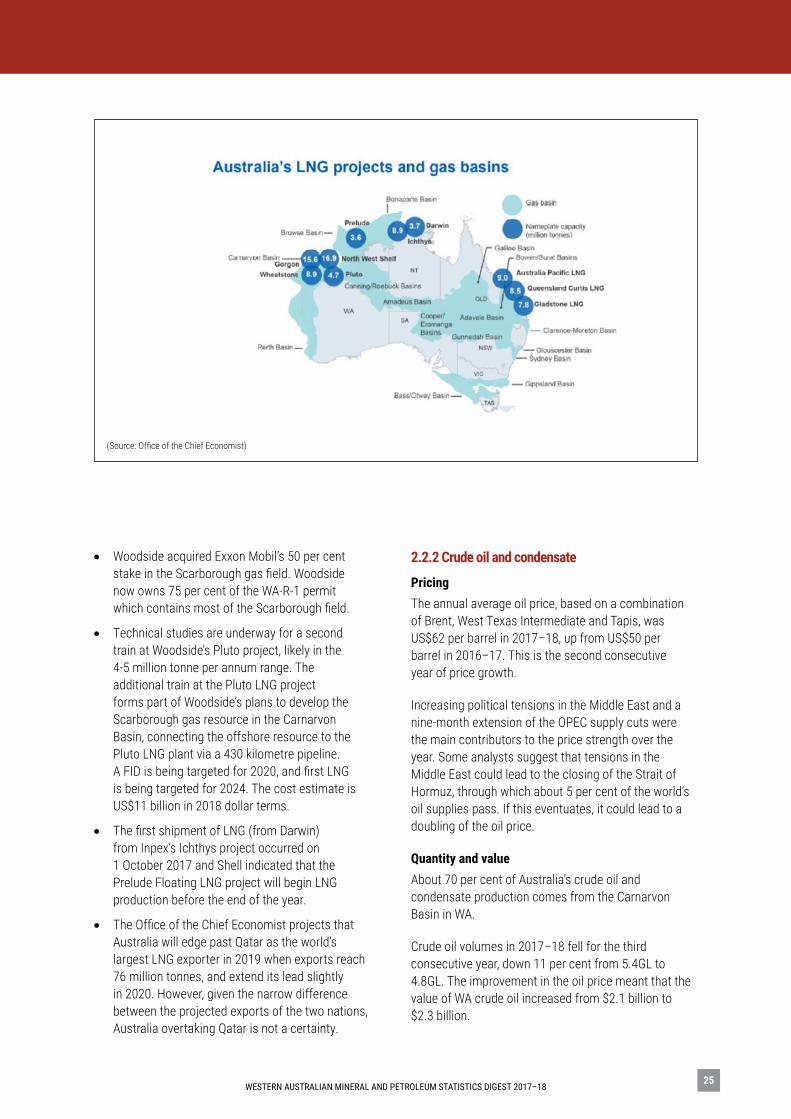
• Woodside acquired Exxon Mobil’s 50 per cent stake in the Scarborough gas field. Woodside now owns 75 per cent of the WA-R-1 permit which contains most of the Scarborough field.
• Technical studies are underway for a second train at Woodside’s Pluto project, likely in the 4-5 million tonne per annum range. The additional train at the Pluto LNG project forms part of Woodside’s plans to develop the Scarborough gas resource in the Carnarvon Basin, connecting the offshore resource to the Pluto LNG plant via a 430 kilometre pipeline. A FID is being targeted for 2020, and first LNG is being targeted for 2024. The cost estimate is US$11 billion in 2018 dollar terms.
• The first shipment of LNG (from Darwin) from Inpex’s Ichthys project occurred on 1 October 2017 and Shell indicated that the Prelude Floating LNG project will begin LNG production before the end of the year.
• The Office of the Chief Economist projects that Australia will edge past Qatar as the world’s largest LNG exporter in 2019 when exports reach 76 million tonnes, and extend its lead slightly in 2020. However, given the narrow difference between the projected exports of the two nations, Australia overtaking Qatar is not a certainty.
2.2.2 Crude oil and condensate
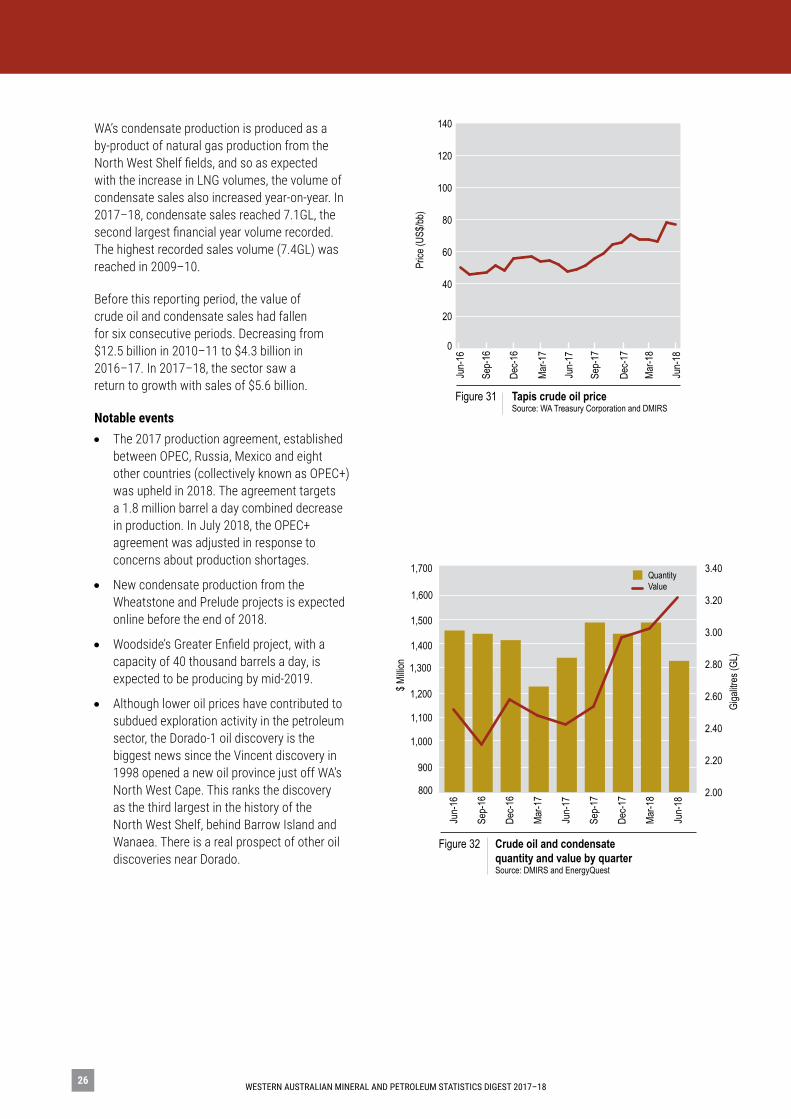
PricingThe annual average oil price, based on a combination of Brent, West Texas Intermediate and Tapis, was US$62 per barrel in 2017–18, up from US$50 per barrel in 2016–17. This is the second consecutive year of price growth.
Increasing political tensions in the Middle East and a nine-month extension of the OPEC supply cuts were the main contributors to the price strength over the year. Some analysts suggest that tensions in the Middle East could lead to the closing of the Strait of Hormuz, through which about 5 per cent of the world’s oil supplies pass. If this eventuates, it could lead to a doubling of the oil price.
Quantity and valueAbout 70 per cent of Australia’s crude oil and condensate production comes from the Carnarvon Basin in WA.
Crude oil volumes in 2017–18 fell for the third consecutive year, down 11 per cent from 5.4GL to 4.8GL. The improvement in the oil price meant that the value of WA crude oil increased from $2.1 billion to $2.3 billion.
(Source: Office of the Chief Economist)
WESTERN AUSTRALIAN MINERAL AND PETROLEUM STATISTICS DIGEST 2017–18WESTERN AUSTRALIAN MINERAL AND PETROLEUM STATISTICS DIGEST 2017–1826
WA’s condensate production is produced as a by-product of natural gas production from the North West Shelf fields, and so as expected with the increase in LNG volumes, the volume of condensate sales also increased year-on-year. In 2017–18, condensate sales reached 7.1GL, the second largest financial year volume recorded. The highest recorded sales volume (7.4GL) was reached in 2009–10.
Before this reporting period, the value of crude oil and condensate sales had fallen for six consecutive periods. Decreasing from $12.5 billion in 2010–11 to $4.3 billion in 2016–17. In 2017–18, the sector saw a return to growth with sales of $5.6 billion.
Notable events• The 2017 production agreement, established
between OPEC, Russia, Mexico and eight other countries (collectively known as OPEC+) was upheld in 2018. The agreement targets a 1.8 million barrel a day combined decrease in production. In July 2018, the OPEC+ agreement was adjusted in response to concerns about production shortages.
• New condensate production from the Wheatstone and Prelude projects is expected online before the end of 2018.
• Woodside’s Greater Enfield project, with a capacity of 40 thousand barrels a day, is expected to be producing by mid-2019.
• Although lower oil prices have contributed to subdued exploration activity in the petroleum sector, the Dorado-1 oil discovery is the biggest news since the Vincent discovery in 1998 opened a new oil province just off WA’s North West Cape. This ranks the discovery as the third largest in the history of the North West Shelf, behind Barrow Island and Wanaea. There is a real prospect of other oil discoveries near Dorado.
Giga
litres
(GL)
$ Milli
on
Figure 32 Crude oil and condensate quantity and value by quarter Source: DMIRS and EnergyQuest
2.00
2.20
2.40
2.60
2.80
3.00
3.20
3.40
Jun-
18
Mar-1
8
Dec-1
7
Sep-
17
Jun-
17
Mar-1
7
Dec-1
6
Sep-
16
Jun-
16
800
900
1,000
1,100
1,200
1,300
1,400
1,500
1,600
1,700QuantityValue
Figure 31 Tapis crude oil price Source: WA Treasury Corporation and DMIRS
0
20
40
60
80
100
120
140
Jun-
18
Dec-1
7
Jun-
17
Mar-1
7
Mar-1
8
Dec-1
6
Jun-
16
Sep-
16
Sep-
17
Price
(US$
/bb)
WESTERN AUSTRALIAN MINERAL AND PETROLEUM STATISTICS DIGEST 2017–18WESTERN AUSTRALIAN MINERAL AND PETROLEUM STATISTICS DIGEST 2017–18 27
0
5
10
15
20
25
30
35
40
45
2017
2007
1997
1987
1977
1967
Giga
litres
Rest of AustraliaWestern Australia
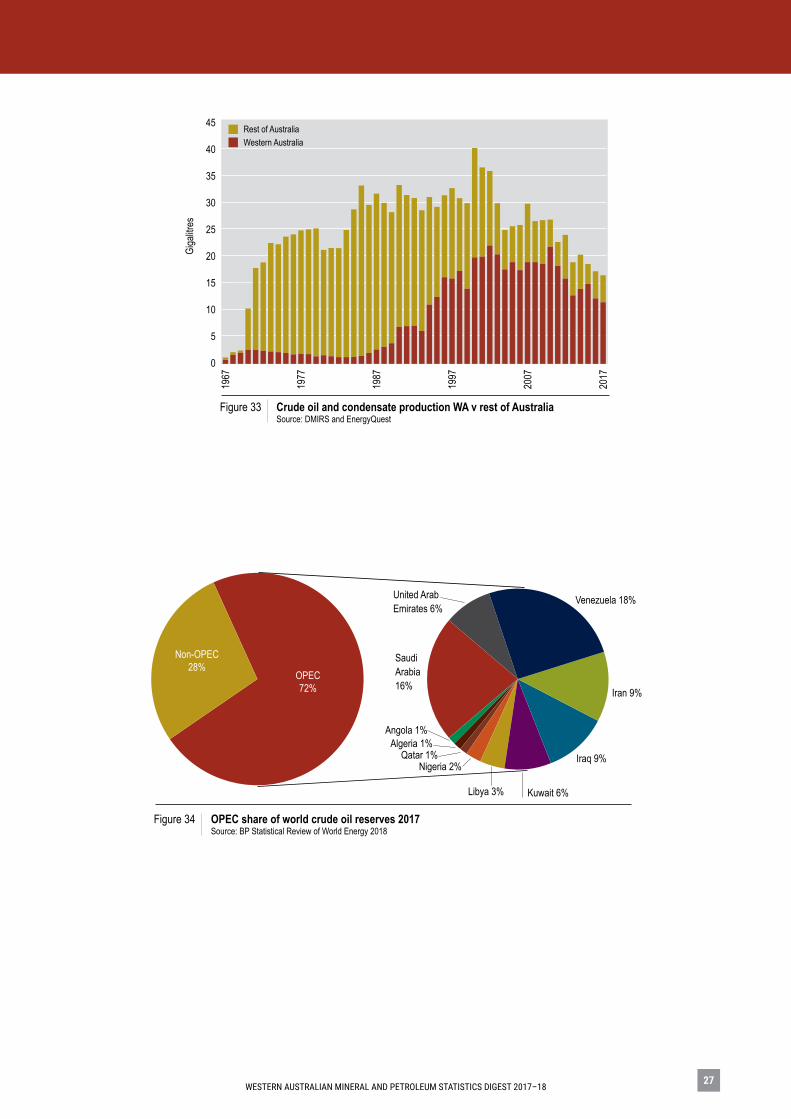
Figure 33 Crude oil and condensate production WA v rest of Australia Source: DMIRS and EnergyQuest
Figure 34 OPEC share of world crude oil reserves 2017 Source: BP Statistical Review of World Energy 2018
Venezuela 18%
Algeria 1%Angola 1%
Iran 9%
Iraq 9%
Saudi Arabia 16%
United Arab Emirates 6%
Qatar 1%Nigeria 2%
Libya 3% Kuwait 6%
OPEC72%
Non-OPEC28%

WESTERN AUSTRALIAN MINERAL AND PETROLEUM STATISTICS DIGEST 2017–18WESTERN AUSTRALIAN MINERAL AND PETROLEUM STATISTICS DIGEST 2017–1828
2.2.3 Domestic natural gas supply
PricingIn 2017–18, the average price of gas sold into the Dampier to Bunbury Natural Gas Pipeline (DBNGP), Parmelia pipeline and Goldfields pipeline was $4.28 per gigajoule (GJ), representing a decrease of almost 14 per cent from the 2016–17 average of $4.96/GJ.
WA has ample supply of domestic gas over the short to mid-term and is about to be further supplemented with supply from the Wheatstone project, expected in
November 2018. This will likely place more downwards pressure on WA’s domestic gas prices over the short to mid-term. Longer term, prices are likely to increase as large domestic gas supply contracts come to an end.
Quantity and valueIn 2017–18, the quantity of natural gas supplied into the domestic market increased from 393PJ (9.7 billion cubic metres) to 374PJ (10 billion cubic metres), the second highest volume recorded.
The value of domestic gas sales is based on the total sales value at the points of entry into the DBNGP,
Figure 35 Average quarterly natural gas price Source: EnergyQuest and DMIRS
0.00.51.01.52.02.53.03.54.04.55.05.56.06.5
A$/G
j
WA domgasEast Coast domgas
Sep-
13
Jun-
13
Mar-1
3
Mar-1
4
Jun-
14
Sep-
14
Dec-1
4
Mar-1
5
Jun-
15
Sep-
15
Dec-1
3
Dec-1
5
Mar-1
6
Jun-
16
Sep-
16
Dec-1
6
Mar-1
7
Jun-
17
Sep-
17
Dec-1
7
Mar-1
8
Jun-
18
Figure 36 Western Australian average domestic natural gas price Source: DMIRS The value of Western Australian domestic gas sales is based on the summation of total domestic gas sale values as at the point of entry into the Dampier to Bunbury Natural Gas Pipeline (DBNGP) or where applicable, the Parmelia and Goldfields pipeline.
$/GJ
A$/GJUS$/GJ
0.0
0.5
1.0
1.5
2.0
2.5
3.0
3.5
4.0
4.5
5.0
5.5
2017
-18
2016
-17
2015
-16
2014
-15
2013
-14
2012
-13
2011
-12
2010
-11
2009
-10
2008
-09
2007
-08
2006
-07
2005
-06
2004
-05
2003
-04
2002
-03
2001
-02
2000
-01
1999
-00
1998
-99
1997
-98
1996
-97
WESTERN AUSTRALIAN MINERAL AND PETROLEUM STATISTICS DIGEST 2017–18WESTERN AUSTRALIAN MINERAL AND PETROLEUM STATISTICS DIGEST 2017–18 29
Parmelia pipeline and Goldfields pipeline. The increase in domestic gas sales volumes was not enough to offset the lower prices and, as a result, the value of domestic gas sales decreased from $1.8 billion in 2016–17 to $1.6 billion in 2017–18.
The North West Shelf project is the largest contributor to Western Australia’s domestic gas supply, however this is expected to change as the project’s offshore gas fields near the end of their productive life and domestic gas contracts begin to end in the early 2020s.
If demand remains at current levels, the commissioning of new domestic gas plants by the Gorgon and Wheatstone LNG projects, and new commitments secured from the North West Shelf, should see the market well supplied into the mid-2020s. However, new sources of supply will be required beyond mid-2020.
Future supplies could come from:
• new domestic gas obligations for LNG producers tolling gas through the North West Shelf facility, such as from the Browse and Equus fields
• the implementation of the Pluto LNG Project’s domestic gas commitments
• development resources by existing or new domestic gas only projects.
Notable events• Woodside has executed a non-binding
memorandum of understanding with Perdaman Chemicals and Fertilisers to supply 125 TJ/d of domestic gas for use in a proposed 2 million tonnes per annum urea export plant in Karratha. Natural gas will be supplied from Woodside’s portfolio of domestic gas underpinned by the proposed Scarborough development. Supply is expected to start from the early 2020s for up to 20 to 25 years.
• Notwithstanding a plentiful supply of domestic gas, there was significant merger and acquisition activity in the reporting period. The Mitsui takeover of AWE and the Beach purchase of Lattice changed the ownership of the Waitsia field, with the two partners each holding 50 per cent, with Mitsui as operator. The field has proven and probable reserves of 800PJ.
• Santos successfully made a bid for Quadrant Energy, giving full ownership of Devil Creek and Varanus Island plus a share of Macedon and interests in two oil facilities, the Ningaloo Vision and Pyrenees. Santos now holds about 35 per cent of the WA domestic gas market.
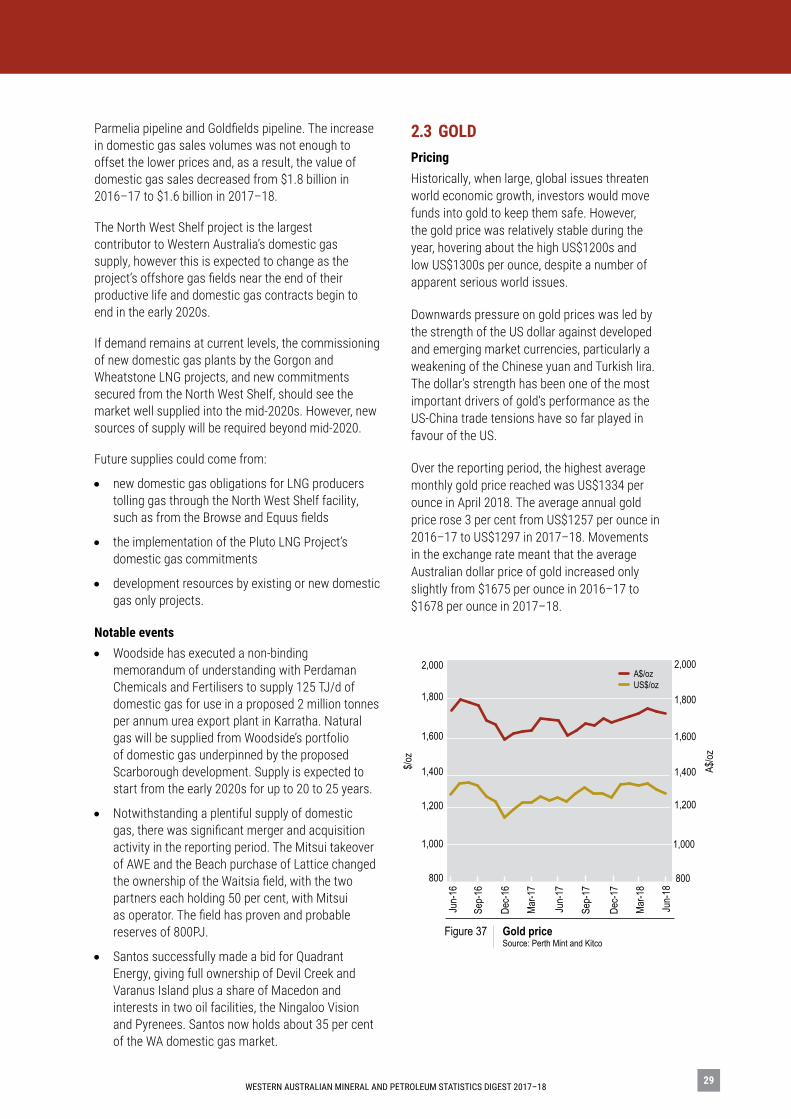
2.3 GOLD PricingHistorically, when large, global issues threaten world economic growth, investors would move funds into gold to keep them safe. However, the gold price was relatively stable during the year, hovering about the high US$1200s and low US$1300s per ounce, despite a number of apparent serious world issues.
Downwards pressure on gold prices was led by the strength of the US dollar against developed and emerging market currencies, particularly a weakening of the Chinese yuan and Turkish lira. The dollar’s strength has been one of the most important drivers of gold’s performance as the US-China trade tensions have so far played in favour of the US.
Over the reporting period, the highest average monthly gold price reached was US$1334 per ounce in April 2018. The average annual gold price rose 3 per cent from US$1257 per ounce in 2016–17 to US$1297 in 2017–18. Movements in the exchange rate meant that the average Australian dollar price of gold increased only slightly from $1675 per ounce in 2016–17 to $1678 per ounce in 2017–18.
Figure 37 Gold price Source: Perth Mint and Kitco
$/oz
A$/oz
A$/ozUS$/oz
800
1,000
1,200
1,400
1,600
1,800
2,000
800
1,000
1,200
1,400
1,600
1,800
2,000
Jun-
16
Sep-
16
Dec-1
6
Mar-1
7
Jun-
17
Sep-
17
Dec-1
7
Mar-1
8
Jun-
18
WESTERN AUSTRALIAN MINERAL AND PETROLEUM STATISTICS DIGEST 2017–18WESTERN AUSTRALIAN MINERAL AND PETROLEUM STATISTICS DIGEST 2017–1830
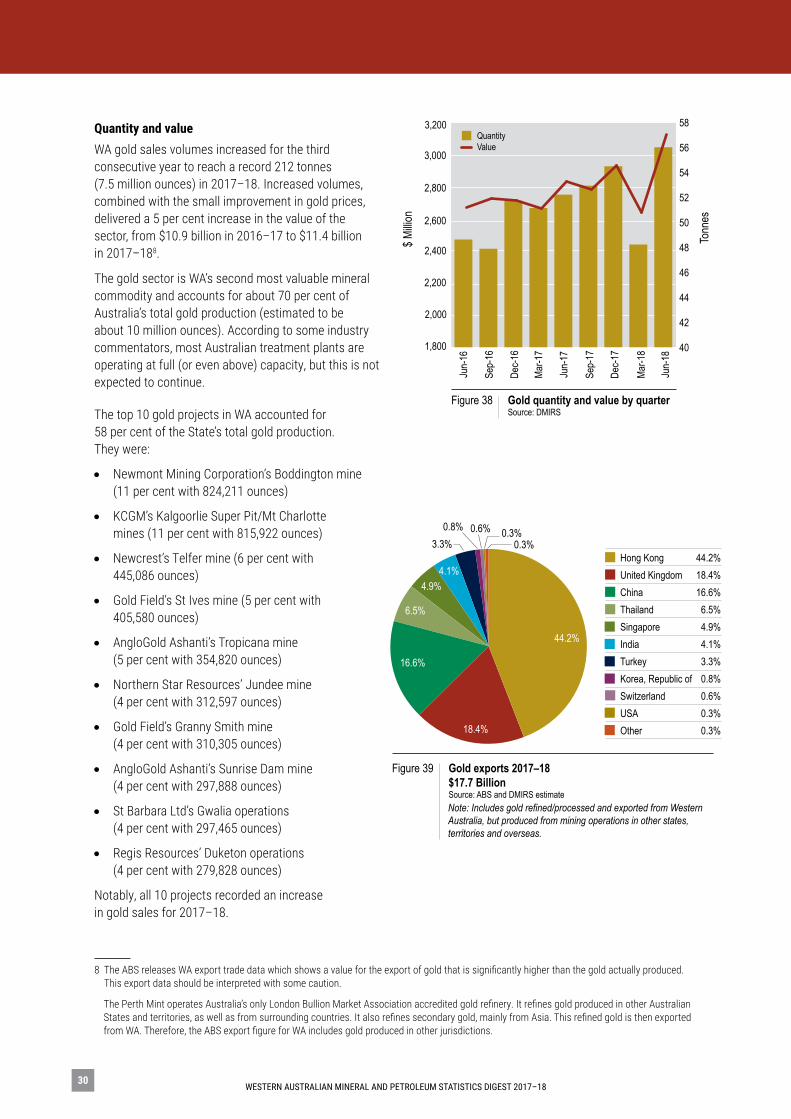
Quantity and valueWA gold sales volumes increased for the third consecutive year to reach a record 212 tonnes (7.5 million ounces) in 2017–18. Increased volumes, combined with the small improvement in gold prices, delivered a 5 per cent increase in the value of the sector, from $10.9 billion in 2016–17 to $11.4 billion in 2017–188.
The gold sector is WA’s second most valuable mineral commodity and accounts for about 70 per cent of Australia’s total gold production (estimated to be about 10 million ounces). According to some industry commentators, most Australian treatment plants are operating at full (or even above) capacity, but this is not expected to continue.
The top 10 gold projects in WA accounted for 58 per cent of the State’s total gold production. They were:
• Newmont Mining Corporation’s Boddington mine (11 per cent with 824,211 ounces)
• KCGM’s Kalgoorlie Super Pit/Mt Charlotte mines (11 per cent with 815,922 ounces)
• Newcrest’s Telfer mine (6 per cent with 445,086 ounces)
• Gold Field’s St Ives mine (5 per cent with 405,580 ounces)
• AngloGold Ashanti’s Tropicana mine (5 per cent with 354,820 ounces)
• Northern Star Resources’ Jundee mine (4 per cent with 312,597 ounces)
• Gold Field’s Granny Smith mine (4 per cent with 310,305 ounces)
• AngloGold Ashanti’s Sunrise Dam mine (4 per cent with 297,888 ounces)
• St Barbara Ltd’s Gwalia operations (4 per cent with 297,465 ounces)
• Regis Resources’ Duketon operations (4 per cent with 279,828 ounces)
Notably, all 10 projects recorded an increase in gold sales for 2017–18.
8 The ABS releases WA export trade data which shows a value for the export of gold that is significantly higher than the gold actually produced. This export data should be interpreted with some caution.
The Perth Mint operates Australia’s only London Bullion Market Association accredited gold refinery. It refines gold produced in other Australian States and territories, as well as from surrounding countries. It also refines secondary gold, mainly from Asia. This refined gold is then exported from WA. Therefore, the ABS export figure for WA includes gold produced in other jurisdictions.
$ Milli
on
Tonn
es
Figure 38 Gold quantity and value by quarter Source: DMIRS
40
42
44
46
48
50
52
54
56
58
1,800
2,000
2,200
2,400
2,600
2,800
3,000
3,200QuantityValue
Jun-
18
Mar-1
8
Dec-1
7
Jun-
17
Sep-
17
Dec-1
6
Jun-
16
Sep-
16
Mar-1
7
Figure 39 Gold exports 2017–18 $17.7 Billion Source: ABS and DMIRS estimate
Hong Kong 44.2%United Kingdom 18.4%China 16.6%Thailand 6.5%Singapore 4.9%India 4.1%Turkey 3.3%Korea, Republic of 0.8%Switzerland 0.6%USA 0.3%Other 0.3%
3.3%0.8% 0.6% 0.3%
0.3%
44.2%
Note: Includes gold refined/processed and exported from Western Australia, but produced from mining operations in other states, territories and overseas.
6.5%
4.9%4.1%
16.6%
18.4%
WESTERN AUSTRALIAN MINERAL AND PETROLEUM STATISTICS DIGEST 2017–18WESTERN AUSTRALIAN MINERAL AND PETROLEUM STATISTICS DIGEST 2017–18 31
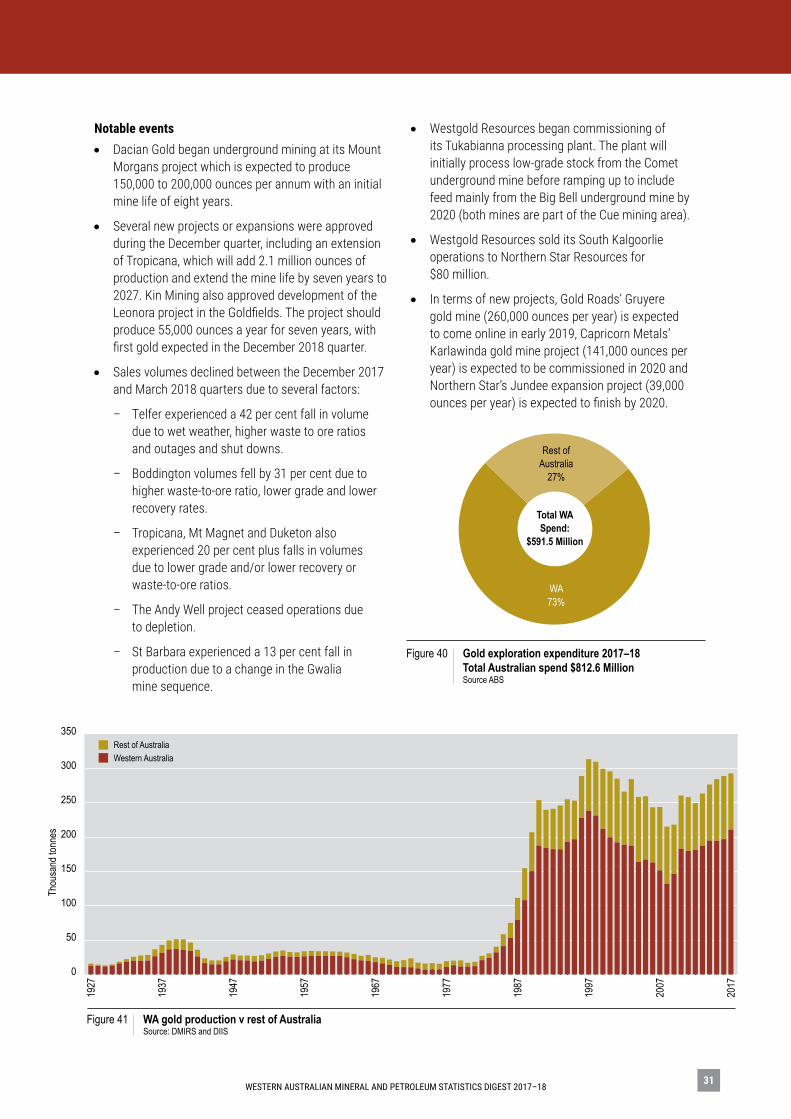
Notable events• Dacian Gold began underground mining at its Mount
Morgans project which is expected to produce 150,000 to 200,000 ounces per annum with an initial mine life of eight years.
• Several new projects or expansions were approved during the December quarter, including an extension of Tropicana, which will add 2.1 million ounces of production and extend the mine life by seven years to 2027. Kin Mining also approved development of the Leonora project in the Goldfields. The project should produce 55,000 ounces a year for seven years, with first gold expected in the December 2018 quarter.
• Sales volumes declined between the December 2017 and March 2018 quarters due to several factors:
– Telfer experienced a 42 per cent fall in volume due to wet weather, higher waste to ore ratios and outages and shut downs.
– Boddington volumes fell by 31 per cent due to higher waste-to-ore ratio, lower grade and lower recovery rates.
– Tropicana, Mt Magnet and Duketon also experienced 20 per cent plus falls in volumes due to lower grade and/or lower recovery or waste-to-ore ratios.
– The Andy Well project ceased operations due to depletion.
– St Barbara experienced a 13 per cent fall in production due to a change in the Gwalia mine sequence.
• Westgold Resources began commissioning of its Tukabianna processing plant. The plant will initially process low-grade stock from the Comet underground mine before ramping up to include feed mainly from the Big Bell underground mine by 2020 (both mines are part of the Cue mining area).
• Westgold Resources sold its South Kalgoorlie operations to Northern Star Resources for $80 million.
• In terms of new projects, Gold Roads’ Gruyere gold mine (260,000 ounces per year) is expected to come online in early 2019, Capricorn Metals’ Karlawinda gold mine project (141,000 ounces per year) is expected to be commissioned in 2020 and Northern Star’s Jundee expansion project (39,000 ounces per year) is expected to finish by 2020.
Figure 40 Gold exploration expenditure 2017–18 Total Australian spend $812.6 Million Source ABS
Rest ofAustralia
27%
WA73%
Total WASpend:
$591.5 Million
Thou
sand
tonn
es
0
50
100
150
200
250
300
35020
17
2007
1997
1987
1977
1967
1957
1947
1937
1927
Rest of AustraliaWestern Australia
Figure 41 WA gold production v rest of Australia Source: DMIRS and DIIS
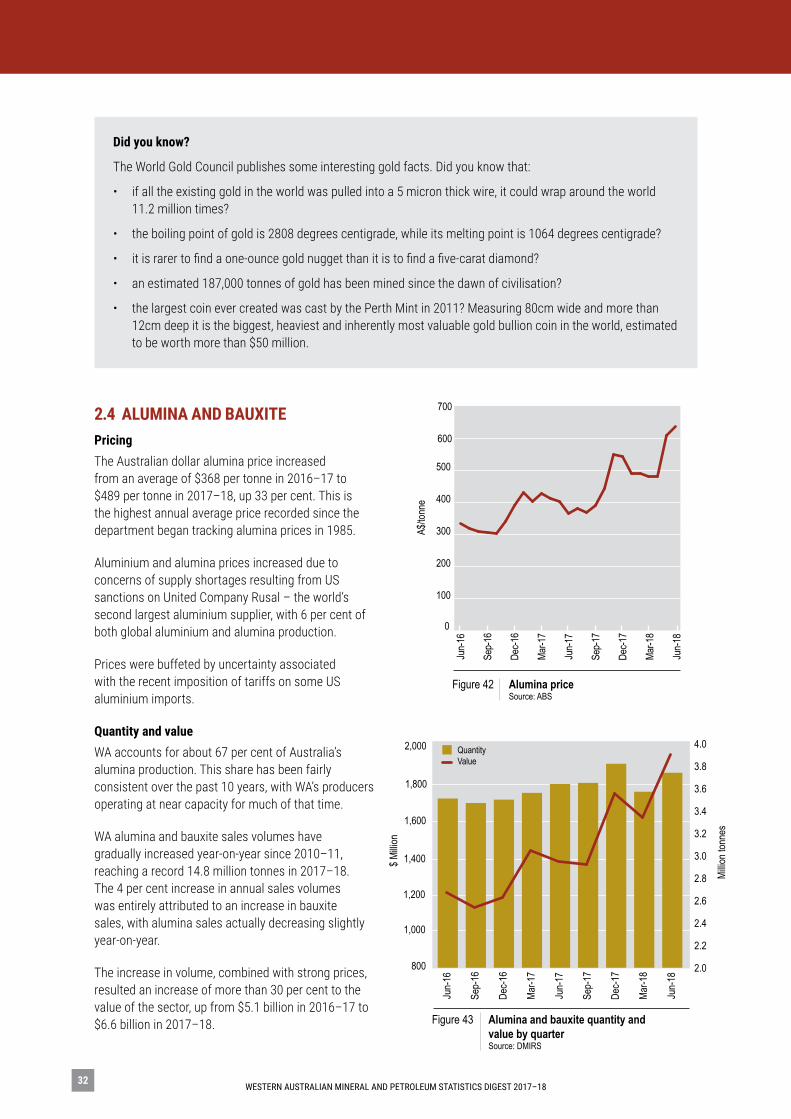
WESTERN AUSTRALIAN MINERAL AND PETROLEUM STATISTICS DIGEST 2017–18WESTERN AUSTRALIAN MINERAL AND PETROLEUM STATISTICS DIGEST 2017–1832
0
100
200
300
400
500
600
700A$
/tonn
e
Figure 42 Alumina price Source: ABS
Jun-
18
Dec-1
7
Mar-1
8
Jun-
17
Sep-
17
Dec-1
6
Mar-1
7
Jun-
16
Sep-
16
$ Milli
on
2.0
2.2
2.4
2.6
2.8
3.0
3.2
3.4
3.6
3.8
4.0
Jun-
18
Mar-1
8
Dec-1
7
Sep-
17
Jun-
17
Mar-1
7
Dec-1
6
Sep-
16
Jun-
16
800
1,000
1,200
1,400
1,600
1,800
2,000 QuantityValue
Figure 43 Alumina and bauxite quantity and value by quarter Source: DMIRS
Millio
n ton
nes
Did you know?
The World Gold Council publishes some interesting gold facts. Did you know that:
• if all the existing gold in the world was pulled into a 5 micron thick wire, it could wrap around the world 11.2 million times?
• the boiling point of gold is 2808 degrees centigrade, while its melting point is 1064 degrees centigrade?
• it is rarer to find a one-ounce gold nugget than it is to find a five-carat diamond?
• an estimated 187,000 tonnes of gold has been mined since the dawn of civilisation?
• the largest coin ever created was cast by the Perth Mint in 2011? Measuring 80cm wide and more than 12cm deep it is the biggest, heaviest and inherently most valuable gold bullion coin in the world, estimated to be worth more than $50 million.
2.4 ALUMINA AND BAUXITEPricingThe Australian dollar alumina price increased from an average of $368 per tonne in 2016–17 to $489 per tonne in 2017–18, up 33 per cent. This is the highest annual average price recorded since the department began tracking alumina prices in 1985.
Aluminium and alumina prices increased due to concerns of supply shortages resulting from US sanctions on United Company Rusal – the world’s second largest aluminium supplier, with 6 per cent of both global aluminium and alumina production.
Prices were buffeted by uncertainty associated with the recent imposition of tariffs on some US aluminium imports.
Quantity and valueWA accounts for about 67 per cent of Australia’s alumina production. This share has been fairly consistent over the past 10 years, with WA’s producers operating at near capacity for much of that time.
WA alumina and bauxite sales volumes have gradually increased year-on-year since 2010–11, reaching a record 14.8 million tonnes in 2017–18. The 4 per cent increase in annual sales volumes was entirely attributed to an increase in bauxite sales, with alumina sales actually decreasing slightly year-on-year.
The increase in volume, combined with strong prices, resulted an increase of more than 30 per cent to the value of the sector, up from $5.1 billion in 2016–17 to $6.6 billion in 2017–18.
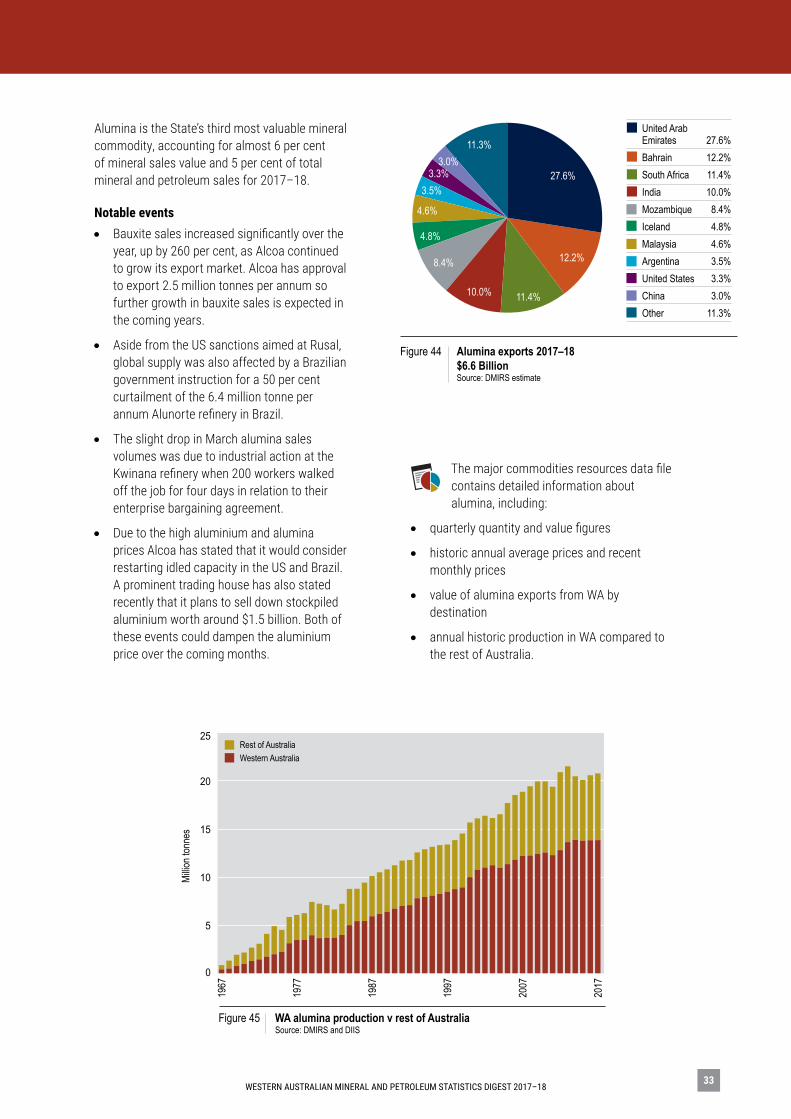
WESTERN AUSTRALIAN MINERAL AND PETROLEUM STATISTICS DIGEST 2017–18WESTERN AUSTRALIAN MINERAL AND PETROLEUM STATISTICS DIGEST 2017–18 33
Alumina is the State’s third most valuable mineral commodity, accounting for almost 6 per cent of mineral sales value and 5 per cent of total mineral and petroleum sales for 2017–18.
Notable events• Bauxite sales increased significantly over the
year, up by 260 per cent, as Alcoa continued to grow its export market. Alcoa has approval to export 2.5 million tonnes per annum so further growth in bauxite sales is expected in the coming years.
• Aside from the US sanctions aimed at Rusal, global supply was also affected by a Brazilian government instruction for a 50 per cent curtailment of the 6.4 million tonne per annum Alunorte refinery in Brazil.
• The slight drop in March alumina sales volumes was due to industrial action at the Kwinana refinery when 200 workers walked off the job for four days in relation to their enterprise bargaining agreement.
• Due to the high aluminium and alumina prices Alcoa has stated that it would consider restarting idled capacity in the US and Brazil. A prominent trading house has also stated recently that it plans to sell down stockpiled aluminium worth around $1.5 billion. Both of these events could dampen the aluminium price over the coming months.
Figure 44 Alumina exports 2017–18 $6.6 Billion Source: DMIRS estimate
United Arab Emirates 27.6%Bahrain 12.2%South Africa 11.4%India 10.0%Mozambique 8.4%Iceland 4.8%Malaysia 4.6%Argentina 3.5%United States 3.3%China 3.0%Other 11.3%
27.6%
12.2%
11.4%10.0%
8.4%
4.8%
4.6%
3.5%3.3%
3.0%11.3%
0
5
10
15
20
25
2017
2007
1997
1987
1977
1967
Millio
n ton
nes
Rest of AustraliaWestern Australia
Figure 45 WA alumina production v rest of Australia Source: DMIRS and DIIS
The major commodities resources data file contains detailed information about alumina, including:
• quarterly quantity and value figures
• historic annual average prices and recent monthly prices
• value of alumina exports from WA by destination
• annual historic production in WA compared to the rest of Australia.
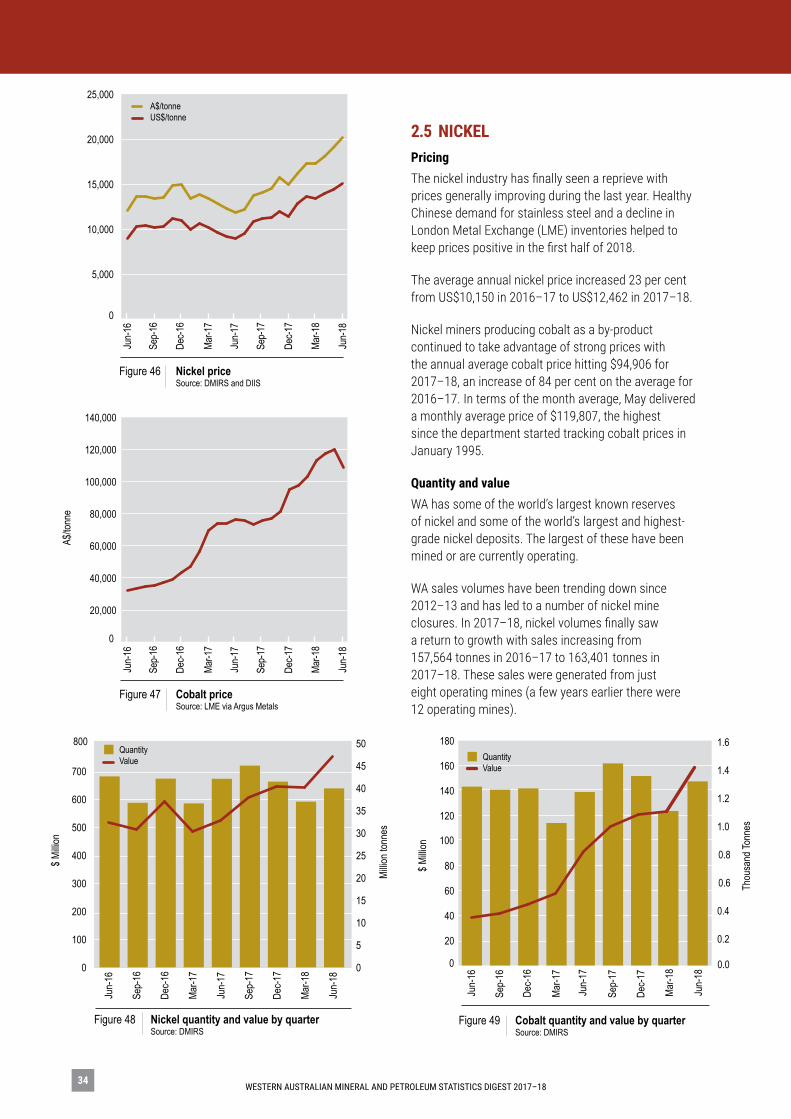
WESTERN AUSTRALIAN MINERAL AND PETROLEUM STATISTICS DIGEST 2017–18WESTERN AUSTRALIAN MINERAL AND PETROLEUM STATISTICS DIGEST 2017–1834
2.5 NICKEL PricingThe nickel industry has finally seen a reprieve with prices generally improving during the last year. Healthy Chinese demand for stainless steel and a decline in London Metal Exchange (LME) inventories helped to keep prices positive in the first half of 2018.
The average annual nickel price increased 23 per cent from US$10,150 in 2016–17 to US$12,462 in 2017–18.
Nickel miners producing cobalt as a by-product continued to take advantage of strong prices with the annual average cobalt price hitting $94,906 for 2017–18, an increase of 84 per cent on the average for 2016–17. In terms of the month average, May delivered a monthly average price of $119,807, the highest since the department started tracking cobalt prices in January 1995.
Quantity and valueWA has some of the world’s largest known reserves of nickel and some of the world’s largest and highest-grade nickel deposits. The largest of these have been mined or are currently operating.
WA sales volumes have been trending down since 2012–13 and has led to a number of nickel mine closures. In 2017–18, nickel volumes finally saw a return to growth with sales increasing from 157,564 tonnes in 2016–17 to 163,401 tonnes in 2017–18. These sales were generated from just eight operating mines (a few years earlier there were 12 operating mines).
0
5,000
10,000
15,000
20,000
25,000
Figure 46 Nickel price Source: DMIRS and DIIS
A$/tonne US$/tonne
Jun-
18
Dec-1
7
Mar-1
8
Jun-
17
Sep-
17
Dec-1
6
Mar-1
7
Jun-
16
Sep-
16
0
20,000
40,000
60,000
80,000
100,000
120,000
140,000
Figure 47 Cobalt price Source: LME via Argus Metals
Jun-
18
Dec-1
7
Mar-1
8
Jun-
17
Sep-
17
Dec-1
6
Mar-1
7
Jun-
16
Sep-
16
A$/to
nne
$ Milli
on
0
5
10
15
20
25
30
35
40
45
50
Jun-
18
Mar-1
8
Dec-1
7
Sep-
17
Jun-
17
Mar-1
7
Dec-1
6
Sep-
16
Jun-
16
0
100
200
300
400
500
600
700
800QuantityValue
Millio
n ton
nes
Figure 48 Nickel quantity and value by quarter Source: DMIRS
Figure 49 Cobalt quantity and value by quarter Source: DMIRS
0.0
0.2
0.4
0.6
0.8
1.0
1.2
1.4
1.6
$ Milli
on
Thou
sand
Tonn
es
0
20
40
60
80
100
120
140
160
180
Jun-
18
Mar-1
8
Dec-1
7
Sep-
17
Jun-
17
Mar-1
7
Dec-1
6
Sep-
16
Jun-
16
QuantityValue
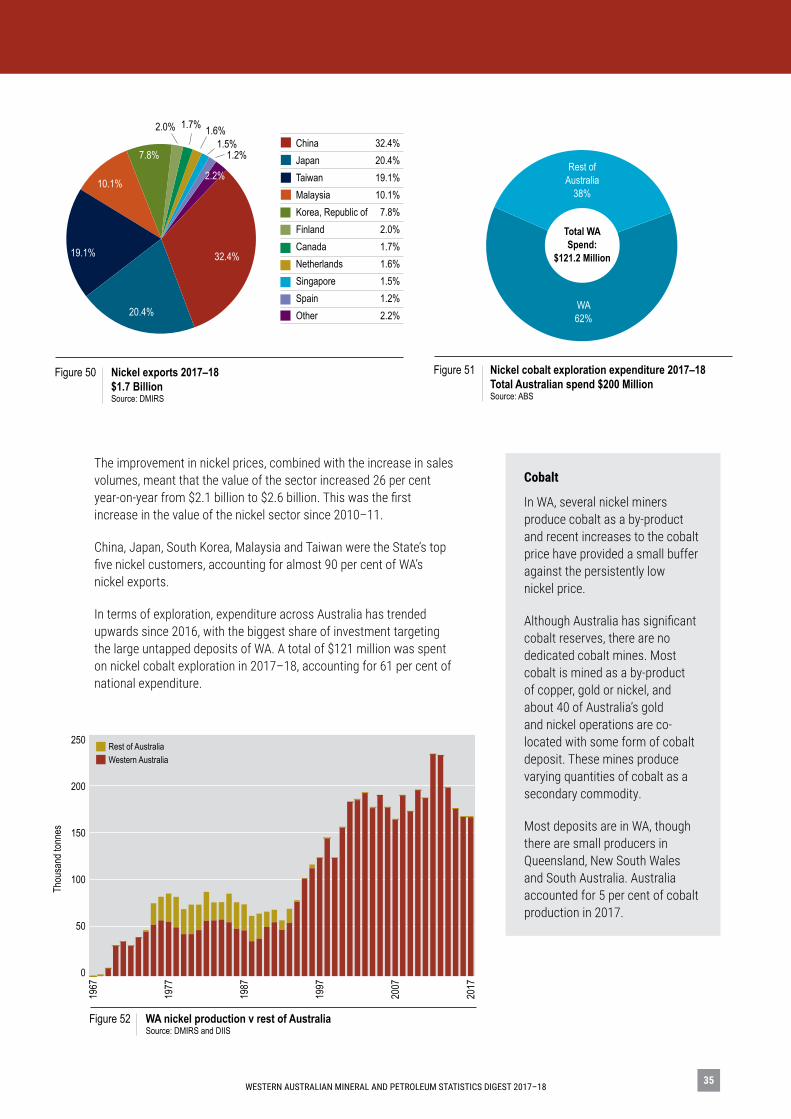
WESTERN AUSTRALIAN MINERAL AND PETROLEUM STATISTICS DIGEST 2017–18WESTERN AUSTRALIAN MINERAL AND PETROLEUM STATISTICS DIGEST 2017–18 35
The improvement in nickel prices, combined with the increase in sales volumes, meant that the value of the sector increased 26 per cent year-on-year from $2.1 billion to $2.6 billion. This was the first increase in the value of the nickel sector since 2010–11.
China, Japan, South Korea, Malaysia and Taiwan were the State’s top five nickel customers, accounting for almost 90 per cent of WA’s nickel exports.
In terms of exploration, expenditure across Australia has trended upwards since 2016, with the biggest share of investment targeting the large untapped deposits of WA. A total of $121 million was spent on nickel cobalt exploration in 2017–18, accounting for 61 per cent of national expenditure.
Figure 50 Nickel exports 2017–18 $1.7 Billion Source: DMIRS
China 32.4%Japan 20.4%Taiwan 19.1%Malaysia 10.1%Korea, Republic of 7.8%Finland 2.0%Canada 1.7%Netherlands 1.6%Singapore 1.5%Spain 1.2%Other 2.2%
1.7%
1.2%
2.0% 1.6%1.5%
32.4%
2.2%
20.4%
19.1%
7.8%
10.1%
Figure 51 Nickel cobalt exploration expenditure 2017–18 Total Australian spend $200 Million Source: ABS
Rest ofAustralia
38%
WA62%
Total WASpend:
$121.2 Million
2017
2007
1997
1987
1977
1967
Thou
sand
tonn
es
Rest of AustraliaWestern Australia
250
200
150
100
50
0
Figure 52 WA nickel production v rest of Australia Source: DMIRS and DIIS
Cobalt
In WA, several nickel miners produce cobalt as a by-product and recent increases to the cobalt price have provided a small buffer against the persistently low nickel price.
Although Australia has significant cobalt reserves, there are no dedicated cobalt mines. Most cobalt is mined as a by-product of copper, gold or nickel, and about 40 of Australia’s gold and nickel operations are co-located with some form of cobalt deposit. These mines produce varying quantities of cobalt as a secondary commodity.
Most deposits are in WA, though there are small producers in Queensland, New South Wales and South Australia. Australia accounted for 5 per cent of cobalt production in 2017.
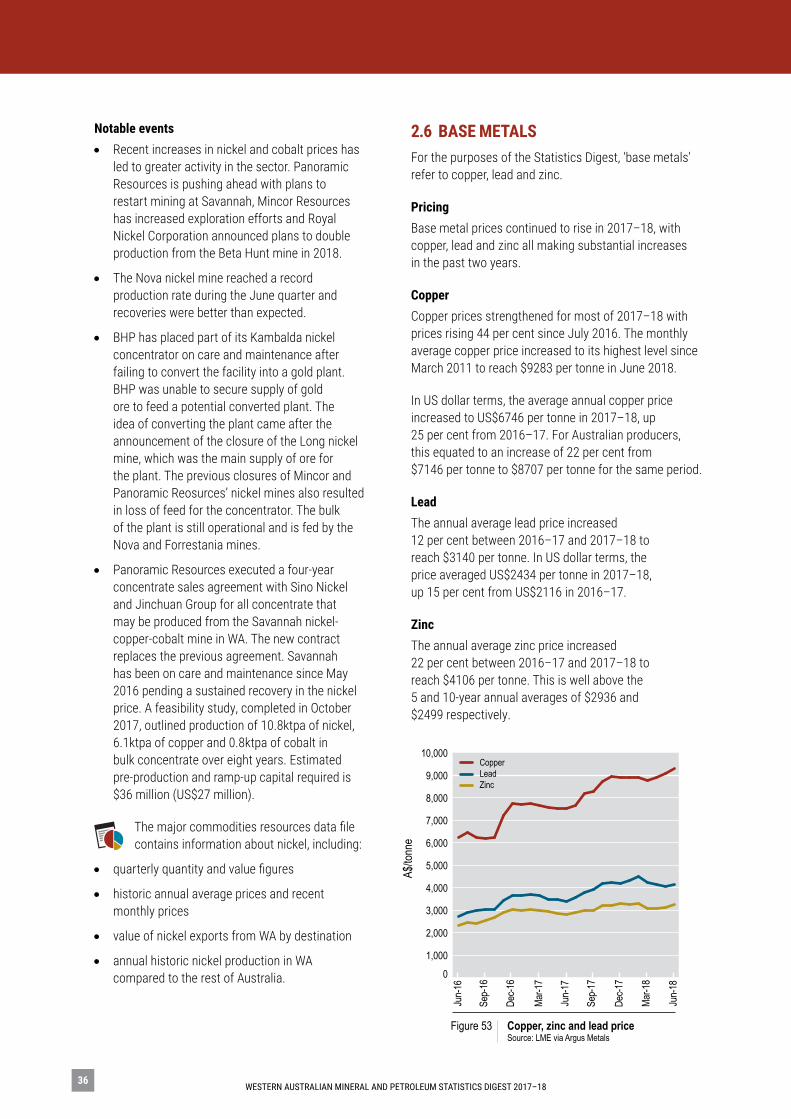
WESTERN AUSTRALIAN MINERAL AND PETROLEUM STATISTICS DIGEST 2017–18WESTERN AUSTRALIAN MINERAL AND PETROLEUM STATISTICS DIGEST 2017–1836
Notable events• Recent increases in nickel and cobalt prices has
led to greater activity in the sector. Panoramic Resources is pushing ahead with plans to restart mining at Savannah, Mincor Resources has increased exploration efforts and Royal Nickel Corporation announced plans to double production from the Beta Hunt mine in 2018.
• The Nova nickel mine reached a record production rate during the June quarter and recoveries were better than expected.
• BHP has placed part of its Kambalda nickel concentrator on care and maintenance after failing to convert the facility into a gold plant. BHP was unable to secure supply of gold ore to feed a potential converted plant. The idea of converting the plant came after the announcement of the closure of the Long nickel mine, which was the main supply of ore for the plant. The previous closures of Mincor and Panoramic Reosurces’ nickel mines also resulted in loss of feed for the concentrator. The bulk of the plant is still operational and is fed by the Nova and Forrestania mines.
• Panoramic Resources executed a four-year concentrate sales agreement with Sino Nickel and Jinchuan Group for all concentrate that may be produced from the Savannah nickel-copper-cobalt mine in WA. The new contract replaces the previous agreement. Savannah has been on care and maintenance since May 2016 pending a sustained recovery in the nickel price. A feasibility study, completed in October 2017, outlined production of 10.8ktpa of nickel, 6.1ktpa of copper and 0.8ktpa of cobalt in bulk concentrate over eight years. Estimated pre-production and ramp-up capital required is $36 million (US$27 million).
The major commodities resources data file contains information about nickel, including:
• quarterly quantity and value figures
• historic annual average prices and recent monthly prices
• value of nickel exports from WA by destination
• annual historic nickel production in WA compared to the rest of Australia.
2.6 BASE METALS For the purposes of the Statistics Digest, ‘base metals’ refer to copper, lead and zinc.
PricingBase metal prices continued to rise in 2017–18, with copper, lead and zinc all making substantial increases in the past two years.
CopperCopper prices strengthened for most of 2017–18 with prices rising 44 per cent since July 2016. The monthly average copper price increased to its highest level since March 2011 to reach $9283 per tonne in June 2018.
In US dollar terms, the average annual copper price increased to US$6746 per tonne in 2017–18, up 25 per cent from 2016–17. For Australian producers, this equated to an increase of 22 per cent from $7146 per tonne to $8707 per tonne for the same period.
LeadThe annual average lead price increased 12 per cent between 2016–17 and 2017–18 to reach $3140 per tonne. In US dollar terms, the price averaged US$2434 per tonne in 2017–18, up 15 per cent from US$2116 in 2016–17.
ZincThe annual average zinc price increased 22 per cent between 2016–17 and 2017–18 to reach $4106 per tonne. This is well above the 5 and 10-year annual averages of $2936 and $2499 respectively.
01,000
2,000
3,000
4,000
5,000
6,000
7,000
8,000
9,000
10,000
Figure 53 Copper, zinc and lead price Source: LME via Argus Metals
Jun-
18
Dec-1
7
Mar-1
8
Jun-
17
Sep-
17
Dec-1
6
Mar-1
7
Jun-
16
Sep-
16
Copper Lead Zinc
A$/to
nne
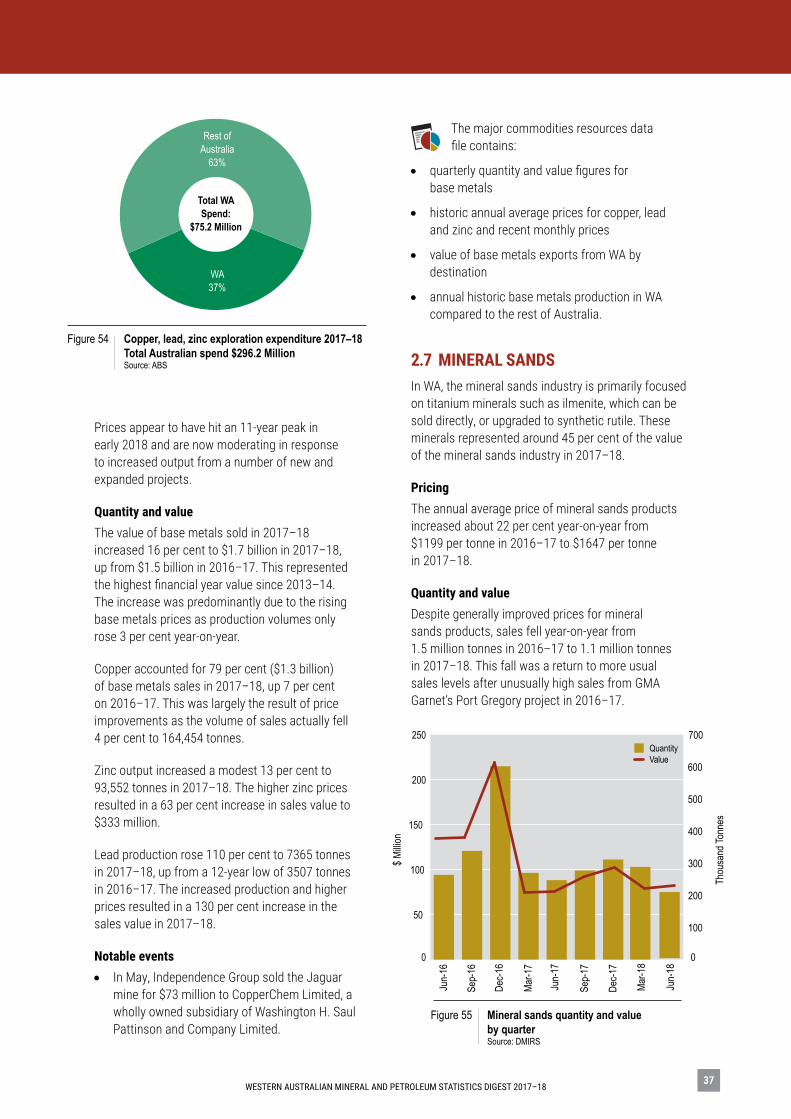
WESTERN AUSTRALIAN MINERAL AND PETROLEUM STATISTICS DIGEST 2017–18WESTERN AUSTRALIAN MINERAL AND PETROLEUM STATISTICS DIGEST 2017–18 37
Prices appear to have hit an 11-year peak in early 2018 and are now moderating in response to increased output from a number of new and expanded projects.
Quantity and valueThe value of base metals sold in 2017–18 increased 16 per cent to $1.7 billion in 2017–18, up from $1.5 billion in 2016–17. This represented the highest financial year value since 2013–14. The increase was predominantly due to the rising base metals prices as production volumes only rose 3 per cent year-on-year.
Copper accounted for 79 per cent ($1.3 billion) of base metals sales in 2017–18, up 7 per cent on 2016–17. This was largely the result of price improvements as the volume of sales actually fell 4 per cent to 164,454 tonnes.
Zinc output increased a modest 13 per cent to 93,552 tonnes in 2017–18. The higher zinc prices resulted in a 63 per cent increase in sales value to $333 million.
Lead production rose 110 per cent to 7365 tonnes in 2017–18, up from a 12-year low of 3507 tonnes in 2016–17. The increased production and higher prices resulted in a 130 per cent increase in the sales value in 2017–18.
Notable events• In May, Independence Group sold the Jaguar
mine for $73 million to CopperChem Limited, a wholly owned subsidiary of Washington H. Saul Pattinson and Company Limited.
The major commodities resources data file contains:
• quarterly quantity and value figures for base metals
• historic annual average prices for copper, lead and zinc and recent monthly prices
• value of base metals exports from WA by destination
• annual historic base metals production in WA compared to the rest of Australia.
2.7 MINERAL SANDS In WA, the mineral sands industry is primarily focused on titanium minerals such as ilmenite, which can be sold directly, or upgraded to synthetic rutile. These minerals represented around 45 per cent of the value of the mineral sands industry in 2017–18.
Pricing The annual average price of mineral sands products increased about 22 per cent year-on-year from $1199 per tonne in 2016–17 to $1647 per tonne in 2017–18.
Quantity and valueDespite generally improved prices for mineral sands products, sales fell year-on-year from 1.5 million tonnes in 2016–17 to 1.1 million tonnes in 2017–18. This fall was a return to more usual sales levels after unusually high sales from GMA Garnet’s Port Gregory project in 2016–17.
Figure 54 Copper, lead, zinc exploration expenditure 2017–18 Total Australian spend $296.2 Million Source: ABS
Rest ofAustralia
63%
WA37%
Total WASpend:
$75.2 Million
Figure 55 Mineral sands quantity and value by quarter Source: DMIRS
$ Milli
on
Thou
sand
Tonn
es
QuantityValue
0
100
200
300
400
500
600
700
Jun-
18
Mar-1
8
Dec-1
7
Sep-
17
Jun-
17
Mar-1
7
Dec-1
6
Sep-
16
Jun-
16
0
50
100
150
200
250
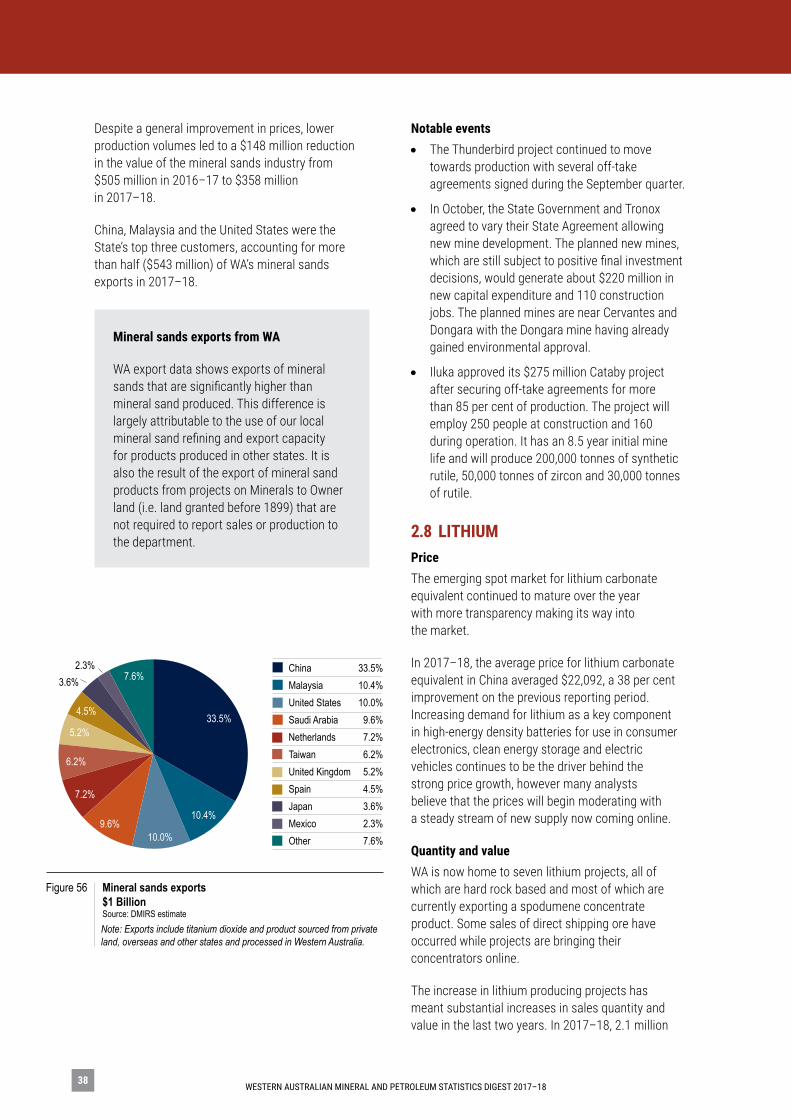
WESTERN AUSTRALIAN MINERAL AND PETROLEUM STATISTICS DIGEST 2017–18WESTERN AUSTRALIAN MINERAL AND PETROLEUM STATISTICS DIGEST 2017–1838
Despite a general improvement in prices, lower production volumes led to a $148 million reduction in the value of the mineral sands industry from $505 million in 2016–17 to $358 million in 2017–18.
China, Malaysia and the United States were the State’s top three customers, accounting for more than half ($543 million) of WA’s mineral sands exports in 2017–18.
Mineral sands exports from WA
WA export data shows exports of mineral sands that are significantly higher than mineral sand produced. This difference is largely attributable to the use of our local mineral sand refining and export capacity for products produced in other states. It is also the result of the export of mineral sand products from projects on Minerals to Owner land (i.e. land granted before 1899) that are not required to report sales or production to the department.
Notable events• The Thunderbird project continued to move
towards production with several off-take agreements signed during the September quarter.
• In October, the State Government and Tronox agreed to vary their State Agreement allowing new mine development. The planned new mines, which are still subject to positive final investment decisions, would generate about $220 million in new capital expenditure and 110 construction jobs. The planned mines are near Cervantes and Dongara with the Dongara mine having already gained environmental approval.
• Iluka approved its $275 million Cataby project after securing off-take agreements for more than 85 per cent of production. The project will employ 250 people at construction and 160 during operation. It has an 8.5 year initial mine life and will produce 200,000 tonnes of synthetic rutile, 50,000 tonnes of zircon and 30,000 tonnes of rutile.
2.8 LITHIUM PriceThe emerging spot market for lithium carbonate equivalent continued to mature over the year with more transparency making its way into the market.
In 2017–18, the average price for lithium carbonate equivalent in China averaged $22,092, a 38 per cent improvement on the previous reporting period. Increasing demand for lithium as a key component in high-energy density batteries for use in consumer electronics, clean energy storage and electric vehicles continues to be the driver behind the strong price growth, however many analysts believe that the prices will begin moderating with a steady stream of new supply now coming online.
Quantity and valueWA is now home to seven lithium projects, all of which are hard rock based and most of which are currently exporting a spodumene concentrate product. Some sales of direct shipping ore have occurred while projects are bringing their concentrators online.
The increase in lithium producing projects has meant substantial increases in sales quantity and value in the last two years. In 2017–18, 2.1 million
Figure 56 Mineral sands exports $1 Billion Source: DMIRS estimate
China 33.5%Malaysia 10.4%United States 10.0%Saudi Arabia 9.6%Netherlands 7.2%Taiwan 6.2%United Kingdom 5.2%Spain 4.5%Japan 3.6%Mexico 2.3%Other 7.6%
3.6%2.3%
5.2%
7.6%
33.5%
7.2%
4.5%
6.2%
10.4%9.6%
10.0%
Note: Exports include titanium dioxide and product sourced from private land, overseas and other states and processed in Western Australia.
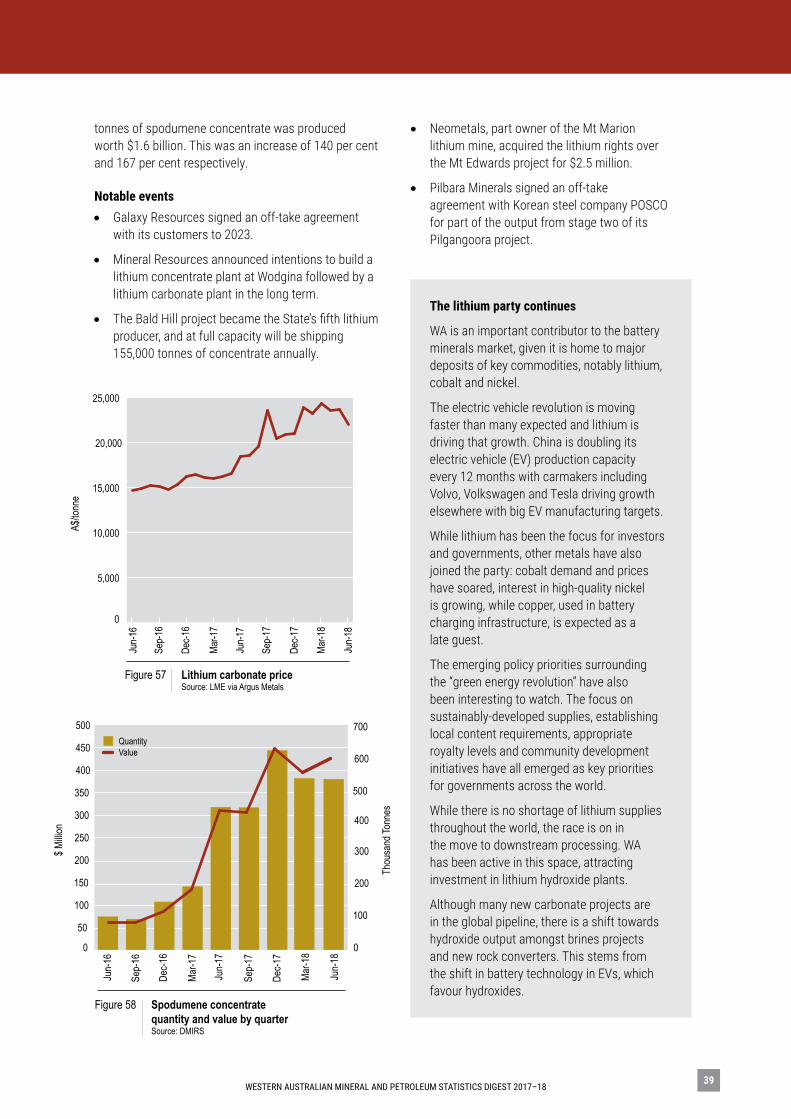
WESTERN AUSTRALIAN MINERAL AND PETROLEUM STATISTICS DIGEST 2017–18WESTERN AUSTRALIAN MINERAL AND PETROLEUM STATISTICS DIGEST 2017–18 39
tonnes of spodumene concentrate was produced worth $1.6 billion. This was an increase of 140 per cent and 167 per cent respectively.
Notable events• Galaxy Resources signed an off-take agreement
with its customers to 2023.
• Mineral Resources announced intentions to build a lithium concentrate plant at Wodgina followed by a lithium carbonate plant in the long term.
• The Bald Hill project became the State’s fifth lithium producer, and at full capacity will be shipping 155,000 tonnes of concentrate annually.
• Neometals, part owner of the Mt Marion lithium mine, acquired the lithium rights over the Mt Edwards project for $2.5 million.
• Pilbara Minerals signed an off-take agreement with Korean steel company POSCO for part of the output from stage two of its Pilgangoora project.
The lithium party continues
WA is an important contributor to the battery minerals market, given it is home to major deposits of key commodities, notably lithium, cobalt and nickel.
The electric vehicle revolution is moving faster than many expected and lithium is driving that growth. China is doubling its electric vehicle (EV) production capacity every 12 months with carmakers including Volvo, Volkswagen and Tesla driving growth elsewhere with big EV manufacturing targets.
While lithium has been the focus for investors and governments, other metals have also joined the party: cobalt demand and prices have soared, interest in high-quality nickel is growing, while copper, used in battery charging infrastructure, is expected as a late guest.
The emerging policy priorities surrounding the “green energy revolution” have also been interesting to watch. The focus on sustainably-developed supplies, establishing local content requirements, appropriate royalty levels and community development initiatives have all emerged as key priorities for governments across the world.
While there is no shortage of lithium supplies throughout the world, the race is on in the move to downstream processing. WA has been active in this space, attracting investment in lithium hydroxide plants.
Although many new carbonate projects are in the global pipeline, there is a shift towards hydroxide output amongst brines projects and new rock converters. This stems from the shift in battery technology in EVs, which favour hydroxides.
A$/to
nne
0
5,000
10,000
15,000
20,000
25,000
Figure 57 Lithium carbonate price Source: LME via Argus Metals
Jun-
18
Dec-1
7
Mar-1
8
Jun-
17
Sep-
17
Dec-1
6
Mar-1
7
Jun-
16
Sep-
16
Figure 58 Spodumene concentrate quantity and value by quarter Source: DMIRS
0
100
200
300
400
500
600
700
$ Milli
on
Thou
sand
Tonn
es
0
50
100
150
200
250
300
350
400
450
500
Jun-
18
Mar-1
8
Dec-1
7
Sep-
17
Jun-
17
Mar-1
7
Dec-1
6
Sep-
16
Jun-
16
QuantityValue
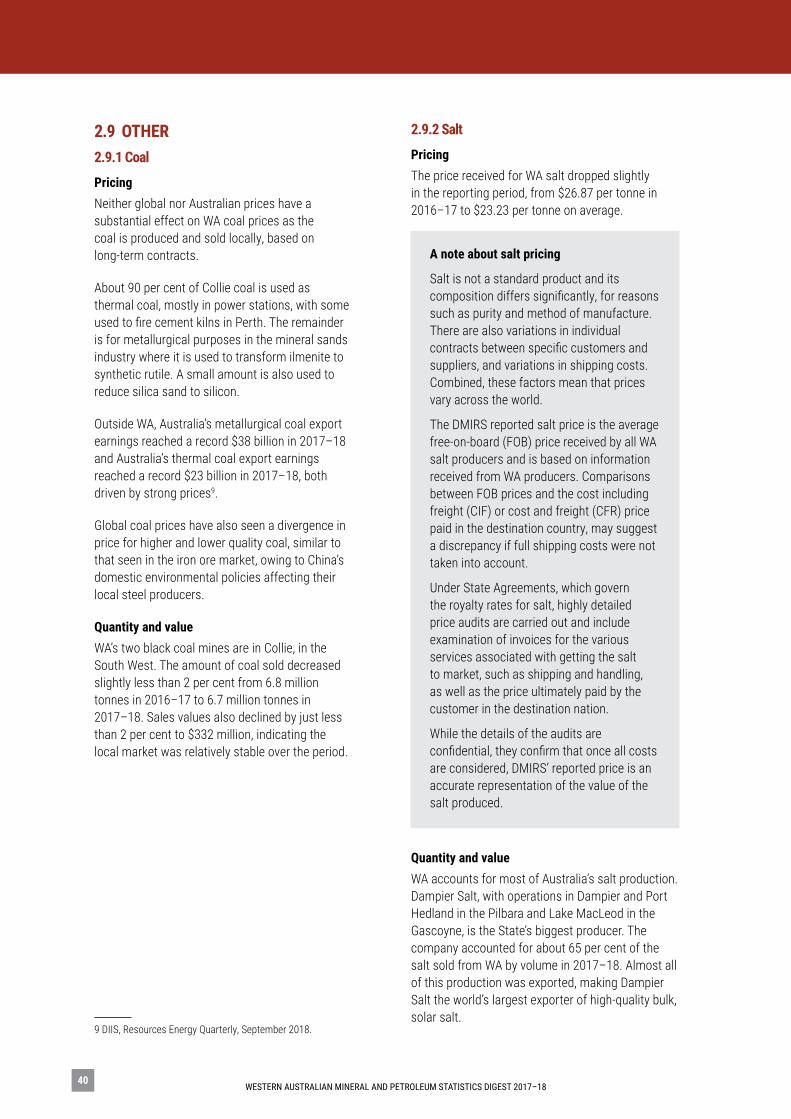
WESTERN AUSTRALIAN MINERAL AND PETROLEUM STATISTICS DIGEST 2017–18WESTERN AUSTRALIAN MINERAL AND PETROLEUM STATISTICS DIGEST 2017–1840
2.9 OTHER 2.9.1 Coal
PricingNeither global nor Australian prices have a substantial effect on WA coal prices as the coal is produced and sold locally, based on long-term contracts.
About 90 per cent of Collie coal is used as thermal coal, mostly in power stations, with some used to fire cement kilns in Perth. The remainder is for metallurgical purposes in the mineral sands industry where it is used to transform ilmenite to synthetic rutile. A small amount is also used to reduce silica sand to silicon.
Outside WA, Australia’s metallurgical coal export earnings reached a record $38 billion in 2017–18 and Australia’s thermal coal export earnings reached a record $23 billion in 2017–18, both driven by strong prices9.
Global coal prices have also seen a divergence in price for higher and lower quality coal, similar to that seen in the iron ore market, owing to China’s domestic environmental policies affecting their local steel producers.
Quantity and valueWA’s two black coal mines are in Collie, in the South West. The amount of coal sold decreased slightly less than 2 per cent from 6.8 million tonnes in 2016–17 to 6.7 million tonnes in 2017–18. Sales values also declined by just less than 2 per cent to $332 million, indicating the local market was relatively stable over the period.
2.9.2 Salt
PricingThe price received for WA salt dropped slightly in the reporting period, from $26.87 per tonne in 2016–17 to $23.23 per tonne on average.
A note about salt pricing
Salt is not a standard product and its composition differs significantly, for reasons such as purity and method of manufacture. There are also variations in individual contracts between specific customers and suppliers, and variations in shipping costs. Combined, these factors mean that prices vary across the world.
The DMIRS reported salt price is the average free-on-board (FOB) price received by all WA salt producers and is based on information received from WA producers. Comparisons between FOB prices and the cost including freight (CIF) or cost and freight (CFR) price paid in the destination country, may suggest a discrepancy if full shipping costs were not taken into account.
Under State Agreements, which govern the royalty rates for salt, highly detailed price audits are carried out and include examination of invoices for the various services associated with getting the salt to market, such as shipping and handling, as well as the price ultimately paid by the customer in the destination nation.
While the details of the audits are confidential, they confirm that once all costs are considered, DMIRS’ reported price is an accurate representation of the value of the salt produced.
Quantity and valueWA accounts for most of Australia’s salt production. Dampier Salt, with operations in Dampier and Port Hedland in the Pilbara and Lake MacLeod in the Gascoyne, is the State’s biggest producer. The company accounted for about 65 per cent of the salt sold from WA by volume in 2017–18. Almost all of this production was exported, making Dampier Salt the world’s largest exporter of high-quality bulk, solar salt.
9 DIIS, Resources Energy Quarterly, September 2018.

WESTERN AUSTRALIAN MINERAL AND PETROLEUM STATISTICS DIGEST 2017–18WESTERN AUSTRALIAN MINERAL AND PETROLEUM STATISTICS DIGEST 2017–18 41
Onslow Salt’s operation at Onslow is WA’s next-largest operation, with 23 per cent of production by volume. The remainder comes from smaller producers, including those focused primarily on domestic production.
In 2017–18, salt sales totalled 13 million tonnes, up 19 per cent on 2016–17. The small price decrease was not enough to impact sales value with the value of the sector increasing 3 per cent year-on-year to $301 million.
Notable events• Leichhardt Industrials’ $230 million Eramurra salt
project has been undergoing pre-feasibility study (PFS) since April 2018 and aims to produce up to 1.83 million tonnes a year of high-grade chemical salt for the Asia-Pacific market. The project is expected to use natural salt pan areas south of Forty Mile Beach as a source for its production. The project’s $2 million PFS is funded by mining-focused RCF Opportunities Fund. It is the third salt project to be announced in WA in the past two years, following K+S’s Ashburton project in 2016 and BC Iron’s Mardie project, which completed PFS in June 2018.
2.9.3 Diamonds
PricingWith no universal, transparent market price for diamonds and little publicly available data, it is difficult to determine the true situation regarding the prices received by mining companies.
Quantity and valueDiamond sales volumes in WA were 15.3 million carats in 2017–18, up 21 per cent on 2016–17.
Notable events• It was announced in January 2018 that Lucapa
Diamond Company had made a significant discovery only 50km east of the old Ellendale mine that once produced half the world’s rare fancy yellow diamonds. Only a few weeks after drilling began for lamproite on its Brooking project, it uncovered 119 diamonds, including seven macro diamonds.
2.9.4 Manganese
PricingGlobally, the manganese market is driven primarily by steel demand and prices move in a way that is broadly comparable to the iron ore price. Manganese prices have trended upwards since early 2016 with a sharp drop seen at the start of 2017 before recovering to slightly elevated levels.
Quantity and valueCurrently, all economic resources for manganese in Australia are located in Western Australia and the Northern Territory. Groote Eylandt, a world-class manganese deposit in the Northern Territory, is the centre of most manganese-mining activity in the country.
In 2017–18, the volume of manganese sold in WA increased 66 per cent in line with the restart of operations at Woodie Woodie in late 2017.
Notable events• Manganese exploration and development company
Element 25, formerly Montezuma Mining, is working towards its flagship project Butcherbird in the north of Western Australia. The Butcherbird manganese deposit is suggested as Australia’s largest onshore manganese resource comprising large tonnages of near surface manganese oxide ore in seven deposits. In May 2018, a scoping study returned robust results with indicated and inferred resource estimates of 180 tonnes at 10.8 per cent manganese. The study also encouraged the start of a pre-feasibility study.
WESTERN AUSTRALIAN MINERAL AND PETROLEUM STATISTICS DIGEST 2017–18WESTERN AUSTRALIAN MINERAL AND PETROLEUM STATISTICS DIGEST 2017–18WESTERN AUSTRALIAN MINERAL AND PETROLEUM STATISTICS DIGEST 2017–1842
2.9.5 Rare earth elements
Demand for rare earth elements is driven by niche uses, primarily in the high-tech industries. They have applications in nuclear reactors, consumer electronics, electric and hybrid vehicles, batteries, lighting (phosphors) and lasers. However, the dominant driver of growth for many key rare earths (including neodymium, dysprosium and praseodymium) is the demand for high-powered permanent magnets, primarily in electric vehicles (which require high-powered magnets for efficient electric motors) and wind turbines.
Quantity and valueWA’s rare earths are mostly lanthanum, cerium, neodymium and praseodymium oxides. Lynas Corporation Ltd operates WA’s only rare earths mine at Mount Weld, supplying rare earth concentrates to the Lynas Advanced Materials Plant in Malaysia. The mine started production in 2011 with an expected mine life of 25 years. The mine operates on a campaign mining basis.
In 2017–18, rare earth sales tonnages increased 11 per cent, while sales values increased 49 per cent compared to 2017–16 values.
Notable events• Lynas competed pilot test work for the
expansion of its rougher flotation circuit at Mt Weld.
• From April 2018, production at Mt Weld increased to 500 tonnes per month. This is expected to increase to 600 tonnes per month in January 2019.
• The Browns Range pilot plant was commissioned in June 2018 and has since achieved mechanical completion. The operation has already produced and stockpiled about 100 tonnes of xenotime concentrate through its beneficiation.
• In November 2017, Hastings Technology Metals completed a definitive feasibility study on its Yangibana project. The project has one of the highest known neodymium and praseodymium to total rare earth oxide ratios of 41 per cent. There are plans to produce up to 15,000 tonnes per annum of mixed rare earths carbonate on site in Yangibana.
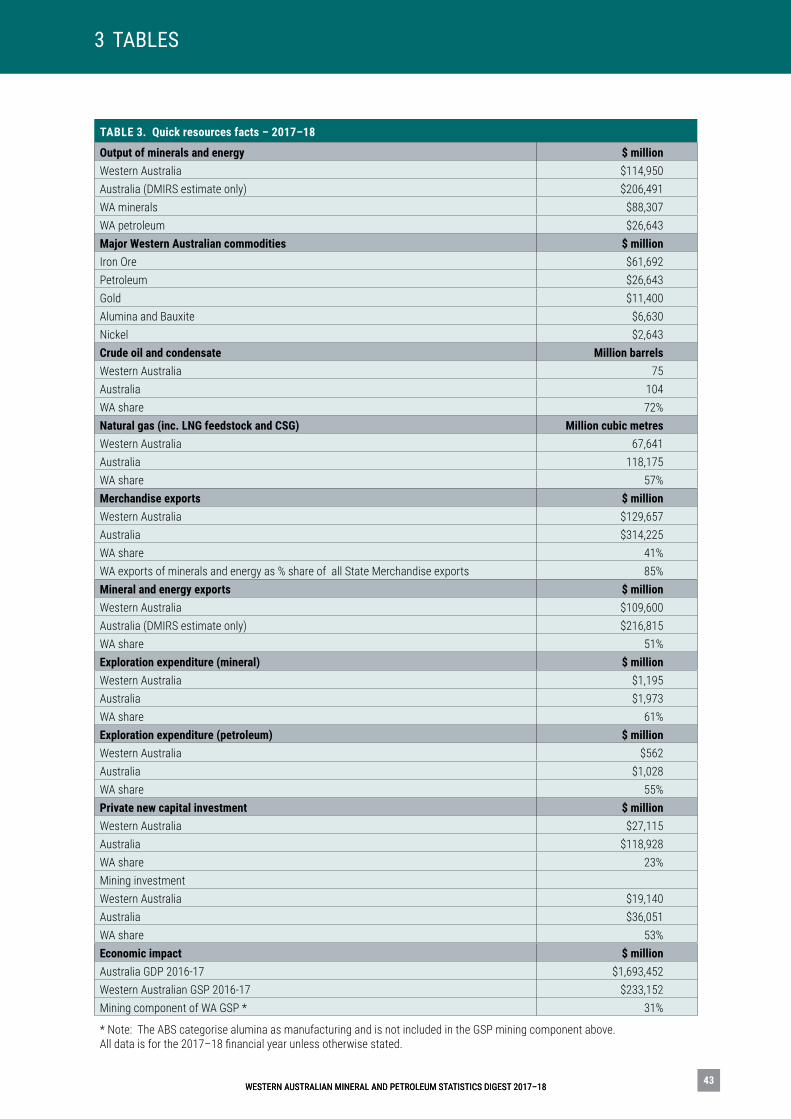
WESTERN AUSTRALIAN MINERAL AND PETROLEUM STATISTICS DIGEST 2017–18 43WESTERN AUSTRALIAN MINERAL AND PETROLEUM STATISTICS DIGEST 2017–18WESTERN AUSTRALIAN MINERAL AND PETROLEUM STATISTICS DIGEST 2017–18
3 TABLES
TABLE 3. Quick resources facts – 2017–18
Output of minerals and energy $ millionWestern Australia $114,950Australia (DMIRS estimate only) $206,491WA minerals $88,307WA petroleum $26,643Major Western Australian commodities $ millionIron Ore $61,692Petroleum $26,643Gold $11,400Alumina and Bauxite $6,630Nickel $2,643Crude oil and condensate Million barrelsWestern Australia 75Australia 104WA share 72%Natural gas (inc. LNG feedstock and CSG) Million cubic metresWestern Australia 67,641 Australia 118,175WA share 57%Merchandise exports $ millionWestern Australia $129,657Australia $314,225WA share 41%WA exports of minerals and energy as % share of all State Merchandise exports 85%Mineral and energy exports $ millionWestern Australia $109,600Australia (DMIRS estimate only) $216,815WA share 51%Exploration expenditure (mineral) $ millionWestern Australia $1,195Australia $1,973WA share 61%Exploration expenditure (petroleum) $ millionWestern Australia $562Australia $1,028WA share 55%Private new capital investment $ millionWestern Australia $27,115Australia $118,928WA share 23%Mining investmentWestern Australia $19,140Australia $36,051WA share 53%Economic impact $ millionAustralia GDP 2016-17 $1,693,452Western Australian GSP 2016-17 $233,152Mining component of WA GSP * 31%
* Note: The ABS categorise alumina as manufacturing and is not included in the GSP mining component above.All data is for the 2017–18 financial year unless otherwise stated.
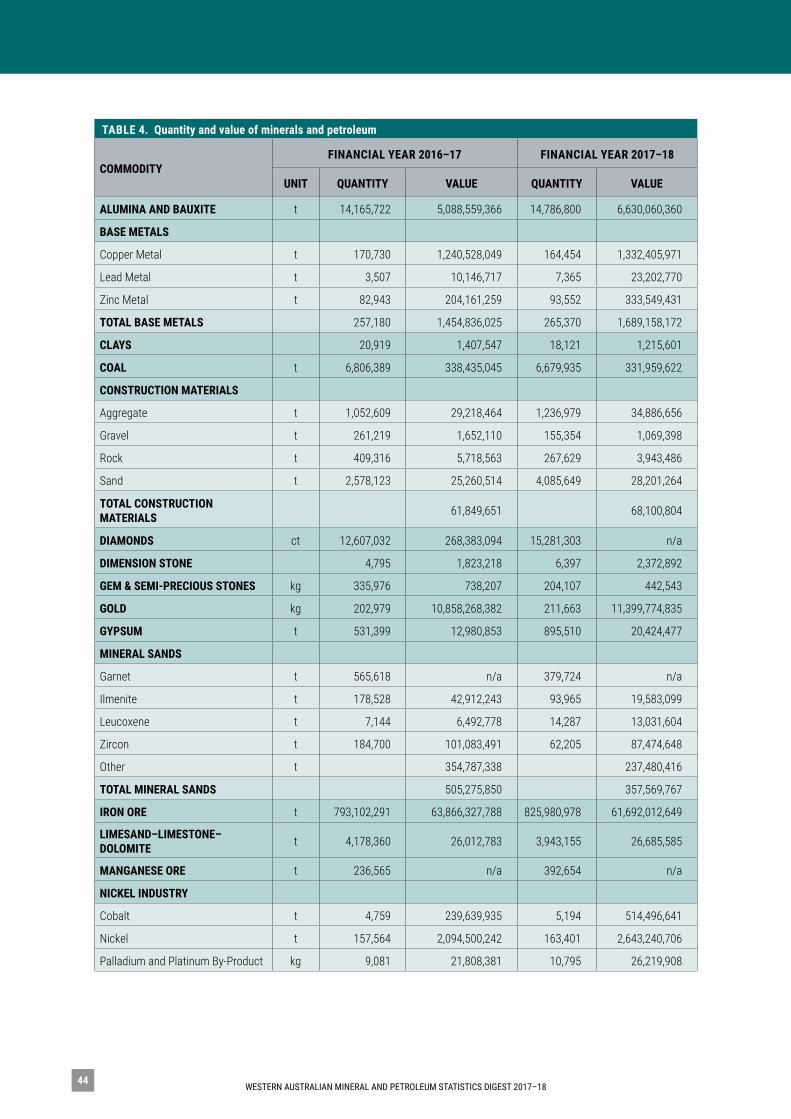
WESTERN AUSTRALIAN MINERAL AND PETROLEUM STATISTICS DIGEST 2017–18WESTERN AUSTRALIAN MINERAL AND PETROLEUM STATISTICS DIGEST 2017–1844
TABLE 4. Quantity and value of minerals and petroleum
COMMODITYFINANCIAL YEAR 2016–17 FINANCIAL YEAR 2017–18
UNIT QUANTITY VALUE QUANTITY VALUE
ALUMINA AND BAUXITE t 14,165,722 5,088,559,366 14,786,800 6,630,060,360
BASE METALS
Copper Metal t 170,730 1,240,528,049 164,454 1,332,405,971
Lead Metal t 3,507 10,146,717 7,365 23,202,770
Zinc Metal t 82,943 204,161,259 93,552 333,549,431
TOTAL BASE METALS 257,180 1,454,836,025 265,370 1,689,158,172
CLAYS 20,919 1,407,547 18,121 1,215,601
COAL t 6,806,389 338,435,045 6,679,935 331,959,622
CONSTRUCTION MATERIALS
Aggregate t 1,052,609 29,218,464 1,236,979 34,886,656
Gravel t 261,219 1,652,110 155,354 1,069,398
Rock t 409,316 5,718,563 267,629 3,943,486
Sand t 2,578,123 25,260,514 4,085,649 28,201,264
TOTAL CONSTRUCTION MATERIALS 61,849,651 68,100,804
DIAMONDS ct 12,607,032 268,383,094 15,281,303 n/a
DIMENSION STONE 4,795 1,823,218 6,397 2,372,892
GEM & SEMI-PRECIOUS STONES kg 335,976 738,207 204,107 442,543
GOLD kg 202,979 10,858,268,382 211,663 11,399,774,835
GYPSUM t 531,399 12,980,853 895,510 20,424,477
MINERAL SANDS
Garnet t 565,618 n/a 379,724 n/a
Ilmenite t 178,528 42,912,243 93,965 19,583,099
Leucoxene t 7,144 6,492,778 14,287 13,031,604
Zircon t 184,700 101,083,491 62,205 87,474,648
Other t 354,787,338 237,480,416
TOTAL MINERAL SANDS 505,275,850 357,569,767
IRON ORE t 793,102,291 63,866,327,788 825,980,978 61,692,012,649
LIMESAND–LIMESTONE–DOLOMITE t 4,178,360 26,012,783 3,943,155 26,685,585
MANGANESE ORE t 236,565 n/a 392,654 n/a
NICKEL INDUSTRY
Cobalt t 4,759 239,639,935 5,194 514,496,641
Nickel t 157,564 2,094,500,242 163,401 2,643,240,706
Palladium and Platinum By-Product kg 9,081 21,808,381 10,795 26,219,908
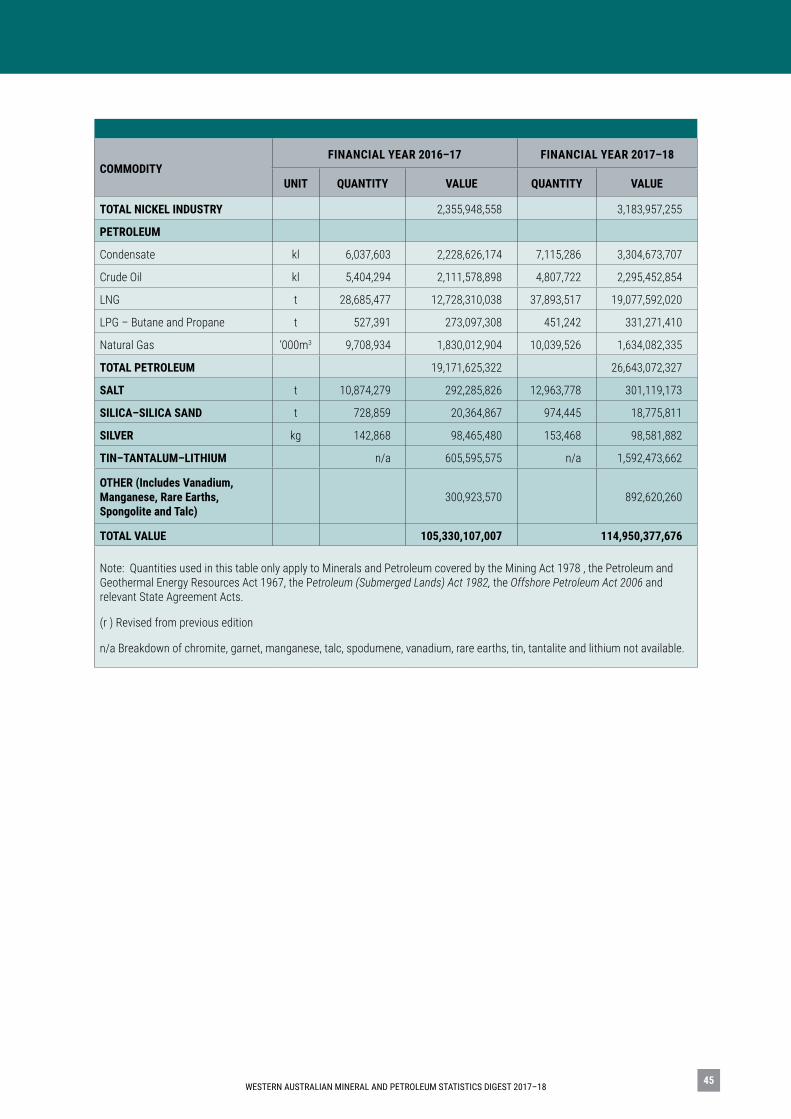
WESTERN AUSTRALIAN MINERAL AND PETROLEUM STATISTICS DIGEST 2017–18WESTERN AUSTRALIAN MINERAL AND PETROLEUM STATISTICS DIGEST 2017–18 45
COMMODITYFINANCIAL YEAR 2016–17 FINANCIAL YEAR 2017–18
UNIT QUANTITY VALUE QUANTITY VALUE
TOTAL NICKEL INDUSTRY 2,355,948,558 3,183,957,255
PETROLEUM
Condensate kl 6,037,603 2,228,626,174 7,115,286 3,304,673,707
Crude Oil kl 5,404,294 2,111,578,898 4,807,722 2,295,452,854
LNG t 28,685,477 12,728,310,038 37,893,517 19,077,592,020
LPG – Butane and Propane t 527,391 273,097,308 451,242 331,271,410
Natural Gas ‘000m3 9,708,934 1,830,012,904 10,039,526 1,634,082,335
TOTAL PETROLEUM 19,171,625,322 26,643,072,327
SALT t 10,874,279 292,285,826 12,963,778 301,119,173
SILICA–SILICA SAND t 728,859 20,364,867 974,445 18,775,811
SILVER kg 142,868 98,465,480 153,468 98,581,882
TIN–TANTALUM–LITHIUM n/a 605,595,575 n/a 1,592,473,662
OTHER (Includes Vanadium, Manganese, Rare Earths, Spongolite and Talc)
300,923,570 892,620,260
TOTAL VALUE 105,330,107,007 114,950,377,676
Note: Quantities used in this table only apply to Minerals and Petroleum covered by the Mining Act 1978 , the Petroleum and Geothermal Energy Resources Act 1967, the Petroleum (Submerged Lands) Act 1982, the Offshore Petroleum Act 2006 and relevant State Agreement Acts.
(r ) Revised from previous edition
n/a Breakdown of chromite, garnet, manganese, talc, spodumene, vanadium, rare earths, tin, tantalite and lithium not available.
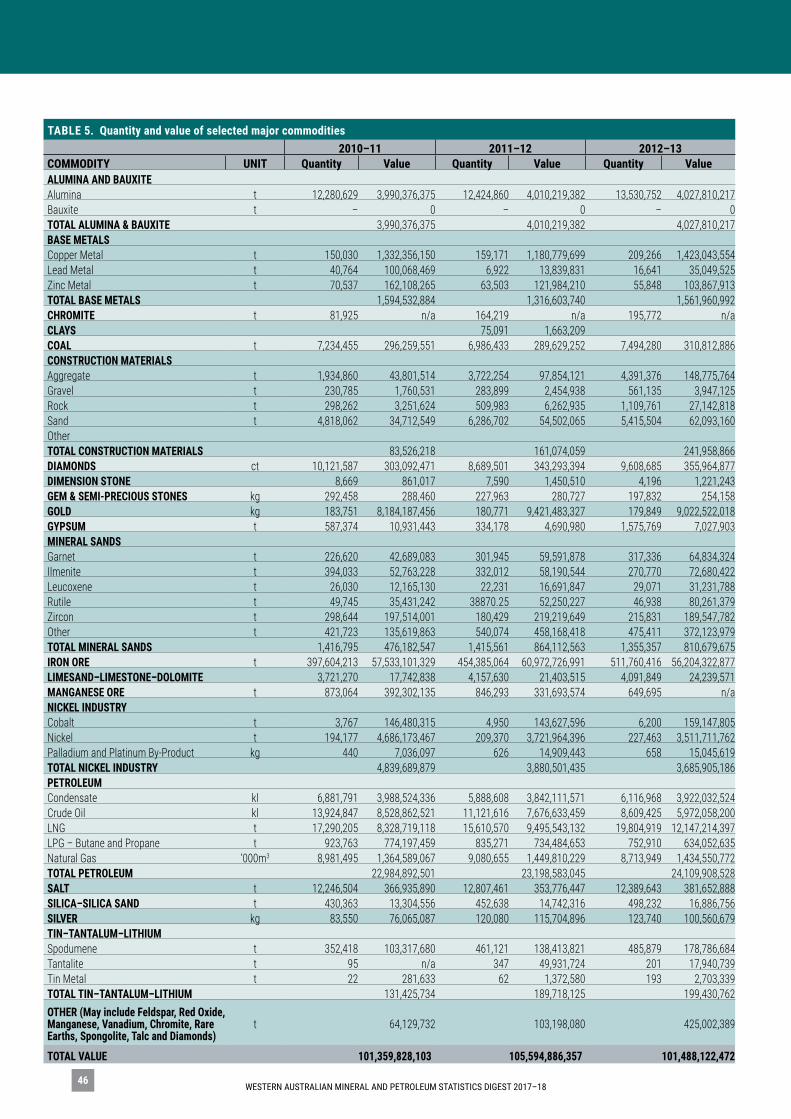
WESTERN AUSTRALIAN MINERAL AND PETROLEUM STATISTICS DIGEST 2017–18WESTERN AUSTRALIAN MINERAL AND PETROLEUM STATISTICS DIGEST 2017–1846
TABLE 5. Quantity and value of selected major commodities2010–11 2011–12 2012–13 2013–14 2014–15 2015–16 2016–17 2017–18
COMMODITY UNIT Quantity Value Quantity Value Quantity Value Quantity Value Quantity Value Quantity Value Quantity Value Quantity ValueALUMINA AND BAUXITEAlumina t 12,280,629 3,990,376,375 12,424,860 4,010,219,382 13,530,752 4,027,810,217 13,717,952 4,295,348,699 13,771,412 5,022,721,218 13,893,540 4,937,279,870 13,855,382 5,073,995,897 13,669,477 6,583,355,409Bauxite t – 0 – 0 – 0 – 0 – 0 47,703 1,952,600 310,341 14,563,469 1,117,323 46,704,951TOTAL ALUMINA & BAUXITE 3,990,376,375 4,010,219,382 4,027,810,217 4,295,348,699 5,022,721,218 4,939,232,470 14,165,722 5,088,559,366 14,786,800 6,630,060,360BASE METALSCopper Metal t 150,030 1,332,356,150 159,171 1,180,779,699 209,266 1,423,043,554 211,186 1,559,565,610 184,495 1,283,046,797 190,275 1,183,262,087 170,730 1,240,528,049 164,454 1,332,405,971Lead Metal t 40,764 100,068,469 6,922 13,839,831 16,641 35,049,525 78,651 178,764,058 59,248 136,949,662 5,988 14,810,595 3,507 10,146,717 7,365 23,202,770Zinc Metal t 70,537 162,108,265 63,503 121,984,210 55,848 103,867,913 54,060 118,261,576 77,831 197,040,406 82,676 195,494,453 82,943 204,161,259 93,552 333,549,431TOTAL BASE METALS 1,594,532,884 1,316,603,740 1,561,960,992 1,856,591,245 1,617,036,865 1,393,567,135 1,454,836,025 1,689,158,172CHROMITE t 81,925 n/a 164,219 n/a 195,772 n/a 66,540 n/a – 0 – 0 – 0 – 0CLAYS 75,091 1,663,209 5,139 345,148 17,670 1,043,438 21,969 1,104,708 20,919 1,407,547 18,121 1,215,601COAL t 7,234,455 296,259,551 6,986,433 289,629,252 7,494,280 310,812,886 6,275,422 263,701,680 6,553,064 306,733,911 6,890,951 336,466,825 6,806,389 338,435,045 6,679,935 331,959,622CONSTRUCTION MATERIALSAggregate t 1,934,860 43,801,514 3,722,254 97,854,121 4,391,376 148,775,764 2,154,534 47,255,402 1,963,871 69,239,676 1,313,696 42,256,613 1,052,609 29,218,464 1,236,979 34,886,656Gravel t 230,785 1,760,531 283,899 2,454,938 561,135 3,947,125 51,853 338,431 172,556 993,903 177,243 1,055,083 261,219 1,652,110 155,354 1,069,398Rock t 298,262 3,251,624 509,983 6,262,935 1,109,761 27,142,818 402,652 10,070,061 1,746,693 46,504,731 220,402 1,828,018 409,316 5,718,563 267,629 3,943,486Sand t 4,818,062 34,712,549 6,286,702 54,502,065 5,415,504 62,093,160 3,796,749 28,420,888 5,939,321 49,279,152 3,477,403 34,966,248 2,578,123 25,260,514 4,085,649 28,201,264Other – – – – –TOTAL CONSTRUCTION MATERIALS 83,526,218 161,074,059 241,958,866 86,084,782 166,017,462 80,105,962 61,849,652 68,100,803DIAMONDS ct 10,121,587 303,092,471 8,689,501 343,293,394 9,608,685 355,964,877 11,646,712 401,672,122 10,423,822 342,313,665 13,869,547 354,047,664 12,607,032 268,383,094 15,281,303 n/aDIMENSION STONE 8,669 861,017 7,590 1,450,510 4,196 1,221,243 5,021 1,365,020 21,250 2,892,731 4,113 2,205,326 4,795 1,823,218 6,397 2,372,892GEM & SEMI-PRECIOUS STONES kg 292,458 288,460 227,963 280,727 197,832 254,158 309,575 401,960 720,552 1,402,333 242,919 623,746 335,976 738,207 204,107 442,543GOLD kg 183,751 8,184,187,456 180,771 9,421,483,327 179,849 9,022,522,018 196,074 8,890,995,046 193,162 9,107,167,942 195,968 10,104,514,299 202,979 10,858,268,382 211,663 11,399,774,835GYPSUM t 587,374 10,931,443 334,178 4,690,980 1,575,769 7,027,903 532,919 9,496,857 576,880 12,240,632 551,910 13,830,966 531,399 12,980,853 895,510 20,424,477MINERAL SANDSGarnet t 226,620 42,689,083 301,945 59,591,878 317,336 64,834,324 357,266 68,896,504 299,022 n/a 251,162 n/a 565,618 n/a 379,724 n/aIlmenite t 394,033 52,763,228 332,012 58,190,544 270,770 72,680,422 78,900 19,515,066 99,674 21,000,789 174,687 39,692,103 178,528 42,912,243 93,965 19,583,099Leucoxene t 26,030 12,165,130 22,231 16,691,847 29,071 31,231,788 29,268 26,205,650 16,965 14,636,208 18,137 16,452,584 7,144 6,492,778 14,287 13,031,604Rutile t 49,745 35,431,242 38870.25 52,250,227 46,938 80,261,379 65,084 65,938,306 30,206 29,582,184 45,888 44,260,114 21,562 21,953,547 15,595 16,156,980 Zircon t 298,644 197,514,001 180,429 219,219,649 215,831 189,547,782 212,068 114,307,405 182,859 136,321,656 191,551 151,297,003 184,700 101,083,491 62,205 87,474,648Other t 421,723 135,619,863 540,074 458,168,418 475,411 372,123,979 335,684 176,168,377 440,970 291,166,037 319,846,256 332,833,791 221,323,436TOTAL MINERAL SANDS 1,416,795 476,182,547 1,415,561 864,112,563 1,355,357 810,679,675 1,078,271 471,031,307 492,706,874 1,170,840 571,548,060 1,457,133 505,275,850 1,083,646 357,569,767IRON ORE t 397,604,213 57,533,101,329 454,385,064 60,972,726,991 511,760,416 56,204,322,877 623,507,315 75,165,582,340 718,806,504 54,375,654,674 748,100,421 48,767,746,598 793,102,291 63,866,327,788 825,980,978 61,692,012,649LIMESAND–LIMESTONE–DOLOMITE 3,721,270 17,742,838 4,157,630 21,403,515 4,091,849 24,239,571 3,116,623 23,378,197 4,903,039 33,175,834 4,446,486 28,826,046 4,178,360 26,012,783 3,943,155 26,685,585MANGANESE ORE t 873,064 392,302,135 846,293 331,693,574 649,695 n/a 711,536 n/a 800,985 n/a 425,303 146,188,090 236,565 n/a 392,654 n/aNICKEL INDUSTRYCobalt t 3,767 146,480,315 4,950 143,627,596 6,200 159,147,805 6,236 175,117,788 6,036 210,567,512 5,479 174,846,826 4,759 239,639,935 5,194 514,496,641Nickel t 194,177 4,686,173,467 209,370 3,721,964,396 227,463 3,511,711,762 209,710 3,419,023,118 183,315 3,169,605,001 175,752 2,202,734,451 157,564 2,094,500,242 163,401 2,643,240,706Palladium and Platinum By-Product kg 440 7,036,097 626 14,909,443 658 15,045,619 1,015 28,523,097 464 13,380,730 687 16,656,441 9,081 21,808,381 10,795 26,219,908TOTAL NICKEL INDUSTRY 4,839,689,879 3,880,501,435 3,685,905,186 3,622,664,003 3,393,553,243 2,394,237,718 2,355,948,558 3,183,957,255PETROLEUM Condensate kl 6,881,791 3,988,524,336 5,888,608 3,842,111,571 6,116,968 3,922,032,524 5,559,221 4,032,961,171 6,753,212 3,488,373,293 6,775,142 2,213,709,834 6,037,603 2,228,626,174 7,115,286 3,304,673,707Crude Oil kl 13,924,847 8,528,862,521 11,121,616 7,676,633,459 8,609,425 5,972,058,200 7,303,854 5,724,962,343 7,844,408 4,493,521,248 7,685,922 3,089,384,046 5,404,294 2,111,578,898 4,807,722 2,295,452,854LNG t 17,290,205 8,328,719,118 15,610,570 9,495,543,132 19,804,919 12,147,214,397 20,049,826 14,804,193,332 20,447,845 13,817,045,230 20,955,641 10,764,545,353 28,685,477 12,728,310,038 37,893,517 19,077,592,020LPG – Butane and Propane t 923,763 774,197,459 835,271 734,484,653 752,910 634,052,635 630,636 586,349,207 553,055 405,561,785 531,595 249,059,073 527,391 273,097,308 451,242 331,271,410Natural Gas ‘000m3 8,981,495 1,364,589,067 9,080,655 1,449,810,229 8,713,949 1,434,550,772 9,368,839 1,655,819,689 9,875,339 1,826,592,934 10,223,641 1,913,134,982 9,708,934 1,830,012,904 10,039,526 1,634,082,335TOTAL PETROLEUM 22,984,892,501 23,198,583,045 24,109,908,528 26,804,285,741 24,031,094,489 18,229,833,288 19,171,625,322 26,643,072,327SALT t 12,246,504 366,935,890 12,807,461 353,776,447 12,389,643 381,652,888 12,992,042 410,097,847 11,726,606 374,622,315 10,974,721 336,253,755 10,874,279 292,285,826 12,963,778 301,119,173SILICA–SILICA SAND t 430,363 13,304,556 452,638 14,742,316 498,232 16,886,756 449,587 15,847,051 483,809 17,927,564 581,966 18,072,793 728,859 20,364,867 974,445 18,775,811SILVER kg 83,550 76,065,087 120,080 115,704,896 123,740 100,560,679 137,180 93,414,212 150,581 95,972,011 155,292 104,786,546 142,868 98,465,480 153,468 98,581,882TIN–TANTALUM–LITHIUMSpodumene t 352,418 103,317,680 461,121 138,413,821 485,879 178,786,684 342,065 150,564,377 489,074 245,874,387 417,286 241,996,770 887,408 589,513,148 2,130,016 1,573,933,340Tantalite t 95 n/a 347 49,931,724 201 17,940,739 58 4,074,774 70 n/a 183 n/a n/a n/a Tin Metal t 22 281,633 62 1,372,580 193 2,703,339 – n/a 14 n/a 22 n/a n/a n/a TOTAL TIN–TANTALUM–LITHIUM 131,425,734 189,718,125 199,430,762 154,639,152 251,051,748 269,771,196 605,595,575 1,592,473,662OTHER (May include Feldspar, Red Oxide, Manganese, Vanadium, Chromite, Rare Earths, Spongolite, Talc and Diamonds)
t 64,129,732 103,198,080 425,002,389 494,402,726 507,533,600 53,048,436 300,923,570 892,620,260
TOTAL VALUE 101,359,828,103 105,594,886,357 101,488,122,472 123,060,999,987 100,152,862,549 87,999,823,537 105,330,107,008 114,950,377,676
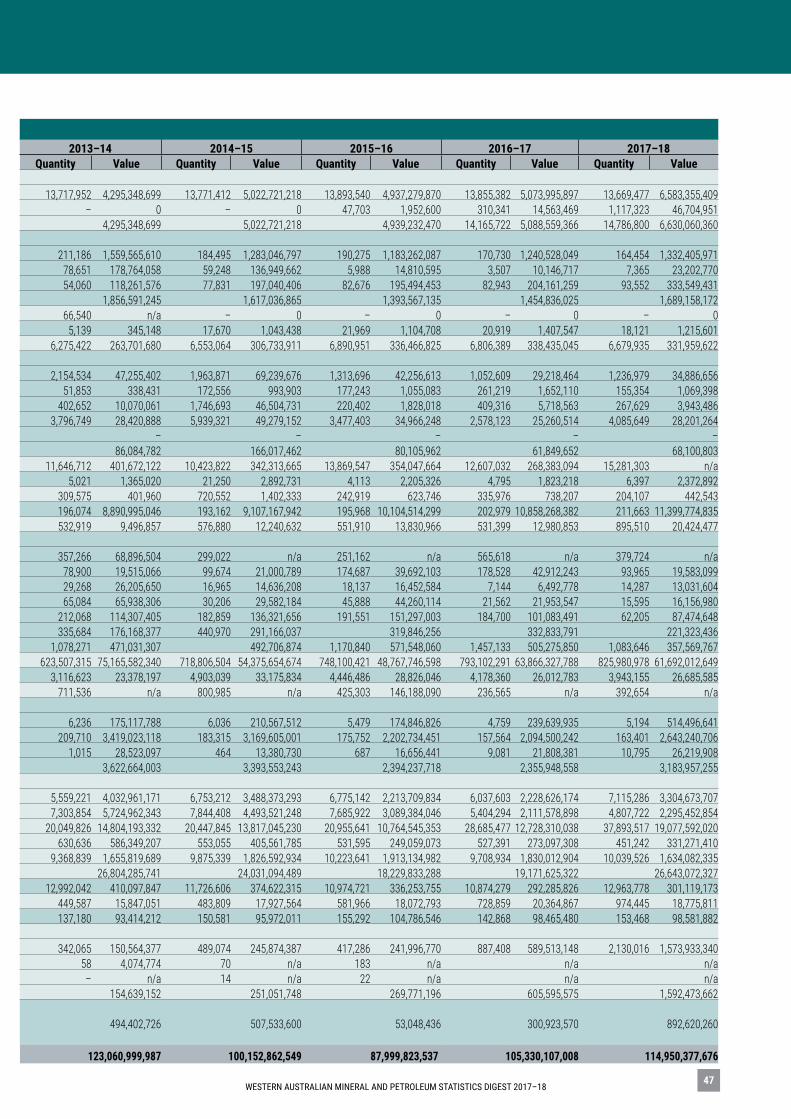
WESTERN AUSTRALIAN MINERAL AND PETROLEUM STATISTICS DIGEST 2017–18WESTERN AUSTRALIAN MINERAL AND PETROLEUM STATISTICS DIGEST 2017–18 47
TABLE 5. Quantity and value of selected major commodities2010–11 2011–12 2012–13 2013–14 2014–15 2015–16 2016–17 2017–18
COMMODITY UNIT Quantity Value Quantity Value Quantity Value Quantity Value Quantity Value Quantity Value Quantity Value Quantity ValueALUMINA AND BAUXITEAlumina t 12,280,629 3,990,376,375 12,424,860 4,010,219,382 13,530,752 4,027,810,217 13,717,952 4,295,348,699 13,771,412 5,022,721,218 13,893,540 4,937,279,870 13,855,382 5,073,995,897 13,669,477 6,583,355,409Bauxite t – 0 – 0 – 0 – 0 – 0 47,703 1,952,600 310,341 14,563,469 1,117,323 46,704,951TOTAL ALUMINA & BAUXITE 3,990,376,375 4,010,219,382 4,027,810,217 4,295,348,699 5,022,721,218 4,939,232,470 14,165,722 5,088,559,366 14,786,800 6,630,060,360BASE METALSCopper Metal t 150,030 1,332,356,150 159,171 1,180,779,699 209,266 1,423,043,554 211,186 1,559,565,610 184,495 1,283,046,797 190,275 1,183,262,087 170,730 1,240,528,049 164,454 1,332,405,971Lead Metal t 40,764 100,068,469 6,922 13,839,831 16,641 35,049,525 78,651 178,764,058 59,248 136,949,662 5,988 14,810,595 3,507 10,146,717 7,365 23,202,770Zinc Metal t 70,537 162,108,265 63,503 121,984,210 55,848 103,867,913 54,060 118,261,576 77,831 197,040,406 82,676 195,494,453 82,943 204,161,259 93,552 333,549,431TOTAL BASE METALS 1,594,532,884 1,316,603,740 1,561,960,992 1,856,591,245 1,617,036,865 1,393,567,135 1,454,836,025 1,689,158,172CHROMITE t 81,925 n/a 164,219 n/a 195,772 n/a 66,540 n/a – 0 – 0 – 0 – 0CLAYS 75,091 1,663,209 5,139 345,148 17,670 1,043,438 21,969 1,104,708 20,919 1,407,547 18,121 1,215,601COAL t 7,234,455 296,259,551 6,986,433 289,629,252 7,494,280 310,812,886 6,275,422 263,701,680 6,553,064 306,733,911 6,890,951 336,466,825 6,806,389 338,435,045 6,679,935 331,959,622CONSTRUCTION MATERIALSAggregate t 1,934,860 43,801,514 3,722,254 97,854,121 4,391,376 148,775,764 2,154,534 47,255,402 1,963,871 69,239,676 1,313,696 42,256,613 1,052,609 29,218,464 1,236,979 34,886,656Gravel t 230,785 1,760,531 283,899 2,454,938 561,135 3,947,125 51,853 338,431 172,556 993,903 177,243 1,055,083 261,219 1,652,110 155,354 1,069,398Rock t 298,262 3,251,624 509,983 6,262,935 1,109,761 27,142,818 402,652 10,070,061 1,746,693 46,504,731 220,402 1,828,018 409,316 5,718,563 267,629 3,943,486Sand t 4,818,062 34,712,549 6,286,702 54,502,065 5,415,504 62,093,160 3,796,749 28,420,888 5,939,321 49,279,152 3,477,403 34,966,248 2,578,123 25,260,514 4,085,649 28,201,264Other – – – – –TOTAL CONSTRUCTION MATERIALS 83,526,218 161,074,059 241,958,866 86,084,782 166,017,462 80,105,962 61,849,652 68,100,803DIAMONDS ct 10,121,587 303,092,471 8,689,501 343,293,394 9,608,685 355,964,877 11,646,712 401,672,122 10,423,822 342,313,665 13,869,547 354,047,664 12,607,032 268,383,094 15,281,303 n/aDIMENSION STONE 8,669 861,017 7,590 1,450,510 4,196 1,221,243 5,021 1,365,020 21,250 2,892,731 4,113 2,205,326 4,795 1,823,218 6,397 2,372,892GEM & SEMI-PRECIOUS STONES kg 292,458 288,460 227,963 280,727 197,832 254,158 309,575 401,960 720,552 1,402,333 242,919 623,746 335,976 738,207 204,107 442,543GOLD kg 183,751 8,184,187,456 180,771 9,421,483,327 179,849 9,022,522,018 196,074 8,890,995,046 193,162 9,107,167,942 195,968 10,104,514,299 202,979 10,858,268,382 211,663 11,399,774,835GYPSUM t 587,374 10,931,443 334,178 4,690,980 1,575,769 7,027,903 532,919 9,496,857 576,880 12,240,632 551,910 13,830,966 531,399 12,980,853 895,510 20,424,477MINERAL SANDSGarnet t 226,620 42,689,083 301,945 59,591,878 317,336 64,834,324 357,266 68,896,504 299,022 n/a 251,162 n/a 565,618 n/a 379,724 n/aIlmenite t 394,033 52,763,228 332,012 58,190,544 270,770 72,680,422 78,900 19,515,066 99,674 21,000,789 174,687 39,692,103 178,528 42,912,243 93,965 19,583,099Leucoxene t 26,030 12,165,130 22,231 16,691,847 29,071 31,231,788 29,268 26,205,650 16,965 14,636,208 18,137 16,452,584 7,144 6,492,778 14,287 13,031,604Rutile t 49,745 35,431,242 38870.25 52,250,227 46,938 80,261,379 65,084 65,938,306 30,206 29,582,184 45,888 44,260,114 21,562 21,953,547 15,595 16,156,980 Zircon t 298,644 197,514,001 180,429 219,219,649 215,831 189,547,782 212,068 114,307,405 182,859 136,321,656 191,551 151,297,003 184,700 101,083,491 62,205 87,474,648Other t 421,723 135,619,863 540,074 458,168,418 475,411 372,123,979 335,684 176,168,377 440,970 291,166,037 319,846,256 332,833,791 221,323,436TOTAL MINERAL SANDS 1,416,795 476,182,547 1,415,561 864,112,563 1,355,357 810,679,675 1,078,271 471,031,307 492,706,874 1,170,840 571,548,060 1,457,133 505,275,850 1,083,646 357,569,767IRON ORE t 397,604,213 57,533,101,329 454,385,064 60,972,726,991 511,760,416 56,204,322,877 623,507,315 75,165,582,340 718,806,504 54,375,654,674 748,100,421 48,767,746,598 793,102,291 63,866,327,788 825,980,978 61,692,012,649LIMESAND–LIMESTONE–DOLOMITE 3,721,270 17,742,838 4,157,630 21,403,515 4,091,849 24,239,571 3,116,623 23,378,197 4,903,039 33,175,834 4,446,486 28,826,046 4,178,360 26,012,783 3,943,155 26,685,585MANGANESE ORE t 873,064 392,302,135 846,293 331,693,574 649,695 n/a 711,536 n/a 800,985 n/a 425,303 146,188,090 236,565 n/a 392,654 n/aNICKEL INDUSTRYCobalt t 3,767 146,480,315 4,950 143,627,596 6,200 159,147,805 6,236 175,117,788 6,036 210,567,512 5,479 174,846,826 4,759 239,639,935 5,194 514,496,641Nickel t 194,177 4,686,173,467 209,370 3,721,964,396 227,463 3,511,711,762 209,710 3,419,023,118 183,315 3,169,605,001 175,752 2,202,734,451 157,564 2,094,500,242 163,401 2,643,240,706Palladium and Platinum By-Product kg 440 7,036,097 626 14,909,443 658 15,045,619 1,015 28,523,097 464 13,380,730 687 16,656,441 9,081 21,808,381 10,795 26,219,908TOTAL NICKEL INDUSTRY 4,839,689,879 3,880,501,435 3,685,905,186 3,622,664,003 3,393,553,243 2,394,237,718 2,355,948,558 3,183,957,255PETROLEUM Condensate kl 6,881,791 3,988,524,336 5,888,608 3,842,111,571 6,116,968 3,922,032,524 5,559,221 4,032,961,171 6,753,212 3,488,373,293 6,775,142 2,213,709,834 6,037,603 2,228,626,174 7,115,286 3,304,673,707Crude Oil kl 13,924,847 8,528,862,521 11,121,616 7,676,633,459 8,609,425 5,972,058,200 7,303,854 5,724,962,343 7,844,408 4,493,521,248 7,685,922 3,089,384,046 5,404,294 2,111,578,898 4,807,722 2,295,452,854LNG t 17,290,205 8,328,719,118 15,610,570 9,495,543,132 19,804,919 12,147,214,397 20,049,826 14,804,193,332 20,447,845 13,817,045,230 20,955,641 10,764,545,353 28,685,477 12,728,310,038 37,893,517 19,077,592,020LPG – Butane and Propane t 923,763 774,197,459 835,271 734,484,653 752,910 634,052,635 630,636 586,349,207 553,055 405,561,785 531,595 249,059,073 527,391 273,097,308 451,242 331,271,410Natural Gas ‘000m3 8,981,495 1,364,589,067 9,080,655 1,449,810,229 8,713,949 1,434,550,772 9,368,839 1,655,819,689 9,875,339 1,826,592,934 10,223,641 1,913,134,982 9,708,934 1,830,012,904 10,039,526 1,634,082,335TOTAL PETROLEUM 22,984,892,501 23,198,583,045 24,109,908,528 26,804,285,741 24,031,094,489 18,229,833,288 19,171,625,322 26,643,072,327SALT t 12,246,504 366,935,890 12,807,461 353,776,447 12,389,643 381,652,888 12,992,042 410,097,847 11,726,606 374,622,315 10,974,721 336,253,755 10,874,279 292,285,826 12,963,778 301,119,173SILICA–SILICA SAND t 430,363 13,304,556 452,638 14,742,316 498,232 16,886,756 449,587 15,847,051 483,809 17,927,564 581,966 18,072,793 728,859 20,364,867 974,445 18,775,811SILVER kg 83,550 76,065,087 120,080 115,704,896 123,740 100,560,679 137,180 93,414,212 150,581 95,972,011 155,292 104,786,546 142,868 98,465,480 153,468 98,581,882TIN–TANTALUM–LITHIUMSpodumene t 352,418 103,317,680 461,121 138,413,821 485,879 178,786,684 342,065 150,564,377 489,074 245,874,387 417,286 241,996,770 887,408 589,513,148 2,130,016 1,573,933,340Tantalite t 95 n/a 347 49,931,724 201 17,940,739 58 4,074,774 70 n/a 183 n/a n/a n/a Tin Metal t 22 281,633 62 1,372,580 193 2,703,339 – n/a 14 n/a 22 n/a n/a n/a TOTAL TIN–TANTALUM–LITHIUM 131,425,734 189,718,125 199,430,762 154,639,152 251,051,748 269,771,196 605,595,575 1,592,473,662OTHER (May include Feldspar, Red Oxide, Manganese, Vanadium, Chromite, Rare Earths, Spongolite, Talc and Diamonds)
t 64,129,732 103,198,080 425,002,389 494,402,726 507,533,600 53,048,436 300,923,570 892,620,260
TOTAL VALUE 101,359,828,103 105,594,886,357 101,488,122,472 123,060,999,987 100,152,862,549 87,999,823,537 105,330,107,008 114,950,377,676
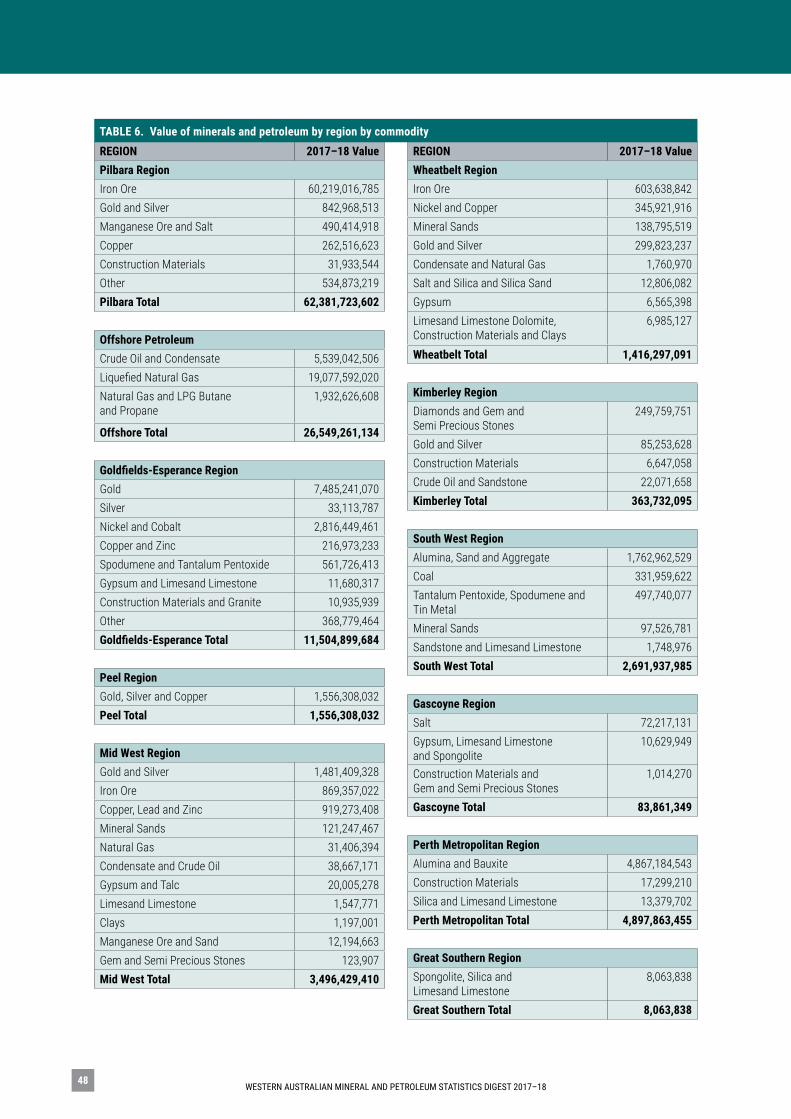
WESTERN AUSTRALIAN MINERAL AND PETROLEUM STATISTICS DIGEST 2017–18WESTERN AUSTRALIAN MINERAL AND PETROLEUM STATISTICS DIGEST 2017–1848
TABLE 6. Value of minerals and petroleum by region by commodityREGION 2017–18 ValuePilbara RegionIron Ore 60,219,016,785Gold and Silver 842,968,513Manganese Ore and Salt 490,414,918Copper 262,516,623Construction Materials 31,933,544Other 534,873,219Pilbara Total 62,381,723,602
Offshore PetroleumCrude Oil and Condensate 5,539,042,506Liquefied Natural Gas 19,077,592,020Natural Gas and LPG Butane and Propane
1,932,626,608
Offshore Total 26,549,261,134
Goldfields-Esperance RegionGold 7,485,241,070Silver 33,113,787Nickel and Cobalt 2,816,449,461Copper and Zinc 216,973,233Spodumene and Tantalum Pentoxide 561,726,413Gypsum and Limesand Limestone 11,680,317Construction Materials and Granite 10,935,939Other 368,779,464Goldfields-Esperance Total 11,504,899,684
Peel RegionGold, Silver and Copper 1,556,308,032Peel Total 1,556,308,032
Mid West RegionGold and Silver 1,481,409,328Iron Ore 869,357,022Copper, Lead and Zinc 919,273,408Mineral Sands 121,247,467Natural Gas 31,406,394Condensate and Crude Oil 38,667,171Gypsum and Talc 20,005,278Limesand Limestone 1,547,771Clays 1,197,001Manganese Ore and Sand 12,194,663Gem and Semi Precious Stones 123,907Mid West Total 3,496,429,410
REGION 2017–18 ValueWheatbelt RegionIron Ore 603,638,842Nickel and Copper 345,921,916Mineral Sands 138,795,519Gold and Silver 299,823,237Condensate and Natural Gas 1,760,970Salt and Silica and Silica Sand 12,806,082Gypsum 6,565,398Limesand Limestone Dolomite, Construction Materials and Clays
6,985,127
Wheatbelt Total 1,416,297,091
Kimberley RegionDiamonds and Gem and Semi Precious Stones
249,759,751
Gold and Silver 85,253,628Construction Materials 6,647,058Crude Oil and Sandstone 22,071,658Kimberley Total 363,732,095
South West RegionAlumina, Sand and Aggregate 1,762,962,529Coal 331,959,622Tantalum Pentoxide, Spodumene and Tin Metal
497,740,077
Mineral Sands 97,526,781Sandstone and Limesand Limestone 1,748,976South West Total 2,691,937,985
Gascoyne RegionSalt 72,217,131Gypsum, Limesand Limestone and Spongolite
10,629,949
Construction Materials and Gem and Semi Precious Stones
1,014,270
Gascoyne Total 83,861,349
Perth Metropolitan RegionAlumina and Bauxite 4,867,184,543Construction Materials 17,299,210Silica and Limesand Limestone 13,379,702Perth Metropolitan Total 4,897,863,455
Great Southern RegionSpongolite, Silica and Limesand Limestone
8,063,838
Great Southern Total 8,063,838
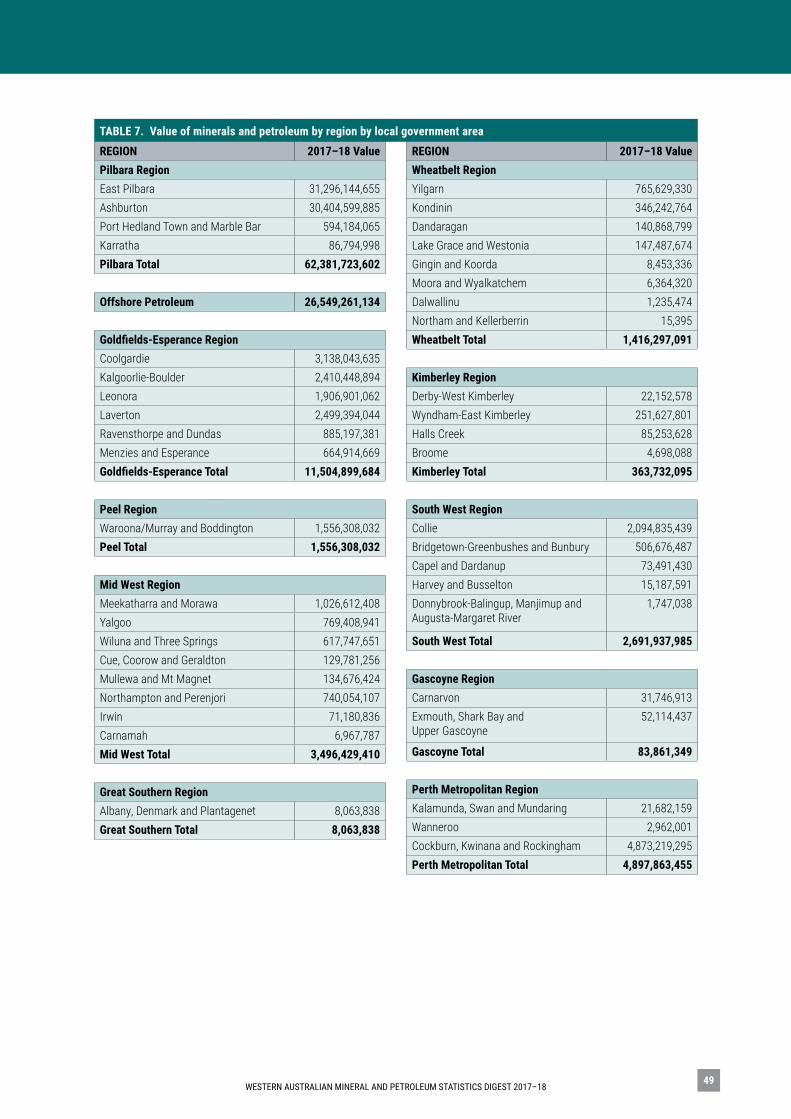
WESTERN AUSTRALIAN MINERAL AND PETROLEUM STATISTICS DIGEST 2017–18WESTERN AUSTRALIAN MINERAL AND PETROLEUM STATISTICS DIGEST 2017–18 49
TABLE 7. Value of minerals and petroleum by region by local government area
REGION 2017–18 ValuePilbara RegionEast Pilbara 31,296,144,655Ashburton 30,404,599,885Port Hedland Town and Marble Bar 594,184,065Karratha 86,794,998Pilbara Total 62,381,723,602
Offshore Petroleum 26,549,261,134
Goldfields-Esperance RegionCoolgardie 3,138,043,635Kalgoorlie-Boulder 2,410,448,894Leonora 1,906,901,062Laverton 2,499,394,044Ravensthorpe and Dundas 885,197,381Menzies and Esperance 664,914,669Goldfields-Esperance Total 11,504,899,684
Peel RegionWaroona/Murray and Boddington 1,556,308,032Peel Total 1,556,308,032
Mid West RegionMeekatharra and Morawa 1,026,612,408Yalgoo 769,408,941Wiluna and Three Springs 617,747,651Cue, Coorow and Geraldton 129,781,256Mullewa and Mt Magnet 134,676,424Northampton and Perenjori 740,054,107Irwin 71,180,836Carnamah 6,967,787Mid West Total 3,496,429,410
Great Southern RegionAlbany, Denmark and Plantagenet 8,063,838Great Southern Total 8,063,838
REGION 2017–18 ValueWheatbelt RegionYilgarn 765,629,330Kondinin 346,242,764Dandaragan 140,868,799Lake Grace and Westonia 147,487,674Gingin and Koorda 8,453,336Moora and Wyalkatchem 6,364,320Dalwallinu 1,235,474Northam and Kellerberrin 15,395Wheatbelt Total 1,416,297,091
Kimberley RegionDerby-West Kimberley 22,152,578Wyndham-East Kimberley 251,627,801Halls Creek 85,253,628Broome 4,698,088Kimberley Total 363,732,095
South West RegionCollie 2,094,835,439Bridgetown-Greenbushes and Bunbury 506,676,487Capel and Dardanup 73,491,430Harvey and Busselton 15,187,591Donnybrook-Balingup, Manjimup and Augusta-Margaret River
1,747,038
South West Total 2,691,937,985
Gascoyne RegionCarnarvon 31,746,913Exmouth, Shark Bay and Upper Gascoyne
52,114,437
Gascoyne Total 83,861,349
Perth Metropolitan RegionKalamunda, Swan and Mundaring 21,682,159Wanneroo 2,962,001Cockburn, Kwinana and Rockingham 4,873,219,295Perth Metropolitan Total 4,897,863,455
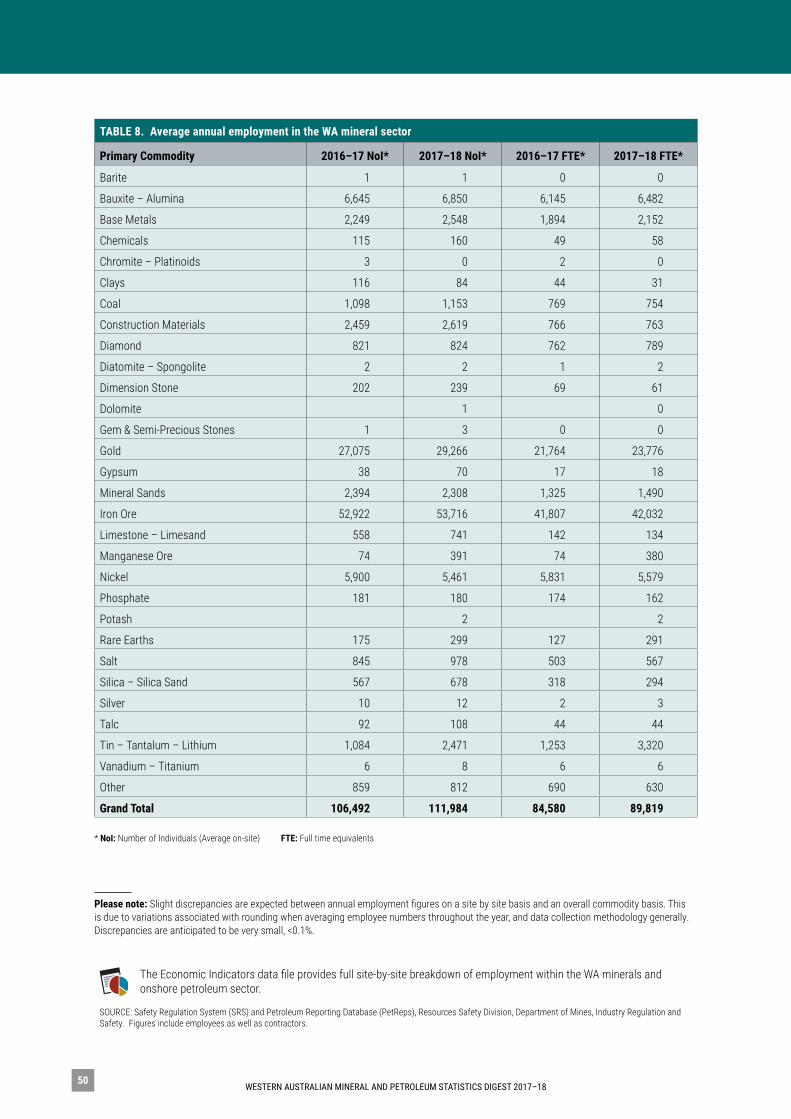
WESTERN AUSTRALIAN MINERAL AND PETROLEUM STATISTICS DIGEST 2017–18WESTERN AUSTRALIAN MINERAL AND PETROLEUM STATISTICS DIGEST 2017–1850
TABLE 8. Average annual employment in the WA mineral sector
Primary Commodity 2016–17 NoI* 2017–18 NoI* 2016–17 FTE* 2017–18 FTE*
Barite 1 1 0 0
Bauxite – Alumina 6,645 6,850 6,145 6,482
Base Metals 2,249 2,548 1,894 2,152
Chemicals 115 160 49 58
Chromite – Platinoids 3 0 2 0
Clays 116 84 44 31
Coal 1,098 1,153 769 754
Construction Materials 2,459 2,619 766 763
Diamond 821 824 762 789
Diatomite – Spongolite 2 2 1 2
Dimension Stone 202 239 69 61
Dolomite 1 0
Gem & Semi-Precious Stones 1 3 0 0
Gold 27,075 29,266 21,764 23,776
Gypsum 38 70 17 18
Mineral Sands 2,394 2,308 1,325 1,490
Iron Ore 52,922 53,716 41,807 42,032
Limestone – Limesand 558 741 142 134
Manganese Ore 74 391 74 380
Nickel 5,900 5,461 5,831 5,579
Phosphate 181 180 174 162
Potash 2 2
Rare Earths 175 299 127 291
Salt 845 978 503 567
Silica – Silica Sand 567 678 318 294
Silver 10 12 2 3
Talc 92 108 44 44
Tin – Tantalum – Lithium 1,084 2,471 1,253 3,320
Vanadium – Titanium 6 8 6 6
Other 859 812 690 630
Grand Total 106,492 111,984 84,580 89,819
* NoI: Number of Individuals (Average on-site) FTE: Full time equivalents
Please note: Slight discrepancies are expected between annual employment figures on a site by site basis and an overall commodity basis. This is due to variations associated with rounding when averaging employee numbers throughout the year, and data collection methodology generally. Discrepancies are anticipated to be very small, <0.1%.
The Economic Indicators data file provides full site-by-site breakdown of employment within the WA minerals and onshore petroleum sector.
SOURCE: Safety Regulation System (SRS) and Petroleum Reporting Database (PetReps), Resources Safety Division, Department of Mines, Industry Regulation and Safety. Figures include employees as well as contractors.
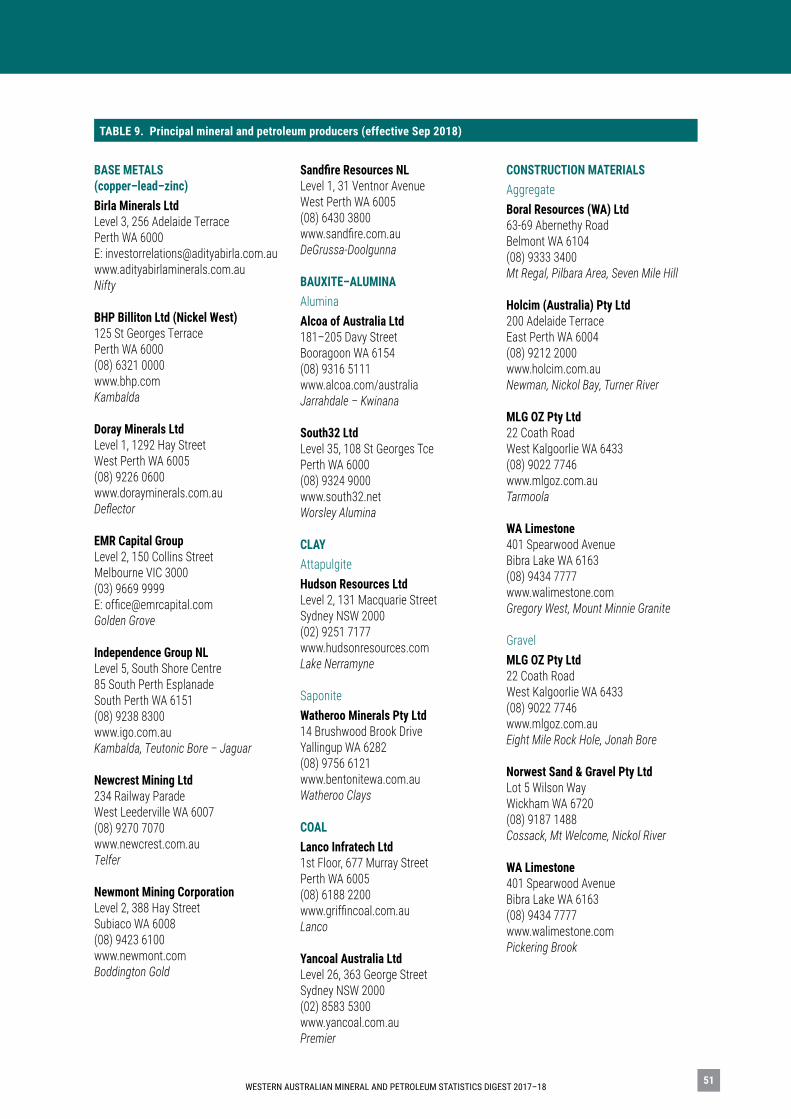
WESTERN AUSTRALIAN MINERAL AND PETROLEUM STATISTICS DIGEST 2017–18WESTERN AUSTRALIAN MINERAL AND PETROLEUM STATISTICS DIGEST 2017–18 51
TABLE 4. Quantity and Value of Minerals and Petroleum ContinuedTABLE 9. Principal mineral and petroleum producers (effective Sep 2018)
BASE METALS (copper–lead–zinc)Birla Minerals LtdLevel 3, 256 Adelaide TerracePerth WA 6000E: investorrelations@adityabirla.com.auwww.adityabirlaminerals.com.auNifty
BHP Billiton Ltd (Nickel West)125 St Georges TerracePerth WA 6000(08) 6321 0000www.bhp.comKambalda
Doray Minerals LtdLevel 1, 1292 Hay StreetWest Perth WA 6005(08) 9226 0600www.dorayminerals.com.auDeflector
EMR Capital GroupLevel 2, 150 Collins StreetMelbourne VIC 3000(03) 9669 9999E: [email protected] Grove
Independence Group NLLevel 5, South Shore Centre85 South Perth EsplanadeSouth Perth WA 6151(08) 9238 8300www.igo.com.auKambalda, Teutonic Bore – Jaguar
Newcrest Mining Ltd234 Railway ParadeWest Leederville WA 6007(08) 9270 7070www.newcrest.com.auTelfer
Newmont Mining CorporationLevel 2, 388 Hay StreetSubiaco WA 6008(08) 9423 6100www.newmont.comBoddington Gold
Sandfire Resources NLLevel 1, 31 Ventnor AvenueWest Perth WA 6005(08) 6430 3800www.sandfire.com.auDeGrussa-Doolgunna
BAUXITE–ALUMINAAluminaAlcoa of Australia Ltd181–205 Davy Street Booragoon WA 6154 (08) 9316 5111www.alcoa.com/australiaJarrahdale – Kwinana
South32 LtdLevel 35, 108 St Georges TcePerth WA 6000(08) 9324 9000www.south32.netWorsley Alumina
CLAYAttapulgite Hudson Resources LtdLevel 2, 131 Macquarie StreetSydney NSW 2000(02) 9251 7177www.hudsonresources.com Lake Nerramyne
SaponiteWatheroo Minerals Pty Ltd14 Brushwood Brook DriveYallingup WA 6282(08) 9756 6121www.bentonitewa.com.au Watheroo Clays
COALLanco Infratech Ltd1st Floor, 677 Murray StreetPerth WA 6005(08) 6188 2200 www.griffincoal.com.auLanco
Yancoal Australia LtdLevel 26, 363 George StreetSydney NSW 2000(02) 8583 5300www.yancoal.com.auPremier
CONSTRUCTION MATERIALSAggregateBoral Resources (WA) Ltd63-69 Abernethy RoadBelmont WA 6104(08) 9333 3400Mt Regal, Pilbara Area, Seven Mile Hill
Holcim (Australia) Pty Ltd200 Adelaide TerraceEast Perth WA 6004(08) 9212 2000www.holcim.com.au Newman, Nickol Bay, Turner River
MLG OZ Pty Ltd22 Coath RoadWest Kalgoorlie WA 6433(08) 9022 7746www.mlgoz.com.auTarmoola
WA Limestone401 Spearwood AvenueBibra Lake WA 6163(08) 9434 7777www.walimestone.comGregory West, Mount Minnie Granite
GravelMLG OZ Pty Ltd22 Coath RoadWest Kalgoorlie WA 6433(08) 9022 7746www.mlgoz.com.auEight Mile Rock Hole, Jonah Bore
Norwest Sand & Gravel Pty LtdLot 5 Wilson WayWickham WA 6720(08) 9187 1488Cossack, Mt Welcome, Nickol River
WA Limestone401 Spearwood AvenueBibra Lake WA 6163(08) 9434 7777www.walimestone.comPickering Brook
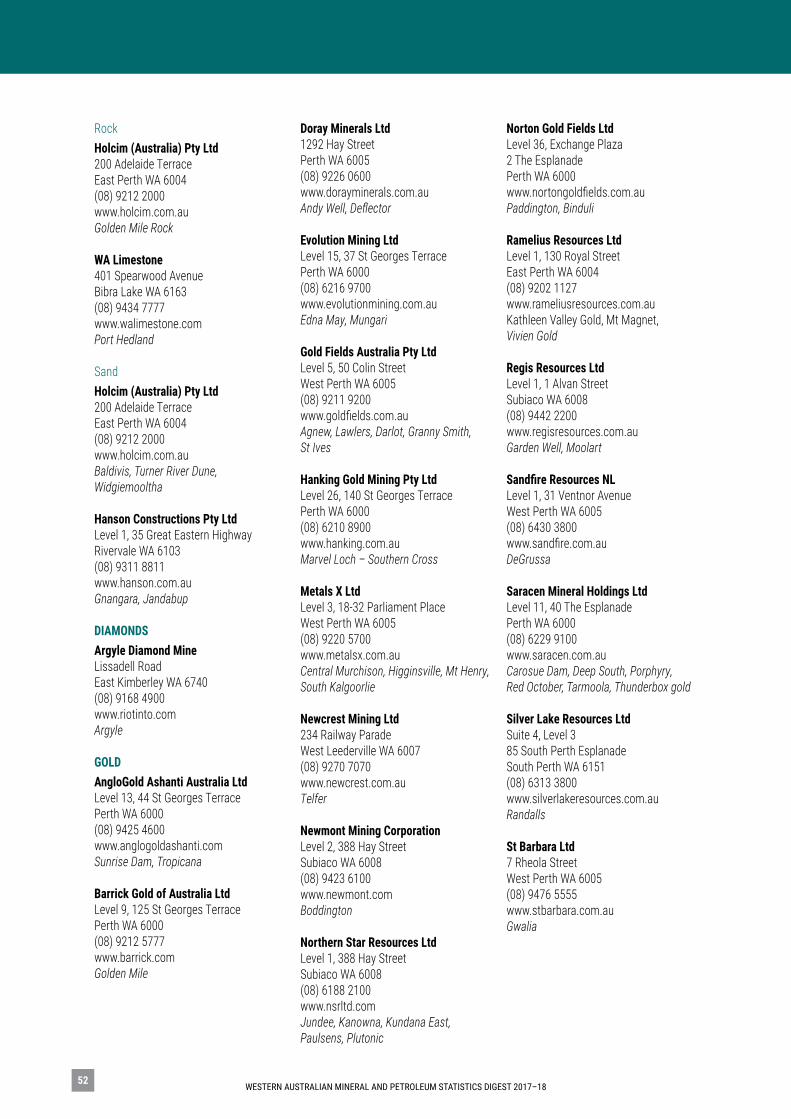
WESTERN AUSTRALIAN MINERAL AND PETROLEUM STATISTICS DIGEST 2017–18WESTERN AUSTRALIAN MINERAL AND PETROLEUM STATISTICS DIGEST 2017–1852
RockHolcim (Australia) Pty Ltd200 Adelaide TerraceEast Perth WA 6004(08) 9212 2000www.holcim.com.auGolden Mile Rock
WA Limestone401 Spearwood AvenueBibra Lake WA 6163(08) 9434 7777www.walimestone.comPort Hedland
SandHolcim (Australia) Pty Ltd200 Adelaide TerraceEast Perth WA 6004(08) 9212 2000www.holcim.com.au Baldivis, Turner River Dune, Widgiemooltha
Hanson Constructions Pty LtdLevel 1, 35 Great Eastern HighwayRivervale WA 6103(08) 9311 8811www.hanson.com.auGnangara, Jandabup
DIAMONDSArgyle Diamond MineLissadell RoadEast Kimberley WA 6740(08) 9168 4900www.riotinto.comArgyle
GOLDAngloGold Ashanti Australia LtdLevel 13, 44 St Georges Terrace Perth WA 6000 (08) 9425 4600 www.anglogoldashanti.comSunrise Dam, Tropicana
Barrick Gold of Australia LtdLevel 9, 125 St Georges TerracePerth WA 6000(08) 9212 5777www.barrick.comGolden Mile
Doray Minerals Ltd1292 Hay StreetPerth WA 6005(08) 9226 0600www.dorayminerals.com.auAndy Well, Deflector
Evolution Mining LtdLevel 15, 37 St Georges TerracePerth WA 6000(08) 6216 9700www.evolutionmining.com.au Edna May, Mungari
Gold Fields Australia Pty LtdLevel 5, 50 Colin StreetWest Perth WA 6005(08) 9211 9200www.goldfields.com.auAgnew, Lawlers, Darlot, Granny Smith, St Ives
Hanking Gold Mining Pty LtdLevel 26, 140 St Georges TerracePerth WA 6000(08) 6210 8900www.hanking.com.auMarvel Loch – Southern Cross
Metals X LtdLevel 3, 18-32 Parliament PlaceWest Perth WA 6005(08) 9220 5700www.metalsx.com.auCentral Murchison, Higginsville, Mt Henry, South Kalgoorlie
Newcrest Mining Ltd234 Railway ParadeWest Leederville WA 6007(08) 9270 7070www.newcrest.com.auTelfer
Newmont Mining CorporationLevel 2, 388 Hay StreetSubiaco WA 6008(08) 9423 6100www.newmont.comBoddington
Northern Star Resources LtdLevel 1, 388 Hay StreetSubiaco WA 6008(08) 6188 2100www.nsrltd.com Jundee, Kanowna, Kundana East, Paulsens, Plutonic
Norton Gold Fields LtdLevel 36, Exchange Plaza2 The Esplanade Perth WA 6000www.nortongoldfields.com.auPaddington, Binduli
Ramelius Resources LtdLevel 1, 130 Royal StreetEast Perth WA 6004(08) 9202 1127www.rameliusresources.com.auKathleen Valley Gold, Mt Magnet, Vivien Gold
Regis Resources LtdLevel 1, 1 Alvan StreetSubiaco WA 6008(08) 9442 2200www.regisresources.com.au Garden Well, Moolart
Sandfire Resources NLLevel 1, 31 Ventnor AvenueWest Perth WA 6005(08) 6430 3800www.sandfire.com.auDeGrussa
Saracen Mineral Holdings LtdLevel 11, 40 The EsplanadePerth WA 6000(08) 6229 9100www.saracen.com.auCarosue Dam, Deep South, Porphyry, Red October, Tarmoola, Thunderbox gold
Silver Lake Resources LtdSuite 4, Level 385 South Perth EsplanadeSouth Perth WA 6151(08) 6313 3800www.silverlakeresources.com.auRandalls
St Barbara Ltd7 Rheola StreetWest Perth WA 6005(08) 9476 5555www.stbarbara.com.au Gwalia
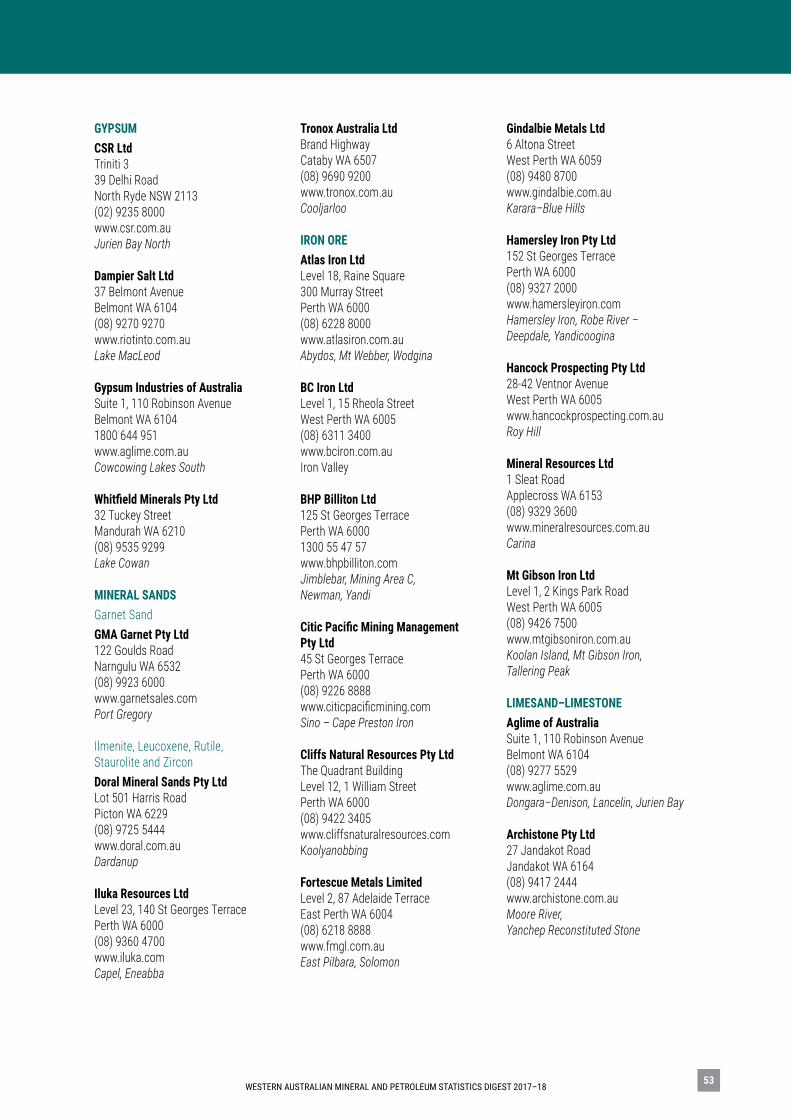
WESTERN AUSTRALIAN MINERAL AND PETROLEUM STATISTICS DIGEST 2017–18WESTERN AUSTRALIAN MINERAL AND PETROLEUM STATISTICS DIGEST 2017–18 53
GYPSUMCSR LtdTriniti 339 Delhi RoadNorth Ryde NSW 2113(02) 9235 8000www.csr.com.auJurien Bay North
Dampier Salt Ltd37 Belmont AvenueBelmont WA 6104(08) 9270 9270www.riotinto.com.auLake MacLeod
Gypsum Industries of AustraliaSuite 1, 110 Robinson AvenueBelmont WA 61041800 644 951www.aglime.com.auCowcowing Lakes South
Whitfield Minerals Pty Ltd32 Tuckey StreetMandurah WA 6210(08) 9535 9299Lake Cowan
MINERAL SANDSGarnet SandGMA Garnet Pty Ltd122 Goulds RoadNarngulu WA 6532(08) 9923 6000 www.garnetsales.com Port Gregory
Ilmenite, Leucoxene, Rutile, Staurolite and Zircon Doral Mineral Sands Pty LtdLot 501 Harris RoadPicton WA 6229(08) 9725 5444www.doral.com.au Dardanup
Iluka Resources LtdLevel 23, 140 St Georges TerracePerth WA 6000(08) 9360 4700www.iluka.comCapel, Eneabba
Tronox Australia LtdBrand HighwayCataby WA 6507(08) 9690 9200www.tronox.com.au Cooljarloo
IRON OREAtlas Iron LtdLevel 18, Raine Square300 Murray StreetPerth WA 6000(08) 6228 8000www.atlasiron.com.auAbydos, Mt Webber, Wodgina
BC Iron LtdLevel 1, 15 Rheola StreetWest Perth WA 6005(08) 6311 3400www.bciron.com.au Iron Valley
BHP Billiton Ltd125 St Georges TerracePerth WA 60001300 55 47 57www.bhpbilliton.comJimblebar, Mining Area C, Newman, Yandi
Citic Pacific Mining Management Pty Ltd45 St Georges TerracePerth WA 6000(08) 9226 8888www.citicpacificmining.comSino – Cape Preston Iron
Cliffs Natural Resources Pty LtdThe Quadrant BuildingLevel 12, 1 William StreetPerth WA 6000(08) 9422 3405www.cliffsnaturalresources.comKoolyanobbing
Fortescue Metals LimitedLevel 2, 87 Adelaide TerraceEast Perth WA 6004(08) 6218 8888www.fmgl.com.au East Pilbara, Solomon
Gindalbie Metals Ltd6 Altona StreetWest Perth WA 6059(08) 9480 8700www.gindalbie.com.au Karara–Blue Hills
Hamersley Iron Pty Ltd152 St Georges TerracePerth WA 6000(08) 9327 2000www.hamersleyiron.com Hamersley Iron, Robe River – Deepdale, Yandicoogina
Hancock Prospecting Pty Ltd28-42 Ventnor AvenueWest Perth WA 6005www.hancockprospecting.com.auRoy Hill
Mineral Resources Ltd1 Sleat RoadApplecross WA 6153(08) 9329 3600www.mineralresources.com.au Carina
Mt Gibson Iron LtdLevel 1, 2 Kings Park RoadWest Perth WA 6005(08) 9426 7500www.mtgibsoniron.com.auKoolan Island, Mt Gibson Iron, Tallering Peak
LIMESAND–LIMESTONEAglime of AustraliaSuite 1, 110 Robinson AvenueBelmont WA 6104(08) 9277 5529www.aglime.com.auDongara–Denison, Lancelin, Jurien Bay
Archistone Pty Ltd27 Jandakot RoadJandakot WA 6164(08) 9417 2444www.archistone.com.auMoore River, Yanchep Reconstituted Stone

WESTERN AUSTRALIAN MINERAL AND PETROLEUM STATISTICS DIGEST 2017–18WESTERN AUSTRALIAN MINERAL AND PETROLEUM STATISTICS DIGEST 2017–1854
Cockburn Cement LtdLot 242, Russell RoadMunster WA 6166(08) 9411 1000www.cockburncement.com.auCockburn, Coogee, Denison, Ledge Point, Wesco Rd
FQM Australia Nickel Pty Ltd1/24 Outram StreetWest Perth WA 6005(08) 9346 0100www.first-quantum.comRavensthorpe Limestone
Lime Industries Pty Ltd43 Hector StreetOsborne Park WA 6017(08) 9241 1100www.limeindustries.com.auBoranup Limesand
Minara ResourcesLevel 10, Alluvion58 Mounts Bay RoadPerth WA 6000(08) 9212 8400www.minara.com.auMt Zephyr Calcrete
WA Limestone401 Spearwood AvenueBibra Lake WA 6163(08) 9434 7777 www.walimestone.comPostans
NICKELBHP Billiton Ltd (Nickel West)125 St Georges TerracePerth WA 60001300 55 47 57www.bhpbilliton.comKambalda
FQM Australia Nickel Pty Ltd1/24 Outram StreetWest Perth WA 6005(08) 9346 0100www.first-quantum.comRavensthorpe Nickel
Minara ResourcesLevel 10, 58 Mounts Bay RoadPerth WA 6000(08) 9212 8400www.minara.com.au Murrin Murrin
Western Areas Ltd2 Kings Park RoadWest Perth WA 6005(08) 9334 7777www.westernareas.com.auForrestania
PALLADIUMBHP Billiton Ltd (Nickel West)125 St Georges TerracePerth WA 60001300 55 47 57www.bhpbilliton.com Kambalda
PETROLEUMBHP Billiton Petroleum (North West Shelf) Pty Ltd125 St Georges TerracePerth WA 60001300 55 47 57www.bhpbilliton.com Macedon, Pyrenees
Chevron Australia Pty LtdLevel 24, QV1 Building250 St Georges TerracePerth WA 6000(08) 9216 4000www.chevronaustralia.com Barrow Island, Gorgon
Origin Energy Resources Ltd34 Colin StreetWest Perth WA 6005(08) 8635 3485www.originenergy.com.auBeharra Springs
Quadrant Energy Pty LtdLevel 9, 100 St Georges TerracePerth WA 6000(08) 6218 7100www.quadrantenergy.com.au East Spar, Harriet, John Brookes, Reindeer, Stag, Van Gogh
Roc Oil (WA) Pty LtdSuite 2, Ground Floor100 Havelock StreetWest Perth WA 6005(08) 9219 7111www.rocoil.com.auCliff Head
Santos LtdLevel 2, 40 The EsplanadePerth WA 6000(08) 9333 9500www.santos.com.au Mutineer–Exeter
Vermilion Oil and Gas Australia Pty LtdLevel 5, 30 The EsplanadePerth WA 6000(08) 9215 0300www.vermilionenergy.comWandoo
Woodside Energy Ltd240 St Georges TerracePerth WA 6000(08) 9348 4000www.woodside.com.au Amanda Claire/Belnaves/Brunello, Angel, Athena, Cossack, Enfield, Goodwyn, Hermes, North Rankin, North West Shelf, Pluto, Vincent, Wanaea
PLATINUMBHP Billiton Ltd (Nickel West)125 St Georges TerracePerth WA 60001300 55 47 57www.bhpbilliton.com Kambalda
RARE EARTHSLynas Corporation Ltd7 Tully RoadEast Perth WA 6004(08) 6241 3800www.lynascorp.com Mount Weld
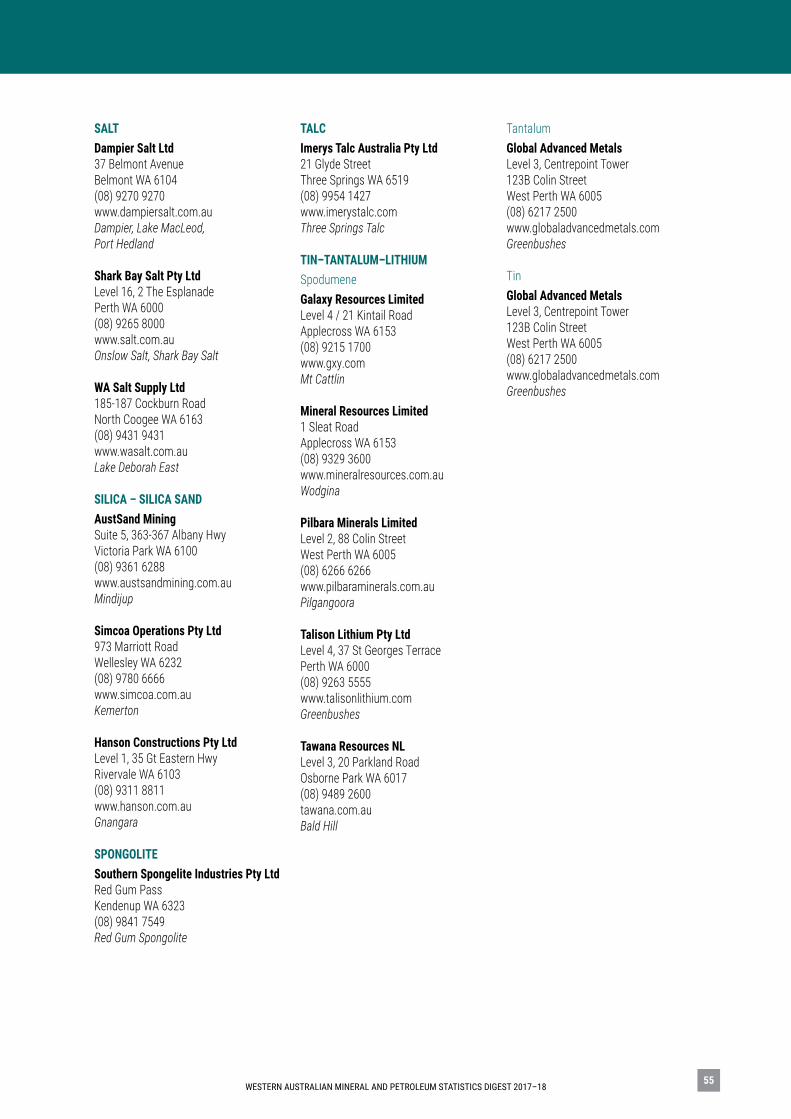
WESTERN AUSTRALIAN MINERAL AND PETROLEUM STATISTICS DIGEST 2017–18WESTERN AUSTRALIAN MINERAL AND PETROLEUM STATISTICS DIGEST 2017–18 55
SALTDampier Salt Ltd37 Belmont AvenueBelmont WA 6104(08) 9270 9270www.dampiersalt.com.au Dampier, Lake MacLeod, Port Hedland
Shark Bay Salt Pty LtdLevel 16, 2 The EsplanadePerth WA 6000(08) 9265 8000www.salt.com.auOnslow Salt, Shark Bay Salt
WA Salt Supply Ltd185-187 Cockburn RoadNorth Coogee WA 6163(08) 9431 9431www.wasalt.com.au Lake Deborah East
SILICA – SILICA SANDAustSand MiningSuite 5, 363-367 Albany HwyVictoria Park WA 6100(08) 9361 6288www.austsandmining.com.auMindijup
Simcoa Operations Pty Ltd973 Marriott RoadWellesley WA 6232(08) 9780 6666www.simcoa.com.au Kemerton
Hanson Constructions Pty LtdLevel 1, 35 Gt Eastern HwyRivervale WA 6103(08) 9311 8811www.hanson.com.auGnangara
SPONGOLITESouthern Spongelite Industries Pty LtdRed Gum PassKendenup WA 6323(08) 9841 7549Red Gum Spongolite
TALCImerys Talc Australia Pty Ltd21 Glyde StreetThree Springs WA 6519(08) 9954 1427www.imerystalc.comThree Springs Talc
TIN–TANTALUM–LITHIUMSpodumeneGalaxy Resources LimitedLevel 4 / 21 Kintail RoadApplecross WA 6153(08) 9215 1700www.gxy.com Mt Cattlin
Mineral Resources Limited1 Sleat Road Applecross WA 6153(08) 9329 3600www.mineralresources.com.auWodgina
Pilbara Minerals LimitedLevel 2, 88 Colin Street West Perth WA 6005(08) 6266 6266www.pilbaraminerals.com.auPilgangoora
Talison Lithium Pty LtdLevel 4, 37 St Georges TerracePerth WA 6000(08) 9263 5555www.talisonlithium.comGreenbushes
Tawana Resources NLLevel 3, 20 Parkland Road Osborne Park WA 6017(08) 9489 2600tawana.com.auBald Hill
TantalumGlobal Advanced MetalsLevel 3, Centrepoint Tower123B Colin StreetWest Perth WA 6005(08) 6217 2500www.globaladvancedmetals.com Greenbushes
TinGlobal Advanced MetalsLevel 3, Centrepoint Tower123B Colin StreetWest Perth WA 6005(08) 6217 2500www.globaladvancedmetals.com Greenbushes
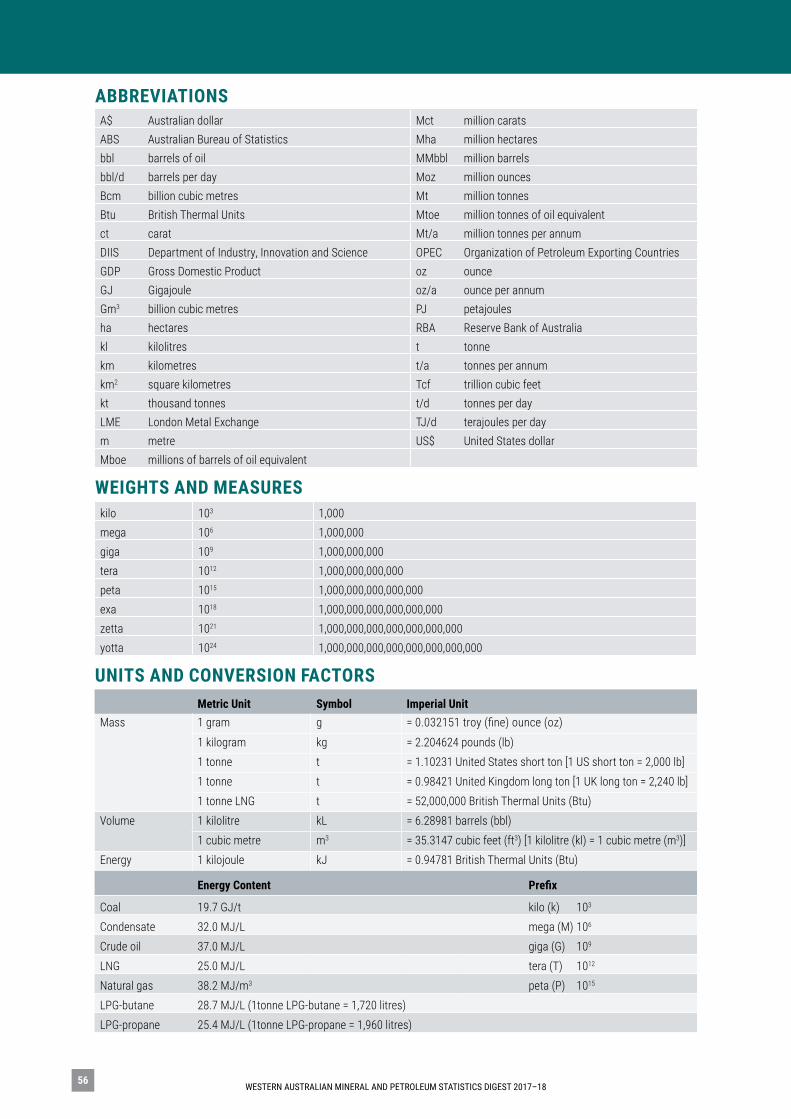
WESTERN AUSTRALIAN MINERAL AND PETROLEUM STATISTICS DIGEST 2017–18WESTERN AUSTRALIAN MINERAL AND PETROLEUM STATISTICS DIGEST 2017–1856
ABBREVIATIONSA$ Australian dollar Mct million caratsABS Australian Bureau of Statistics Mha million hectaresbbl barrels of oil MMbbl million barrelsbbl/d barrels per day Moz million ouncesBcm billion cubic metres Mt million tonnesBtu British Thermal Units Mtoe million tonnes of oil equivalentct carat Mt/a million tonnes per annumDIIS Department of Industry, Innovation and Science OPEC Organization of Petroleum Exporting CountriesGDP Gross Domestic Product oz ounceGJ Gigajoule oz/a ounce per annumGm3 billion cubic metres PJ petajoulesha hectares RBA Reserve Bank of Australiakl kilolitres t tonnekm kilometres t/a tonnes per annumkm2 square kilometres Tcf trillion cubic feetkt thousand tonnes t/d tonnes per dayLME London Metal Exchange TJ/d terajoules per daym metre US$ United States dollarMboe millions of barrels of oil equivalent
WEIGHTS AND MEASURESkilo 103 1,000mega 106 1,000,000giga 109 1,000,000,000tera 1012 1,000,000,000,000peta 1015 1,000,000,000,000,000exa 1018 1,000,000,000,000,000,000zetta 1021 1,000,000,000,000,000,000,000yotta 1024 1,000,000,000,000,000,000,000,000
UNITS AND CONVERSION FACTORSMetric Unit Symbol Imperial Unit
Mass 1 gram g = 0.032151 troy (fine) ounce (oz)
1 kilogram kg = 2.204624 pounds (lb)1 tonne t = 1.10231 United States short ton [1 US short ton = 2,000 lb]1 tonne t = 0.98421 United Kingdom long ton [1 UK long ton = 2,240 lb]1 tonne LNG t = 52,000,000 British Thermal Units (Btu)
Volume 1 kilolitre kL = 6.28981 barrels (bbl)1 cubic metre m3 = 35.3147 cubic feet (ft3) [1 kilolitre (kl) = 1 cubic metre (m3)]
Energy 1 kilojoule kJ = 0.94781 British Thermal Units (Btu)
Energy Content Prefix
Coal 19.7 GJ/t kilo (k) 103
Condensate 32.0 MJ/L mega (M) 106
Crude oil 37.0 MJ/L giga (G) 109
LNG 25.0 MJ/L tera (T) 1012
Natural gas 38.2 MJ/m3 peta (P) 1015
LPG-butane 28.7 MJ/L (1tonne LPG-butane = 1,720 litres)LPG-propane 25.4 MJ/L (1tonne LPG-propane = 1,960 litres)
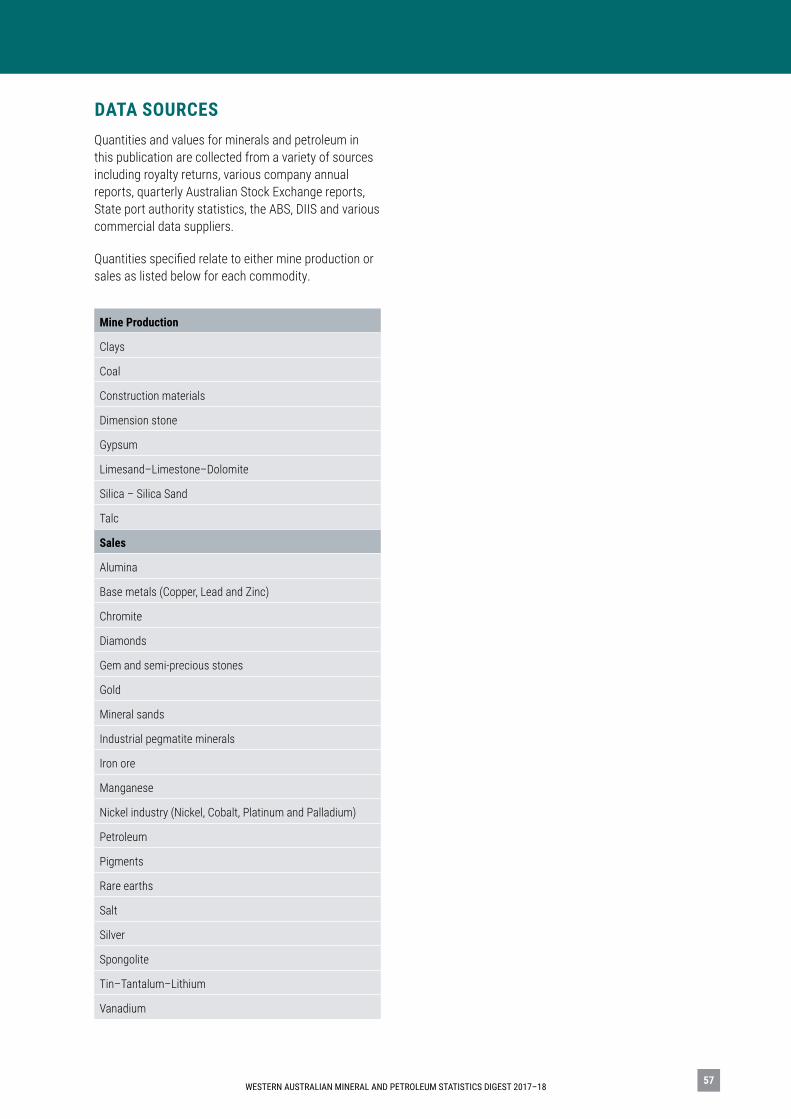
WESTERN AUSTRALIAN MINERAL AND PETROLEUM STATISTICS DIGEST 2017–18WESTERN AUSTRALIAN MINERAL AND PETROLEUM STATISTICS DIGEST 2017–18 57
DATA SOURCESQuantities and values for minerals and petroleum in this publication are collected from a variety of sources including royalty returns, various company annual reports, quarterly Australian Stock Exchange reports, State port authority statistics, the ABS, DIIS and various commercial data suppliers.
Quantities specified relate to either mine production or sales as listed below for each commodity.
Mine Production
Clays
Coal
Construction materials
Dimension stone
Gypsum
Limesand–Limestone–Dolomite
Silica – Silica Sand
Talc
Sales
Alumina
Base metals (Copper, Lead and Zinc)
Chromite
Diamonds
Gem and semi-precious stones
Gold
Mineral sands
Industrial pegmatite minerals
Iron ore
Manganese
Nickel industry (Nickel, Cobalt, Platinum and Palladium)
Petroleum
Pigments
Rare earths
Salt
Silver
Spongolite
Tin–Tantalum–Lithium
Vanadium
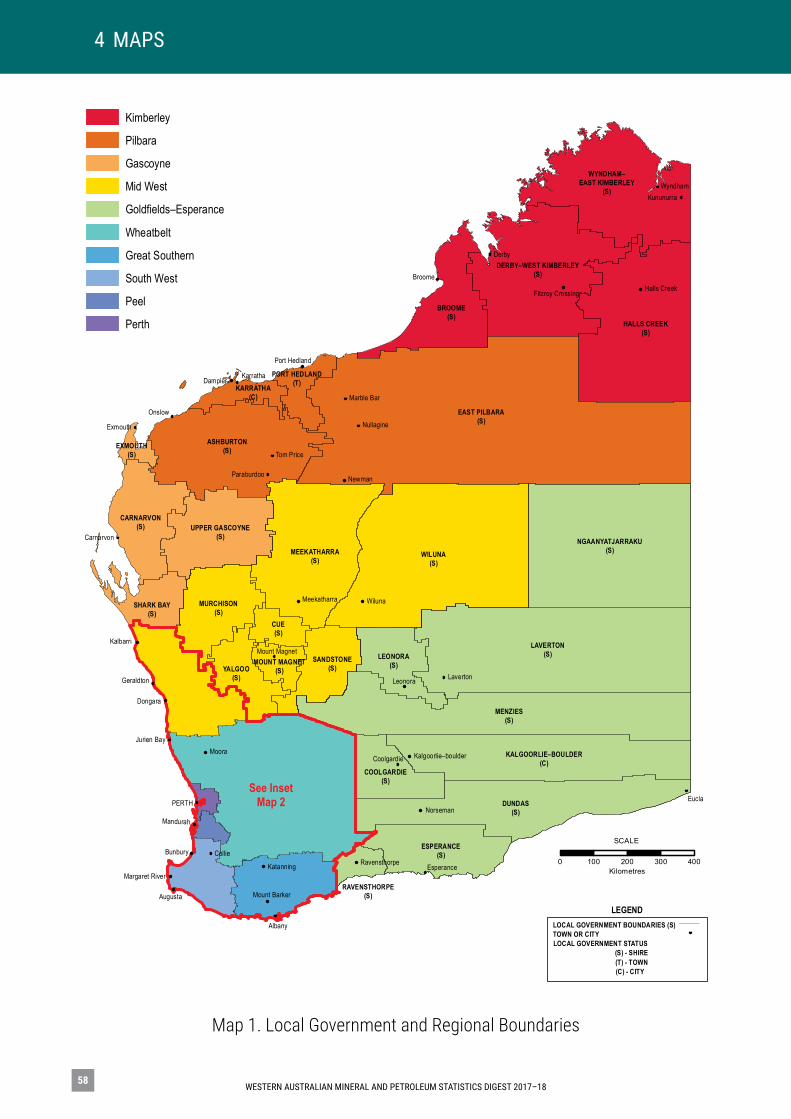
WESTERN AUSTRALIAN MINERAL AND PETROLEUM STATISTICS DIGEST 2017–18WESTERN AUSTRALIAN MINERAL AND PETROLEUM STATISTICS DIGEST 2017–1858
Moora
Derby
Eucla
Wiluna
Onslow
Newman
Collie
Broome
Albany
Wyndham
Leonora
Exmouth
Dongara
Augusta
Dampier
Norseman
Laverton
Karratha
Kalbarri
Tom Price
Kununurra
Geraldton
Esperance
Carnarvon
Nullagine
Paraburdoo
Marble Bar
Coolgardie
Jurien Bay
Meekatharra
Halls Creek
Ravensthorpe
Port Hedland
Mount Magnet
Mount Barker
Margaret River
Fitzroy Crossing
Bunbury
Katanning
Kalgoorlie–boulder
Mandurah
EAST PILBARA(S)
WILUNA(S)
LAVERTON(S)
MENZIES(S)
DUNDAS(S)
HALLS CREEK(S)
ASHBURTON(S)
NGAANYATJARRAKU(S)MEEKATHARRA
(S)
BROOME(S)
DERBY–WEST KIMBERLEY(S)
KALGOORLIE–BOULDER(C)
ESPERANCE(S)
MURCHISON(S)
WYNDHAM–EAST KIMBERLEY
(S)
CARNARVON(S)
YALGOO(S)
LEONORA(S)
CUE(S)
UPPER GASCOYNE(S)
COOLGARDIE(S)
SHARK BAY(S)
SANDSTONE(S)
KARRATHA(C)
PORT HEDLAND(T)
MOUNT MAGNET(S)
RAVENSTHORPE(S)
EXMOUTH(S)
PERTH
See Inset
Map 2
LOCAL GOVERNMENT BOUNDARIES (S) TOWN OR CITYLOCAL GOVERNMENT STATUS
(S) - SHIRE (T) - TOWN(C) - CITY
LEGEND
Kimberley
Pilbara
Gascoyne
Mid West
Goldfields–Esperance
Wheatbelt
Great Southern
South West
Peel
Perth
SCALE
Kilometres0 100 200 300 400
Map 1. Local Government and Regional Boundaries
4 MAPS
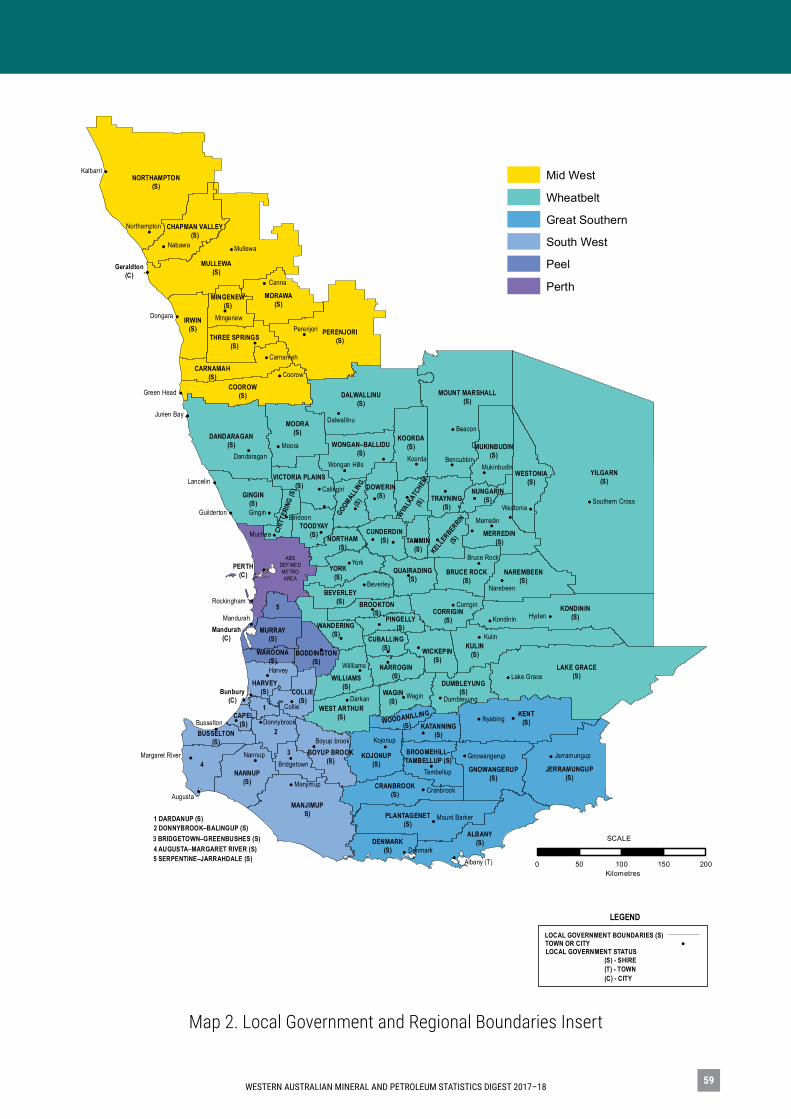
WESTERN AUSTRALIAN MINERAL AND PETROLEUM STATISTICS DIGEST 2017–18WESTERN AUSTRALIAN MINERAL AND PETROLEUM STATISTICS DIGEST 2017–18 59
Map 2. Local Government and Regional Boundaries Insert
!
! !
!
!
!
!
!
!
!
!
!
!
!
!
!
!
!
!
!
!
!
!
!
!
!
!
!
!
!
!
!
!
!
!
!
!
!
!
!
!
!
!
!
!
!
!
!
!
!
!
!
!
!
!
!
!
!
!
!
!
!
!
!
!
!
!
!
!
!
!
!
!
!
!
!
!
!
!
!
!
!
!
!
!
!
!
!
!
!
!
!
!
YILGARN(S)
KENT(S)
LAKE GRACE(S)
KULIN(S)
NORTHAMPTON(S)
KONDININ(S)
PERENJORI(S)
MANJIMUPS)
DALWALLINU(S)
MOUNT MARSHALL(S)
MOORA(S)DANDARAGAN
(S)
GINGIN(S)
COOROW(S)
JERRAMUNGUP(S)
IRWIN(S)
MORAWA(S)
YORK(S)
NANNUP(S)
PLANTAGENET(S)
KOORDA(S)
MERREDIN(S)
WESTONIA(S)
KOJONUP(S)
NAREMBEEN(S)
WAGIN(S)
CORRIGIN(S)
GNOWANGERUP(S)
CRANBROOK(S)
WILLIAMS(S)
BEVERLEY(S)
HARVEY(S)
WICKEPIN(S)
BRUCE ROCK(S)
WEST ARTHUR(S)
DENMARK(S)
DUMBLEYUNG(S)
TOODYAY(S)
WONGAN–BALLIDU(S)
MINGENEW(S)
TRAYNING(S)
QUAIRADING(S)
NARROGIN(S)
MUKINBUDIN(S)
CARNAMAH(S)
COLLIE(S)
CHAPMAN VALLEY(S)
MURRAY(S)
BOYUP BROOK(S)
DOWERIN(S)
THREE SPRINGS(S)
CUNDERDIN(S)
WANDERING(S)
VICTORIA PLAINS(S)
BODDINGTON(S)
TAMMIN(S)
NORTHAM(S)
BROOKTON(S)
PINGELLY(S)
GOOMALLING
(S)
KATANNING(S)
KELLERBERRIN
(S)
NUNGARIN(S)
CUBALLING(S)
WYALK
ATCHEM
(S)
BROOMEHILL–TAMBELLUP (S)
CHITT
ERIN
G (S
)
CAPEL(S)
WAROONA(S)
WOODANILLING(S)
BUSSELTON(S)
PERTH(C)
MULLEWA(S)
Mandurah(C)
Bunbury(C)
York
Moora
Kulin
Canna
Hyden
Nannup
Muchea
Koorda
Harvey
Gingin
DarkanCollie
Albany (T)
Nabawa
Coorow
Beacon
Mullewa
Kojonup
Dongara
Denmark
Augusta
Nyabing
Narebeen
Mingenew
Manjimup
Lancelin
Kondinin
Kalbarri
Carnamah
Beverley
Mandurah
Westonia
Tambellup
Perenjori
Geraldton(C)
Cranbrook
Busselton
Bencubbin
Rockingham
Mukinbudin
Lake Grace
Green Head
Dumbleyung
Donnybrook
Bridgetown
Jurien Bay
Dandaragan
Guilderton
Dalwallinu
Northampton
JerramungupGnowangerup
Boyup brook
Wongan Hills
Mount Barker
Southern Cross
Margaret River
Wagin
Bindoon Merredin
Corrigin
Wiilliams
Calingiri
Bruce Rock
ALBANY(S)
ABSDEFINEDMETROAREA
3
2
4
1
5
4 AUGUSTA–MARGARET RIVER (S)
2 DONNYBROOK–BALINGUP (S)1 DARDANUP (S)
3 BRIDGETOWN–GREENBUSHES (S)
5 SERPENTINE–JARRAHDALE (S)
Wheatbelt
Perth
Peel
South West
Great Southern
Mid West
!
LEGEND
TOWN OR CITYLOCAL GOVERNMENT BOUNDARIES (S)
LOCAL GOVERNMENT STATUS(S) - SHIRE (T) - TOWN(C) - CITY
Kilometres
SCALE
0 50 100 150 200
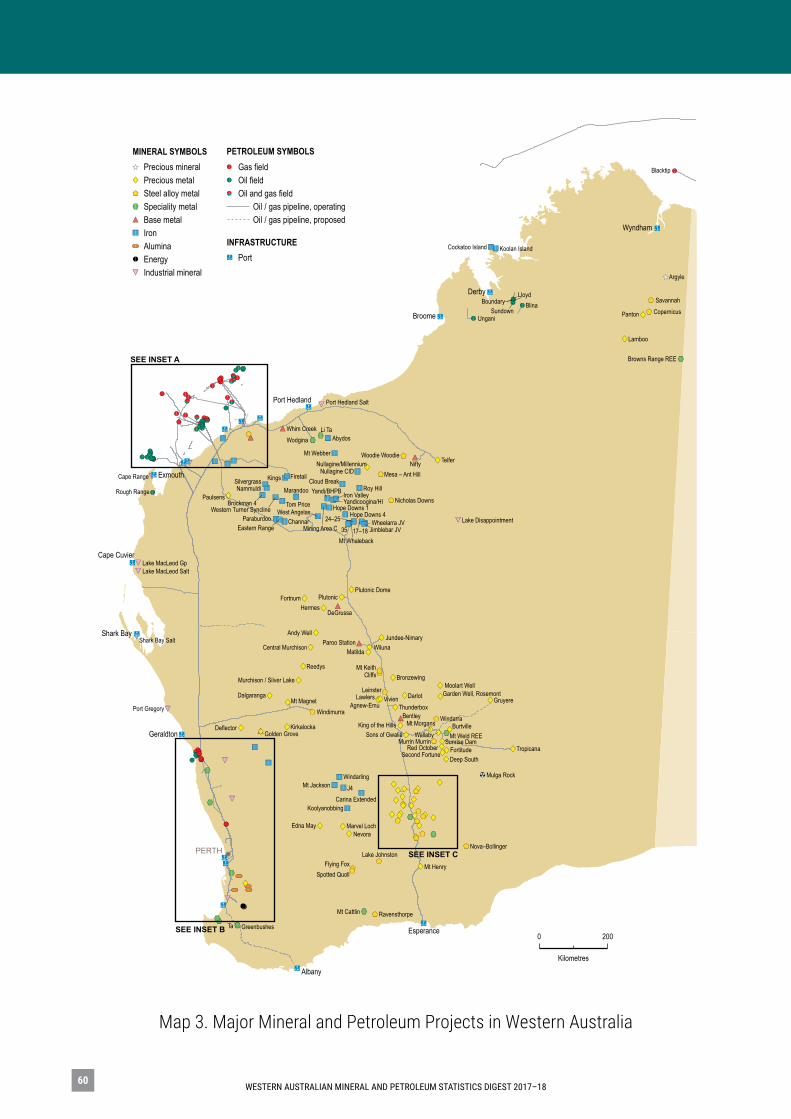
WESTERN AUSTRALIAN MINERAL AND PETROLEUM STATISTICS DIGEST 2017–18WESTERN AUSTRALIAN MINERAL AND PETROLEUM STATISTICS DIGEST 2017–1860
Map 3. Major Mineral and Petroleum Projects in Western Australia
MINERAL SYMBOLS
IronAluminaEnergyIndustrial mineral
PETROLEUM SYMBOLSGas fieldOil fieldOil and gas field
Oil / gas pipeline, operatingOil / gas pipeline, proposed
INFRASTRUCTUREPort|
Speciality metalBase metal
Precious mineral
Steel alloy metalPrecious metal
0 200
Kilometres
StatisticsDigest_2017_08
Blina
Blacktip
Lloyd
SundownBoundary
Ungani
Rough Range
n|
n|
n|
n|
n|
n|
n|
n|
n|
n|
n|
n|
n|
n|n| n|
n|
n|
Ta
Darlot
Cliffs
Wiluna
Savannah
Plutonic
Andy Well
Mt Magnet
Mt Webber
Tropicana
Copernicus
Mt Jackson
Red October
Central Murchison
Moolart Well
Ravensthorpe
Shark Bay Salt
Port Gregory Windimurra
Murchison / Silver Lake
DeGrussa
17–1835
Kings
24–25
Abydos
Argyle
Wodgina
Lawlers
Channar
Firetail
Marandoo
Mt Keith
Roy HillPaulsens
Mt Henry
Nifty
Leinster
Nammuldi
Tom Price
Agnew-Emu
Brockman 4
Flying Fox
Paraburdoo
Yandi/BHPB
Bronzewing
Iron Valley
Cloud Break
Mt Weld REESunrise Dam
Marvel Loch
Hope Downs 1
Jimblebar JV
Hope Downs 4West Angelas
Mt Whaleback
Wheelarra JV
TelferNullagine CID
Spotted Quoll
Koolyanobbing
Browns Range REE
Jundee-Nimary
Eastern Range Mining Area C
Murrin Murrin
Greenbushes
Sons of Gwalia
Lake MacLeod Gp
Cockatoo Island
Yandicoogina/HI
Bentley
Paroo Station
Nicholas Downs
Port Hedland Salt
Lake MacLeod Salt
King of the Hills
Nullagine/Millennium
Golden Grove Wallaby
Garden Well, Rosemont
Western Turner Syncline
Derby
Broome
Albany
Wyndham
Port Hedland
Esperance
Cape Cuvier
Exmouth
Geraldton
Shark Bay
Lamboo
Whim Creek
Woodie Woodie
Mesa – Ant HillSilvergrass
Kirkalocka
Reedys
ThunderboxVivien
Deep South
J4
Nova–Bollinger
Mt Cattlin
Cape Range
Edna May
Windarra
Plutonic Dome
Hermes
Matilda
Gruyere
Second Fortune
Nevora
Windarling
Li Ta
Lake Disappointment
Fortnum
Dalgaranga
Deflector Mt Morgans
Fortitude
Mulga Rock
Lake Johnston
Carina Extended
Burtville
Panton
Koolan Island
SEE INSET A
SEE INSET B
SEE INSET CPERTH!
Map 4. Major Mineral and Petroleum Projects in Western Australia Insert
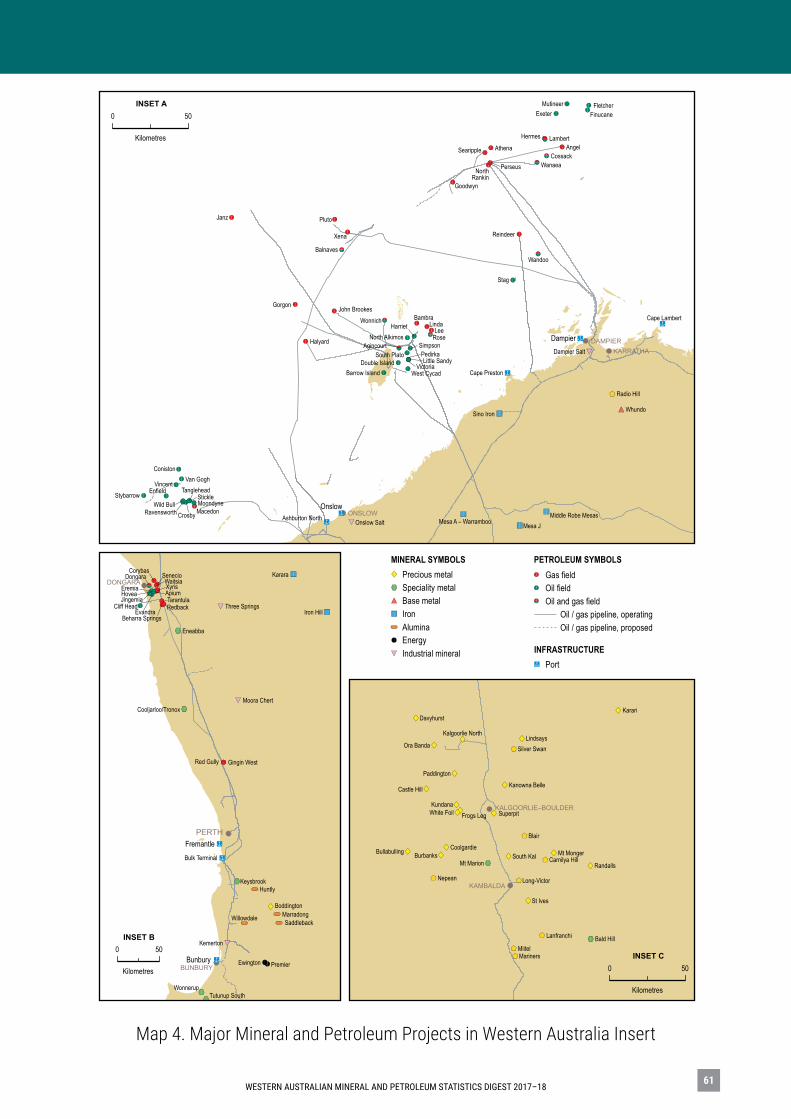
WESTERN AUSTRALIAN MINERAL AND PETROLEUM STATISTICS DIGEST 2017–18WESTERN AUSTRALIAN MINERAL AND PETROLEUM STATISTICS DIGEST 2017–18 61
Map 4. Major Mineral and Petroleum Projects in Western Australia Insert
n|
n|
n|
n|
n|
n|Lee
Stag
Rose
Angel
Wandoo
Wanaea
Hermes
Exeter
Crosby
Bambra
Athena
Vincent
Simpson
Perseus
Macedon
Harriet
Goodwyn
Coniston
Enfield
Cossack
Victoria
Van Gogh
Finucane
Stybarrow
Halyard
West Cycad
John Brookes
Barrow Island
Stickle
Pedirka
Lambert
Agincourt
Searipple
South Plato
Ravensworth
NorthRankin
Little Sandy
North Alkimos
Double Island
Pluto
Reindeer
Wild Bull
Tanglehead
Moondyne
Balnaves
FletcherMutineer
Janz
Xena
Gorgon
LindaWonnich
Onslow
Mesa J
Dampier
Sino Iron
Onslow Salt
Cape Lambert
Cape Preston
Whundo
Dampier Salt
Ashburton North Mesa A – Warramboo
Exmouth
Middle Robe Mesas
Radio Hill
DAMPIERKARRATHA
ONSLOW
n|
n|
n|
n|
PERTH
BUNBURY
DONGARA
Huntly
Premier
Eneabba
Wonnerup
MarradongWillowdale Saddleback
Moora Chert
Kemerton
Karara
Boddington
Cooljarloo/Tronox
Three Springs
EwingtonBunbury
FremantleBulk Terminal
Tutunup South
Iron Hill
Keysbrook
Dongara
Cliff Head
XyrisHovea ApiumEremia
RedbackEvandra
Corybas
Jingemia Tarantula
Beharra Springs
Gingin WestRed Gully
WaitsiaSenecio
INSET A0 50
Kilometres
INSET B0 50
Kilometres
Blair
Karari
Miitel
Nepean
Kundana
Mariners
RandallsBurbanks
Superpit
Lindsays
South Kal
Ora Banda
Mt Monger
Frogs LegWhite Foil
Paddington
Coolgardie
Lanfranchi
Long-Victor
Castle Hill
Bald Hill
Bullabulling
Kanowna Belle
Carnilya Hill
Kalgoorlie North
Mt Marion
St Ives
Davyhurst
Silver Swan
KAMBALDA
KALGOORLIE–BOULDER
StatisticsDigest_2017_08_Inset
INSET C0 50
Kilometres
MINERAL SYMBOLS
IronAluminaEnergyIndustrial mineral
Speciality metalPrecious metal
Base metal
PETROLEUM SYMBOLSGas fieldOil fieldOil and gas field
Oil / gas pipeline, operatingOil / gas pipeline, proposed
INFRASTRUCTUREPort|
Government of Western AustraliaDepartment of Mines, Industry Regulation and Safety
Mineral House, 100 Plain StreetEast Perth, Western Australia 6004
Tel: +61 8 9222 3333Fax: +61 8 9222 3862
Web: www.dmirs.wa.gov.au
For specific enquiries regarding this publication please email: [email protected]
Published October 2018 DMIRSOCT18_5445