Embed Size (px)
Citation preview

Miniaturised multi channel wireless ECG connected to
graphical computer interface using Bluetooth.
Patrik Gustafsson
[email protected] Jimmie Hagblad
2007-08-13
A Master of Science thesis in electronic sciences performed at The Department of Computer Science and Electronics, Mälardalen University
during the spring and summer of 2007.
Supervisor: Martin Ekström Mälardalen University, the Department of Computer Science and Electronics.
Examiner: Mikael Ekström Mälardalen University, the Department of Computer Science and Electronics.

Abstract The effect of physical exercise is optimised when the heart rate is just below the individual level of lactate threshold. By recording ECG and changes in heart rate and R-to-R time, time between each heart beat, a more detailed view of the processes at hand can be achieved. The ECG originates in the heart and the steps of this process are discussed in the thesis. The purpose of the thesis is to investigate the possibilities to develop a battery powered system capable of measuring three analogue channels of ECG on an exercising subject and sending them using Bluetooth to a computer interface and to develop such a system. Such a system has been developed and tested; capable of measuring, showing and saving three different channels of ECG. The system is designed in EAGLE 4.16 and built using surface mounted components and the computer interface is developed using LabWindows 8. The collecting of measured data and analogue to digital conversion is made using a PIC microprocessor and the communication between the system and computer is realised using a Bluetooth module programmed with a Serial Port Profile. Keywords: ECG, EKG, Bluetooth, EAGLE, LabWindows, LabView
Sammanfattning Effekten av träning är optimerad när pulsen ligger precis under den individuella mjölksyretröskeln. Genom lagring av EKG och ändringar i pulsen och R-R tid, avstånd mellan pulsslagen, en mer detaljerad syn på processerna i fråga kan fås. EKG har sitt ursprung i hjärtat och stegen i denna process diskuteras i denna avhandling. Syftet med avhandlingen är att undersöka möjligheterna att utveckla ett batteridrivet system kapabelt att mäta tre analoga EKG-kanaler på ett tränande objekt och sända dessa via Bluetooth till ett datorinterface och att utveckla ett sådant system. Ett sådant system har tagits fram och testats som är kapabelt att mäta, visa och spara tre separata EKG-kanaler. Systemet är ritat i EAGLE 4.16 och byggt med ytmonterade komponenter och datorinterfacet är gjort i LabWindows 8. Insamlingen av uppmätta data och analog till digitalkonverteringen görs med en PIC mikroprocessor och kommunikationen mellan systemet och datorn sker med en Bluetooth-modul programmerad med en serieportsprofil.

Preface We want to thank Marcus Blom and Martin Ekström for the feedback and company during the time in the lab.
3

Table of contents 1 Background.................................................................................................................6 2 Aim .............................................................................................................................6 3 The anatomy of the heart ............................................................................................7
3.1 The generation of bio potential ............................................................................7 3.2 The Conducting system........................................................................................8
4 The ECG-curve .........................................................................................................10 4.1 The origin of the ECG-curve .............................................................................10 4.2 The development of the ECG-curve ..................................................................11
5 Bluetooth...................................................................................................................16 5.1 Frequency spectrum...........................................................................................16 5.2 Piconets ..............................................................................................................16 5.3 RFCOMM..........................................................................................................16 5.4 SPP.....................................................................................................................16
6 Limitations ................................................................................................................17 7 Components ..............................................................................................................17
7.1 PIC18F4520 .......................................................................................................17 7.2 Mitsumi Bluetooth™ Module............................................................................18 7.3 Voltage regulator ...............................................................................................18 7.4 Operational amplifiers .......................................................................................18
8 Hardware design .......................................................................................................20 8.1 Schematics Overview.........................................................................................20 8.2 System overview................................................................................................20 8.3 Electrical circuit design......................................................................................21
8.3.1 Microprocessor ...........................................................................................21 8.3.2 Bluetooth module........................................................................................22 8.3.3 The ECG-amplifier. ....................................................................................22 8.3.4 Power supply...............................................................................................24 8.3.5 Right Leg Drive. .........................................................................................24 8.3.6 Design schematics.......................................................................................25
8.4 External components..........................................................................................26 8.4.1 Leads ...........................................................................................................26 8.4.2 Electrodes....................................................................................................26 8.4.3 Housing .......................................................................................................26
8.5 Bluetooth adapters .............................................................................................26 8.5.1 Serial port Bluetooth adapter ......................................................................26 8.5.2 USB Bluetooth adapter. ..............................................................................26
9 Design .......................................................................................................................27 9.1 Top side..............................................................................................................27 9.2 Bottom side ........................................................................................................28
10 Software design.......................................................................................................29 10.1 Firmware design...............................................................................................29
10.1.1 ADC ..........................................................................................................30 10.2 Baud rate ..........................................................................................................31
10.2.1 Oscillator...................................................................................................32 10.3 Sampling ..........................................................................................................33 10.4 Firmware flowchart..........................................................................................34 10.5 Computer interface...........................................................................................35
10.5.1 Filters ........................................................................................................35
4

10.5.2 Pulse detection ..........................................................................................35 10.5.3 File format.................................................................................................36 10.5.4 Computer interface flowchart ...................................................................38
11 Result ......................................................................................................................39 11.1 Power consumption..........................................................................................39 11.2 Problems ..........................................................................................................39 11.3 Process .............................................................................................................40
12 Discussion ...............................................................................................................41 13 Summary .................................................................................................................42 14 Hardware.................................................................................................................43 15 Software ..................................................................................................................43 16 Part list ....................................................................................................................44 17 References...............................................................................................................45 Appendix......................................................................................................................46
Used acronyms.........................................................................................................46 Firmware ..................................................................................................................47 Lab Windows ...........................................................................................................49
5

1 Background The effect of physical exercise is optimised when the current heart rate is just below the individual level of lactate threshold. This level usually is considered to be at a certain percentage of the maximum heart rate but that is not always the case. By exploring the changes accruing at the lactate threshold the effect of static load training might be enhanced. Measuring and analysing ECG is an established tool when optimising physical training. By recording ECG and changes in heart rate and R-to-R time, time between each heart beat, a more detailed view of the processes at hand can be achieved. Measuring ECG signals via Bluetooth using a PIC microprocessor has proven to be a working concept. [1]
2 Aim The primary aim is to develop a battery powered sensor system capable of simultaneously measure three channels of ECG; aVL, I, aVR and an optional external signal. The measured data shall be streamed wirelessly using Bluetooth. Since the device is to be used to monitor the heart during training and movement is to be expected, size and weight is to be minimised and sensitivity to movement is of concern. Additionally a computer based interface recording and showing the signals in real time as well as saving them to file is to be developed. The information of the files saved shall be usable to produce an FFT analysis of the ECG recording later on. To enable analysing of the displayed and recorded data no automatic filtering is to be implemented but an option to activate such a function should be implemented. The system will then be used to examine if the lactate threshold can be detected by analyzing the output of the system.
6

3 The anatomy of the heart The heart is located in the chest between the lungs close by diencephalons and is surrounded by the pericardial and connected to the pleura. Two thirds of the heart is located on the left side of the median line through the body. See figure 1. The heart has four larger different chambers, divided into atriums (left and right) and ventricles (left and right). Right half of the heart contains venous blood (deoxygenated). The heart pumps blood from right atrium too right ventricle further through the pulmonary. Oxygenated blood returns from the lungs to the left atrium and through the left ventricle and further in too the big circulation and returns too the right atrium and closing the circle. [2]
Figure 1 location of the heart in the body [2].
3.1 The generation of bio potential Signals that control the physiological activity in the heart and other organs are a result of ions propagating over the cell membrane which some of the cells has. Walls of the cells such as nerve-, muscle- and gland cells have semi permeable membrane. This means that the membrane lets certain substances pass but stops other. When the cells are in a resting state, the cell fluid inside of the membrane (cytosol) has excess of potassium ions and on the outside it is excess of chloride- and sodium ions. This difference in concentration is maintained by energy exacting pumps, which give a way for ions through the cell membrane. In resting state is the inside of the cell more negative than the cell’s outside. The explanation to this is that when the cell is in resting state the inside of the cell membrane has a collection of negative ions, and on the membranes outside are a corresponding collection of positive ions. When a specified stimulus affects the cells, channels open between the in- and outside of the cell membrane, and the ions can flow in and out of the cell. The ions stream
7

from higher to lower concentration and from higher to lower charges. If the stimulus is big in enough a large quantity of ion channels open at the same time, which means that a large stream of ions flows giving an increased effect on the existent membrane potential. From a normal level of -70mV (potential in resting state) up to -55mV which is the threshold value of an action potential. The negative value can be explained by a cell having a higher concentration of negative charges inside than outside. The streams of ions proceeds until the potential of the membranes have reached up to +30mV, after reaching that level it returns to resting state at -70mV until a new stimulus occurs. The actions potential spreads via nerve pathways through the body passing the region the specific stimulus corresponds to and transforms into a specific action. See figure 2. [2]
Figure 2, Electrophysiology of the cardiac muscle cell. [2]
3.2 The Conducting system. The Conducting system controls the electric activity of the heart. This system supervises that the heart has a continuous heart rhythm and that it contains a collected quantity of auto rhythmic cells which spontaneous generates impulses (action potential) with a specific frequency. The frequency can change with the help of nerve impulses and hormones, making it increase or decrease. The auto rhythmic cells have two important functions, first it is to control that the heart has correct rhythm and secondly it is to form the conducting system by propagating the action potential through the heart muscle. The conducting system can bee divided up into Sinus node (sinoatrial node or SA node), AV-node (atrioventricular node), Bundle of His (Common bundle) with bundle branches and Purkinje fibres. The Sinus node is structured by auto rhythmic cells producing impulses automatic (actions potentials), occurring around 90-100 times per minutes. Hormones and outer substance can decrease that frequency down to around 70-80 impulses per minutes. The Sinus node can be said to manage the heart rhythm. The AV-node is located in boundary between the atria and ventricle and consists of a large amount of heart cells with specific properties. Impulses made in Sinus node gets help from Bundle of his and Purkinje fibre to bring the nerve impulses through the heart, giving the hearts contractions. See figure 3. [2]
8

Figure 3, The heart’s anatomy with waveforms from different specific part of the heart [1].
The action potential propagates along the atrial muscle too the AV-node and produces a contraction of the atrium. The action potential is delayed in the AV-node to coordinate a contraction of atrium and ventricle. The impulse propagates further from AV-node down along the diaphragm between left and right atrium through the Bundle of His. This relation between atrium and ventricle is the only electric connection in the heart (the other parts are isolated). The action potentials spreads further down along the Bundle branch to apex and up along each side of the heart. The ventricle is now contracting, which happens around 200ms after atriums contractions. The AV-node can do the Sinus node’s work to make impulses if the Sinus node has gone down, but it has its limitations at about 40-50 impulses per minutes. If the AV-node also has problems the Bundle of His is next in line to do this work with a frequency limitation at about 20-40 impulses per minute. [2] [3] [4]
9

4 The ECG-curve The produced ECG curve is dependent on the electrical activity of the heart and method of measuring.
4.1 The origin of the ECG-curve The ECG-curve can be divided into discreet wave forms and phases. In a normal ECG-curve you can see tree distinct waves within each heart beat. The first part of the ECG-curve is called P-wave and this wave shows atriums depolarisation, it starts in Sinus node and continues on by the right atrium and briefly after that through the left atrium. After about 100ms from the beginning of the P-wave, the atrium starts the contractions. The size of the atrium reflects on the P-wave, a normal length on this phase is about 70-110ms. The spread of this impulse is occurring radial through the atrium. The second part of the curve is the QRS-complex and this part shows ventricular muscles depolarisation. Ventricular contractions begin briefly after the QRS-complex starts, and normally is shorter than 110ms. The third and last part is the T-wave which shows ventricular repolarisation that occurs just before the ventricular relaxes. The T-wave is smaller but wider then the QRS-complex, that can be explained by the repolarisation which occurs slower then the depolarisation. The repolarisation of the ventricular often is concealed by the QRS-complex and then doesn’t show on the ECG-curve. [2] [5] [6]
Figure 4, this figure shows a characteristic look of the ECG-curve. [7]
10

Under the curve in Figure 4 shows picture of what simultaneously happens in the heart: a. Depolarisation of atrium. b. Delays of impulses in AV-node. c. Spreading of impulses through the Bundle of his. d. Ventricular begin the depolarisation and also the contraction. e. Ventricular are still tense. f. Ventricular is repolarisation and relax again. When analysing the ECG-curves different phases between the waves are of interest: The PQ phase which shows the time it takes for the impulse to propagate between the beginning of the Sinus node and the ventricle, is measured from the start of the P-wave to the beginning of QRS-complex. Propagation of this impulse normally goes through the AV-node. The conductivity in this node is only a fifth compared to in the atrium, which dominates the PQ-time with a connection to the AV-node. Normal time for PQ-phase is between 120-210ms. ST phase is measured from the end of S-wave to the beginning of the T-wave. This interval shows the time it takes for the ventricular muscles to completely be depolarized. QT phase is measured from the beginnings of QRS-complex to the end of the T-wave. The interval shows the time it takes from start of ventricle depolarisation to the end of ventricle depolarisation, this time changes with the heart beat. The changes of this time make a standardisation of QT-time necessary. This frequency correction is calculated using Bazett’s formula and gives a QTc-time (Corrected QT-time). [2] [5] [6]
Bazett’s formula: RR
QTQTc =
RR: time between the R peaks in seconds. [8]
4.2 The development of the ECG-curve The appearance of an ECG curve is depending of which leads that are used. To get a usual look of the curve (like in Figure 4) the lead I is used. The action potential which has propagated from Sinus node through the atrium to the AV-node can bee seen as a vector and the size of this vector is comes from a summation of all impulses that the Sinus node sends in the direction of apex and the atrium contract. This vector is projected on the Lead I vector and builds a positive wave, the P-wave such as the figure 5. [2]
11

Figure 5. The left picture shows the impulses size and direction, from the Sinus node through the atrium. The right picture shows the projection of this vector as a arrow and the P-wave [2]
When the impulses propagate further from the atrium to the ventricle by the AV-node and Bundle of His, through the AV-node the velocity of the impulse is limited and the ventricle can activate giving the curve a baseline among the P- and Q-wave. When the wall between the ventricular is activated from left to right, the brief negative wave which is the Q-wave is produced. The atrium is now completely depolarised. When the impulse propagates down through between the ventricles the sum of these impulses are comparatively small in the, at the same time the projected vector is pointed from left to right arm. See figure 6. [2]
Figure 6, Left picture shows the direction of the impulses in the heart. Right picture shows the projected arrow and the ECG-curve as far as the Q-wave. [2]
When the impulse propagates further along the ventricle wall down to apex, the impulses are reinforced and the direction of this impulse is once more at apex. A projection on Lead I show a large positive part of this curve, this is the distance between Q and R. The left ventricular walls contain more muscle fibre then the right ventricular, giving the positive direction on the R-wave. This is illustrated in pictures 7 and 8. [2]
12

Figure 7 R-wave part I [2]
Figure 8 R-wave part II [2]
The impulses propagate further along the ventricle wall (fig 9). It is harder here for the impulse to get through; because of this the vector does not get so big, the curve returns and stops just below the baseline. That can be explained by that the vectors points at each other when the impulse vector projects on Lead I vector, that represents the distance from R to S. Now the ventricular is completely depolarised. See figure 10 [2]
13
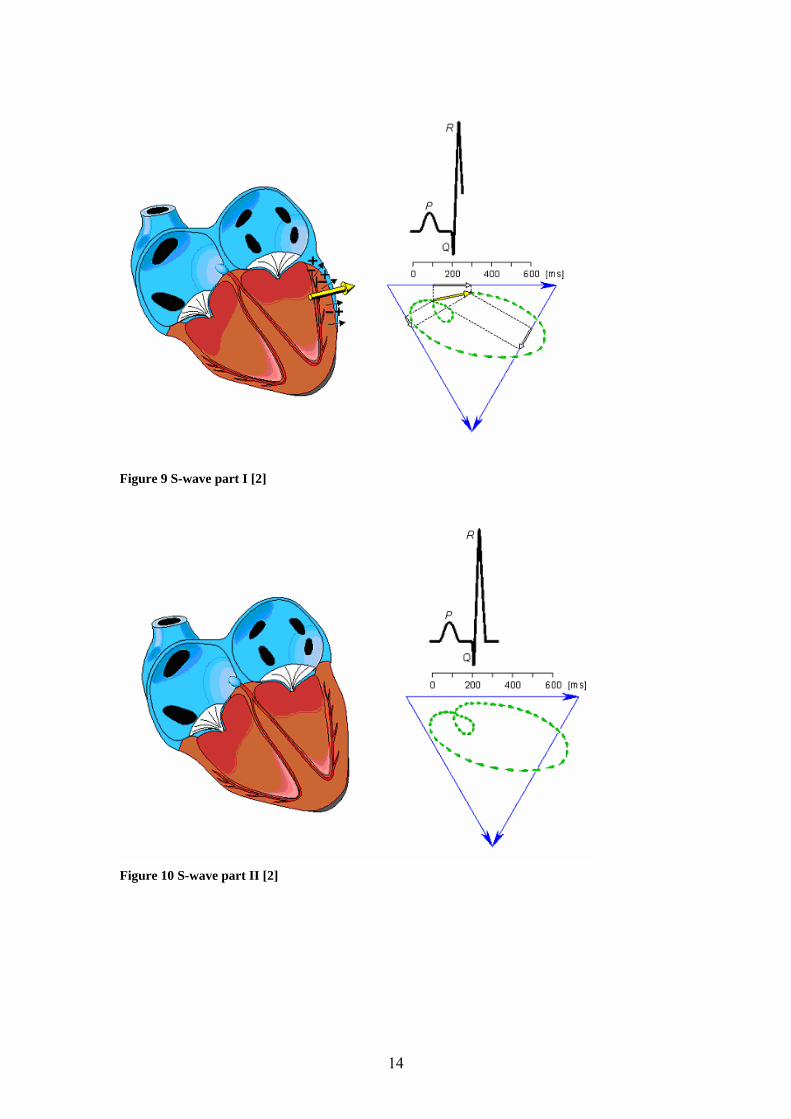
Figure 9 S-wave part I [2]
Figure 10 S-wave part II [2]
14

After that the repolarisation of the ventricular begins, showing as the T-wave, both depolarization and repolarisation have a positive direction instead of negative, which a normally a ventricular repolarisation has. This can be explained by that the positive direction of the wave is an impulse of the repolarisation. The impulse starts from outside of the ventricular and propagates inwards which is the opposite direction of the depolarisation. See figure 11. [2]
Figure 11 the heart when it is depolarised. [2]
15

5 Bluetooth Bluetooth is a short-range communications system intended for cable replacement between electronic devices in a low cost, low power, robust way. A Bluetooth system consists of a RF transceiver, baseband, and protocol stack offering services to connect and exchange data between devices. Bluetooth is used in three different classes depending application regarding desired operational range and power limitations: [22] Device Power Class Max Output Power Expected RangeClass 1 100mW 20dBm 100m Class 2 2.5mW 4dBm 10m Class 3 1mW 0dBm 10cm
5.1 Frequency spectrum Bluetooth operates at 2.4GHz, an unlicensed ISM band free to use in most areas. To avoid interference and fading the transceiver employs frequency hopping. The module used in this project is rated at 2402~2480MHz. 5.2 Piconets A group of devices typically share a radio channel and are synchronised to a common hopping pattern. The reference is provided by one of the devices, master, and the other, slaves, synchronise to that. This type of net is the fundamental form of Bluetooth communication and is called a piconet. [9]
5.3 RFCOMM RFCOMM is a transport protocol with additions for emulating the functions of RS-232 serial ports over the L2CAP protocol. Depending on implementation up to 60 simultaneous connections between two devices can be established. [10]
5.4 SPP Serial Port Profile defines how to set-up virtual serial ports to connect two Bluetooth devices using the RFCOMM protocol to provide serial-port emulation. SPP enables wireless replacement of RS-232 based serial communication at data rates up to 128 Kbit/sec. Two different roles are defined: Device A (DevA) – This is the device that takes initiative to form a connection with another device. Device B (DevB) – This is the device that waits for another device to take initiative to connect. There are no fixed master slave roles. [11]
16

6 Limitations The bandwidth of the system is limited by the possible data rate which is dependent of the minimum time to acquire; process and send a packet of data. The maximum data rate of the ECG-system is measured to 980Hz. As stated by Nyquists theorem the bandwidth of the system is limited to half of the sampling rate. [12] Making the system wireless applies some constrains on the uses of the system. Bluetooth limits the usable distance and bandwidth. The use of a battery for power supply limits the level of miniaturisation. Running the operational amplifiers at 3.3V single supply and restricted use of filtering of the signals limits the compliance to wandering baseline due to saturation of the amplifiers.
7 Components The ECG system is built around a couple of key components described below.
7.1 PIC18F4520 The purpose of the microprocessor is to acquire analogue signals ranging from 0 to 3.3V and sending them by standard serial protocol to a Bluetooth module configured with a SPP. Requirements of the microprocessor:
• Ability to read four or more analogue channels at 0-3.3V • Possibility to use in a 3.3V system. • Programmable in circuit • Built in USART • Low power consumption
Based on theses basic requirement and the availability of development tools and knowledge in programming the choice of processor was limited to Microchips line of PIC processors. The following data is stated for the selected microprocessor: PIC18F4520 CPU
• Up to 10 MIPS performance • C compiler optimised RISC architecture • 8 x 8 Single Cycle Hardware Multiply
System
• Internal oscillator support - 31 kHz to 8 MHz, up to 32 MHz with 4X PLL • Fail-Safe Clock Monitor – allows safe shutdown if clock fails • Watchdog Timer with separate RC oscillator • Wide operating Voltage range; 2.0V to 5.5V
17

nanoWatt Power Managed Modes • Run, Idle and Sleep modes • Idle mode currents down to 5.8uA typical • Sleep mode currents down to 0.1uA typical
Analog Features
• 10-bit ADC, 13 channels, 100K samples per second • Programmable Low Voltage Detection Module • Programmable Brown-out Reset module • Two Analog comparators with input multiplexing
Peripherals
• Master Synchronous Serial Port supports SPI ™ Master and Slave Mode • EUSART module including LIN bus support • Four Timer Modules • Up to 5 PWM outputs • Up to 2 Capture / Compare
The PIC18F4520 is available in special low voltage version, PIC18lf4520, able to work at a supply voltage between 2.0 and 5.5V suitable for 3.3V applications. [13]
7.2 Mitsumi Bluetooth™ Module The used Bluetooth module used for the prototype is Mitsumi’s WML-C46 Class 2 which includes a RFCOMM stack supporting the Serial Port Profile used for the communication between the microprocessor and PC. The accepted VDD range is 2.8 ~ 3.4Vdc, it is not tolerant to 5Vdc. [14] The module was programmed using CSR BlueSuite2 with a serial port profile for use at 115200 Baud as DevB to allow for connection by any device of type DevA using the correct link key. [11]
7.3 Voltage regulator The choice of voltage regulator was made based on some basic conditions:
• The accepted VDD range of the Bluetooth module is 2.8 ~ 3.4Vdc; it is not tolerant to 5Vdc.
• Power is to be supplied by a 3.7V battery or available AC/DC adapter. • Packet : SOT23-5
The voltage regulator used on the prototype is a Texas Instrument LP2985-33 chosen because of the wide input range, up to 16V, and precision output 3.3±0.05V.
7.4 Operational amplifiers Conditions for choice of operational amplifiers used in the ECG system:
• 3.3V Single supply. • Available in quad package to minimise design. • High output current to allow an effective right leg drive feedback. • Rail-to-rail outputs and inputs to maximise resolution of output. • Packet SOT23-5
18

Additional attributes taken considered but not essential: • Low power consumption to improve battery time. • Low noise to improve signal quality.
The used OPA4342 is a high speed single supply OP optimised for low voltage systems and ADC driving. To enable AC-signals in the system a single TVL2460 operational amplifier was used to buffer a voltage divider in order to add an analogue ground level to the system at 1.65V.
19

8 Hardware design The main objective of the hardware design was to optimise the resolution and accuracy of the ECG sensor. The resolution is dependent on having a total amplification optimised to produce as high output as possible to the microprocessor at the maximum of the input signal. In this case that means to amplify 2mV to 3.3V, a total amplification of 1650V/V. Since no clinical use of the device is intended surge protection is not implemented.
8.1 Schematics Overview The system consists of three separates ECG amplifiers with common inputs and right leg drive feedback. See figure 12. [12]
+
Buffers
Common Mode Amplifier
Buffers
Common Mode Amplifier
Buffers
Common Mode Amplifier
- +
-
+
-
Lead I Lead aVR Lead aVL Figure 12, System principle
8.2 System overview Serial communication between a PIC microprocessor and a computer is usually conducted according to figure 13. In this application the cable and MAX232 serial level converter is replaced with a Bluetooth™ connection.
Figure 13, Serial communication concept [15]
20

8.3 Electrical circuit design. The circuitry is divided into several function blocks connected according to figure 19.
8.3.1 Microprocessor The microprocessor pic18lf4520 is used to convert the analogue to digital signal (ADC) and as universal asynchronous receiver-transmitter (UART) for a serial connection whit the Bluetooth module. The VDD, PGC, PGD, MCLR and GND are connected to a pin header for onboard programming by using PICFlash2 and PicFLASH 7.04. See figure 14.
Figure 14 Microprocessor circuit. Block M in figure 19.
21

8.3.2 Bluetooth module The GND2, VDD2, SPI_MOSI, SPI_CLK, SPI_CSB, SPI_MISO and RST(TBD) are connected to a pin header for in circuit programming using Bluesuite2 and LPT printer port programmer. See figure 2. PIO(7) is connected to a blue LED indicating if the module has established contact with a master. The LED flashes when searching for a master to connect with and is lit when contact is established with the master.
Figure 15 Bluetooth circuit. Block B in figure 19. 8.3.3 The ECG-amplifier. These schematics can be divided into three different channels (aVR, Lead I and aVL) and each channel can be split up into different blocks. The first block is buffers and its task is to ensure that the input signals from the ECG-sensors don’t interfere with each other when the signals are added together and reaches next block. Block two is a single supply instrumental amplifier where the first stage of this amplifier acts as an input buffer with low amplification; 3V/V. see figure 16.
A= 1615109
1091
RRRR
RR
++
++ kk
kk
2020
10101 ++= = VV3
Vout = ( ) AVinVin ∗+ −+
Input signals Vin+ Vin-
aVR RA (LA+LL)/2 Lead I LA RA aVL LA (LL+RA)/2
Left Arm = LA Left Leg = LL Right Arm = RA
22

The second stage of this block is a differential amplifier whit a amplification at a VV10 . All channels have the same component value in .See figure 16.
Vout = 1238
RRVin ∗− =
kkVin
110
∗ = VV10
The total amplifications of this block are VVVV 103 −∗ = VV30− The third block of this amplifier is a DC restoration and it uses feedback commitment to minimise the DC offset in the ECG-amplifier. The speed of this restoration is determined by the time constant (τ=RC) in the HP filter, in this case R31 and C3 (see figure 4) it can take up to 10τ for a full reduction of the DC-offset in this connection.
Calculate τ= =331 CR ∗ μ1560 ∗k = f=s56.0τ1 → f=
56.01 ≈ 1.79
The frequency should be set close to 2Hz to get a quick restorations according to [12]. In the last block of this ECG-amplifier are a differential amplifier and a connection to the microprocessor. The amplification in this block is around VV34− .
Vout(pic) = 228
RRVin ∗− =
kkVin
8.162
∗ ≈ VV4.34−
The total amplification of the ECG-amplifier: VVVVVV 34103 −∗−∗ = VV1020
Figure 16 ECG-amplifier (aVR, Lead I and aVL from top to bottom). Block E in figure 19.
23

8.3.4 Power supply This circuit is used to make sure that the supply voltage for the rest of the circuit is stable at 3.3 volts and to generate an analogue ground. See figure 17.
Figure 17 Power supply. Block P in figure 19.
8.3.5 Right Leg Drive. The Right Leg Drive’s (RLD) purpose is to eliminate the noise that is produced by the body and the interfering noise generated by the mains voltages at 50Hz. The input signal is a summary of the various ECG-connections. This differential amplifier inverts and amplifies the input signal and sends it back into the body through the right leg by a common-mode amplifier. This signal is just a feedback to the different leads and limits the effect of the signal noise at the wanted ECG-signal. See figure 18. The output voltage from the common-mode calculated by the formula [12]: Input signals
Vin+ Vin-
aVR RA (LA+LL)/2Lead I LA RA aVL LA (LL+RA)/2
RLD =2
)( −+ +VinVin
RLD=2
)( aVRVinVin −+ ++
2)( IVinVin −+ +
+2
)( aVLVinVin −+ +=
4255 LLLARA ++
Figure 18 Right Leg Drive circuit. Block R in figure 19.
24

8.3.6 Design schematics
Figure 19 Design Schematics of the ECG-system whit the different blocks.
E
R
P
M B
25
8.4 External components Besides the designed and produced circuit board the system consists of a few external components.
8.4.1 Leads To reduce motion artefacts and interference by surrounding electrical equipment short flexible cables was desired. EEG cables proved to meet those needs. The Leads are colour coded in accordance with IEC. [21]
8.4.2 Electrodes The electrodes used for the project is ConMed Cleartrace.
8.4.3 Housing In order to protect the prototype from physical damage housing was created by modifying the batty charger used to charge the used battery.
8.5 Bluetooth adapters To enable Bluetooth capabilities on the computer two alternatives was examined and tested.
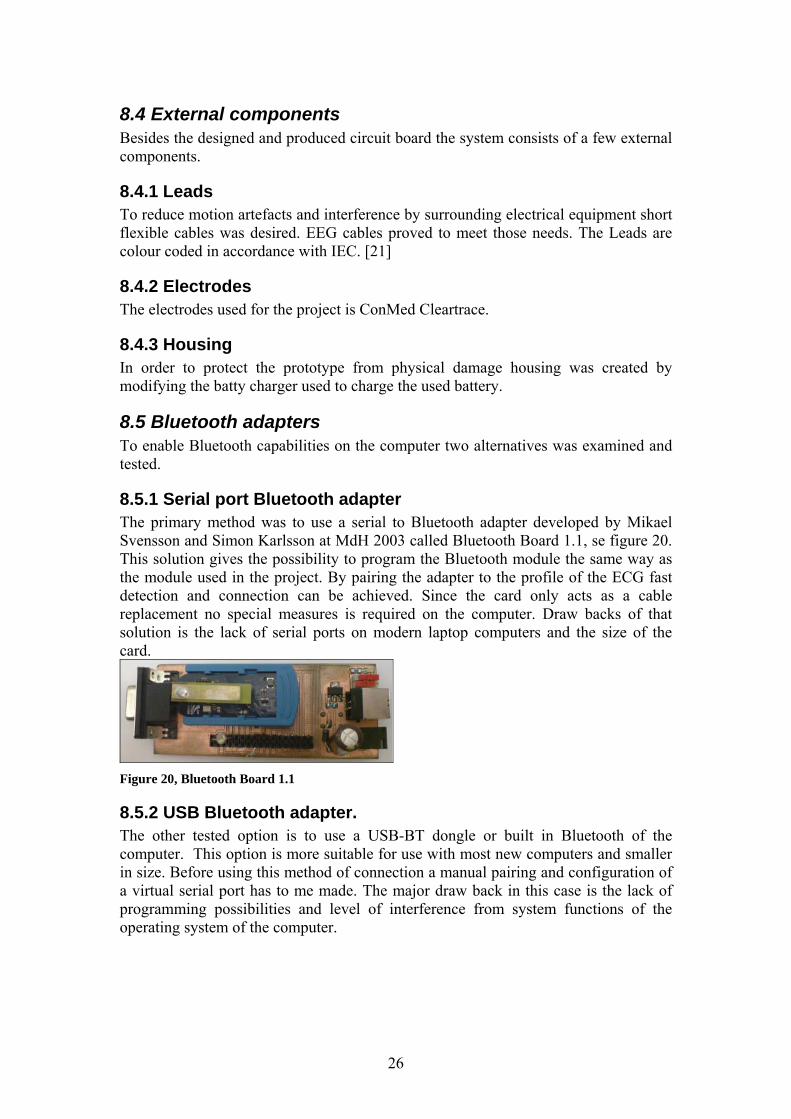
8.5.1 Serial port Bluetooth adapter The primary method was to use a serial to Bluetooth adapter developed by Mikael Svensson and Simon Karlsson at MdH 2003 called Bluetooth Board 1.1, se figure 20. This solution gives the possibility to program the Bluetooth module the same way as the module used in the project. By pairing the adapter to the profile of the ECG fast detection and connection can be achieved. Since the card only acts as a cable replacement no special measures is required on the computer. Draw backs of that solution is the lack of serial ports on modern laptop computers and the size of the card.
Figure 20, Bluetooth Board 1.1
8.5.2 USB Bluetooth adapter. The other tested option is to use a USB-BT dongle or built in Bluetooth of the computer. This option is more suitable for use with most new computers and smaller in size. Before using this method of connection a manual pairing and configuration of a virtual serial port has to me made. The major draw back in this case is the lack of programming possibilities and level of interference from system functions of the operating system of the computer.
26

9 Design The requirement for this electrical CAD design of the ECG-system:
• Maximum size: 45×55mm, same as that use battery. • Dual layer card with SMD components. • No signal or GND near the Bluetooth modules antenna.
The electrical design was made in Eagle CAD 4.16
9.1 Top side. On this side are power supply and the digital stage with microprocessor and Bluetooth module. See figure 21
Power supply
Microprocessor
Bluetooth module
Figure 21 Top layer, Eagle CAD
27

9.2 Bottom side On this side the analogue signal of the ECG system is processed. See figure 22.
Figure 22 Bottom layer. Eagle CAD.
28

10 Software design The software of the system consists of two parts, firmware in the microprocessor of the ECG and a user interface, GUI, for use in Windows. Firmware tasks
- Sample analogue values from ECG and convert then to digital. - Encode packets of data. - Control the serial port - Send data to Bluetooth module by EUSART.
GUI tasks - Initiate communication with the ECG system. - Control the mode of operation of the firmware - Read and display output from the ECG system. - Save data to file.
10.1 Firmware design The purpose of the PIC is to acquire multiple analogue signals simultaneously, make packages of the digital values suitable for transmitting and sending to the Bluetooth module acting as a cable replacement between the microprocessor and the computer. Programming of the microprocessor was made in MikroC, developed by MikroElektronika , an editor/compiler for Microchip’s line of PIC microprocessors. MikroC produces files of type .hex which then are programmed into the processor using PICFlash by MikroElektronika To optimise the number of samples per second a decision was made to minimise the load on the microprocessor by making as much of the calculation in the PC. The firmware of the PIC basically consists of a three part loop; Read ADC inputs, prepare data blocks and send them to the Bluetooth module using 4 wires, Rx/Tx and RTS/CTS. Sending of data by the serial protocol is made in block of eight bits, a byte. Pins used in the firmware are listed in Figure 23.
29
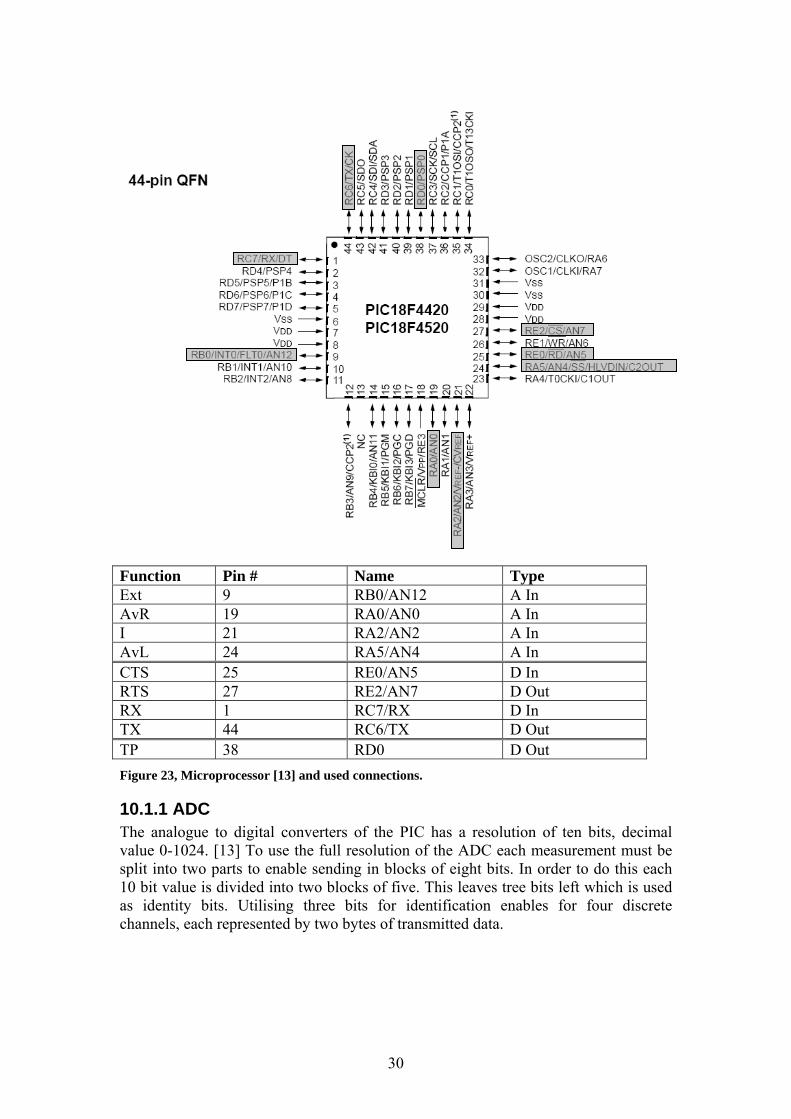
Function Pin # Name Type Ext 9 RB0/AN12 A In AvR 19 RA0/AN0 A In I 21 RA2/AN2 A In AvL 24 RA5/AN4 A In CTS 25 RE0/AN5 D In RTS 27 RE2/AN7 D Out RX 1 RC7/RX D In TX 44 RC6/TX D Out TP 38 RD0 D Out Figure 23, Microprocessor [13] and used connections.
10.1.1 ADC The analogue to digital converters of the PIC has a resolution of ten bits, decimal value 0-1024. [13] To use the full resolution of the ADC each measurement must be split into two parts to enable sending in blocks of eight bits. In order to do this each 10 bit value is divided into two blocks of five. This leaves tree bits left which is used as identity bits. Utilising three bits for identification enables for four discrete channels, each represented by two bytes of transmitted data.
30

I.e. with the ADC configured for 0-3.3V, 3.3V ≡ 1024, and the four inputs at a voltage of 0.5, 1.0, 1.5 and 2.5 V the resulting data bytes are constructed according to table 1. channel analogue digital part id data Sent byte 1 0.5V 0010011011 high 000 00100 00000100 low 001 11011 00111011 2 1.0V 0100110110 high 010 01001 01001001 low 011 10110 01110110 3 1.5V 0111010001 high 100 01110 10001110 low 101 10001 10110001 4 2.5V 1100000111 high 110 11000 11011000 low 111 00111 11100111
Table 1
The identification bits are used by the receiving program to reassemble the separated bits back into the original 10 bits of data. The firmware has three modes of operation selectable by sending the corresponding command char: “0” – No reading of ADC or sending of data. “1” – Read 4 ADC channels and send as 8 bytes. “2” – Read 1 channel 4 times and send as 8 bytes.
10.2 Baud rate A decisive parameter in acquiring an acceptable representation of an ECG is the inclusion of all relevant frequency components. Vital in obtaining this is to sample the signal at two times the highest frequency component of interest. [12] In the case of ECG, the highest comprising frequency of concern is about 400Hz requiring a sampling frequency of 800 Hz to be registered. Simultaneously measuring four channels requires 3200 measurements per second. Each measurement is then to be transmitted as two 10bit-bytes. The total required transmission speed is therefore 64000 bits per second. The closest standard baud rate above this is 115200. When using the USART of the PIC18LF4520 the exact desired baud rate cannot be obtained, the level of deviation depends on the requested baud rate and the frequency of the used oscillator. Table 2 shows the possible baud rates.
Table 2
31

Table 3
Equations used to calculate baud rate using table 2 and 3: [13]
)1(4 +⋅= SPBRGFOSCrateBaud
14 −= ⋅ rateBaudFOSCSPBRG = 42.4
The baud rate is calculated by the formula )142(420000000
)1(4 +⋅+⋅ == SPBRGFOSCrateBaud = 116279
Based on this table tests were made to verify the transmission speed throughout the whole system with communication initiated at 115200 baud using a 20 MHZ crystal. This was performed by monitoring the Tx line from the receiving Bluetooth module to the computer with an oscilloscope and measuring the width of the shortest detected pulse.
0
0,5
1
1,5
2
2,5
3
3,5
4
-1,0E-05 0,0E+00 1,0E-05 2,0E-05 3,0E-05 4,0E-05 5,0E-05 6,0E-05 7,0E-05 8,0E-05 9,0E-050
0,5
1
1,5
2
2,5
3
3,5
4
2,5E-05 2,6E-05 2,7E-05 2,8E-05 2,9E-05 3,0E-05 3,1E-05 3,2E-05 3,3E-05 3,4E-05 3,5E-05 Figure 24, Measured bit time
The actual baud rate was calculated by measuring the bit time (BT), in this case 8.6µs, see Figure 24. Calculating the frequency as 1/BT results in 116279 bits per second which matches the theoretical value.
10.2.1 Oscillator The microprocessor can be configured to work with at clock rate based on an internal oscillator or different types of external crystals. The choice of crystal for this project was made dependent on the need for transmission speed of the UART called Baud rate.
32

10.3 Sampling In order for a band-limited (i.e., one with a zero power spectrum for frequencies v>B) baseband (v>0) signal to be reconstructed fully, it must be sampled at a rate v≥2B. A signal sampled at v=2B is said to be Nyquist sampled, and v=2B is called the Nyquist frequency. No information is lost if a signal is sampled at the Nyquist frequency, and no additional information is gained by sampling faster than this rate, se figure 25. [16]
Figure 25, LabView measurements manual [17]
33

10.4 Firmware flowchart Presented in Figure 26 is a flow chart for the firmware of the microprocessor.
Initiationvarialbles
InitiationUART
(115200)
InitiationPorts
InitiationA/D
Test pulseTP
(250ms)
SetRTS
Data ready on UART
’val’ = first char in que
Y
N
Set TP if ’val’ ? ”0"
Val = ’1'
’Ch_1' = ADC(0)
’Ch_2' = ADC(2)
’Ch_3' = ADC(4)
’Ch_x’ = ADC(12)
Val = ’2'
’Ch_1' = ADC(0)
’Ch_2' = ADC(0)
’Ch_3' = ADC(0)
’Ch_x’ = ADC(0)
SetRTS
Val = ’1' or ’2'
Split 10-bit values into two 5-bit
values with id.
USART Write 8 byte
Delay 22 µs
Delay 22 µs
CTS set
Y Y
Y
Y
1
N
N
N N
Figure 26, Flowchart firmware
34

10.5 Computer interface The computer interface was made using National Instrument’s LabWindowsTM/CVI 8.0.0 (273). LabWindowsTM/CVI is an ANSI C integrated development environment providing a set of programming tools for creating test and control applications. [18] The choice of LabWindows as a development environment was made because of the combination of tools suitable for the application compared to e.g. MS Visual Studio and the added detail control compared to NI’s LabView. The purpose of the computer interface is to receive packets of data from the PIC and use them to display the signals graphically. The program also calculates and displays the heart rate and R-R-times over time. Measured and calculates information can be saved to file continuously, se figure 27.
Figure 27, Computer interface
10.5.1 Filters The signals are stored in arrays without any filtering. An LP-filter can be applied to the graph to remove unwanted jitter. When calculating heart rate and R-R values a HP-filter is used in order to remove low frequency changes of the baseline due to movement of the user.
10.5.2 Pulse detection Detection of the current heart rate is based on the time between the peaks of the R waves. The pulse detection is performed I a series of steps. First the maximum and minimum value during 4096 measurements is calculated. Secondly the peaks are detected by
35

defining them as the local maxima between the points where the signal passes 90% of the total span going up and 80% going down. When the whole span has been analysed
the heart rate (HR) in beats per minute is defined as t
nHR 60)1( ⋅−= where is the
number of detected peaks and t is the time from the first to the last peak. Finally the measurements between the first and last peaks, the complete waves appearing, are saved to file.
n
10.5.3 File format The GUI has an option to log unfiltered measurements to file. Writing to the file is performed each time a new sweep of data has been read and analysed. Each addition to the log file consists of these parts:
• Time stamp Current data and time. • R-R Time between each detected R-peak. • Heart rate Calculated heart rate. • Time span Time between first and last detected R-peak. • Point Number of measurements during time span. • ECG listing of measurements during time span.
Figure 28 shows an example of output.
------------------------ Mon Jul 09 10:06:58 2007 R1-R2: 0.742079 R2-R3: 0.739093 R3-R4: 0.745065 R4-R5: 0.776421 R5-R6: 0.752531 R6-R7: 0.809269 Heart rate: 81 Time span(s): 4.450 Points: 3055 aVL I -aVR ¯¯¯¯ ¯¯¯¯ ¯¯¯¯ 183 1023 737 250 1023 713 323 986 718
. . .
239 882 556 219 929 595 129 979 623 80 1023 645 ------------------------ Mon Jul 09 10:07:16 2007 R1-R2: 0.802012 R2-R3: 0.825008 R3-R4: 0.836507 R4-R5: 0.822134 R5-R6: 0.790513 R6-R7: 0.751706 Heart rate: 76 Time span(s): 4.707 Points: 3357 aVL I -aVR ¯¯¯¯ ¯¯¯¯ ¯¯¯¯ 168 1023 695 292 1023 722 467 841 746
Figure 28
36

To separate out the different types of information from the log file a MS-DOS batch file was developed. The script produces a number of files each containing one of the mentioned parts to be used in further analysing. Figure 29 shows the batch file.
@echo off color f1 dir /B REM Request filename, save in variable fn SET /P fn=File to split up (expand with TAB): REM copy lines containing "Heart" to new file with _HR added to filename. echo Filtering out only Heart rates from %fn% echo to %fn:~0,-4%_HR.log find "Heart" %fn% > %fn:~0,-4%_HR.log echo Filtering out only R-R values from %fn% echo to %fn:~0,-4%_R-R.log find "-R" %fn% > %fn:~0,-4%_R-R.log echo Filtering out 3ch ECG from %fn% echo to %fn:~0,-4%_ECG.log find ":" %fn% > %fn:~0,-4%_-ECG.log echo Filtering out only 3ch ECG from %fn% echo to %fn:~0,-4%_ECG.log find /v ":" %fn% > %fn:~0,-4%_ECG.log echo -------------- echo Files created: dir /B %fn:~0,-4%*.log color 07
Figure 29
37

10.5.4 Computer interface flowchart Presented in Figure 30 is a flow chart for the firmware of the microprocessor.
Open COMport
Open Panel
Start Com Callback
8 chars
START Com CB Timer CB Save file CB Mode CB
COM Callback
Quit
Sort data
Full plot
Save to file
Calculate max/min
Calculate R-peaks
Plot R-RPlot HR
Save to file
Reset counter
Increase counter
filter
Filter signal
Plot graphs
on
Dim filename
Get name
Clear que
Clear graphs
Send ”0"Send”0", ”1" or ”2"
Clear que
Set flag savefile
Figure 30, Computer interface flowchart
38

11 Result The project has resulted in a prototype capable of recording and presenting three channels of ECG continuously during real situation tests. The graphical output has been proven to be usable for statistical purposes. When used to record ECG levels of normal magnitudes, 0-2mV, output is within 0-3V. The physical properties comply with the objective regarding size and component placement.
11.1 Power consumption The current consumption of the system was measured at the battery during the different modes of operation: Stand by: 45mA “0”: 59mA “1”&”2”: 67mA Power consumption during active mode while sending data at 980Hz based on current consumption and ohms law P=U·I. P = 3.7V·67mA = 248mW The maximum time to run the system using the battery in use has not been tested since the intended usage of the system without recharging is limited to less than an hour and the battery is interchangeable. The theoretical running time using the available batteries, 780mAh and 1800mAh, is at least 11h based on the measured current consumption.
11.2 Problems As can be expected a few problems was bound to occur during a project like this. Most could be addressed and solved quickly but a few major problems have surfaced. Due to some unresolved problems regarding reduced sampling rate, depending on update rate of the graphs, the actual rate of data saved to the file is lower than desired; ~675 only allowing for FFT up to ~385 Hz. Programming of the Bluetooth modules rendered some problems due to faulty programming hardware. Because of the failure to program the system a new, alternative, board was developed equipped with an exchangeable Bluetooth module enabling usage of various types of Bluetooth modules. Soldering the Bluetooth module by hand showed to be quite complicated and prolonged the fabrication of the card. Since neither of the participants in the project had any experience in milling circuit boards several cards had to be made and later discarded, before the resulting product was to satisfaction.
39

When subjecting the system to a longer test the housing proved to be less waterproof than expected, the system suddenly stopped working. The circuit board showed residue of dried salt around the voltage regulator which had been damaged and had to be replaced. Originally another microprocessor capable of 12-bit analogue to digital conversion was planned to be utilized but this feature has no support in the development software so the decision was made to revert to the used one supporting 10-bit. Because the project is part of a larger ongoing research project the conditions has not always been established generating some delay.
11.3 Process The first step in the development of the system was to evaluate different approaches to measuring the three ECG channels aVL, aVR and I simultaneously without using more than four electrodes.
Figure 31, 3/6-lead ECG
Two approaches were tested on bread board, to expand a 1-lead solution by using buffers to avoid interference between the channels, see figure 16, or to use a reduced 6-lead ECG, see figure 31. [1][12] The former solution showed to be working and more easily optimised. The firmware of the microprocessor and GUI was developed using a microprocessor and MAX3232 on a bread board connected to the PC by cable, the cable was later exchanged for two serial Bluetooth boards before the realising the tested design on a milled board. In parallel to the development of the software; design of the complete system using SMD components was conducted. During the development phase an electronic patient simulator was used instead of a human to simulate different changes in the attributes of the subject.
40

12 Discussion In hindsight the project became more focused on development and production of a miniaturised embedded system than evaluating and analysing the expected output from it. If we had focused less on miniaturising the system more time could have been left for testing and optimising the complete system. We begun the work with the intension to quickly examine the task and develop a simple prototype of the different parts to be able to initiate the design of the complete system shortly. The major flaw of the GUI is the often slow sampling rate and page-based update of the graphs. The sampling rate is highly dependent on the computer in use and even the fastest computer tested on does not get rates approaching that of the stream of data from the microprocessor. There seems to be a high dependency between rate of graphical update and rate of read samples. By using individual threads for the serial communication, graphical interface and file saving functions improvements in over all speed should be achieved. Running the system using Linux might improve the performance. The choice of the 44-pin PIC18F4520 was mainly based on the fact that there were samples available making testing on a bread board possible but to minimise the prototype, a smaller microprocessor such as the 28-pin PIC18F2520 could be used instead without affecting the functionality since most of the I/O pins and ADC channels are unused. To further improve the resolution of the measurements alternative microprocessors equipped with 12-bit ADC could be utilised. The hardware and firmware is designed to process a fourth channel of additional information from an external source but that is not enabled in the current computer interface since this was planned to originate from another project. In order to improve the working range, work could be done in replacement of the antenna to improve the free area around it. If the device is to be used on subjects undergoing physical exercise better moisture-secure housing might be considered.
41

13 Summary The project has resulted in a prototype of very small, multi channel, wireless ECG usable in monitoring an exercising subject without being overloaded by inference from movement and surrounding electronics despite not deploying any filtering. The work became more centred on the development, rather than analysing the possible uses and results, of the device than expected. Much time was spent on building and testing the hardware since the use of SMD components not always suitable for manual attachment. Even though the result and work during the project didn’t exactly accord to the expectations it has been an interesting project giving insight into the process of developing an electronic measuring system.
42
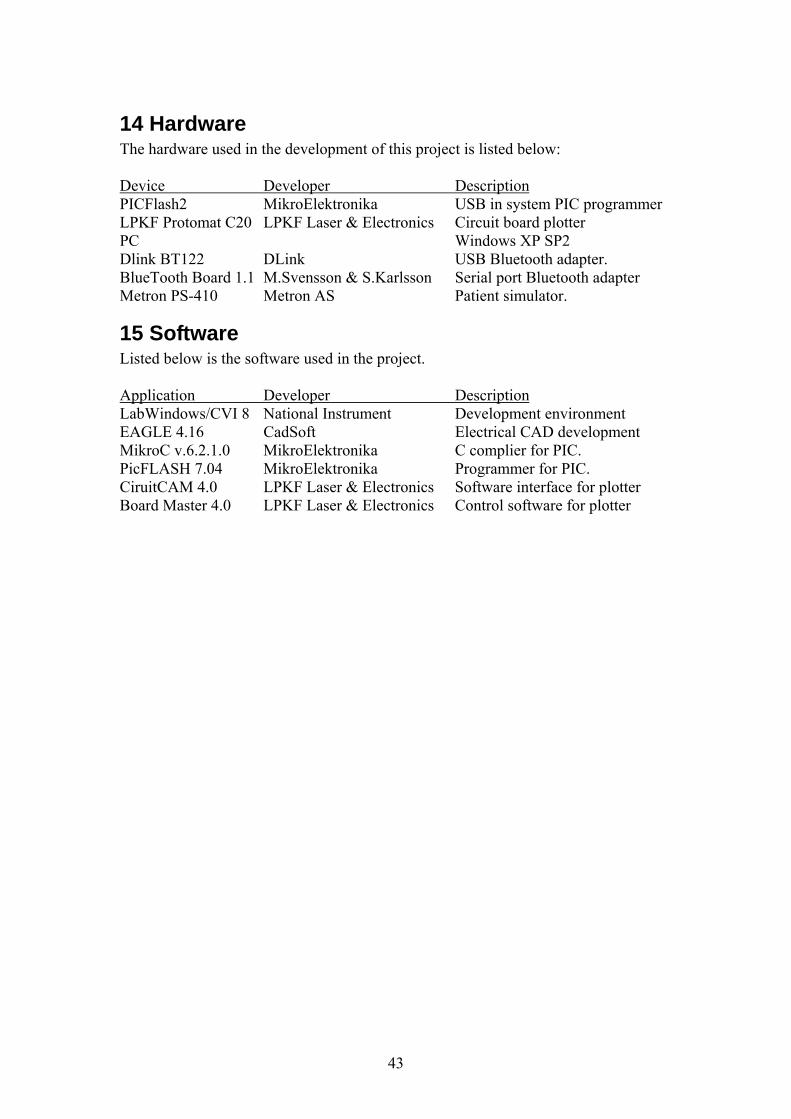
14 Hardware The hardware used in the development of this project is listed below: Device Developer Description PICFlash2 MikroElektronika USB in system PIC programmer LPKF Protomat C20 LPKF Laser & Electronics Circuit board plotter PC Windows XP SP2 Dlink BT122 DLink USB Bluetooth adapter. BlueTooth Board 1.1 M.Svensson & S.Karlsson Serial port Bluetooth adapter Metron PS-410 Metron AS Patient simulator.
15 Software Listed below is the software used in the project. Application Developer Description LabWindows/CVI 8 National Instrument Development environment EAGLE 4.16 CadSoft Electrical CAD development MikroC v.6.2.1.0 MikroElektronika C complier for PIC. PicFLASH 7.04 MikroElektronika Programmer for PIC. CiruitCAM 4.0 LPKF Laser & Electronics Software interface for plotter Board Master 4.0 LPKF Laser & Electronics Control software for plotter
43
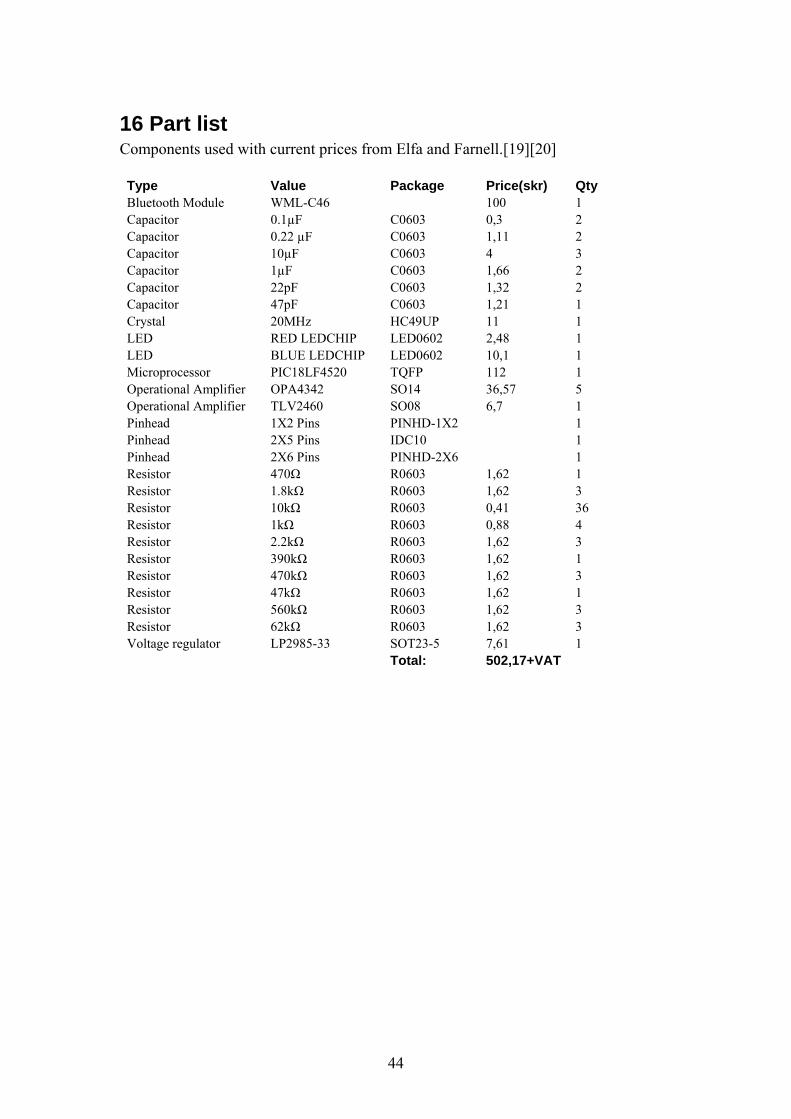
16 Part list Components used with current prices from Elfa and Farnell.[19][20] Type Value Package Price(skr) Qty Bluetooth Module WML-C46 100 1 Capacitor 0.1µF C0603 0,3 2 Capacitor 0.22 µF C0603 1,11 2 Capacitor 10µF C0603 4 3 Capacitor 1µF C0603 1,66 2 Capacitor 22pF C0603 1,32 2 Capacitor 47pF C0603 1,21 1 Crystal 20MHz HC49UP 11 1 LED RED LEDCHIP LED0602 2,48 1 LED BLUE LEDCHIP LED0602 10,1 1 Microprocessor PIC18LF4520 TQFP 112 1 Operational Amplifier OPA4342 SO14 36,57 5 Operational Amplifier TLV2460 SO08 6,7 1 Pinhead 1X2 Pins PINHD-1X2 1 Pinhead 2X5 Pins IDC10 1 Pinhead 2X6 Pins PINHD-2X6 1 Resistor 470Ω R0603 1,62 1 Resistor 1.8kΩ R0603 1,62 3 Resistor 10kΩ R0603 0,41 36 Resistor 1kΩ R0603 0,88 4 Resistor 2.2kΩ R0603 1,62 3 Resistor 390kΩ R0603 1,62 1 Resistor 470kΩ R0603 1,62 3 Resistor 47kΩ R0603 1,62 1 Resistor 560kΩ R0603 1,62 3 Resistor 62kΩ R0603 1,62 3 Voltage regulator LP2985-33 SOT23-5 7,61 1 Total: 502,17+VAT
44

17 References [1] http://www.idt.mdh.se/utbildning/exjobb/files/TR0479.pdf 2007-08-08 08:08 [2] http://butler.cc.tut.fi/~malmivuo/bem/bembook/
2007-08-07 14:38 [3] http://en.wikipedia.org/wiki/Heart
2007-08-07 14:39 [4] http://sv.wikipedia.org/wiki/Hjärta
2007-08-07 14:46 [5] http://en.wikipedia.org/wiki/ECG
2007-08-07 14:41 [6] http://sv.wikipedia.org/wiki/EKG
2007-08-07 14:42 [7] http://www.diva-portal.org/diva/getDocument?urn_nbn_se_liu_diva-357-
1__fulltext.pdf 2007-08-08 15:30 [8] http://en.wikipedia.org/wiki/QT_interval
2007-08-07 14:38 [9] http://www.bluetooth.com/Bluetooth/Learn/Works/ 2007-08-01 08:30 [10] http://bluetooth.com/NR/rdonlyres/4C1E59CA-7E67-4126-8FE8- 107C84A7B72C/916/rfcomm.pdf 2007-08-01 09:30 [11] http://bluetooth.com/Bluetooth/Learn/Works/Profiles_Overview.htm 2007-08-01 09:30 [12] Joseph J. Carr & John M. Brown
Introduction to Biomedical Technology, Fourth Edition ISBN 0-13-010492-2, Prentice Hall 2001
[13] Microchip PIC18F2420/2520/4420/4520 Data Sheet Revision B http://ww1.microchip.com/downloads/en/DeviceDoc/39631b.pdf 2007-02-09
[14] http://www.mitsumi.co.jp/Catalog/pdf/commun_wml_c46_e.pdf 2007-07-25 10:00 [15] http://www.mikroe.com/pdf/mikroc/mikroc_manual.pdf 2007-07-25 10:50 [16] http://mathworld.wolfram.com/SamplingTheorem.html 2007-08-05 15:00 [17] National Instruments Corporation
LabView Measurements Manual, April 2003 Edition [18] http://www.ni.com/lwcvi/
2007-07-19 14:30 [19] http://www.elfa.se/ 2007-08-07 10:15 [20] http://se.farnell.com/ 2007-08-07 10:00 [21] http://www.gla.ac.uk/care/colourcoding.html
2007-08-10 09:30 [22] http://www.palowireless.com/INFOTOOTH/knowbase/general/10.asp 2007-08-13 10:30
45
Appendix
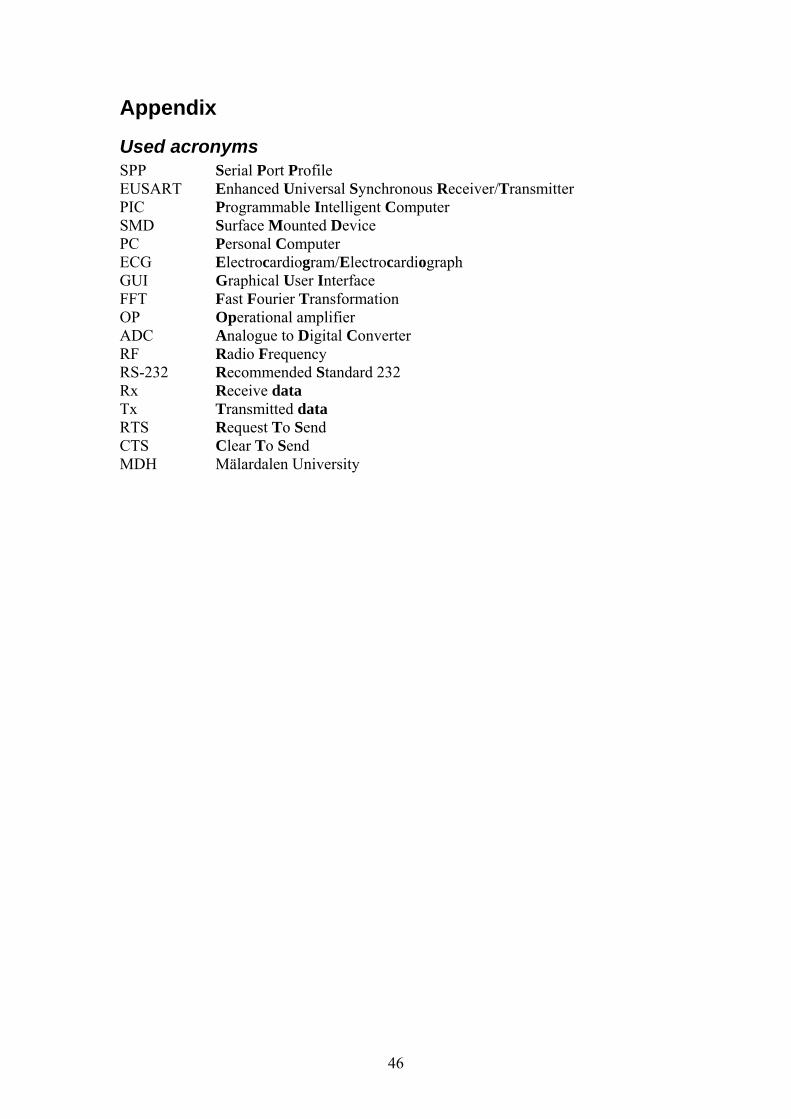
Used acronyms SPP Serial Port Profile EUSART Enhanced Universal Synchronous Receiver/Transmitter PIC Programmable Intelligent Computer SMD Surface Mounted Device PC Personal Computer ECG Electrocardiogram/Electrocardiograph GUI Graphical User Interface FFT Fast Fourier Transformation OP Operational amplifier ADC Analogue to Digital Converter RF Radio Frequency RS-232 Recommended Standard 232 Rx Receive data Tx Transmitted data RTS Request To Send CTS Clear To Send MDH Mälardalen University
46

Firmware Listed below is the MikroC program listing. /************************************ * INITIATION VARIABLES * *************************************/ int val='2'; //Start in mode 2 int ch_1=100,ch_2=200,ch_3=400,ch_x=800; int ch_1l,ch_2l,ch_3l,ch_xl; int ch_1h,ch_2h,ch_3h,ch_xh; int i=1; /*$*$*$*$*$*$*$*$*$*$*$*$*$*$*$*$*$*$ Used I/O pins on PIC18LF4520 TQFP Ext 8 RB0/AN12 A In AvR 19 RA0/AN0 A In I 21 RA2/AN2 A In AvL 24 RA5/AN4 A In CTS 25 RE0/AN5 D In RTS 27 RE2/AN7 D Out TP 38 RD0 D Out RX 1 RC7/RX D In TX 44 RC6/TX D Out *$*$*$*$*$*$*$*$*$*$*$*$*$*$*$*$*$*$*/ void main() /************************************ * INITIATION ADC * *************************************/ ADCON1 = 0x0A; // AN12-5 Digital IO, AN3-0 Analog input ADCON2.F7 = 0; // A/D result, format xxxxxxNN NNNNNNNN ADCON2.F5 = 1; // A/D 12 TAD, f<2.86MHz: 18LF4520 ADCON2.F4 = 0; // A/D TAD ADCON2.F3 = 1; // A/D TAD /************************************ * INITIATION PORTS * *************************************/ TRISA = 0xFF; // PORTA all inputs, RST=FF TRISD = 0; // Pins PORTD Outputs TRISB = 1; // Bit 0, PORTB input TRISE = 0x04; // Pins PORTE: RE2 Output,RE0 Input /************************************ * INITIATION UART *
47

*************************************/ Usart_Init(115200); //20MHz /************************************ * STARTPULS on TESTPINS * *************************************/ PORTD.F0 = 0; //LED delay_ms(250); PORTD.F0 = 1; //LED PORTD = ~PORTD; //Toggle LED2 Delay_ms(250); PORTD.F0 = 0; //LED PORTD = 0; /************************************ * SET Ready To Send * *************************************/ PORTE.F2 = 0; //PORTE.F2 == 0 = RTS /************************************ * MAINLOOP * *************************************/ do PORTD = ~PORTD; //INVERT TP if (Usart_Data_Ready()) //Check for new command val = Usart_Read(); PORTD.F0 = (val - '0'); //SET TP if active mode /************************************** * 3+1 channel ***************************************/ if (val == '1')//Read 4 channels PORTD = 4; ch_1 = ADC_Read(0); ch_2 = ADC_Read(2); ch_3 = ADC_Read(4); ch_x = ADC_Read(12); if (val == '2')//Read 1 channel 4 times PORTD = 4; ch_1 = ADC_Read(0); ch_2 = ADC_Read(0); ch_3 = ADC_Read(0); ch_x = ADC_Read(0);
48

PORTE.F2 = 0; //PORTE.F0 == 0 = RTS if ((val == '1') || (val == '2') ) //Send if val is valid if (!PORTE.F0) //PORTE.F0 == 0 = CTS //Calculate 8 bytes of data ch_1h=(ch_1 >> 5) + 0x00; ch_1l=(ch_1 & 0x1F) + 0x20; ch_2h=(ch_2 >> 5) + 0x40; ch_2l=(ch_2 & 0x1F) + 0x60; ch_3h=(ch_3 >> 5) + 0x80; ch_3l=(ch_3 & 0x1F) + 0xa0; ch_xh=(ch_x >> 5) + 0xc0; ch_xl=(ch_x & 0x1F) + 0xe0; PORTD.F0 = 0; //SET TP=0 delay_us(22); //SEND DATA USART_Write(ch_1h); USART_Write(ch_1l); USART_Write(ch_2h); USART_Write(ch_2l); USART_Write(ch_3h); USART_Write(ch_3l); USART_Write(ch_xh); USART_Write(ch_xl); delay_us(22); PORTE.F2 = 0; //PORTE.F2 == 0 = RTS while(1);
Lab Windows Listed below is the LabWindows program listing. /*¤*¤*¤*¤*¤*¤*¤*¤*¤*¤*¤*¤*¤*¤*¤*¤*¤*¤*¤*¤*¤*¤*¤*¤*¤*¤*¤*¤*¤* *¤*¤*¤*¤*¤*¤*¤*¤*¤ 3 - C H . E C G ¤*¤*¤*¤*¤*¤*¤*¤*¤ ¤*¤*¤*¤*¤*¤*¤*¤*¤*¤*¤*¤*¤*¤*¤*¤*¤*¤*¤*¤*¤*¤*¤*¤*¤*¤*¤*¤*¤*¤*/ #include "toolbox.h" #include <formatio.h> #include <rs232.h>
49

#include <ansi_c.h> #include <analysis.h> #include <userint.h> #include "ECG07.h" #include <utility.h> static NIComplexNumber ch_1_cplx_fft[2048]; static NIComplexNumber ch_1_cplx[2048]; #define antal_punkter 4096 #define bytes 8 // 4ch * 2bytes //Functions void ECG_save_file(int startx, int stopx, double T); //First, last, time f-l char * ascii_time(void); char * file_time(void); void Save_file(char * data); void Time_save_file(void); void FFTSaveToFile(void); //CUIR Callbacks void CVICALLBACK ReceiveData(int portNo, int eventMask, void *data); static int panelHandle,fileHandle; int temp, eventMask=LWRS_RECEIVE,plotxx=0,plotx=0,ch_1[antal_punkter*4],ch_2[antal_punkter*4],ch_3[antal_punkter*4],ch_x[antal_punkter*4],k=0; int val=1,bs_flag=0; double T=0,dT=0,FIRcoef[10000]; int n=0,sfflag=0,sf=0,hpf=5; char f_name[64],t_tmp[64]; int ts=1,it=0,comcount=0; char pulse_s[32]; int sr=500; int cerr=0; int cport=1; //Serial port selection /*********************************************************** ***************** M A I N ******************** ***********************************************************/ int main (int argc, char *argv[]) if (argv[1]) cport=atoi(argv[1]) ; //COMport # as first argument to EXE. (eg. "ecgprog.exe 23" to use COM23) panelHandle = LoadPanel (0, "d:\\JH\\ComTest\\ECG07.uir", PANEL);// PanelHandle declaration cerr = OpenComConfig (cport, NULL, 115200, 0, 8, 1, 32, 0);//comport initiation if (!cerr) //continue communication if port is valid
SetCTSMode (cport, LWRS_HWHANDSHAKE_CTS_RTS); //Aktivera flödeskontroll i form av RTS/CTS för kommunikationen FlushInQ (cport); //Rensa buffrar FlushOutQ (cport); InstallComCallback (cport, eventMask, 8, 0, ReceiveData, NULL); //Callback vid 8 tecken i bufferten
50

ComWrtByte (cport, '1'); //start signal DisplayPanel (panelHandle); if (cerr == -2) SetPanelAttribute (panelHandle, ATTR_TITLE, "COM ERROR: Invalid port"); SetCtrlVal (panelHandle, PANEL_TEXTMSG_time, ascii_time()); SetCtrlVal (panelHandle, PANEL_STRING_filename, file_time());
SetAxisScalingMode (panelHandle, PANEL_GRAPH_ECG, VAL_BOTTOM_XAXIS, VAL_MANUAL, 0.0, antal_punkter); SetCtrlAttribute (panelHandle, PANEL_GRAPH_ECG, ATTR_REFRESH_GRAPH, 1); RunUserInterface (); DiscardPanel (panelHandle); return 0; /*********************************************************** *************** Q U I T ****************** ***********************************************************/ int CVICALLBACK QuitCallback (int panel, int control, int event, void *callbackData, int eventData1, int eventData2) switch (event) case EVENT_COMMIT: ComWrtByte (cport, '0');// stäng av mätning ComWrtByte (cport, '\n'); FlushInQ (cport); FlushOutQ (cport); CloseCom (cport); QuitUserInterface (0); break; return 0; /*********************************************************** *************** R E C E I V E D A T A ****************** ***********************************************************/ void CVICALLBACK ReceiveData (int portNo, int eventMask, void *data) int i,bs_filter;//declarear era varabler.. unsigned char intmp[9]; double ch_1_real[antal_punkter*4],yyy[antal_punkter*4],ch_2_real[antal_punkter],ch_3_real[antal_punkter]; unsigned short int uttmp[8]=0,0,0,0,0,0,0,0,res;
51

double fas=0; double xxx_bs[10000]; int ymax,ymin,yma,ym,ymi,nm=0,n1=0; double x1,x2,HR=60,kfft=1; if(LWRS_RECEIVE) ComRd(cport, intmp,8); //Read 8 chars intmp[8]='\00'; //Stringgnulltermination //Sort data //bit 7-6: Channel //bit 5: High or low bits //bit 4-0: Data for (i=0;i<8;i++) //Skapa mätvärdesarray baserat på indatats id uttmp[intmp[i] >> 5]=intmp[i] & 0x1f; //ex. intmp[i] = 101x xxxx -> signal 5, ch_3 låga bitar. n++; SetCtrlVal (panelHandle, PANEL_NUMERIC_n, plotx); //Mätpunkitsräknare if (plotx >= ((antal_punkter-1) * (1 + 3*(val == 2))) ) //Vid "full" graf k=1; //Satt efter första varvet ConvertArrayType (ch_1, VAL_INTEGER, ch_1_real, VAL_DOUBLE, antal_punkter * (1 + 3*(val == 2)));
//Konvertera värdesarrayen till double. for (i=0;i<(antal_punkter * (1 + 3*(val == 2)));i++) yyy[i]=0; //Skapa tom imaginärarray till FFT dT=T; //Tidsmätning för inläsning till FFT/filter T=Timer(); SetCtrlVal (panelHandle, PANEL_Num_Timer, T-dT); sr = plotx/(T-dT) ; GetCtrlVal (panelHandle, PANEL_BINARYSWITCH_file, &sf); /*¤*¤*¤*¤*¤*¤ 5 0 H z *¤*¤*¤*¤*¤*¤*/ GetCtrlVal bs_filter=1;
(panelHandle, PANEL_50HZ_BUTTON, &bs_filter); //Val för 50Hz filter //FORCE FILTER ON !!!!!!!
if (bs_filter) //FFT med filter för 50Hz FIR_Coef (1, antal_punkter, hpf*(T-dT), hpf*(T-dT), 199, FIRcoef);// Definition av parametrar för Filter Convolve (ch_1_real, antal_punkter , FIRcoef, 199, xxx_bs); // Skapande av filtrerad mätvärdes //PPPPPPPPPPPPPPPPPPPPPPPPPPPPPPPPPPPPPPPPPPPPPPPPPPPPPPPPPPPPPPPPPPPPPPPPPPP // P U L S E //PPPPPPPPPPPPPPPPPPPPPPPPPPPPPPPPPPPPPPPPPPPPPPPPPPPPPPPPPPPPPPPPPPPPPPPPPPP if (sfflag) Save_file(ascii_time());
52

//Channel 1: AvL : xxx_bs filtrerad for (i=100,ymin=1024,ymax=0;i<plotx;i++) //Get minimum and maximum if (xxx_bs[i] < ymin) ymin = xxx_bs[i]; if (xxx_bs[i] > ymax) ymax = xxx_bs[i]; yma = ymax - 0.7*(ymax-ymin); ymi = ymax - 0.8*(ymax-ymin); for (i=100,x1=0.0,x2=0.0,n=0,ym=ymi;i<plotx;i++) if (xxx_bs[i] < ym) ym = xxx_bs[i]; if (x1) x2 = i; n1=1; else if (xxx_bs[i] > yma) if (n1) nm++; if (x1) PlotStripChartPoint (panelHandle, PANEL_STRIPCHART_T, (T-dT)/(plotx-100)*(i-it));//dT R-R // PRINT R_R TO FILE if (sfflag) sprintf (pulse_s, "R%i-R%i:\t%3f\n",nm-1,nm, (T-dT)/(plotx-100)*(i-it)); Save_file(pulse_s); it=i; PlotLine (panelHandle, PANEL_GRAPH_ECG, i-100, 0, i-100, 3000, VAL_DK_MAGENTA); //Pulsplot if (x1 == 0) // Första gången x1 = i; n1=0; ym = ymi; HR=(5*60*(nm-1)/((T-dT)*(x2-x1)/plotx))/5; SetCtrlVal (panelHandle, PANEL_NUMERIC_pulse,HR); PlotStripChartPoint (panelHandle, PANEL_STRIPCHART_HR, HR); SetCtrlAttribute (panelHandle, PANEL_TIMER_hr, ATTR_INTERVAL, 60/HR) ;
53

Pin (HR,0,999); //Limit HR values to 0-999 to avoid errors in sprint if (sfflag) sprintf (pulse_s, "Heart rate:\t%3.0f\n", HR); Save_file(pulse_s); ECG_save_file(x1-100,x2-100,(T-dT)*(x2-x1)/plotx); Save_file("------------------------\n"); DeleteGraphPlot (panelHandle, PANEL_GRAPH_ECG, -1, VAL_DELAYED_DRAW); //Rensa grafer DeleteGraphPlot (panelHandle, PANEL_GRAPH_EXT, -1, VAL_DELAYED_DRAW); plotx = 0; // Nolla riträknare if (val == 2) //Databehandling för 1 kanal inläst med med hög frekvens, 4 nya värden ch_1[plotx] =uttmp[0]*32+uttmp[1]; //Sammanslagning av 5 höga och 5 låga bitar till ett decimaltal 0-1024. ch_1[plotx+1]=uttmp[2]*32+uttmp[3]; ch_1[plotx+2]=uttmp[4]*32+uttmp[5]; ch_1[plotx+3]=uttmp[6]*32+uttmp[7]; plotx+=4; else //Databehandling för 4 kanaler med 25% av frekvensen, 1 nytt värde per kanal ch_1[plotx]=uttmp[0]*32+uttmp[1]; ch_2[plotx]=uttmp[2]*32+uttmp[3]; ch_3[plotx]=uttmp[4]*32+uttmp[5]; ch_x[plotx]=uttmp[6]*32+uttmp[7]; plotx++; FlushInQ (cport); //Rensa inbufferten //END LWRS RECIEVE // starta insamling av EKG signaler /*********************************************************** ************** F U N C T I O N S W I T C H **************** ***********************************************************/ int CVICALLBACK CB_BinSw (int panel, int control, int event, void *callbackData, int eventData1, int eventData2) int relTime=0,val=0;
54
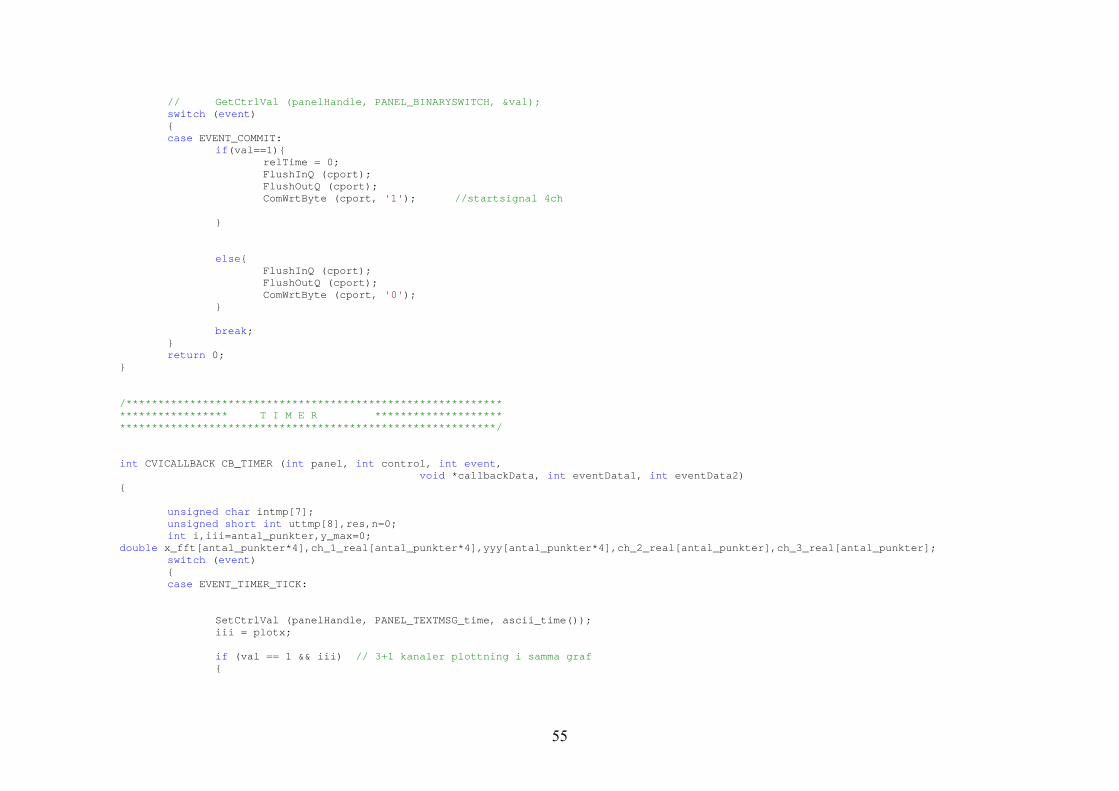
// GetCtrlVal (panelHandle, PANEL_BINARYSWITCH, &val); switch (event) case EVENT_COMMIT: if(val==1) relTime = 0; FlushInQ (cport); FlushOutQ (cport); ComWrtByte (cport, '1'); //startsignal 4ch else FlushInQ (cport); FlushOutQ (cport); ComWrtByte (cport, '0'); break; return 0; /*********************************************************** ***************** T I M E R ******************** ***********************************************************/ int CVICALLBACK CB_TIMER (int panel, int control, int event, void *callbackData, int eventData1, int eventData2) unsigned char intmp[7]; unsigned short int uttmp[8],res,n=0; int i,iii=antal_punkter,y_max=0; double x_fft[antal_punkter*4],ch_1_real[antal_punkter*4],yyy[antal_punkter*4],ch_2_real[antal_punkter],ch_3_real[antal_punkter]; switch (event) case EVENT_TIMER_TICK: SetCtrlVal (panelHandle, PANEL_TEXTMSG_time, ascii_time()); iii = plotx; if (val == 1 && iii) // 3+1 kanaler plottning i samma graf
55
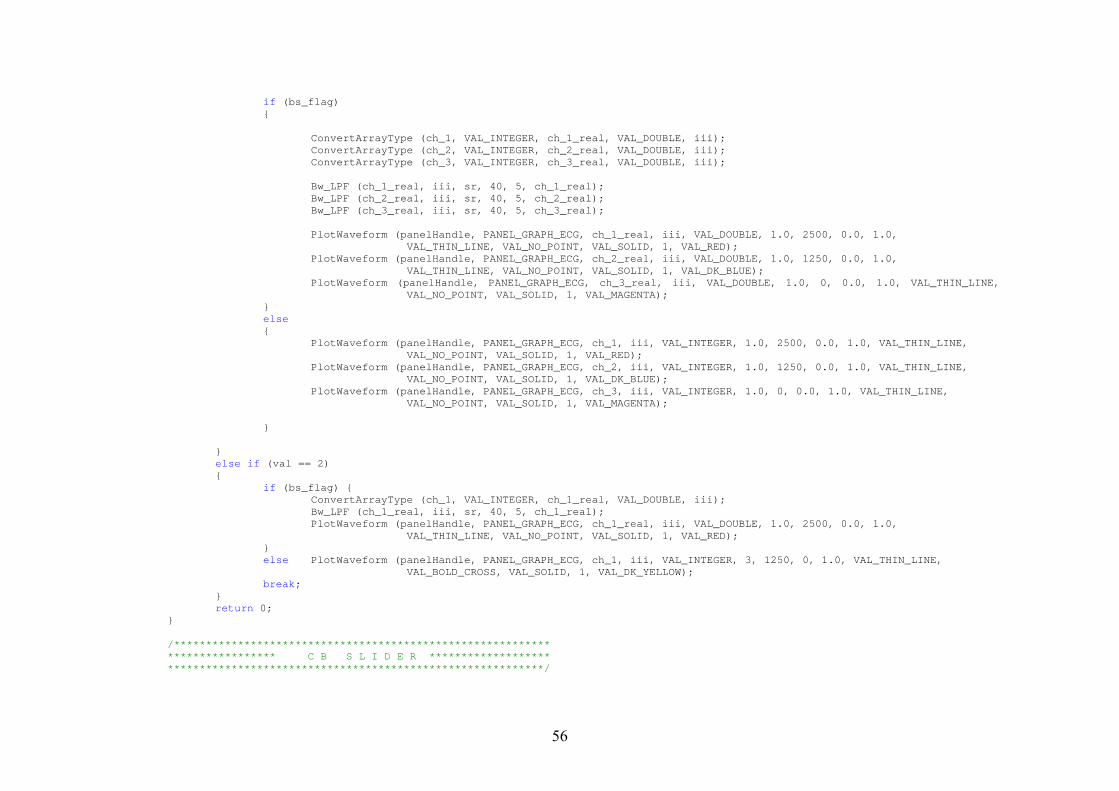
if (bs_flag) ConvertArrayType (ch_1, VAL_INTEGER, ch_1_real, VAL_DOUBLE, iii); ConvertArrayType (ch_2, VAL_INTEGER, ch_2_real, VAL_DOUBLE, iii); ConvertArrayType (ch_3, VAL_INTEGER, ch_3_real, VAL_DOUBLE, iii); Bw_LPF (ch_1_real, iii, sr, 40, 5, ch_1_real); Bw_LPF (ch_2_real, iii, sr, 40, 5, ch_2_real); Bw_LPF (ch_3_real, iii, sr, 40, 5, ch_3_real); PlotWaveform (panelHandle, PANEL_GRAPH_ECG, ch_1_real, iii, VAL_DOUBLE, 1.0, 2500, 0.0, 1.0, VAL_THIN_LINE, VAL_NO_POINT, VAL_SOLID, 1, VAL_RED); PlotWaveform (panelHandle, PANEL_GRAPH_ECG, ch_2_real, iii, VAL_DOUBLE, 1.0, 1250, 0.0, 1.0, VAL_THIN_LINE, VAL_NO_POINT, VAL_SOLID, 1, VAL_DK_BLUE); PlotWaveform (panelHandle, PANEL_GRAPH_ECG, ch_3_real, iii, VAL_DOUBLE, 1.0, 0, 0.0, 1.0, VAL_THIN_LINE, VAL_NO_POINT, VAL_SOLID, 1, VAL_MAGENTA); else PlotWaveform (panelHandle, PANEL_GRAPH_ECG, ch_1, iii, VAL_INTEGER, 1.0, 2500, 0.0, 1.0, VAL_THIN_LINE, VAL_NO_POINT, VAL_SOLID, 1, VAL_RED); PlotWaveform (panelHandle, PANEL_GRAPH_ECG, ch_2, iii, VAL_INTEGER, 1.0, 1250, 0.0, 1.0, VAL_THIN_LINE, VAL_NO_POINT, VAL_SOLID, 1, VAL_DK_BLUE); PlotWaveform (panelHandle, PANEL_GRAPH_ECG, ch_3, iii, VAL_INTEGER, 1.0, 0, 0.0, 1.0, VAL_THIN_LINE, VAL_NO_POINT, VAL_SOLID, 1, VAL_MAGENTA); else if (val == 2) if (bs_flag) ConvertArrayType (ch_1, VAL_INTEGER, ch_1_real, VAL_DOUBLE, iii); Bw_LPF (ch_1_real, iii, sr, 40, 5, ch_1_real); PlotWaveform (panelHandle, PANEL_GRAPH_ECG, ch_1_real, iii, VAL_DOUBLE, 1.0, 2500, 0.0, 1.0, VAL_THIN_LINE, VAL_NO_POINT, VAL_SOLID, 1, VAL_RED); else PlotWaveform (panelHandle, PANEL_GRAPH_ECG, ch_1, iii, VAL_INTEGER, 3, 1250, 0, 1.0, VAL_THIN_LINE, VAL_BOLD_CROSS, VAL_SOLID, 1, VAL_DK_YELLOW); break; return 0; /*********************************************************** ***************** C B S L I D E R ******************* ***********************************************************/
56

int CVICALLBACK cb_slider (int panel, int control, int event, void *callbackData, int eventData1, int eventData2) int relTime=0; GetCtrlVal (panelHandle, PANEL_RINGSLIDE, &val); switch (event) case EVENT_COMMIT: if(val==1) relTime = 0; FlushInQ (cport); FlushOutQ (cport); ComWrtByte (cport, '1'); //startsignal 4ch DeleteGraphPlot
DeleteGraphPlot
(panelHandle, PANEL_GRAPH_ECG, -1, VAL_DELAYED_DRAW); //Rensa grafer SetAxisScalingMode (panelHandle, PANEL_GRAPH_ECG, VAL_BOTTOM_XAXIS, VAL_MANUAL, 0.0, antal_punkter); plotx=1; else if(val==2) relTime = 0; FlushInQ (cport); FlushOutQ (cport); ComWrtByte (cport, '2'); //startsignal 1ch
(panelHandle, PANEL_GRAPH_ECG, -1, VAL_DELAYED_DRAW); //Rensa grafer SetAxisScalingMode (panelHandle, PANEL_GRAPH_ECG, VAL_BOTTOM_XAXIS, VAL_MANUAL, 0.0, antal_punkter*4); plotx=1; else FlushInQ (cport); FlushOutQ (cport); ComWrtByte (cport, '0'); //Stoppsignal break; return 0; /*********************************************************** *************** C B 5 0 H z S w i t c h *************** ***********************************************************/
57

int CVICALLBACK cb_50hz (int panel, int control, int event, void *callbackData, int eventData1, int eventData2) switch (event) case EVENT_COMMIT: bs_flag=!bs_flag; //Växling av filter SetCtrlAttribute (panelHandle, PANEL_TOGGLEBUTTON, ATTR_TEXT_STRIKEOUT, bs_flag); // break; return 0; /********************************************************** ***************** C B Save file ecg ******************* ***********************************************************/ int CVICALLBACK cb_save (int panel, int control, int event, void *callbackData, int eventData1, int eventData2) switch (event) case EVENT_COMMIT: GetCtrlVal (panelHandle, PANEL_BINARYSWITCH_file, &sfflag); SetCtrlAttribute (panelHandle, PANEL_STRING_filename, ATTR_DIMMED, sfflag) ; SetCtrlAttribute (panelHandle, PANEL_COMMANDBUTTON_GT, ATTR_DIMMED, sfflag); Time_save_file(); break; return 0; /*¤*¤*¤*¤*¤**¤*¤*¤*¤*¤*¤**¤*¤*¤*¤*¤*¤*¤*¤* F U N C T I O N D E C L A R A T I O N S *¤*¤*¤*¤*¤**¤*¤*¤*¤*¤*¤**¤*¤*¤*¤*¤*¤*¤*¤*/ /********************************************* ************* Save Time To File ************** *********************************************/ void Time_save_file(void) char file_name[64];
58

char * file_timestamp; GetCtrlVal (panelHandle, PANEL_STRING_filename, file_name); fileHandle = OpenFile (file_name, VAL_WRITE_ONLY, VAL_APPEND, VAL_ASCII); CloseFile(fileHandle); /********************************************* ************* Save To File ************** *********************************************/ void Save_file(char * data) char file_name[64]; GetCtrlVal (panelHandle, PANEL_STRING_filename, file_name); fileHandle = OpenFile (file_name, VAL_WRITE_ONLY, VAL_APPEND, VAL_ASCII); WriteFile (fileHandle, data , strlen(data)); CloseFile(fileHandle); /*********************************************************** ***************** Function Save file ecg **************** ***********************************************************/ void ECG_save_file(int startx, int stopx, double T) char file_name[64],p_line[128]; int fileindex,i; char * file_timestamp; GetCtrlVal (panelHandle, PANEL_STRING_filename, file_name); fileHandle = OpenFile (file_name, VAL_WRITE_ONLY, VAL_APPEND, VAL_ASCII); sprintf(p_line,"Timespan(s):\t%.3f\nPoints:\t%i\naVL\tI\t-aVR\n¯¯¯¯\t¯¯¯¯\t¯¯¯¯\n",T,stopx-startx); WriteFile (fileHandle, p_line, strlen(p_line)); for (i=startx;i<stopx;i++)// Print ECG arrays from startx to stopx to file sprintf(p_line,"%d\t%d\t%d\n",ch_1[i],ch_2[i],ch_3[i]); WriteFile (fileHandle, p_line, strlen(p_line));
59

CloseFile (fileHandle); /*********************************************************** ******* Function: Create localized timestring *********** ***********************************************************/ char * ascii_time(void) time_t t_time; struct tm * tt_time; char *timestamp; time(&t_time); tt_time=localtime(&t_time); timestamp=asctime(tt_time); return timestamp; /*********************************************************** *** Function: Create localized timestring as filename ***** ***********************************************************/ char * file_time(void) time_t t_time; struct tm * tt_time; char *timestamp; char ff_name[64]; time(&t_time); tt_time=localtime(&t_time); timestamp=asctime(tt_time); timestamp[strlen(timestamp)-1]=NULL; sprintf (f_name, "ECG_%s.log\n\0", timestamp); f_name[strlen(f_name)-16]='_'; f_name[strlen(f_name)-13]='_'; return f_name; /*********************************************************** *** Function: Read filename from time ***** ***********************************************************/ int CVICALLBACK CB_gettime (int panel, int control, int event, void *callbackData, int eventData1, int eventData2)
60

switch (event) case EVENT_COMMIT: SetCtrlVal (panelHandle, PANEL_STRING_filename, file_time()); break; return 0; /*********************************************************** *** Function: Change timespan of ECG graph, Zoom ***** ***********************************************************/ int CVICALLBACK cb_tscale (int panel, int control, int event, void *callbackData, int eventData1, int eventData2) switch (event) case EVENT_COMMIT: GetCtrlVal (panelHandle, PANEL_BINARYSWITCH_tscale, &ts); SetAxisScalingMode (panelHandle, PANEL_GRAPH_ECG, VAL_BOTTOM_XAXIS, VAL_MANUAL, 0.0, antal_punkter* (1 + 3*(val == 2))/ts); break; return 0; /*********************************************************** *** Function: Create localized timestring as filename ***** ***********************************************************/ int CVICALLBACK cb_T1 (int panel, int control, int event, void *callbackData, int eventData1, int eventData2) double tt=1; switch (event) case EVENT_COMMIT: GetCtrlVal (panelHandle, PANEL_RINGKNOB, &tt); SetCtrlAttribute (panelHandle, PANEL_TIMER, ATTR_INTERVAL, 1/tt); break; return 0;
61
/*********************************************************** *** Function: 1 second timer ***** ***********************************************************/ int CVICALLBACK cb_hpf (int panel, int control, int event, void *callbackData, int eventData1, int eventData2) switch (event) case EVENT_COMMIT: GetCtrlVal (panelHandle, PANEL_HPfilter, &hpf); break; return 0;
62