Embed Size (px)
Citation preview
Minilyzer ML1User Manual
TABLE OF CONTENTSTABLE OF CONTENTSTABLE OF CONTENTSTABLE OF CONTENTSTABLE OF CONTENTS
1. INTRODUCTION ............................................................... 1-011.1 CE Declaration of Conformity ........................................... 1-011.2 International Warranty and Repair .................................... 1-021.3 Warnings ......................................................................... 1-031.4 Overview .......................................................................... 1-041.5 Battery Replacement ......................................................... 1-05
2. BASIC OPERATION .......................................................... 2-012.1 Power ON/OFF - Backlight ................................................. 2-022.2 Escape ............................................................................. 2-022.3 Enter / Cursor Control ...................................................... 2-032.4 Display Mode ................................................................... 2-032.5 Menu Bar ......................................................................... 2-042.6 Inputs and Monitor Output ............................................... 2-082.7 Music Detection ............................................................... 2-08
3. MEASUREMENT FUNCTIONS .............................................. 3-013.1 Level RMS ........................................................................ 3-013.2 Level Relative .................................................................... 3-023.3 Level SPL .......................................................................... 3-033.4 THD+N ............................................................................. 3-083.5 vu+PPM ........................................................................... 3-093.6 Polarity ............................................................................. 3-113.7 Signal Balance Error .......................................................... 3-123.8 Sweep .............................................................................. 3-133.9 1/3rd Octave RMS .............................................................. 3-173.10 1/3rd Octave SPL ............................................................... 3-183.11 Scope ............................................................................... 3-20
4. TROUBLESHOOTING ......................................................... 4-014.1 System Break Down .......................................................... 4-014.2 Low Level Measurements .................................................. 4-01
5. ACCESSORIES ................................................................. 5-015.1 MiniSPL ............................................................................ 5-015.2 ML1 Adapter -20dB .......................................................... 5-015.3 Pouch .............................................................................. 5-025.4 Minstruments System Case ............................................... 5-025.5 Copy Cable ...................................................................... 5-02
6. TECHNICAL SPECIFICATION ................................................ 6-016.1 Technical Data General Functions ........................................ 6-016.2 Technical Data Acoustic Functions ....................................... 6-03
NTI CONTACTNTI CONTACTNTI CONTACTNTI CONTACTNTI CONTACT
Headquarter: NTI AGIm alten Riet 102FL- 9494 SchaanLiechtenstein, EuropeTel +423 - 239 6060Fax +423 - 239 6089E-mail [email protected] www.nt-instruments.com
Subsidiary: NTI (Montreal)3520 Griffith StreetSt. LaurentQuebec H4T 1A7CanadaTel +1 - 514 - 344 5220Toll free +1 - 800 - 661 6388Fax +1 - 514 - 344 5221E-mail [email protected]
© NTI AGAll rights reserved.Subject to change without notice.Release 2.0 / July 2001 / Software V2.00Printed in Liechtenstein.
Minilyzer, Minirator, MiniSPL and Minstruments are registered trademarksof NTI (Neutrik Test Instruments).

1.1.1.1.1. INTRODUCTIONINTRODUCTIONINTRODUCTIONINTRODUCTIONINTRODUCTION
Congratulations and thank you for buying NTI’s Minilyzer ML1, a productspecially suited for professional audio applications. The Minilyzer offersadvanced analysis functions, expected only in much larger and moreexpensive systems. We are convinced you will enjoy using it!
NTI products are manufactured in compliance with the highest qualitystandards and marked with the CE sign.
In order to avoid any damage to the unit, we strongly recommend toread the entire manual before you start using the instrument.
1.11.11.11.11.1 CE Declaration of ConformityCE Declaration of ConformityCE Declaration of ConformityCE Declaration of ConformityCE Declaration of Conformity
We, the manufacturerNTI AGIm alten Riet 102FL- 9494 SchaanLiechtenstein, Europe
hereby declare that the product Minilyzer ML1, released in 2000, conformsto the following standards or other normative documents.
EMC-Directives: 89/336, 92/31, 93/68Harmonized Standards: EN 61326-1
This declaration becomes void in case of any changes on the productwithout written authorization by NTI.
Date: 01.04.2000
Signature:
Position of Signatory: Technical Director
1.21.21.21.21.2 International Warranty and RepairInternational Warranty and RepairInternational Warranty and RepairInternational Warranty and RepairInternational Warranty and Repair
International WarrantyNTI guarantees the Minilyzer and its components against defects inmaterial or workmanship for a period of one year from the date oforiginal purchase, and agrees to repair or to replace at its discretion anydefective unit at no cost for either parts or labor during this period.
RestrictionsThis warranty does not cover damages caused through accidents, misuse,lack of care, the attachment or installation of any components that werenot provided with the product, loss of parts, connecting the instrumentto a power supply, input signal voltage or connector type other thanspecified, or wrongly polarized batteries. In particular, no responsibility isgranted for special, incidental or consequential damages.This warranty becomes void if servicing or repairs of the product areperformed by any party other than an authorized NTI service center or ifthe instrument has been opened in a manner other than specified in thismanual.No other warranty, written or verbal, is authorized by NTI. Except asotherwise stated in this warranty, NTI makes no representation or warrantyof any kind, expressed or implied in law or in fact, including, withoutlimitation, merchandising or fitting for any particular purpose and assumesno liability, either in tort, strict liability, contract or warranty for products.
Repair of your Minilyzer ML1In case of malfunction, take - or ship prepaid - your NTI Minilyzer packedin the original box, to the authorized NTI representative in your country.For contact-details please see the NTI web page: www.nt-instruments.com
Be sure to include a copy of your sales invoice as prove of purchase date.Transit damages are not covered by this warranty.
Introduction Introduction
1-01 1-02
1.31.31.31.31.3 WarningsWarningsWarningsWarningsWarnings
In order to avoid any problems during the operation of the instrument,follow the rules listed below:
• Read this manual thoroughly before you operate theinstrument for the first time.
• Use the instrument for the intended purpose only.
• Never connect the instrument to a high voltage output suchas a power amplifier, mains power plug, etc.
• Do not disassemble the instrument.
• Never use the instrument in a damp environment.
• Remove the batteries as soon as they are flat or if theinstrument is not intended to be used for a longer period oftime.
1.41.41.41.41.4 OverviewOverviewOverviewOverviewOverview
The Minilyzer ML1 is a sophisticated audio test instrument, supporting awide range of useful measurement functions. The results are displayedon a large LCD with backlight:
• Level RMS, Relative or SPL (Sound Pressure Level)• THD+N (Total Harmonic Distortion + Noise)• vu-Indicator and PPM (Peak Program Meter)• Frequency• Polarity Test (in combination with NTI’s Minirator MR1)• Signal Balance Error• Sweep recording with respect to frequency or time• 1/3rd Octave Spectrum RMS or SPL• Scope
Additionally, several input filters are available, depending on the activemeasurement function:
• A-weighting acc. IEC 60651• C-message acc. CCIR 468-4• 22 Hz Highpass acc. DIN 45045, -120 dB / dec.• 60 Hz Highpass acc. DIN 45045, -120 dB / dec.• 400 Hz Highpass acc. DIN 45045, -120 dB / dec.• Voice Bandpass acc. ITU-T P.48• C-weigting acc. IEC 60651• X-Curve-1 acc. ISO 2969
The X-Curve-1 filter is especially applicable for the recording, monitoringand play-back of wide range soundtracks in indoor theatres, reviewrooms or cinemas. To measure the acoustic response in such roomse.g. the Minirator MR1 shall be used with the pink noise signal selected.Via the Minilyzer the 1/3rd octave spectrum has to be recorded usingthe X-Curve-1 filter. According the ISO-norm the result shall be a flatgraph (a continuous noise spectrum having constant energy per 1/3rd
octave bandwidth).
A setup screen allows to adjust four settings according to the specificdemands of the user:
• Auto power off duration• Auto backlight off duration• LCD contrast• Multiple setup (individual settings for up to 4 users)
Introduction Introduction
1-041-03
2.2.2.2.2. BASIC OPERATIONBASIC OPERATIONBASIC OPERATIONBASIC OPERATIONBASIC OPERATION
Despite the wide range of available measurement functions and optio-nal setups, the operation of the Minilyzer is almost self-explanatory.
The LCD is divided in the menu bar on top (measurement function, filter,setup and running / low battery) and the results displayed below areshowing various information’s about the current status.
The cursor control keys and the escape button allow straightforwardnavigation through the available features to quickly get the requiredinformation’s like
• Actual setup (measurement function, filters)• Status of the unit / batteries• Measurement results (numerical values and bargraph).
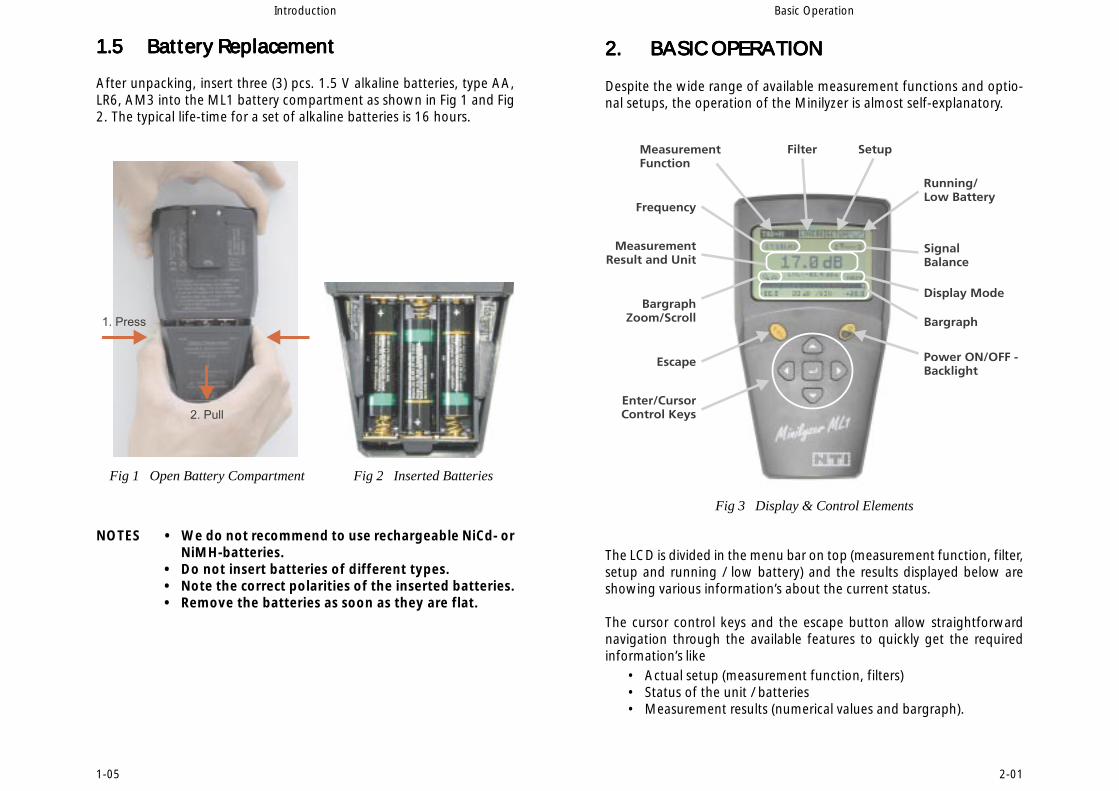
1.51.51.51.51.5 Battery ReplacementBattery ReplacementBattery ReplacementBattery ReplacementBattery Replacement
After unpacking, insert three (3) pcs. 1.5 V alkaline batteries, type AA,LR6, AM3 into the ML1 battery compartment as shown in Fig 1 and Fig2. The typical life-time for a set of alkaline batteries is 16 hours.
NOTES • We do not recommend to use rechargeable NiCd- orNiMH-batteries.
• Do not insert batteries of different types.• Note the correct polarities of the inserted batteries.• Remove the batteries as soon as they are flat.
Fig 3 Display & Control Elements
1-05 2-01
Basic OperationIntroduction
Fig 1 Open Battery Compartment Fig 2 Inserted Batteries
2.32.32.32.32.3 Enter / Cursor ControlEnter / Cursor ControlEnter / Cursor ControlEnter / Cursor ControlEnter / Cursor Control
The cursor is the core control element of ML1, providing access to itsmenus and to the current instrument settings. The cursor position isrepresented by an inverted display (white on black) of the field holdingthe cursor.
The cursor may be moved from menu to menu by using the four grayarrow keys !, ", # and $. The enter key (↵ ) has to be pressed to entera submenu or to confirm the current selection.
To modify the menu status execute the following procedure:• Move the cursor to the field of interest and press the enter key.• Scroll to the required menu option by using the arrow keys.• Confirm your selection by pressing the enter key.
Please note that in certain selection modes, the measurement result willbe updated with the new selection even before the enter key has beenpressed for confirmation.For instance, if a new level unit is selected - but not yet confirmed - thedisplay will instantly update to the newly selected unit even before theenter key has been pressed for confirmation.In case of an unwanted change of any menu, the old status may be re-established by pressing the ESC-key.
2.42.42.42.42.4 Display ModeDisplay ModeDisplay ModeDisplay ModeDisplay Mode
Giving a better readability the display mode determines the rapidity offollowing up input signal changes. The available modes are:
• SLOW 3 sec. averaging• NRM 1 sec. averaging• FAST no averaging
If averaging is active, measurements are smoothed in an exponentialway (exponential time constant) before being displayed.
2.12.12.12.12.1 Power ON/OFF - BacklightPower ON/OFF - BacklightPower ON/OFF - BacklightPower ON/OFF - BacklightPower ON/OFF - Backlight
The yellow, oval-shaped key on the right hand side has the followingfunctions:
• Device on, press and hold it for at least one second to turn theunit on.
• Backlight, press it shortly to activate the backlight.• Device off, press and hold it for at least two second to turn the
unit off.
The Minilyzer will start up in the same mode (e.g. measurement function)and with the same settings as it was switched off the last time. In casethe setup screen has been selected at switching off the unit, the previousmeasurement function will be entered.
The backlight may be activated at any time, without affecting the settingsof the unit.
Please note that the ML1 has independent auto power off functions formain power and the backlight. These may be adjusted separately (see2.5.c Setup).
2.22.22.22.22.2 EscapeEscapeEscapeEscapeEscape
The yellow key on the left-hand side labeled ESC, activates the escape(exit) function and may be selected at any time. Depending on theinstrument status, pressing the ESC-key performs the following functions:
• No menu is open, the cursor returns to its default position (topleft field).
• A selection menu is open, the menu gets closed, resetting theunit to the status in which it was opened.
• In the SETUP mode, the executed changes are saved and theprevious measurement mode is recalled.
In other terms, by pressing the ESC-key maximum twice, the unit is resetto the last active status and the cursor returns to its default position.
Basic Operation Basic Operation
2-02 2-03
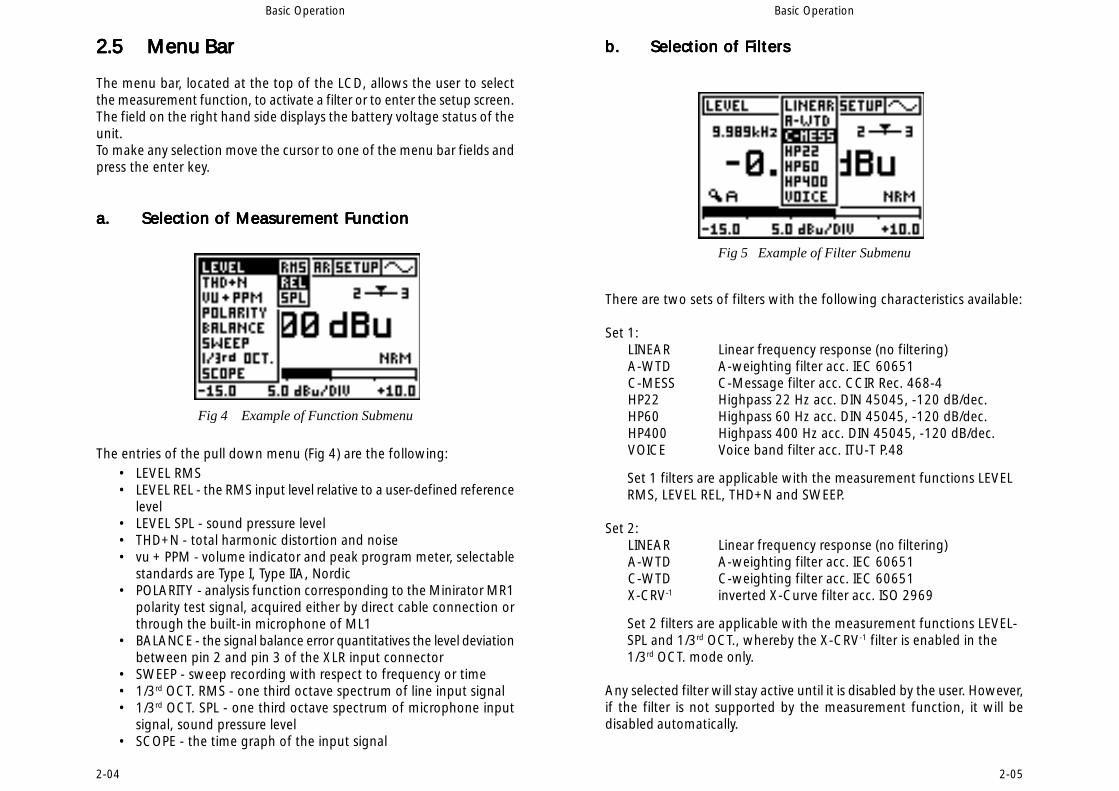
b.b.b.b.b. Selection of FiltersSelection of FiltersSelection of FiltersSelection of FiltersSelection of Filters
There are two sets of filters with the following characteristics available:
Set 1:LINEAR Linear frequency response (no filtering)A-WTD A-weighting filter acc. IEC 60651C-MESS C-Message filter acc. CCIR Rec. 468-4HP22 Highpass 22 Hz acc. DIN 45045, -120 dB/dec.HP60 Highpass 60 Hz acc. DIN 45045, -120 dB/dec.HP400 Highpass 400 Hz acc. DIN 45045, -120 dB/dec.VOICE Voice band filter acc. ITU-T P.48
Set 1 filters are applicable with the measurement functions LEVELRMS, LEVEL REL, THD+N and SWEEP.
Set 2:LINEAR Linear frequency response (no filtering)A-WTD A-weighting filter acc. IEC 60651C-WTD C-weighting filter acc. IEC 60651X-CRV-1 inverted X-Curve filter acc. ISO 2969
Set 2 filters are applicable with the measurement functions LEVEL-SPL and 1/3rd OCT., whereby the X-CRV-1 filter is enabled in the1/3rd OCT. mode only.
Any selected filter will stay active until it is disabled by the user. However,if the filter is not supported by the measurement function, it will bedisabled automatically.
2.52.52.52.52.5 Menu BarMenu BarMenu BarMenu BarMenu Bar
The menu bar, located at the top of the LCD, allows the user to selectthe measurement function, to activate a filter or to enter the setup screen.The field on the right hand side displays the battery voltage status of theunit.To make any selection move the cursor to one of the menu bar fields andpress the enter key.
a.a.a.a.a. Selection of Measurement FunctionSelection of Measurement FunctionSelection of Measurement FunctionSelection of Measurement FunctionSelection of Measurement Function
The entries of the pull down menu (Fig 4) are the following:• LEVEL RMS• LEVEL REL - the RMS input level relative to a user-defined reference
level• LEVEL SPL - sound pressure level• THD+N - total harmonic distortion and noise• vu + PPM - volume indicator and peak program meter, selectable
standards are Type I, Type IIA, Nordic• POLARITY - analysis function corresponding to the Minirator MR1
polarity test signal, acquired either by direct cable connection orthrough the built-in microphone of ML1
• BALANCE - the signal balance error quantitatives the level deviationbetween pin 2 and pin 3 of the XLR input connector
• SWEEP - sweep recording with respect to frequency or time• 1/3rd OCT. RMS - one third octave spectrum of line input signal• 1/3rd OCT. SPL - one third octave spectrum of microphone input
signal, sound pressure level• SCOPE - the time graph of the input signal
Basic Operation Basic Operation
2-052-04
Fig 4 Example of Function Submenu
Fig 5 Example of Filter Submenu
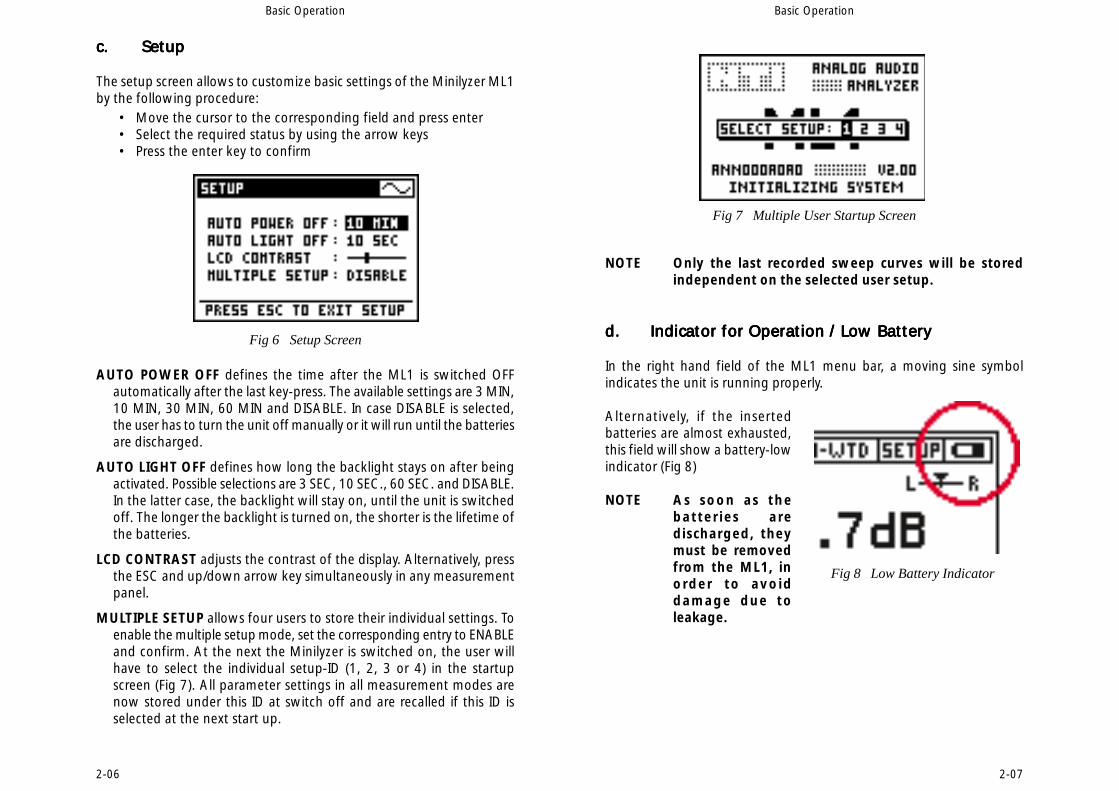
NOTE Only the last recorded sweep curves will be storedindependent on the selected user setup.
d.d.d.d.d. Indicator for Operation / Low BatteryIndicator for Operation / Low BatteryIndicator for Operation / Low BatteryIndicator for Operation / Low BatteryIndicator for Operation / Low Battery
In the right hand field of the ML1 menu bar, a moving sine symbolindicates the unit is running properly.
Alternatively, if the insertedbatteries are almost exhausted,this field will show a battery-lowindicator (Fig 8)
NOTE As soon as thebatteries aredischarged, theymust be removedfrom the ML1, inorder to avoiddamage due toleakage.
Fig 7 Multiple User Startup Screen
c.c.c.c.c. SetupSetupSetupSetupSetup
The setup screen allows to customize basic settings of the Minilyzer ML1by the following procedure:
• Move the cursor to the corresponding field and press enter• Select the required status by using the arrow keys• Press the enter key to confirm
AUTO POWER OFF defines the time after the ML1 is switched OFFautomatically after the last key-press. The available settings are 3 MIN,10 MIN, 30 MIN, 60 MIN and DISABLE. In case DISABLE is selected,the user has to turn the unit off manually or it will run until the batteriesare discharged.
AUTO LIGHT OFF defines how long the backlight stays on after beingactivated. Possible selections are 3 SEC, 10 SEC., 60 SEC. and DISABLE.In the latter case, the backlight will stay on, until the unit is switchedoff. The longer the backlight is turned on, the shorter is the lifetime ofthe batteries.
LCD CONTRAST adjusts the contrast of the display. Alternatively, pressthe ESC and up/down arrow key simultaneously in any measurementpanel.
MULTIPLE SETUP allows four users to store their individual settings. Toenable the multiple setup mode, set the corresponding entry to ENABLEand confirm. At the next the Minilyzer is switched on, the user willhave to select the individual setup-ID (1, 2, 3 or 4) in the startupscreen (Fig 7). All parameter settings in all measurement modes arenow stored under this ID at switch off and are recalled if this ID isselected at the next start up.
Fig 6 Setup Screen
Basic Operation
2-072-06
Basic Operation
Fig 8 Low Battery Indicator
3.3.3.3.3. MEASUREMENT FUNCTIONSMEASUREMENT FUNCTIONSMEASUREMENT FUNCTIONSMEASUREMENT FUNCTIONSMEASUREMENT FUNCTIONS
3.13.13.13.13.1 Level RMSLevel RMSLevel RMSLevel RMSLevel RMS
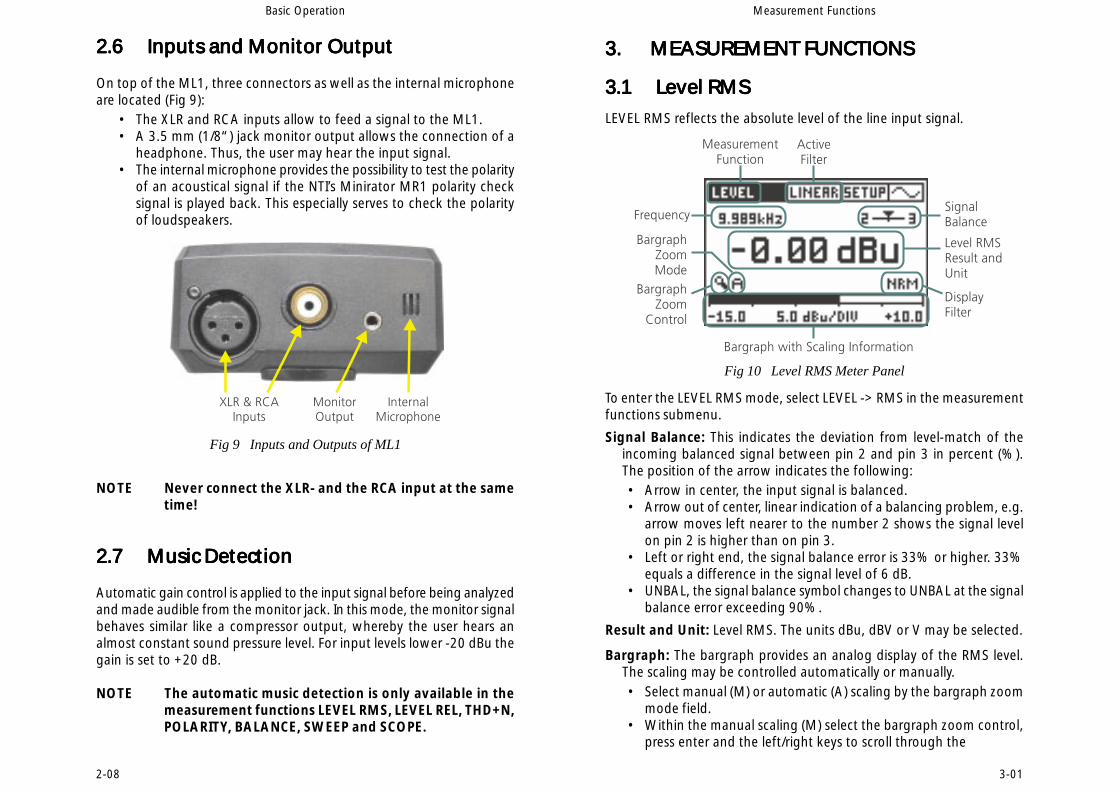
LEVEL RMS reflects the absolute level of the line input signal.
To enter the LEVEL RMS mode, select LEVEL -> RMS in the measurementfunctions submenu.
Signal Balance: This indicates the deviation from level-match of theincoming balanced signal between pin 2 and pin 3 in percent (%).The position of the arrow indicates the following:• Arrow in center, the input signal is balanced.• Arrow out of center, linear indication of a balancing problem, e.g.
arrow moves left nearer to the number 2 shows the signal levelon pin 2 is higher than on pin 3.
• Left or right end, the signal balance error is 33% or higher. 33%equals a difference in the signal level of 6 dB.
• UNBAL, the signal balance symbol changes to UNBAL at the signalbalance error exceeding 90%.
Result and Unit: Level RMS. The units dBu, dBV or V may be selected.
Bargraph: The bargraph provides an analog display of the RMS level.The scaling may be controlled automatically or manually.• Select manual (M) or automatic (A) scaling by the bargraph zoom
mode field.• Within the manual scaling (M) select the bargraph zoom control,
press enter and the left/right keys to scroll through the
Fig 10 Level RMS Meter Panel
Measurement Functions
3-01
2.62.62.62.62.6 Inputs and Monitor OutputInputs and Monitor OutputInputs and Monitor OutputInputs and Monitor OutputInputs and Monitor Output
On top of the ML1, three connectors as well as the internal microphoneare located (Fig 9):
• The XLR and RCA inputs allow to feed a signal to the ML1.• A 3.5 mm (1/8“) jack monitor output allows the connection of a
headphone. Thus, the user may hear the input signal.• The internal microphone provides the possibility to test the polarity
of an acoustical signal if the NTI’s Minirator MR1 polarity checksignal is played back. This especially serves to check the polarityof loudspeakers.
NOTE Never connect the XLR- and the RCA input at the sametime!
2.72.72.72.72.7 Music DetectionMusic DetectionMusic DetectionMusic DetectionMusic Detection
Automatic gain control is applied to the input signal before being analyzedand made audible from the monitor jack. In this mode, the monitor signalbehaves similar like a compressor output, whereby the user hears analmost constant sound pressure level. For input levels lower -20 dBu thegain is set to +20 dB.
NOTE The automatic music detection is only available in themeasurement functions LEVEL RMS, LEVEL REL, THD+N,POLARITY, BALANCE, SWEEP and SCOPE.
Fig 9 Inputs and Outputs of ML1
Basic Operation
2-08
actual range or the up/down keys to increase or decrease therange (sensitivity) of the bargraph scale.
• Press enter to confirm your setting.
Display Filter: see 2.4. Display Mode
NOTES • For balanced input levels higher than +20 dBu, theML1 Adapter -20dB may be applied. (for details see5. Accessories).
• The LEVEL RMS function is also available in the SWEEPmode (see 3.8) and in 1/3rd OCT. RMS mode (see 3.9).
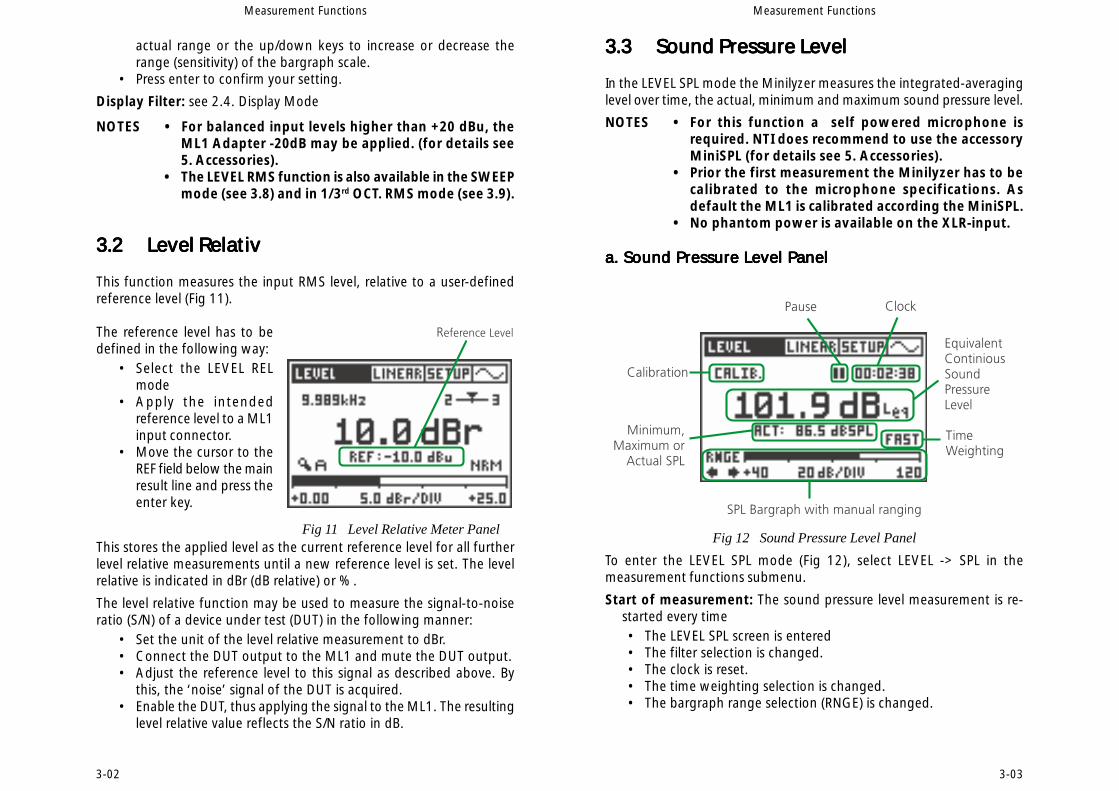
3.23.23.23.23.2 Level RelativLevel RelativLevel RelativLevel RelativLevel Relativ
This function measures the input RMS level, relative to a user-definedreference level (Fig 11).
The reference level has to bedefined in the following way:
• Select the LEVEL RELmode
• Apply the intendedreference level to a ML1input connector.
• Move the cursor to theREF field below the mainresult line and press theenter key.
This stores the applied level as the current reference level for all furtherlevel relative measurements until a new reference level is set. The levelrelative is indicated in dBr (dB relative) or %.
The level relative function may be used to measure the signal-to-noiseratio (S/N) of a device under test (DUT) in the following manner:
• Set the unit of the level relative measurement to dBr.• Connect the DUT output to the ML1 and mute the DUT output.• Adjust the reference level to this signal as described above. By
this, the ‘noise’ signal of the DUT is acquired.• Enable the DUT, thus applying the signal to the ML1. The resulting
level relative value reflects the S/N ratio in dB.
Measurement Functions
3-02
3.33.33.33.33.3 Sound Pressure LevelSound Pressure LevelSound Pressure LevelSound Pressure LevelSound Pressure Level
In the LEVEL SPL mode the Minilyzer measures the integrated-averaginglevel over time, the actual, minimum and maximum sound pressure level.
NOTES • For this function a self powered microphone isrequired. NTI does recommend to use the accessoryMiniSPL (for details see 5. Accessories).
• Prior the first measurement the Minilyzer has to becalibrated to the microphone specifications. Asdefault the ML1 is calibrated according the MiniSPL.
• No phantom power is available on the XLR-input.
a. Sound Pressure Level Panela. Sound Pressure Level Panela. Sound Pressure Level Panela. Sound Pressure Level Panela. Sound Pressure Level Panel
To enter the LEVEL SPL mode (Fig 12), select LEVEL -> SPL in themeasurement functions submenu.
Start of measurement: The sound pressure level measurement is re-started every time• The LEVEL SPL screen is entered• The filter selection is changed.• The clock is reset.• The time weighting selection is changed.• The bargraph range selection (RNGE) is changed.
Measurement Functions
3-03
Fig 12 Sound Pressure Level PanelFig 11 Level Relative Meter Panel

Sound Pressure Level: The equivalent continuous sound pressure level(also time-averaged sound level) is indicated in dBLeq, dBLAeq , dBLCeq,depending on the selected filter in the filter menu.
Example:• select in the main menu the filter A-WTD• the measurement unit is changing to dBL
Aeq and the minimum,
maximum and actual sound pressure level readings below are A-weighted.
Below the time-averaged SPL reading one of the following valuesmay be displayed (select with the cursor keys):• ACT: actual sound pressure level (SPL)• MIN: minimum sound pressure level acquired during the measuring
time indicated by the clock. The minimum value is stored until anew lower reading has been taken.
• MAX: maximum sound pressure level acquired during themeasuring time indicated by the clock. The maximum value isstored until a new higher reading has been taken.
Pause: The Leq
and min./max. measurement may be freezed for a userdefined time.• Select the pause symbol and press the enter key.• The pause symbol is flashing.• The actual SPL reading is continuously displayed and not freezed.• Select the pause symbol and press the enter key to continue the
measurement, visible by the continuing counting clock.
Clock: Duration in hours:minutes:seconds of the actual measurement;select the clock and press the enter key to reset the time and restartthe measurement.
Time weighting: All sound pressure level measurements include timeweighting. A change in sound pressure level is read out on the displaywith a shorter or longer response time.Available response times, corresponding to IEC 60651, are• SLOW (long attack- and release time)• FAST (short attack- and release time)• IMP (=impulse, very short attack and long release time)
Bargraph: The bargraph provides an analog display of the actual soundpressure level.Available bargraph ranges are:• 20 - 100 dBSPL
• 40 - 120 dBSPL
• 60 - 140 dBSPL
The selected bargraph range complies to the measurement range ofthe instrument. To achieve accuracy of the measurement within thespecified tolerances the proper range must be selected, called primaryindicator range. The two range indicator arrows assist to set theMinilyzer to the optimal range. As soon as the indicated bargraphvalue is found lower than the primary indicator range, the down arrowsymbol below RNGE will start to move, symbolizing the actual bargraphreading is inaccurate. The lower bargraph range needs to be changedmanually by selecting the moving left arrow symbol and pressing theenter key.
By exceeding the primary indicator range four overload arrowsreplacing the dBLeq reading and no reading below is shown (see Fig.13). Select the right arrow below RNGE and press enter to change tothe next higher bargraph range. In case signal clipping has occurredthe term OVL is flashing above the RNGE field as long as this peak, issignificant influencing the integrating sound pressure level reading.For example an SPL peak for 0.1 sec. will have effects to the Leq readingfor several seconds but it’s contribution can be neglected after tenminutes.
Measurement Functions Measurement Functions
3-04 3-05
Fig 13 SPL Panel with Overload
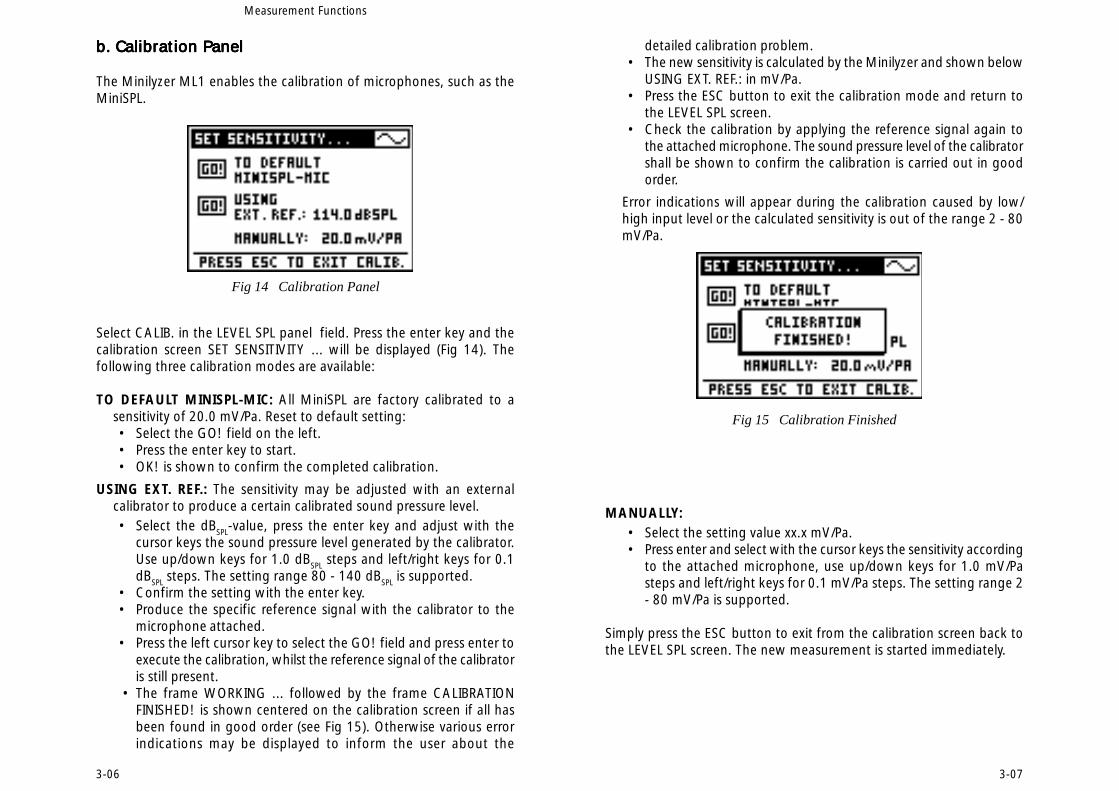
b. Calibration Panelb. Calibration Panelb. Calibration Panelb. Calibration Panelb. Calibration Panel
The Minilyzer ML1 enables the calibration of microphones, such as theMiniSPL.
Select CALIB. in the LEVEL SPL panel field. Press the enter key and thecalibration screen SET SENSITIVITY ... will be displayed (Fig 14). Thefollowing three calibration modes are available:
TO DEFAULT MINISPL-MIC: All MiniSPL are factory calibrated to asensitivity of 20.0 mV/Pa. Reset to default setting:• Select the GO! field on the left.• Press the enter key to start.• OK! is shown to confirm the completed calibration.
USING EXT. REF.: The sensitivity may be adjusted with an externalcalibrator to produce a certain calibrated sound pressure level.• Select the dBSPL-value, press the enter key and adjust with the
cursor keys the sound pressure level generated by the calibrator.Use up/down keys for 1.0 dBSPL steps and left/right keys for 0.1dBSPL steps. The setting range 80 - 140 dBSPL is supported.
• Confirm the setting with the enter key.• Produce the specific reference signal with the calibrator to the
microphone attached.• Press the left cursor key to select the GO! field and press enter to
execute the calibration, whilst the reference signal of the calibratoris still present.
• The frame WORKING ... followed by the frame CALIBRATIONFINISHED! is shown centered on the calibration screen if all hasbeen found in good order (see Fig 15). Otherwise various errorindications may be displayed to inform the user about the
Measurement Functions
3-06
Fig 14 Calibration Panel
detailed calibration problem.• The new sensitivity is calculated by the Minilyzer and shown below
USING EXT. REF.: in mV/Pa.• Press the ESC button to exit the calibration mode and return to
the LEVEL SPL screen.• Check the calibration by applying the reference signal again to
the attached microphone. The sound pressure level of the calibratorshall be shown to confirm the calibration is carried out in goodorder.
Error indications will appear during the calibration caused by low/high input level or the calculated sensitivity is out of the range 2 - 80mV/Pa.
MANUALLY:• Select the setting value xx.x mV/Pa.• Press enter and select with the cursor keys the sensitivity according
to the attached microphone, use up/down keys for 1.0 mV/Pasteps and left/right keys for 0.1 mV/Pa steps. The setting range 2- 80 mV/Pa is supported.
Simply press the ESC button to exit from the calibration screen back tothe LEVEL SPL screen. The new measurement is started immediately.
3-07
Fig 15 Calibration Finished
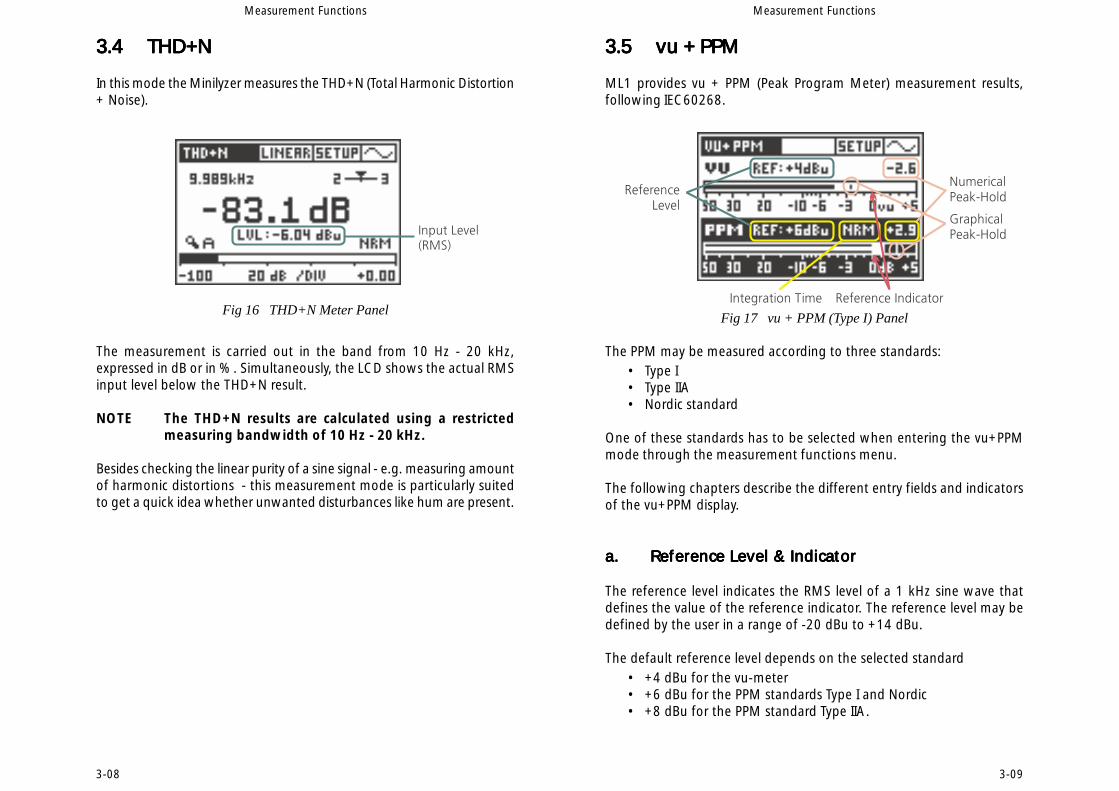
3.53.53.53.53.5 vu + PPMvu + PPMvu + PPMvu + PPMvu + PPM
ML1 provides vu + PPM (Peak Program Meter) measurement results,following IEC60268.
Fig 17 vu + PPM (Type I) Panel
The PPM may be measured according to three standards:• Type I• Type IIA• Nordic standard
One of these standards has to be selected when entering the vu+PPMmode through the measurement functions menu.
The following chapters describe the different entry fields and indicatorsof the vu+PPM display.
a.a.a.a.a. Reference Level & IndicatorReference Level & IndicatorReference Level & IndicatorReference Level & IndicatorReference Level & Indicator
The reference level indicates the RMS level of a 1 kHz sine wave thatdefines the value of the reference indicator. The reference level may bedefined by the user in a range of -20 dBu to +14 dBu.
The default reference level depends on the selected standard• +4 dBu for the vu-meter• +6 dBu for the PPM standards Type I and Nordic• +8 dBu for the PPM standard Type IIA.
Measurement Functions
3-09
3.43.43.43.43.4 THD+NTHD+NTHD+NTHD+NTHD+N
In this mode the Minilyzer measures the THD+N (Total Harmonic Distortion+ Noise).
The measurement is carried out in the band from 10 Hz - 20 kHz,expressed in dB or in %. Simultaneously, the LCD shows the actual RMSinput level below the THD+N result.
NOTE The THD+N results are calculated using a restrictedmeasuring bandwidth of 10 Hz - 20 kHz.
Besides checking the linear purity of a sine signal - e.g. measuring amountof harmonic distortions - this measurement mode is particularly suitedto get a quick idea whether unwanted disturbances like hum are present.
Measurement Functions
Fig 16 THD+N Meter Panel
3-08
Measurement Functions
3-11
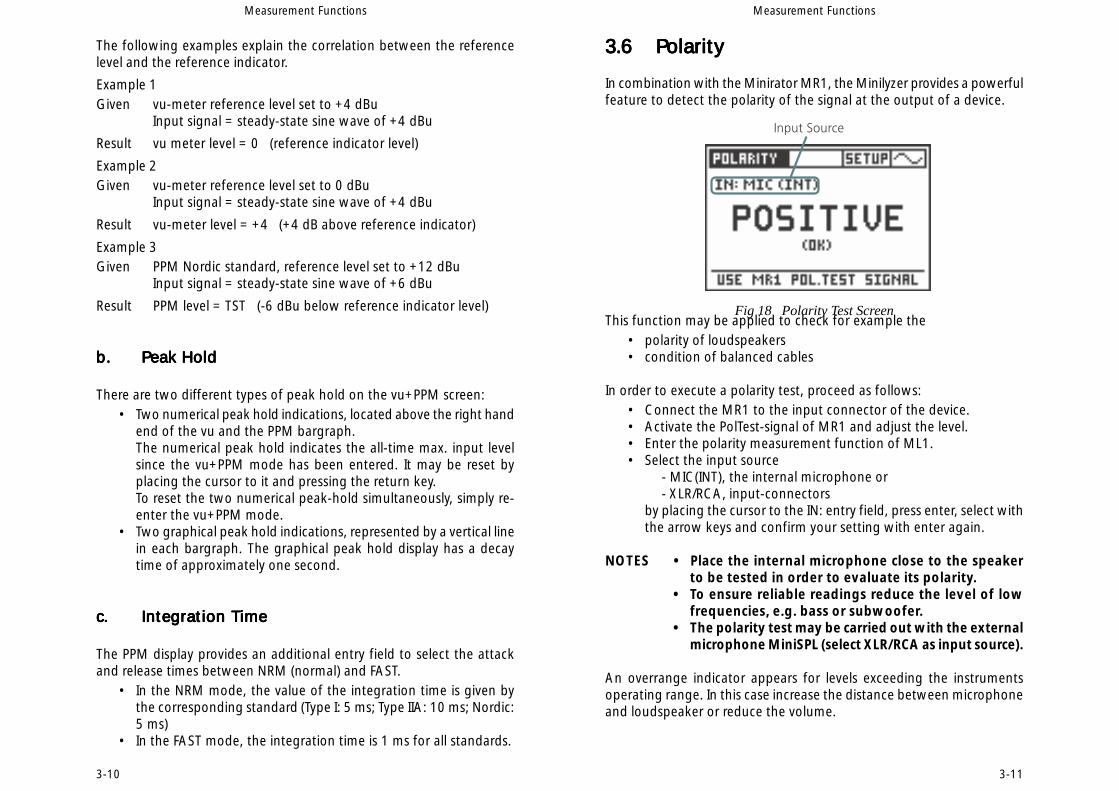
3.63.63.63.63.6 PolarityPolarityPolarityPolarityPolarity
In combination with the Minirator MR1, the Minilyzer provides a powerfulfeature to detect the polarity of the signal at the output of a device.
This function may be applied to check for example the• polarity of loudspeakers• condition of balanced cables
In order to execute a polarity test, proceed as follows:• Connect the MR1 to the input connector of the device.• Activate the PolTest-signal of MR1 and adjust the level.• Enter the polarity measurement function of ML1.• Select the input source
- MIC(INT), the internal microphone or- XLR/RCA, input-connectors
by placing the cursor to the IN: entry field, press enter, select withthe arrow keys and confirm your setting with enter again.
NOTES • Place the internal microphone close to the speakerto be tested in order to evaluate its polarity.
• To ensure reliable readings reduce the level of lowfrequencies, e.g. bass or subwoofer.
• The polarity test may be carried out with the externalmicrophone MiniSPL (select XLR/RCA as input source).
An overrange indicator appears for levels exceeding the instrumentsoperating range. In this case increase the distance between microphoneand loudspeaker or reduce the volume.
Fig 18 Polarity Test Screen
The following examples explain the correlation between the referencelevel and the reference indicator.
Example 1Given vu-meter reference level set to +4 dBu
Input signal = steady-state sine wave of +4 dBu
Result vu meter level = 0 (reference indicator level)
Example 2Given vu-meter reference level set to 0 dBu
Input signal = steady-state sine wave of +4 dBu
Result vu-meter level = +4 (+4 dB above reference indicator)
Example 3Given PPM Nordic standard, reference level set to +12 dBu
Input signal = steady-state sine wave of +6 dBu
Result PPM level = TST (-6 dBu below reference indicator level)
b.b.b.b.b. Peak HoldPeak HoldPeak HoldPeak HoldPeak Hold
There are two different types of peak hold on the vu+PPM screen:• Two numerical peak hold indications, located above the right hand
end of the vu and the PPM bargraph.The numerical peak hold indicates the all-time max. input levelsince the vu+PPM mode has been entered. It may be reset byplacing the cursor to it and pressing the return key.To reset the two numerical peak-hold simultaneously, simply re-enter the vu+PPM mode.
• Two graphical peak hold indications, represented by a vertical linein each bargraph. The graphical peak hold display has a decaytime of approximately one second.
c.c.c.c.c. Integration TimeIntegration TimeIntegration TimeIntegration TimeIntegration Time
The PPM display provides an additional entry field to select the attackand release times between NRM (normal) and FAST.
• In the NRM mode, the value of the integration time is given bythe corresponding standard (Type I: 5 ms; Type IIA: 10 ms; Nordic:5 ms)
• In the FAST mode, the integration time is 1 ms for all standards.
Measurement Functions
3-10
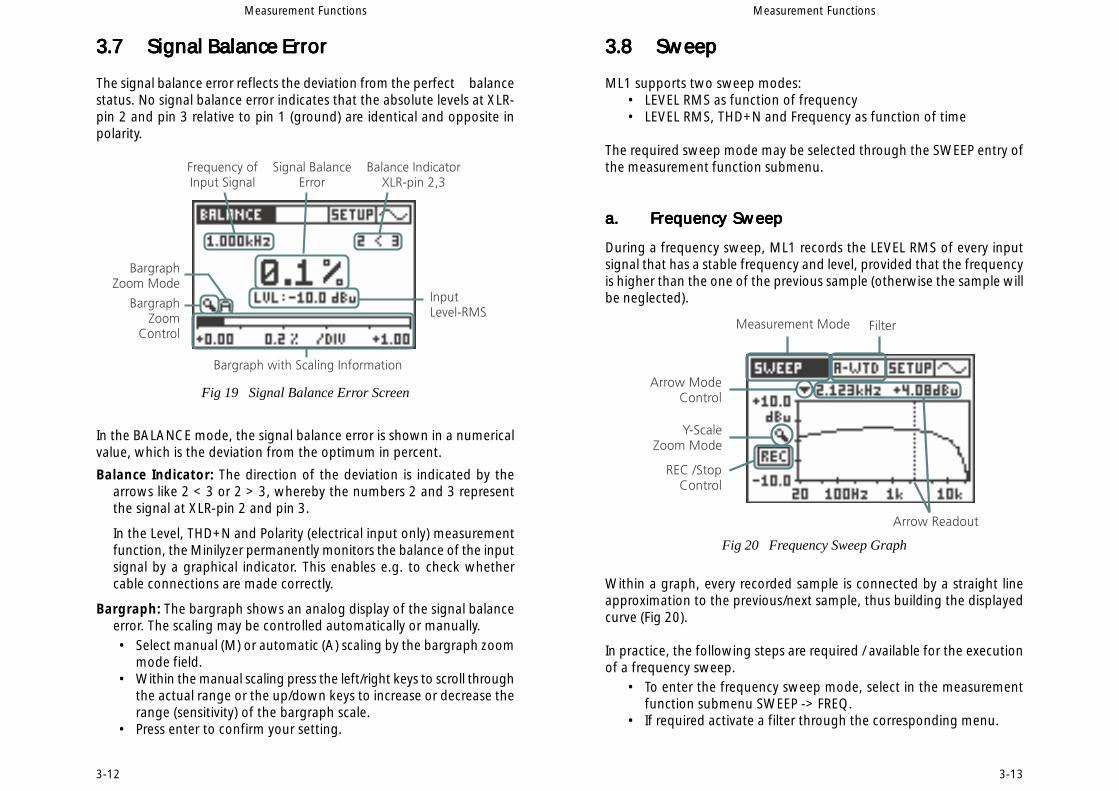
3.83.83.83.83.8 SweepSweepSweepSweepSweep
ML1 supports two sweep modes:• LEVEL RMS as function of frequency• LEVEL RMS, THD+N and Frequency as function of time
The required sweep mode may be selected through the SWEEP entry ofthe measurement function submenu.
a.a.a.a.a. Frequency SweepFrequency SweepFrequency SweepFrequency SweepFrequency Sweep
During a frequency sweep, ML1 records the LEVEL RMS of every inputsignal that has a stable frequency and level, provided that the frequencyis higher than the one of the previous sample (otherwise the sample willbe neglected).
Within a graph, every recorded sample is connected by a straight lineapproximation to the previous/next sample, thus building the displayedcurve (Fig 20).
In practice, the following steps are required / available for the executionof a frequency sweep.
• To enter the frequency sweep mode, select in the measurementfunction submenu SWEEP -> FREQ.
• If required activate a filter through the corresponding menu.
Measurement Functions
3-13
Fig 20 Frequency Sweep Graph
Measurement Functions
3-12
3.73.73.73.73.7 Signal Balance ErrorSignal Balance ErrorSignal Balance ErrorSignal Balance ErrorSignal Balance Error
The signal balance error reflects the deviation from the perfect balancestatus. No signal balance error indicates that the absolute levels at XLR-pin 2 and pin 3 relative to pin 1 (ground) are identical and opposite inpolarity.
In the BALANCE mode, the signal balance error is shown in a numericalvalue, which is the deviation from the optimum in percent.
Balance Indicator: The direction of the deviation is indicated by thearrows like 2 < 3 or 2 > 3, whereby the numbers 2 and 3 representthe signal at XLR-pin 2 and pin 3.
In the Level, THD+N and Polarity (electrical input only) measurementfunction, the Minilyzer permanently monitors the balance of the inputsignal by a graphical indicator. This enables e.g. to check whethercable connections are made correctly.
Bargraph: The bargraph shows an analog display of the signal balanceerror. The scaling may be controlled automatically or manually.• Select manual (M) or automatic (A) scaling by the bargraph zoom
mode field.• Within the manual scaling press the left/right keys to scroll through
the actual range or the up/down keys to increase or decrease therange (sensitivity) of the bargraph scale.
• Press enter to confirm your setting.
Fig 19 Signal Balance Error Screen
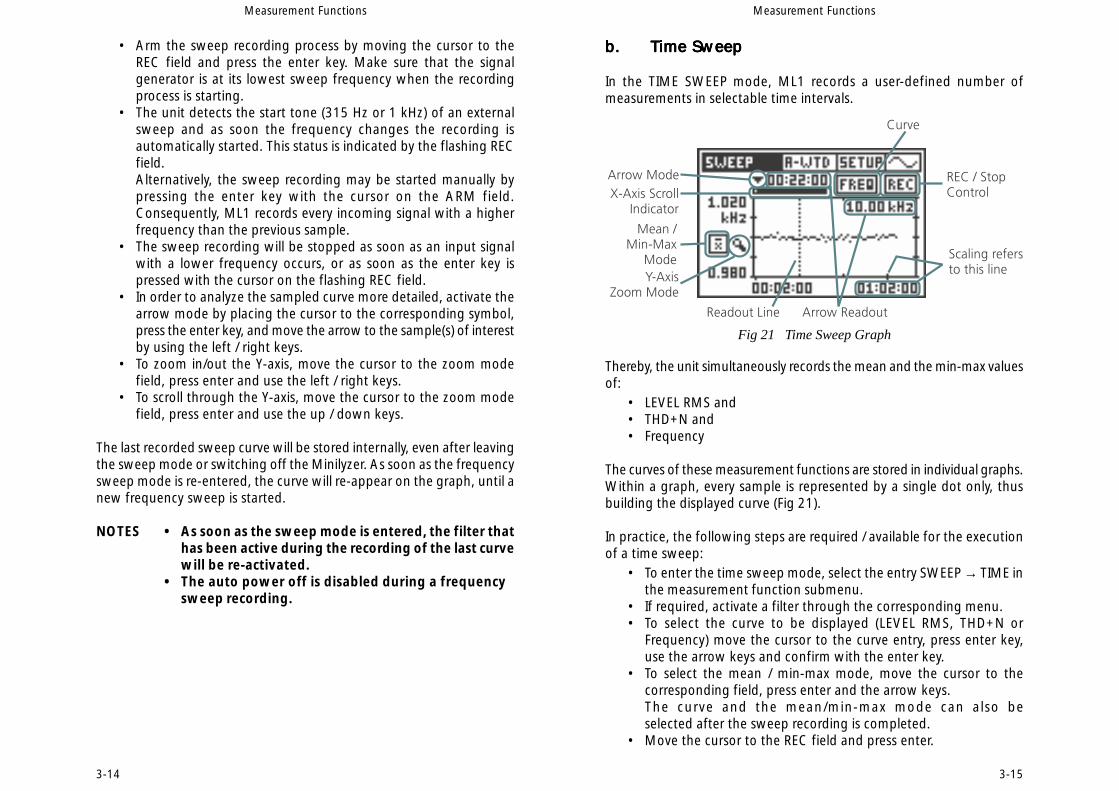
b.b.b.b.b. Time SweepTime SweepTime SweepTime SweepTime Sweep
In the TIME SWEEP mode, ML1 records a user-defined number ofmeasurements in selectable time intervals.
Thereby, the unit simultaneously records the mean and the min-max valuesof:
• LEVEL RMS and• THD+N and• Frequency
The curves of these measurement functions are stored in individual graphs.Within a graph, every sample is represented by a single dot only, thusbuilding the displayed curve (Fig 21).
In practice, the following steps are required / available for the executionof a time sweep:
• To enter the time sweep mode, select the entry SWEEP → TIME inthe measurement function submenu.
• If required, activate a filter through the corresponding menu.• To select the curve to be displayed (LEVEL RMS, THD+N or
Frequency) move the cursor to the curve entry, press enter key,use the arrow keys and confirm with the enter key.
• To select the mean / min-max mode, move the cursor to thecorresponding field, press enter and the arrow keys.The curve and the mean/min-max mode can also beselected after the sweep recording is completed.
• Move the cursor to the REC field and press enter.
Measurement Functions
3-15
Fig 21 Time Sweep Graph
• Arm the sweep recording process by moving the cursor to theREC field and press the enter key. Make sure that the signalgenerator is at its lowest sweep frequency when the recordingprocess is starting.
• The unit detects the start tone (315 Hz or 1 kHz) of an externalsweep and as soon the frequency changes the recording isautomatically started. This status is indicated by the flashing RECfield.Alternatively, the sweep recording may be started manually bypressing the enter key with the cursor on the ARM field.Consequently, ML1 records every incoming signal with a higherfrequency than the previous sample.
• The sweep recording will be stopped as soon as an input signalwith a lower frequency occurs, or as soon as the enter key ispressed with the cursor on the flashing REC field.
• In order to analyze the sampled curve more detailed, activate thearrow mode by placing the cursor to the corresponding symbol,press the enter key, and move the arrow to the sample(s) of interestby using the left / right keys.
• To zoom in/out the Y-axis, move the cursor to the zoom modefield, press enter and use the left / right keys.
• To scroll through the Y-axis, move the cursor to the zoom modefield, press enter and use the up / down keys.
The last recorded sweep curve will be stored internally, even after leavingthe sweep mode or switching off the Minilyzer. As soon as the frequencysweep mode is re-entered, the curve will re-appear on the graph, until anew frequency sweep is started.
NOTES • As soon as the sweep mode is entered, the filter thathas been active during the recording of the last curvewill be re-activated.
• The auto power off is disabled during a frequencysweep recording.
Measurement Functions
3-14
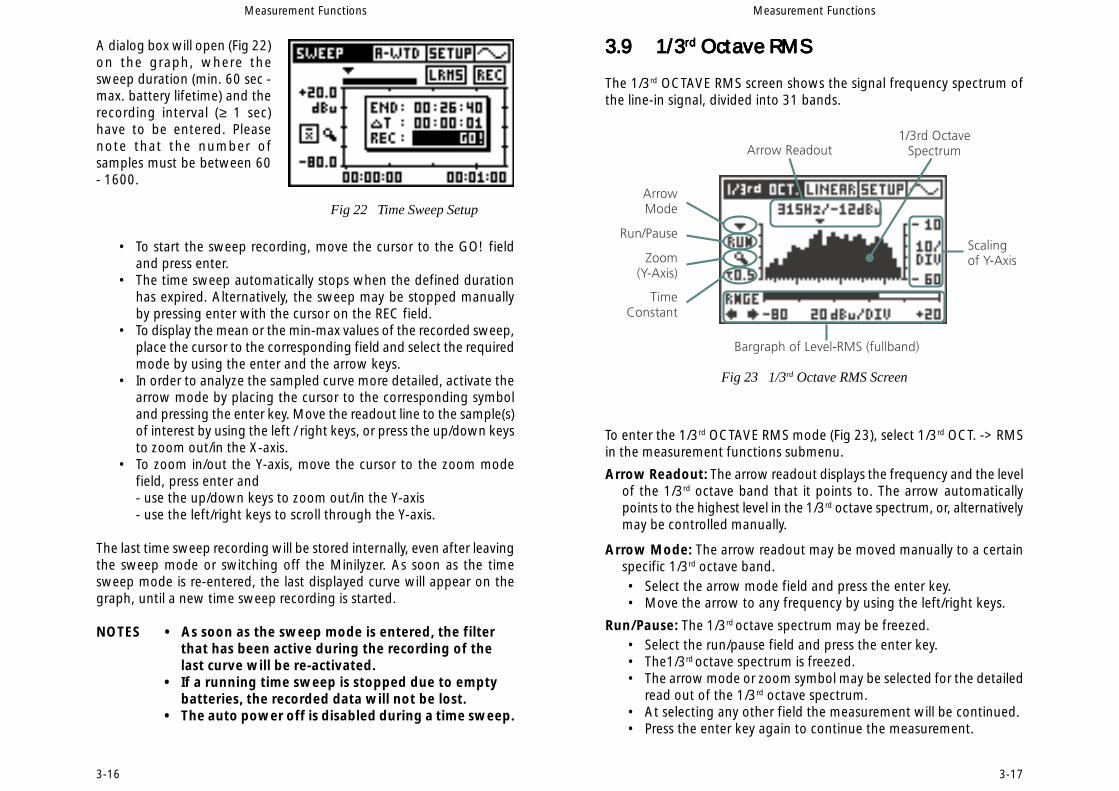
3.93.93.93.93.9 1/31/31/31/31/3rdrdrdrdrd Octave RMS Octave RMS Octave RMS Octave RMS Octave RMS
The 1/3rd OCTAVE RMS screen shows the signal frequency spectrum ofthe line-in signal, divided into 31 bands.
To enter the 1/3rd OCTAVE RMS mode (Fig 23), select 1/3rd OCT. -> RMSin the measurement functions submenu.
Arrow Readout: The arrow readout displays the frequency and the levelof the 1/3rd octave band that it points to. The arrow automaticallypoints to the highest level in the 1/3rd octave spectrum, or, alternativelymay be controlled manually.
Arrow Mode: The arrow readout may be moved manually to a certainspecific 1/3rd octave band.• Select the arrow mode field and press the enter key.• Move the arrow to any frequency by using the left/right keys.
Run/Pause: The 1/3rd octave spectrum may be freezed.• Select the run/pause field and press the enter key.• The1/3rd octave spectrum is freezed.• The arrow mode or zoom symbol may be selected for the detailed
read out of the 1/3rd octave spectrum.• At selecting any other field the measurement will be continued.• Press the enter key again to continue the measurement.
3-17
Measurement Functions
Fig 23 1/3rd Octave RMS Screen
A dialog box will open (Fig 22)on the graph, where thesweep duration (min. 60 sec -max. battery lifetime) and therecording interval (≥ 1 sec)have to be entered. Pleasenote that the number ofsamples must be between 60- 1600.
• To start the sweep recording, move the cursor to the GO! fieldand press enter.
• The time sweep automatically stops when the defined durationhas expired. Alternatively, the sweep may be stopped manuallyby pressing enter with the cursor on the REC field.
• To display the mean or the min-max values of the recorded sweep,place the cursor to the corresponding field and select the requiredmode by using the enter and the arrow keys.
• In order to analyze the sampled curve more detailed, activate thearrow mode by placing the cursor to the corresponding symboland pressing the enter key. Move the readout line to the sample(s)of interest by using the left / right keys, or press the up/down keysto zoom out/in the X-axis.
• To zoom in/out the Y-axis, move the cursor to the zoom modefield, press enter and- use the up/down keys to zoom out/in the Y-axis- use the left/right keys to scroll through the Y-axis.
The last time sweep recording will be stored internally, even after leavingthe sweep mode or switching off the Minilyzer. As soon as the timesweep mode is re-entered, the last displayed curve will appear on thegraph, until a new time sweep recording is started.
NOTES • As soon as the sweep mode is entered, the filterthat has been active during the recording of thelast curve will be re-activated.
• If a running time sweep is stopped due to emptybatteries, the recorded data will not be lost.
• The auto power off is disabled during a time sweep.
Fig 22 Time Sweep Setup
Measurement Functions
3-16
3-19
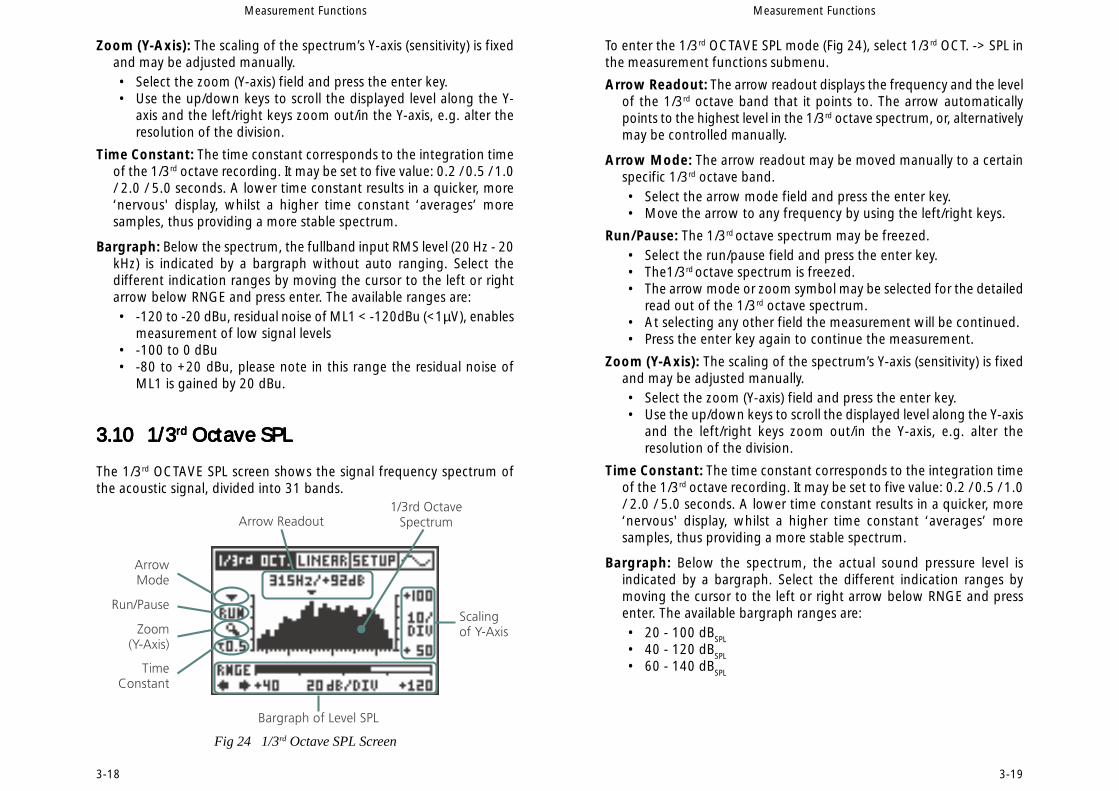
To enter the 1/3rd OCTAVE SPL mode (Fig 24), select 1/3rd OCT. -> SPL inthe measurement functions submenu.
Arrow Readout: The arrow readout displays the frequency and the levelof the 1/3rd octave band that it points to. The arrow automaticallypoints to the highest level in the 1/3rd octave spectrum, or, alternativelymay be controlled manually.
Arrow Mode: The arrow readout may be moved manually to a certainspecific 1/3rd octave band.• Select the arrow mode field and press the enter key.• Move the arrow to any frequency by using the left/right keys.
Run/Pause: The 1/3rd octave spectrum may be freezed.• Select the run/pause field and press the enter key.• The1/3rd octave spectrum is freezed.• The arrow mode or zoom symbol may be selected for the detailed
read out of the 1/3rd octave spectrum.• At selecting any other field the measurement will be continued.• Press the enter key again to continue the measurement.
Zoom (Y-Axis): The scaling of the spectrum’s Y-axis (sensitivity) is fixedand may be adjusted manually.• Select the zoom (Y-axis) field and press the enter key.• Use the up/down keys to scroll the displayed level along the Y-axis
and the left/right keys zoom out/in the Y-axis, e.g. alter theresolution of the division.
Time Constant: The time constant corresponds to the integration timeof the 1/3rd octave recording. It may be set to five value: 0.2 / 0.5 / 1.0/ 2.0 / 5.0 seconds. A lower time constant results in a quicker, more‘nervous' display, whilst a higher time constant ‘averages’ moresamples, thus providing a more stable spectrum.
Bargraph: Below the spectrum, the actual sound pressure level isindicated by a bargraph. Select the different indication ranges bymoving the cursor to the left or right arrow below RNGE and pressenter. The available bargraph ranges are:• 20 - 100 dB
SPL
• 40 - 120 dBSPL
• 60 - 140 dBSPL
Measurement Functions
3-18
Measurement Functions
Zoom (Y-Axis): The scaling of the spectrum’s Y-axis (sensitivity) is fixedand may be adjusted manually.• Select the zoom (Y-axis) field and press the enter key.• Use the up/down keys to scroll the displayed level along the Y-
axis and the left/right keys zoom out/in the Y-axis, e.g. alter theresolution of the division.
Time Constant: The time constant corresponds to the integration timeof the 1/3rd octave recording. It may be set to five value: 0.2 / 0.5 / 1.0/ 2.0 / 5.0 seconds. A lower time constant results in a quicker, more‘nervous' display, whilst a higher time constant ‘averages’ moresamples, thus providing a more stable spectrum.
Bargraph: Below the spectrum, the fullband input RMS level (20 Hz - 20kHz) is indicated by a bargraph without auto ranging. Select thedifferent indication ranges by moving the cursor to the left or rightarrow below RNGE and press enter. The available ranges are:• -120 to -20 dBu, residual noise of ML1 < -120dBu (<1µV), enables
measurement of low signal levels• -100 to 0 dBu• -80 to +20 dBu, please note in this range the residual noise of
ML1 is gained by 20 dBu.
3.103.103.103.103.10 1/31/31/31/31/3rdrdrdrdrd Octave SPL Octave SPL Octave SPL Octave SPL Octave SPL
The 1/3rd OCTAVE SPL screen shows the signal frequency spectrum ofthe acoustic signal, divided into 31 bands.
Fig 24 1/3rd Octave SPL Screen
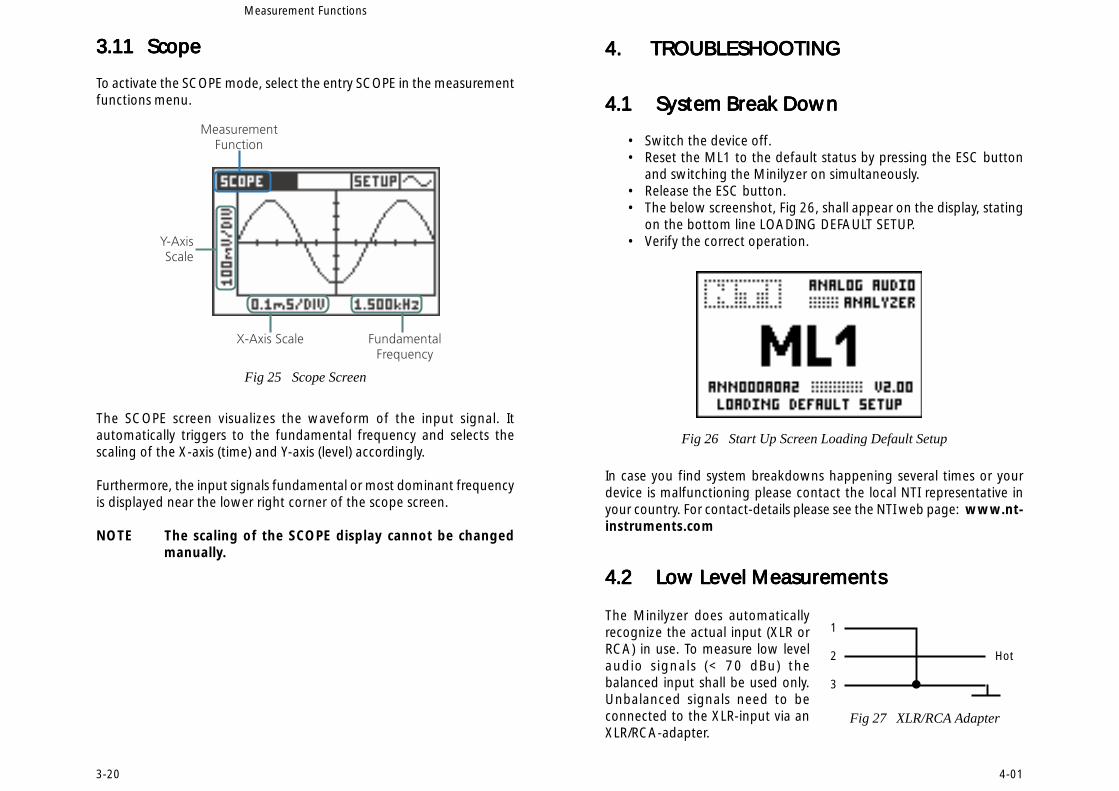
3.113.113.113.113.11 ScopeScopeScopeScopeScope
To activate the SCOPE mode, select the entry SCOPE in the measurementfunctions menu.
The SCOPE screen visualizes the waveform of the input signal. Itautomatically triggers to the fundamental frequency and selects thescaling of the X-axis (time) and Y-axis (level) accordingly.
Furthermore, the input signals fundamental or most dominant frequencyis displayed near the lower right corner of the scope screen.
NOTE The scaling of the SCOPE display cannot be changedmanually.
Fig 25 Scope Screen
Measurement Functions
3-20
4.4.4.4.4. TROUBLESHOOTINGTROUBLESHOOTINGTROUBLESHOOTINGTROUBLESHOOTINGTROUBLESHOOTING
4.14.14.14.14.1 System Break DownSystem Break DownSystem Break DownSystem Break DownSystem Break Down
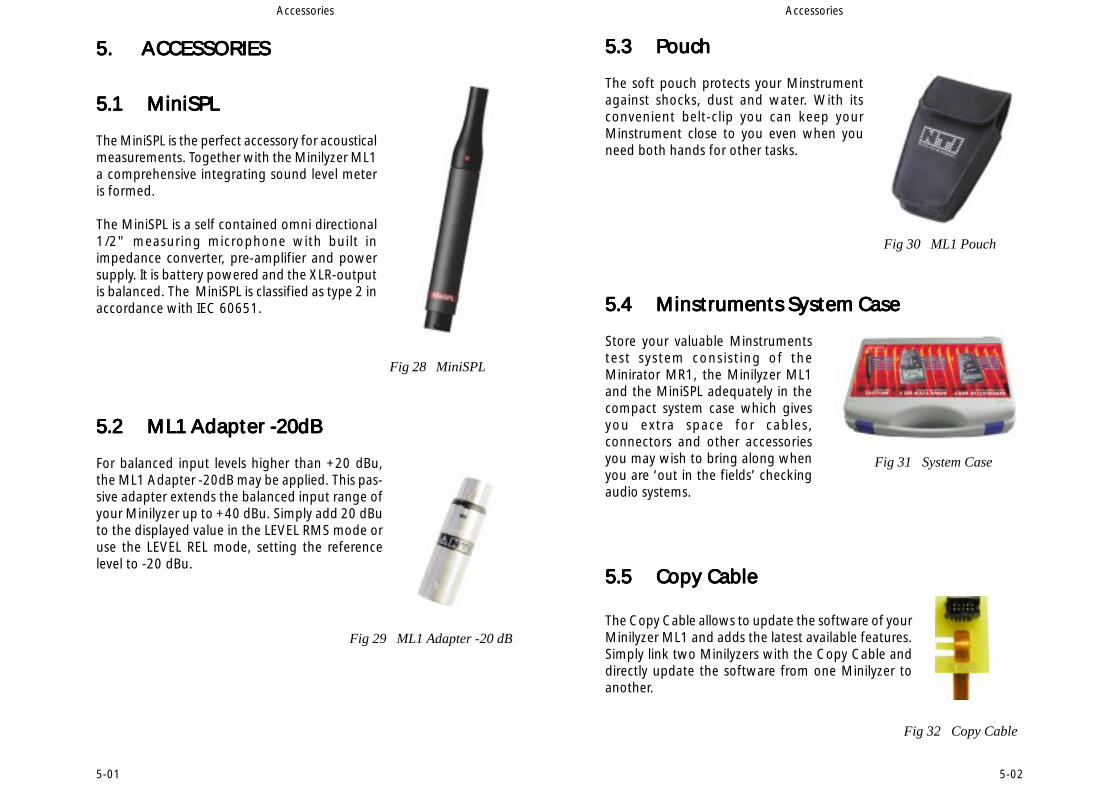
• Switch the device off.• Reset the ML1 to the default status by pressing the ESC button
and switching the Minilyzer on simultaneously.• Release the ESC button.• The below screenshot, Fig 26, shall appear on the display, stating
on the bottom line LOADING DEFAULT SETUP.• Verify the correct operation.
In case you find system breakdowns happening several times or yourdevice is malfunctioning please contact the local NTI representative inyour country. For contact-details please see the NTI web page: www.nt-instruments.com
4.24.24.24.24.2 Low Level MeasurementsLow Level MeasurementsLow Level MeasurementsLow Level MeasurementsLow Level Measurements
4-01
Fig 26 Start Up Screen Loading Default Setup
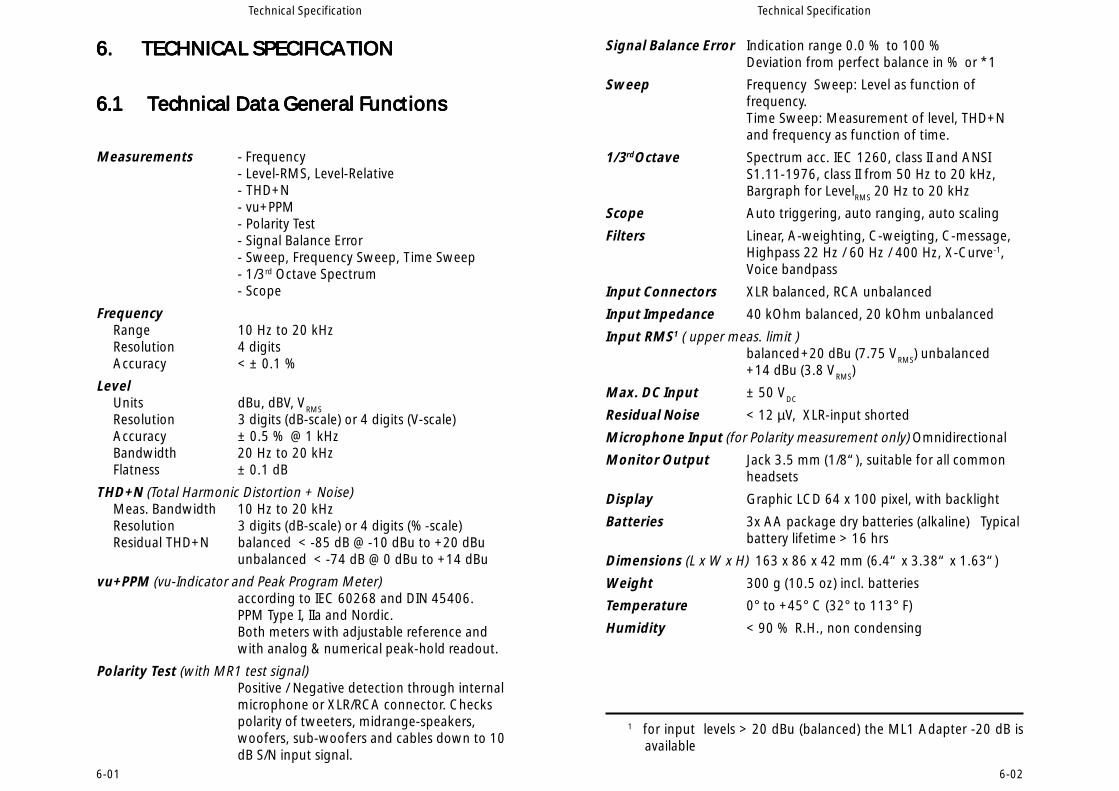
The Minilyzer does automaticallyrecognize the actual input (XLR orRCA) in use. To measure low levelaudio signals (< 70 dBu) thebalanced input shall be used only.Unbalanced signals need to beconnected to the XLR-input via anXLR/RCA-adapter.
Fig 27 XLR/RCA Adapter
1
2
3
Hot
5.5.5.5.5. ACCESSORIESACCESSORIESACCESSORIESACCESSORIESACCESSORIES
5.15.15.15.15.1 MiniSPLMiniSPLMiniSPLMiniSPLMiniSPL
The MiniSPL is the perfect accessory for acousticalmeasurements. Together with the Minilyzer ML1a comprehensive integrating sound level meteris formed.
The MiniSPL is a self contained omni directional1/2" measuring microphone with built inimpedance converter, pre-amplifier and powersupply. It is battery powered and the XLR-outputis balanced. The MiniSPL is classified as type 2 inaccordance with IEC 60651.
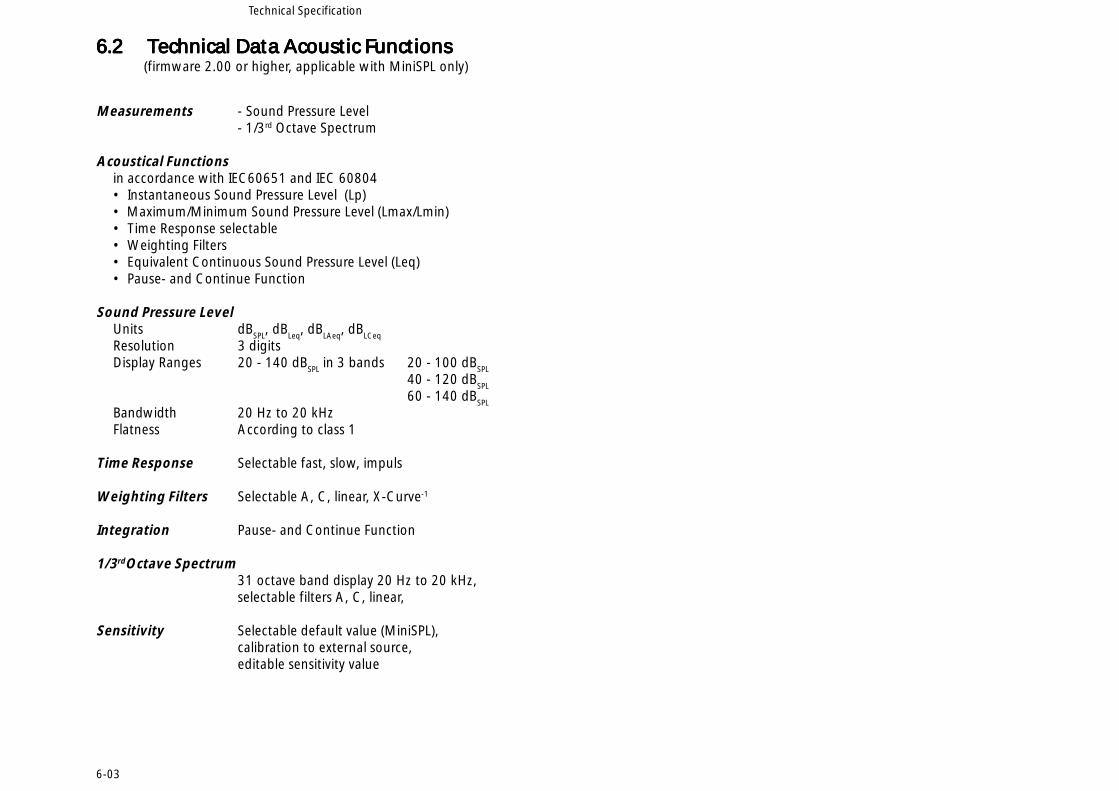
5.25.25.25.25.2 ML1 Adapter -20dBML1 Adapter -20dBML1 Adapter -20dBML1 Adapter -20dBML1 Adapter -20dB
For balanced input levels higher than +20 dBu,the ML1 Adapter -20dB may be applied. This pas-sive adapter extends the balanced input range ofyour Minilyzer up to +40 dBu. Simply add 20 dButo the displayed value in the LEVEL RMS mode oruse the LEVEL REL mode, setting the referencelevel to -20 dBu.
5-01
Fig 29 ML1 Adapter -20 dB
Accessories
Fig 28 MiniSPL
5.35.35.35.35.3 PouchPouchPouchPouchPouch
The soft pouch protects your Minstrumentagainst shocks, dust and water. With itsconvenient belt-clip you can keep yourMinstrument close to you even when youneed both hands for other tasks.
5.45.45.45.45.4 Minstruments System CaseMinstruments System CaseMinstruments System CaseMinstruments System CaseMinstruments System Case
Store your valuable Minstrumentstest system consisting of theMinirator MR1, the Minilyzer ML1and the MiniSPL adequately in thecompact system case which givesyou extra space for cables,connectors and other accessoriesyou may wish to bring along whenyou are ‘out in the fields’ checkingaudio systems.
5.55.55.55.55.5 Copy CableCopy CableCopy CableCopy CableCopy Cable
The Copy Cable allows to update the software of yourMinilyzer ML1 and adds the latest available features.Simply link two Minilyzers with the Copy Cable anddirectly update the software from one Minilyzer toanother.
Accessories
5-02
Fig 30 ML1 Pouch
Fig 32 Copy Cable
Fig 31 System Case
Signal Balance Error Indication range 0.0 % to 100 %Deviation from perfect balance in % or *1
Sweep Frequency Sweep: Level as function offrequency.Time Sweep: Measurement of level, THD+Nand frequency as function of time.
1/3rdOctave Spectrum acc. IEC 1260, class II and ANSIS1.11-1976, class II from 50 Hz to 20 kHz,Bargraph for LevelRMS 20 Hz to 20 kHz
Scope Auto triggering, auto ranging, auto scaling
Filters Linear, A-weighting, C-weigting, C-message,Highpass 22 Hz / 60 Hz / 400 Hz, X-Curve-1,Voice bandpass
Input Connectors XLR balanced, RCA unbalanced
Input Impedance 40 kOhm balanced, 20 kOhm unbalanced
Input RMS1 ( upper meas. limit )balanced+20 dBu (7.75 VRMS) unbalanced+14 dBu (3.8 VRMS)
Max. DC Input ± 50 VDC
Residual Noise < 12 µV, XLR-input shorted
Microphone Input (for Polarity measurement only) Omnidirectional
Monitor Output Jack 3.5 mm (1/8“), suitable for all commonheadsets
Display Graphic LCD 64 x 100 pixel, with backlight
Batteries 3x AA package dry batteries (alkaline) Typicalbattery lifetime > 16 hrs
Dimensions (L x W x H) 163 x 86 x 42 mm (6.4“ x 3.38“ x 1.63“)
Weight 300 g (10.5 oz) incl. batteries
Temperature 0° to +45° C (32° to 113° F)
Humidity < 90 % R.H., non condensing
Technical Specification
6-02
1 for input levels > 20 dBu (balanced) the ML1 Adapter -20 dB isavailable
6.6.6.6.6. TECHNICAL SPECIFICATIONTECHNICAL SPECIFICATIONTECHNICAL SPECIFICATIONTECHNICAL SPECIFICATIONTECHNICAL SPECIFICATION
6.16.16.16.16.1 Technical Data General FunctionsTechnical Data General FunctionsTechnical Data General FunctionsTechnical Data General FunctionsTechnical Data General Functions
Measurements - Frequency- Level-RMS, Level-Relative- THD+N- vu+PPM- Polarity Test- Signal Balance Error- Sweep, Frequency Sweep, Time Sweep- 1/3rd Octave Spectrum- Scope
FrequencyRange 10 Hz to 20 kHzResolution 4 digitsAccuracy < ± 0.1 %
LevelUnits dBu, dBV, V
RMS
Resolution 3 digits (dB-scale) or 4 digits (V-scale)Accuracy ± 0.5 % @ 1 kHzBandwidth 20 Hz to 20 kHzFlatness ± 0.1 dB
THD+N (Total Harmonic Distortion + Noise)Meas. Bandwidth 10 Hz to 20 kHzResolution 3 digits (dB-scale) or 4 digits (%-scale)Residual THD+N balanced < -85 dB @ -10 dBu to +20 dBu
unbalanced < -74 dB @ 0 dBu to +14 dBu
vu+PPM (vu-Indicator and Peak Program Meter)according to IEC 60268 and DIN 45406.PPM Type I, IIa and Nordic.Both meters with adjustable reference andwith analog & numerical peak-hold readout.
Polarity Test (with MR1 test signal)Positive / Negative detection through internalmicrophone or XLR/RCA connector. Checkspolarity of tweeters, midrange-speakers,woofers, sub-woofers and cables down to 10dB S/N input signal.
Technical Specification
6-01
6.26.26.26.26.2 Technical Data Acoustic FunctionsTechnical Data Acoustic FunctionsTechnical Data Acoustic FunctionsTechnical Data Acoustic FunctionsTechnical Data Acoustic Functions (firmware 2.00 or higher, applicable with MiniSPL only)
Measurements - Sound Pressure Level- 1/3rd Octave Spectrum
Acoustical Functionsin accordance with IEC60651 and IEC 60804• Instantaneous Sound Pressure Level (Lp)• Maximum/Minimum Sound Pressure Level (Lmax/Lmin)• Time Response selectable• Weighting Filters• Equivalent Continuous Sound Pressure Level (Leq)• Pause- and Continue Function
Sound Pressure LevelUnits dB
SPL, dB
Leq, dB
LAeq, dB
LCeq
Resolution 3 digitsDisplay Ranges 20 - 140 dB
SPL in 3 bands 20 - 100 dB
SPL
40 - 120 dBSPL
60 - 140 dBSPL
Bandwidth 20 Hz to 20 kHzFlatness According to class 1
Time Response Selectable fast, slow, impuls
Weighting Filters Selectable A, C, linear, X-Curve-1
Integration Pause- and Continue Function
1/3rdOctave Spectrum31 octave band display 20 Hz to 20 kHz,selectable filters A, C, linear,
Sensitivity Selectable default value (MiniSPL),calibration to external source,editable sensitivity value
6-03
Technical Specification
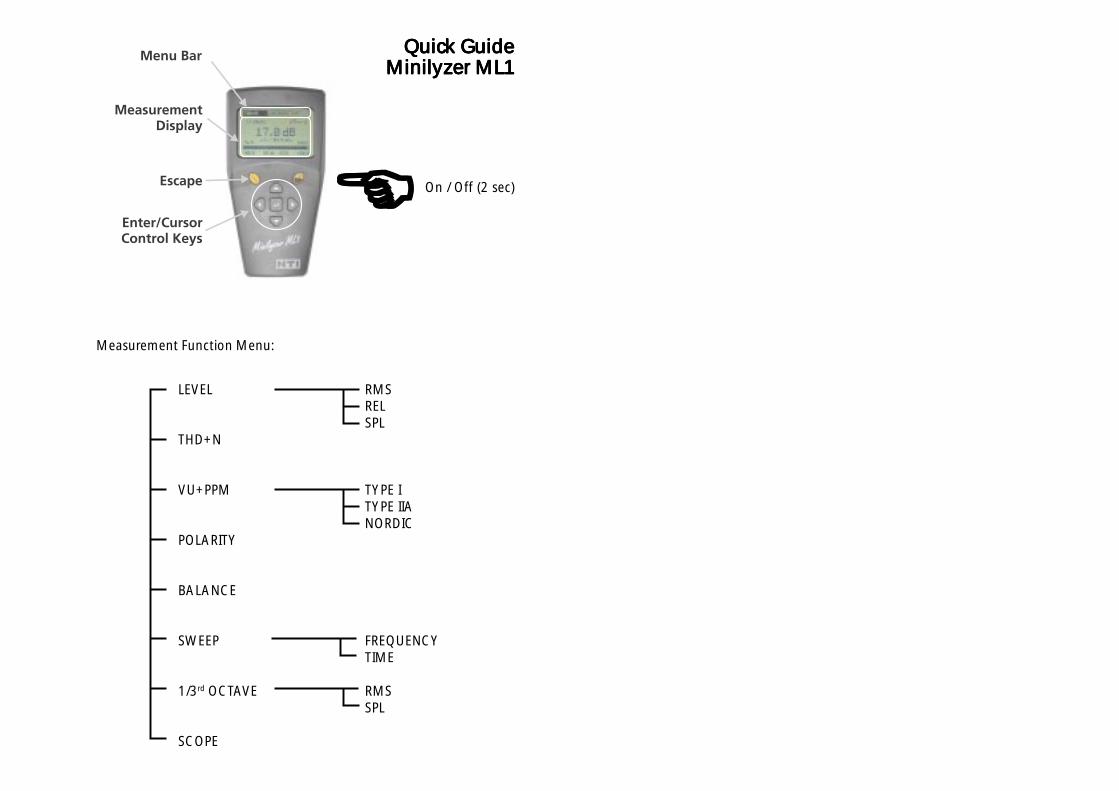
Quick GuideQuick GuideQuick GuideQuick GuideQuick GuideMinilyzer ML1Minilyzer ML1Minilyzer ML1Minilyzer ML1Minilyzer ML1
LEVEL
THD+N
VU+PPM
POLARITY
BALANCE
SWEEP
1/3rd OCTAVE
SCOPE
RMSRELSPL
TYPE ITYPE IIANORDIC
FREQUENCYTIME
RMSSPL
%%%%% On / Off (2 sec)
Measurement Function Menu: