Embed Size (px)
Citation preview
MINISTRY OF NATURAL RESOURCES AND
TOURISM
WILDLIFE DIVISION
BASELINE SURVEY OF THE EASTERN PILOT WILDLIFE
MANAGEMENT AREAS
FINAL REPORT
VOLUME II: IDODI-PAWAGA
By
Dr. C.G. Mung’ong’o (Sociologist & Team Leader)
Dr. Agnes Mwakaje (Economist)
Mr. Allan Kijazi (Ecologist)
With the help of:
Mr. Mathew Maige, Wildlife Division
Mr. Lazaro Yohana, GTZ-Tanzania
Ms Bupe Yoram, University of Dar es Salaam
June, 2003
2
TABLE OF CONTENTS
Executive Summary........................................................................................................................................ 4
1.0 INTRODUCTION ..................................................................................................................................17
1.1. Background.........................................................................................................................................17
1.2 Study Objective .............................................................................................................................18
1.3 The Study Area ..............................................................................................................................18
1.4 Literature Review ..........................................................................................................................19
1.4.1 The concept "Community Based Natural Resources Management" (CBRNM) ............................... 19
1.4.2 Problems and prospects of CBNRM ................................................................................................. 22
1.5 Methodology.......................................................................................................................................23
FINDINGS ....................................................................................................................................................23
2.0 SOCIOLOGICAL ASPECTS .................................................................................................................23
2.1 Demographic Trends ....................................................................................................................23
2.2 Migration Patterns .........................................................................................................................24
2.3 Household Characteristics .............................................................................................................25
2.3.1 Type of households ............................................................................................................................. 25
2.3.2 Household size and composition ........................................................................................................ 25
2.3.3 Dependence ratios ............................................................................................................................... 25
2.4 Natural Resource Use Patterns and Access Mechanisms ..............................................................26
2.5 Institutional Set-Up........................................................................................................................26
2.6 Issues of Governance .......................................................................................................................27
2.7 Relationship Between Village Governments and CBOs................................................................27
2.8 Villagers' Solidarity and Participation in Community Development Initiatives ............................28
2.9 Understanding the Concept WMA ................................................................................................28
2.10 Emergent Issues: A Discussion .....................................................................................................28
2.10.1 Good governnance………………………………………………………………………...……...28
2.10.2 Administrative constraints ................................................................................................................ 29
2.11 Conclusion and Recommendations ................................................................................................29
2.11 The Way Forward ..........................................................................................................................30
3.0 ECONOMIC ASPECTS ..........................................................................................................................30
3.1 Level of Development of the WMA ...................................................................................................30
3.2 Land Use Pattern and Availability ......................................................................................................30
3.3 Village Economic Status ........................................................................................................................33
3.3.1 Agricultural practices and farming technology ................................................................................... 33
3.3.2 Overall village economy ...................................................................................................................... 34
3.4 Agricultural Production, Yield and Trend ..........................................................................................38
3.5 Incomes and expenditure at the household and VG levels of over time .............................................38
3.5.1 Sources of income ................................................................................................................................ 38
3.5.2 Expenditure at household level ............................................................................................................ 40
3.5.3 Income sources by VG ......................................................................................................................... 40
3.5.4 VGs expenditures ................................................................................................................................. 41
3.6 Natural Resource Use Patterns ...........................................................................................................42
3.7 Mechanisms for Natural Resource Access ..........................................................................................43
3.8 Marketing ...........................................................................................................................................43
3.8.1 Transport as market availability factor ................................................................................................ 43
3.8.2 Marketing ............................................................................................................................................ 44
3.9 Economic Agents .................................................................................................................................45
3.9.1 Existing investors ................................................................................................................................. 45
3.9.2 Other economic agents ......................................................................................................................... 46
3
3.9.3 Interactions between economic agents and local people ..................................................................... 46
3.10 Financial Facilities ............................................................................................................................47
3.10.1 Loans and repayments ....................................................................................................................... 48
3.10.2 Poverty levels ..................................................................................................................................... 49
3.11 Availability of Socio-Economic Services ..........................................................................................49
3.12 Household Poverty Levels .................................................................................................................54
3.13 Opportunities to Increase VG Incomes .............................................................................................58
3.13.1 Introduction ........................................................................................................................................ 58
3.13.2 Fishing ................................................................................................................................................ 58
3.13.3 Fish farming ...................................................................................................................................... 61
3.13.4 Tourism .............................................................................................................................................. 62
3.13.5 Tourist and resident hunting .............................................................................................................. 62
3.13.6 Photo tourism ..................................................................................................................................... 62
3.13.7 Sport hunting ...................................................................................................................................... 63
3.13.8 Live animal capture and Sale ............................................................................................................ 63
3.14 Emerging Issues ................................................................................................................................63
3.15 Conclusion .........................................................................................................................................64
3.16 Recommendation ..............................................................................................................................66
3.17 Way Forward ....................................................................................................................................66
4.0 ECOLOGICAL ASPECTS......................................................................................................................67
4.1 Situation Analysis ................................................................................................................................67
4.2 Ecological Data and Analysis ..............................................................................................................68
4.2.1 The Current Ecological Status of the Area .......................................................................................... 68
4.2.2 Trends and Use of Wildlife ................................................................................................................. 69
4.2.3 The Status of Vegetation Communities and an Assessment of the Suitability of the
Habitats for Wildlife ..................................................................................................................................... 73
4.2.4 The Current Status and trends in water availability for Wildlife ........................................................ 76
4.2.5 An Overview of Wildlife Movements ................................................................................................ 77
4.2.6 Status, trends and use of fisheries, forests and bee keeping resources ............................................... 78
4.2.7 Human-wildlife Conflicts and Natural Resource Use Conflicts ....................................................... 79
4.3 Emerging Issues: A Discussion ..........................................................................................................80
4.3.1 Ecological Isolation............................................................................................................................ 80
4.3.2 Drying up of water in Great Ruaha during the dry season .................................................................. 80
4.3.3 Timber Extraction ............................................................................................................................... 81
4.3.4 Clearing of woodland and bushland for agriculture .......................................................................... 81
4.3.5 Overgrazing ......................................................................................................................................... 81
4.3.6 Crop damage ....................................................................................................................................... 81
4.3.7 Water pollution through fertilizers and pesticides .............................................................................. 81
4.4 Conclusions and Recommendations ....................................................................................................82
4.5 Way Forward ......................................................................................................................................82
REFERENCES ..............................................................................................................................................83
APPENDICES ...............................................................................................................................................85
Appendix I: Important Data and Tables ...................................................................................................85
4
Executive Summary
0.1 INTRODUCTION
The main objective of this study was to facilitate the collection, analysis and compilation of baseline
information from 16 pilot WMAs. This information is intended to be the basis for the development of
Monitoring Indicators and Monitoring Plans during the implementation of the proposed Idodi-Pawaga pilot
WMA.
0.2 METHODOLOGY
Both primary and secondary data were collected from all villages surrounding the proposed WMA.
Socio-Economic Data
Secondary data was collected through extensive literature reviews from documents obtained from
different sources, including GTZ, WWF, IRA, DFID, MNRT and WD. There were also consultations
with key and primary stakeholders in the above listed institutions, councilors, and other key players. In
the study areas we also visited MBOMIPA offices in Iringa Town and Iringa District Wildlife Offices.
Primary data was collected from all the villages surrounding the the pilot WMAs, except for two
villages which were not visited due to their inaccessibility. Two villages were visited per day,
spending about three hours of interviews in each village. Within the villages discussions and/or
meetings were conducted with village governments, focused groups differentiated by age and gender,
and a few of the curious general public.
Data Collection Instruments used included:
PRAs techniques using through focused group discussions, wealth ranking, key informants and
individual villagers’ interviews. A checklist developed in Dar es Salaam was used to gather
information from the respondents.
A household questionnaire was also administered to 4 villages. The selection of villages for household
interviews was done randomly, while that of the respondent households was stratified in terms of main
occupation (agriculture or livestock keeping), gender, age and migration status. From each stratum
villagers were selected randomly making a total sample of 30 households per village.
Photographs were taken where deemed appropriate.
Data weaknesses and limitation:
The data collected from the villages depended very much on the respondents' recall capability. Most of
the villages seem not to have proper record keeping systems that may affect the reliability of the data.
5
However, secondary data from MBOMIPA, GTZ and the Ministry of Natural Resources and Tourism
helped to reduce the weakness in reliability.
Ecological Data
Data collection involved literature review, field reconnaissance surveys, and informal discussions with
selected individuals knowledgeable about the area and public meetings with village government leaders.
The scanty secondary data provided supplementary information to that contained in this report.
Various reports were reviewed specifically to collate information and establish ecological status of the
area to cover:
- the current ecological status of the area
- trends and use of wildlife (consumptive and non consumptive uses)
- the status of vegetation communities and an assessment of the suitability of the habitats for
wildlife
- the current status and trends in water availability for wildlife
- an overview of wildlife movements
- status, trends and use of fisheries, forest and bee keeping resources and other biological resources
- human-wildlife conflicts and natural resource use conflicts in general.
Primary data collection was done through:
rapid field reconnaissance surveys on the proposed WMA. In the field visits the ecologist was
accompanied by the District Game Officer and/or a local resident who knew the area. The field visit
gave room for site discussions and exchange of ideas on the observations made. The purpose of the
field reconnaissance was to identify key ecological issues that require immediate action and follow up
during the first three years of the pilot project. Due to limited time and resources, fieldwork was
limited to road transects around the proposed WMA. Driving along selected roads provided an
overview of the ecological status of the area and helped to verify some information provided by
villagers, as well as verify information collected from secondary sources.
interviews with village government leaders and village game scouts selected as representative samples
of various communities in the villages where interviews. Village government leaders were selected for
the interview because they are elected by communities to represent them in making important
decisions. All members of the village government were invited to participate in the interviews,
believing that the information provided was representative of community views. Village game scouts
were selected because they are directly dealing with natural resources protection in the area, so it is
believed that they have a better view of the problems existing in the field than other members of the
community.
a checklist of ecological information relevant to the proposed WMA was administered, together with
social and economic aspect questions, to the village leaders of villages in the proposed WMA. Open-
ended questions were posed to the village leaders, and each was given the opportunity to respond while
6
others were allowed to give their comments on the response given. The consensus of the majority was
recorded as right response.
special informants who seemed to understand the area better and had interest in conservation were
selected from the local communities and interviewed. They provided ecological information that either
verified information collected from secondary sources, or provided information that was unavailable.
GIS work was done at the Tanzania Wildlife Research Institute. The work involved digitizing specific
thematic maps and overlaying selected information to suit the purpose of this study. The package used
in this analysis is ArcView. Analysis was done at a limited scale due to limited financial resources.
0.3 SURVEY FINDINGS
Sociological Aspects
Demographic characteristics
Population change in the proposed Idodi-Pawaga WMA is very dynamic due to in-migration. More than
50% of the respondents reported to have been born outside their villages of residence. 30% were recorded
to have moved in the area in the last ten years in search for agricultural opportunities. The seemingly high
influx of in-migrants is balanced by equally high rates of out-migration which in some villages is as high as
40%.
Natural resource use
Fuelwood is the most used resource in the proposed WMA, followed by charcoal, building poles, thatch
grass and medicinal plants. Wildlife is widely recognized as an important resource in the proposed WMA;
the influence of the work by MBOMIPA is evident in this respect.
Institutional Set-Up
The standard village government structure comprising three main committees (Planning and Finance; Peace
and Security, and Social Services Committees) prevails in all the villages visited. Under these committees
are various specialized sub-committees. The Natural Resources Sub-Committees operate under the
Planning and Finance Committees.
Governance
Infancy or lack of opposition political parties has led to a situation where there is no watchdog to forestall
or criticize village government excesses or abuse of power.
There are very few active CBOs. The few that exist include MBOMIPA. Others belong to religious
missions dealing with provision of social services such as education and health care.
7
Understanding the concept of WMA
This was measured by calculating the percentage of people mentioning all the three attributes of the
concept, i.e. participation, benefit sharing, and resource conservation in defining the concept. Results show
that perception is comparatively low (31%).
Level of development of WMA
Idodi-Pawaga has made considerable progress. MBOMIPA has been converted to an NGO with and
Advisory Board. Every member village has a Natural Resources Committee and a group of trained Game
Scouts. They still need to form Authorised Associations to carry out the proposed WMA activities.
Economic Aspects
Land use
Land use pattern consists of residential, agriculture, grazing and conservation (WMA) land. Few villages
have set aside land for later use and some have areas set for burial purposes. Except for land set aside for
the proposed WMA, no other land was reported to have been conserved for ecological purposes. Attempts
to quantify area under different uses were difficult because most of the villages do not have land use and
general management plans.
At household level farmers were able to mention number of plots and crops grown but it was very difficult
to provide acreage under each crop. This is partly because farmers practice intercropping rather than pure
stands.
In many villages land for grain farming other than rice is plenty and many people practice shifting
cultivation. However, land for rice farming and gardening is not adequate in all villages visited. The two
crops are important for food security and cash incomes. Following the collapse of cotton and pyrethrum
cooperative marketing rice has emerged as a major cash crop in the area.
The reasons for limited land for rice production in the villages surrounding the proposed WMA include
limited irrigated land, population pressure due to influx of people from other parts of the country and
unequal distribution. Few farmers have farms ranging from 10-20 ha. They rent some of farms to other
farmers at a cost of Tshs 15,000 to 30,000 per ha per season. This amount is very high for many farmers to
afford especially the youth generation who want to start farming activities.
Inadequate land for grazing is also facing the livestock sector. Insufficient water for livestock is common
for many villages and has been the major source of conflict between farmers and livestock keepers. But
8
also poor governance by VG in managing and allocating resources to different users has contributed to
these conflicts.
Village economic status
People in Idodi-Pawaga are principally agriculturalists. Almost 99% of the population are either pure
farmers or mixed farmers. Other economic activities include livestock keeping mainly by Masai, Sukuma
and Barbaig. There is also petty business especially during dry season. It includes shops, transport services,
and milling machines. Fishing and beekeeping are operated on subsistence levels.
Agricultural farming technology
Farming is mainly by hand hoe. Input use is very low or non-existent. Farming is both rainfed and irrigated.
Although irrigation potential of Idodi-Pawaga is 325 ha and 10,000 ha for Idodi and Pawaga, respectively,
the area currently irrigated is only 275 ha and 1,250 ha, respectively.
Overall village economy
The major economic sources existing include agriculture, livestock keeping, petty trade and fishing.
Generally, the villages’ economy is low due to poor farming technology, low input use and poor
marketing. Income from other sources such as employment is almost non-existent. Although households
also considerably benefit from natural resource extraction, such information is very difficult to quantify
because they are used mainly at subsistence level. Poor record keeping on incomes and expenditure by
households makes the assessment of this information rather difficult.
Household agricultural production, yield and trends
Production levels at households for the past five years were difficult to determine partly because most of
the crops, except rice and maize, are produced at subsistence level. Also farmers do not keep records of
production level so it is difficult to memorize beyond two or three years. The only information available is
for current season 2002/2003 and to a large extent it is only for the crops that go through the market.
Agricultural productivity is very low in most villages. For example, in 1995/96 season farmers harvested
1,500, 2,000 and 2,500 kg of maize, paddy and sorghum, respectively, while in the 2002/2003 season this
was reduced to only 693, 1,373 and 795 kg, respectively. This yield is significantly low when compared to
the past as well as experts recommendations. Experts’ recommendations suggest that by using composite
seeds farmers are supposed to harvest 1,500, 2,000 and 4,500 kg per ha of maize, paddy and sorghum,
respectively.
The reasons given for the declining yield trend include poor soils, drought and poor farming technology.
Crop damage by wild animals also contributes significantly in reduction of yield. In some villages wild
9
animals damage was reported to account for one third of the total crop loss. Post harvest crop losses are
also high due to poor storage facilities and techniques.
Incomes and expenditure at household and VG levels
Household income levels
Field data show that over 82% of the respondents in Idodi-Pawaga earn less than one dollar a day. Most of
the income comes from agriculture and related activities. Other sources of incomes at household levels
come from business, employment, and remittance.
Expenditure at household levels
Information at household expenditure was not easily available, especially in the form of quantities and
money terms, because farmers do not have the tradition of keeping records for their incomes and
expenditures. Rather, villagers were able to list areas of expenditure, which included, buying domestic
goods, health costs, education costs and farming expenses.
Health and education appear to consume a lion’s share of the households’ incomes. Common diseases are
water borne diseases such as diarrhea, typhoid, dysentery, and malaria. Thus improving water sources has
a big impact on peoples’ welfare. TB and the AIDS pandemic were reported to be serious where about 25%
and 10% of the population was reported to be affected, respectively.
Many villages do not have health services and the few with them are lacking qualified personnel and drugs.
High rates of infection lead to reduced labour force and productivity in the household, increase poverty
levels among rural communities. The cost of treating diseases is considerably high and is a burden to the
already meager household budgets.
Income sources by VG
The income sources for most village governments are 10% of the development levy collected, cess from
petty trade in the villages, fines for by-law violators, wildlife quotas and other incomes from natural
resources use. Income from wildlife account for 73.8% of the VGs’ incomes.
VGs expenditures
Village governments in Idodi-Pawaga spend 64.2 % of their income for recurrent and development
purposes. There is a great variation of the VGs income expenditures per village. Four villages out of 15
spend less than 50% of their incomes, while one village spent 198% of its income. The extra income is said
to come from villagers’ contribution and/or borrowing from rich people in the village. Increasing money
for development projects is perhaps the major incentive for villagers to feel sense of ownership for the
10
proposed WMA. It is not clear whether the balance is saved or used elsewhere. It is important for VGs to
have a culture of doing some savings for the part of the money earned annually to meet emergencies and
other developmental issues. Saving could also be used for lending money to villagers in the long term,
which could have a positive impact on poverty reduction at household level.
Natural resource use patterns
An examination of the natural resources use in villages surrounding the proposed Idodi-Pawaga WMA
show a range of items, including fish, charcoal, honey, building poles, thatching grass, minerals, medicine,
wild foods, and timber. Although game meat business is also practiced, many villages were not ready to
mention or provide actual figures due to its being performed illegally. Almost 100% of the respondents use
natural resources in one way or another.
Mechanisms for natural resource access
All villages have almost similar procedures for natural resource extraction. Natural resources for home use
are extracted without any permission. For petty business related resources, the villagers need to apply
through the village governments and pay a fee. For wild animals or cutting trees for timber permission has
to come from the Director of Wildlife and the District Natural Resource Office, respectively. Nevertheless,
despite the existing laws and by-laws for natural resource use, there is illegal extraction of resources in
many villages visited, suggesting that the laws/by-laws are not properly enforced.
Markets for village products
Most of the farm products go through market. So do live animals and livestock products such as meat, milk,
and skins.
Generally, transport system is very poor in all villages. Because of this transport costs to Iringa are very
high. A high proportion of farmers sell their farm products locally to itinerant traders or among the farmers
themselves at periodic markets (magulio). Hence prices received by farmers are very low.
Poor roads and infrastructure also limit farmers from producing potential high value but perishable crops
such as tomatoes and vegetables because they cannot sell easily.
The collapse of cooperative unions has left farmers with no representative organization to co-ordinate their
production; negotiate prices with buyers and campaign for better support services. Lack of market
information is another factor affecting bargaining power by farmers. Most farmers do not have price
information from other sources than the traders themselves. Due to lack of quality price information,
farmers have quite often realized that same trader who bought their produce paid different prices to
different farmers for the same quality of produce and at the same time. One important role the government
11
could play in these liberalized markets could be to improve access to price information by farmers so that
it discriminates less against small farmers and consumers.
The marketing situation is also not favourable for livestock keepers who complain that prices are so low
that they cannot sell their herds for enough money to buy food. Good markets for livestock could lead to
sustainability of the proposed WMA, as high prices for livestock will provide incentive for livestock
keepers to sell their cattle in large numbers. This will lead to the availability of beef or goat meat at
affordable prices and therefore reduce pressures for bush meat as a close substitute. Also selling large
number of animals by livestock keepers will enable them to purchase enough food from farmers thereby
increasing local markets for farmers. Another advantage is that, high incentive to sell livestock may reduce
grazing pressure on the WMA, which is good for wild animals.
One of the problems with marketing is the collapse of cooperative unions, which has left farmers with no
representative organization to co-ordinate their production; negotiate prices with buyers and campaign for
better support services. Lack of market information is another factor affecting bargaining power by
farmers. Most farmers do not have price information from other sources than the traders themselves. Due
to lack of quality price information, farmers have quite often realized that same trader who bought their
produce paid different prices to different farmers for the same quality of produce and at the same time. One
important role the government could play in these liberal markets could be to improve access to price
information by farmers so that it discriminates less against small farmers and consumers.
Economic agents
Existing investors
There are very limited investors in Idodi-Pawaga. There is only one tented camp at Tungamalenga village.
The camp comprises 6 rooms with en-suites as well as attractive camping sites with very good clean
facilities. They are targeting tourists who do not want to pay the high overnight costs in Ruaha, preferring
to go into Ruaha National Park on daily basis.
Few villages are being facilitated by religious organizations, especially the Anglican, Lutheran and Roman
Catholic churhes. These religious groups are involved mainly in education and health services provision on
small scale basis. One village mentioned to have been also helped by DANIDA in tape water installation.
In addition, an NGO known as Concern has been providing technical assistance for irrigation canal
construction/rehabilitation in some villages. Ruaha National Park, through its community conservation unit,
provides education to the communities in conservation and promotion of tourism based activities.
12
Interactions between economic agents and local people
There is no direct link between these economic agents and the local people in the area. Although, villagers
might be getting some incomes as commission/fee paid to the village government authorities by investors
which is then partly channeled back to the local communities in the area, their role to villages are not yet
well defined.
Financial facilities
Formal financial credit is not available in the villages visited. People rely on informal credit, which is
limited to a few thousand shillings. The demand for credit is high and the main source of credit is family
member or friends. High transaction cost related to formal credit both for lenders and borrowers limits the
establishment of these institutions in rural areas. Also low money circulation and lack of collateral for rural
communities create disincentives for financial institutions to provide services in these areas.
Poverty levels
Poverty is widely spread and pervasive in the villages visited. Using their own criteria the local show that
over 75%of the households in Idodi-Pawaga face relative poverty. This number is likely to be higher when
one compares with the national as well as international standards of poverty monitoring indicators such as
access to health services, education, life expectancy, under five mortality rate and access to clean water.
These findings are consistent with the household surveys where assessment on income poverty show over
80% of the respondents are poor earning less than one dollar a day.
The poverty levels were also revealed in terms of food consumption patterns. Although people appear to
have wide range of food consumption patterns, food composition is dominated by starchy foods with very
little protein and fat sources. Many villagers have only two meals a day, which is reduced to one meal
during lean periods.
Economic opportunities to increase VG incomes
A high proportion of the villages visited do not have any idea on how they could increase their incomes
from wildlife utilisation following the implementation of the concept WMA. Indeed, many villages were
not able to say anything on how they are going to improve their VGs’ incomes from the proposed WMA.
After brainstorming with the researchers the villagers were able to mention economic opportunities such as
ecotourism, tourism related to water falls attractions, hot springs tourism and cultural utilization, climbing
hills, campsites, optimization of game meat quota’s and business on live birds and photographing. People
expressed interest in practicing beekeeping. Currently, very few appear to practice it due to lack of
knowledge on the sector. Also fishing is one of the potential areas to increase wildlife income and nutrition
by villagers.
13
0.4 Ecological Aspects
Vegetation
This ranges from Acacia to miombo woodlands with interspersed riperian vegetation, bushland and
thickets. Some of the areas are open grasslands
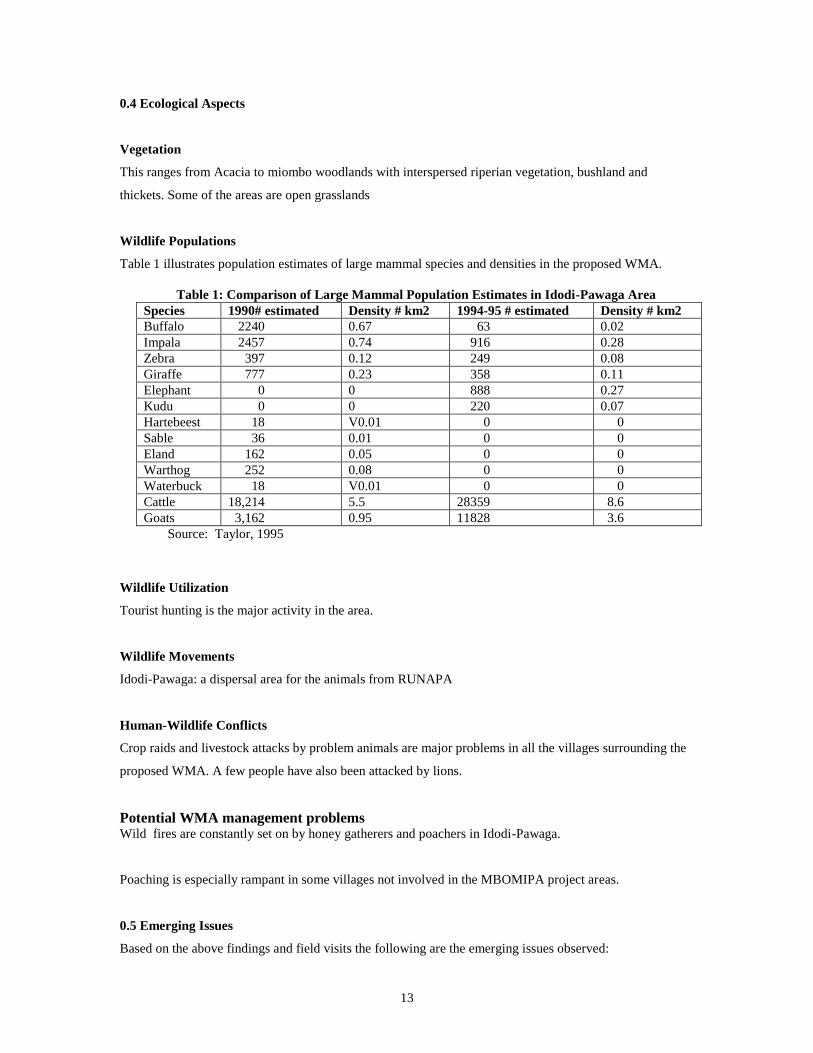
Wildlife Populations
Table 1 illustrates population estimates of large mammal species and densities in the proposed WMA.
Table 1: Comparison of Large Mammal Population Estimates in Idodi-Pawaga Area
Species 1990# estimated Density # km2 1994-95 # estimated Density # km2
Buffalo 2240 0.67 63 0.02
Impala 2457 0.74 916 0.28
Zebra 397 0.12 249 0.08
Giraffe 777 0.23 358 0.11
Elephant 0 0 888 0.27
Kudu 0 0 220 0.07
Hartebeest 18 V0.01 0 0
Sable 36 0.01 0 0
Eland 162 0.05 0 0
Warthog 252 0.08 0 0
Waterbuck 18 V0.01 0 0
Cattle 18,214 5.5 28359 8.6
Goats 3,162 0.95 11828 3.6
Source: Taylor, 1995
Wildlife Utilization
Tourist hunting is the major activity in the area.
Wildlife Movements
Idodi-Pawaga: a dispersal area for the animals from RUNAPA
Human-Wildlife Conflicts
Crop raids and livestock attacks by problem animals are major problems in all the villages surrounding the
proposed WMA. A few people have also been attacked by lions.
Potential WMA management problems Wild fires are constantly set on by honey gatherers and poachers in Idodi-Pawaga.
Poaching is especially rampant in some villages not involved in the MBOMIPA project areas.
0.5 Emerging Issues
Based on the above findings and field visits the following are the emerging issues observed:
14
Level of knowledge and awareness regarding these new concepts of WMA and AA by villagers
including village governments is very low or non-existence. This may affect local communities
bargaining power relative to investors and joint ventures related business.
Natural resource use by villagers is considerable but difficult to quantify and to put in money
terms because is used mainly on subsistence levels or used illegally.
Most of the natural resources is extracted free of charge because either by-laws are not developed
or they are not enforceable.
The capacity to keep records for incomes and expenditure by households and village governments
is very poor and in some villages not transparent enough.
A good proportion of the VG incomes seem to have been used in administrative matters rather
than villages’ development projects.
Capacity to identify economic opportunities for their WMA by villages is low which may
undermine their bargaining power with investors.
The benefits accruing from WMA are likely to benefit the community rather than individual
households especially in the initial years of implementation. Families that depend on natural
resource for subsistence may suffer following WMA’s implementations.
The efficiency in running economic activities is likely to differ from one village to another
depending on comparative advantages.
0.6 Conclusion and Recommendations
The most deficience observed in the field is the knowledge gap and awareness about the whole idea of
WMA and AA by villages. With exception of the villages’ chairmen who attended the inauguration
ceremony by the MNRT in Dar es Salaam, a high proportion of the villagers including VGs do not know
exactly what is going on and how this is going to affect their socio-economic lives. Awareness raising for
the whole community surrounding the proposed WMA and capacity building for key players in the VG
should be the starting point of WMA implementation by the government, donor community and NGOs.
Educating villagers on the WMA and associated packages is also important for bargaining power with
investors. Education also should be extended to teaching people basic principals of project appraisal and
book-keeping or general management skills. Field observations show that VGs cannot keep even simple
records for income and expenditure for their villages. Proper monitoring of the impact of the WMA concept
15
will only be possible if there is proper record keeping in villages. Record keeping techniques should
extend to households in terms of harvests, marketed crops and consumption.
Help should be provided to villages to develop by-laws for natural resources utilization as incentives to
increase VG incomes and sustainable utilisation of natural resources. Most villages do not know how they
will increase their incomes based on this new policy of WMA. At least in the initial years of WMA
implementation. The proposed WMA should be allocated with a facilitator that could help them in
identifying and implementing economic opportunities.
Since level of investment and joint venture between investors and local communities is almost non existent
at least to the knowledge of villagers, the government should try to build capacity in these aspects
providing skills related to investment and joint ventures.
The WMA should be helped to develop general management and land use plans by the MNRT and
Ministry of Land and Urban Settlements. This is undoubtedly important and a necessary first step for better
identification of land use patterns and economic opportunities.
Incomes and expenditure by village governments are not clear and transparent enough in some villages.
Also income from wildlife resources for developmental projects is not clearly indicated which is difficult to
make a follow-up. Proper monitoring of the impact of WMA concept will only be possible if there is proper
record keeping in villages’ incomes and expenditures.
Although many villages are likely to benefit from WMA implementation, most of these benefits will be
accrued at communal level and not at the household. There will be losers from natural resource livelihoods,
especially wild food extraction, and this category of people may need to be compensated.
Crop destruction by wild animals is considerable in all villages visited. These affect villagers’ crop harvests
and incomes. The destruction by wild animals is also experienced by livestock keepers where several
animals have been killed by wild animals such as Lion, Leopards, etc.
0.8 Way Forward
There should be immediate and extensive awareness raising programmes for the villagers surrounding the
WMA and capacity building in WMA, AA and general managerial skills for the key players of the VGs.
This work should be performed by WD.
There should be training for households and VG in record keeping for incomes and expenditure as well as
quantity/volumes harvested, marketed or consumed. Also there should be an external board to audit VGs’
16
incomes and expenditures. This work should be implemented by DW in collaboration with Ministry of
Finance or Cooperatives.
The MNRT need to contract another firm (economic) to undertake a detailed study in the proposed WMAs
case by case to establish cost benefit analysis and comparative advantages for each participating village.
This is important for each village to operate in economic areas, which is more efficient and competitive.
Comparative advantage could be in terms of wildlife resource endowed, transport advantage, time invested
in the business, etc.
The WD should look onto ways of compensating households whose livelihoods to a high extent depend on
natural resource extraction/use. This could be through providing alternative livelihoods.
Improvement of good governance at the village level is crucial. There is need for transparency and
accountability. Capacity building is also imperative, especially capacity to keep records and identify
economic opportunities.
Shortage of back-up staff at ward and district levels needs to be addressed. Awareness raising about the
proposed WMA initiative to the local communities is imperative.
17
1.0 INTRODUCTION
1.1. Background
The government of Tanzania through its Wildlife Policy (1998) is advocating the
establishment of Wildlife Management Areas (WMAs) as a means of effectively
implementing Community Based Conservation (CBC) activities in Tanzania. The
underlying assumption is that WMAs will be established where there is a ‘health’
population of wildlife. WMAs, despite their conservation roles, will run as business
entities parallel to other production systems in village lands, as will be determined by
land use plans. The new policy stipulates that local communities will benefit directly
from wildlife conservation economic opportunities through direct management of
WMAs. Benefits are expected through formation of joint ventures and benefit sharing. In
this process the CBC in WMAs will be implemented by Authorized Associations (AA).
The AAs are basically individual groups and designated organizations within the villages.
The AAs will be given authority by the Village Council to manage wildlife outside NPs
and GRs. About 15 sites will implement WMAs on a pilot basis for the period of three
years.
The concept of WMAs is to be implemented under the Wildlife Conservation Act (1974)
as translated in the Wildlife Management Authorities (WMAs) Regulations of 2002, and
the Guidelines for designation and management of WMAs which support the
implementation of the Wildlife Policy of Tanzania (1998). The Guidelines are
administrative rules, which are intended to rationalize in practical terms the Wildlife
Conservation (WMAs) Regulations, 2002.
Much of the initial focus of CBC has been on wildlife, which is threatened with
displacement by illegal use and growing rural human populations. The new policy
approach underlying the WMA concept devolves rights over wildlife to local
communities and aims to make wildlife conservation part of the rural poverty alleviation
process. In this context, the WMA initiatives must be financially attractive for the
community, economically efficient for the nation and financially viable for donors and
18
the government. Without these incentives, WMAs will not be sustainable, and will not
alleviate poverty or conserve wildlife.
1.2 Study Objective
The main objective of this study was to facilitate the collection, analysis and compilation of
baseline information from 15 pilot WMAs. This information is intended to be the basis for
the development of Monitoring Indicators and Monitoring Plans during the implementation
of the WMAs.
Hereunder we present the results of the baseline survey done in villages surrounding the
proposed Idodi-Pawaga pilot WMA. This report is divided into four sections. The
introductory section is followed by a second section that provides the sociological aspects of
the survey. The third section then discusses the economic aspects of the communities, while
the fourth and last one presents the ecological aspects of the proposed pilot WMA.
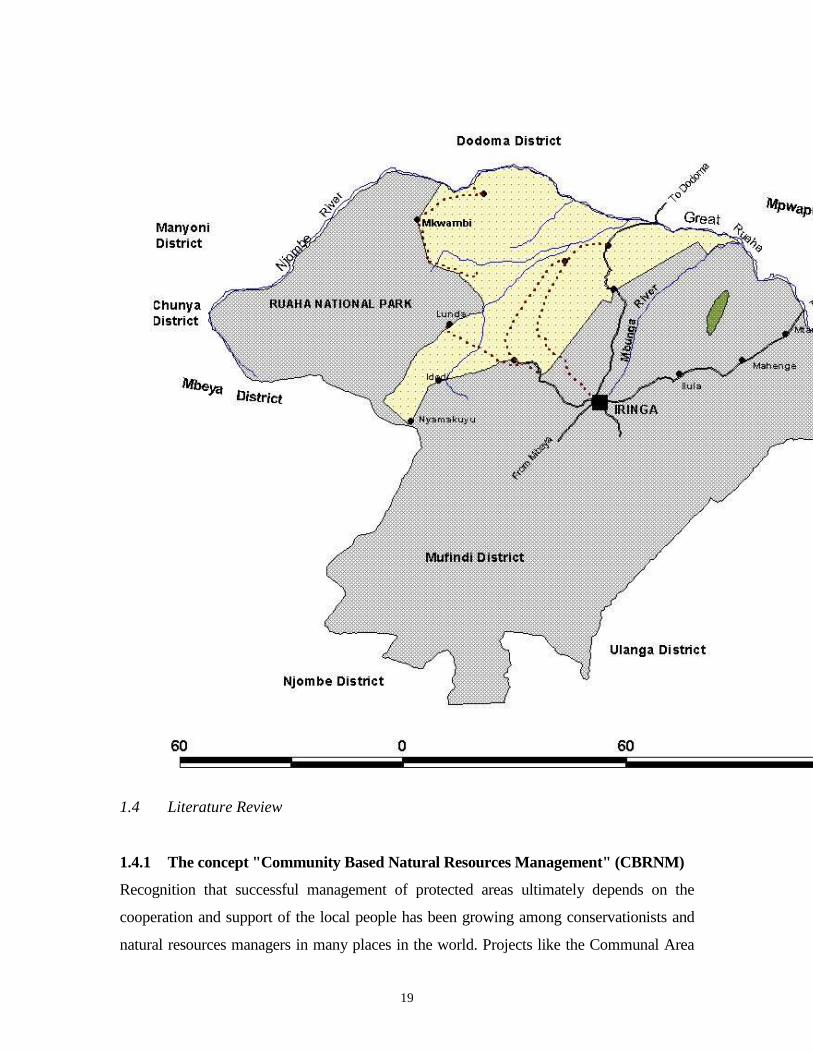
1.3 The Study Area
The proposed pilot WMA is within the Lunda-Mkwabi Game Controlled Area
(LMGCA). The communities have developed a memorandum of understanding to jointly
manage the area as a Wildlife Management Area. The total area of the Game Controlled
Area is 4,046 km2 (Map 1). The proposed pilot WMA has both ecological and social
benefits to Ruaha National Park. The biological, or ecological benefits are a result of the
territorial expansion of the protected area that keeps human impact further away. Some of
these benefits are:
Physical barrier from human encroachment
Enlargement of the natural habitat and reduction of edge effects
Enhancement of the environmental services provided by the reserved area.
19
1.4 Literature Review
1.4.1 The concept "Community Based Natural Resources Management" (CBRNM)
Recognition that successful management of protected areas ultimately depends on the
cooperation and support of the local people has been growing among conservationists and
natural resources managers in many places in the world. Projects like the Communal Area
20
Management Plan for Indigenous Resources (CAMPFIRE) in Zimbabwe and the Luangwa
Integrated Resource Development Project in Zambia have been established under such an
assumption and have recently taken the limelight as models of this supposedly new outlook
in the management of natural resources in protected areas (Wells and Brandon, 1993).
This outlook is not new to Tanzania. The problem of environmental degradation has been
the concern of the government for a very long time. Since the colonial period widespread
efforts have been made to conserve and improve natural resources such as forests, wildlife
and land. Generally, three types of conservation initiatives and programmes can be
distinguished. These are the preservation of forests and wildlife, the rehabilitation and
improvement of degraded lands, and environmental resource improvement efforts
undertaken at the initiative of local communities and grassroot organizations with varying
degrees of financial support of central government, local and foreign donors (Mung'ong'o,
1996).
The preservation of forests and wildlife began during the German period and was
emphasized during the British time by gazetting more conservation areas. People living on
the periphery of gazetted national parks, forest and wildlife reserves were evicted to protect
the reserves from "poaching" and encroachment. In the wake of Independence from the
colonial government in 1961, wildlife parks and forest reserves were increased to cover
almost 30 per cent of the country's land resources. (Table 1).
21
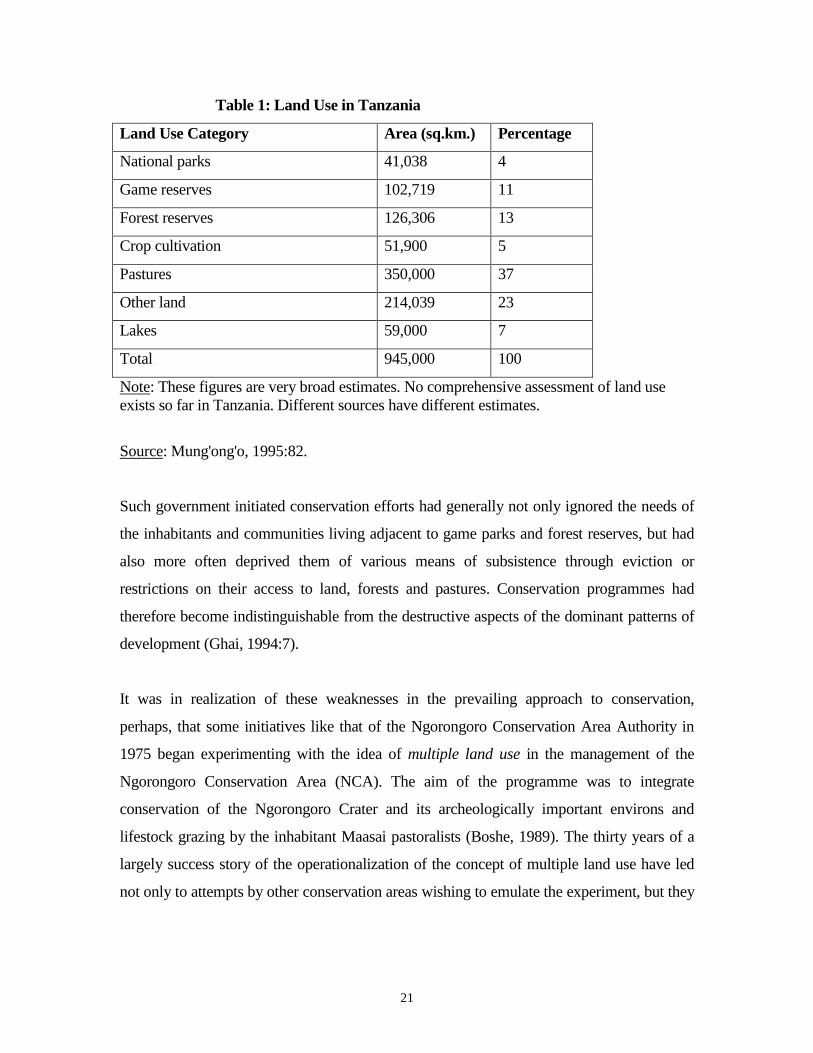
Table 1: Land Use in Tanzania
Land Use Category Area (sq.km.) Percentage
National parks 41,038 4
Game reserves 102,719 11
Forest reserves 126,306 13
Crop cultivation 51,900 5
Pastures 350,000 37
Other land 214,039 23
Lakes 59,000 7
Total 945,000 100
Note: These figures are very broad estimates. No comprehensive assessment of land use
exists so far in Tanzania. Different sources have different estimates.
Source: Mung'ong'o, 1995:82.
Such government initiated conservation efforts had generally not only ignored the needs of
the inhabitants and communities living adjacent to game parks and forest reserves, but had
also more often deprived them of various means of subsistence through eviction or
restrictions on their access to land, forests and pastures. Conservation programmes had
therefore become indistinguishable from the destructive aspects of the dominant patterns of
development (Ghai, 1994:7).
It was in realization of these weaknesses in the prevailing approach to conservation,
perhaps, that some initiatives like that of the Ngorongoro Conservation Area Authority in
1975 began experimenting with the idea of multiple land use in the management of the
Ngorongoro Conservation Area (NCA). The aim of the programme was to integrate
conservation of the Ngorongoro Crater and its archeologically important environs and
lifestock grazing by the inhabitant Maasai pastoralists (Boshe, 1989). The thirty years of a
largely success story of the operationalization of the concept of multiple land use have led
not only to attempts by other conservation areas wishing to emulate the experiment, but they
22
have also virtually fostered the emergence of a new rural development paradigm in
Tanzania.1
The underlying assumption of the paradigm has been that local communities will best
manage natural resources such as wildlife and forests if they are assured of clearly defined
user rights, proper incentives, information and the know-how to do it. The local people are
thus expected to participate in the process of design, establishment and management of the
conservation areas.
The aim of such a participatory approach to decision-making is to allow the stakeholders to
express their objectives in natural resource use and management, and to decide on how
these can best be achieved. It furthermore allows the stakeholders to evaluate the alternative
uses of the ecosystems according to their specific rationales; hence also effectively
empowering the local people to make better use and protection of their environment. At a
more theoretical level it provides better information to be used in resource management as a
result of the intermarriage between indigenous knowledge and scientific knowledge
(Tacconi and Benett, 1995:93).
1.4.2 Problems and prospects of CBNRM
Of recent wildlife conservation in Game Controlled Areas (GCA) and communal lands has
become difficult to implement in a centralized manner. It has also become difficult to justify
in economic terms. In the preceding paragraphs we have highlighted the changing
perception and approach among natural resources managers and conservationists at both the
national and district levels towards a recognition that successful management of protected
areas ultimately depend on the cooperation and support of the local communities. We have
noted the underlying assumption of the emerging paradigm as being based on a belief that
local communities value natural resources such as wildlife and forests and would manage
them best if they were assured of proper incentives, information and the know-how to do it.
1. The NCA has, for example, retained some of the most spectacular combination of scenic, wildlife and
archeological qualities in the world so as to acquire the status of a World Heritage Site in 1979 and a Biosphere
Reserve in 1982.
23
1.5 Methodology
Both primary and secondary data were collected from all villages surrounding the Idodi-
Pawaga WMA. The methodology used in accessing these data is detailed in Vol. I of this
four-part report.
FINDINGS
2.0 SOCIOLOGICAL ASPECTS
2.1 Demographic Trends
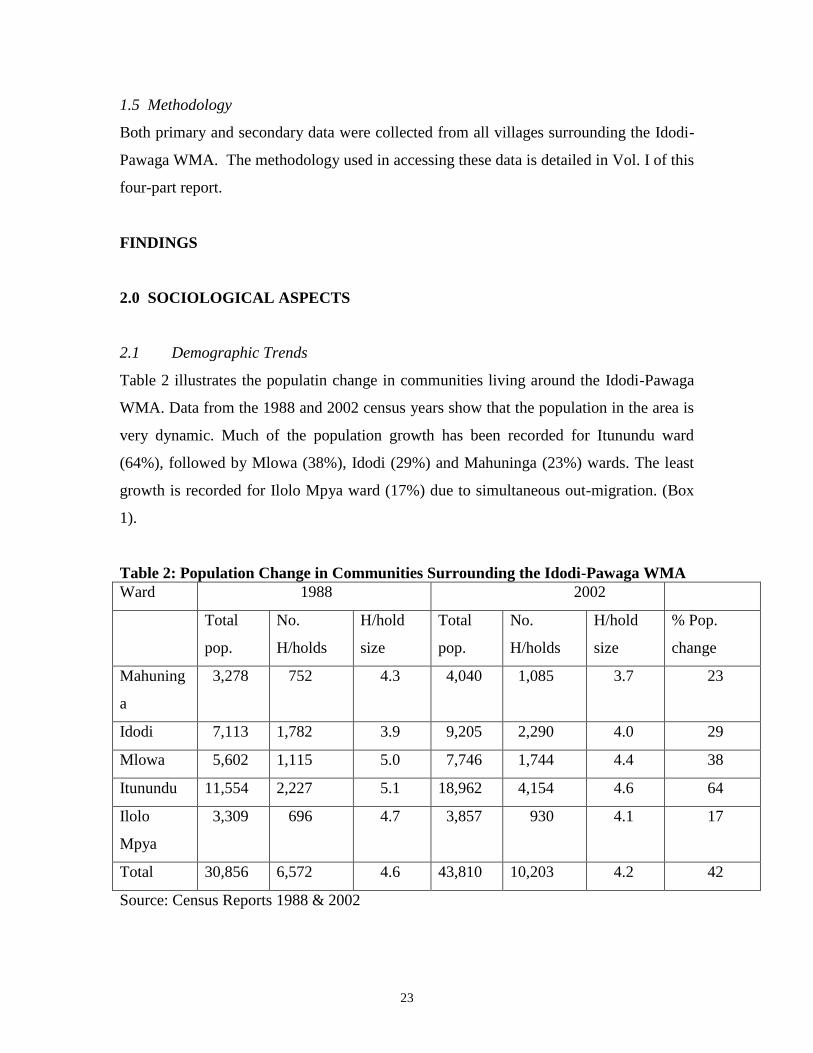
Table 2 illustrates the populatin change in communities living around the Idodi-Pawaga
WMA. Data from the 1988 and 2002 census years show that the population in the area is
very dynamic. Much of the population growth has been recorded for Itunundu ward
(64%), followed by Mlowa (38%), Idodi (29%) and Mahuninga (23%) wards. The least
growth is recorded for Ilolo Mpya ward (17%) due to simultaneous out-migration. (Box
1).
Table 2: Population Change in Communities Surrounding the Idodi-Pawaga WMA
Ward 1988 2002
Total
pop.
No.
H/holds
H/hold
size
Total
pop.
No.
H/holds
H/hold
size
% Pop.
change
Mahuning
a
3,278 752 4.3 4,040 1,085 3.7 23
Idodi 7,113 1,782 3.9 9,205 2,290 4.0 29
Mlowa 5,602 1,115 5.0 7,746 1,744 4.4 38
Itunundu 11,554 2,227 5.1 18,962 4,154 4.6 64
Ilolo
Mpya
3,309 696 4.7 3,857 930 4.1 17
Total 30,856 6,572 4.6 43,810 10,203 4.2 42
Source: Census Reports 1988 & 2002
24
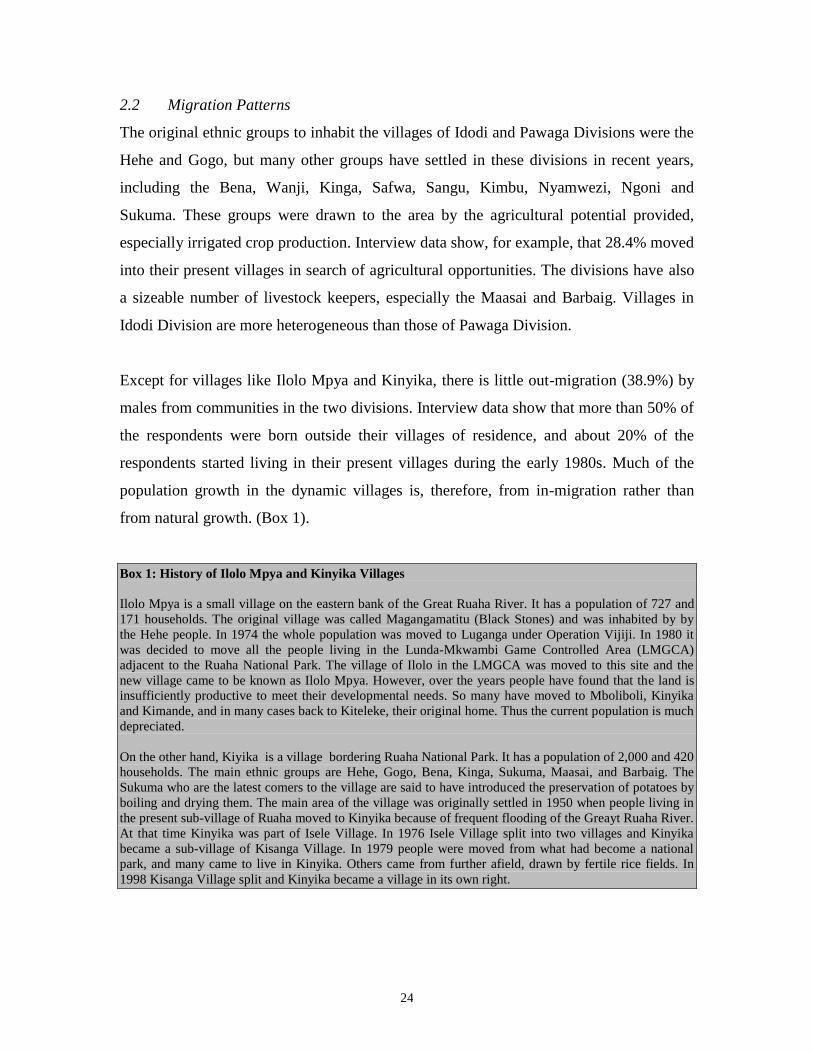
2.2 Migration Patterns
The original ethnic groups to inhabit the villages of Idodi and Pawaga Divisions were the
Hehe and Gogo, but many other groups have settled in these divisions in recent years,
including the Bena, Wanji, Kinga, Safwa, Sangu, Kimbu, Nyamwezi, Ngoni and
Sukuma. These groups were drawn to the area by the agricultural potential provided,
especially irrigated crop production. Interview data show, for example, that 28.4% moved
into their present villages in search of agricultural opportunities. The divisions have also
a sizeable number of livestock keepers, especially the Maasai and Barbaig. Villages in
Idodi Division are more heterogeneous than those of Pawaga Division.
Except for villages like Ilolo Mpya and Kinyika, there is little out-migration (38.9%) by
males from communities in the two divisions. Interview data show that more than 50% of
the respondents were born outside their villages of residence, and about 20% of the
respondents started living in their present villages during the early 1980s. Much of the
population growth in the dynamic villages is, therefore, from in-migration rather than
from natural growth. (Box 1).
Box 1: History of Ilolo Mpya and Kinyika Villages
Ilolo Mpya is a small village on the eastern bank of the Great Ruaha River. It has a population of 727 and
171 households. The original village was called Magangamatitu (Black Stones) and was inhabited by by
the Hehe people. In 1974 the whole population was moved to Luganga under Operation Vijiji. In 1980 it
was decided to move all the people living in the Lunda-Mkwambi Game Controlled Area (LMGCA)
adjacent to the Ruaha National Park. The village of Ilolo in the LMGCA was moved to this site and the
new village came to be known as Ilolo Mpya. However, over the years people have found that the land is
insufficiently productive to meet their developmental needs. So many have moved to Mboliboli, Kinyika
and Kimande, and in many cases back to Kiteleke, their original home. Thus the current population is much
depreciated.
On the other hand, Kiyika is a village bordering Ruaha National Park. It has a population of 2,000 and 420
households. The main ethnic groups are Hehe, Gogo, Bena, Kinga, Sukuma, Maasai, and Barbaig. The
Sukuma who are the latest comers to the village are said to have introduced the preservation of potatoes by
boiling and drying them. The main area of the village was originally settled in 1950 when people living in
the present sub-village of Ruaha moved to Kinyika because of frequent flooding of the Greayt Ruaha River.
At that time Kinyika was part of Isele Village. In 1976 Isele Village split into two villages and Kinyika
became a sub-village of Kisanga Village. In 1979 people were moved from what had become a national
park, and many came to live in Kinyika. Others came from further afield, drawn by fertile rice fields. In
1998 Kisanga Village split and Kinyika became a village in its own right.
25
2.3 Household Characteristics
2.3.1 Type of households
Rural households in Tanzania are normally headed by male members of the community.
If not a husband then it is a close kin - a son, a brother, or an uncle. Such is the situation
in two divisions. According to interview data 70.1% of the respondent households were
headed by males. Only 29.9% of households were headed by females as a result of
divorce or widowhood.
2.3.2 Household size and composition
Household sizes in the village vary greatly depending on the type of household. In well-
off households where polygyn, extended families and bonded labour arrangements are the
norm many people tend to stay in one household. On average, however, the household
size ranging between 3.7 and 4.6 people with an average of 4.2 people. Aggregately, in
an average household between 1 and 5 of the resident people would be women and
between 3 and 4 would be men. The age breakdown in such a household would be 5
children (aged between 0-15 years), 4 adults (aged between 16-59), and 1 elder (aged 60
and above).
2.3.3 Dependence ratios
A dependence ratio is the product of the total number of children, the old and the disabled
(the dependents) divided by the number of able-bodied adults who form the labour force
of a household. The ratio of dependence varies between wealth groups in the village. The
highest is among the middle and the well-off wealth groups, followed by those of the
poor social group. This tendency is explainable by differentiated access to labour. The
well-off households have the biggest labour force in the village and can thus afford to
keep large families. On average, however, the dependence ratio in the two divisions is
2.5.
26
2.4 Natural Resource Use Patterns and Access Mechanisms
According to the interview data the main natural resources, other than land, used by the
people of the two divisions from the local forests is fuelwood, building poles, timber,
wild vegetables, rope, medicine and thatch grass. Others are honey and fruits. The local
forest is depended upon by the local people for woodfuel (78%), for charcoal (8%) and
for building poles, timber and/or thatch grass (8%). Because of the activities of
MBOMIPA wildlife is recognized as an important natural resource in both divisions.
Access mechanisms for the various natural resources are discussed in detail in Section
3.12 of this report. However, in accordance with the tradition of ethnic groups resident in
the two divisions the man controls all resources, including land and income generated in
a household. The interview data demonstrate that despite the woman's equal contribution
to the household income the main decision-maker in the household is always the man.
Only a few respondents indicated that both the partners shared the decision-making
process, or that the woman made the major decisions in their households. The latter
responses came from polygynous or female-headed households. Women in this
community are aware of this anomaly. Women representation in the village government
and other leadership positions was, for example, suggested as one of the solutions for the
problems identified at the women focus group discussions.
2.5 Institutional Set-Up
In all the villages visited during this survey the standard village government (VG)
structure was prevalent. Below the Village Assembly (Box 2) the VG was headed by an
elected Village Chairman. The Chairman was supported in their day to day activities by
an appointed Village Executive Officer. These people were in turn supported by three
Village Committees (VCs) for Planning and Finance, Social Services and Peace and
Security. Under each of these VCs there are various Sub-Committees for various issues,
e.g. sub-committees for village shops, milling machines, water supply, the village school,
the environment or natural resources, et cetera.
27
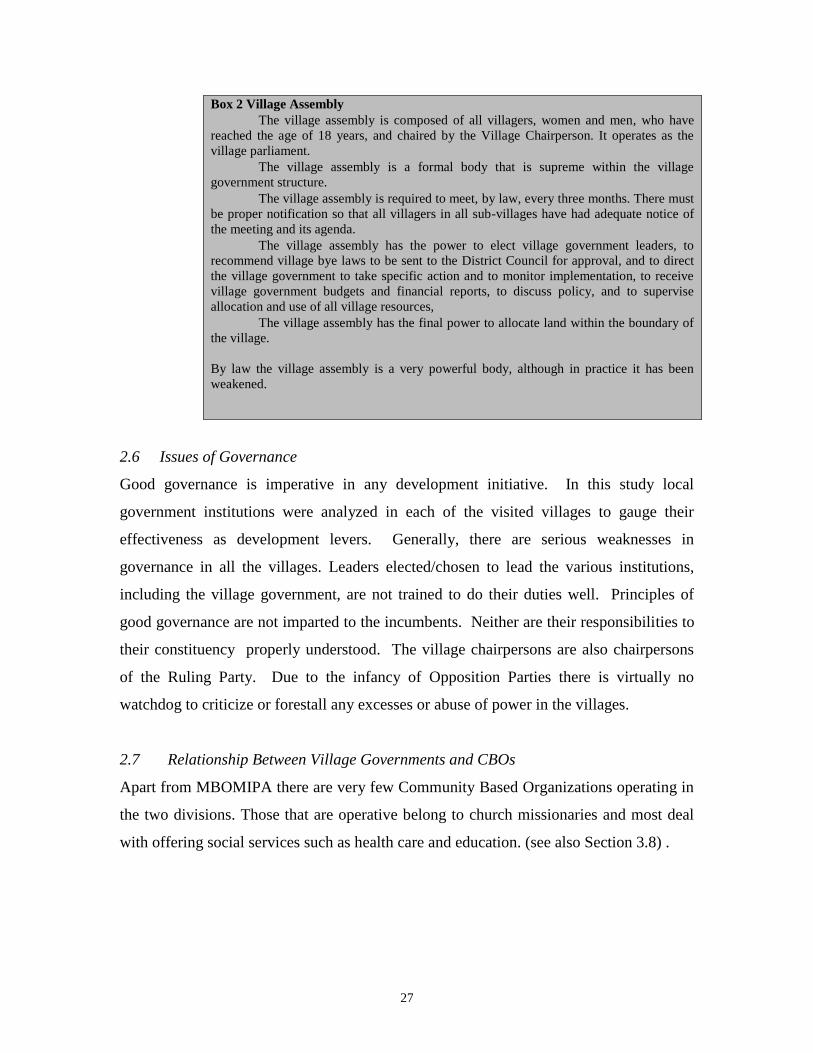
Box 2 Village Assembly
The village assembly is composed of all villagers, women and men, who have
reached the age of 18 years, and chaired by the Village Chairperson. It operates as the
village parliament.
The village assembly is a formal body that is supreme within the village
government structure.
The village assembly is required to meet, by law, every three months. There must
be proper notification so that all villagers in all sub-villages have had adequate notice of
the meeting and its agenda.
The village assembly has the power to elect village government leaders, to
recommend village bye laws to be sent to the District Council for approval, and to direct
the village government to take specific action and to monitor implementation, to receive
village government budgets and financial reports, to discuss policy, and to supervise
allocation and use of all village resources,
The village assembly has the final power to allocate land within the boundary of
the village.
By law the village assembly is a very powerful body, although in practice it has been
weakened.
2.6 Issues of Governance
Good governance is imperative in any development initiative. In this study local
government institutions were analyzed in each of the visited villages to gauge their
effectiveness as development levers. Generally, there are serious weaknesses in
governance in all the villages. Leaders elected/chosen to lead the various institutions,
including the village government, are not trained to do their duties well. Principles of
good governance are not imparted to the incumbents. Neither are their responsibilities to
their constituency properly understood. The village chairpersons are also chairpersons
of the Ruling Party. Due to the infancy of Opposition Parties there is virtually no
watchdog to criticize or forestall any excesses or abuse of power in the villages.
2.7 Relationship Between Village Governments and CBOs
Apart from MBOMIPA there are very few Community Based Organizations operating in
the two divisions. Those that are operative belong to church missionaries and most deal
with offering social services such as health care and education. (see also Section 3.8) .
28
2.8 Villagers' Solidarity and Participation in Community Development Initiatives
Although local governance is problematic in all the study villages, it is more so in semi-
arid Pawaga Division villages than in sub-humid Idodi Division. In the former villages
there is a major rift between the village council leaders and the villagers, supporting the
contention that poor people are vulnerable to political marginalization and alienation.
People’s participation in decision-making and leadership accountability in resource
allocation is at its minimum in these villages. Meetings are not called and income and
expenditure reports are not given to the Village Assembly. The village chairpersons hold
sway in the villages. Nothing is done until they approve it.
2.9 Understanding the Concept WMA
A considerable number of the respondents (30.6%) indicated that they understood the
concept by properly mentioning the three components of participation, benefit sharing
and resource conservation. Some 20.0% mentioned participation and resource
conservation, while 17.6% mentioned participation alone. The concept is, therefore, fairly
well understood and liked by many of the respondents (89.9%). This is most likely a
result of the good work of MBOMIPA in the two divisions.
2.10 Emergent Issues: A Discussion
2.10.1 Good governance
Representative democracy relies on elected representatives, namely Members of
Parliament, District Councilors, Village Councilors and Village Chairpersons to act on
behalf of those who elected them. The general conclusion is that the representative
system is not functioning properly. MPs and district/village councilors did not engage in
regular consultation processes with their local constituents, nor did they report back on
decisions made in Parliament, District Council or Village Council. According to many
villagers, ‘they are around during election campaigns, and then they disappear.’ This was
leading to growing tension between elected and appointed officials on the one hand, and
ordinary citizens on the other.
29
Underlying resistance at the local level to democratisation of local government is a deep-
seated distrust in central and local government of pluralism and public dissent. A low
tolerance for difference and alternative views reflects not only formal ‘modern’
government structures but ‘traditional’ communal values. The central principle of
representative democracy is that people use the power of the vote to choose the leaders
they wish, in order to get the kind of policies they want. The hostile reactions shown by
some leaders towards local moves of self-organisation and dissent indicate the
unwillingness among many to accept this principle, and the desire to hold onto power by
any means.
2.10.2 Administrative constraints
The managing of WMAs through Natural Resources Committees requires a local
leadership that is incorruptible and well versed in wildlife issues. Such type of leaders is
not easily available in most of the villages visited. Capacity building should be a major
activity in the pilot WMAs.
Apart from MBOMIPA, Iringa Rural District have no capacity to manage the anticipated
WMA. There are, for example, very few wildlife officers at the district headquarters with
no reliable transport facilities to visit all the villages of that vast district. In the event
MBOMIPA winds up its activities the district cannot carry over the role played by that
project. The establishment of the WMA should, in this respect, go parallel with the
employment and training of enough wildlife officers, especially so at the ward level to
facilitate supervision of village game scouts.
2.11 Conclusion and Recommendations
The institutional set up put in place to manage wildlife resources is very well organized,
and the level awareness seems to be high. If given the necessary financial and technical
support these communities can manage wildlife resources reasonably well.
30
2.11 The Way Forward
In the foregoing discussion two points have been raised as the way forward. These are:
Capacity building should be a major activity in the pilot WMA.
The establishment of the WMA should go parallel with the employment and training
of enough wildlife officers, especially at the ward level to facilitate supervision of village
game scouts.
3.0 ECONOMIC ASPECTS
3.1 Level of Development of the WMA
The Idodi-Pawaga WMA has made considerable progress. The Community Based
Conservation (CBC) started in 1993 and the MBOMIPA project came in 1997. Starting
from 2002, the MBOMIPA was converted into CBO, which forms the umbrella
organization for all villages surrounding the WMA. Every village supplies 2 game scouts
to undertake patrol activities for 10 days on rotational basis. The game scouts are paid
little allowances for the job, which according to them, are too little to meet basic needs.
In every village there is natural resource committee for natural resources related matters.
However, poor working facilities such as transport, communication, uniform, food have
constrained performance of wildlife protection against poaching.
3.2 Land Use Pattern and Availability
According to villagers, land use pattern is divided into residential, agriculture, livestock
and conservation (WMA). Few villages have set aside land for later use and some have
areas set for cemetery purposes. Except for WMA conserved land, there was no any land
reported to have been conserved for ecological purposes e.g. catchment areas.
There was no village that was able to provide quantitative data (area under different land
use). This has been occurred partly because village does not have Land Use Plan and
General Management Plan. The same problem experienced at household level, where
farmers were able to mention number of plots and crops grown but it was very difficult to
provide acreage under each crop. This is partly because they practice intercropping rather
31
than pure stand. In addition, data on the quantities of fish caught are not easily available
at village governments. This is mainly because most of the fishing activities are
undertaken on subsistence levels and no records are kept for catch volumes. To have such
data it needs a separate detailed study, which starts with awareness raising on the
importance of record keeping for any economic activity even though this may too prove
difficult when activities are indeed undertaken on subsistence level.
In many villages land for grain farming other than rice is not a problem. It is plenty and
many people practice shifting cultivation. However, land for rice farming and garden is
not adequate in all villages visited. The two crops are important for food security and
cash incomes. Following the collapse of cotton and pyrethrum cooperative marketing,
rice has emerged as a major cash crop in the area.
The reason for limited land in the villages surrounding the Idodi-Pawaga WMA is both
due to population pressure and unequal distribution. In the past 30 years, there has been
influx of people from other parts of the country looking for grazing pastures and
agricultural land. But also there is unequitable distribution of land. Few farmers mainly
local Hehe ethnic group (especially the old generation) are having big farms ranging from
10-20 acres per person. They cannot farm them all nor cannot sell them rather they rent to
other farmers at a cost of T.shs 20,000 per acre per season. Very few villagers are
charged T.shs 15,000 per acre per season (e.g Ilolo Mpya, Magozi and Luganga) and
others go as high as T.sh 30,000 (e.g Malinzanga, Mafuluto) per acre per season. In some
occasions they are asked to pay in kind of 2 sacks of rice per season for one hired acre.
This amount is very high for many farmers to afford especially the youth generation who
wants to start farming business.
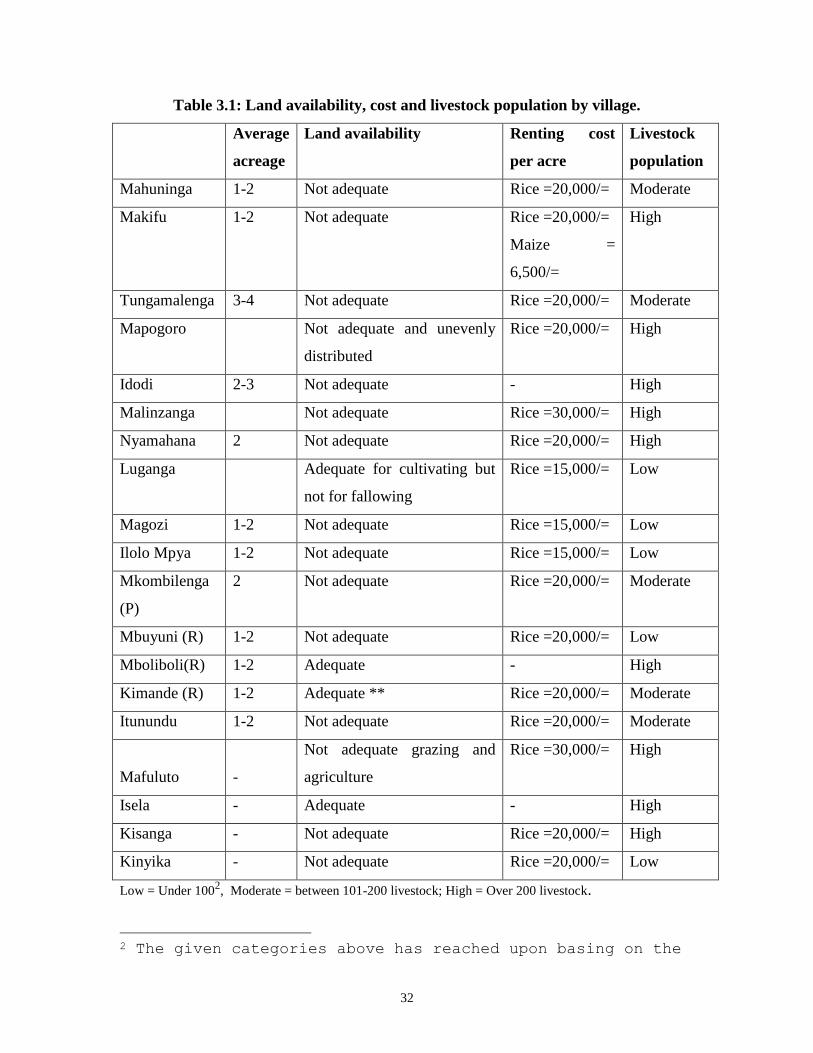
Inadequate land is also facing the livestock sector. Insufficient grazing areas and water
for livestock is common for many villages and has been the major source of conflict
between farmers and livestock keepers. But also poor governance by VG in managing
and allocating resource to different users has contributed to these conflicts. Table 1.0
displays land availability, cost and livestock population for each of the villages.
32
Table 3.1: Land availability, cost and livestock population by village.
Average
acreage
Land availability Renting cost
per acre
Livestock
population
Mahuninga 1-2 Not adequate Rice =20,000/= Moderate
Makifu 1-2 Not adequate Rice =20,000/=
Maize =
6,500/=
High
Tungamalenga 3-4 Not adequate Rice =20,000/= Moderate
Mapogoro Not adequate and unevenly
distributed
Rice =20,000/= High
Idodi 2-3 Not adequate - High
Malinzanga Not adequate Rice =30,000/= High
Nyamahana 2 Not adequate Rice =20,000/= High
Luganga Adequate for cultivating but
not for fallowing
Rice =15,000/= Low
Magozi 1-2 Not adequate Rice =15,000/= Low
Ilolo Mpya 1-2 Not adequate Rice =15,000/= Low
Mkombilenga
(P)
2 Not adequate Rice =20,000/= Moderate
Mbuyuni (R) 1-2 Not adequate Rice =20,000/= Low
Mboliboli(R) 1-2 Adequate - High
Kimande (R) 1-2 Adequate ** Rice =20,000/= Moderate
Itunundu 1-2 Not adequate Rice =20,000/= Moderate
Mafuluto
-
Not adequate grazing and
agriculture
Rice =30,000/= High
Isela - Adequate - High
Kisanga - Not adequate Rice =20,000/= High
Kinyika - Not adequate Rice =20,000/= Low
Low = Under 1002, Moderate = between 101-200 livestock; High = Over 200 livestock.
2 The given categories above has reached upon basing on the
33
3.3 Village Economic Status
People in Idodi-Pawaga are principally agriculturalists. Almost 99% of the population is
either pure farmers or mixed farmers. Other economic activities include livestock keeping
mainly by Masai, Sukuma and Barbaig. There is also petty business especially during dry
season. Fishing and beekeeping are operated on subsistence levels.
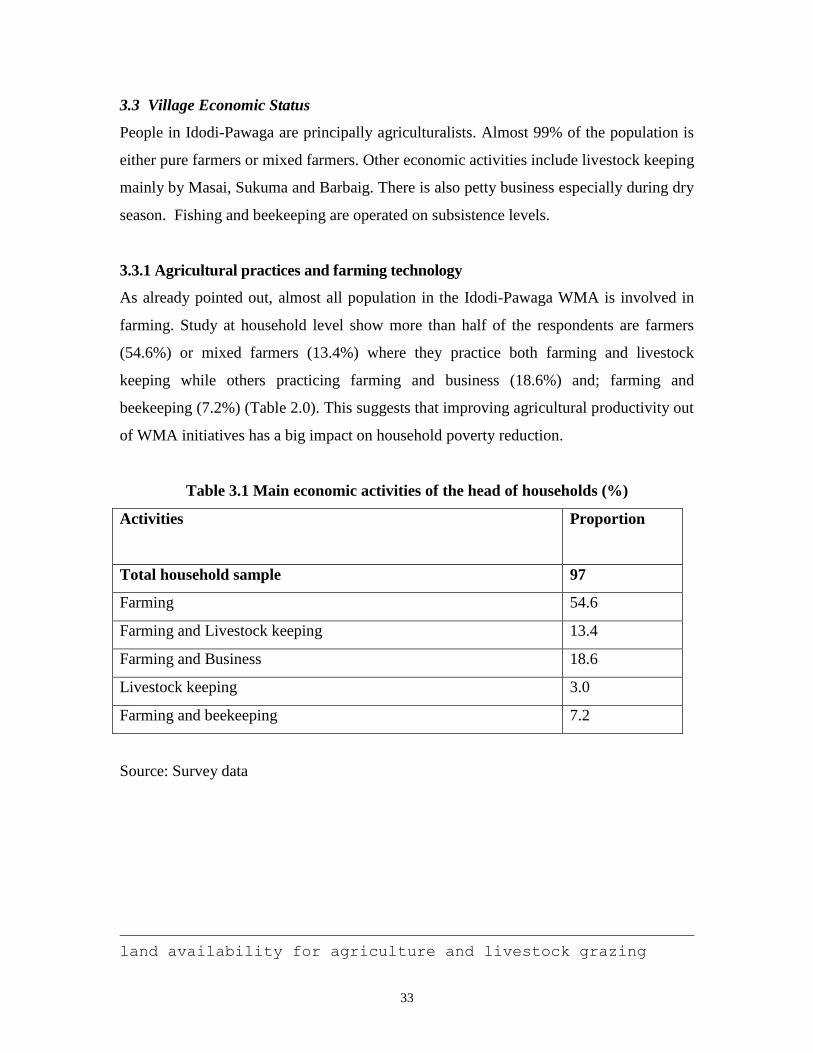
3.3.1 Agricultural practices and farming technology
As already pointed out, almost all population in the Idodi-Pawaga WMA is involved in
farming. Study at household level show more than half of the respondents are farmers
(54.6%) or mixed farmers (13.4%) where they practice both farming and livestock
keeping while others practicing farming and business (18.6%) and; farming and
beekeeping (7.2%) (Table 2.0). This suggests that improving agricultural productivity out
of WMA initiatives has a big impact on household poverty reduction.
Table 3.1 Main economic activities of the head of households (%)
Activities
Proportion
Total household sample 97
Farming 54.6
Farming and Livestock keeping 13.4
Farming and Business 18.6
Livestock keeping 3.0
Farming and beekeeping 7.2
Source: Survey data
land availability for agriculture and livestock grazing
34
3.3.1 Farming technology
The farming practice is both rainfed and irrigation. Available information show that the
irrigation potential of the area is 325 ha and 10,000 ha for Idodi and Pawaga respectively.
However, area under irrigation cultivation is 275 ha and only 1,250 ha for Idodi and
Pawaga, respectively (URT 1996).
The main crops grown are maize, rice, groundnuts and sorghum. Each household usually
cultivates 1-4 acres depending on the farming technology and availability of family
labour. A high proportion of farmers use hand hoe, few use oxen and very few can
manage to use tractors. Nevertheless, the choice for a technology to use is not determined
entirely by the poverty levels but also farmers’ perceptions about the technology do
matter. Many people claim that ploughing with tractors dig too dip, which brings the sand
to the surface and takes the fertile soil down too deep where the crops can’t use it.
Tractors are also seemed to be too expensive for many people to afford. Ploughing one
acre costs about 12,000 -15,000/=. On the other hand, cultivation by hand hoe doesn’t dig
deep enough, so the soil isn’t sufficiently mixed and therefore not very good for
agriculture. In addition, hand hoe is labour intensive and less efficient. The oxen seem to
be the most preferred technology by many due to the fact that the ridges spacing is better
and it does not dig too dip which is good for crops. But again the cost paid for ox-plough
services of 8000-10000/= per acre is high for many farmers to afford. Consequently, hand
hoe dominates the farming technology in the villages surrounding Idodi-Pawaga WMA
where over 80% of the population use it.
3.3.2 Overall village economy
Generally, villages’ economy in all 15 villages visited is agriculture and related activities
e.g selling of farm products. Income from other sources such as employment is almost
non-existent. Although households also considerably benefit from natural resource
extraction, such information is very difficult to quantify because they are used mainly in
subsistence. But also due to the fear about legal implications many people are not willing
to mention quantity and amount of money extracted from natural resource use. On the
35
other hand, poor record keeping on incomes and expenditure by households makes the
assessment of this information rather difficult.
Average income per village government per year is only T.shs 1,634,711. This is very
little to have any significant impact on villages’ development. Most of the income comes
from MBOMIPA quota with very little coming from other sources such as natural
resource use.
3.4 Agricultural Production, Yield and Trend
Production levels at villages for the past five years were difficult to determine. This is
partly because except for rice most of the crops are produced at subsistence levels. Also
farmers do not keep records of production levels so it is difficult to memorize for the past
five years. The only information available is for season 2002/2003 and only for only
crops that goes through markets.
The data on yield trend is only available in qualitative forms. The reason is linked to the
above point that people do not keep records for harvests and incomes. An examination of
yield trend shows to be declining. Eleven villages out of 16 reported the yield to be
declining. For example, in 1995/96 season farmers harvested 1500, 2000 and 2500 kgs
of maize, paddy and sorghum respectively compared to 693, 1373 and 795 kgs in year
2002/2003. This yield is significantly low when compared to the past as well as experts
recommendations. Experts’ recommendations suggest that by using composite seeds
farmers are supposed to harvest 1500, 2000 and 4500 kgs per acre of maize, paddy and
sorghum, respectively (URT 1996). The reasons given for such a trend included
unfavorable weather (e.g as drought, pest), poor farming technology (hand hoe) and
labour constraints. Also crop raiding by wild animals is a serious problem in all villages
visited where about quarter of the crops are destroyed in this way. Although, many
villagers feel that the fertility of the soil to be good and as a result, most of them do not
use any fertilizers, the low yield is among other things an indication of inadequate
fertility of the soil. This suggest that the sustainability of WMA may depend very much
on improving agricultural productivity through irrigation and controlling the influx of
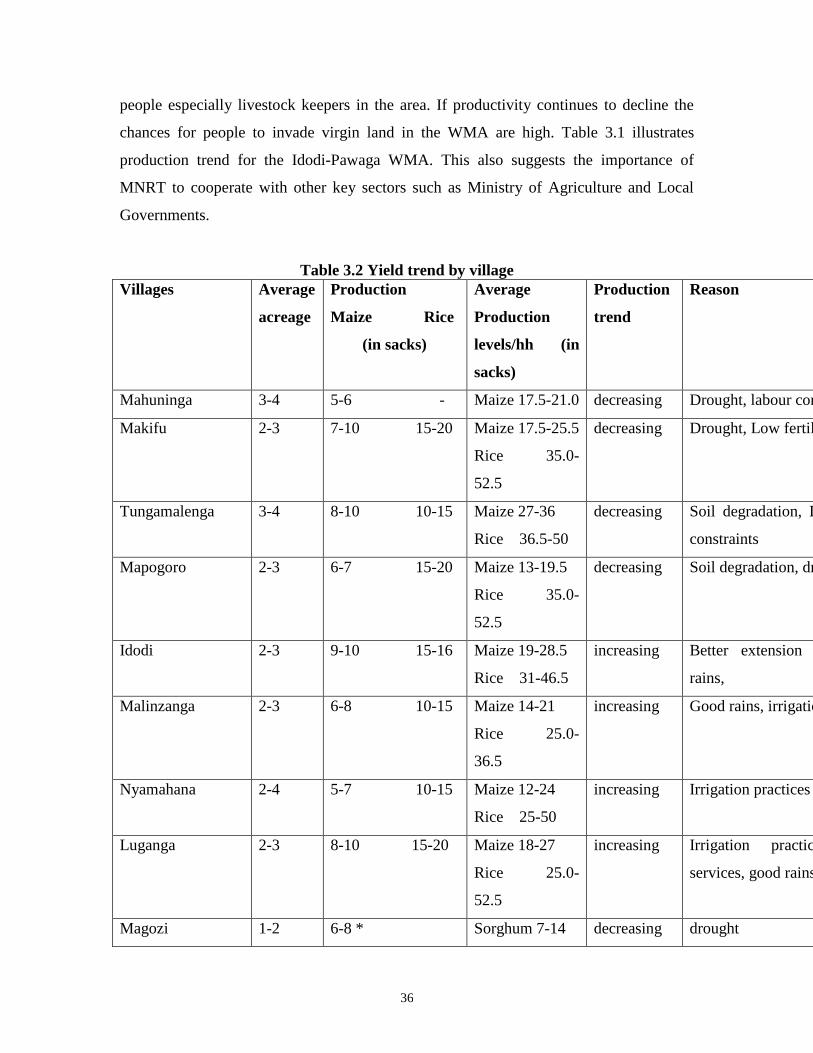
36
people especially livestock keepers in the area. If productivity continues to decline the
chances for people to invade virgin land in the WMA are high. Table 3.1 illustrates
production trend for the Idodi-Pawaga WMA. This also suggests the importance of
MNRT to cooperate with other key sectors such as Ministry of Agriculture and Local
Governments.
Table 3.2 Yield trend by village
Villages Average
acreage
Production
Maize Rice
(in sacks)
Average
Production
levels/hh (in
sacks)
Production
trend
Reason
Mahuninga 3-4 5-6 - Maize 17.5-21.0 decreasing Drought, labour constraints
Makifu 2-3 7-10 15-20 Maize 17.5-25.5
Rice 35.0-
52.5
decreasing Drought, Low fertility levels
Tungamalenga 3-4 8-10 10-15 Maize 27-36
Rice 36.5-50
decreasing Soil degradation, Drought, labour
constraints
Mapogoro 2-3 6-7 15-20 Maize 13-19.5
Rice 35.0-
52.5
decreasing Soil degradation, drought
Idodi 2-3 9-10 15-16 Maize 19-28.5
Rice 31-46.5
increasing Better extension services, good
rains,
Malinzanga 2-3 6-8 10-15 Maize 14-21
Rice 25.0-
36.5
increasing Good rains, irrigation
Nyamahana 2-4 5-7 10-15 Maize 12-24
Rice 25-50
increasing Irrigation practices
Luganga 2-3 8-10 15-20 Maize 18-27
Rice 25.0-
52.5
increasing Irrigation practices, extension
services, good rains
Magozi 1-2 6-8 * Sorghum 7-14 decreasing drought
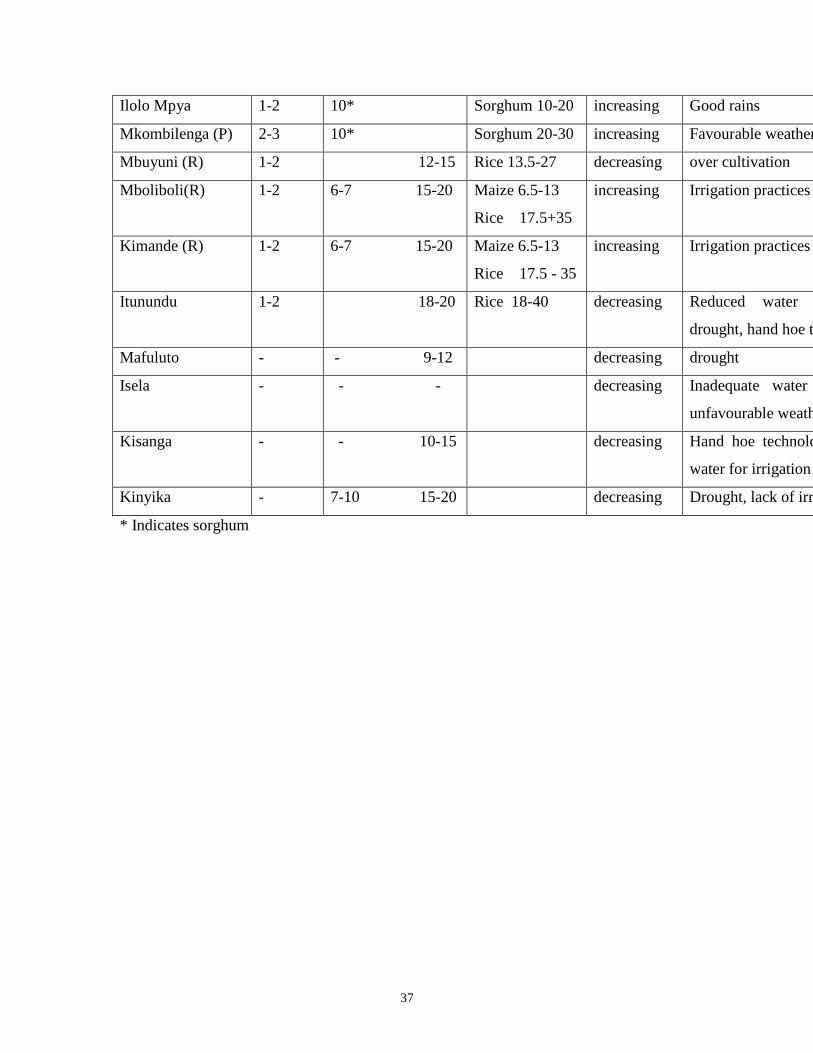
37
Ilolo Mpya 1-2 10* Sorghum 10-20 increasing Good rains
Mkombilenga (P) 2-3 10* Sorghum 20-30 increasing Favourable weather
Mbuyuni (R) 1-2 12-15 Rice 13.5-27 decreasing over cultivation
Mboliboli(R) 1-2 6-7 15-20 Maize 6.5-13
Rice 17.5+35
increasing Irrigation practices
Kimande (R) 1-2 6-7 15-20 Maize 6.5-13
Rice 17.5 - 35
increasing Irrigation practices
Itunundu 1-2 18-20 Rice 18-40 decreasing Reduced water for irrigation,
drought, hand hoe technology
Mafuluto - - 9-12 decreasing drought
Isela - - - decreasing Inadequate water for irrigation,
unfavourable weather
Kisanga - - 10-15 decreasing Hand hoe technology, inadequate
water for irrigation
Kinyika - 7-10 15-20 decreasing Drought, lack of irrigation water
* Indicates sorghum
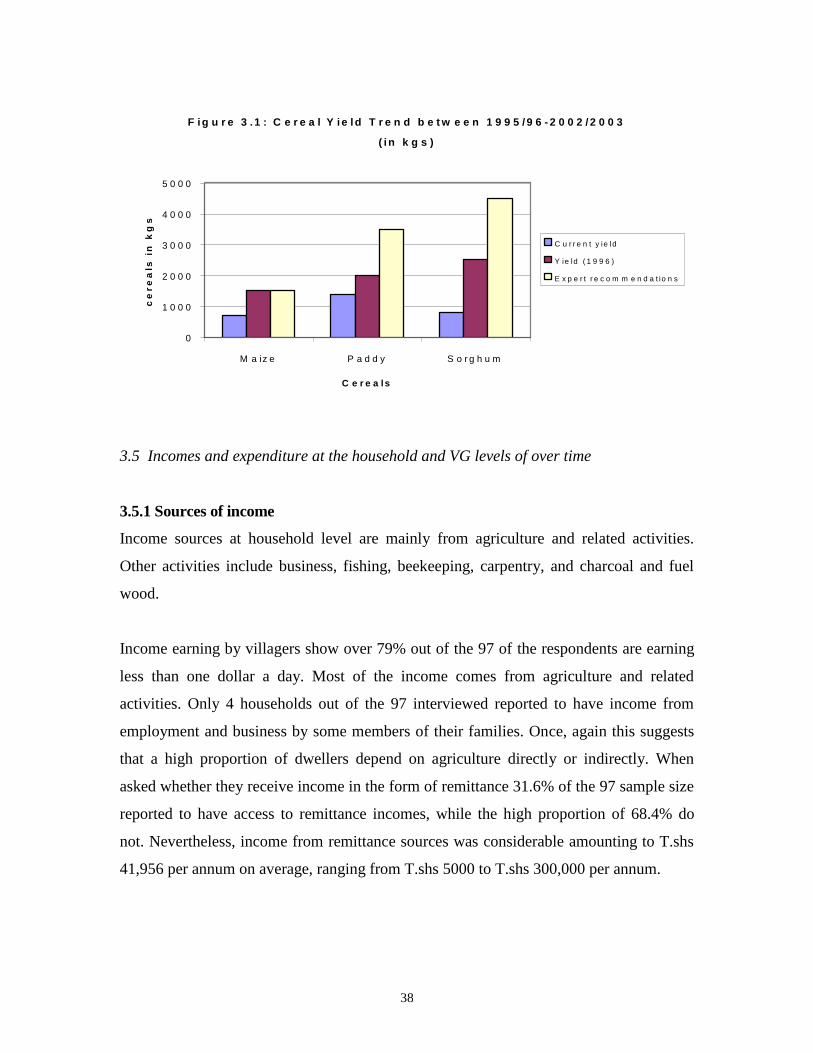
38
F i g u r e 3 . 1 : C e r e a l Y i e l d T r e n d b e t w e e n 1 9 9 5 / 9 6 - 2 0 0 2 / 2 0 0 3
( i n k g s )
0
1 0 0 0
2 0 0 0
3 0 0 0
4 0 0 0
5 0 0 0
M a iz e P a d d y S o r g h u m
C e r e a ls
ce
re
als
in
kg
s
C u r r e n t y ie ld
Y ie ld ( 1 9 9 6 )
E x p e r t r e c o m m e n d a t io n s
3.5 Incomes and expenditure at the household and VG levels of over time
3.5.1 Sources of income
Income sources at household level are mainly from agriculture and related activities.
Other activities include business, fishing, beekeeping, carpentry, and charcoal and fuel
wood.
Income earning by villagers show over 79% out of the 97 of the respondents are earning
less than one dollar a day. Most of the income comes from agriculture and related
activities. Only 4 households out of the 97 interviewed reported to have income from
employment and business by some members of their families. Once, again this suggests
that a high proportion of dwellers depend on agriculture directly or indirectly. When
asked whether they receive income in the form of remittance 31.6% of the 97 sample size
reported to have access to remittance incomes, while the high proportion of 68.4% do
not. Nevertheless, income from remittance sources was considerable amounting to T.shs
41,956 per annum on average, ranging from T.shs 5000 to T.shs 300,000 per annum.
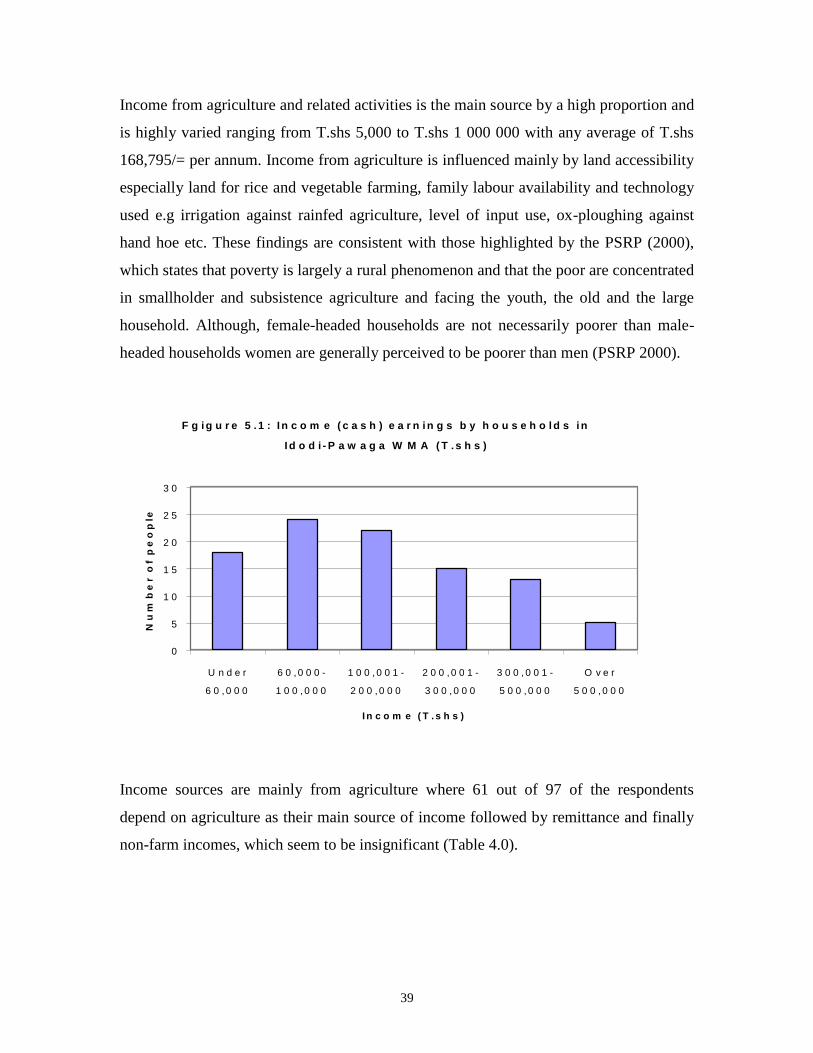
39
Income from agriculture and related activities is the main source by a high proportion and
is highly varied ranging from T.shs 5,000 to T.shs 1 000 000 with any average of T.shs
168,795/= per annum. Income from agriculture is influenced mainly by land accessibility
especially land for rice and vegetable farming, family labour availability and technology
used e.g irrigation against rainfed agriculture, level of input use, ox-ploughing against
hand hoe etc. These findings are consistent with those highlighted by the PSRP (2000),
which states that poverty is largely a rural phenomenon and that the poor are concentrated
in smallholder and subsistence agriculture and facing the youth, the old and the large
household. Although, female-headed households are not necessarily poorer than male-
headed households women are generally perceived to be poorer than men (PSRP 2000).
F g i g u r e 5 . 1 : I n c o m e ( c a s h ) e a r n i n g s b y h o u s e h o l d s i n
I d o d i - P a w a g a W M A ( T . s h s )
0
5
1 0
1 5
2 0
2 5
3 0
U n d e r
6 0 , 0 0 0
6 0 , 0 0 0 -
1 0 0 , 0 0 0
1 0 0 , 0 0 1 -
2 0 0 , 0 0 0
2 0 0 , 0 0 1 -
3 0 0 , 0 0 0
3 0 0 , 0 0 1 -
5 0 0 , 0 0 0
O v e r
5 0 0 , 0 0 0
I n c o m e ( T . s h s )
Nu
mb
er
of p
eo
ple
Income sources are mainly from agriculture where 61 out of 97 of the respondents
depend on agriculture as their main source of income followed by remittance and finally
non-farm incomes, which seem to be insignificant (Table 4.0).
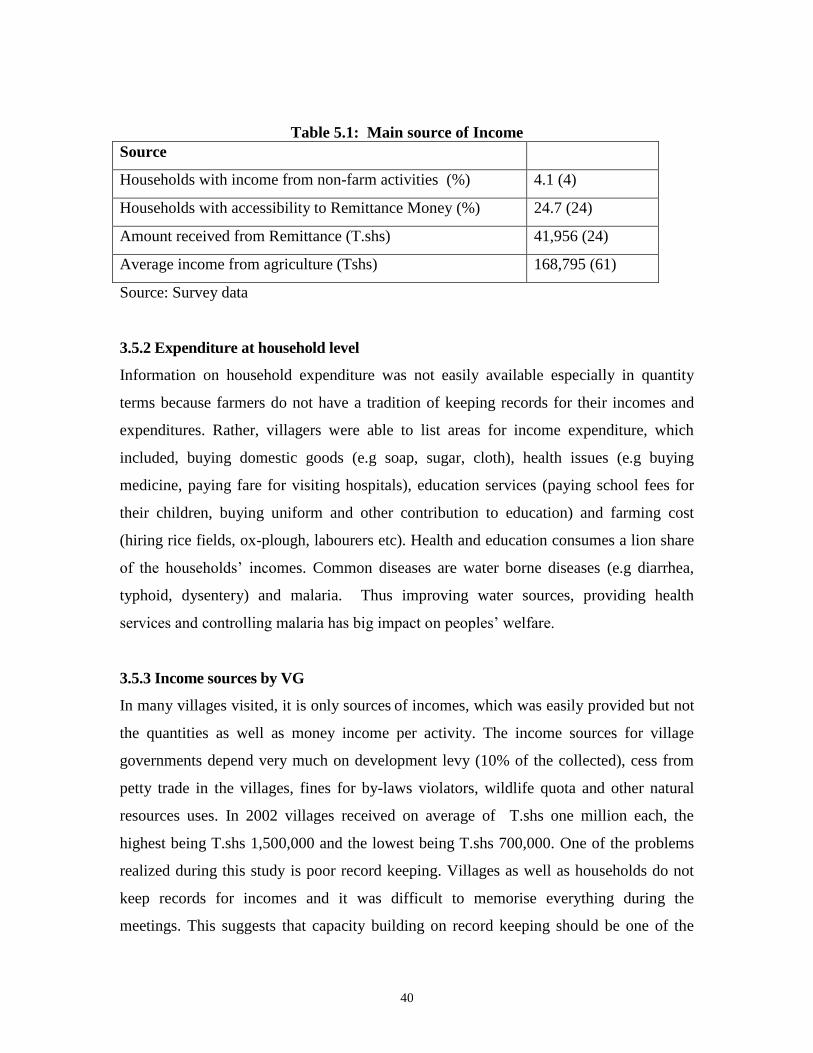
40
Table 5.1: Main source of Income
Source
Households with income from non-farm activities (%) 4.1 (4)
Households with accessibility to Remittance Money (%) 24.7 (24)
Amount received from Remittance (T.shs) 41,956 (24)
Average income from agriculture (Tshs) 168,795 (61)
Source: Survey data
3.5.2 Expenditure at household level
Information on household expenditure was not easily available especially in quantity
terms because farmers do not have a tradition of keeping records for their incomes and
expenditures. Rather, villagers were able to list areas for income expenditure, which
included, buying domestic goods (e.g soap, sugar, cloth), health issues (e.g buying
medicine, paying fare for visiting hospitals), education services (paying school fees for
their children, buying uniform and other contribution to education) and farming cost
(hiring rice fields, ox-plough, labourers etc). Health and education consumes a lion share
of the households’ incomes. Common diseases are water borne diseases (e.g diarrhea,
typhoid, dysentery) and malaria. Thus improving water sources, providing health
services and controlling malaria has big impact on peoples’ welfare.
3.5.3 Income sources by VG
In many villages visited, it is only sources of incomes, which was easily provided but not
the quantities as well as money income per activity. The income sources for village
governments depend very much on development levy (10% of the collected), cess from
petty trade in the villages, fines for by-laws violators, wildlife quota and other natural
resources uses. In 2002 villages received on average of T.shs one million each, the
highest being T.shs 1,500,000 and the lowest being T.shs 700,000. One of the problems
realized during this study is poor record keeping. Villages as well as households do not
keep records for incomes and it was difficult to memorise everything during the
meetings. This suggests that capacity building on record keeping should be one of the
41
priorities by WMAs. Without proper record keeping by households and villages
monitoring and evaluation of the impact of the WMAs initiatives may become difficult.
In many villages income from wildlife accounts for high proportion of the VG incomes
ranging from 55% to over 80% (Table 5.1). Overall, income from wildlife utilization is
73.5% of the total VG incomes for Idodi Pawaga WMA. This suggests that proper
utilization of wildlife has the potential to increase VG incomes and therefore reduce
poverty in the villages through construction of schools, health centers and reducing
pressure on local people contribution to the development activities. In the long term,
income from wildlife by the VGs could also be used as a source of credit to villagers or
establish what is known as SACCOS. Currently, many villages’ wildlife incomes come
from MBOMIPA quotas with very little coming from other resource utilization such as
fishing, carpentry, artisan etc. This occurs due to either lack of by-laws or inability to
enforce them. Increasing income from other sources need to be strengthened under these
WMAs new approach and this could form a monitoring indicator for future WMAs.
3.5.4 VGs expenditures
There is great variation of the GVs income expenditures. Four villages (Luganga,
Magozi, Mboliboli, Kimande and Magozi ) out of 15 spend less than 50% of their
incomes while one village (Mkombilenga) spent 198% of its income. The extra income is
said to come from villagers’ contribution and/or borrowing from rich people in the
village.
Overall, Idodi-Pawaga WMA spends 64.2% of their annual earned incomes. The VG was
not able to provide the break down of income expenditures i.e, what proportion is used
for village development projects, for conservation, for emergencies etc. It is not clear
whether the remaining 36% is saved in villages’ bank accounts or spent in recurrent.
Nevertheless, villages should be encouraged to show clearly on how income was spent.
Also to do savings for the part of the money earned annually to meet emergencies and
other developmental issues. Saving could also be used for lending money to villagers in
long term, which could have positive impact on poverty reduction at household level.
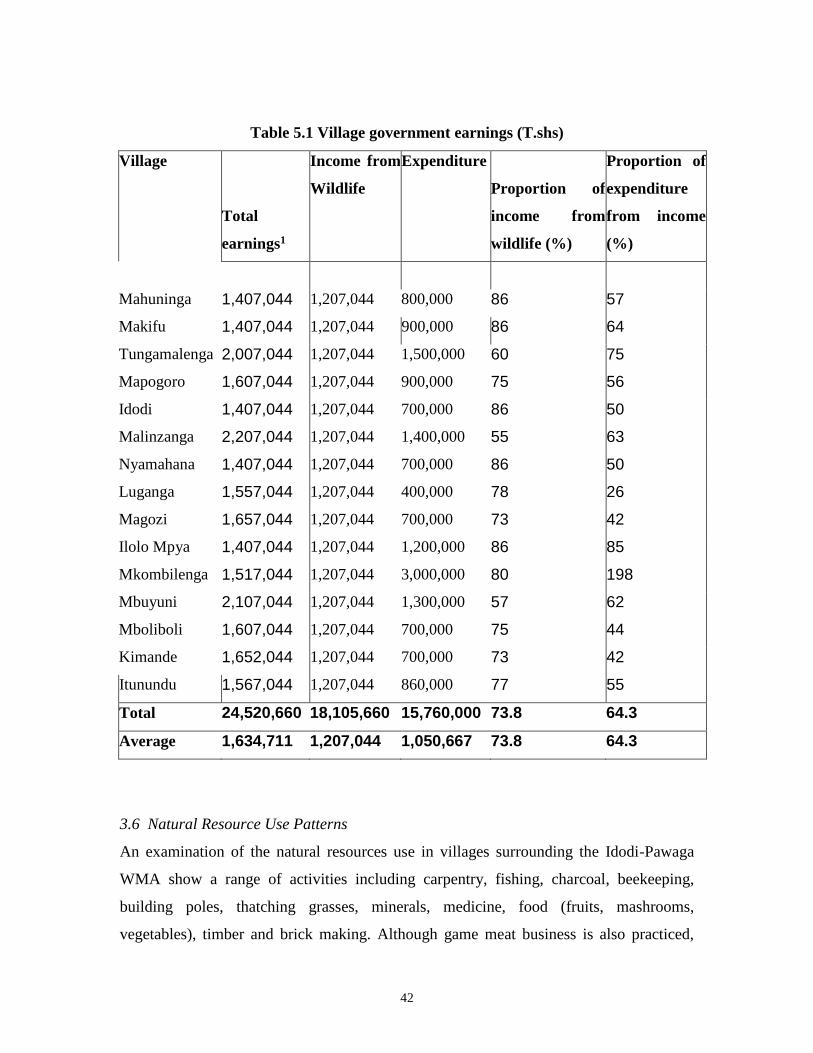
42
Table 5.1 Village government earnings (T.shs)
Village
Total
earnings1
Income from
Wildlife
Expenditure
Proportion of
income from
wildlife (%)
Proportion of
expenditure
from income
(%)
Mahuninga 1,407,044 1,207,044 800,000 86 57
Makifu 1,407,044 1,207,044 900,000 86 64
Tungamalenga 2,007,044 1,207,044 1,500,000 60 75
Mapogoro 1,607,044 1,207,044 900,000 75 56
Idodi 1,407,044 1,207,044 700,000 86 50
Malinzanga 2,207,044 1,207,044 1,400,000 55 63
Nyamahana 1,407,044 1,207,044 700,000 86 50
Luganga 1,557,044 1,207,044 400,000 78 26
Magozi 1,657,044 1,207,044 700,000 73 42
Ilolo Mpya 1,407,044 1,207,044 1,200,000 86 85
Mkombilenga 1,517,044 1,207,044 3,000,000 80 198
Mbuyuni 2,107,044 1,207,044 1,300,000 57 62
Mboliboli 1,607,044 1,207,044 700,000 75 44
Kimande 1,652,044 1,207,044 700,000 73 42
Itunundu 1,567,044 1,207,044 860,000 77 55
Total 24,520,660 18,105,660 15,760,000 73.8 64.3
Average 1,634,711 1,207,044 1,050,667 73.8 64.3
3.6 Natural Resource Use Patterns
An examination of the natural resources use in villages surrounding the Idodi-Pawaga
WMA show a range of activities including carpentry, fishing, charcoal, beekeeping,
building poles, thatching grasses, minerals, medicine, food (fruits, mashrooms,
vegetables), timber and brick making. Although game meat business is also practiced,
43
many villages were not ready to mention or provide actual figures due to the fact that it is
performed illegally. As a result, they are feared that our investigations might be for the
government. Results from households show that over 80% of the population most of this
being used in subsistence level. Any attempt to capture natural resource consumption
rates failed because: First natural resource is used mainly on subsistence level. Where it
is used on business, people are reluctant to disclose quantities and money incomes due to
fear of arrest by the government. Also farmers do not have tradition of keeping records.
3.7 Mechanisms for Natural Resource Access
All villages have almost similar procedures for natural resource extraction. Natural
resource for home use e.g fuelwood collection, building poles, thatching grass, food etc,
the villagers do extract them without any permission. For petty business related
resources, the villagers need to apply through the village governments and pay a fee. For
certain type of natural resource e.g wild animals or cutting trees for timber the permission
has to come from the director for wildlife and District Natural Resource Office,
respectively. Nevertheless, despite the existing laws and by-laws for natural resource use,
there is illegal extraction of resources in many villages visited suggesting that either the
laws/by-laws are not available or there is no incentive to enforce them due to reasons
such as the cost of enforcing outweighs benefits.
3.8 Marketing
Most of the product that goes through markets is maize, rice, beans and millets. Also live
animals and livestock products such as meat, milk, skins etc.
3.8.1 Transport as market availability factor
Generally, transport system is very poor. The Idodi-Pawaga villages are far from town on
a road, which becomes very difficult to pass during the wet season. Each division of
Idodi and Pawaga depend on one bus only. Because of this transport costs to Iringa town
is very difficult and expensive. It cost about T.shs 4400/= for a return trip and about T.shs
1500-2000 per sack (of 90kgs) of grains. These transport costs are translated themselves
in prices received by farmers which is very low (Section 6.2).
44
3.8.2 Marketing
Agricultural products are marketed by private traders and periodic markets (magulio).
The major complains from farmers is low prices offered by traders relative to the cost of
production. During the harvesting periods prices are very low and farmers sells their rice
at a price of 7000/= per one sack while the same quantity is sold at 16,000/= during the
scarcity period. For maize it is 6000/= and 10,000/= during harvest and lean seasons,
respectively . Nevertheless, due to high demand for cash as well as lack of efficient
storage facilities, a high proportion of farmers sell their produce immediately after
harvest and as a result, they get very low prices. Villages which are located off from
major roads and towns (e.g Mboliboli) are the most hit by marketing problems. Poor
roads and infrastructure also limits farmers from producing potential high value but
perishable crops such as tomatoes and vegetables because they can’t sell easily (URT
1996).
The marketing situation is also not favourable for livestock keepers who complain that
prices are so low that they can’t sell their cows for enough money to buy food. The prices
for livestock keepers are very varied ranging from as low as 30,000/= to 150,000/=
depending on the size of the cow and buyers availability. According to the livestock
keepers, cattle buyers come from Iringa town, they know to each other and the
auctioneer, and therefore they can easily collude for low prices.
It is important to note that good markets for livestock could lead to sustainability of the
WMAs. High price for livestock will provide incentive for livestock keepers to sell their
cattle in large numbers. As a result, this will lead to availability of beef or goat meat at
affordable prices and therefore reduce pressures for bush meat as close substitute. Also
selling large number of animals by livestock keepers will enable them to purchase
enough food from farmers thereby increasing local markets for farmers. Another
advantage is that, high incentive to sell livestock may reduce grazing pressure on WMAs,
which is good for wild animals.
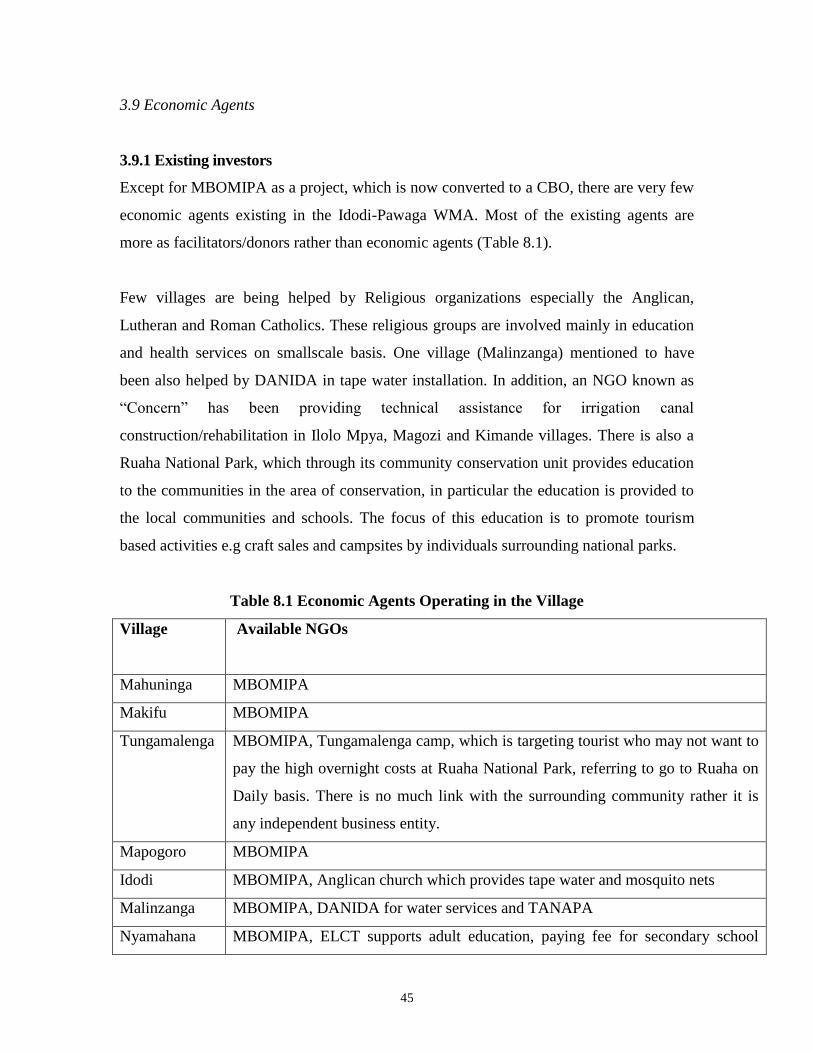
45
3.9 Economic Agents
3.9.1 Existing investors
Except for MBOMIPA as a project, which is now converted to a CBO, there are very few
economic agents existing in the Idodi-Pawaga WMA. Most of the existing agents are
more as facilitators/donors rather than economic agents (Table 8.1).
Few villages are being helped by Religious organizations especially the Anglican,
Lutheran and Roman Catholics. These religious groups are involved mainly in education
and health services on smallscale basis. One village (Malinzanga) mentioned to have
been also helped by DANIDA in tape water installation. In addition, an NGO known as
“Concern” has been providing technical assistance for irrigation canal
construction/rehabilitation in Ilolo Mpya, Magozi and Kimande villages. There is also a
Ruaha National Park, which through its community conservation unit provides education
to the communities in the area of conservation, in particular the education is provided to
the local communities and schools. The focus of this education is to promote tourism
based activities e.g craft sales and campsites by individuals surrounding national parks.
Table 8.1 Economic Agents Operating in the Village
Village Available NGOs
Mahuninga MBOMIPA
Makifu MBOMIPA
Tungamalenga MBOMIPA, Tungamalenga camp, which is targeting tourist who may not want to
pay the high overnight costs at Ruaha National Park, referring to go to Ruaha on
Daily basis. There is no much link with the surrounding community rather it is
any independent business entity.
Mapogoro MBOMIPA
Idodi MBOMIPA, Anglican church which provides tape water and mosquito nets
Malinzanga MBOMIPA, DANIDA for water services and TANAPA
Nyamahana MBOMIPA, ELCT supports adult education, paying fee for secondary school
46
students. About 4 students per parish/year
Luganga MBOMIPA, RC-paying fee for secondary school students, constructed a nursery
school
CONCERN-agricultural irrigation and marketing.
Magozi MBOMIPA, Anglican-Church provides mosquito nets, Concern-irrigation canal
Ilolo Mpya MBOMIPA, Concern-provides technical assistance on irrigation canal
construction, Religious institutions sponsor students from poor families
Mkombilenga MBOMIPA
Mbuyuni MBOMIPA
Mboliboli MBOMIPA, Anglican Church is building a health center for the village
Kimande MBOMIPA, Concern –irrigation farming.
Itunundu MBOMIPA
Mafuluto MBOMIPA
Isela MBOMIPA
Kisanga MBOMIPA
Kinyika MBOMIPA
3.9.2 Other economic agents
There is one private tourist camp at Tungamalenga. The camp comprises 6 rooms with
en-suites as well as attractive camping sites with very good clean facilities. They are
targeting tourists who do not want to pay the high overnight costs in Ruaha, preferring to
go into Ruaha National Park on daily basis (MEMA, 2001). There was also a small craft
shop with craft from all over Tanzania for sale. In addition, there are two national parks.
Ruaha national parks which is found in the west and the Udzungwa national park, which
is found in the east. Also there is the Lunda Mwambi game controlled area.
3.9.3 Interactions between economic agents and local people
Following interviews with villagers there is no direct link between these economic agents
and local people in the area. Although, villagers might be getting some incomes as
commission/fee paid to the government authorities by investors which is the partly
47
channeled back to local communities in the area, their role to villages are not yet known
by villagers. Villagers as government are not involved whatsoever in these investments
although some individuals are getting employments both skilled and unskilled. It is clear
that there is no any sort of joint venture in the villages visited. For the case of
facilitators/donors there is some cost sharing mechanisms. The donors are paid funds for
technical support or material purchase and the local communities are contributing in kind
by providing labour power. They can also contribute financially from their VG earnings.
3.10 Financial Facilities
Formal financial facilities do not exist in Idodi-Pawaga WMA. This is because the money
circulation is very low to attract financial investors. Also many villagers do not have
collateral for loans applications in formal financial institutions, which creates
disincentives for establishing financial institutions in rural areas both for local people and
for financial agents.
However, informal money lending is quite common in the WMA. About 40% of the
respondents had access to money borrowing where a high proportion received from
family member and friends and only one person out of 97 households had a loan from
Bank. The money borrowed ranged from T.shs 5,000 to T.shs 20,000. These findings
suggest that the demand for credit is high and the main source of credit is family member
or friends. One focus of WMAs could be for the villages to lend money to their people to
help eradicate poverty. The WMAs also could be playing a role of providing guarantee to
its people for formal loans. Table 9.1 summarizes credit sources by respondents.
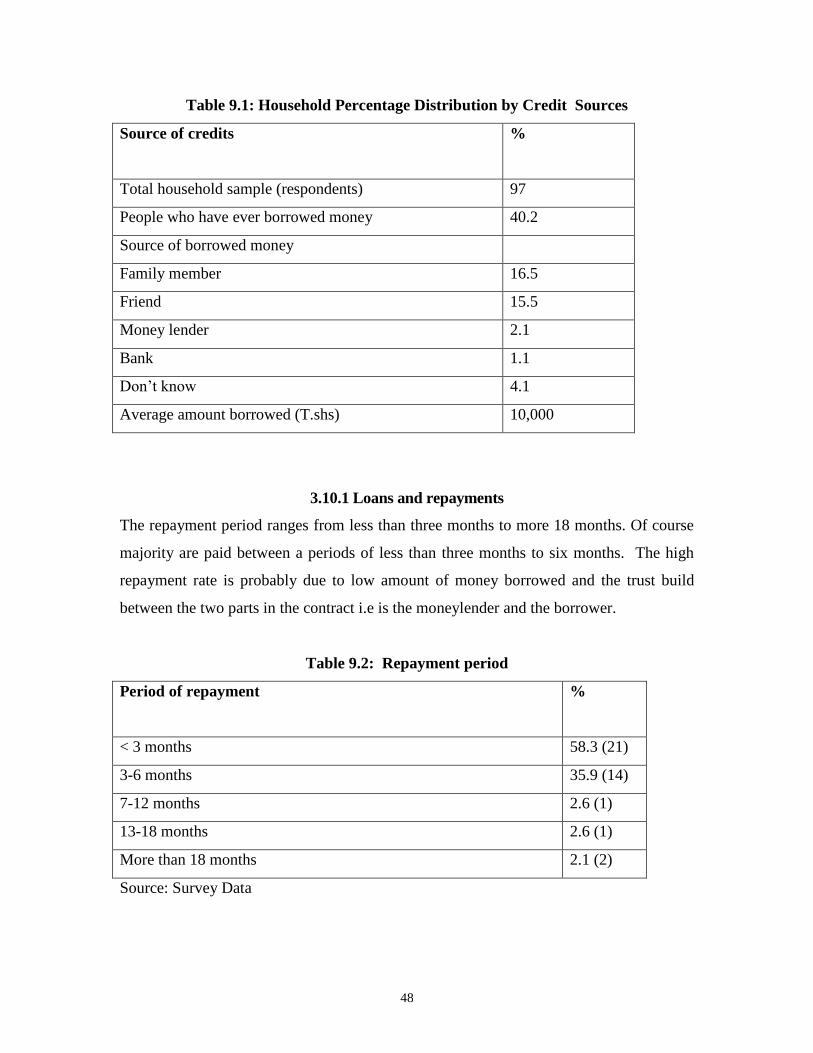
48
Table 9.1: Household Percentage Distribution by Credit Sources
Source of credits %
Total household sample (respondents) 97
People who have ever borrowed money 40.2
Source of borrowed money
Family member 16.5
Friend 15.5
Money lender 2.1
Bank 1.1
Don’t know 4.1
Average amount borrowed (T.shs) 10,000
3.10.1 Loans and repayments
The repayment period ranges from less than three months to more 18 months. Of course
majority are paid between a periods of less than three months to six months. The high
repayment rate is probably due to low amount of money borrowed and the trust build
between the two parts in the contract i.e is the moneylender and the borrower.
Table 9.2: Repayment period
Period of repayment %
< 3 months 58.3 (21)
3-6 months 35.9 (14)
7-12 months 2.6 (1)
13-18 months 2.6 (1)
More than 18 months 2.1 (2)
Source: Survey Data
49
3.10.2 Poverty levels
Poverty as per National Poverty Eradication Strategy (1998) is defined as a state of
deprivation prohibitive of decent human life. In thus includes both inadequate income as
well as deficiencies in non-income human development attributes. The key dimension of
poverty identification are (i) inadequate income to purchase basic necessities, (ii)
deficiency in human capabilities (illiteracy, malnutrition, diseases etc) (ii) isolation and
vulnerability (social exclusion and dependency) and (iv) powerless and hopeless.
At national level in defining poor and non poor the following indicators has been used.
Rates of morbidity and mortality, prevalence of malnutrition, illiteracy, infant and
maternal mortality rates, life expectancy, housing standards, clothing, per capita income,
and expenditure, infrastructure. Other include fertility, lack of access to basic services
such as safe water, food security, and technology
In this study poverty assessment did not go in to such sophisticated kind of definition
mainly because of the limited time and resources. Instead the poverty levels for the
villages surrounding the Idodi-Pawaga WMA was assessed by investigating availability
of socio-economic services. At a household level a PRA techniques used villagers were
asked to list criteria for defining wealth/ poverty among themselves. Although the criteria
for defining wealth vs poverty were almost the same in all villages there was some
differences in terms of quantity. For example in some villages one modern house is
satisfactory indication of wealth while others were saying at least 5 modern houses for
one to be identified as a well off person.
3.11 Availability of Socio-Economic Services
All the villages visited complained about the inadequacy socio-economic services. Roads
were reported to be poor in all villages as well as water services. Although most villages
are supplied with tape water, they are not adequate and people resort to river water as
supplement, which is not safe. The common source of energy is fuel wood where almost
all the villagers use it. Charcoal is used by very few residents and kerosene is used
mainly for illumination. These findings are consistent by those obtained at household
50
level where 100% of the respondents reported to have been using fuel wood as main
source of their energy for cooking. Health services are also very limited. Some villages
such as Makifu, Nyamahana, Mbuyuni and Magozi do not have any health centers. Even
in villages where health services exist they are under staffed and there is no medicine.
The same applies to education services. Mkombilenga and Mbuyuni do not have any
school while the rest villages have at least one primary school in their villages. However,
teachers, classrooms, desks were reported to be inadequate in every school. Shops and
viosks exist in many villages but they are not sufficient both in number and facilities
provided. Consequently, most villagers depend on periodic markets, which occur once
per month or they have to travel to Iringa town for attaining consumer goods and other
necessities. Table 9.0 displays social services in Idodi-Pawaga WMA.
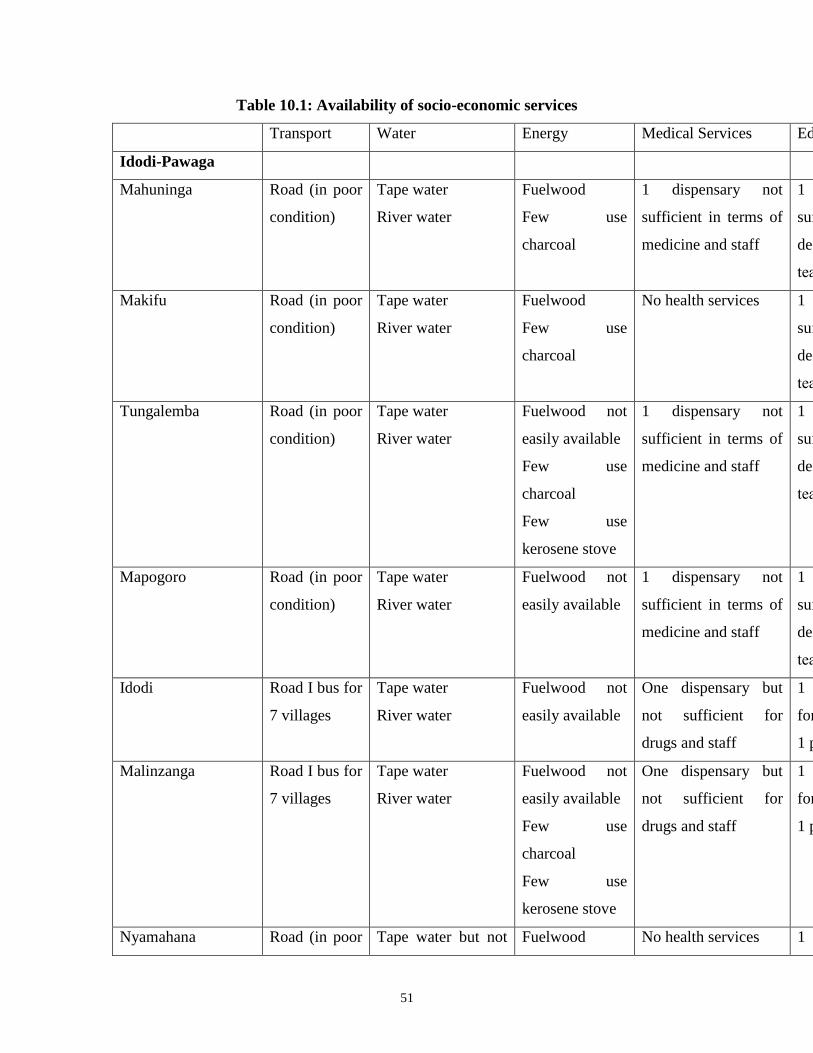
51
Table 10.1: Availability of socio-economic services
Transport Water Energy Medical Services Education Shops/Viosks
Idodi-Pawaga
Mahuninga Road (in poor
condition)
Tape water
River water
Fuelwood
Few use
charcoal
1 dispensary not
sufficient in terms of
medicine and staff
1 school not
sufficient in terms
desks, classrooms,
teachers’ houses
5
Makifu Road (in poor
condition)
Tape water
River water
Fuelwood
Few use
charcoal
No health services 1 school not
sufficient in terms
desks, classrooms,
teachers’ houses
3
Tungalemba Road (in poor
condition)
Tape water
River water
Fuelwood not
easily available
Few use
charcoal
Few use
kerosene stove
1 dispensary not
sufficient in terms of
medicine and staff
1 school not
sufficient in terms
desks, classrooms,
teachers’ houses
4
Mapogoro Road (in poor
condition)
Tape water
River water
Fuelwood not
easily available
1 dispensary not
sufficient in terms of
medicine and staff
1 school not
sufficient in terms
desks, classrooms,
teachers’ houses
7
Idodi Road I bus for
7 villages
Tape water
River water
Fuelwood not
easily available
One dispensary but
not sufficient for
drugs and staff
1 secondary school
for the Division and
1 primary school
8
Malinzanga Road I bus for
7 villages
Tape water
River water
Fuelwood not
easily available
Few use
charcoal
Few use
kerosene stove
One dispensary but
not sufficient for
drugs and staff
1 secondary school
for the Division and
1 primary school
4
Nyamahana Road (in poor Tape water but not Fuelwood No health services 1 secondary school 2
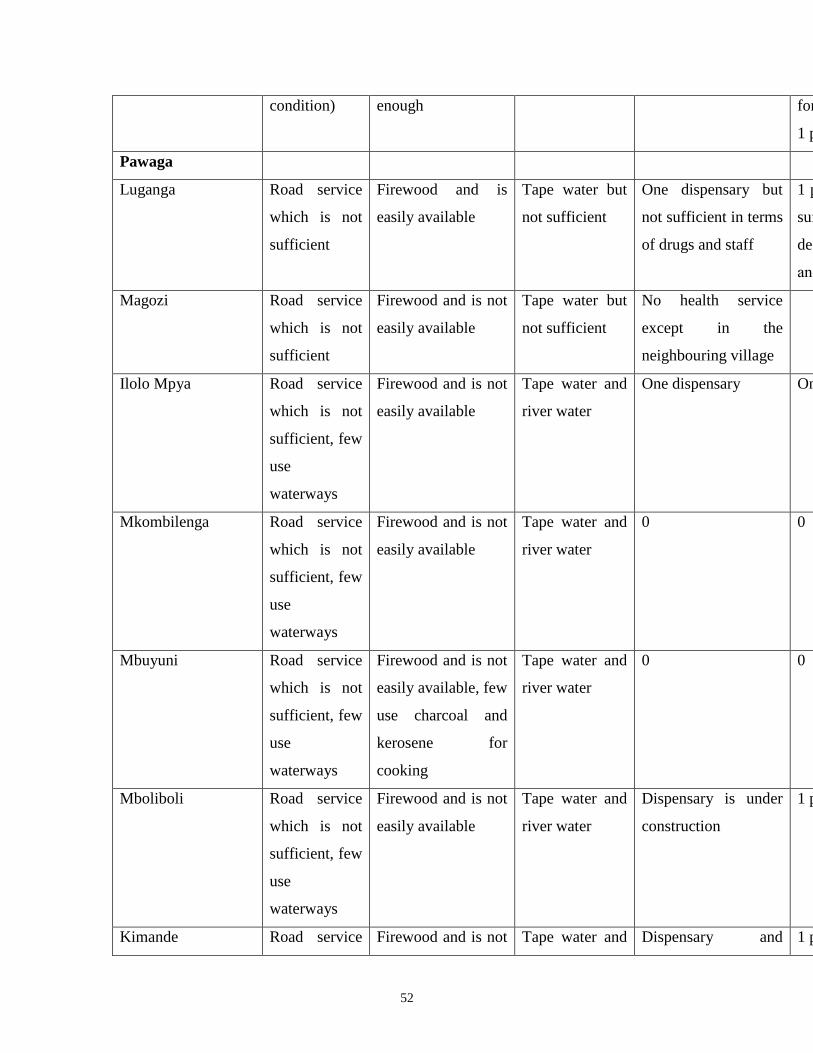
52
condition) enough for the Division and
1 primary school
Pawaga
Luganga Road service
which is not
sufficient
Firewood and is
easily available
Tape water but
not sufficient
One dispensary but
not sufficient in terms
of drugs and staff
1 primary school not
sufficient in terms of
desks, classrooms
and teachers’ houses
2
Magozi Road service
which is not
sufficient
Firewood and is not
easily available
Tape water but
not sufficient
No health service
except in the
neighbouring village
Ilolo Mpya Road service
which is not
sufficient, few
use
waterways
Firewood and is not
easily available
Tape water and
river water
One dispensary One primary school 1
Mkombilenga Road service
which is not
sufficient, few
use
waterways
Firewood and is not
easily available
Tape water and
river water
0 0 0
Mbuyuni Road service
which is not
sufficient, few
use
waterways
Firewood and is not
easily available, few
use charcoal and
kerosene for
cooking
Tape water and
river water
0 0 3
Mboliboli Road service
which is not
sufficient, few
use
waterways
Firewood and is not
easily available
Tape water and
river water
Dispensary is under
construction
1 primary school 5
Kimande Road service Firewood and is not Tape water and Dispensary and 1 primary school 7
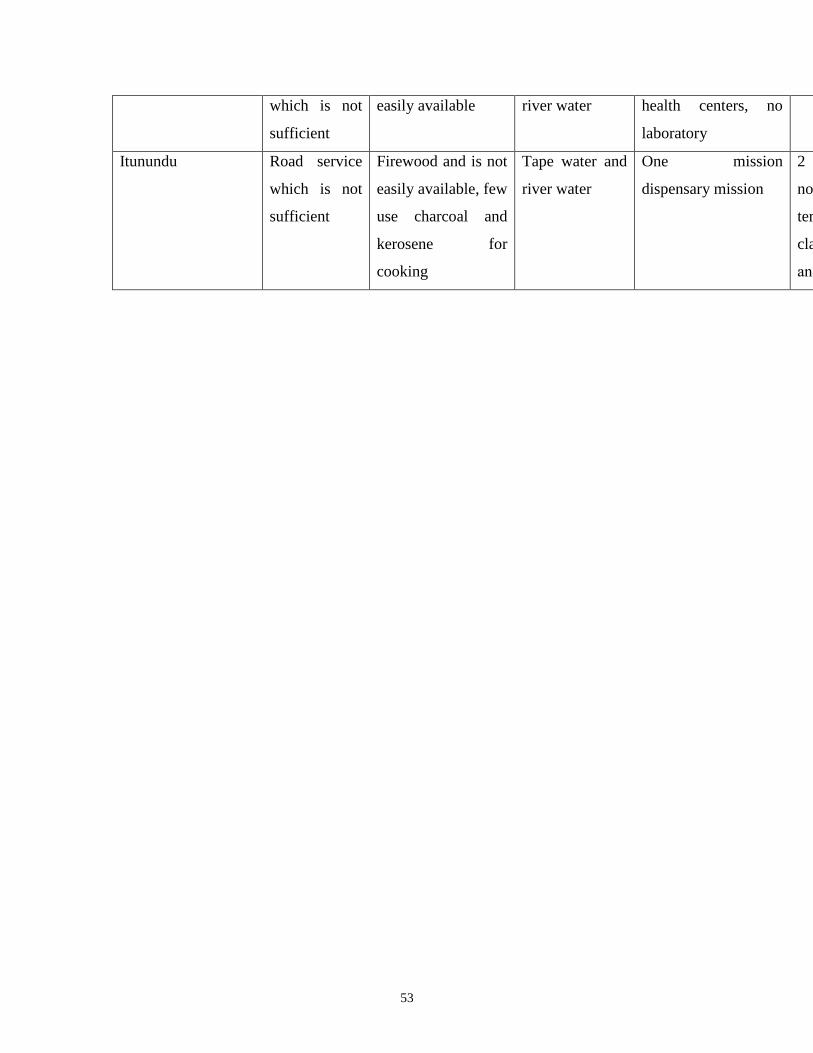
53
which is not
sufficient
easily available river water health centers, no
laboratory
Itunundu Road service
which is not
sufficient
Firewood and is not
easily available, few
use charcoal and
kerosene for
cooking
Tape water and
river water
One mission
dispensary mission
2 primary schools,
not adequate in
terms of teachers,
classrooms, desks
and teachers’ houses
5
54
3.12 Household Poverty Levels
Basing on PRA approach poverty in Idodi-Pawaga is widely spread and pervasive. Using
their own criteria (e.g ownership of large number of land, cattle, shops, modern house,
milling machine, cars) a high proportion of over 75% of the villages are poor with very
few appearing to be better off. This number is likely to be higher when one compares
with the national standard as well as international standards of poverty monitoring
indicators such as access to health services, education, life expectancy, under five
mortality rate and access to clean water. These findings are consistent with the household
surveys where assessment on income poverty show over 80% of the respondents are poor
earning less than one dollar a day.
The poverty levels were also revealed in terms of food consumption patterns. Although
people appeared to have wide range of food consumption patterns, food composition is
dominated by starchy with very little protein and fat sources. Many villagers have two
meals a day i.e Lunch and Dinner, which is reduced to one meal during lean seasons. The
few with three meals per day make a small proportion of the villagers of the area and in
most cases these are civil servants employed by the local government or by NGOs in the
area.
As already pointed out, many villages do not have health services and the few with them
are lacking qualified personnel and drugs. Common diseases were reported to be malaria,
dysentery and typhoid. It was reported that at least half of the villages suffer from malaria
annually and a high proportion of this segment have repeated malaria incidences of about
3-4 times per year. According to villagers, the minimum cost of treating malaria is T.shs
1,000 and several people in the households can fall sick of malaria. Thus, expenditure on
health services by rural households is high. It was also reported that about sixty percent
of the population fall sick of dysentery, typhoid and diarrhea and the cost of treating these
diseases is even higher where some people have spent about 45,000/= for treating the
diseases. AIDS pandemic was also reported to be serious where about 10% of the
population were reported to be affected. High rate of disease infections not only affected
household budgets but also labour force availability, which leads to low productivity and
55
increases poverty levels in the area. Trend on the levels of poverty as well as diseases
incidences should form part of poverty monitoring indicators in the would be WMA.
Table 10.2 displays wealth-ranking criteria for villages in Idodi-Pawaga WMA.
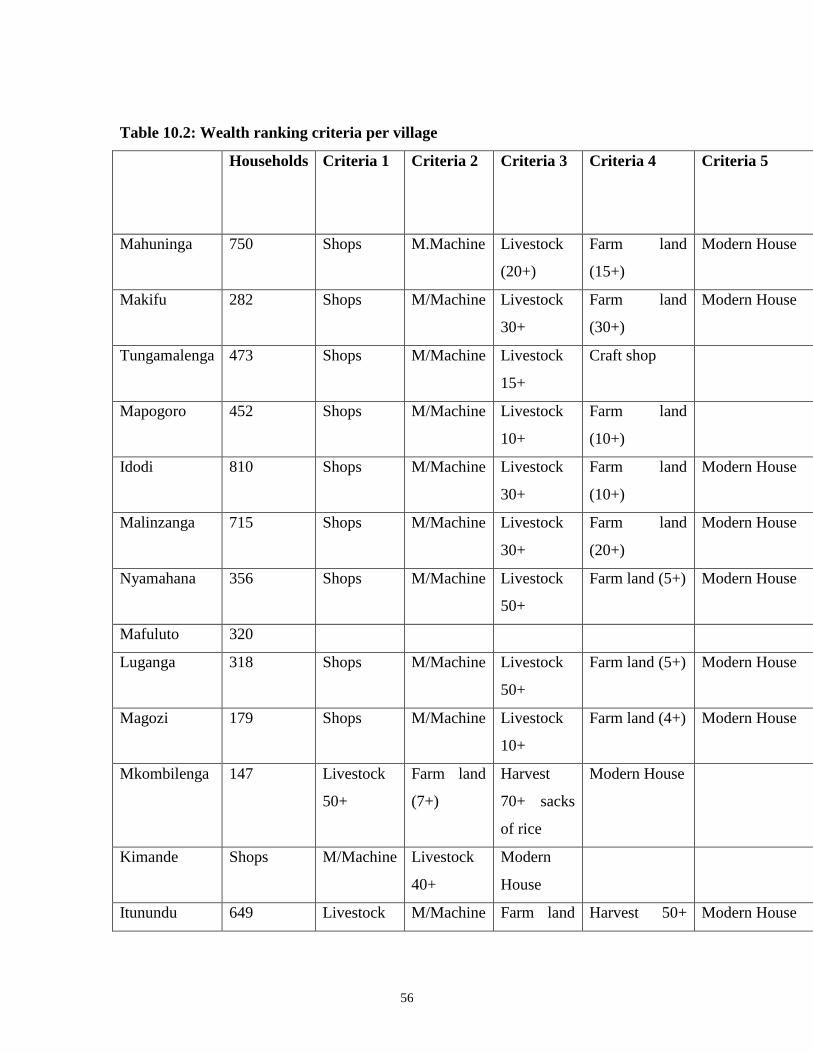
56
Table 10.2: Wealth ranking criteria per village
Households Criteria 1 Criteria 2 Criteria 3 Criteria 4 Criteria 5 Criteria 6 Proportion of
poor people
(%)
Mahuninga 750 Shops M.Machine Livestock
(20+)
Farm land
(15+)
Modern House 80
Makifu 282 Shops M/Machine Livestock
30+
Farm land
(30+)
Modern House 90
Tungamalenga 473 Shops M/Machine Livestock
15+
Craft shop 63
Mapogoro 452 Shops M/Machine Livestock
10+
Farm land
(10+)
85
Idodi 810 Shops M/Machine Livestock
30+
Farm land
(10+)
Modern House Car 74
Malinzanga 715 Shops M/Machine Livestock
30+
Farm land
(20+)
Modern House Car 42
Nyamahana 356 Shops M/Machine Livestock
50+
Farm land (5+) Modern House 89
Mafuluto 320
Luganga 318 Shops M/Machine Livestock
50+
Farm land (5+) Modern House Cash saving
100000+
80
Magozi 179 Shops M/Machine Livestock
10+
Farm land (4+) Modern House 71
Mkombilenga 147 Livestock
50+
Farm land
(7+)
Harvest
70+ sacks
of rice
Modern House 75
Kimande Shops M/Machine Livestock
40+
Modern
House
65
Itunundu 649 Livestock M/Machine Farm land Harvest 50+ Modern House Cash saving 75
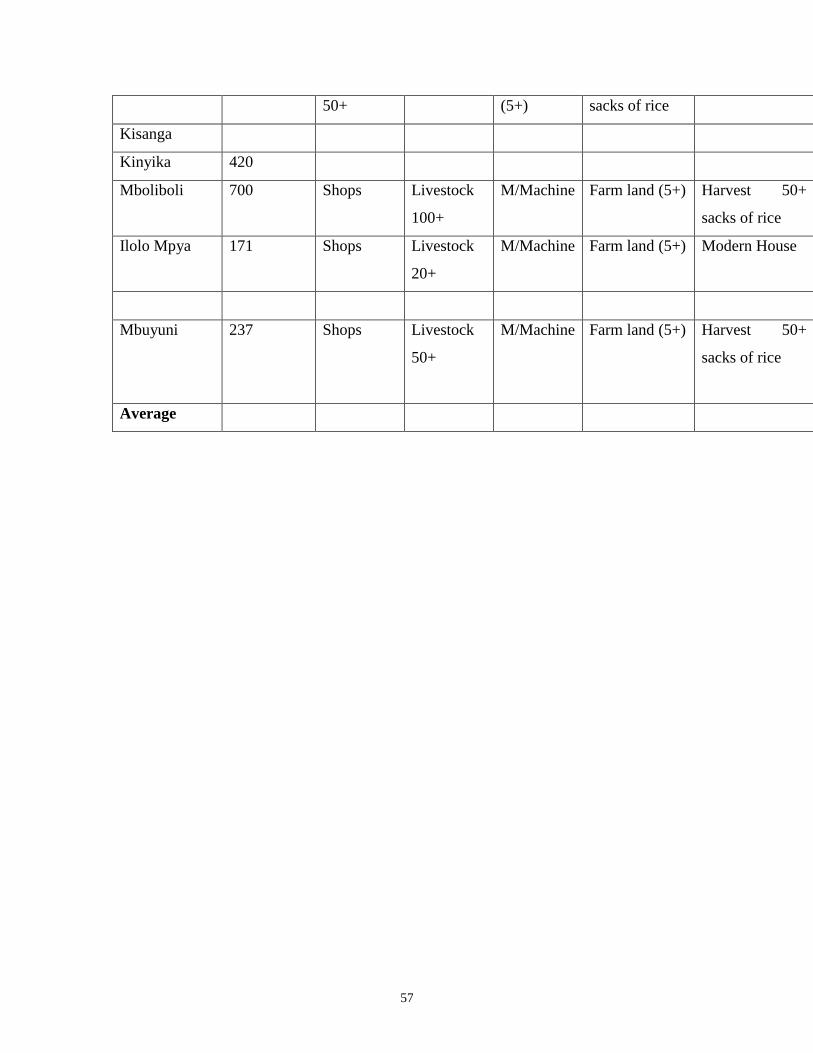
57
50+ (5+) sacks of rice 1000000+
Kisanga
Kinyika 420
Mboliboli 700 Shops Livestock
100+
M/Machine Farm land (5+) Harvest 50+
sacks of rice
Modern
House
80
Ilolo Mpya 171 Shops Livestock
20+
M/Machine Farm land (5+) Modern House 88
Mbuyuni 237 Shops Livestock
50+
M/Machine Farm land (5+) Harvest 50+
sacks of rice
Cash
income
1,000,000
75
Average 75.5
58
3.13 Opportunities to Increase VG Incomes
3.13.1 Introduction
Given their similar ecological background, economic opportunities are likely to be
similar in all WMAs. Nevertheless, the efficiency in running these economic activities is
likely to differ from one WMA to another depending on different reasons including
wildlife richness, type of wildlife existing, infrastructure, knowledge and experience in
conservation. To understand which WMA is efficient in what economic activity may
need a detailed study cost benefit and comparative advantages.
A high proportion of the villages visited do not have any idea on how they could increase
their incomes from wildlife utilisation following the implementation of the WMAs.
Indeed, many villages were not able to say anything on how they are going to improve
their VGs’ incomes from WMA. Rather, they were asking the consultants to help them
identify the opportunities on their behalf. Nevertheless, after brainstorming with the
researchers the villagers were able to mentioned economic opportunities such as
ecotourism, tourism related to water falls attractions, climbing hills, campsites and
business on live birds and photographing. People expressed interest of practicing
beekeeping. Currently, very few appear to practice it due to lack of knowledge on the
sector. Also fishing activities is one of the potential areas to increase wildlife income and
nutrition by villagers. The economic potential are explained in details in the following
sections.
3.13.2 Fishing
Idodi Division has got a big number of water sources and fish farming is a viable activity.
It is anticipated that fishing and fish farming activities will improve the welfare of those
who are involved and thus improve the living standard. Currently, fish farming has been
started in Idodi Division. There are 16 ponds in 5 villages (Isack 2001).
Also fishing activities is taking place in little ruaha where people catch fish for
subsistence use. These include kambale, tilapia, katoga and nchema. However, fish are
59
only available during rainy season when river fills up. In some villages fishing is said to
be destructive and unsustainable. The fishermen build barriers across the river, use
spears, set up fish traps, use nets or kangas and sometimes use poisoning materials.
In Tungamalenga village, fish are caught from the river Tungamalenga and also
sometimes from irrigation canal in the rainy season. The fish caught are mainly kambale,
dagaa, ngogo. They catch fish using hooks, khangas, and traps. Constraint towards
fishing is lack of expertise. They catch fish indiscriminately, even the little ones. In the
months when fish are available people eat fish every day. Table 11.1 the scale of fishing
activities in Idodi-Pawaga WMA.
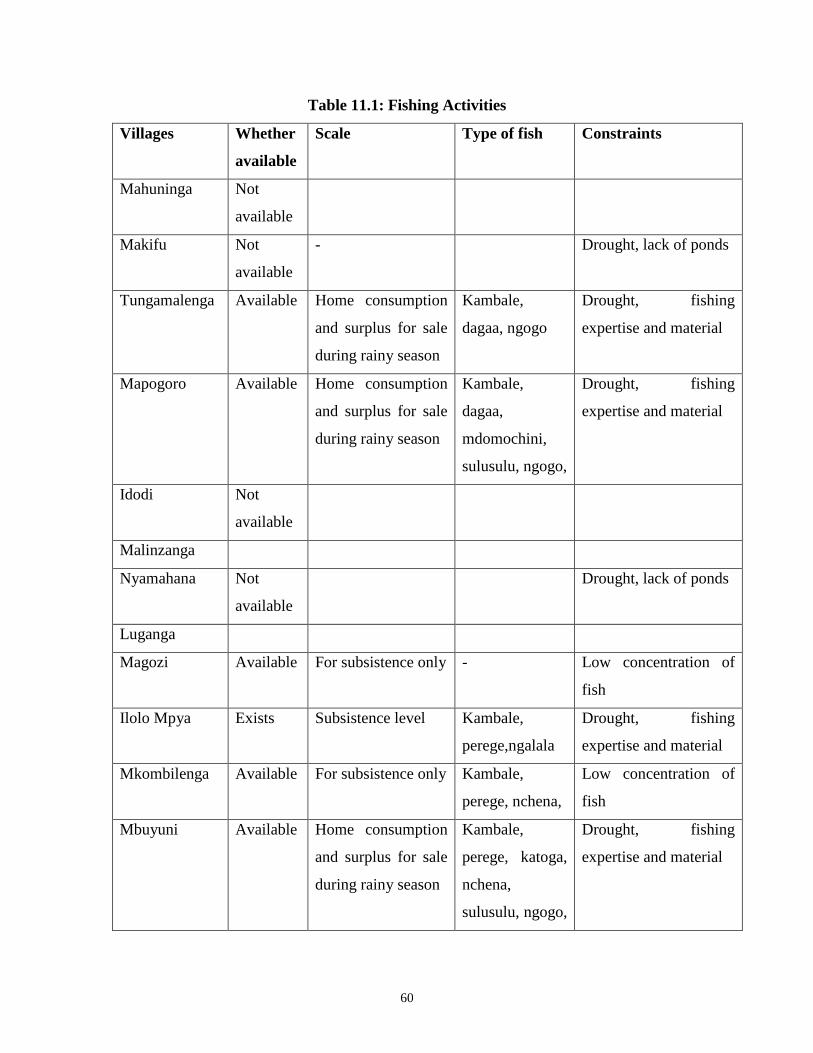
60
Table 11.1: Fishing Activities
Villages Whether
available
Scale Type of fish Constraints
Mahuninga Not
available
Makifu Not
available
- Drought, lack of ponds
Tungamalenga Available Home consumption
and surplus for sale
during rainy season
Kambale,
dagaa, ngogo
Drought, fishing
expertise and material
Mapogoro Available Home consumption
and surplus for sale
during rainy season
Kambale,
dagaa,
mdomochini,
sulusulu, ngogo,
Drought, fishing
expertise and material
Idodi Not
available
Malinzanga
Nyamahana Not
available
Drought, lack of ponds
Luganga
Magozi Available For subsistence only - Low concentration of
fish
Ilolo Mpya Exists Subsistence level Kambale,
perege,ngalala
Drought, fishing
expertise and material
Mkombilenga Available For subsistence only Kambale,
perege, nchena,
Low concentration of
fish
Mbuyuni Available Home consumption
and surplus for sale
during rainy season
Kambale,
perege, katoga,
nchena,
sulusulu, ngogo,
Drought, fishing
expertise and material
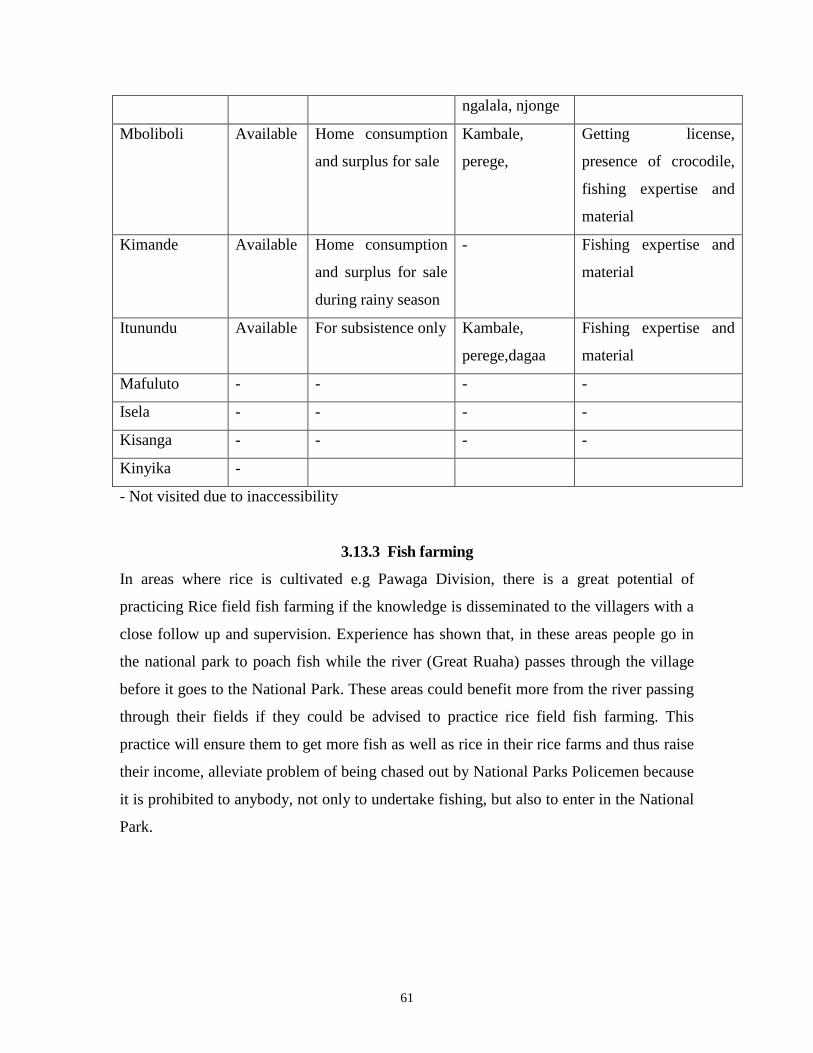
61
ngalala, njonge
Mboliboli Available Home consumption
and surplus for sale
Kambale,
perege,
Getting license,
presence of crocodile,
fishing expertise and
material
Kimande Available Home consumption
and surplus for sale
during rainy season
- Fishing expertise and
material
Itunundu Available For subsistence only Kambale,
perege,dagaa
Fishing expertise and
material
Mafuluto - - - -
Isela - - - -
Kisanga - - - -
Kinyika -
- Not visited due to inaccessibility
3.13.3 Fish farming
In areas where rice is cultivated e.g Pawaga Division, there is a great potential of
practicing Rice field fish farming if the knowledge is disseminated to the villagers with a
close follow up and supervision. Experience has shown that, in these areas people go in
the national park to poach fish while the river (Great Ruaha) passes through the village
before it goes to the National Park. These areas could benefit more from the river passing
through their fields if they could be advised to practice rice field fish farming. This
practice will ensure them to get more fish as well as rice in their rice farms and thus raise
their income, alleviate problem of being chased out by National Parks Policemen because
it is prohibited to anybody, not only to undertake fishing, but also to enter in the National
Park.
62
3.13.4 Tourism
There are initiatives to establish a local tourism association where 2 members from each
of the 19 villages would join the association. The planned tourism activities includes the
conservation and better control of game and investments in campsites, guided
photographic tours and craft. The benefits from tourism enterprises will be going to
village councils to support community development. They had decided that funding for
the tourism projects should come from money raised through their wildlife quota, they
were also looking for some support from NGOs community.
3.13.5 Tourist and resident hunting
Currently, the Idodi-Pawaga WMA through MBOMIPA sells its quota based hunting
rights to the tourist hunting companies and/or resident hunting. This activity should be
enhanced as it provides economic opportunity for the WMA. Hunting has the advantage
of generating considerable revenues right from the beginning with little or no investments
needed by the AA. The resource is already presented and available for operation. Hunting
can generate profits early that communities can and should reinvest into the other
economic opportunities. Nevertheless, hunting tourism to be sustainable, consumptive
use of wildlife should not jeopardize the biological and ecological basic requirements.
This could be achieved through the systems of monitoring the game populations, and
must be jointly developed and implemented by the WD and the AAs along with the
system of enforcing quotas.
3.13.6 Photo tourism
Photo tourism is another opportunity for income raising in Idodi-Pawaga WMA. The
high densities of wildlife areas or attractive birds could be targeted for photographic
operations. Christopherson et. al., (2000), proposes for example to extend buffer zone
around national parks from one kilometer to five kilometers. Where a WMA is situated
directly adjacent to a national park a small area of 5km wide buffer zone around national
parks could be zoned for limited photo tourism. In this respect, photo safari companies
should have small-tented camps located well inside such extended buffer zones, whose
guests remain inside the small-gazetted photo tourism area and only access the camps
63
through the park and only venture inside the park or protected area. These small-gazetted
areas would have to be off limits for the hunter. To avoid conflicts between the two
operations, conditions for hunting and photo safari companies should be clearly spelled
out in the lease contracts and be in compliance with the Tanzania law. Also tented camps
should not be too many in the buffer zone to avoid hindering the movement of the game
between the protected area and the WMA hunting block.
3.13.7 Sport hunting
Sport hunting could be potentially another major earner of revenues in the WMA. For
instance, a report by MNRT (1996) estimates such an activity to generate revenue up to
US$ 40,000 per block per annum for surrounding communities in the SGM bufferzones.
The study also proposes that for such an activity to be efficient market forces should be
allowed for allocation and pricing of hunting blocks.
The issue of increasing supply of meat for community surrounding WMA could also
come from meat recovery from sport hunting. The great deal of the meat arising from
sport hunting operations is presently wasted, for various practical reasons (MNRT 1996).
Given the nutritional status of the surrounding communities where meat is scarce, this
could help reduce the gap.
3.13.8 Live animal capture and Sale
This activity AA could be receiving quota from WD to capture and export live animals.
The AA could consider this option along with the hunting and cropping options or some
combination with the three. Quotas for capture and sale of non game animals (reptiles
etc) could also be established for the WMA
3.14 Emerging Issues
Based on the above findings and field visits the following are the emerging issues
observed:
Level of knowledge and awareness regarding these new concepts of WMA and
AA by villagers including village governments is very low or non-existence. This may
64
affect local communities bargaining power relative to investors and joint ventures related
business.
Natural resource use by villagers is considerable but difficult to quantify and to
put in money terms because is used mainly on subsistence levels or used illegally.
Most of the natural resources is extracted free of charge because either by-laws
are not developed or they are not enforceable.
The capacity to keep records for incomes and expenditure by households and
village governments is very poor and in some villages not transparent enough.
A good proportion of the VG incomes seem to have been used in administrative
matters rather than villages’ development projects.
Capacity to identify economic opportunities for their WMA by villages is low
which may undermine their bargaining power with investors.
The benefits accruing from WMA are likely to benefit the community rather than
individual households especially in the initial years of implementation. Families that
depend on natural resource for subsistence may suffer following WMAs
implementations.
The efficiency in running economic activities is likely to differ from one WMA to
another depending on comparative advantages.
3.15 Conclusion
The Idodi-Pawaga WMA has made a good progress administratively. The original
MBOMIPA project has been converted to a CBO, which also acts as a facilitator. Natural
resource committees have been established in each village. Every village supplies 2 game
scouts for 10 days on rotational basis. They are only paid little allowances, which is not
65
enough to motivate them, and make them active for the job. Also poor working facilities
such as transport, communication, uniform, food have constrained performance of game
scouts in performing anti-poaching business.
During this study there was no any joint venture existing between villagers and investors.
What was seen is cost sharing between government/donors and local communities e.g in
areas of education, health and irrigation projects. In most cases the donor/facilitator
provides funds or expertise and the communities provide labour force.
MBOMIPA on behalf of the villages sells the quota to the professional hunting
companies for money. The earned money is then distributed to all villages equally. About
T.shs 1 000 000 per year is given to each village. Income from other wildlife not
channeled through MBOMIPA is very low due to either non-existent or weak/un-
unenforceable by-laws.
Incomes and expenditure by village governments are not clear and transparent enough in
some villages . Also income from natural resource for developmental projects is not
clearly indicated which is difficult to make a follow-up. Proper monitoring of the impact
of WMAs concept will only be possible if there is proper record keeping in villages’
incomes and expenditures.
Although many villages are likely to benefit from WMA implementation, most of these
benefits will be accrued at communal level and not household. There will be losers from
natural resource livelihoods e.g food extraction and this category of people may need to
be compensated.
Crop destruction by wild animals is considerable in all villages visited. These affect
villagers’ crop harvest and incomes. The destruction by wild animals is also experienced
by livestock keepers where several animals has been killed by wild animals such as Lion,
Leopards etc.
66
Due to similar ecological background, the economic opportunities are likely to be similar
in all WMAs. Nevertheless, the efficiency in running these economic activities is likely
to differ from one WMA to another depending on different reasons including wildlife
richness, type of wildlife existing, infrastructure, knowledge and experience in
conservation.
3.16 Recommendation
There should be immediate and extensive awareness raising programme for the villagers
surrounding the WMA and capacity building in WMA, AA and general managerial skills
for the key players of the VGs. This work should be performed by WD.
There should be trainings for households and VG in records keeping for incomes and
expenditure as well as quantity/volumes harvested, marketed or consumed. Also there
should be external board to audit VGs’ incomes and expenditures. This work should be
implemented by DW in collaboration with Ministry of Finance or Cooperatives.
The MNRT need to contract another firm (economic) to undertake a detailed study in all
WMAs case by case to establish cost benefit analysis and comparative advantages for
each WMA. This is important for each WMA to operate in areas, which is more efficient
and competitive. Comparative advantage could be in terms wildlife resource endowed,
transport advantage, time invested in the business etc.
The WD should look on ways of compensating households, which their livelihood to a
high extent depends on natural resource use. This could be through providing alternative
livelihoods.
3.17 Way Forward
The most deficiency observed in the field is the knowledge gap and awareness about the
whole idea of WMA and AA by villages. With exception of the villages’ chairmen who
attended the inauguration ceremony by the MNRT in Dar es Salaam, a high proportion of
the villagers including VGs do not know exactly what is going on and how this is going
67
to affect their socio-economic lives. Therefore, awareness raising for the whole
community surrounding WMAs and capacity building for key players in the VG should
be the starting point of WMA implementation by the government, donor community and
NGOs. Educating villagers on the WMA and associated packages is also important for
bargaining power with investors. Education also should be extended to teaching people
basic principals of project appraisal and book-keeping or general management skills.
Field observation show that VGs cannot keep even simple records for income and
expenditure for their villages. Proper monitoring of the impact of WMAs concept will
only be possible if there is proper record keeping in villages. Record keeping techniques
should extend to households in terms of harvests, marketed and consumptions.
Help villages to develop by-laws for natural resources utilization as incentives to increase
VG incomes and sustainable utilisation of natural resource. Most villages do not know
how they will increase their incomes based on this new policy of WMA. At least in the
initial years of WMAs implementation each WMA should be allocated with a facilitator
that could help them in identifying and implementing economic opportunities.
Since level of investment and joint venture between investors and local communities is
almost in-existent at least to the knowledge of villagers, the government should try to
build capacity in these aspects providing skills related to investment and joint ventures.
4.0 ECOLOGICAL ASPECTS
4.1 Situation Analysis
The proposed pilot WMA is within the Lunda Mkwabi Game Controlled Area
(LMGCA). The communities have developed a memorandum of understanding to jointly
manage the area as a Wildlife Management Area. The total area of the Game Controlled
Area is 4046 km2 (see map 1). The proposed pilot WMA has both ecological and social
benefits to Ruaha National Park. The biological, or ecological benefits are a result of the
territorial expansion of the protected area that keeps human impact further away. Some of
these benefits are:
68
Physical barrier from human encroachment
Enlarge the natural habitat and reduce edge effects
Enhance the environmental services provided by the reserved
The institutional set up put in place to manage wildlife resources is very well organized,
and the level awareness seems to be high. If given the necessary financial and technical
support, these communities can manage wildlife resources reasonably well.
4.2 Ecological Data and Analysis
4.2.1 The Current Ecological Status of the Area
Overview
The area is characterized by semi-arid to arid climate, with a rainfall of approximately
500mm per rainy season. The vegetation is varied ranging from Acacia woodlands to
miombo woodlands dominated by Acacia, Commiphora, Combretum and Brachystegia
species. Land use is extensive, ranging from subsistence agriculture, agro-pastoralism, to
pastoralism.
The area is within the miombo woodlands zone. Ecological studies indicate that, the
dynamics of Miombo are strongly influenced by human activities. The structure of the
woodlands tend to be substantially modified through slash and burn agriculture,
harvesting for fuelwood and charcoal, frequent burning and heavy grazing by livestock.
Transformation and modification of the woodlands increase as population grows and
economic conditions change. Potential environmental impacts affect biodiversity,
ecological functioning, carbon storage, trace gas emissions, hydrology and regional
climate.
The vegetation communities in the study area represent two phytocoria, namely the
Southern Zambezian Brachystegia woodland and Northern dry Somali-Maasai Acacia-
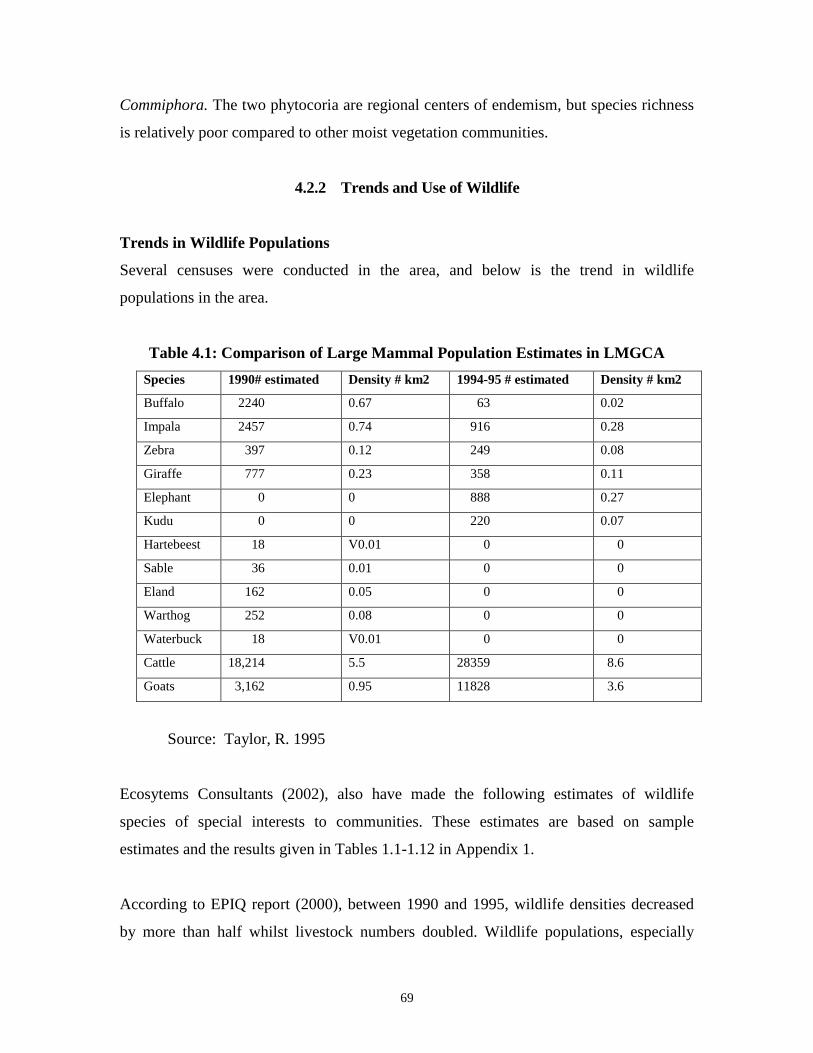
69
Commiphora. The two phytocoria are regional centers of endemism, but species richness
is relatively poor compared to other moist vegetation communities.
4.2.2 Trends and Use of Wildlife
Trends in Wildlife Populations
Several censuses were conducted in the area, and below is the trend in wildlife
populations in the area.
Table 4.1: Comparison of Large Mammal Population Estimates in LMGCA
Species 1990# estimated Density # km2 1994-95 # estimated Density # km2
Buffalo 2240 0.67 63 0.02
Impala 2457 0.74 916 0.28
Zebra 397 0.12 249 0.08
Giraffe 777 0.23 358 0.11
Elephant 0 0 888 0.27
Kudu 0 0 220 0.07
Hartebeest 18 V0.01 0 0
Sable 36 0.01 0 0
Eland 162 0.05 0 0
Warthog 252 0.08 0 0
Waterbuck 18 V0.01 0 0
Cattle 18,214 5.5 28359 8.6
Goats 3,162 0.95 11828 3.6
Source: Taylor, R. 1995
Ecosytems Consultants (2002), also have made the following estimates of wildlife
species of special interests to communities. These estimates are based on sample
estimates and the results given in Tables 1.1-1.12 in Appendix 1.
According to EPIQ report (2000), between 1990 and 1995, wildlife densities decreased
by more than half whilst livestock numbers doubled. Wildlife populations, especially
70
large game species such as buffalo were generally depleted for a number of reasons
including over hunting and human densities estimated to have reached 18 persons per
square kilometer. Systematic Reconnaissance Flight Method Censuses conducted by
REWMP in 1994 and 1995, showed a marked increase in settlements and clearing of
land for agriculture and livestock.
Surveys done during the wet and dry seasons in 1999, 2000 and 2001 concluded that
wildlife populations have remained stable within expected levels of annual/seasonal
fluctuations, and recommended increased off take quota for buffalo, kudu, sable,
waterbuck, and guinea fowl.
Other wildlife species found in the area include impala, hippopotamus, monkeys, wild
pig, lion, wild dog, baboons, jackals, dikdik, crocodiles, ostrich, hyaena, leopard and
cheetah. Most of these species are believed to be increasing, with the exception of wild
dog whose population is said to be declining.
Communities believe that, these species are increasing because of improved habitat
management, and reduced poaching.
Endemic, Rare, Threatened and Endangered Species
There are no species of large mammals are known to be endemic to the area. The
following large mammals found in the area are regarded by IUCN as threatened;
The African Elephant is classified as Endangered
The Cats: the lion and cheetah are both regarded as vulnerable
Species in the lower risk category include; waterbuck and oryx.
CITES Status
Because of international concern about the trade in several species and their products, the
following large mammals found in the area are placed within the CITES appendices;
71
Appendix 1: African Elephant (with recent proviso permitting some trade of elephant
products originating in some African States), Wild Dog and Leopard.
Appendix 11: Hippopotamus and Crocodiles
There are no records for the status of small mammals, amphibians and reptiles in the area.
In this case therefore it is also difficult to conclude if there are any endemic, threatened or
endangered species among these three groups. Detailed studies are therefore required to
document the status and threats of small mammals, amphibians and reptiles.
Wildlife Utilization
The form of wildlife utilization in the proposed pilot WMA is mainly tourist hunting.
Records indicate that, tourist hunting in the Lunda Mkwabi Game Controlled Area
(LMGCA) started in 1993, but was stopped shortly in LMGCA South due to depleted
wildlife populations. At present, tourist hunting continues in LMGCA north. The main
species hunted are lion, leopard, buffalo, greater kudu and impala. From the safari
operator’s perspective, hunting is satisfactory to good but is reliant on and complemented
by hunting blocks adjacent to Rungwa Game Reserve.
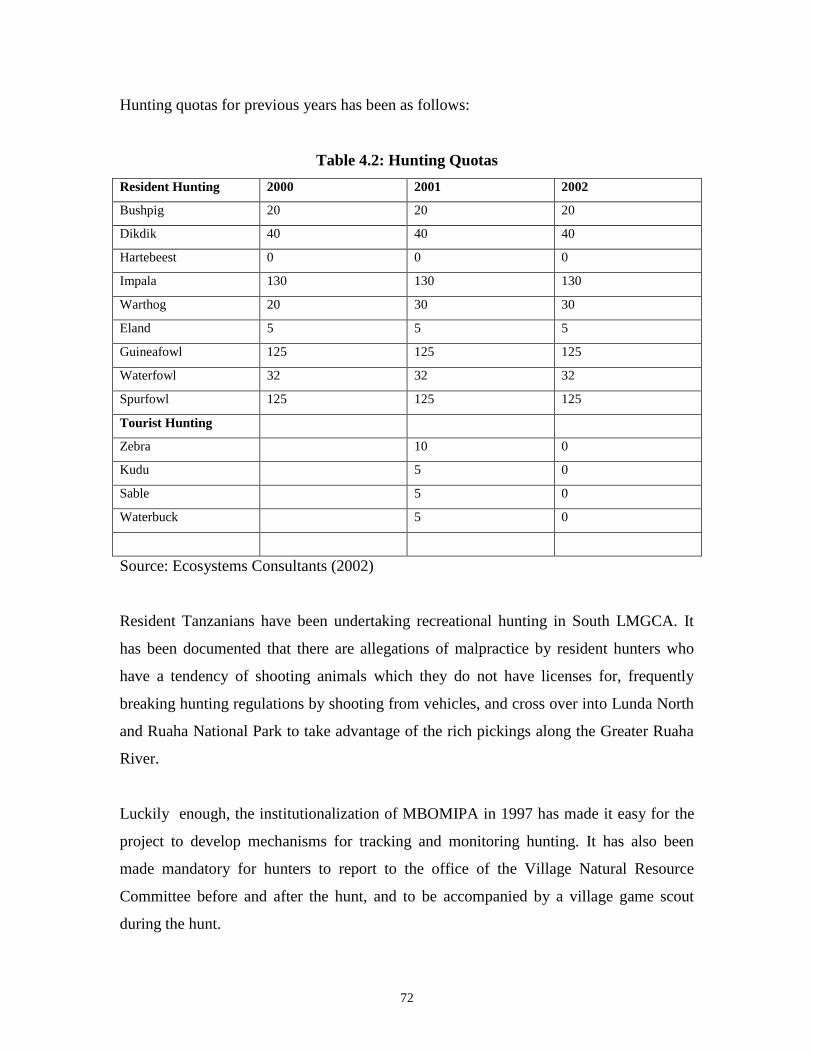
72
Hunting quotas for previous years has been as follows:
Table 4.2: Hunting Quotas
Resident Hunting 2000 2001 2002
Bushpig 20 20 20
Dikdik 40 40 40
Hartebeest 0 0 0
Impala 130 130 130
Warthog 20 30 30
Eland 5 5 5
Guineafowl 125 125 125
Waterfowl 32 32 32
Spurfowl 125 125 125
Tourist Hunting
Zebra 10 0
Kudu 5 0
Sable 5 0
Waterbuck 5 0
Source: Ecosystems Consultants (2002)
Resident Tanzanians have been undertaking recreational hunting in South LMGCA. It
has been documented that there are allegations of malpractice by resident hunters who
have a tendency of shooting animals which they do not have licenses for, frequently
breaking hunting regulations by shooting from vehicles, and cross over into Lunda North
and Ruaha National Park to take advantage of the rich pickings along the Greater Ruaha
River.
Luckily enough, the institutionalization of MBOMIPA in 1997 has made it easy for the
project to develop mechanisms for tracking and monitoring hunting. It has also been
made mandatory for hunters to report to the office of the Village Natural Resource
Committee before and after the hunt, and to be accompanied by a village game scout
during the hunt.
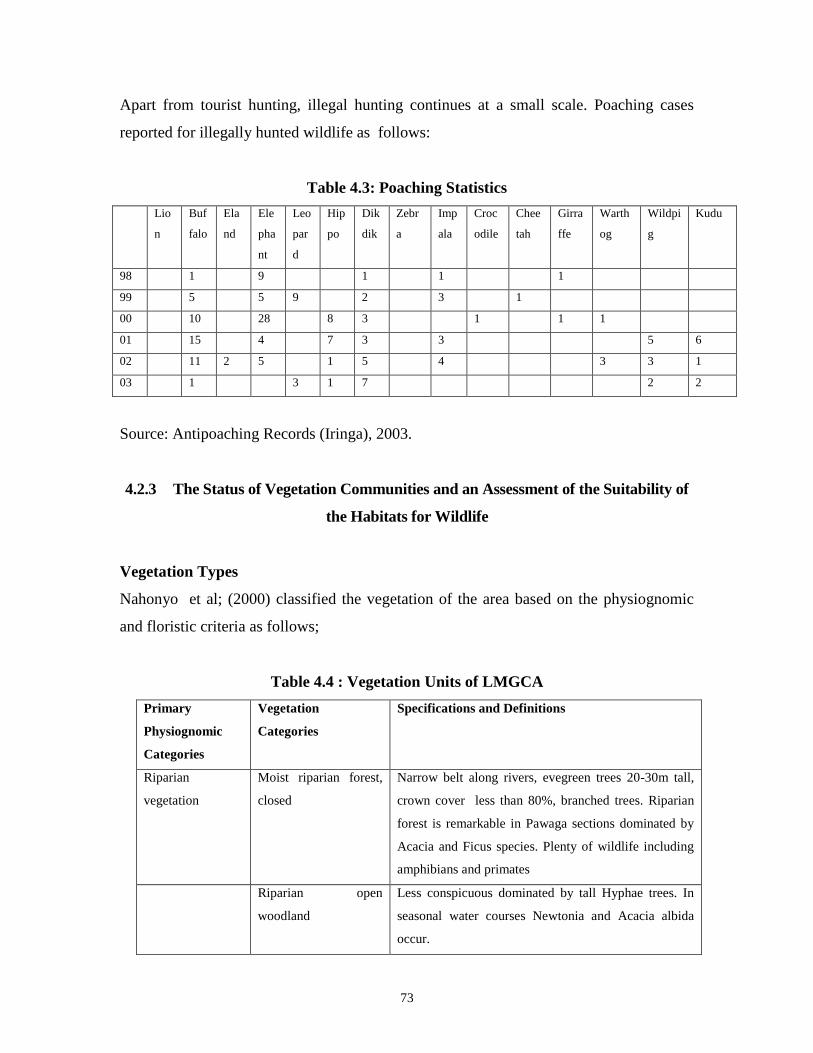
73
Apart from tourist hunting, illegal hunting continues at a small scale. Poaching cases
reported for illegally hunted wildlife as follows:
Table 4.3: Poaching Statistics
Lio
n
Buf
falo
Ela
nd
Ele
pha
nt
Leo
par
d
Hip
po
Dik
dik
Zebr
a
Imp
ala
Croc
odile
Chee
tah
Girra
ffe
Warth
og
Wildpi
g
Kudu
98 1 9 1 1 1
99 5 5 9 2 3 1
00 10 28 8 3 1 1 1
01 15 4 7 3 3 5 6
02 11 2 5 1 5 4 3 3 1
03 1 3 1 7 2 2
Source: Antipoaching Records (Iringa), 2003.
4.2.3 The Status of Vegetation Communities and an Assessment of the Suitability of
the Habitats for Wildlife
Vegetation Types
Nahonyo et al; (2000) classified the vegetation of the area based on the physiognomic
and floristic criteria as follows;
Table 4.4 : Vegetation Units of LMGCA
Primary
Physiognomic
Categories
Vegetation
Categories
Specifications and Definitions
Riparian
vegetation
Moist riparian forest,
closed
Narrow belt along rivers, evegreen trees 20-30m tall,
crown cover less than 80%, branched trees. Riparian
forest is remarkable in Pawaga sections dominated by
Acacia and Ficus species. Plenty of wildlife including
amphibians and primates
Riparian open
woodland
Less conspicuous dominated by tall Hyphae trees. In
seasonal water courses Newtonia and Acacia albida
occur.
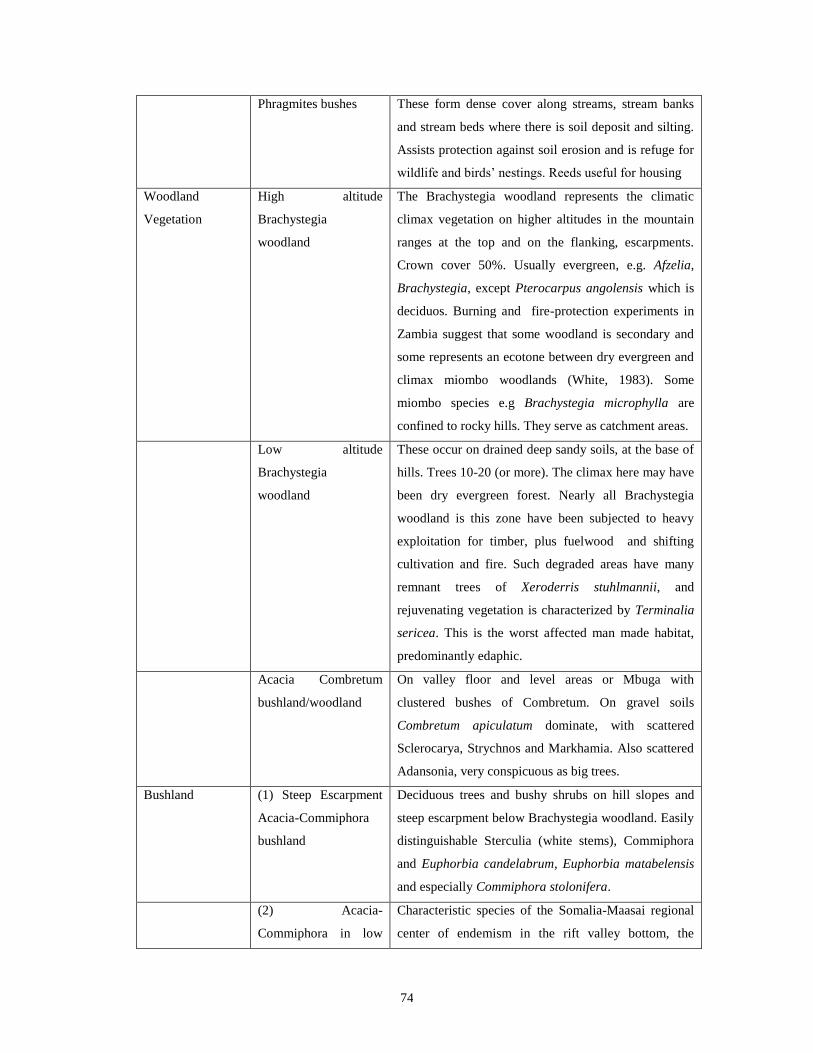
74
Phragmites bushes These form dense cover along streams, stream banks
and stream beds where there is soil deposit and silting.
Assists protection against soil erosion and is refuge for
wildlife and birds’ nestings. Reeds useful for housing
Woodland
Vegetation
High altitude
Brachystegia
woodland
The Brachystegia woodland represents the climatic
climax vegetation on higher altitudes in the mountain
ranges at the top and on the flanking, escarpments.
Crown cover 50%. Usually evergreen, e.g. Afzelia,
Brachystegia, except Pterocarpus angolensis which is
deciduos. Burning and fire-protection experiments in
Zambia suggest that some woodland is secondary and
some represents an ecotone between dry evergreen and
climax miombo woodlands (White, 1983). Some
miombo species e.g Brachystegia microphylla are
confined to rocky hills. They serve as catchment areas.
Low altitude
Brachystegia
woodland
These occur on drained deep sandy soils, at the base of
hills. Trees 10-20 (or more). The climax here may have
been dry evergreen forest. Nearly all Brachystegia
woodland is this zone have been subjected to heavy
exploitation for timber, plus fuelwood and shifting
cultivation and fire. Such degraded areas have many
remnant trees of Xeroderris stuhlmannii, and
rejuvenating vegetation is characterized by Terminalia
sericea. This is the worst affected man made habitat,
predominantly edaphic.
Acacia Combretum
bushland/woodland
On valley floor and level areas or Mbuga with
clustered bushes of Combretum. On gravel soils
Combretum apiculatum dominate, with scattered
Sclerocarya, Strychnos and Markhamia. Also scattered
Adansonia, very conspicuous as big trees.
Bushland (1) Steep Escarpment
Acacia-Commiphora
bushland
Deciduous trees and bushy shrubs on hill slopes and
steep escarpment below Brachystegia woodland. Easily
distinguishable Sterculia (white stems), Commiphora
and Euphorbia candelabrum, Euphorbia matabelensis
and especially Commiphora stolonifera.
(2) Acacia-
Commiphora in low
Characteristic species of the Somalia-Maasai regional
center of endemism in the rift valley bottom, the
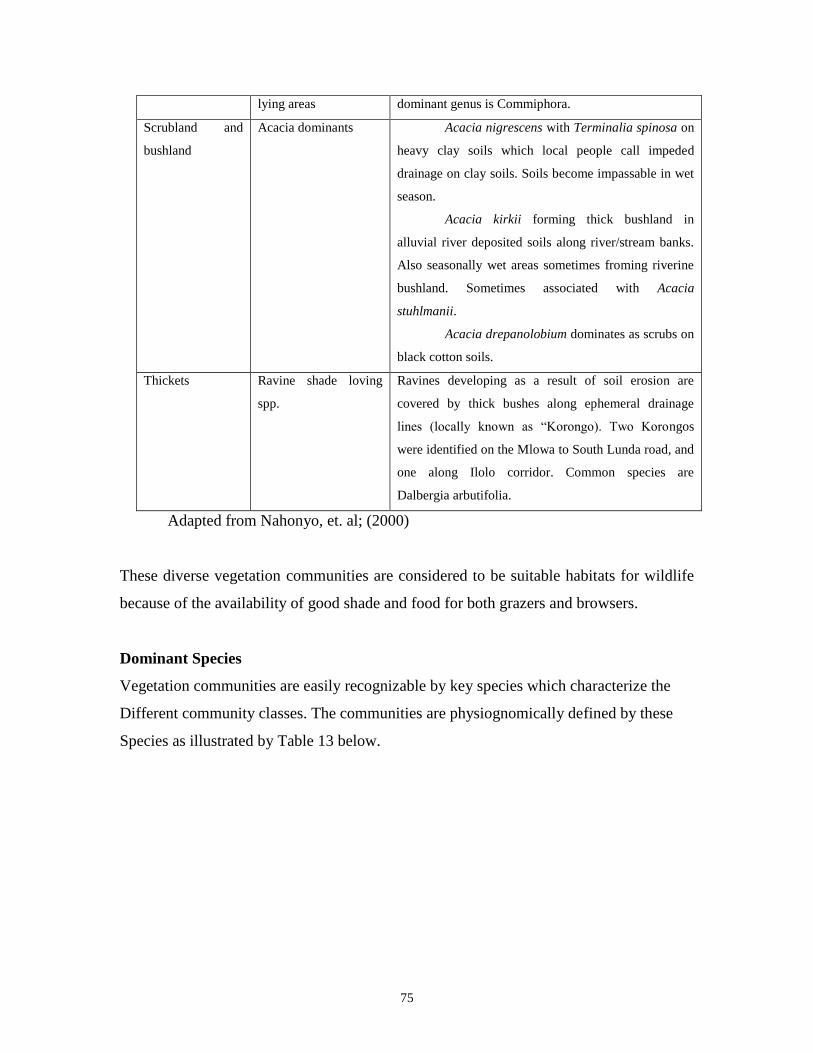
75
lying areas dominant genus is Commiphora.
Scrubland and
bushland
Acacia dominants a) Acacia nigrescens with Terminalia spinosa on
heavy clay soils which local people call impeded
drainage on clay soils. Soils become impassable in wet
season.
b) Acacia kirkii forming thick bushland in
alluvial river deposited soils along river/stream banks.
Also seasonally wet areas sometimes froming riverine
bushland. Sometimes associated with Acacia
stuhlmanii.
c) Acacia drepanolobium dominates as scrubs on
black cotton soils.
Thickets Ravine shade loving
spp.
Ravines developing as a result of soil erosion are
covered by thick bushes along ephemeral drainage
lines (locally known as “Korongo). Two Korongos
were identified on the Mlowa to South Lunda road, and
one along Ilolo corridor. Common species are
Dalbergia arbutifolia.
Adapted from Nahonyo, et. al; (2000)
These diverse vegetation communities are considered to be suitable habitats for wildlife
because of the availability of good shade and food for both grazers and browsers.
Dominant Species
Vegetation communities are easily recognizable by key species which characterize the
Different community classes. The communities are physiognomically defined by these
Species as illustrated by Table 13 below.
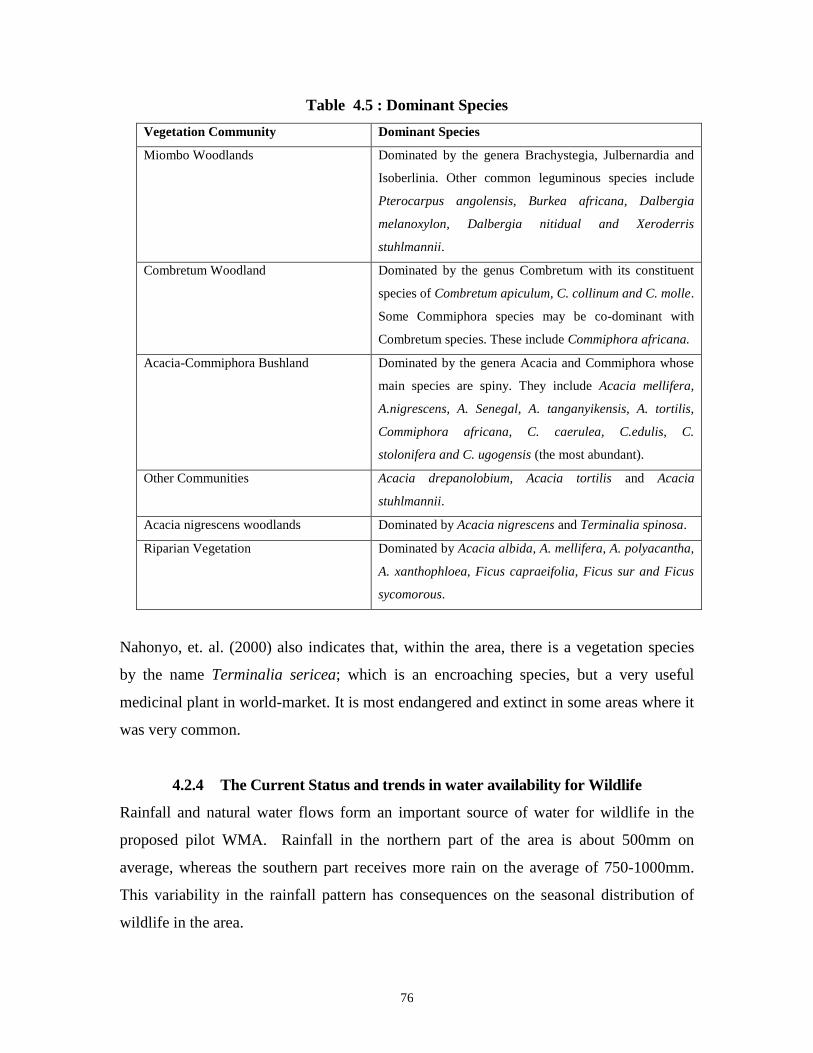
76
Table 4.5 : Dominant Species
Vegetation Community Dominant Species
Miombo Woodlands Dominated by the genera Brachystegia, Julbernardia and
Isoberlinia. Other common leguminous species include
Pterocarpus angolensis, Burkea africana, Dalbergia
melanoxylon, Dalbergia nitidual and Xeroderris
stuhlmannii.
Combretum Woodland Dominated by the genus Combretum with its constituent
species of Combretum apiculum, C. collinum and C. molle.
Some Commiphora species may be co-dominant with
Combretum species. These include Commiphora africana.
Acacia-Commiphora Bushland Dominated by the genera Acacia and Commiphora whose
main species are spiny. They include Acacia mellifera,
A.nigrescens, A. Senegal, A. tanganyikensis, A. tortilis,
Commiphora africana, C. caerulea, C.edulis, C.
stolonifera and C. ugogensis (the most abundant).
Other Communities Acacia drepanolobium, Acacia tortilis and Acacia
stuhlmannii.
Acacia nigrescens woodlands Dominated by Acacia nigrescens and Terminalia spinosa.
Riparian Vegetation Dominated by Acacia albida, A. mellifera, A. polyacantha,
A. xanthophloea, Ficus capraeifolia, Ficus sur and Ficus
sycomorous.
Nahonyo, et. al. (2000) also indicates that, within the area, there is a vegetation species
by the name Terminalia sericea; which is an encroaching species, but a very useful
medicinal plant in world-market. It is most endangered and extinct in some areas where it
was very common.
4.2.4 The Current Status and trends in water availability for Wildlife
Rainfall and natural water flows form an important source of water for wildlife in the
proposed pilot WMA. Rainfall in the northern part of the area is about 500mm on
average, whereas the southern part receives more rain on the average of 750-1000mm.
This variability in the rainfall pattern has consequences on the seasonal distribution of
wildlife in the area.
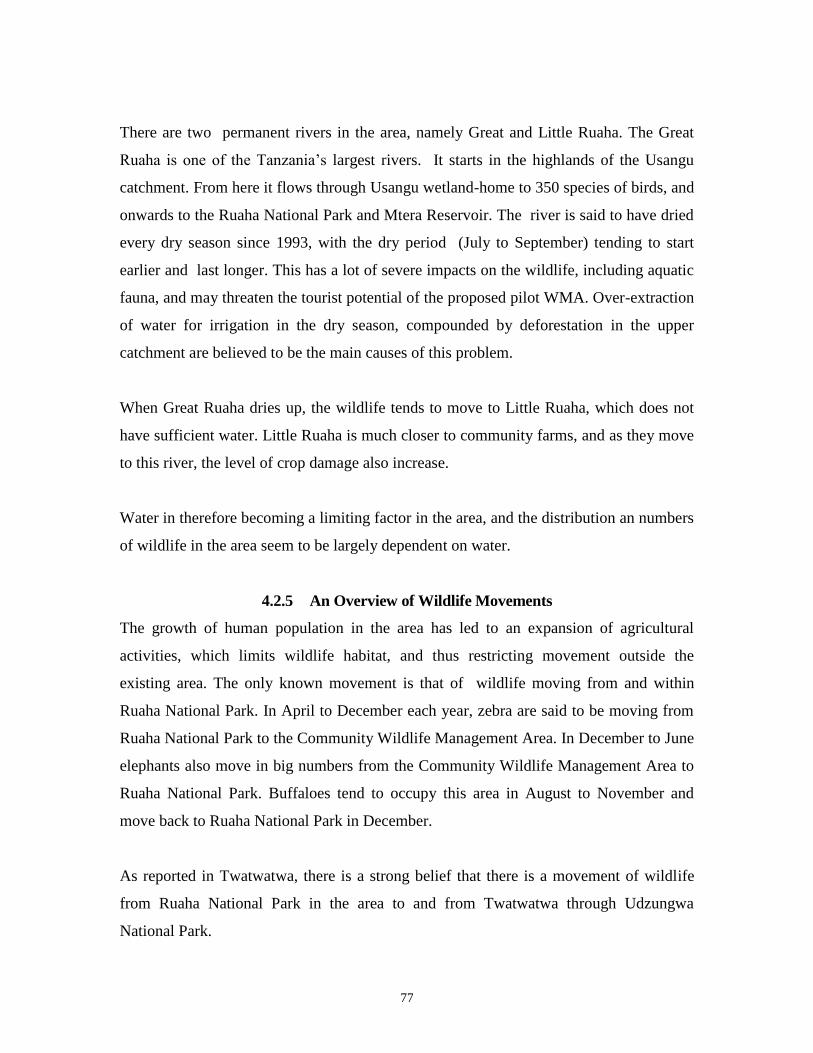
77
There are two permanent rivers in the area, namely Great and Little Ruaha. The Great
Ruaha is one of the Tanzania’s largest rivers. It starts in the highlands of the Usangu
catchment. From here it flows through Usangu wetland-home to 350 species of birds, and
onwards to the Ruaha National Park and Mtera Reservoir. The river is said to have dried
every dry season since 1993, with the dry period (July to September) tending to start
earlier and last longer. This has a lot of severe impacts on the wildlife, including aquatic
fauna, and may threaten the tourist potential of the proposed pilot WMA. Over-extraction
of water for irrigation in the dry season, compounded by deforestation in the upper
catchment are believed to be the main causes of this problem.
When Great Ruaha dries up, the wildlife tends to move to Little Ruaha, which does not
have sufficient water. Little Ruaha is much closer to community farms, and as they move
to this river, the level of crop damage also increase.
Water in therefore becoming a limiting factor in the area, and the distribution an numbers
of wildlife in the area seem to be largely dependent on water.
4.2.5 An Overview of Wildlife Movements
The growth of human population in the area has led to an expansion of agricultural
activities, which limits wildlife habitat, and thus restricting movement outside the
existing area. The only known movement is that of wildlife moving from and within
Ruaha National Park. In April to December each year, zebra are said to be moving from
Ruaha National Park to the Community Wildlife Management Area. In December to June
elephants also move in big numbers from the Community Wildlife Management Area to
Ruaha National Park. Buffaloes tend to occupy this area in August to November and
move back to Ruaha National Park in December.
As reported in Twatwatwa, there is a strong belief that there is a movement of wildlife
from Ruaha National Park in the area to and from Twatwatwa through Udzungwa
National Park.
78
This information could not be mapped, as it is considered too raw. Adequate time and
synthesis is required before mapping the actual corridors.
4.2.6 Status, trends and use of fisheries, forests and bee keeping resources
Fisheries
There is a subsistence level fishery activities taking place in the rivers. Main species of
fish harvested are covered in the economic part of the study. The level of fishing taking
place is so small, that communities do not pay attention to it. There are therefore no
proper records to indicate the problems and potentiality of this sector.
Forests
In the miombo woodlands there is a natural diversity of trees, providing local
people with a wide variety of products, including wood, fuel, fruits, fodder and
medicinal plants. A study by Nahonyo, et al (1998) indicate that the Acacia-
Commiphora vegetation communities are under pressure from livestock grazing,
fuelwood and cultivation. On the other hand, miombo woodlands are under pressure
mostly from cultivation, timber harvesting, charcoal processing and fuelwood
collection.
Commercially harvested trees, which require immediate attention, are:
Brachystegia species which are mainly used for charcoal and commercial fuelwood
Pterocarpus angolensis which is used for timber
Afzelia quazensis which is used for timber
Entandrophragma bussei which is used for timber.
The most important fuel wood species (in descending order) for each village in Idodi and
Pawaga Divisions are provided in Tables 1.13 and 1.14 in Appendix 1.
79
Beekeeping
The vegetation of Idodi and Pawaga is suitable and has a high potential for beekeeping
(Nahonyo et al; 1998). At present, beekeeping activities are practiced on an individual
basis. Miombo species are most commonly used for making and hanging hives. Forest
resources could be used to promote beekeeping through the use of modern hives.
4.2.7 Human-wildlife Conflicts and Natural Resource Use Conflicts
Pastoralist Ethnic Conflicts
The indigenous ethnic groups have fewer livestock than in the past, but other immigrant
groups such as the Maasai, Barbaig and Sukuma have substantial livestock holdings. It is
estimated that depending on the season and movement of pastoralists, there are between
40,000 and 60,000 cattle in the area. This is one source of potential conflicts in resource
use.
This is usually of cattle raiding among livestock herders. Ecologically, they occupy the
same ecological niche. However, there is a conflict between the two ethnic groups due to
the tendency of cattle raiding. This has created an antagonism and therefore they tend to
avoid one another. The tendency of avoiding one another creates a situation of frequent
movements, and this has negative consequences on the environment.
Crop Raiding
Wildlife is abundant in the proposed pilot WMA and move frequently to the farm areas.
Elephants move extensively throughout farming and settlement areas, and are a source of
human-wildlife conflicts. The principal species involved include elephant, buffalo, wild
pig and baboons.
In most villages, it is estimated that crop damage each year by wildlife is between 5% to
15% at most of the total cultivated area.
80
Pastoralists against Community Wildlife Management Area Leadership
Pastoralists have a tendency of grazing in the proposed pilot WMA due to availability of
pasture and water. This creates conflicts in resource use as they are limited.
Illegal/Over Utilization of Forest Products
As indicated above, there is a problem of illegal harvesting of forest products in the
proposed WMA, and most likely over utilization of forest products in the surrounding
communities. This threatens the ecological integrity of the area.
4.3 Emerging Issues: A Discussion
4.3.1 Ecological Isolation
It was reported during the field visit that there are ecological links between Ruaha Park
and Udzungwa National Park. Wildlife is believed to move from these areas to
Twatwatwa area. However, wildlife corridors for these areas are not known. The intensity
of land use in between these two areas puts a lot of doubt on the possible continued
ecological links.
The major effects of ecological islands of wildlife or forest are the decline of species.
There may also be local extinctions of especially rare species and small populations as
habitats become more isolated. There also be local extinctions of especially rare species
and small populations as habitats become more isolated. Because of discontinuous
habitat, dispersal of both animals and plants becomes difficult, and this has more effect
on amphibians and reptiles than mammals and birds. Habitat isolation also reduces plant
diversity and quality and hence animal diversity will also be affected.
4.3.2 Drying up of water in Great Ruaha during the dry season
Drying up of Great Ruaha river threatens the possibilities of maintaining the potentials of
Lunda Mkwabi as a WMA. Great Ruaha river originates from Usangu plains. It is
believed that irrigation practices upstream contribute significantly to the decline in water
81
levels downstream. As a catchment area, there are also threats which impact the water
yielding capacity of the area. Among those, the most important are;
4.3.3 Timber Extraction
Timber extraction is contributing to deforestation. For quite sometimes there have been
no controls in place and the extraction was done in unsustainable manner.
4.3.4 Clearing of woodland and bushland for agriculture
Acacia/Commiphora/Lannea woodland and bushland is found on alluvial soils of low
slope and is often cleared to open up new land for cultivation. Because few or no inputs
are made in the form of fertilizers to increase and/or maintain soil fertility, the plots are
abandoned after a few years.
4.3.5 Overgrazing
Ovegrazing on the Usangu plains is a serious problem. Overgrazing has direct impacts on
the vegetation and tend to compact the soil. All these affect water filtration and retention
capacity.
4.3.6 Crop damage
Crop damage is rampant in most villages in the area. While communities now are
appreciating the value of wildlife, the continued problem of crop damage may negate
these values, especially if the benefits obtained from wildlife are small compared to
damages made.
4.3.7 Water pollution through fertilizers and pesticides
Tobacco farming which is taking place in some villages adjacent to the villages
surrounding the proposed pilot WMA tend to use a lot of chemical fertilizers and
pesticides. Most of these chemicals are poisonous and may have long term effects to
wildlife if discharged to Little and Great Ruaha.
82
4.4 Conclusions and Recommendations
The proposed WMA has most ecological qualities which make it qualify to be designated as a pilot WMA.
The communities are also well prepared and the level of institutional development is encouraging. In order
to add more strengths in the level of ecological information available, it is proposed that the following
recommendation be considered by stakeholders involve in the process:
Identify and Map Wildlife Corridors
There seems to be ecological links between Ruaha National Park/LMGCA with other
protected areas, specifically Udzungwa and Mikumi. These links are manifested by the
wildlife movements which are believed to occur among these areas. However, the
corridors used in these movements are not well known, and if known, then they are not
documented. It is therefore recommended that the corridors be identified and mapped.
Monitor Water Quality and Quantity
Water in Great Ruaha and Little Ruaha are a lifeline for wildlife in the area. The
continued declining water levels in these rivers should be considered as a number one
priority in designing strategies for managing the area. This will be done properly if basic
information is collected to establish the exact changes in the water levels as well as
quality. This should be done in collaboration with relevant authorities such as the
Ministry of Water and Livestock Development .
Tree Planting Campaigns
The present demand for fuelwood, timber and other uses of forest products put excessive
pressure on the forests in the area. It is proposed that extensive campaigns be initiated to
start planting trees as an alternative to dependence on natural wood products.
4.5 Way Forward
The communities around LMGCA are in a better position to manage the proposed pilot
WMA. The immediate step that should be taken at present is to establish an Authorized
Association in order to follow up the process of being empowered to manage wildlife
resources in LMGCA.
83
REFERENCES
Baldus R.D., Hahn R., Kaggi D., Kaihula S., Murphree M., Mahundi C.C., Koettcher K.,
Siege L and Zacharia M (2001): Experience with community based wildlife
Conservation in Tanzania: Tanzania Wildlife Discussion Paper No. 29.
Boshe, J.I. (1989). Wildlife conservation in the Ngorongoro Conservation Area in
Tanzania: Social and ecological implications of increasing pastoralist and declining
per capita livestock populations. In: Mammal conservation in developing countries. A
new approach. Proceedings of a Workshop held at the 5th Theriological Congress in
Rome, Italy, August, 1989. Edited by Per Wegge. Development and Environment
No. 11, Agricultural University of Norway, pp. 84-100.
Christophersen K., Hagen R and Jambiya G (2000): Economic Opportunities in Wildlife
Management Areas. WD of the MNRT and USAID/Tanzania.
Ecosystems Consultants (2002). Game survey of Lunda-Mkwambi GCA and adjacent
areas of RUNAPA. Report No. MCR 13. 9November).
Ghai, G. (1994). Environment, livelihood and empowerment. Development and Change
25(1):1-11.
Isack J.J (2001) Fisheries Activities in Iringa District.
MBOMIPA Project (1998). Seminar on the roles and relationship between village
governments, natural resources committees, and government departments, Iringa, 2-
4 November. Report No. MNR 2. (Ngowi, R.C. and C.S. Ugulumu).
MEMA (2001): Analysis of Community Based Tourism Potential in Iringa District.
Mung'ong'o, C.G. 1995. Social processes and ecology in the Kondoa Irangi Hills, Central
Tanzania. Meddelanden series B 93. Department of Human Geography, Stockholm
University, 180pp.
Mung'ong'o, C.G. 1996. Natural resource use conflict resolution in Tanzania. Mimeo.
Nahonyo, C.L., L. Mwasumbi, and D.G. Bayona (1998). Survey of the vegetation
communities and utilization of woody plant species in the MBOMIPA Project
Area. Report No. MCR 1.
84
Tacconi, L. and J. Bennett 1995. Biodiversity conservation: the process of economic
assessment and establishment of a protected area in Vanuatu. Development and
Change 26.
URT (1996): Iringa District socio-economic profile.
Wells, M.P and K.E. Brandon 1993. The principles and practice of buffer zones and local
participation in biodiversity conservation. Ambio 22(2-3):157-62.
Yanda, P.Z., I.S. Kikula, R.B.B. Mwalyosi and C.G. Mung’ong’o, (2001). The status of
game controlled areas as a basis for the establishment of wildlife management areas
in Tanzania. The case of Arusha Region. Final Report to Wildlife Division,
Ministry of Natural Resources and Tourism. July; 79pp.
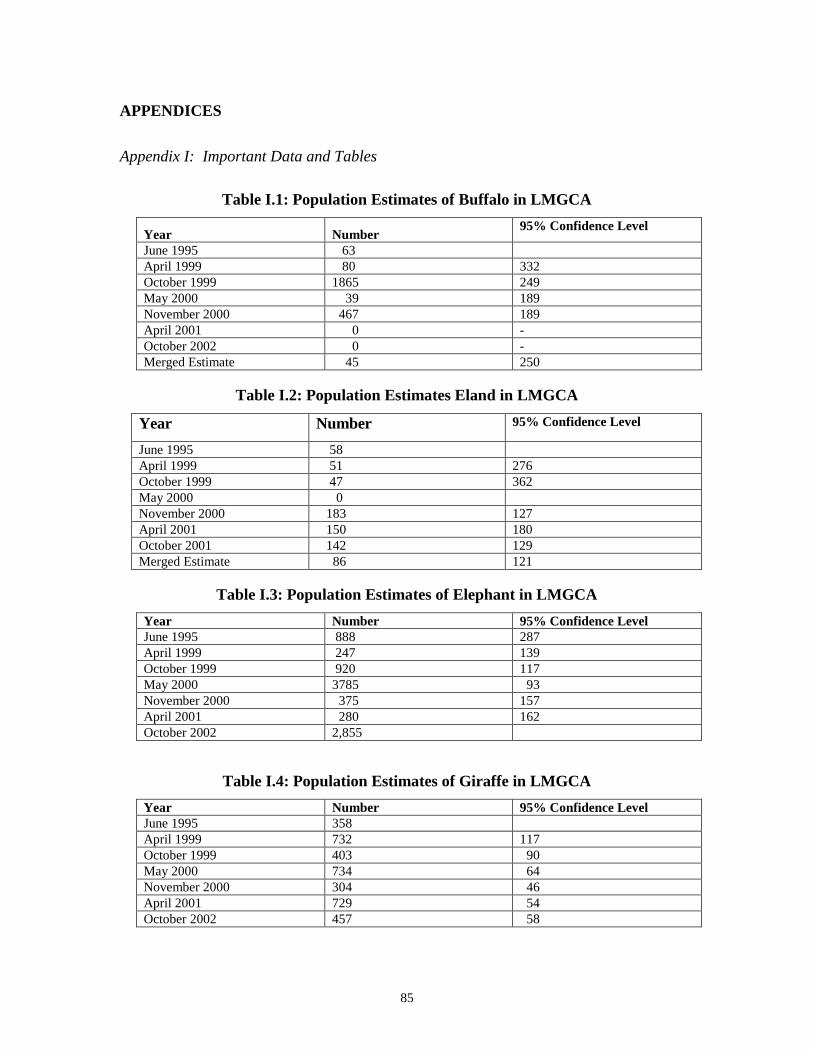
85
APPENDICES
Appendix I: Important Data and Tables
Table I.1: Population Estimates of Buffalo in LMGCA
Year Number 95% Confidence Level
June 1995 63
April 1999 80 332
October 1999 1865 249
May 2000 39 189
November 2000 467 189
April 2001 0 -
October 2002 0 -
Merged Estimate 45 250
Table I.2: Population Estimates Eland in LMGCA
Year Number 95% Confidence Level
June 1995 58
April 1999 51 276
October 1999 47 362
May 2000 0
November 2000 183 127
April 2001 150 180
October 2001 142 129
Merged Estimate 86 121
Table I.3: Population Estimates of Elephant in LMGCA
Year Number 95% Confidence Level
June 1995 888 287
April 1999 247 139
October 1999 920 117
May 2000 3785 93
November 2000 375 157
April 2001 280 162
October 2002 2,855
Table I.4: Population Estimates of Giraffe in LMGCA
Year Number 95% Confidence Level
June 1995 358
April 1999 732 117
October 1999 403 90
May 2000 734 64
November 2000 304 46
April 2001 729 54
October 2002 457 58
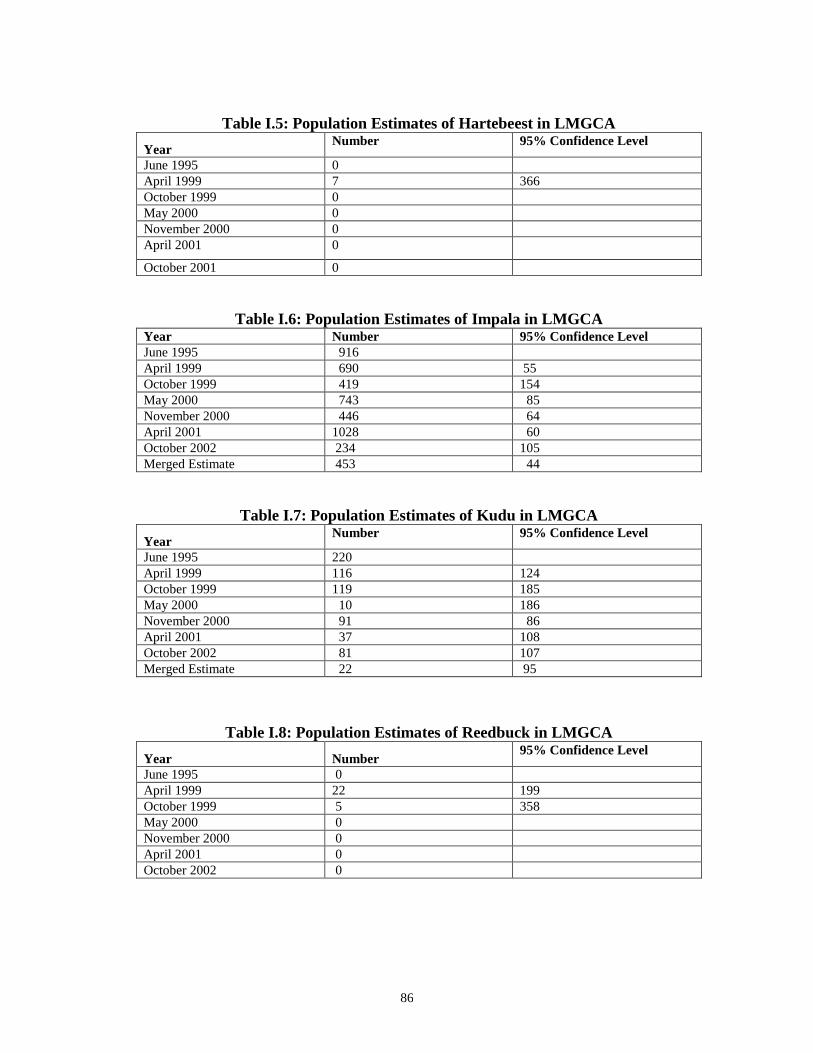
86
Table I.5: Population Estimates of Hartebeest in LMGCA
Year Number 95% Confidence Level
June 1995 0
April 1999 7 366
October 1999 0
May 2000 0
November 2000 0
April 2001 0
October 2001 0
Table I.6: Population Estimates of Impala in LMGCA Year Number 95% Confidence Level
June 1995 916
April 1999 690 55
October 1999 419 154
May 2000 743 85
November 2000 446 64
April 2001 1028 60
October 2002 234 105
Merged Estimate 453 44
Table I.7: Population Estimates of Kudu in LMGCA
Year Number 95% Confidence Level
June 1995 220
April 1999 116 124
October 1999 119 185
May 2000 10 186
November 2000 91 86
April 2001 37 108
October 2002 81 107
Merged Estimate 22 95
Table I.8: Population Estimates of Reedbuck in LMGCA
Year Number 95% Confidence Level
June 1995 0
April 1999 22 199
October 1999 5 358
May 2000 0
November 2000 0
April 2001 0
October 2002 0
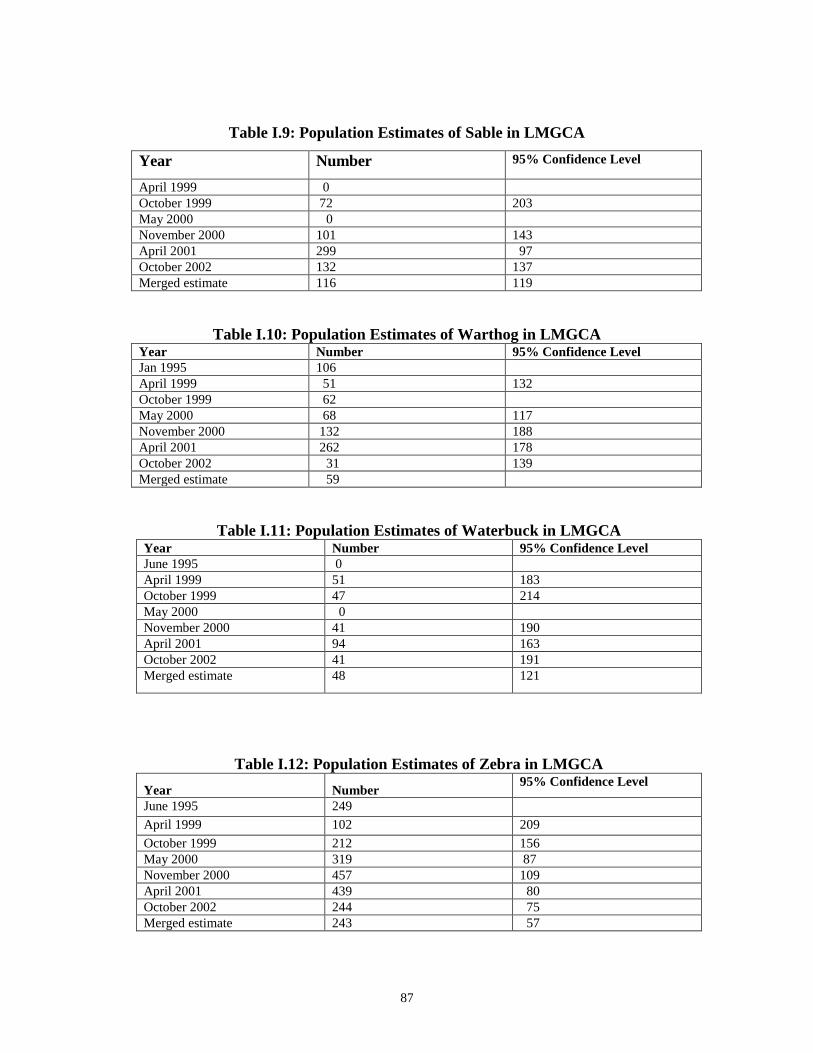
87
Table I.9: Population Estimates of Sable in LMGCA
Year Number 95% Confidence Level
April 1999 0
October 1999 72 203
May 2000 0
November 2000 101 143
April 2001 299 97
October 2002 132 137
Merged estimate 116 119
Table I.10: Population Estimates of Warthog in LMGCA Year Number 95% Confidence Level
Jan 1995 106
April 1999 51 132
October 1999 62
May 2000 68 117
November 2000 132 188
April 2001 262 178
October 2002 31 139
Merged estimate 59
Table I.11: Population Estimates of Waterbuck in LMGCA Year Number 95% Confidence Level
June 1995 0
April 1999 51 183
October 1999 47 214
May 2000 0
November 2000 41 190
April 2001 94 163
October 2002 41 191
Merged estimate 48 121
Table I.12: Population Estimates of Zebra in LMGCA
Year Number 95% Confidence Level
June 1995 249
April 1999 102 209
October 1999 212 156
May 2000 319 87
November 2000 457 109
April 2001 439 80
October 2002 244 75
Merged estimate 243 57
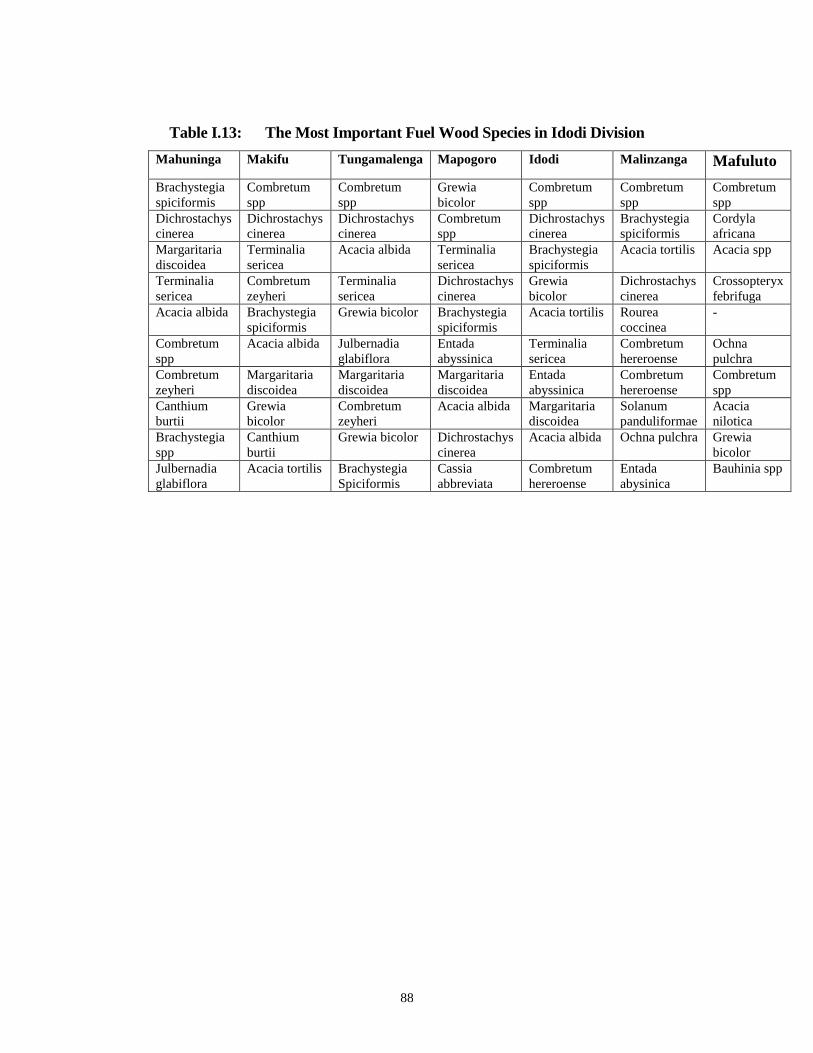
88
Table I.13: The Most Important Fuel Wood Species in Idodi Division
Mahuninga Makifu Tungamalenga Mapogoro Idodi Malinzanga Mafuluto
Brachystegia
spiciformis
Combretum
spp
Combretum
spp
Grewia
bicolor
Combretum
spp
Combretum
spp
Combretum
spp
Dichrostachys
cinerea
Dichrostachys
cinerea
Dichrostachys
cinerea
Combretum
spp
Dichrostachys
cinerea
Brachystegia
spiciformis
Cordyla
africana
Margaritaria
discoidea
Terminalia
sericea
Acacia albida Terminalia
sericea
Brachystegia
spiciformis
Acacia tortilis Acacia spp
Terminalia
sericea
Combretum
zeyheri
Terminalia
sericea
Dichrostachys
cinerea
Grewia
bicolor
Dichrostachys
cinerea
Crossopteryx
febrifuga
Acacia albida Brachystegia
spiciformis
Grewia bicolor Brachystegia
spiciformis
Acacia tortilis Rourea
coccinea
-
Combretum
spp
Acacia albida Julbernadia
glabiflora
Entada
abyssinica
Terminalia
sericea
Combretum
hereroense
Ochna
pulchra
Combretum
zeyheri
Margaritaria
discoidea
Margaritaria
discoidea
Margaritaria
discoidea
Entada
abyssinica
Combretum
hereroense
Combretum
spp
Canthium
burtii
Grewia
bicolor
Combretum
zeyheri
Acacia albida Margaritaria
discoidea
Solanum
panduliformae
Acacia
nilotica
Brachystegia
spp
Canthium
burtii
Grewia bicolor Dichrostachys
cinerea
Acacia albida Ochna pulchra Grewia
bicolor
Julbernadia
glabiflora
Acacia tortilis Brachystegia
Spiciformis
Cassia
abbreviata
Combretum
hereroense
Entada
abysinica
Bauhinia spp
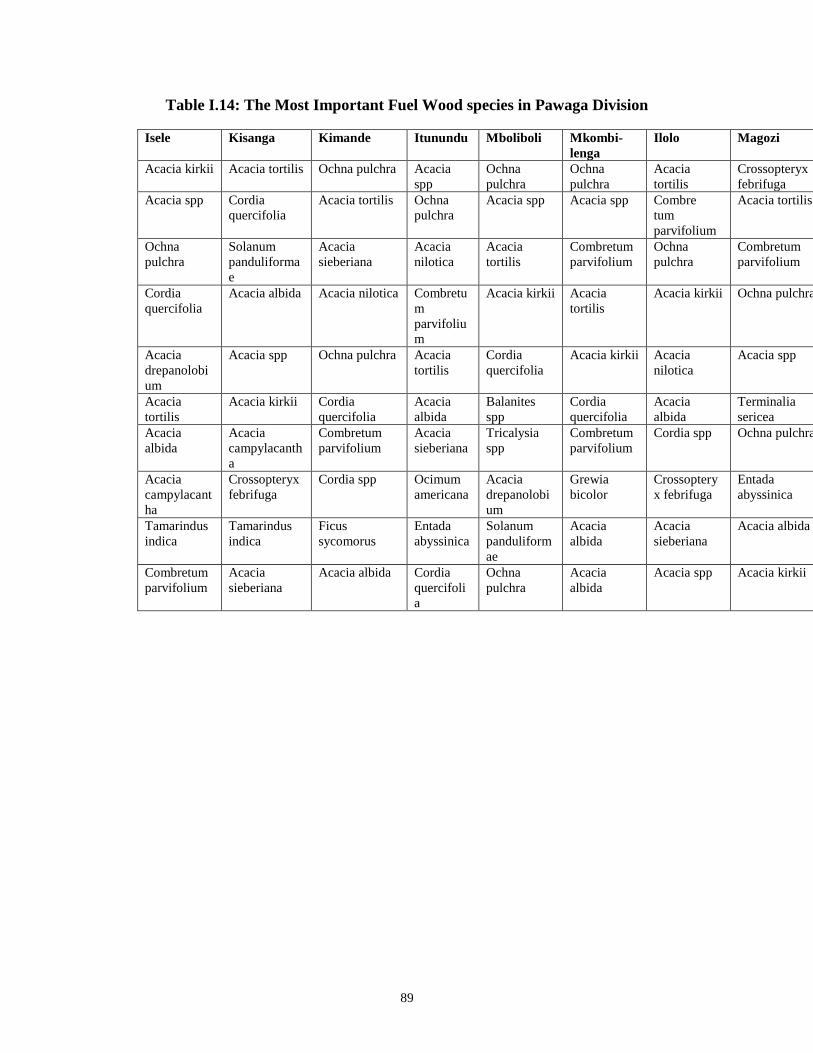
89
Table I.14: The Most Important Fuel Wood species in Pawaga Division
Isele Kisanga Kimande Itunundu Mboliboli Mkombi-
lenga
Ilolo Magozi Luganga
Acacia kirkii Acacia tortilis Ochna pulchra Acacia
spp
Ochna
pulchra
Ochna
pulchra
Acacia
tortilis
Crossopteryx
febrifuga
Crossopteryx
febrifuga
Acacia spp Cordia
quercifolia
Acacia tortilis Ochna
pulchra
Acacia spp Acacia spp Combre
tum
parvifolium
Acacia tortilis Acacia
tortilis
Ochna
pulchra
Solanum
panduliforma
e
Acacia
sieberiana
Acacia
nilotica
Acacia
tortilis
Combretum
parvifolium
Ochna
pulchra
Combretum
parvifolium
Acacia kirkii
Cordia
quercifolia
Acacia albida Acacia nilotica Combretu
m
parvifoliu
m
Acacia kirkii Acacia
tortilis
Acacia kirkii Ochna pulchra Grewia
bicolor
Acacia
drepanolobi
um
Acacia spp Ochna pulchra Acacia
tortilis
Cordia
quercifolia
Acacia kirkii Acacia
nilotica
Acacia spp Acacia spp
Acacia
tortilis
Acacia kirkii Cordia
quercifolia
Acacia
albida
Balanites
spp
Cordia
quercifolia
Acacia
albida
Terminalia
sericea
Acacia
nilotica
Acacia
albida
Acacia
campylacanth
a
Combretum
parvifolium
Acacia
sieberiana
Tricalysia
spp
Combretum
parvifolium
Cordia spp Ochna pulchra Entada
abyssinica
Acacia
campylacant
ha
Crossopteryx
febrifuga
Cordia spp Ocimum
americana
Acacia
drepanolobi
um
Grewia
bicolor
Crossoptery
x febrifuga
Entada
abyssinica
Cassia
abbreviana
Tamarindus
indica
Tamarindus
indica
Ficus
sycomorus
Entada
abyssinica
Solanum
panduliform
ae
Acacia
albida
Acacia
sieberiana
Acacia albida Cordia
quercifolia
Combretum
parvifolium
Acacia
sieberiana
Acacia albida Cordia
quercifoli
a
Ochna
pulchra
Acacia
albida
Acacia spp Acacia kirkii Ochna
pulchra