Embed Size (px)
Citation preview


MINNESOTA STATE UNIVERSITY, MANKATO
A MEMBER OF THE MINNESOTA STATE COLLEGES AND UNIVERSITIES SYSTEM
ANNUAL FINANCIAL REPORT
FOR THE YEARS ENDED JUNE 30, 2011 and 2010
Prepared by:
Minnesota State University, Mankato 236 Wigley Administration Center Mankato, Minnesota 56001

Upon request, this publication is available in alternate formats by calling one of the following: General number (651) 201-1800 Toll free: 1-888-667-2848 For TTY communication, contact Minnesota Relay Service at 7-1-1 or 1-800-627-3529.
MINNESOTA STATE UNIVERSITY, MANKATO
ANNUAL FINANCIAL REPORT FOR THE YEARS ENDED JUNE 30, 2011 and 2010
TABLE OF CONTENTS
INTRODUCTION
Page
Transmittal Letter ...................................................................................................................................5
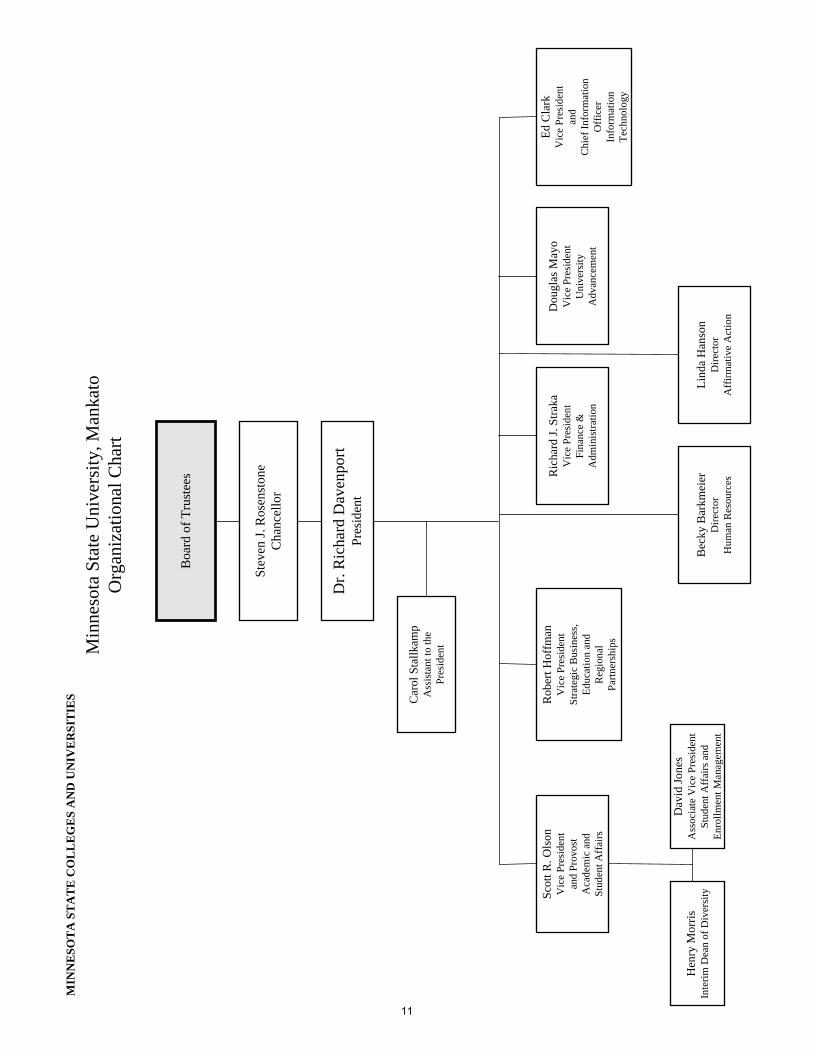
Organizational Chart ............................................................................................................................11
FINANCIAL SECTION
Independent Auditor’s Report ............................................................................................................. 14
Management’s Discussion and Analysis ..............................................................................................16
Basic Financial Statements
Statements of Net Assets .............................................................................................................. 24
Minnesota State University, Mankato Foundation – Statements of Financial Position .................25
Statements of Revenues, Expenses, and Changes in Net Assets ...................................................26
Minnesota State University, Mankato Foundation – Statements of Activities ..............................27
Statements of Cash Flows .............................................................................................................28
Notes to the Financial Statements .................................................................................................30
REQUIRED SUPPLEMENTARY INFORMATION SECTION
Schedule of Funding Progress for Net Other Postemployment Benefits ............................................. 55
SUPPLEMENTARY SECTION
Report on Internal Control Over Financial Reporting and on Compliance and Other Matters Based on an Audit of Financial Statements Performed in Accordance with Government Auditing Standards .................................................................. 58
1

This page intentionally left blank
2

INTRODUCTION
3

This page intentionally left blank
4
5
-MrNNESOTASTATE
UNIVERSITYMANKATO
October 28,2011
Minnesota State Colleges and Universities Board of TrusteesSteven J. Rosenstone, ChancellorMinnesota State Colleges and Universities350 Wells Fargo Place30 East 7th StreetSt. Paul, MN 55101
Dear Members of the Board and Chancellor Rosenstone:
I am pleased to submit to you the audited annual financial statements for Minnesota StateUniversity, Mankato for the fiscal year ending June 30, 2011. This report includes thefinancial statements and disclosures necessary to accurately present the financial conditionand results of operation for the year. The financial statements are presented in accordancewith generally accepted accounting principles, as prescribed by the GovernmentalAccounting Standards Board.
Milmesota State University, Mankato is one of 32 colleges and universities in the MinnesotaState Colleges and Universities System. It has been my privilege to serve as president sinceJuly 1,2002. Our faculty, staff and administrators strive to meet the highest standards ofexcellence in the overall management of the University, including fiscal, academic andstudent services. The following narrative demonstrates our success in achieving ourexpectations.
Now in its 143rd year, Minnesota State Mankato today serves approximately 15,645students. Our student body includes nearly 600 international students from 72 countries. Oursix academic colleges-Allied Health and Nursing; Arts and Humanities; Business;Education; Science, Engineering and Technology; and Social and Behavioral Sciencesfeature approximately 150 undergraduate programs of study and 70 graduate programs. TheUniversity employs close to 1600 faculty and staff (474 full-time instructional faculty, 83percent with terminal degrees). Minnesota State Mankato is accredited by The HigherLearning Commission (North Central Association of Colleges and Schools) and additionally,twenty-three national accrediting agencies have accredited programs at Minnesota StateMankato. Our alumni number over 105,000 worldwide. And, during the 2010-2011academic year, the University awarded 2,740 degrees.
Minnesota State Mankato offers bachelors, masters, applied doctorate, associate, andspecialist degrees, as well as undergraduate and graduate certificates. During 2010-2011, theUniversity emolled students in four applied doctoral programs. Our most popular programsare elementary education, biology, law enforcement, management and psychology.
OFFICE OF THE PRESIDENT
309 WIGLEY ADMINISTRATION CENTER' MANKATO, MN 56001PHONE 507-389-1111 (V) , 800-627-3529 OK 711 (MRS/TTY) . FAX 507-389-6200
Amember of the Minnesoto State Colleges and Universities System, Minnesota State University, Mankato is an Affirmanve Action/Equal Oppor/unity University,
6
Minnesota State Mankato houses several renowned centers for applied research, includingthe Center on Aging, Center for Applied Social Services, Center for School-UniversityPartnerships, Minnesota Center for Automotive Research, Minnesota Center for RapidPrototyping and Production, Kessel Institute for the Study ofPeace and Change, MinnesotaCenter for Transportation Research and Implementation, International Renewable EnergyTechnology Institute, Center for Continuous Learning, Minnesota Center for Engineering andManufacturing Excellence, Minnesota Modeling and Simulation Center, Space ImageProcessing Center, and Water Resources Center.
The University Theatre and Dance Department continued its long tradition of performinghigh-quality theatre. The Odyssey was one of four productions selected from 1,300 nationwide to be presented at the Kennedy Center for Performing Arts in Washington, D.C. as partof the 44th annual American College Theater Festival in April. In addition, it won eightnational awards (the most in the country) including one for the entire cast for ensembleacting. Additionally, individual awards were presented to students and faculty forperformance, set design, lighting design, sound design, costume design, stage managementand direction.
The Glen Taylor Nursing Institute for Family and Society was founded in 2009 to generatenew ideas and policies about family health care, improve patient care with new "models ofcaring" and other research, create health-care delivery systems that better meet the needs ofdiverse families, develop community and academic partnerships that promote innovativefamily and societal nursing practices, and lead the study of solutions to regional and nationalfamily health problems. It is the only such center in Minnesota, and inspired the creation ofthe International Family Nursing Association. During this year the School ofNursing and theInformation and Technology Division partnered to design and install a state of the art nursingsimulation lab. This lab contains a live feed observation room and allows for the recording ofnurses in simulation scenarios complete with debriefing notes and time lines.
The Minnesota Center for Engineering & Manufacturing Excellence (MNCEME) wascreated by the Board of Trustees in the fall of2005. With Minnesota State Mankato as thelead institution, our six MnSCU partner institutions and industry partners collaborate to laythe groundwork for student success in relevant curricula, seamless transfer models, andopportunities for student internships, faculty research and customized training. All of thiscontributes to support Minnesota industry that is competing in a global market.
Minnesota State Mankato is known throughout the state and nation for our research,particularly in renewable sources of energy. We are conducting leading-edge research inproduction of ethanol from grass, E-20 ethanol conversion kits, wind-generated residentialelectricity and other alternative energy products and sources. Our faculty and students areinvolved in learning and research experiences that will benefit future employers and the stateofMinnesota. We continue as an academic partner in the International Renewable EnergyInstitute (IRETI) that facilitates idea and technology exchange between Sweden and theUnited States. Construction of the new Center of Renewable Energy was completed this yearand provides laboratory space for both IRETI and the Center for Automotive Research. TheCenter is used for testing renewable-energy vehicles, and for testing combustible solid fueland biogas building heating units.
7
Fifty-eight acres of prairie and wetland for environmental, natural science and hydrologyresearch were donated to the University this year. The land is the University's firstenvironmental research plot.
During the 2010-2011 academic year, Minnesota State Mankato fielded 23 intercollegiateathletic teams, including: NCAA Division I WCHA men's and women's hockey; NCAADivision II men's baseball, basketball, cross country, football, golf, track and wrestling; andNCAA Division II women's basketball, cross country, golf, soccer, softball, swimming,tennis, track and volleyball. Over 600 student athletes participated in athletic competitions.These teams are sources of great pride for students and community members. MaverickAthletics enjoyed a high level of success this year including:
CD A second place finish in the Northern Sun Intercollegiate Conference/U.S. Bank AllSports Award in 2010-11.
.. The men's basketball team went to the NCAA D-2 Final Four for the first time inMaverick athletics history.
.. The softball team set a school record for wins and finished 5th at the nationaltournament.
CD Minnesota State was selected as the recipient of the NCAA Division II 2010 GameEnvironment of Excellence Award, for our "Stay Back Tape." The tape helpspromote a positive game environment and was adopted by the NCAA last summer.
The Concrete Canoe Team tied for 1i h in the American Society of Civil Engineers' NationalConcrete Canoe Competition following a first place finish in the regional competition. Thiswas the first time that Minnesota State Mankato qualified for the national competition.
Minnesota State Mankato is a vibrant campus with approximately 240 academic studentgroups, intramural and club sports, leadership and religious organizations, honorary,professional and social fraternities and sororities, and other special interest groups. We host anationally recognized Service-Learning program (our acclaimed Campus Kitchens) withmore than 2,000 students participating annually. Over 300 students in business coursesengaged in service projects with external community agencies. The work of our LGBTCenter has earned the University status as one of the 100 Best Campuses for LGBT studentsas determined by The Advocate College Guide for LGBT Students. After just one year as anew student organization, Mavericks for SHRM (Society for Human Resource Management)received an award from the National Society for Human Resource Management for itsdedication to servingthe needs of its members and to the advancement of the human resourcemanagement profession.
Among the notable achievements of our students: Two students captured top awards in theMilmesota Music Teachers Association Young Artist Piano Competition-the state's mostprestigious competition for young pianists. The Jazz Mavericks and Jazz Singers earned highregional awards at the Eau Claire WI Jazz Festival. Sixteen students and two facultymembers traveled to Mzamomhle, South Africa to distribute clothing to children. Ajuniorchemistry major was one of 305 undergraduates worldwide who received a prestigiousResearch Internship in Science & Engineering fellowships. A recent master's degreegraduate was named Minnesota's Potential School Counselor of the Year. A student wasappointed to the Minnesota State Colleges & Universities Board of Trustees by Governor
8
Mark Dayton. Twenty-two undergraduate students attended and presented their research atthe National Council Undergraduate Research meeting in Ithaca, NY. Two undergraduatestudents presented their research atthe prestigious Council of Undergraduate ResearchPosters on the Hill session, Washington, DC.
Construction is underway on the new 300-bed, semi-suite style residence hall situated on thenorthwest comer of campus with occupancy scheduled in August 2012. The $4.5 millionrenovation of the Centennial Student Union Ballroom is nearing completion in October 2011.
Our educational site in the south metro area, 7700 France, saw continued growth. Studentsare able to finish an undergraduate degree, earn a graduate degree or obtain licensure orcertification in selected fields. It provides a convenient location to serve primarily thenontraditional student. Credit hours generated at this location increased over 33 percent fromthe previous year (4,276 Fall 2010 to 5,716 Fall 2011).
Thanks to generous gifts from alumni and supporters of the University, as of June 30, 2011,total foundation support for the year was an impressive $6.4 million, including $3.67 millionin annual gifts from 11,519 individual donors. Additionally, we received over $4.6 million ingrants and contracts.
Minnesota State Mankato strives to be a good neighbor and community partner, serving as aregional economic and cultural hub in south central Minnesota. TheCities/Colleges/University Advisory Council consisting of the cities ofMankatolNorthMankato, Minnesota State Mankato, the Chamber of Commerce, Greater Mankato EconomicDevelopment Corporation, Mankato Public Schools, Bethany Lutheran College, GustavusAdolphus College, South Central College and Rasmussen College continues to meetregularly to work together on community issues ranging from long-term planning to safety todiversity. Thousands ofpeople from across southern Minnesota and northern Iowa travel toMinnesota State Mankato for our award-winning theatre and musical productions, readingsby renowned poets and authors, presentations by business and industry leaders, art .exhibitions, and nationally-known speakers. The University also hosts a wide variety ofcultural and ethnic events which reflect the University's growing diversity.
We continued our strong relationship with the community - particularly Greater MankatoGrowth, the business and economic development organization in Mankato. We see positiveresults from our Division of Strategic Business, Education and Regional Partnerships throughexpanding connections with education, business and industry. We are working closely withregional employers in developing partnerships that are beneficial to our students, faculty, andour regional employers.
The Small Business Development Center joined Minnesota State Mankato last spring,becoming the state's newest university-based advisor to entrepreneurs and small businesses.It served 240 clients, delivered 1,047 consulting sessions and assisted in raising over $4million in capital for area small businesses, assisting in creating or retaining an estimated 237jobs.
We continue to make progress in enrolling ethnic minority students. In fiscal year 2010,10.5% of our student population identified themselves as being a student of color.
9
The Minnesota State Mankato Iron Range Engineering program enrolled its first students inJanuary, 2011. This is an innovative, collaborative program leading to a professional fouryear engineering degree and is hosted by Mesabi Range College in Virginia, MN. Itsproject-based curriculum makes it a first of its kind in the state ofMinnesota. We will haveour first graduates in December, 2011.
The University continues to make progress on our set of strategic priorities. We are workingto:
• Change the world by collaboratively addressing our planet's most challengingproblems.
• Foster the thriving and robust academic culture of a university with applied doctoralprograms.
• Greatly expand the reach of our extended learning programs.• Reinvigorate our physical home and build the campus of the future.• Measure and continuously improve our work to ensure excellence in all that we do.
We point with pride at the following sample of additional notable accomplishments:
• We were ranked among the top quartile of the nation's four-year public and privatecolleges by Forbes magazine. We were one of four Minnesota public universities onthe list, and the highest-ranking institution in the Minnesota State Colleges andUniversities system.
• For the fifth consecutive year, the MBA program was listed as one ofthe nation'sbest in The Princeton Review's 2011 business school guidebook.
• The University again captured awards in both categories of the statewide MinnesotaState Colleges & Universities System financial and facilities management excellencecompetition. It was the tenth consecutive year the University has received theExcellence in Facilities Management Award, the ninth of 10 years it has received theExcellence in Financial Management Award, and a University administrator receivedan Outstanding Service Award.
The University's financial statements were audited by Kern DeWenter Viere, Ltd. Includedin these financial statements are statements ofnet assets, statements of revenues, expensesand changes in net assets, and statements of cash flows. The financial statements show thatthe University's financial position remained strong during fiscal year 2011. The University'snet assets increased during fiscal year 2011 by $13.0 million and now total $200.1 million.Additionally, the University ended fiscal year 2011 with a general operating fund reserve of$10.2 million. The general operating fund reserve is approximately seven percent of the totalgeneral fund operating revenue from the prior fiscal year, and is at the high end of therequired reserve range of five to seven percent per board policy. This reserve serves toprotect the University in case of financial hardship from unanticipated changes in operatingexpenses, operating revenue, enrollment or state appropriation. For a summary review andexplanation of the financial statements, please review the Management's Discussion andAnalysis section of this report.
10
Responsibility for the accuracy, fairness, and completeness of the information in this reportrests with Finance and Administration staff from Minnesota State University, Mankato andFinance Division staff from the Office of the Chancellor. The completion of this report trulyrepresents a combined effort, and we rely on both units in providing this assurance.Accordingly, the many people who assisted in this effort are deserving of our appreciation.
p ctfully submitted,
Enclosure
Boa
rd o
f Tru
stee
s
Stev
en J.
Ros
enst
one
Cha
ncel
lor
Dr.
Ric
hard
Dav
enpo
rtPr
esid
ent
Scot
t R. O
lson
Vic
e Pr
esid
ent
and
Prov
ost
Aca
dem
ic a
ndSt
uden
t Aff
airs
Rob
ert H
offm
anV
ice
Pres
iden
tSt
rate
gic
Bus
ines
s,Ed
ucat
ion
and
Reg
iona
lPa
rtner
ship
s
Bec
ky B
arkm
eier
Dire
ctor
Hum
an R
esou
rces
Ric
hard
J. S
traka
Vic
e Pr
esid
ent
Fina
nce
&A
dmin
istra
tion
Dou
glas
May
oV
ice
Pres
iden
tU
nive
rsity
Adv
ance
men
t
Ed C
lark
Vic
e Pr
esid
ent
and
Chi
ef In
form
atio
nO
ffic
erIn
form
atio
nTe
chno
logy
Dav
id Jo
nes
Ass
ocia
te V
ice
Pres
iden
t St
uden
t Aff
airs
and
En
rollm
ent M
anag
emen
t
Car
ol S
tallk
amp
Ass
ista
nt to
the
Pres
iden
t
Lind
a H
anso
nD
irect
orA
ffirm
ativ
e A
ctio
n
Min
neso
ta S
tate
Uni
vers
ity, M
anka
toO
rgan
izat
iona
l Cha
rt
MIN
NE
SOT
A S
TA
TE
CO
LL
EG
ES
AN
D U
NIV
ER
SIT
IES
Hen
ry M
orris
Inte
rim D
ean
of D
iver
sity
11
The financial activity of the Minnesota State University, Mankato is included in this report. The University is one of 32 colleges and universities included in the Minnesota State Colleges and Universities Annual Financial Report which is issued separately. The University’s portion of the Revenue Fund is also included in this report. The Revenue Fund activity is included both in the Minnesota State Colleges and Universities Annual Financial Report and in a separately issued Revenue Fund Annual Financial Report. All financial activity of Minnesota State Colleges and Universities is included in the state of Minnesota Comprehensive Annual Financial Report.
12

FINANCIAL SECTION
13
14
~DVExpert advice. When you need it. SM
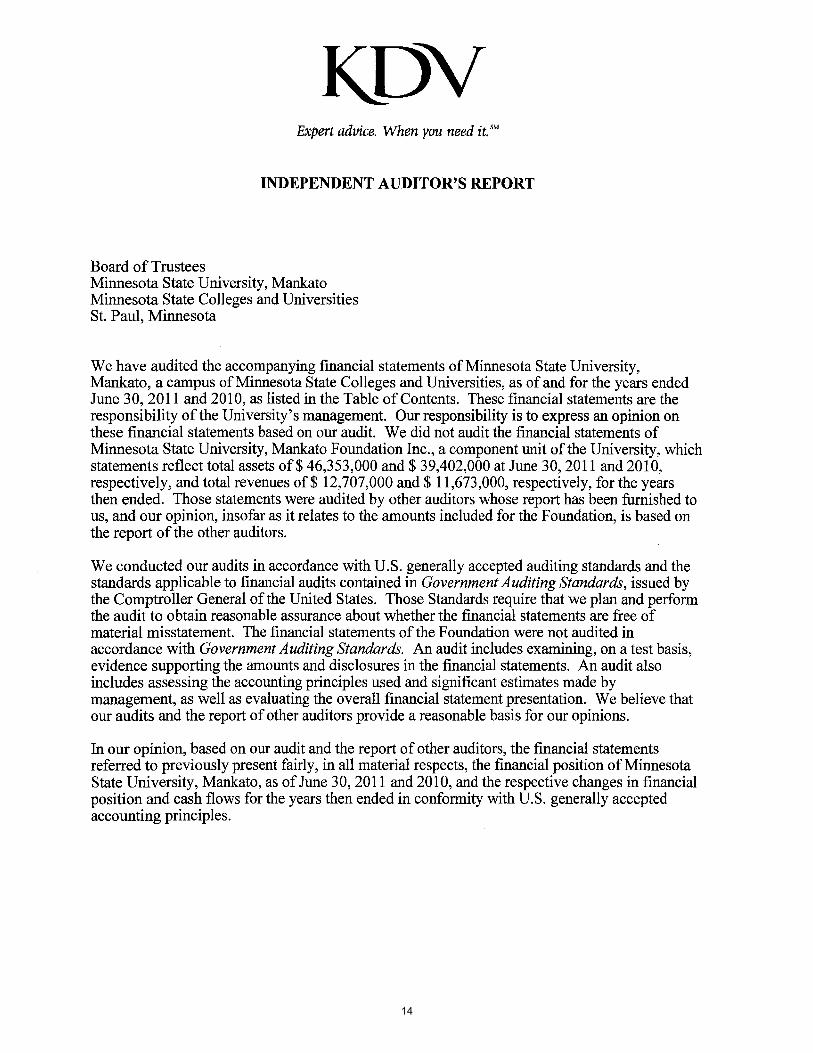
INDEPENDENT AUDITOR'S REPORT
Board of TrusteesMinnesota State University, MankatoMinnesota State Colleges and UniversitiesSt. Paul, Minnesota
We have audited the accompanying financial statements of Minnesota State University,Mankato, a campus of Minnesota State Colleges and Universities, as of and for the years endedJune 30, 2011 and 2010, as listed in the Table of Contents. These financial statements are theresponsibility ofthe University's management. Our responsibility is to express an opinion onthese financial statements based on our audit. We did not audit the financial statements ofMinnesota State University, Mankato Foundation Inc., a component unit of the University, whichstatements reflect total assets of$ 46,353,000 and $ 39,402,000 at June 30, 2011 and 2010,respectively, and total revenues of $ 12,707,000 and $ 11,673,000, respectively, for the yearsthen ended. Those statements were audited by other auditors whose report has been furnished tous, and our opinion, insofar as it relates to the amounts included for the Foundation, is based onthe report of the other auditors.
We conducted our audits in accordance with U.S. generally accepted auditing standards and thestandards applicable to financial audits contained in Government Auditing Standards, issued bythe Comptroller General of the United States. Those Standards require that we plan and performthe audit to obtain reasonable assurance about whether the financial statements are free ofmaterial misstatement. The financial statements of the Foundation were not audited inaccordance with Government Auditing Standards. An audit includes examining, on a test basis,evidence supporting the amounts and disclosures in the financial statements. An audit alsoincludes assessing the accounting principles used and significant estimates made bymanagement, as well as evaluating the overall financial statement presentation. We believe thatour audits and the report of other auditors provide a reasonable basis for our opinions.
In our opinion, based on our audit and the report of other auditors, the financial statementsreferred to previously present fairly, in all material respects, the financial position of MinnesotaState University, Mankato, as of June 30, 2011 and 2010, and the respective changes in financialposition and cash flows for the years then ended in conformity with U.S. generally acceptedaccounting principles.
~DVExpert advice. When you need it. SM
INDEPENDENT AUDITOR'S REPORT
Board of TrusteesMinnesota State University, MankatoMinnesota State Colleges and UniversitiesSt. Paul, Minnesota
We have audited the accompanying financial statements of Minnesota State University,Mankato, a campus of Minnesota State Colleges and Universities, as of and for the years endedJune 30, 2011 and 2010, as listed in the Table of Contents. These financial statements are theresponsibility ofthe University's management. Our responsibility is to express an opinion onthese financial statements based on our audit. We did not audit the financial statements ofMinnesota State University, Mankato Foundation Inc., a component unit of the University, whichstatements reflect total assets of$ 46,353,000 and $ 39,402,000 at June 30, 2011 and 2010,respectively, and total revenues of $ 12,707,000 and $ 11,673,000, respectively, for the yearsthen ended. Those statements were audited by other auditors whose report has been furnished tous, and our opinion, insofar as it relates to the amounts included for the Foundation, is based onthe report of the other auditors.
We conducted our audits in accordance with U.S. generally accepted auditing standards and thestandards applicable to financial audits contained in Government Auditing Standards, issued bythe Comptroller General of the United States. Those Standards require that we plan and performthe audit to obtain reasonable assurance about whether the financial statements are free ofmaterial misstatement. The financial statements of the Foundation were not audited inaccordance with Government Auditing Standards. An audit includes examining, on a test basis,evidence supporting the amounts and disclosures in the financial statements. An audit alsoincludes assessing the accounting principles used and significant estimates made bymanagement, as well as evaluating the overall financial statement presentation. We believe thatour audits and the report of other auditors provide a reasonable basis for our opinions.
In our opinion, based on our audit and the report of other auditors, the financial statementsreferred to previously present fairly, in all material respects, the financial position of MinnesotaState University, Mankato, as of June 30, 2011 and 2010, and the respective changes in financialposition and cash flows for the years then ended in conformity with U.S. generally acceptedaccounting principles.
15
~ov
In accordance with Government Auditing Standards, we have also issued our report datedOctober 28,2011, on our consideration of the University's internal control over financialreporting and our tests of its compliance with certain provisions of laws, regulations, contractsand grant agreements and other matters. The purpose of that report is to describe the scope andour testing of internal control over financial reporting and compliance and the results of thattesting, and not to provide an opinion on the internal control over financial reporting orcompliance. That report is an integral part of an audit performed in accordance with GovernmentAuditing Standards and important for assessing the results of our audit.
U.s. generally accepted accounting principles require that the Management's Discussion andAnalysis, which follows this report letter, and the Schedule of Funding Progress for Net OtherPostemployment Benefits, be presented to supplement the basic financial statements. Suchinformation, although not a part ofthe basic financial statements, is required by theGovernmental Accounting Standards Board (GASB), who considers it to be an essential part offinancial reporting for placing the basic financial statements in an appropriate operational,economic or historical context. We have applied certain limited procedures to the requiredsupplementary information in accordance with U.S. generally accepted auditing standards, whichconsisted of inquiries of management about the methods of preparing the information andcomparing the information for consistency with management's responses to our inquiries, thebasic financial statements, and other knowledge we obtained during our audit of the basicfinancial statements. We do not express an opinion or provide any assurance on the informationbecause the limited procedures do not provide us with sufficient evidence to express an opinionor provide any assurance.
Our audits were conducted for the purpose of forming an opinion on the basic financialstatements ofthe University. The accompanying introductory section identified in the Table ofContents is presented for purposes of additional analysis and is not a required part of the basicfinancial statements. Such information has not been subjected to the auditing procedures appliedby us and, accordingly, we express no opinion on it.
ILl lkW-UA-4, V~, W'KERN, DEWENTER, VIERE, LTD.Bloomington, MinnesotaOctober 28, 2011
MANAGEMENT’S DISCUSSION AND ANALYSIS (Unaudited) INTRODUCTION The following discussion and analysis provides an overview of the financial position and activities of Minnesota State University, Mankato, a member of the Minnesota State Colleges and Universities system, for the fiscal years ended June 30, 2011, 2010, and 2009. This discussion has been prepared by management and should be read in conjunction with the financial statements and accompanying notes, which follow this section. Minnesota State University, Mankato is one of 32 colleges and universities comprising Minnesota State Colleges and Universities. The Minnesota State Colleges and Universities system is governed by a 15 member Board of Trustees appointed by the Governor. Twelve trustees serve six year terms, eight representing each of Minnesota’s congressional districts and four serving at-large. Three student trustees, one from a state university, one from a community college, and one from a technical college, serve two year terms. The Board of Trustees selects the Chancellor and has broad policy responsibility for system planning, academic programs, fiscal management, personnel, admissions requirements, tuition and fees, and policies and procedures. The University is a comprehensive public institution of higher learning that serves more than 14,500 students including 1,900 graduate and professional students. Approximately 1,800 faculty and staff members are employed by the University. Additionally, the University has more than 100,000 alumni. The eight colleges that comprise the University’s academic programs are as follows.
• Allied Health & Nursing • Extended Learning • Arts and Humanities • Graduate Studies and Research • Business • Science, Engineering and Technology • Education • Social and Behavioral Science
The University offers students opportunities for bachelor’s, master’s, applied doctorate, associate, and specialist degrees, as well as graduate certificates. Students can choose from over 150 undergraduate study programs, including 16 pre-professional programs, over 100 graduate study programs, and 4 applied doctorate degree programs. The University is accredited by 24 national accrediting agencies including the North Central Association of Colleges and AACSB International (MBA program). FINANCIAL HIGHLIGHTS The University’s financial position remained strong during fiscal year 2011. Although the University’s state appropriation revenue was reduced by $2.0 million during fiscal year 2011, tuition revenue increased by $5.7 million, federal grant revenue increased by $2.0 million, and salary and benefit expenses decreased by 0.4 million. Over the past three fiscal years, the University has been engaged in an ongoing budget planning process that has resulted in significant operating cost reductions to help stabilize the University’s financial position. For the fiscal year ended June 30, 2011, assets totaled $349.6 million compared to liabilities of $149.5 million. Net assets, which represent the residual interest in the University’s assets after liabilities are deducted, is comprised of capital assets, net of related debt, of $145.2 million; restricted assets of $21.9 million; and unrestricted assets of $33.0 million. The fiscal year 2011 net assets total of $200.1 million represents an increase of $13.0 million over fiscal year 2010 and $34.9 million over fiscal year 2009. The fiscal year 2011 unrestricted net assets total of $33.0 million represents a 38.9 percent increase from the fiscal year 2010 total of $23.8 million and a 95.2 percent increase compared to the fiscal year 2009 total of $16.9 million. Fiscal year 2011 state appropriations revenue, excluding capital appropriations, totaled $52.1 million and represents a 3.7 percent decrease from fiscal year 2010 and a 13.8 percent decrease from fiscal year 2009. Net tuition revenue in fiscal year 2011 reached $68.1 million which is a 9.2 percent increase over fiscal year 2010 and a 13.1 percent increase over fiscal year 2009.
16
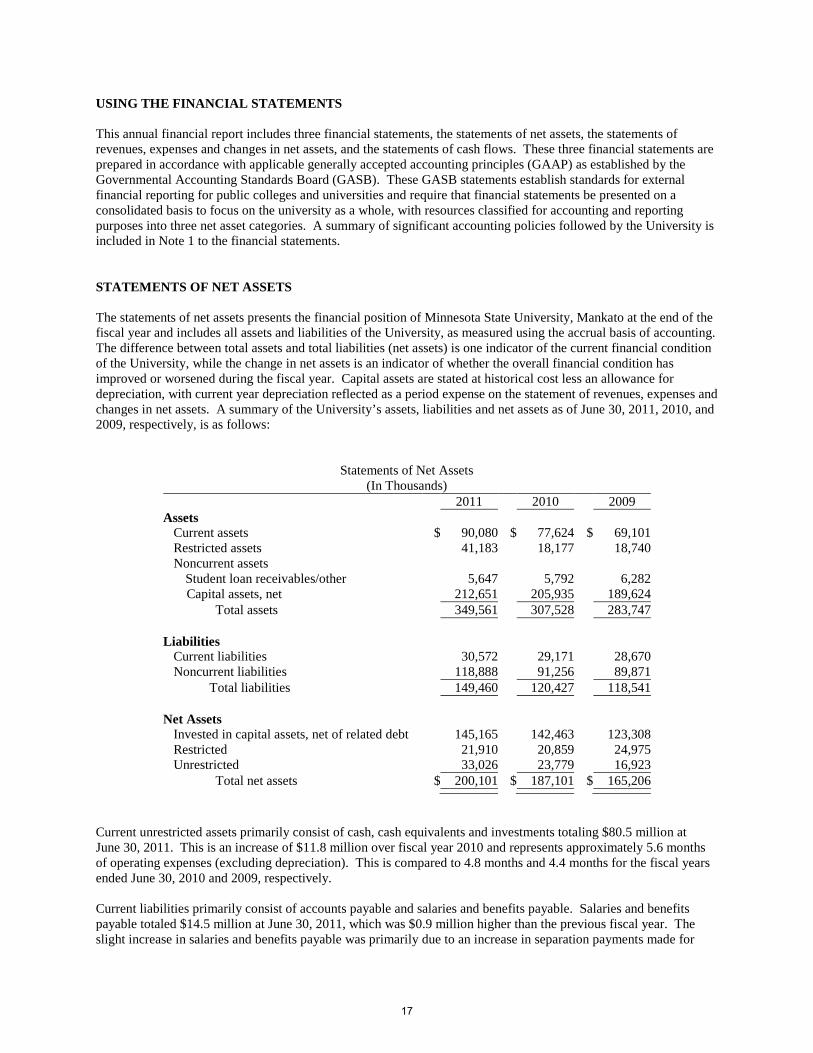
USING THE FINANCIAL STATEMENTS This annual financial report includes three financial statements, the statements of net assets, the statements of revenues, expenses and changes in net assets, and the statements of cash flows. These three financial statements are prepared in accordance with applicable generally accepted accounting principles (GAAP) as established by the Governmental Accounting Standards Board (GASB). These GASB statements establish standards for external financial reporting for public colleges and universities and require that financial statements be presented on a consolidated basis to focus on the university as a whole, with resources classified for accounting and reporting purposes into three net asset categories. A summary of significant accounting policies followed by the University is included in Note 1 to the financial statements. STATEMENTS OF NET ASSETS The statements of net assets presents the financial position of Minnesota State University, Mankato at the end of the fiscal year and includes all assets and liabilities of the University, as measured using the accrual basis of accounting. The difference between total assets and total liabilities (net assets) is one indicator of the current financial condition of the University, while the change in net assets is an indicator of whether the overall financial condition has improved or worsened during the fiscal year. Capital assets are stated at historical cost less an allowance for depreciation, with current year depreciation reflected as a period expense on the statement of revenues, expenses and changes in net assets. A summary of the University’s assets, liabilities and net assets as of June 30, 2011, 2010, and 2009, respectively, is as follows:
Statements of Net Assets (In Thousands)
2011 2010 2009 Assets
Current assets $ 90,080 $ 77,624 $ 69,101 Restricted assets 41,183 18,177 18,740 Noncurrent assets
Student loan receivables/other 5,647 5,792 6,282 Capital assets, net 212,651 205,935 189,624
Total assets 349,561 307,528 283,747 Liabilities
Current liabilities 30,572 29,171 28,670 Noncurrent liabilities 118,888 91,256 89,871
Total liabilities 149,460 120,427 118,541 Net Assets
Invested in capital assets, net of related debt 145,165 142,463 123,308 Restricted 21,910 20,859 24,975 Unrestricted 33,026 23,779 16,923
Total net assets $ 200,101 $ 187,101 $ 165,206
Current unrestricted assets primarily consist of cash, cash equivalents and investments totaling $80.5 million at June 30, 2011. This is an increase of $11.8 million over fiscal year 2010 and represents approximately 5.6 months of operating expenses (excluding depreciation). This is compared to 4.8 months and 4.4 months for the fiscal years ended June 30, 2010 and 2009, respectively. Current liabilities primarily consist of accounts payable and salaries and benefits payable. Salaries and benefits payable totaled $14.5 million at June 30, 2011, which was $0.9 million higher than the previous fiscal year. The slight increase in salaries and benefits payable was primarily due to an increase in separation payments made for
17
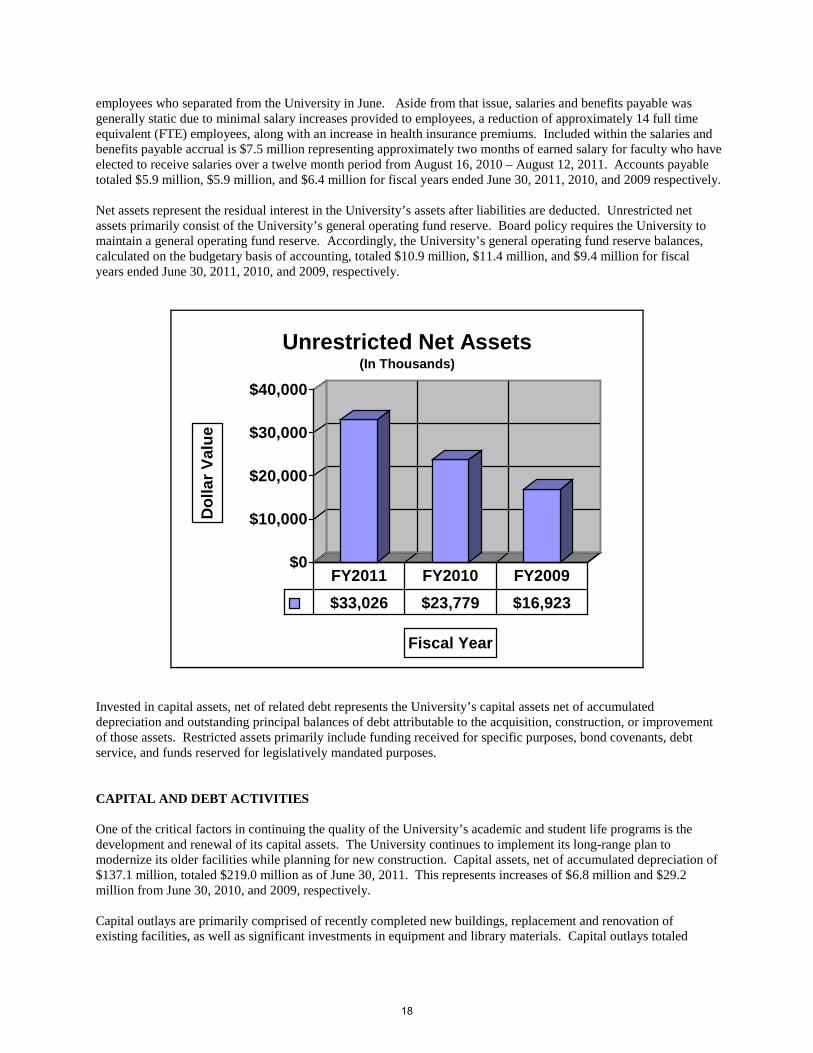
employees who separated from the University in June. Aside from that issue, salaries and benefits payable was generally static due to minimal salary increases provided to employees, a reduction of approximately 14 full time equivalent (FTE) employees, along with an increase in health insurance premiums. Included within the salaries and benefits payable accrual is $7.5 million representing approximately two months of earned salary for faculty who have elected to receive salaries over a twelve month period from August 16, 2010 – August 12, 2011. Accounts payable totaled $5.9 million, $5.9 million, and $6.4 million for fiscal years ended June 30, 2011, 2010, and 2009 respectively. Net assets represent the residual interest in the University’s assets after liabilities are deducted. Unrestricted net assets primarily consist of the University’s general operating fund reserve. Board policy requires the University to maintain a general operating fund reserve. Accordingly, the University’s general operating fund reserve balances, calculated on the budgetary basis of accounting, totaled $10.9 million, $11.4 million, and $9.4 million for fiscal years ended June 30, 2011, 2010, and 2009, respectively.
$0
$10,000
$20,000
$30,000
$40,000
Dol
lar V
alue
Fiscal Year
Unrestricted Net Assets(In Thousands)
$33,026 $23,779 $16,923FY2011 FY2010 FY2009
Invested in capital assets, net of related debt represents the University’s capital assets net of accumulated depreciation and outstanding principal balances of debt attributable to the acquisition, construction, or improvement of those assets. Restricted assets primarily include funding received for specific purposes, bond covenants, debt service, and funds reserved for legislatively mandated purposes. CAPITAL AND DEBT ACTIVITIES One of the critical factors in continuing the quality of the University’s academic and student life programs is the development and renewal of its capital assets. The University continues to implement its long-range plan to modernize its older facilities while planning for new construction. Capital assets, net of accumulated depreciation of $137.1 million, totaled $219.0 million as of June 30, 2011. This represents increases of $6.8 million and $29.2 million from June 30, 2010, and 2009, respectively. Capital outlays are primarily comprised of recently completed new buildings, replacement and renovation of existing facilities, as well as significant investments in equipment and library materials. Capital outlays totaled
18
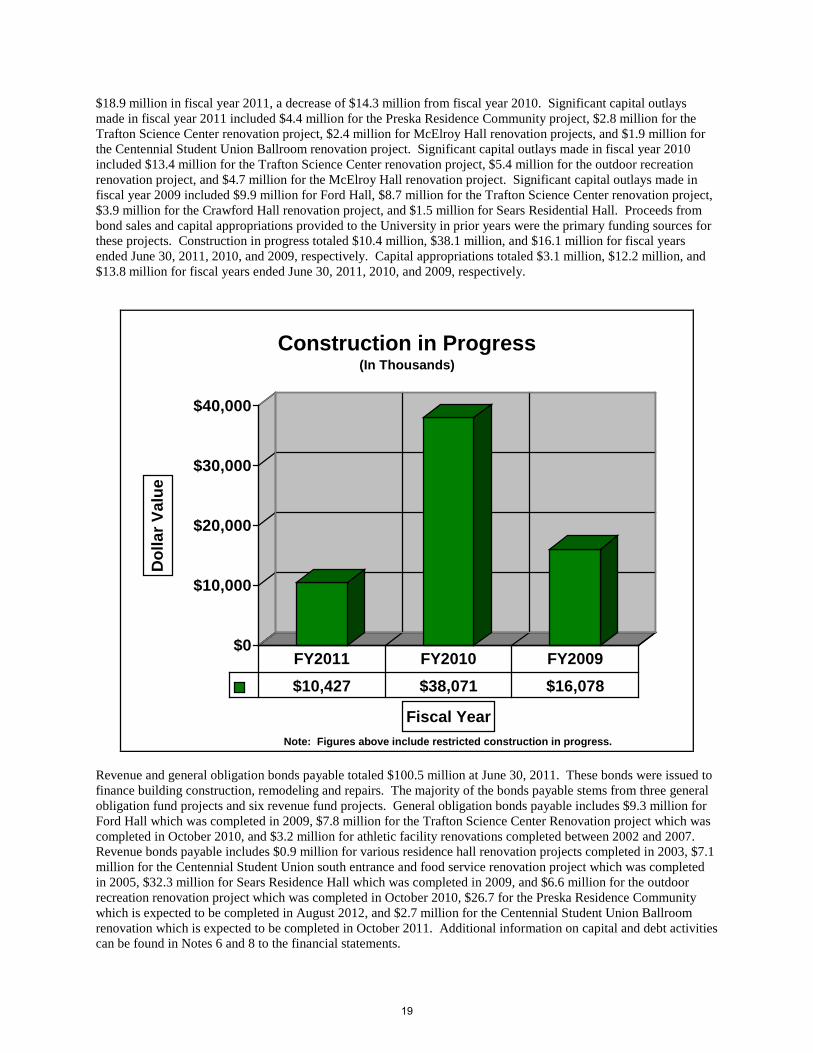
Note: Figures above include restricted construction in progress.
$18.9 million in fiscal year 2011, a decrease of $14.3 million from fiscal year 2010. Significant capital outlays made in fiscal year 2011 included $4.4 million for the Preska Residence Community project, $2.8 million for the Trafton Science Center renovation project, $2.4 million for McElroy Hall renovation projects, and $1.9 million for the Centennial Student Union Ballroom renovation project. Significant capital outlays made in fiscal year 2010 included $13.4 million for the Trafton Science Center renovation project, $5.4 million for the outdoor recreation renovation project, and $4.7 million for the McElroy Hall renovation project. Significant capital outlays made in fiscal year 2009 included $9.9 million for Ford Hall, $8.7 million for the Trafton Science Center renovation project, $3.9 million for the Crawford Hall renovation project, and $1.5 million for Sears Residential Hall. Proceeds from bond sales and capital appropriations provided to the University in prior years were the primary funding sources for these projects. Construction in progress totaled $10.4 million, $38.1 million, and $16.1 million for fiscal years ended June 30, 2011, 2010, and 2009, respectively. Capital appropriations totaled $3.1 million, $12.2 million, and $13.8 million for fiscal years ended June 30, 2011, 2010, and 2009, respectively.
$0
$10,000
$20,000
$30,000
$40,000
Dol
lar V
alue
Fiscal Year
Construction in Progress(In Thousands)
$10,427 $38,071 $16,078FY2011 FY2010 FY2009
Revenue and general obligation bonds payable totaled $100.5 million at June 30, 2011. These bonds were issued to finance building construction, remodeling and repairs. The majority of the bonds payable stems from three general obligation fund projects and six revenue fund projects. General obligation bonds payable includes $9.3 million for Ford Hall which was completed in 2009, $7.8 million for the Trafton Science Center Renovation project which was completed in October 2010, and $3.2 million for athletic facility renovations completed between 2002 and 2007. Revenue bonds payable includes $0.9 million for various residence hall renovation projects completed in 2003, $7.1 million for the Centennial Student Union south entrance and food service renovation project which was completed in 2005, $32.3 million for Sears Residence Hall which was completed in 2009, and $6.6 million for the outdoor recreation renovation project which was completed in October 2010, $26.7 for the Preska Residence Community which is expected to be completed in August 2012, and $2.7 million for the Centennial Student Union Ballroom renovation which is expected to be completed in October 2011. Additional information on capital and debt activities can be found in Notes 6 and 8 to the financial statements.
19
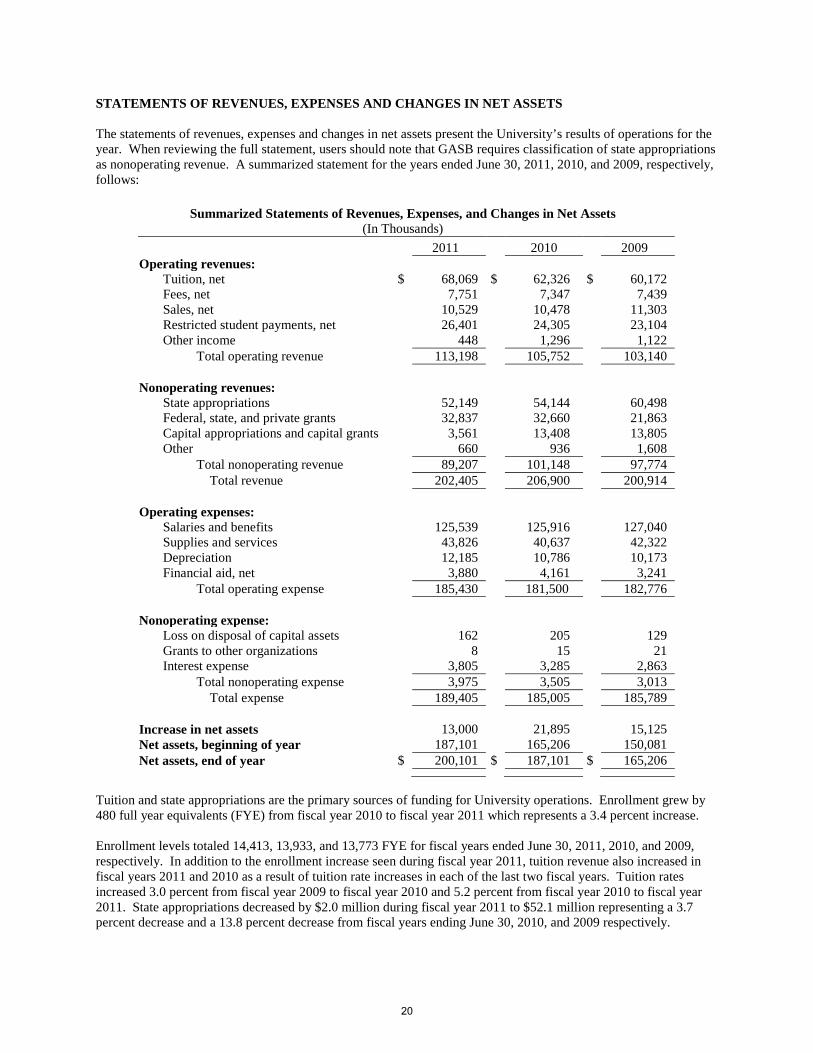
STATEMENTS OF REVENUES, EXPENSES AND CHANGES IN NET ASSETS The statements of revenues, expenses and changes in net assets present the University’s results of operations for the year. When reviewing the full statement, users should note that GASB requires classification of state appropriations as nonoperating revenue. A summarized statement for the years ended June 30, 2011, 2010, and 2009, respectively, follows:
Summarized Statements of Revenues, Expenses, and Changes in Net Assets (In Thousands)
2011 2010 2009 Operating revenues: Tuition, net $ 68,069 $ 62,326 $ 60,172 Fees, net 7,751 7,347 7,439 Sales, net 10,529 10,478 11,303 Restricted student payments, net 26,401 24,305 23,104 Other income 448 1,296 1,122 Total operating revenue 113,198 105,752 103,140 Nonoperating revenues: State appropriations 52,149 54,144 60,498 Federal, state, and private grants 32,837 32,660 21,863 Capital appropriations and capital grants 3,561 13,408 13,805 Other 660 936 1,608 Total nonoperating revenue 89,207 101,148 97,774 Total revenue 202,405 206,900 200,914 Operating expenses: Salaries and benefits 125,539 125,916 127,040 Supplies and services 43,826 40,637 42,322 Depreciation 12,185 10,786 10,173 Financial aid, net 3,880 4,161 3,241 Total operating expense 185,430 181,500 182,776 Nonoperating expense: Loss on disposal of capital assets 162 205 129 Grants to other organizations 8 15 21 Interest expense 3,805 3,285 2,863 Total nonoperating expense 3,975 3,505 3,013 Total expense 189,405 185,005 185,789 Increase in net assets 13,000 21,895 15,125 Net assets, beginning of year 187,101 165,206 150,081 Net assets, end of year $ 200,101 $ 187,101 $ 165,206
Tuition and state appropriations are the primary sources of funding for University operations. Enrollment grew by 480 full year equivalents (FYE) from fiscal year 2010 to fiscal year 2011 which represents a 3.4 percent increase. Enrollment levels totaled 14,413, 13,933, and 13,773 FYE for fiscal years ended June 30, 2011, 2010, and 2009, respectively. In addition to the enrollment increase seen during fiscal year 2011, tuition revenue also increased in fiscal years 2011 and 2010 as a result of tuition rate increases in each of the last two fiscal years. Tuition rates increased 3.0 percent from fiscal year 2009 to fiscal year 2010 and 5.2 percent from fiscal year 2010 to fiscal year 2011. State appropriations decreased by $2.0 million during fiscal year 2011 to $52.1 million representing a 3.7 percent decrease and a 13.8 percent decrease from fiscal years ending June 30, 2010, and 2009 respectively.
20
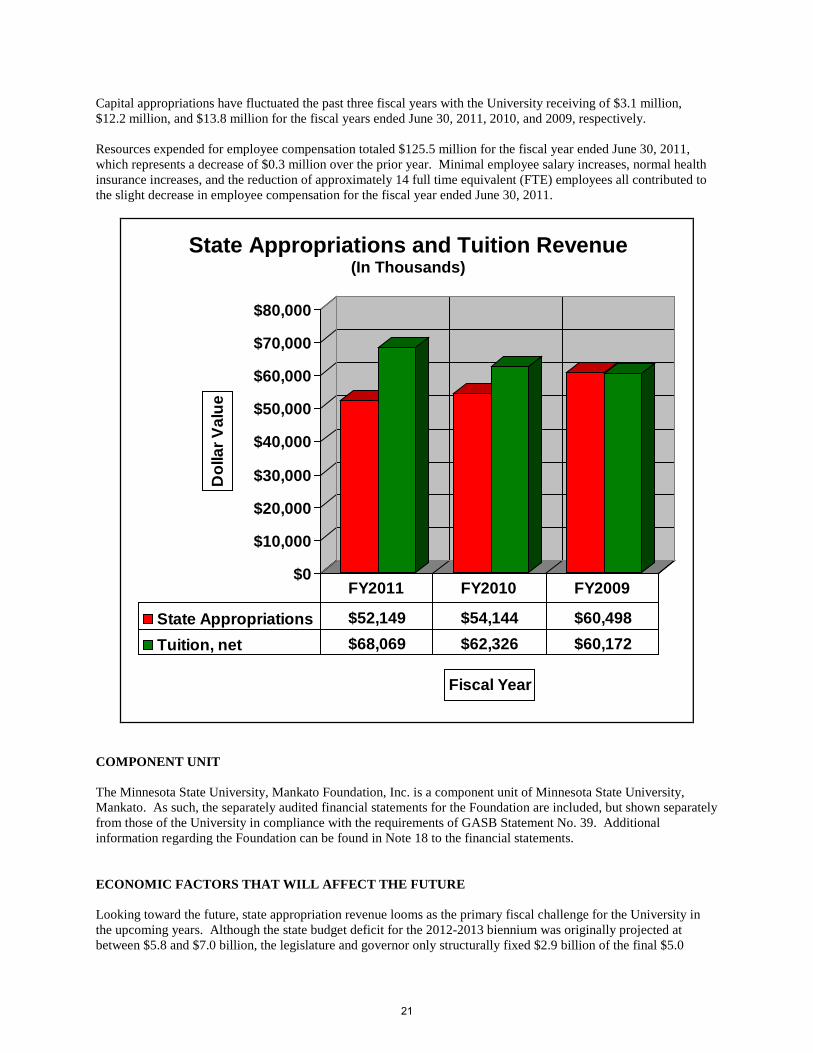
Capital appropriations have fluctuated the past three fiscal years with the University receiving of $3.1 million, $12.2 million, and $13.8 million for the fiscal years ended June 30, 2011, 2010, and 2009, respectively. Resources expended for employee compensation totaled $125.5 million for the fiscal year ended June 30, 2011, which represents a decrease of $0.3 million over the prior year. Minimal employee salary increases, normal health insurance increases, and the reduction of approximately 14 full time equivalent (FTE) employees all contributed to the slight decrease in employee compensation for the fiscal year ended June 30, 2011.
$0
$10,000
$20,000
$30,000
$40,000
$50,000
$60,000
$70,000
$80,000
Dol
lar V
alue
Fiscal Year
State Appropriations $52,149 $54,144 $60,498Tuition, net $68,069 $62,326 $60,172
FY2011 FY2010 FY2009
COMPONENT UNIT The Minnesota State University, Mankato Foundation, Inc. is a component unit of Minnesota State University, Mankato. As such, the separately audited financial statements for the Foundation are included, but shown separately from those of the University in compliance with the requirements of GASB Statement No. 39. Additional information regarding the Foundation can be found in Note 18 to the financial statements. ECONOMIC FACTORS THAT WILL AFFECT THE FUTURE Looking toward the future, state appropriation revenue looms as the primary fiscal challenge for the University in the upcoming years. Although the state budget deficit for the 2012-2013 biennium was originally projected at between $5.8 and $7.0 billion, the legislature and governor only structurally fixed $2.9 billion of the final $5.0
State Appropriations and Tuition Revenue (In Thousands)
21
billion deficit when finalizing the 2012-13 state biennial budget in July 2011. The current biennial reduction to the University’s state appropriation was significantly less than projected, but 40.0 percent of the state budget or approximately $2.1billion of the state budget will still need to be corrected in the 2014-15 biennium, and the University will most likely see another significant appropriation reduction because of this situation. The University faces other challenges in addition to anticipated reductions in state appropriation including:
1) Increasing pressure to limit tuition rate increases 2) Enrollment management challenges as the number of Minnesota high school graduates declines in the near
future 3) Collective bargaining pressure to increase salaries after two years of wage freezes and bargaining
agreements that are unsettled as of October 28, 2011. 4) Increasing employer paid health insurance premiums for employees 5) Impacts on University operations of recently implemented and anticipated budget reductions.
Enrollment management will remain a challenge for the University as demographics project a significant decline in the number of high school graduates within the University’s current primary service areas over the next five years. However, in the short-term, the economic crisis has led and may lead to a short-term increase in demand for higher education from the incumbent work force and increased number of unemployed workers. Enrollment management remains the University’s primary strategic initiative. The University continues to commit resources to maintaining the University’s goal of steady management enrollment growth of approximately 1.0 percent per year. As of October 28, 2011, University enrollment is projected to approach 1.0 percent growth for fiscal year 2012. Collective bargaining for the 2012-13 and 2014-15 bienniums may be challenging. The remaining state budget deficit will be pitted against wages which have been frozen for at least two years. Health insurance costs are anticipated to continue to increase significantly the next three years. The competitiveness of University faculty compensation will also be a factor as University faculty compensation has declined in national competitiveness over the last decade despite a boost in the 2008-2009 biennium. The continued volatility in world financial markets will create a challenging environment for the University’s foundation to increase endowment earnings distributions. In summary, these factors, along with anticipated cost increases for purchased services and supplies, may result in financial challenges for the University in fiscal years 2012, 2013 and beyond. However, the University has made significant structural changes to its base operating budget during the last three years. Those changes, which were implemented using the University’s open budget planning process, which incorporates a shared governance philosophy into decision making, have positioned the University to respond effectively to current and future financial challenges. REQUESTS FOR INFORMATION This financial report is designed to provide a general overview of Minnesota State University, Mankato’s financial position. Questions concerning information provided in this report or requests for additional financial information should be addressed to:
Steve W. Smith Assistant Vice President for Budget and Business Services Minnesota State University, Mankato 236 Wigley Administration Center Mankato, MN 56001 [email protected]
22

This page intentionally left blank
23
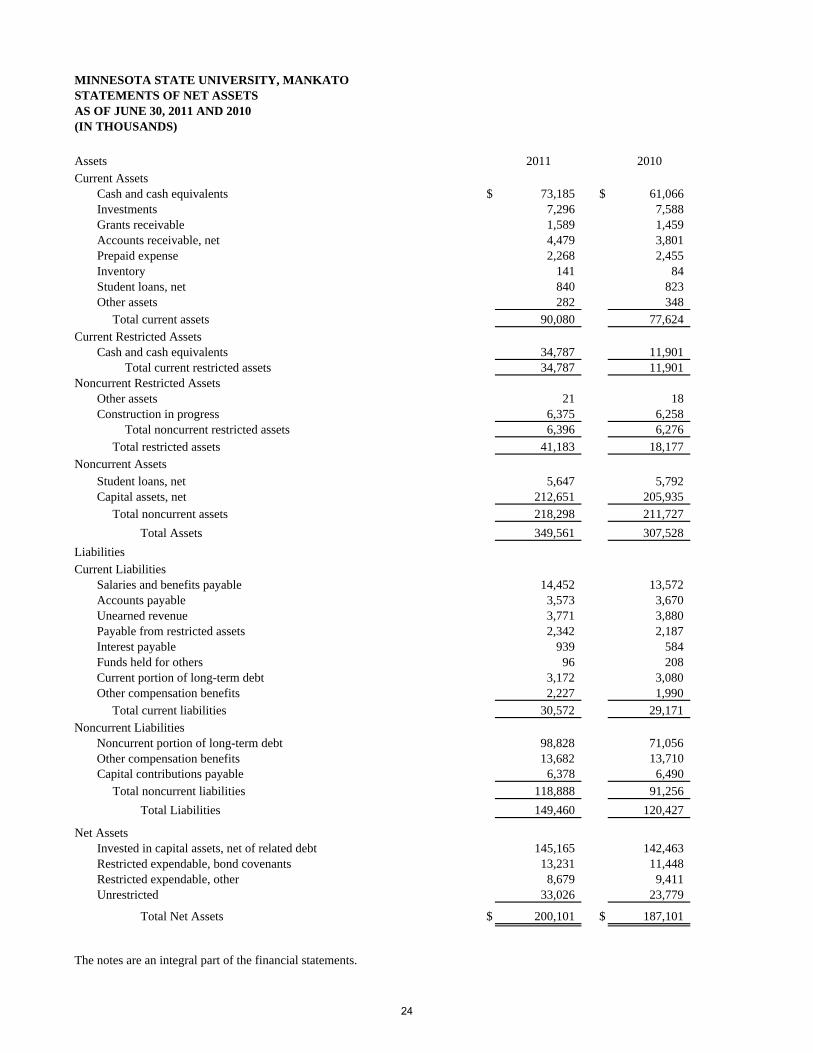
STATEMENTS OF NET ASSETSAS OF JUNE 30, 2011 AND 2010(IN THOUSANDS)
Assets 2011 2010Current Assets
Cash and cash equivalents $ 73,185 $ 61,066 Investments 7,296 7,588 Grants receivable 1,589 1,459 Accounts receivable, net 4,479 3,801 Prepaid expense 2,268 2,455 Inventory 141 84 Student loans, net 840 823 Other assets 282 348 Total current assets 90,080 77,624
Current Restricted AssetsCash and cash equivalents 34,787 11,901 Total current restricted assets 34,787 11,901
Noncurrent Restricted AssetsOther assets 21 18 Construction in progress 6,375 6,258 Total noncurrent restricted assets 6,396 6,276 Total restricted assets 41,183 18,177
Noncurrent AssetsStudent loans, net 5,647 5,792 Capital assets, net 212,651 205,935 Total noncurrent assets 218,298 211,727 Total Assets 349,561 307,528
LiabilitiesCurrent Liabilities
Salaries and benefits payable 14,452 13,572 Accounts payable 3,573 3,670 Unearned revenue 3,771 3,880 Payable from restricted assets 2,342 2,187 Interest payable 939 584 Funds held for others 96 208 Current portion of long-term debt 3,172 3,080 Other compensation benefits 2,227 1,990 Total current liabilities 30,572 29,171
Noncurrent LiabilitiesNoncurrent portion of long-term debt 98,828 71,056 Other compensation benefits 13,682 13,710 Capital contributions payable 6,378 6,490 Total noncurrent liabilities 118,888 91,256 Total Liabilities 149,460 120,427
Net AssetsInvested in capital assets, net of related debt 145,165 142,463 Restricted expendable, bond covenants 13,231 11,448 Restricted expendable, other 8,679 9,411 Unrestricted 33,026 23,779
Total Net Assets $ 200,101 $ 187,101
The notes are an integral part of the financial statements.
MINNESOTA STATE UNIVERSITY, MANKATO
24
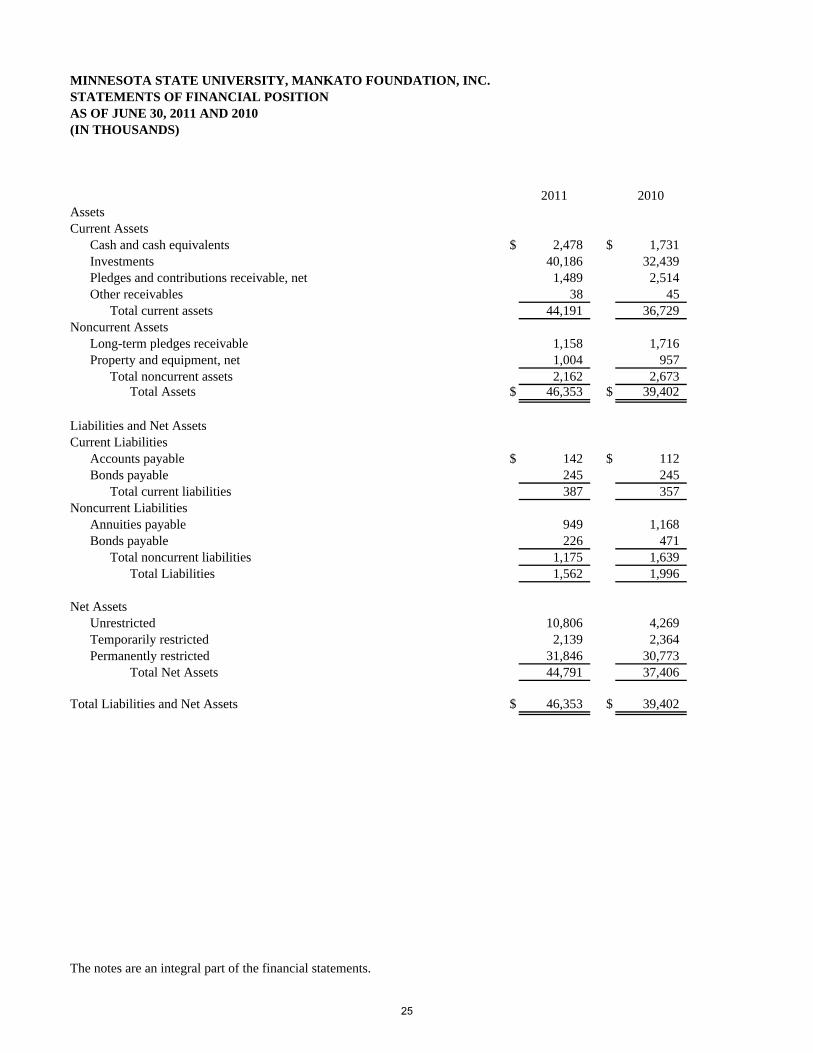
MINNESOTA STATE UNIVERSITY, MANKATO FOUNDATION, INC.
(IN THOUSANDS)
2011 2010AssetsCurrent Assets
Cash and cash equivalents $ 2,478 $ 1,731 Investments 40,186 32,439 Pledges and contributions receivable, net 1,489 2,514 Other receivables 38 45
Total current assets 44,191 36,729 Noncurrent Assets
Long-term pledges receivable 1,158 1,716 Property and equipment, net 1,004 957
Total noncurrent assets 2,162 2,673 Total Assets $ 46,353 $ 39,402
Liabilities and Net AssetsCurrent Liabilities
Accounts payable $ 142 $ 112 Bonds payable 245 245
Total current liabilities 387 357 Noncurrent Liabilities
Annuities payable 949 1,168 Bonds payable 226 471
Total noncurrent liabilities 1,175 1,639 Total Liabilities 1,562 1,996
Net AssetsUnrestricted 10,806 4,269 Temporarily restricted 2,139 2,364 Permanently restricted 31,846 30,773
Total Net Assets 44,791 37,406
Total Liabilities and Net Assets $ 46,353 $ 39,402
The notes are an integral part of the financial statements.
STATEMENTS OF FINANCIAL POSITIONAS OF JUNE 30, 2011 AND 2010
25
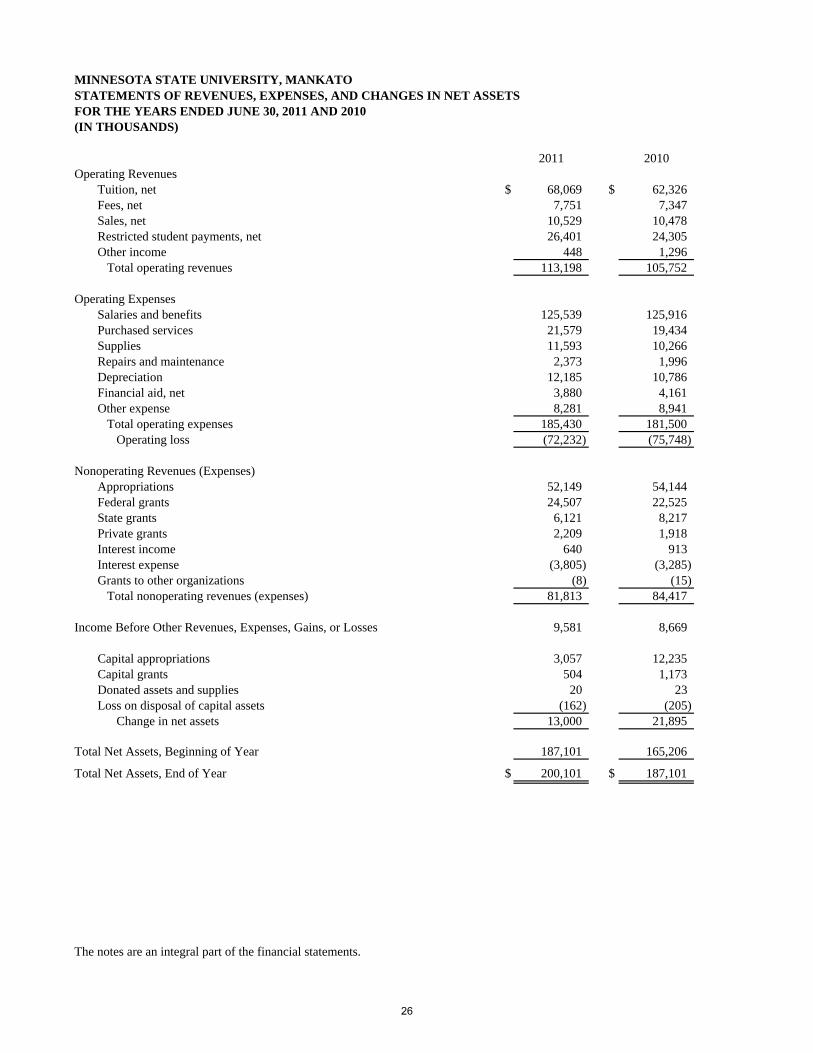
STATEMENTS OF REVENUES, EXPENSES, AND CHANGES IN NET ASSETSFOR THE YEARS ENDED JUNE 30, 2011 AND 2010(IN THOUSANDS)
2011 2010Operating Revenues
Tuition, net $ 68,069 $ 62,326 Fees, net 7,751 7,347 Sales, net 10,529 10,478 Restricted student payments, net 26,401 24,305 Other income 448 1,296 Total operating revenues 113,198 105,752
Operating ExpensesSalaries and benefits 125,539 125,916 Purchased services 21,579 19,434 Supplies 11,593 10,266 Repairs and maintenance 2,373 1,996 Depreciation 12,185 10,786 Financial aid, net 3,880 4,161 Other expense 8,281 8,941 Total operating expenses 185,430 181,500 Operating loss (72,232) (75,748)
Nonoperating Revenues (Expenses)Appropriations 52,149 54,144 Federal grants 24,507 22,525 State grants 6,121 8,217 Private grants 2,209 1,918 Interest income 640 913 Interest expense (3,805) (3,285) Grants to other organizations (8) (15) Total nonoperating revenues (expenses) 81,813 84,417
Income Before Other Revenues, Expenses, Gains, or Losses 9,581 8,669
Capital appropriations 3,057 12,235 Capital grants 504 1,173 Donated assets and supplies 20 23 Loss on disposal of capital assets (162) (205) Change in net assets 13,000 21,895
Total Net Assets, Beginning of Year 187,101 165,206
Total Net Assets, End of Year $ 200,101 $ 187,101
The notes are an integral part of the financial statements.
MINNESOTA STATE UNIVERSITY, MANKATO
26
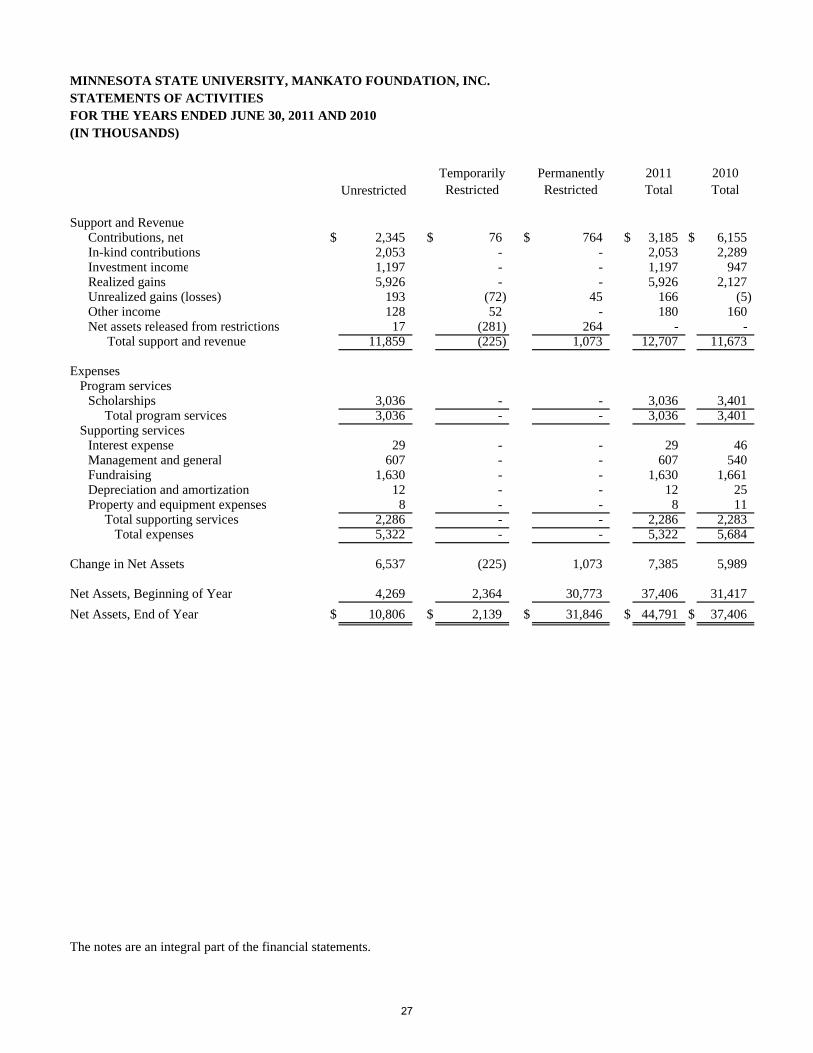
MINNESOTA STATE UNIVERSITY, MANKATO FOUNDATION, INC.STATEMENTS OF ACTIVITIESFOR THE YEARS ENDED JUNE 30, 2011 AND 2010(IN THOUSANDS)
UnrestrictedTemporarily Restricted
Permanently Restricted
2011 Total
2010 Total
Support and RevenueContributions, net $ 2,345 $ 76 $ 764 $ 3,185 $ 6,155 In-kind contributions 2,053 - - 2,053 2,289 Investment income 1,197 - - 1,197 947 Realized gains 5,926 - - 5,926 2,127 Unrealized gains (losses) 193 (72) 45 166 (5) Other income 128 52 - 180 160 Net assets released from restrictions 17 (281) 264 - -
Total support and revenue 11,859 (225) 1,073 12,707 11,673
Expenses Program services
Scholarships 3,036 - - 3,036 3,401 Total program services 3,036 - - 3,036 3,401
Supporting servicesInterest expense 29 - - 29 46 Management and general 607 - - 607 540 Fundraising 1,630 - - 1,630 1,661 Depreciation and amortization 12 - - 12 25 Property and equipment expenses 8 - - 8 11 Total supporting services 2,286 - - 2,286 2,283 Total expenses 5,322 - - 5,322 5,684
Change in Net Assets 6,537 (225) 1,073 7,385 5,989
Net Assets, Beginning of Year 4,269 2,364 30,773 37,406 31,417 Net Assets, End of Year $ 10,806 $ 2,139 $ 31,846 $ 44,791 $ 37,406
The notes are an integral part of the financial statements.
27
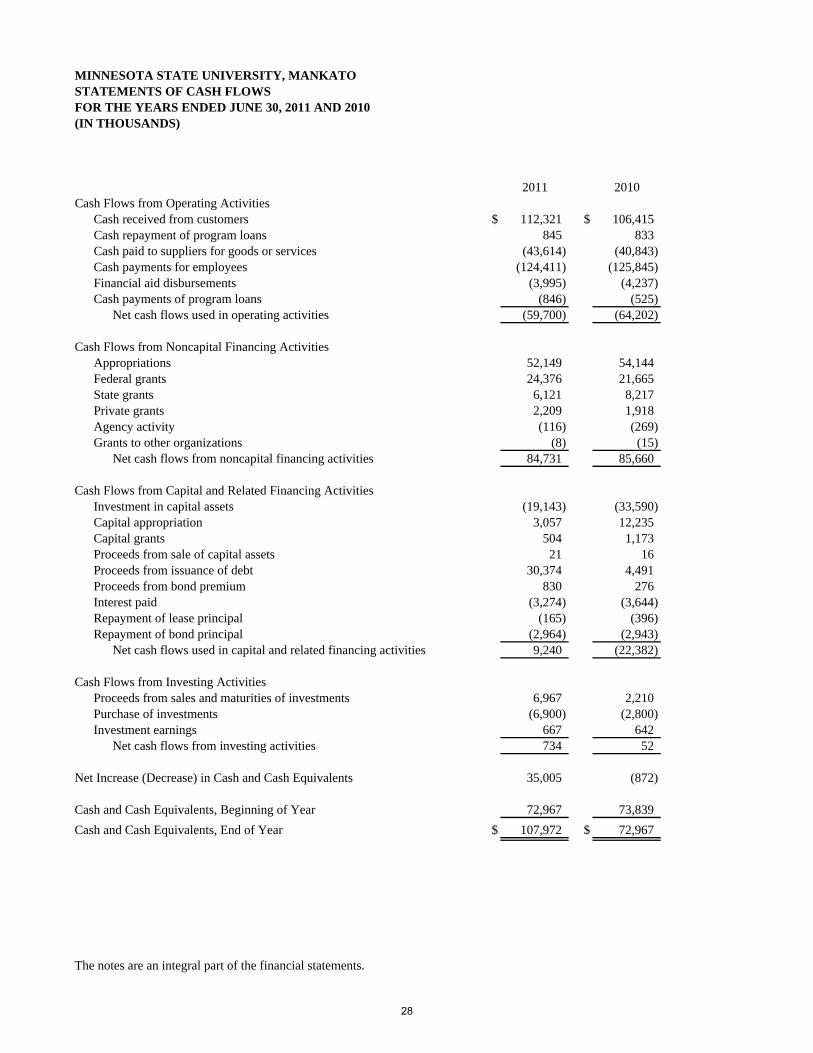
MINNESOTA STATE UNIVERSITY, MANKATOSTATEMENTS OF CASH FLOWSFOR THE YEARS ENDED JUNE 30, 2011 AND 2010(IN THOUSANDS)
2011 2010Cash Flows from Operating Activities
Cash received from customers $ 112,321 $ 106,415 Cash repayment of program loans 845 833 Cash paid to suppliers for goods or services (43,614) (40,843) Cash payments for employees (124,411) (125,845) Financial aid disbursements (3,995) (4,237) Cash payments of program loans (846) (525)
Net cash flows used in operating activities (59,700) (64,202)
Cash Flows from Noncapital Financing ActivitiesAppropriations 52,149 54,144 Federal grants 24,376 21,665 State grants 6,121 8,217 Private grants 2,209 1,918 Agency activity (116) (269) Grants to other organizations (8) (15)
Net cash flows from noncapital financing activities 84,731 85,660
Cash Flows from Capital and Related Financing ActivitiesInvestment in capital assets (19,143) (33,590) Capital appropriation 3,057 12,235 Capital grants 504 1,173 Proceeds from sale of capital assets 21 16 Proceeds from issuance of debt 30,374 4,491 Proceeds from bond premium 830 276 Interest paid (3,274) (3,644) Repayment of lease principal (165) (396) Repayment of bond principal (2,964) (2,943)
Net cash flows used in capital and related financing activities 9,240 (22,382)
Cash Flows from Investing ActivitiesProceeds from sales and maturities of investments 6,967 2,210 Purchase of investments (6,900) (2,800) Investment earnings 667 642
Net cash flows from investing activities 734 52
Net Increase (Decrease) in Cash and Cash Equivalents 35,005 (872)
Cash and Cash Equivalents, Beginning of Year 72,967 73,839 Cash and Cash Equivalents, End of Year $ 107,972 $ 72,967
The notes are an integral part of the financial statements.
28
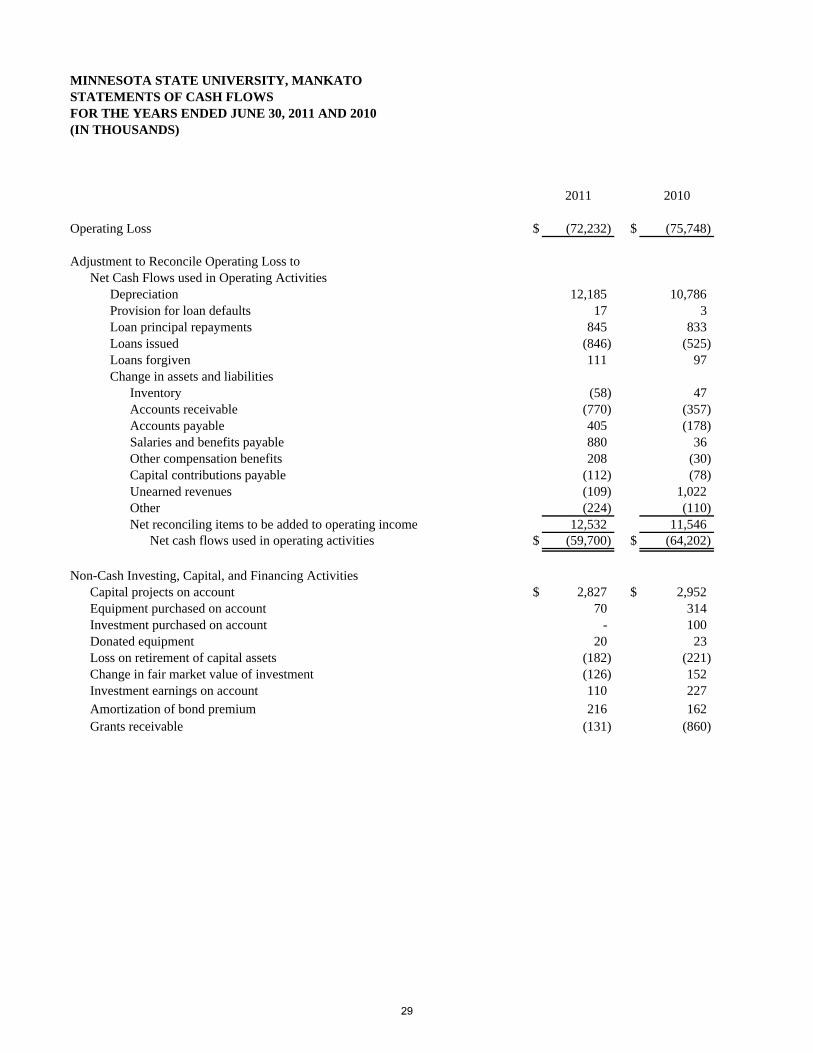
MINNESOTA STATE UNIVERSITY, MANKATOSTATEMENTS OF CASH FLOWSFOR THE YEARS ENDED JUNE 30, 2011 AND 2010(IN THOUSANDS)
2011 2010
Operating Loss $ (72,232) $ (75,748)
Adjustment to Reconcile Operating Loss toNet Cash Flows used in Operating Activities
Depreciation 12,185 10,786 Provision for loan defaults 17 3 Loan principal repayments 845 833 Loans issued (846) (525) Loans forgiven 111 97 Change in assets and liabilities
Inventory (58) 47 Accounts receivable (770) (357) Accounts payable 405 (178) Salaries and benefits payable 880 36 Other compensation benefits 208 (30) Capital contributions payable (112) (78) Unearned revenues (109) 1,022 Other (224) (110) Net reconciling items to be added to operating income 12,532 11,546
Net cash flows used in operating activities $ (59,700) $ (64,202)
Non-Cash Investing, Capital, and Financing ActivitiesCapital projects on account $ 2,827 $ 2,952 Equipment purchased on account 70 314 Investment purchased on account - 100 Donated equipment 20 23 Loss on retirement of capital assets (182) (221) Change in fair market value of investment (126) 152 Investment earnings on account 110 227 Amortization of bond premium 216 162 Grants receivable (131) (860)
29
MINNESOTA STATE UNIVERSITY, MANKATO NOTES TO THE FINANCIAL STATEMENTS YEARS ENDED JUNE 30, 2011 AND 2010
1. SUMMARY OF SIGNIFICANT ACCOUNTING AND REPORTING POLICIES Basis of Presentation — The reporting policies of Minnesota State University, Mankato, a member of the Minnesota State Colleges and Universities system, conform to generally accepted accounting principles (GAAP) as prescribed by the Governmental Accounting Standards Board (GASB). The statements of net assets; statements of revenues, expenses, and changes in net assets; and statements of cash flows include financial activities of Minnesota State University, Mankato. Financial Reporting Entity — Minnesota State Colleges and Universities is an agency of the state of Minnesota and receives appropriations from the state legislature, substantially all of which are used to fund general operations. Minnesota State University, Mankato receives a portion of the Minnesota State Colleges and Universities’ appropriation. The operations of most student organizations are included in the reporting entity because the Board of Trustees has certain fiduciary responsibilities for these resources. Discretely presented component units are legally separate organizations that raise and hold economic resources for the direct benefit of a college or university in accordance with GASB Statement No. 39, Determining Whether Certain Organizations are Component Units. The Minnesota State University, Mankato Foundation, Inc. is considered significant to the University and is included as a discretely presented component unit and separately identified in Note 18. Complete financial statements may be obtained from the Minnesota State University, Mankato Foundation, Inc., 224 Alumni Foundation Center, 1536 Warren Street, Mankato, Minnesota 56001. Basis of Accounting — The basis of accounting refers to when revenues and expenses are recognized and reported in the financial statements. The accompanying financial statements have been prepared as a special purpose government entity engaged in business type activities. Business type activities are those that are financed in whole or in part by fees charged to external parties for goods or services. Accordingly, these financial statements have been presented using the economic resources measurement focus and the accrual basis of accounting. Revenues are recognized when earned and expenses are recognized as they are incurred. Eliminations have been made to minimize the double counting of internal activities. Interfund receivables and payables have been eliminated in the statements of net assets. Minnesota State Colleges and Universities applies all applicable Financial Accounting Standards Board statements issued prior to November 30, 1989, and GASB statements issued since that date. Budgetary Accounting — University budgetary accounting, which is the basis for annual budgets and the allocation of state appropriations, differs from GAAP. University budgetary accounting includes all receipts and expenses up to the close of the books in August for the budget fiscal year. Revenues not yet received by the close of the books are not included. The criterion for recognizing expenses is the actual disbursement, not when the goods or services are received. The state of Minnesota operates on a two year (biennial) budget cycle ending on June 30 of odd numbered years. Minnesota State Colleges and Universities is governed by a 15 member board of trustees appointed by the Governor with the advice and consent of the state senate. The Board approves the University biennial budget request and allocation as part of the Minnesota State Colleges and Universities’ total budget. Budgetary control is maintained at the University. The University President has the authority and responsibility to administer the budget and can transfer money between programs within the University without Board approval. The budget of the University can be legally amended by the authority of the Vice Chancellor/Chief Financial Officer.
30
The state appropriations do not lapse at year end. Any unexpended appropriation from the first year of a biennium is available for the second year. Any unexpended balance may also carry over into future bienniums. Capital Appropriation Revenue —Minnesota State Colleges and Universities is responsible for paying one third of the debt service for certain general obligation bonds sold for capital projects, as specified in the authorizing legislation. The portion of general obligation bond debt service that is payable by the state of Minnesota is recognized by the Minnesota State Colleges and Universities as capital appropriation revenue when the related expenses are incurred. Individual colleges and universities are allocated cash, capital appropriation revenue, and debt based on capital project expenses. Cash and Cash Equivalents —The cash balance represents cash in the state treasury and demand deposits in local bank accounts as well as cash equivalents. Cash equivalents are short term, liquid investments having original maturities (remaining time to maturity at acquisition) of three months or less. Cash and cash equivalents include amounts in demand deposits, savings accounts, cash management pools, repurchase agreements, and money market funds. Restricted cash is cash held for capital projects and cash in the Revenue Fund for capital projects and debt service. The Revenue Fund is used to account for the revenues, expenses, and net assets of revenue producing facilities, which are supported through usage. It has the authority to sell revenue bonds for the construction and maintenance of revenue producing facilities. All balances related to the state appropriation, tuition revenues, and most fees are in the state treasury. The University also has three accounts in local banks. The activities handled through local banks include financial aid, student payroll, auxiliary, and student activities. Investments — The Minnesota State Board of Investment invests the University’s balances in the state treasury, except for the Revenue Fund, as part of a state investment pool. This asset is reported as a cash equivalent. Interest income earned on pooled investments is retained by the Office of the Chancellor and allocated to the colleges and universities. Cash in the Revenue Fund is invested separately. The Fund contracts with the Minnesota State Board of Investment and U.S. Bank, N.A. for investment management services. Investments are reported at fair value. Restricted investments are investments held in the Revenue Fund for capital projects and debt service. Receivables — Receivables are shown net of an allowance for uncollectible accounts. Inventories — Inventories are valued at cost using the first in, first out and actual cost methods. Prepaid Expense — Prepaid expense consists primarily of deposits in the state of Minnesota Debt Service Fund for future general obligation bond payments. Capital Assets — Capital assets are recorded at cost or, for donated assets, at fair value at the date of acquisition. Estimated historical cost has been used when actual cost is not available. Such assets are depreciated or amortized on a straight line basis over the useful life of the assets. Estimated useful lives are as follows:
Buildings 35-40 years Building improvements 15-20 years Equipment 3-20 years Internally developed software 7 years Library collections 7 years
Equipment includes all items with an original cost of $10,000 and over for items purchased since July 1, 2008; $5,000 and over for items purchased between July 1, 2003 and June 30, 2008; and $2,000 and over for items purchased prior to July 1, 2003. Buildings, building improvements, and internally developed software include all projects with a cost of $250,000 and over for projects started since July 1, 2008, and $100,000 and over for
31
projects started prior to July 1, 2008. All land and library collection purchases are capitalized regardless of amount spent. Funds Held for Others — Funds held for others are primarily assets held for student organizations. Long Term Liabilities — The state of Minnesota appropriates for and sells general obligation bonds to support construction and renovation of the Minnesota State Colleges and Universities’ facilities as approved through the state’s capital budget process. The University is responsible for a portion of the debt service on the bonds sold for some University projects. The University may also enter into capital lease agreements for certain capital assets. Other long term liabilities include compensated absences, early termination benefits, net other postemployment benefits, and workers’ compensation claims. Minnesota State Colleges and Universities may finance the construction, renovation and acquisition of facilities for student residences and student unions through the sale of revenue bonds. These activities are accounted for and reported in the Revenue Fund included herein. Details on the Revenue Fund bonds are available in the separately audited and issued Revenue Fund annual financial report. Copies are available from the Financial Reporting Director, Minnesota State Colleges and Universities, 30 7th St. E., Suite 350, St. Paul, Minnesota 55101-7804. Unearned Revenue — Unearned revenue consists primarily of tuition received, but not yet earned, for summer and fall terms. It also includes residential hall room deposits, parking permit deposits, and amounts received from grants, which have not yet been earned under the terms of the agreement. Operating Activities — Operating activities as reported in the statements of revenues, expenses, and changes in net assets are those that generally result from exchange transactions such as payments received for providing services and payments made for services or goods received. Nearly all of the University’s expenses are from exchange transactions. Certain significant revenue streams relied upon for operations are recorded as nonoperating revenues, including state appropriations, federal, state and private grants and investment income. Tuition, Fees, and Sales, Net — Tuition, fees, and sales are reported net of scholarship allowances. See Note 12 for additional information.
Restricted Student Payments — Restricted student payments consist of room, board, sales, and fee revenue restricted for payment of revenue bonds, and are net of scholarship allowances. See Note 12 for additional information.
Federal Grants — The University participates in several federal grant programs. The largest programs include Pell, Supplemental Educational Opportunity Grant, Federal Work Study, and TRIO. Federal Grant revenue is recognized as nonoperating revenue in accordance with GASB Statement No. 33, Accounting and Financial Reporting for Nonexchange Transactions. During fiscal years 2011 and 2010, $3,765,861 and $4,626,534 of federal aid was recognized as revenue related to the American Recovery and Reinvestment Act of 2009. Of this amount, $1,345,751 and $1,223,881, respectively, was used to mitigate tuition increases that would have otherwise been necessary. Expenditures under government contracts are subject to review by the granting authority. To the extent, if any, that such a review reduces expenditures allowable under these contracts, the University will record such disallowance at the time the determination is made. Capital Grants — The University receives federal, state, and private grants which are restricted for the acquisition or construction of capital assets. Reclassifications —Certain prior year amounts have been reclassified to conform with current year presentation. These classifications had no effect on net assets previously reported. Cost of goods sold in the amount of $1,192,918, reported in fiscal year 2010 as a reduction to sales revenue, was reclassified to an operating expense. Capital appropriation revenue in the amount of $354,881 was reclassified as state appropriation revenue. These reclassifications had no effect on total operating loss. Additionally, fiscal year 2010 restricted
32
expendable net assets restricting in the amount of $3,427,298 was reclassified to invested in capital assets, net of related debt. Use of Estimates — To prepare the basic financial statements in conformity with generally accepted accounting principles, management must make estimates and assumptions. These estimates and assumptions may affect the reported amounts of assets and liabilities and disclosure of contingent assets and liabilities, at the date of the financial statements and the reported amounts of revenues and expenses during the reporting period. Actual results could differ from those estimates. The most significant areas that require the use of management’s estimates relate to allowances for uncollectible accounts, scholarship allowances, workers’ compensation claims, and compensated absences. Net Assets — The difference between assets and liabilities is net assets. Net assets are further classified for accounting and reporting purposes into the following three net asset categories:
• Invested in capital assets, net of related debt: Capital assets, net of accumulated depreciation and outstanding principal balances of debt attributable to the acquisition, construction, or improvement of those assets.
• Restricted expendable net assets: Net assets subject to externally imposed stipulations. Net asset restrictions for the University are as follows:
Restricted for bond covenants — revenue bond restrictions Restricted for other — includes restrictions for the following:
Donations — restricted per donor requests. Loans — University capital contributed for Perkins loans. Capital projects — restricted for completion of capital projects. Debt service — legally restricted for bond debt repayments. Faculty contract obligations — faculty development and travel required by contracts.
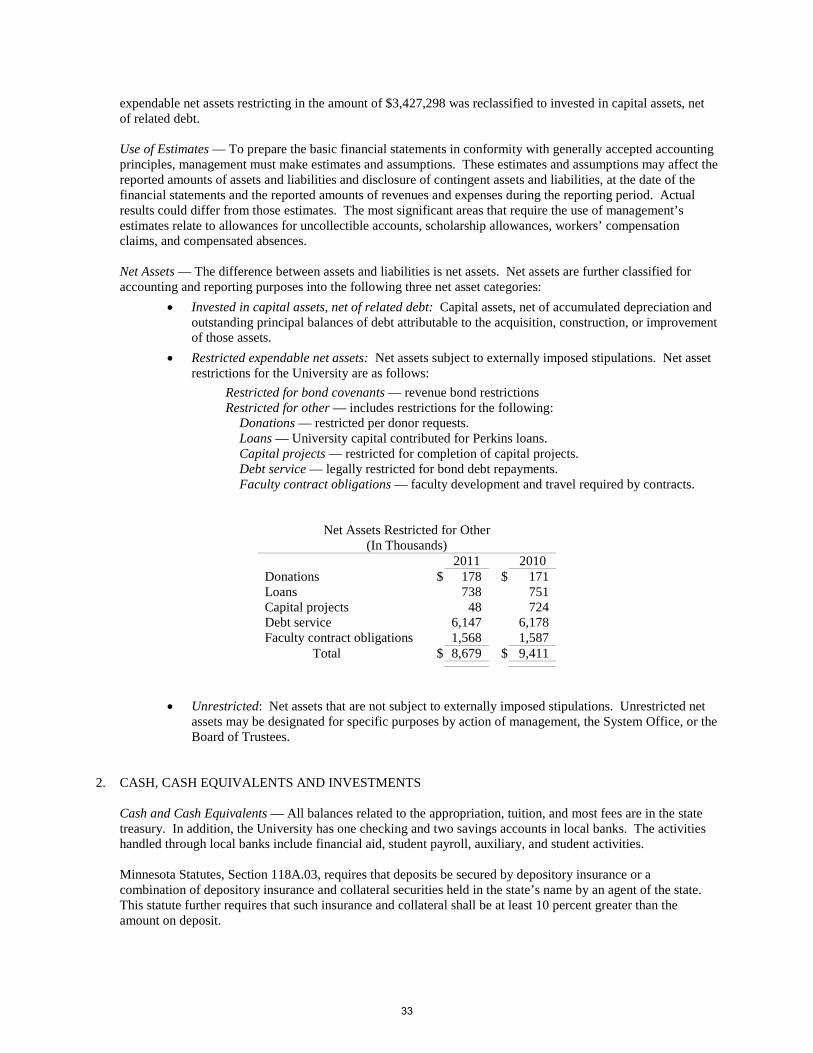
Net Assets Restricted for Other (In Thousands)
2011 2010 Donations $ 178 $ 171 Loans 738 751 Capital projects 48 724 Debt service 6,147 6,178 Faculty contract obligations 1,568 1,587 Total $ 8,679 $ 9,411
• Unrestricted: Net assets that are not subject to externally imposed stipulations. Unrestricted net
assets may be designated for specific purposes by action of management, the System Office, or the Board of Trustees.
2. CASH, CASH EQUIVALENTS AND INVESTMENTS Cash and Cash Equivalents — All balances related to the appropriation, tuition, and most fees are in the state treasury. In addition, the University has one checking and two savings accounts in local banks. The activities handled through local banks include financial aid, student payroll, auxiliary, and student activities. Minnesota Statutes, Section 118A.03, requires that deposits be secured by depository insurance or a combination of depository insurance and collateral securities held in the state’s name by an agent of the state. This statute further requires that such insurance and collateral shall be at least 10 percent greater than the amount on deposit.
33
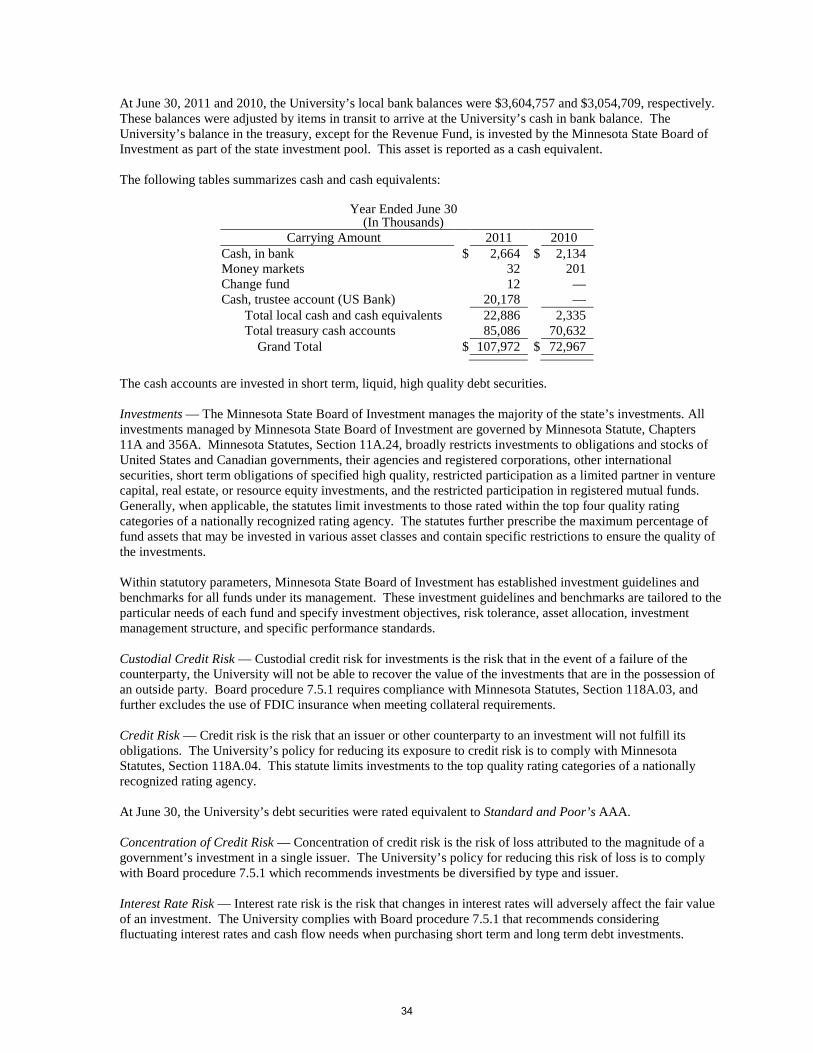
At June 30, 2011 and 2010, the University’s local bank balances were $3,604,757 and $3,054,709, respectively. These balances were adjusted by items in transit to arrive at the University’s cash in bank balance. The University’s balance in the treasury, except for the Revenue Fund, is invested by the Minnesota State Board of Investment as part of the state investment pool. This asset is reported as a cash equivalent. The following tables summarizes cash and cash equivalents:
Year Ended June 30 (In Thousands)
Carrying Amount 2011 2010 Cash, in bank $ 2,664 $ 2,134 Money markets 32 201 Change fund 12 — Cash, trustee account (US Bank) 20,178 —
Total local cash and cash equivalents 22,886 2,335 Total treasury cash accounts 85,086 70,632
Grand Total $ 107,972 $ 72,967
The cash accounts are invested in short term, liquid, high quality debt securities. Investments — The Minnesota State Board of Investment manages the majority of the state’s investments. All investments managed by Minnesota State Board of Investment are governed by Minnesota Statute, Chapters 11A and 356A. Minnesota Statutes, Section 11A.24, broadly restricts investments to obligations and stocks of United States and Canadian governments, their agencies and registered corporations, other international securities, short term obligations of specified high quality, restricted participation as a limited partner in venture capital, real estate, or resource equity investments, and the restricted participation in registered mutual funds. Generally, when applicable, the statutes limit investments to those rated within the top four quality rating categories of a nationally recognized rating agency. The statutes further prescribe the maximum percentage of fund assets that may be invested in various asset classes and contain specific restrictions to ensure the quality of the investments. Within statutory parameters, Minnesota State Board of Investment has established investment guidelines and benchmarks for all funds under its management. These investment guidelines and benchmarks are tailored to the particular needs of each fund and specify investment objectives, risk tolerance, asset allocation, investment management structure, and specific performance standards. Custodial Credit Risk — Custodial credit risk for investments is the risk that in the event of a failure of the counterparty, the University will not be able to recover the value of the investments that are in the possession of an outside party. Board procedure 7.5.1 requires compliance with Minnesota Statutes, Section 118A.03, and further excludes the use of FDIC insurance when meeting collateral requirements. Credit Risk — Credit risk is the risk that an issuer or other counterparty to an investment will not fulfill its obligations. The University’s policy for reducing its exposure to credit risk is to comply with Minnesota Statutes, Section 118A.04. This statute limits investments to the top quality rating categories of a nationally recognized rating agency. At June 30, the University’s debt securities were rated equivalent to Standard and Poor’s AAA. Concentration of Credit Risk — Concentration of credit risk is the risk of loss attributed to the magnitude of a government’s investment in a single issuer. The University’s policy for reducing this risk of loss is to comply with Board procedure 7.5.1 which recommends investments be diversified by type and issuer. Interest Rate Risk — Interest rate risk is the risk that changes in interest rates will adversely affect the fair value of an investment. The University complies with Board procedure 7.5.1 that recommends considering fluctuating interest rates and cash flow needs when purchasing short term and long term debt investments.
34
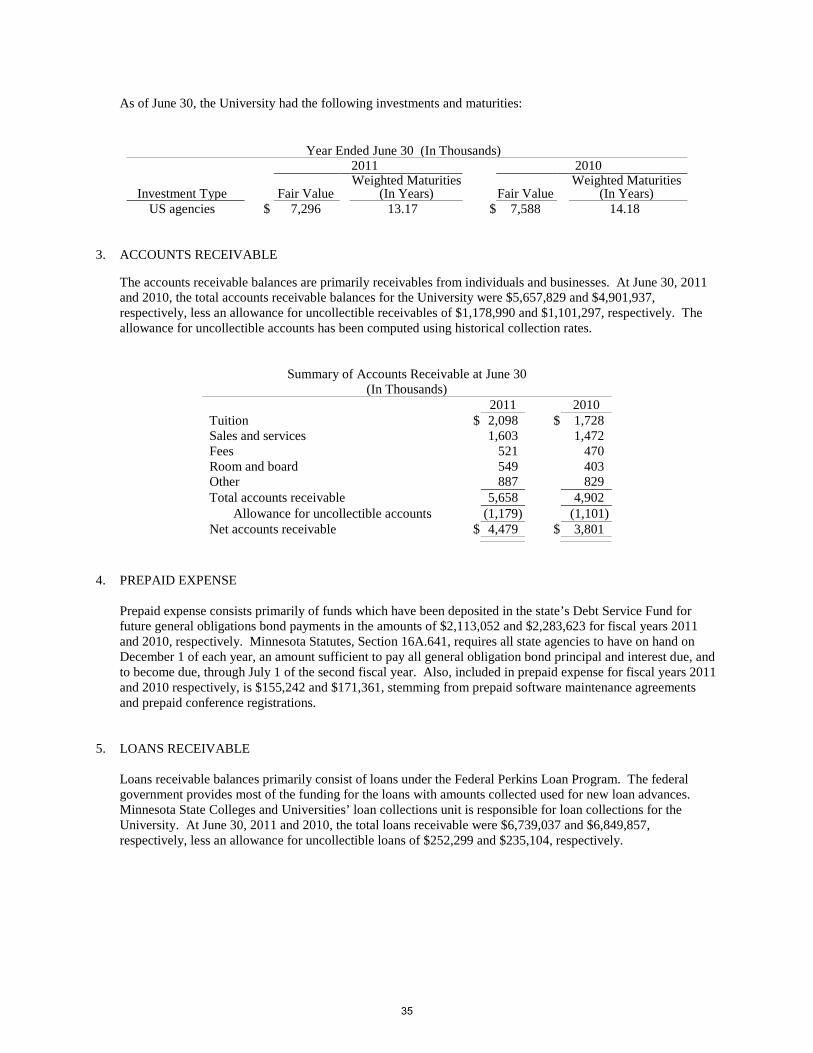
As of June 30, the University had the following investments and maturities:
Year Ended June 30 (In Thousands) 2011 2010
Investment Type Fair Value Weighted Maturities
(In Years) Fair Value Weighted Maturities
(In Years) US agencies $ 7,296 13.17 $ 7,588 14.18
3. ACCOUNTS RECEIVABLE
The accounts receivable balances are primarily receivables from individuals and businesses. At June 30, 2011 and 2010, the total accounts receivable balances for the University were $5,657,829 and $4,901,937, respectively, less an allowance for uncollectible receivables of $1,178,990 and $1,101,297, respectively. The allowance for uncollectible accounts has been computed using historical collection rates.
Summary of Accounts Receivable at June 30 (In Thousands)
2011 2010 Tuition $ 2,098 $ 1,728 Sales and services 1,603 1,472 Fees 521 470 Room and board 549 403 Other 887 829 Total accounts receivable 5,658 4,902 Allowance for uncollectible accounts (1,179) (1,101) Net accounts receivable $ 4,479 $ 3,801
4. PREPAID EXPENSE
Prepaid expense consists primarily of funds which have been deposited in the state’s Debt Service Fund for future general obligations bond payments in the amounts of $2,113,052 and $2,283,623 for fiscal years 2011 and 2010, respectively. Minnesota Statutes, Section 16A.641, requires all state agencies to have on hand on December 1 of each year, an amount sufficient to pay all general obligation bond principal and interest due, and to become due, through July 1 of the second fiscal year. Also, included in prepaid expense for fiscal years 2011 and 2010 respectively, is $155,242 and $171,361, stemming from prepaid software maintenance agreements and prepaid conference registrations.
5. LOANS RECEIVABLE Loans receivable balances primarily consist of loans under the Federal Perkins Loan Program. The federal government provides most of the funding for the loans with amounts collected used for new loan advances. Minnesota State Colleges and Universities’ loan collections unit is responsible for loan collections for the University. At June 30, 2011 and 2010, the total loans receivable were $6,739,037 and $6,849,857, respectively, less an allowance for uncollectible loans of $252,299 and $235,104, respectively.
35
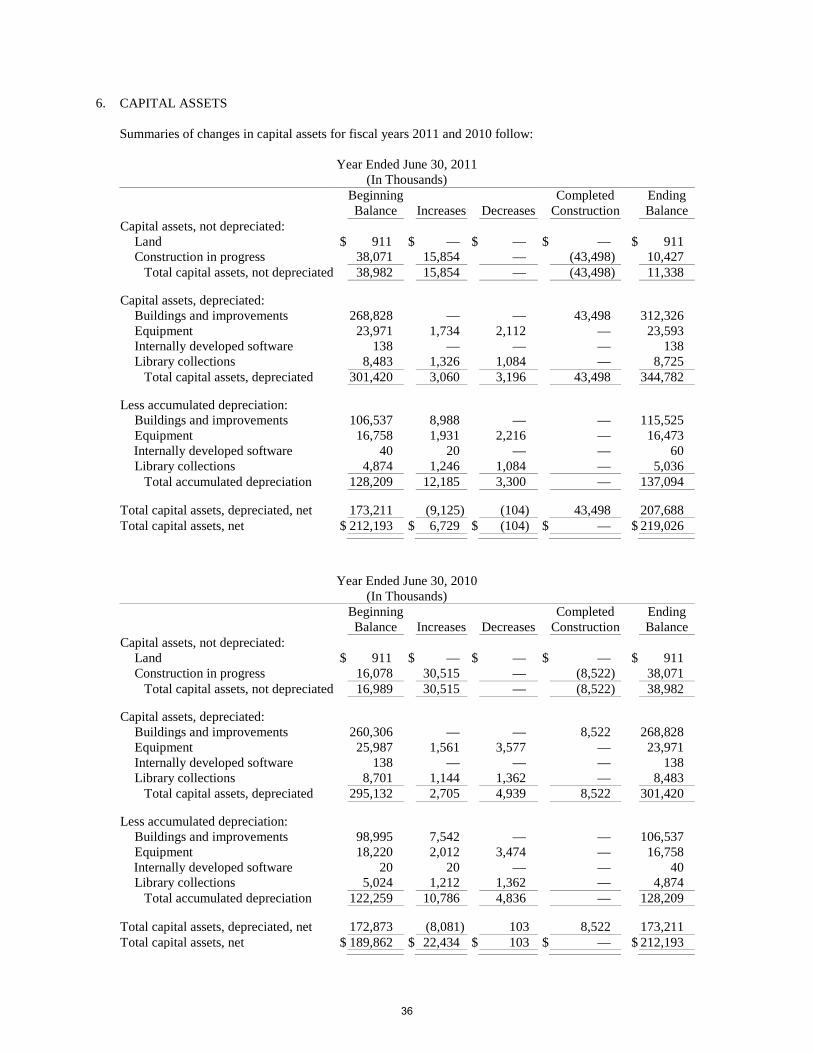
6. CAPITAL ASSETS Summaries of changes in capital assets for fiscal years 2011 and 2010 follow:
Year Ended June 30, 2011 (In Thousands)
Beginning Balance Increases Decreases
Completed Construction
Ending Balance
Capital assets, not depreciated: Land $ 911 $ — $ — $ — $ 911 Construction in progress 38,071 15,854 — (43,498) 10,427 Total capital assets, not depreciated 38,982 15,854 — (43,498) 11,338
Capital assets, depreciated: Buildings and improvements 268,828 — — 43,498 312,326 Equipment 23,971 1,734 2,112 — 23,593 Internally developed software 138 — — — 138 Library collections 8,483 1,326 1,084 — 8,725 Total capital assets, depreciated 301,420 3,060 3,196 43,498 344,782 Less accumulated depreciation: Buildings and improvements 106,537 8,988 — — 115,525 Equipment 16,758 1,931 2,216 — 16,473
Internally developed software 40 20 — — 60 Library collections 4,874 1,246 1,084 — 5,036 Total accumulated depreciation 128,209 12,185 3,300 — 137,094
Total capital assets, depreciated, net 173,211 (9,125) (104) 43,498 207,688 Total capital assets, net $ 212,193 $ 6,729 $ (104) $ — $ 219,026
Year Ended June 30, 2010
(In Thousands)
Beginning Balance
Increases
Decreases
Completed Construction
Ending Balance
Capital assets, not depreciated: Land $ 911 $ — $ — $ — $ 911 Construction in progress 16,078 30,515 — (8,522) 38,071 Total capital assets, not depreciated 16,989 30,515 — (8,522) 38,982
Capital assets, depreciated: Buildings and improvements 260,306 — — 8,522 268,828 Equipment 25,987 1,561 3,577 — 23,971 Internally developed software 138 — — — 138 Library collections 8,701 1,144 1,362 — 8,483 Total capital assets, depreciated 295,132 2,705 4,939 8,522 301,420 Less accumulated depreciation: Buildings and improvements 98,995 7,542 — — 106,537 Equipment 18,220 2,012 3,474 — 16,758
Internally developed software 20 20 — — 40 Library collections 5,024 1,212 1,362 — 4,874 Total accumulated depreciation 122,259 10,786 4,836 — 128,209
Total capital assets, depreciated, net 172,873 (8,081) 103 8,522 173,211 Total capital assets, net $ 189,862 $ 22,434 $ 103 $ — $ 212,193
36
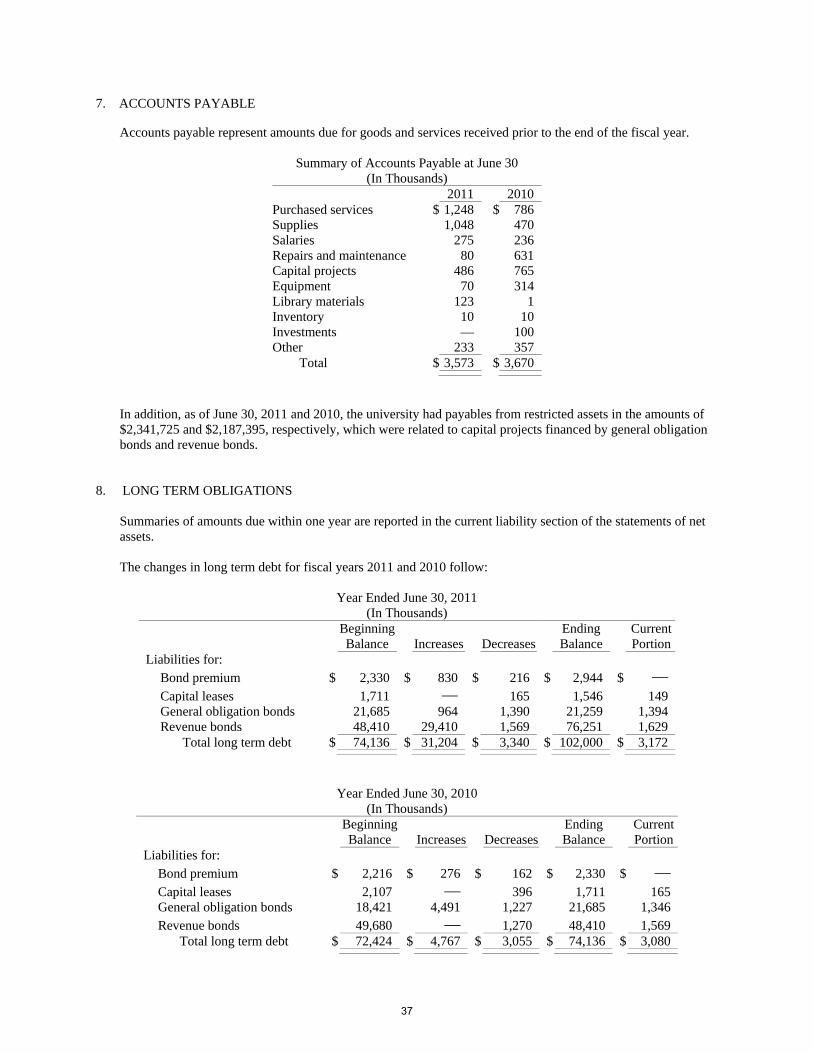
7. ACCOUNTS PAYABLE Accounts payable represent amounts due for goods and services received prior to the end of the fiscal year.
Summary of Accounts Payable at June 30 (In Thousands)
2011 2010 Purchased services $ 1,248 $ 786 Supplies 1,048 470 Salaries 275 236 Repairs and maintenance 80 631 Capital projects 486 765 Equipment 70 314 Library materials 123 1 Inventory 10 10 Investments — 100 Other 233 357
Total $ 3,573 $ 3,670 In addition, as of June 30, 2011 and 2010, the university had payables from restricted assets in the amounts of $2,341,725 and $2,187,395, respectively, which were related to capital projects financed by general obligation bonds and revenue bonds.
8. LONG TERM OBLIGATIONS Summaries of amounts due within one year are reported in the current liability section of the statements of net assets. The changes in long term debt for fiscal years 2011 and 2010 follow:
Year Ended June 30, 2011 (In Thousands)
BeginningBalance Increases Decreases
Ending Balance
Current Portion
Liabilities for: Bond premium $ 2,330 $ 830 $ 216 $ 2,944 $ — Capital leases 1,711 — 165 1,546 149 General obligation bonds 21,685 964 1,390 21,259 1,394 Revenue bonds 48,410 29,410 1,569 76,251 1,629
Total long term debt $ 74,136 $ 31,204 $ 3,340 $ 102,000 $ 3,172
Year Ended June 30, 2010 (In Thousands)
BeginningBalance Increases Decreases
Ending Balance
Current Portion
Liabilities for: Bond premium $ 2,216 $ 276 $ 162 $ 2,330 $ — Capital leases 2,107 — 396 1,711 165 General obligation bonds 18,421 4,491 1,227 21,685 1,346 Revenue bonds 49,680 — 1,270 48,410 1,569
Total long term debt $ 72,424 $ 4,767 $ 3,055 $ 74,136 $ 3,080
37
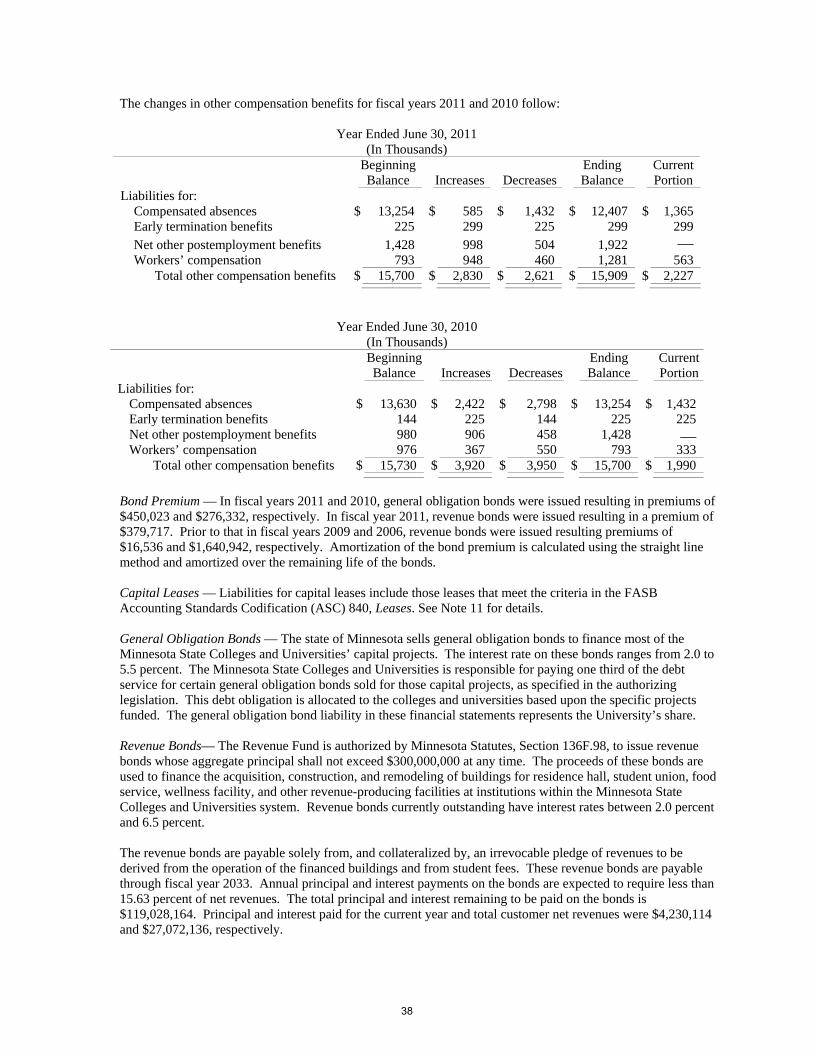
The changes in other compensation benefits for fiscal years 2011 and 2010 follow:
Year Ended June 30, 2011 (In Thousands)
BeginningBalance Increases Decreases
Ending Balance
Current Portion
Liabilities for: Compensated absences $ 13,254 $ 585 $ 1,432 $ 12,407 $ 1,365 Early termination benefits 225 299 225 299 299 Net other postemployment benefits 1,428 998 504 1,922 — Workers’ compensation 793 948 460 1,281 563
Total other compensation benefits $ 15,700 $ 2,830 $ 2,621 $ 15,909 $ 2,227
Year Ended June 30, 2010 (In Thousands)
BeginningBalance Increases Decreases
Ending Balance
Current Portion
Liabilities for: Compensated absences $ 13,630 $ 2,422 $ 2,798 $ 13,254 $ 1,432 Early termination benefits 144 225 144 225 225 Net other postemployment benefits 980 906 458 1,428 —Workers’ compensation 976 367 550 793 333
Total other compensation benefits $ 15,730 $ 3,920 $ 3,950 $ 15,700 $ 1,990 Bond Premium — In fiscal years 2011 and 2010, general obligation bonds were issued resulting in premiums of $450,023 and $276,332, respectively. In fiscal year 2011, revenue bonds were issued resulting in a premium of $379,717. Prior to that in fiscal years 2009 and 2006, revenue bonds were issued resulting premiums of $16,536 and $1,640,942, respectively. Amortization of the bond premium is calculated using the straight line method and amortized over the remaining life of the bonds. Capital Leases — Liabilities for capital leases include those leases that meet the criteria in the FASB Accounting Standards Codification (ASC) 840, Leases. See Note 11 for details. General Obligation Bonds — The state of Minnesota sells general obligation bonds to finance most of the Minnesota State Colleges and Universities’ capital projects. The interest rate on these bonds ranges from 2.0 to 5.5 percent. The Minnesota State Colleges and Universities is responsible for paying one third of the debt service for certain general obligation bonds sold for those capital projects, as specified in the authorizing legislation. This debt obligation is allocated to the colleges and universities based upon the specific projects funded. The general obligation bond liability in these financial statements represents the University’s share. Revenue Bonds— The Revenue Fund is authorized by Minnesota Statutes, Section 136F.98, to issue revenue bonds whose aggregate principal shall not exceed $300,000,000 at any time. The proceeds of these bonds are used to finance the acquisition, construction, and remodeling of buildings for residence hall, student union, food service, wellness facility, and other revenue-producing facilities at institutions within the Minnesota State Colleges and Universities system. Revenue bonds currently outstanding have interest rates between 2.0 percent and 6.5 percent. The revenue bonds are payable solely from, and collateralized by, an irrevocable pledge of revenues to be derived from the operation of the financed buildings and from student fees. These revenue bonds are payable through fiscal year 2033. Annual principal and interest payments on the bonds are expected to require less than 15.63 percent of net revenues. The total principal and interest remaining to be paid on the bonds is $119,028,164. Principal and interest paid for the current year and total customer net revenues were $4,230,114 and $27,072,136, respectively.
38
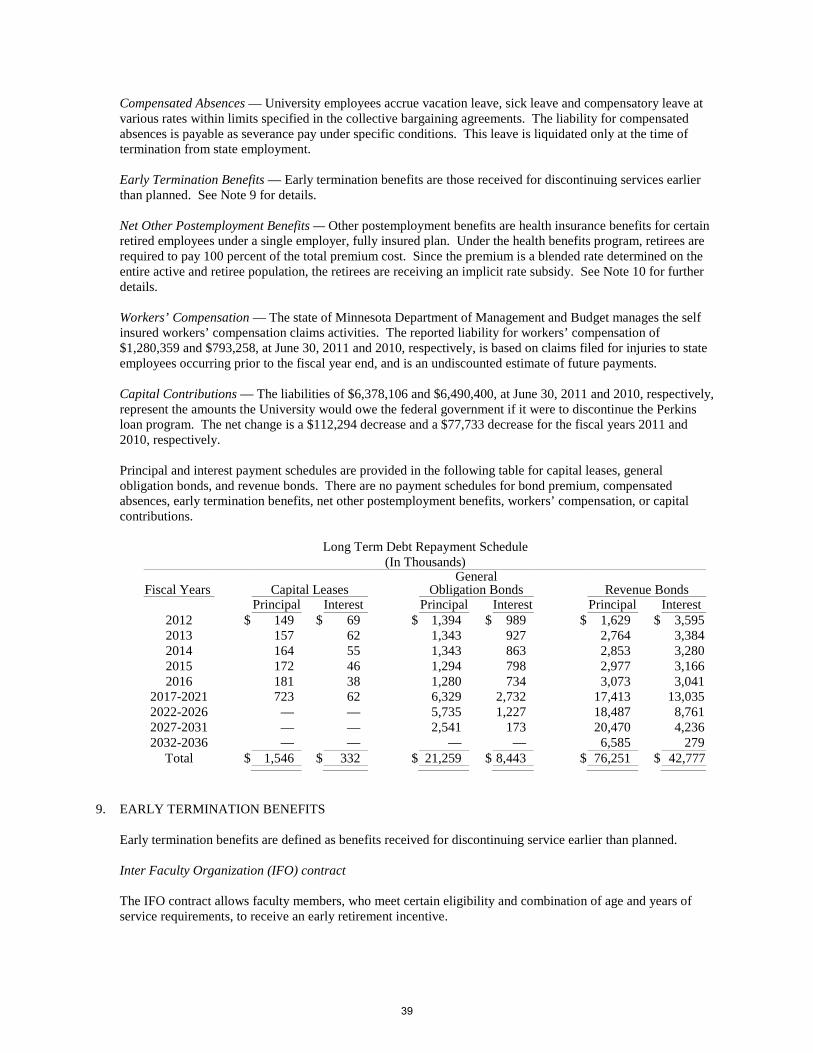
Compensated Absences — University employees accrue vacation leave, sick leave and compensatory leave at various rates within limits specified in the collective bargaining agreements. The liability for compensated absences is payable as severance pay under specific conditions. This leave is liquidated only at the time of termination from state employment. Early Termination Benefits — Early termination benefits are those received for discontinuing services earlier than planned. See Note 9 for details. Net Other Postemployment Benefits — Other postemployment benefits are health insurance benefits for certain retired employees under a single employer, fully insured plan. Under the health benefits program, retirees are required to pay 100 percent of the total premium cost. Since the premium is a blended rate determined on the entire active and retiree population, the retirees are receiving an implicit rate subsidy. See Note 10 for further details. Workers’ Compensation — The state of Minnesota Department of Management and Budget manages the self insured workers’ compensation claims activities. The reported liability for workers’ compensation of $1,280,359 and $793,258, at June 30, 2011 and 2010, respectively, is based on claims filed for injuries to state employees occurring prior to the fiscal year end, and is an undiscounted estimate of future payments. Capital Contributions — The liabilities of $6,378,106 and $6,490,400, at June 30, 2011 and 2010, respectively, represent the amounts the University would owe the federal government if it were to discontinue the Perkins loan program. The net change is a $112,294 decrease and a $77,733 decrease for the fiscal years 2011 and 2010, respectively.
Principal and interest payment schedules are provided in the following table for capital leases, general obligation bonds, and revenue bonds. There are no payment schedules for bond premium, compensated absences, early termination benefits, net other postemployment benefits, workers’ compensation, or capital contributions.
Long Term Debt Repayment Schedule (In Thousands)
Fiscal Years Capital Leases General
Obligation Bonds Revenue Bonds Principal Interest Principal Interest Principal Interest
2012 $ 149 $ 69 $ 1,394 $ 989 $ 1,629 $ 3,595 2013 157 62 1,343 927 2,764 3,384 2014 164 55 1,343 863 2,853 3,280 2015 172 46 1,294 798 2,977 3,166 2016 181 38 1,280 734 3,073 3,041
2017-2021 723 62 6,329 2,732 17,413 13,035 2022-2026 — — 5,735 1,227 18,487 8,761 2027-2031 — — 2,541 173 20,470 4,236 2032-2036 — — — — 6,585 279
Total $ 1,546 $ 332 $ 21,259 $ 8,443 $ 76,251 $ 42,777
9. EARLY TERMINATION BENEFITS
Early termination benefits are defined as benefits received for discontinuing service earlier than planned. Inter Faculty Organization (IFO) contract The IFO contract allows faculty members, who meet certain eligibility and combination of age and years of service requirements, to receive an early retirement incentive.
39
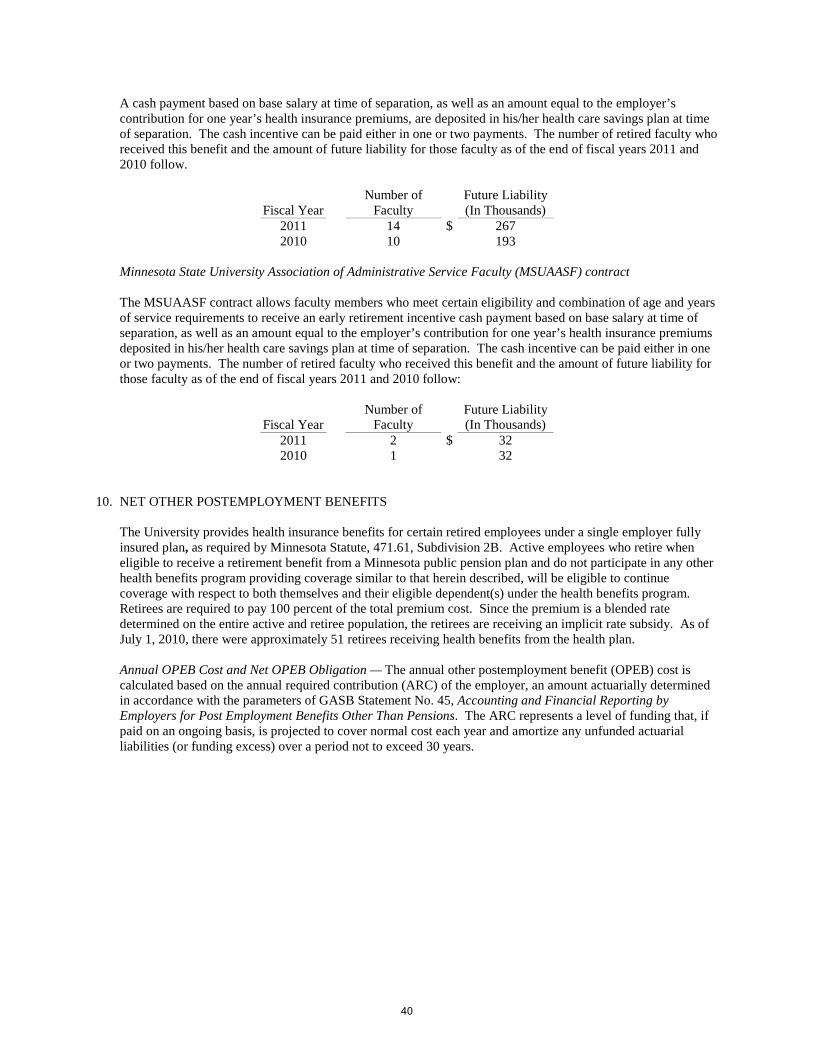
A cash payment based on base salary at time of separation, as well as an amount equal to the employer’s contribution for one year’s health insurance premiums, are deposited in his/her health care savings plan at time of separation. The cash incentive can be paid either in one or two payments. The number of retired faculty who received this benefit and the amount of future liability for those faculty as of the end of fiscal years 2011 and 2010 follow.
Fiscal Year Number of
Faculty Future Liability (In Thousands)
2011 14 $ 267 2010 10 193
Minnesota State University Association of Administrative Service Faculty (MSUAASF) contract
The MSUAASF contract allows faculty members who meet certain eligibility and combination of age and years of service requirements to receive an early retirement incentive cash payment based on base salary at time of separation, as well as an amount equal to the employer’s contribution for one year’s health insurance premiums deposited in his/her health care savings plan at time of separation. The cash incentive can be paid either in one or two payments. The number of retired faculty who received this benefit and the amount of future liability for those faculty as of the end of fiscal years 2011 and 2010 follow:
Fiscal Year Number of
Faculty Future Liability (In Thousands)
2011 2 $ 32 2010 1 32
10. NET OTHER POSTEMPLOYMENT BENEFITS
The University provides health insurance benefits for certain retired employees under a single employer fully insured plan, as required by Minnesota Statute, 471.61, Subdivision 2B. Active employees who retire when eligible to receive a retirement benefit from a Minnesota public pension plan and do not participate in any other health benefits program providing coverage similar to that herein described, will be eligible to continue coverage with respect to both themselves and their eligible dependent(s) under the health benefits program. Retirees are required to pay 100 percent of the total premium cost. Since the premium is a blended rate determined on the entire active and retiree population, the retirees are receiving an implicit rate subsidy. As of July 1, 2010, there were approximately 51 retirees receiving health benefits from the health plan. Annual OPEB Cost and Net OPEB Obligation — The annual other postemployment benefit (OPEB) cost is calculated based on the annual required contribution (ARC) of the employer, an amount actuarially determined in accordance with the parameters of GASB Statement No. 45, Accounting and Financial Reporting by Employers for Post Employment Benefits Other Than Pensions. The ARC represents a level of funding that, if paid on an ongoing basis, is projected to cover normal cost each year and amortize any unfunded actuarial liabilities (or funding excess) over a period not to exceed 30 years.
40
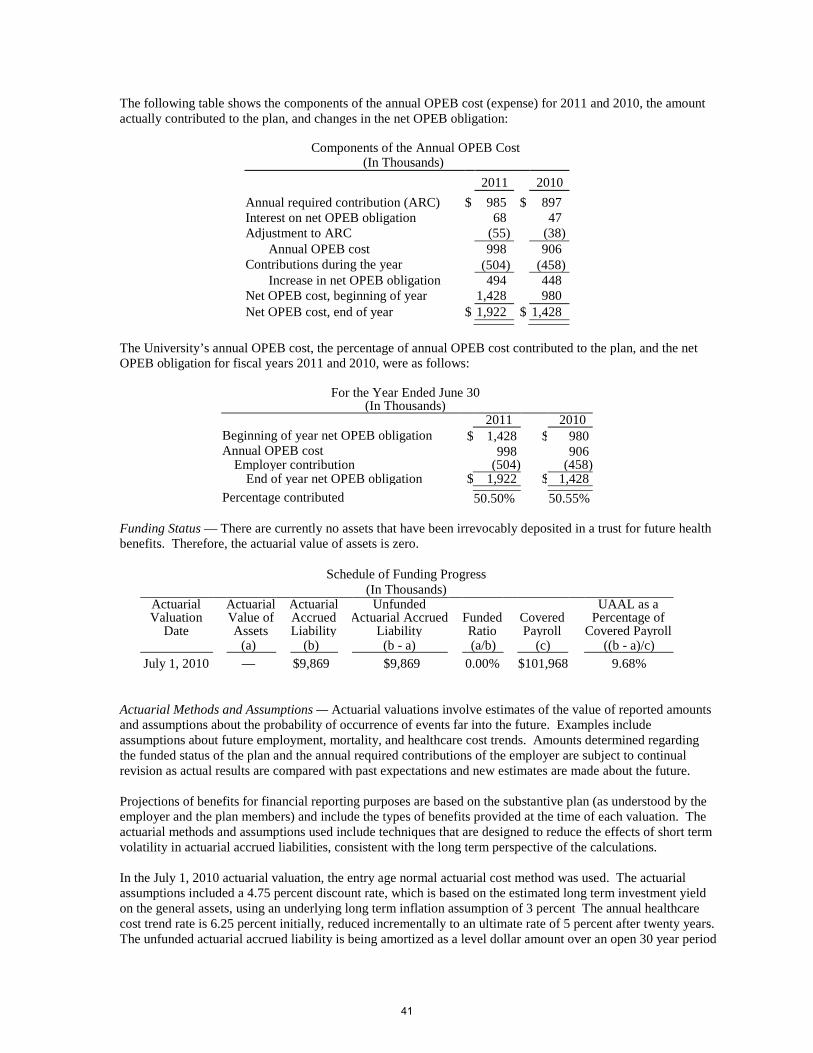
The following table shows the components of the annual OPEB cost (expense) for 2011 and 2010, the amount actually contributed to the plan, and changes in the net OPEB obligation:
Components of the Annual OPEB Cost (In Thousands)
2011 2010 Annual required contribution (ARC) $ 985 $ 897 Interest on net OPEB obligation 68 47 Adjustment to ARC (55) (38) Annual OPEB cost 998 906 Contributions during the year (504) (458) Increase in net OPEB obligation 494 448 Net OPEB cost, beginning of year 1,428 980 Net OPEB cost, end of year $ 1,922 $ 1,428
The University’s annual OPEB cost, the percentage of annual OPEB cost contributed to the plan, and the net OPEB obligation for fiscal years 2011 and 2010, were as follows:
For the Year Ended June 30 (In Thousands)
2011 2010 Beginning of year net OPEB obligation $ 1,428 $ 980 Annual OPEB cost 998 906
Employer contribution (504) (458) End of year net OPEB obligation $ 1,922 $ 1,428
Percentage contributed 50.50% 50.55% Funding Status — There are currently no assets that have been irrevocably deposited in a trust for future health benefits. Therefore, the actuarial value of assets is zero.
Schedule of Funding Progress (In Thousands)
Actuarial Valuation
Date
Actuarial Value of Assets
Actuarial Accrued Liability
Unfunded Actuarial Accrued
Liability
Funded Ratio
Covered Payroll
UAAL as a Percentage of
Covered Payroll (a) (b) (b - a) (a/b) (c) ((b - a)/c)
July 1, 2010 — $9,869 $9,869 0.00% $101,968 9.68% Actuarial Methods and Assumptions — Actuarial valuations involve estimates of the value of reported amounts and assumptions about the probability of occurrence of events far into the future. Examples include assumptions about future employment, mortality, and healthcare cost trends. Amounts determined regarding the funded status of the plan and the annual required contributions of the employer are subject to continual revision as actual results are compared with past expectations and new estimates are made about the future. Projections of benefits for financial reporting purposes are based on the substantive plan (as understood by the employer and the plan members) and include the types of benefits provided at the time of each valuation. The actuarial methods and assumptions used include techniques that are designed to reduce the effects of short term volatility in actuarial accrued liabilities, consistent with the long term perspective of the calculations. In the July 1, 2010 actuarial valuation, the entry age normal actuarial cost method was used. The actuarial assumptions included a 4.75 percent discount rate, which is based on the estimated long term investment yield on the general assets, using an underlying long term inflation assumption of 3 percent The annual healthcare cost trend rate is 6.25 percent initially, reduced incrementally to an ultimate rate of 5 percent after twenty years. The unfunded actuarial accrued liability is being amortized as a level dollar amount over an open 30 year period
41
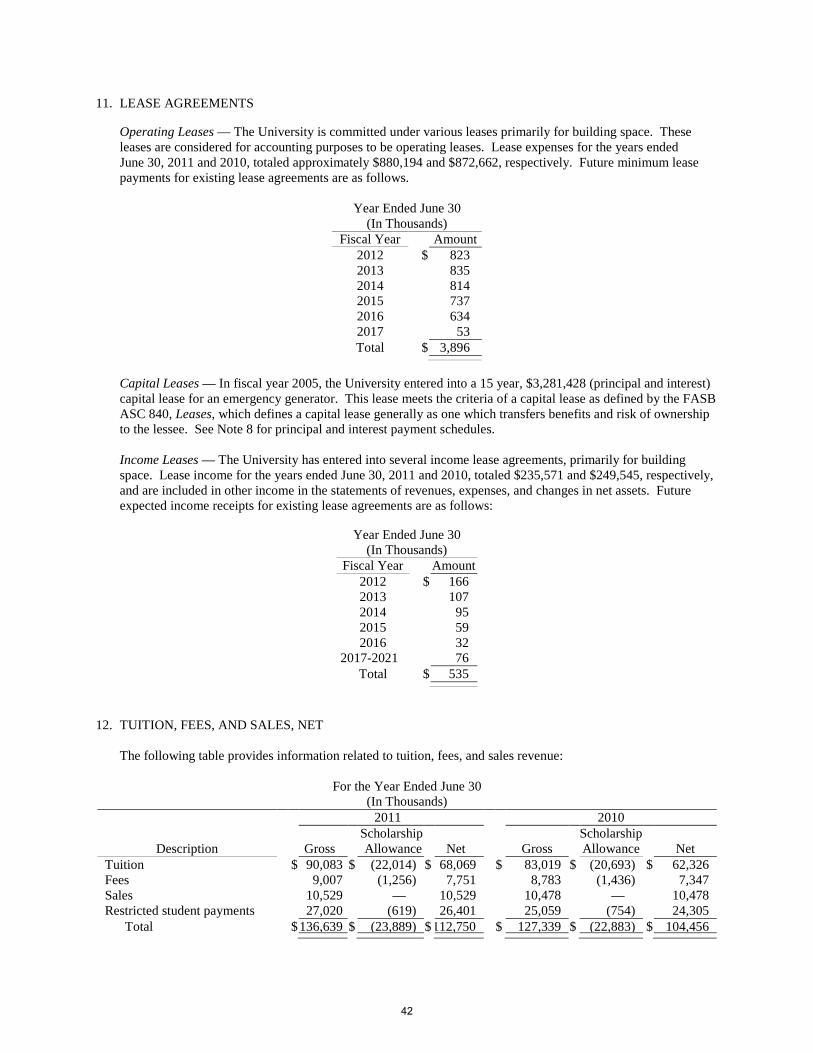
11. LEASE AGREEMENTS Operating Leases — The University is committed under various leases primarily for building space. These leases are considered for accounting purposes to be operating leases. Lease expenses for the years ended June 30, 2011 and 2010, totaled approximately $880,194 and $872,662, respectively. Future minimum lease payments for existing lease agreements are as follows.
Year Ended June 30 (In Thousands)
Fiscal Year Amount 2012 $ 823 2013 835 2014 814 2015 737 2016 634 2017 53 Total $ 3,896
Capital Leases — In fiscal year 2005, the University entered into a 15 year, $3,281,428 (principal and interest) capital lease for an emergency generator. This lease meets the criteria of a capital lease as defined by the FASB ASC 840, Leases, which defines a capital lease generally as one which transfers benefits and risk of ownership to the lessee. See Note 8 for principal and interest payment schedules. Income Leases — The University has entered into several income lease agreements, primarily for building space. Lease income for the years ended June 30, 2011 and 2010, totaled $235,571 and $249,545, respectively, and are included in other income in the statements of revenues, expenses, and changes in net assets. Future expected income receipts for existing lease agreements are as follows:
Year Ended June 30
(In Thousands) Fiscal Year Amount
2012 $ 166 2013 107 2014 95 2015 59 2016 32
2017-2021 76 Total $ 535
12. TUITION, FEES, AND SALES, NET
The following table provides information related to tuition, fees, and sales revenue:
For the Year Ended June 30 (In Thousands)
2011 2010 Scholarship Scholarship
Description Gross Allowance Net Gross Allowance Net Tuition $ 90,083 $ (22,014) $ 68,069 $ 83,019 $ (20,693) $ 62,326 Fees 9,007 (1,256) 7,751 8,783 (1,436) 7,347 Sales 10,529 — 10,529 10,478 — 10,478 Restricted student payments 27,020 (619) 26,401 25,059 (754) 24,305 Total $ 136,639
$ (23,889) $ 112,750 $ 127,339 $ (22,883) $ 104,456
42
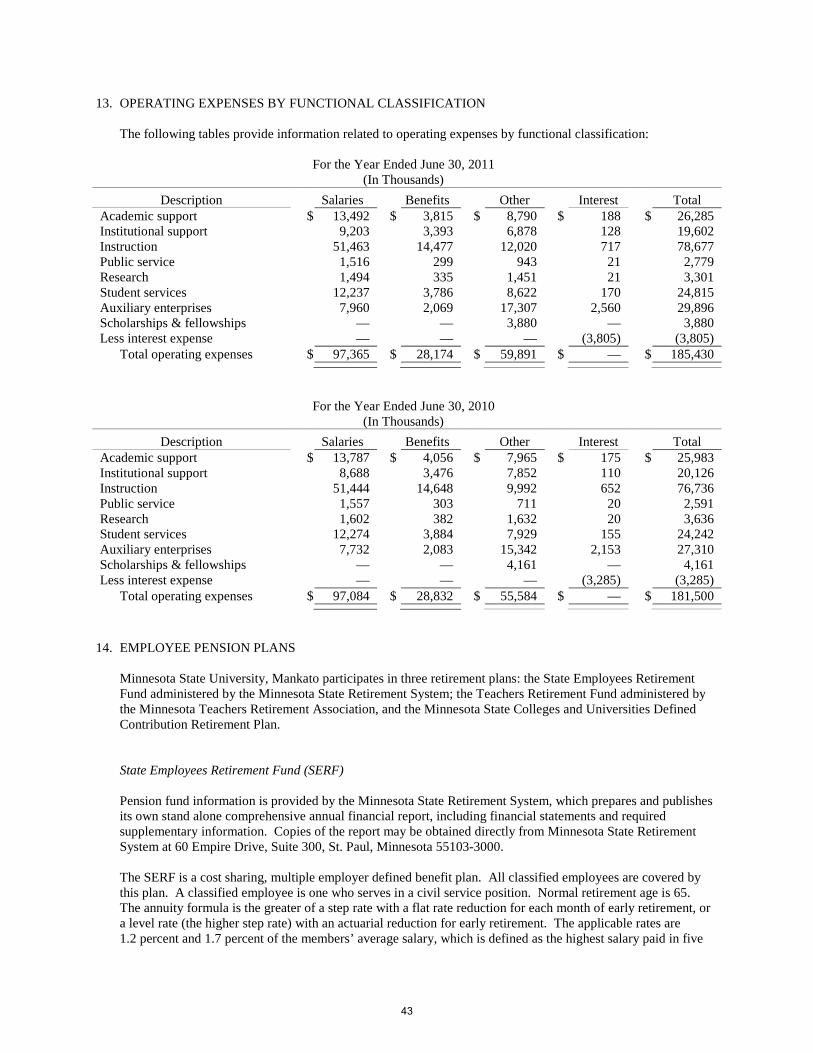
13. OPERATING EXPENSES BY FUNCTIONAL CLASSIFICATION The following tables provide information related to operating expenses by functional classification:
For the Year Ended June 30, 2011 (In Thousands)
Description Salaries Benefits Other Interest Total Academic support $ 13,492 $ 3,815 $ 8,790 $ 188 $ 26,285 Institutional support 9,203 3,393 6,878 128 19,602 Instruction 51,463 14,477 12,020 717 78,677 Public service 1,516 299 943 21 2,779 Research 1,494 335 1,451 21 3,301 Student services 12,237 3,786 8,622 170 24,815 Auxiliary enterprises 7,960 2,069 17,307 2,560 29,896 Scholarships & fellowships — — 3,880 — 3,880 Less interest expense — — — (3,805) (3,805) Total operating expenses $ 97,365 $ 28,174 $ 59,891 $ — $ 185,430
For the Year Ended June 30, 2010 (In Thousands)
Description Salaries Benefits Other Interest Total Academic support $ 13,787 $ 4,056 $ 7,965 $ 175 $ 25,983 Institutional support 8,688 3,476 7,852 110 20,126 Instruction 51,444 14,648 9,992 652 76,736 Public service 1,557 303 711 20 2,591 Research 1,602 382 1,632 20 3,636 Student services 12,274 3,884 7,929 155 24,242 Auxiliary enterprises 7,732 2,083 15,342 2,153 27,310 Scholarships & fellowships — — 4,161 — 4,161 Less interest expense — — — (3,285) (3,285) Total operating expenses $ 97,084 $ 28,832 $ 55,584 $ — $ 181,500
14. EMPLOYEE PENSION PLANS
Minnesota State University, Mankato participates in three retirement plans: the State Employees Retirement Fund administered by the Minnesota State Retirement System; the Teachers Retirement Fund administered by the Minnesota Teachers Retirement Association, and the Minnesota State Colleges and Universities Defined Contribution Retirement Plan. State Employees Retirement Fund (SERF) Pension fund information is provided by the Minnesota State Retirement System, which prepares and publishes its own stand alone comprehensive annual financial report, including financial statements and required supplementary information. Copies of the report may be obtained directly from Minnesota State Retirement System at 60 Empire Drive, Suite 300, St. Paul, Minnesota 55103-3000. The SERF is a cost sharing, multiple employer defined benefit plan. All classified employees are covered by this plan. A classified employee is one who serves in a civil service position. Normal retirement age is 65. The annuity formula is the greater of a step rate with a flat rate reduction for each month of early retirement, or a level rate (the higher step rate) with an actuarial reduction for early retirement. The applicable rates are 1.2 percent and 1.7 percent of the members’ average salary, which is defined as the highest salary paid in five
43
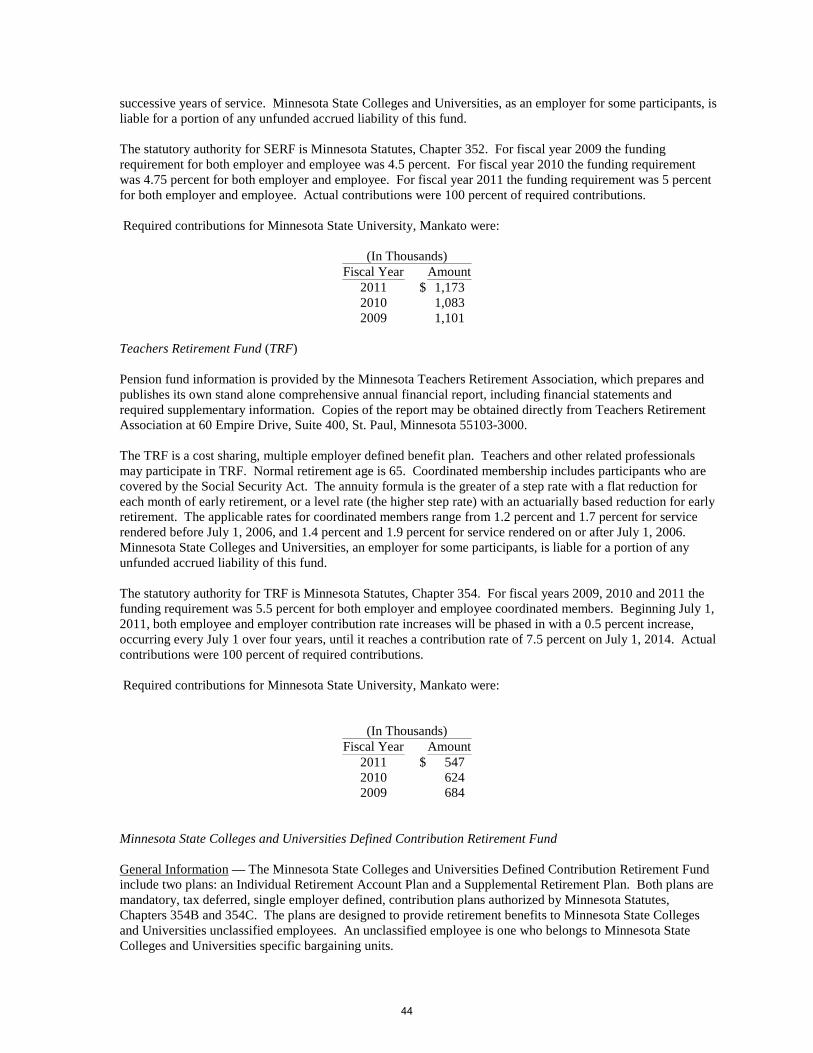
successive years of service. Minnesota State Colleges and Universities, as an employer for some participants, is liable for a portion of any unfunded accrued liability of this fund. The statutory authority for SERF is Minnesota Statutes, Chapter 352. For fiscal year 2009 the funding requirement for both employer and employee was 4.5 percent. For fiscal year 2010 the funding requirement was 4.75 percent for both employer and employee. For fiscal year 2011 the funding requirement was 5 percent for both employer and employee. Actual contributions were 100 percent of required contributions. Required contributions for Minnesota State University, Mankato were:
(In Thousands) Fiscal Year Amount
2011 $ 1,173 2010 1,083 2009 1,101
Teachers Retirement Fund (TRF) Pension fund information is provided by the Minnesota Teachers Retirement Association, which prepares and publishes its own stand alone comprehensive annual financial report, including financial statements and required supplementary information. Copies of the report may be obtained directly from Teachers Retirement Association at 60 Empire Drive, Suite 400, St. Paul, Minnesota 55103-3000. The TRF is a cost sharing, multiple employer defined benefit plan. Teachers and other related professionals may participate in TRF. Normal retirement age is 65. Coordinated membership includes participants who are covered by the Social Security Act. The annuity formula is the greater of a step rate with a flat reduction for each month of early retirement, or a level rate (the higher step rate) with an actuarially based reduction for early retirement. The applicable rates for coordinated members range from 1.2 percent and 1.7 percent for service rendered before July 1, 2006, and 1.4 percent and 1.9 percent for service rendered on or after July 1, 2006. Minnesota State Colleges and Universities, an employer for some participants, is liable for a portion of any unfunded accrued liability of this fund. The statutory authority for TRF is Minnesota Statutes, Chapter 354. For fiscal years 2009, 2010 and 2011 the funding requirement was 5.5 percent for both employer and employee coordinated members. Beginning July 1, 2011, both employee and employer contribution rate increases will be phased in with a 0.5 percent increase, occurring every July 1 over four years, until it reaches a contribution rate of 7.5 percent on July 1, 2014. Actual contributions were 100 percent of required contributions. Required contributions for Minnesota State University, Mankato were:
(In Thousands) Fiscal Year Amount
2011 $ 547 2010 624 2009 684
Minnesota State Colleges and Universities Defined Contribution Retirement Fund General Information — The Minnesota State Colleges and Universities Defined Contribution Retirement Fund include two plans: an Individual Retirement Account Plan and a Supplemental Retirement Plan. Both plans are mandatory, tax deferred, single employer defined, contribution plans authorized by Minnesota Statutes, Chapters 354B and 354C. The plans are designed to provide retirement benefits to Minnesota State Colleges and Universities unclassified employees. An unclassified employee is one who belongs to Minnesota State Colleges and Universities specific bargaining units.
44
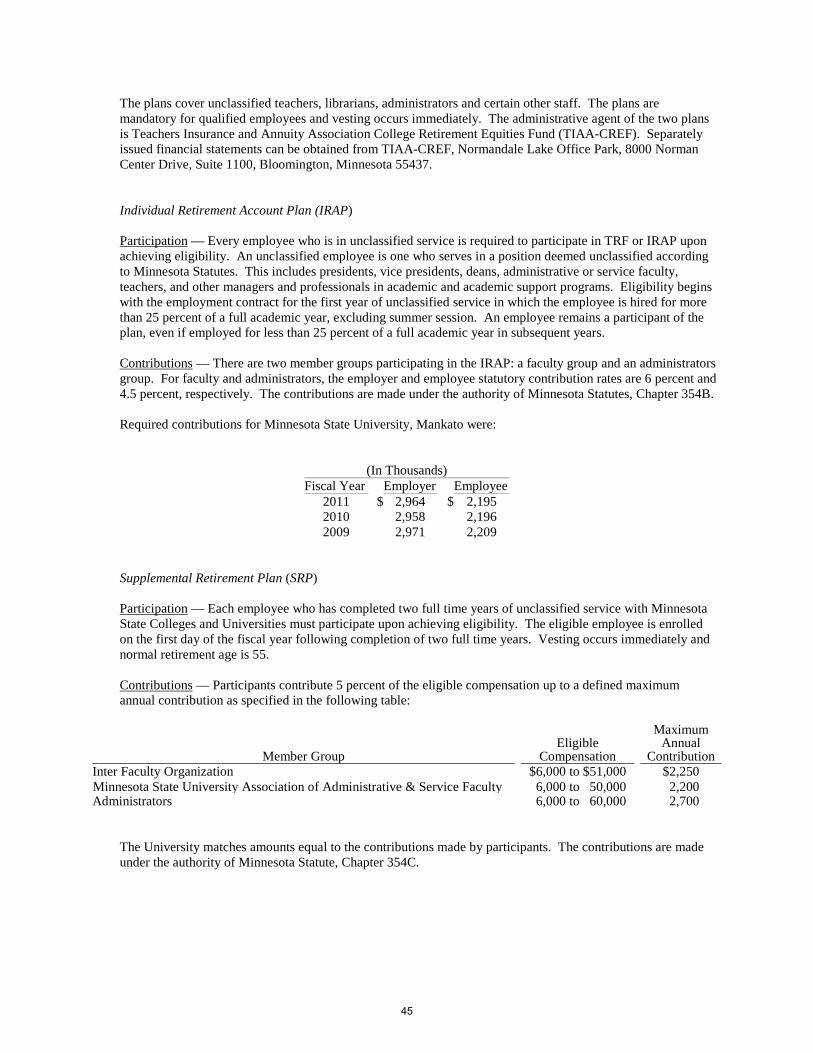
The plans cover unclassified teachers, librarians, administrators and certain other staff. The plans are mandatory for qualified employees and vesting occurs immediately. The administrative agent of the two plans is Teachers Insurance and Annuity Association College Retirement Equities Fund (TIAA-CREF). Separately issued financial statements can be obtained from TIAA-CREF, Normandale Lake Office Park, 8000 Norman Center Drive, Suite 1100, Bloomington, Minnesota 55437. Individual Retirement Account Plan (IRAP) Participation
— Every employee who is in unclassified service is required to participate in TRF or IRAP upon achieving eligibility. An unclassified employee is one who serves in a position deemed unclassified according to Minnesota Statutes. This includes presidents, vice presidents, deans, administrative or service faculty, teachers, and other managers and professionals in academic and academic support programs. Eligibility begins with the employment contract for the first year of unclassified service in which the employee is hired for more than 25 percent of a full academic year, excluding summer session. An employee remains a participant of the plan, even if employed for less than 25 percent of a full academic year in subsequent years.
Contributions
— There are two member groups participating in the IRAP: a faculty group and an administrators group. For faculty and administrators, the employer and employee statutory contribution rates are 6 percent and 4.5 percent, respectively. The contributions are made under the authority of Minnesota Statutes, Chapter 354B.
Required contributions for Minnesota State University, Mankato were:
(In Thousands) Fiscal Year Employer Employee
2011 $ 2,964 $ 2,195 2010 2,958 2,196 2009 2,971 2,209
Supplemental Retirement Plan (SRP) Participation
— Each employee who has completed two full time years of unclassified service with Minnesota State Colleges and Universities must participate upon achieving eligibility. The eligible employee is enrolled on the first day of the fiscal year following completion of two full time years. Vesting occurs immediately and normal retirement age is 55.
Contributions
— Participants contribute 5 percent of the eligible compensation up to a defined maximum annual contribution as specified in the following table:
Member Group
Eligible
Compensation
Maximum Annual
Contribution Inter Faculty Organization $6,000 to $51,000 $2,250 Minnesota State University Association of Administrative & Service Faculty
6,000 to 50,000 2,200 Administrators 6,000 to 60,000 2,700
The University matches amounts equal to the contributions made by participants. The contributions are made under the authority of Minnesota Statute, Chapter 354C.
45
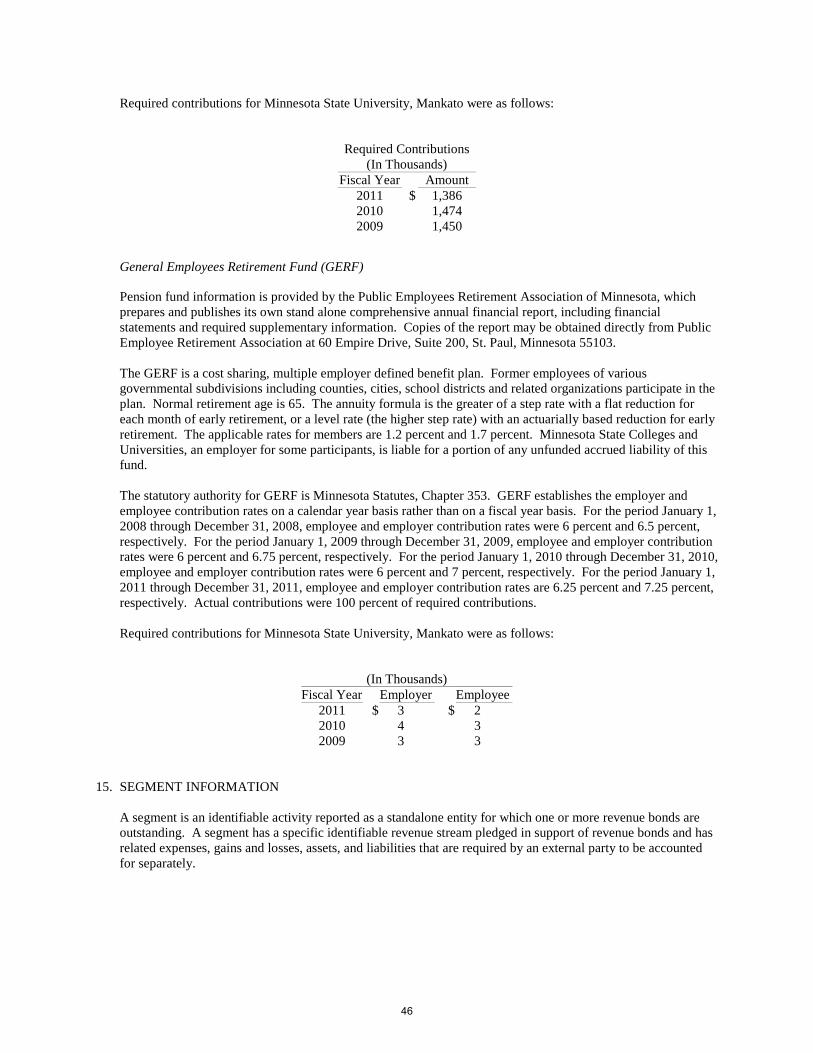
Required contributions for Minnesota State University, Mankato were as follows:
Required Contributions (In Thousands)
Fiscal Year Amount 2011 $ 1,386 2010 1,474 2009 1,450
General Employees Retirement Fund (GERF) Pension fund information is provided by the Public Employees Retirement Association of Minnesota, which prepares and publishes its own stand alone comprehensive annual financial report, including financial statements and required supplementary information. Copies of the report may be obtained directly from Public Employee Retirement Association at 60 Empire Drive, Suite 200, St. Paul, Minnesota 55103. The GERF is a cost sharing, multiple employer defined benefit plan. Former employees of various governmental subdivisions including counties, cities, school districts and related organizations participate in the plan. Normal retirement age is 65. The annuity formula is the greater of a step rate with a flat reduction for each month of early retirement, or a level rate (the higher step rate) with an actuarially based reduction for early retirement. The applicable rates for members are 1.2 percent and 1.7 percent. Minnesota State Colleges and Universities, an employer for some participants, is liable for a portion of any unfunded accrued liability of this fund. The statutory authority for GERF is Minnesota Statutes, Chapter 353. GERF establishes the employer and employee contribution rates on a calendar year basis rather than on a fiscal year basis. For the period January 1, 2008 through December 31, 2008, employee and employer contribution rates were 6 percent and 6.5 percent, respectively. For the period January 1, 2009 through December 31, 2009, employee and employer contribution rates were 6 percent and 6.75 percent, respectively. For the period January 1, 2010 through December 31, 2010, employee and employer contribution rates were 6 percent and 7 percent, respectively. For the period January 1, 2011 through December 31, 2011, employee and employer contribution rates are 6.25 percent and 7.25 percent, respectively. Actual contributions were 100 percent of required contributions. Required contributions for Minnesota State University, Mankato were as follows:
(In Thousands) Fiscal Year Employer Employee
2011 $ 3 $ 2 2010 4 3 2009 3 3
15. SEGMENT INFORMATION
A segment is an identifiable activity reported as a standalone entity for which one or more revenue bonds are outstanding. A segment has a specific identifiable revenue stream pledged in support of revenue bonds and has related expenses, gains and losses, assets, and liabilities that are required by an external party to be accounted for separately.
46
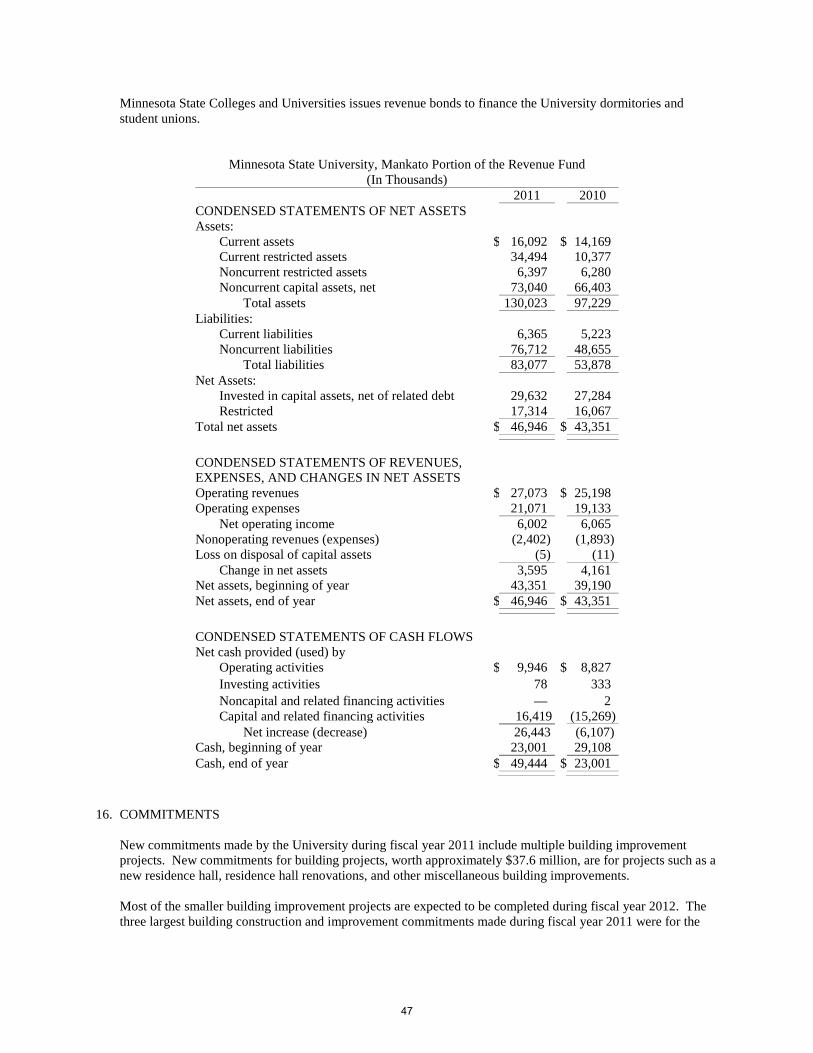
Minnesota State Colleges and Universities issues revenue bonds to finance the University dormitories and student unions.
Minnesota State University, Mankato Portion of the Revenue Fund
(In Thousands) 2011 2010 CONDENSED STATEMENTS OF NET ASSETS Assets: Current assets $ 16,092 $ 14,169 Current restricted assets 34,494 10,377 Noncurrent restricted assets 6,397 6,280 Noncurrent capital assets, net 73,040 66,403 Total assets 130,023 97,229 Liabilities: Current liabilities 6,365 5,223 Noncurrent liabilities 76,712 48,655 Total liabilities 83,077 53,878 Net Assets: Invested in capital assets, net of related debt 29,632 27,284 Restricted 17,314 16,067 Total net assets $ 46,946 $ 43,351 CONDENSED STATEMENTS OF REVENUES, EXPENSES, AND CHANGES IN NET ASSETS Operating revenues $ 27,073 $ 25,198 Operating expenses 21,071 19,133 Net operating income 6,002 6,065 Nonoperating revenues (expenses) (2,402) (1,893) Loss on disposal of capital assets (5) (11) Change in net assets 3,595 4,161 Net assets, beginning of year 43,351 39,190 Net assets, end of year $ 46,946 $ 43,351 CONDENSED STATEMENTS OF CASH FLOWS Net cash provided (used) by Operating activities $ 9,946 $ 8,827 Investing activities 78 333 Noncapital and related financing activities — 2 Capital and related financing activities 16,419 (15,269) Net increase (decrease) 26,443 (6,107) Cash, beginning of year 23,001 29,108 Cash, end of year $ 49,444 $ 23,001
16. COMMITMENTS
New commitments made by the University during fiscal year 2011 include multiple building improvement projects. New commitments for building projects, worth approximately $37.6 million, are for projects such as a new residence hall, residence hall renovations, and other miscellaneous building improvements. Most of the smaller building improvement projects are expected to be completed during fiscal year 2012. The three largest building construction and improvement commitments made during fiscal year 2011 were for the
47
Margaret R. Preska Residence Community building, the Carkoski Commons Dining facility renovation project, and the McElroy Residence Hall renovation project. Construction on the new Margaret R. Preska Residence Community building, funded primarily by revenue bond proceeds, is expected to be completed in August 2012 at a cost of $31.9 million. The Carkoski Commons Dining facility renovation project, funded by revenue fund operating funds, is expected to be completed to be completed in November 2011 at cost of $2.4 million. The McElroy Residence Hall renovation project, funded by revenue fund operating funds, is expected to be completed in September 2011 at a cost of $2.3 million.
17. RISK MANAGEMENT
Minnesota State Colleges and Universities is exposed to various risks of loss related to tort; theft of, damage to, or destruction of assets; error or omissions; and employer obligations. Minnesota State Colleges and Universities manage these risks through state of Minnesota insurance plans including the state of Minnesota Risk Management Fund and through purchased insurance coverage. Automobile liability coverage is required by the state and is provided by the Minnesota Risk Management Fund. The University purchased optional physical damage coverage for all vehicles. Property and casualty coverage is required by Minnesota State Colleges and Universities policy. The University also selected professional liability insurance for employed physicians and student health services professional liability insurance. The Minnesota Risk Management Fund provides the following coverage levels.
Coverage Amount Institution deductible (Academic & Residential Life) $100,000 Institution deductible (Centennial Student Union) $25,000 Fund responsibility Deductible to $1,000,000 Primary re insurer coverage $1,000,001 to $25,000,000 Catastrophic Insurance $25,000,001 to $1,000,000,000 Bodily injury and property damage per person $500,000 Bodily injury and property damage per occurrence $1,500,000 Annual maximum paid by fund, excess by reinsurer $4,000,000 Maintenance deductible for additional claims $25,000
Minnesota State University, Mankato retains the risk of loss. The University did not have any settlements in excess of coverage in the last three years. The Minnesota Risk Management Fund purchased student intern professional liability and dental clinics professional liability insurance on the open market for the University. Minnesota State Colleges and Universities participates in the State Employee Group Insurance Plan, which provides life insurance, hospital, medical, and dental benefits coverage through provider organizations. Workers’ compensation is covered through state participation in the Workers’ Compensation Reinsurance Association, which pays for catastrophic workers’ compensation claims. Other workers’ compensation risks are covered through self insurance for which Minnesota State Colleges and Universities pays the cost of claims through the state Workers’ Compensation Fund. A Minnesota State Colleges and Universities’ workers’ compensation payment pool helps institutions manage the volatility of such claims. Annual premiums are assessed by the pool based on salary dollars and claims history. From this pool, all workers’ compensation claims are paid to the state Workers’ Compensation Fund.
48
The following table presents changes in the balances of workers’ compensation claims liability during the fiscal years ended June 30, 2011 and 2010.
(In Thousands)
Beginning Liability
Net Additions
Payments & Other
Reductions Ending
Liability Fiscal Year Ended 6/30/11 $ 793 $ 948 $ 460 $ 1,281 Fiscal Year Ended 6/30/10 976 367 550 793
18. COMPONENT UNITS In accordance with Governmental Accounting Standards Board (GASB) Statement No. 39, Determining Whether Certain Organizations Are Component Units, the following foundation affiliated with Minnesota State University, Mankato is a legally separate, tax exempt entity and reported as a component unit. The Minnesota State University, Mankato Foundation, Inc. is a separate legal entity formed for the purpose of obtaining and disbursing funds for the sole benefit of the University. The University does not appoint any members of the board and the resources held by the Foundation can only be used by, or for, the benefit of the University. The Foundation’s relationship with the institution is such that exclusion of the Foundation’s financial statements would cause the University financial statements to be misleading or incomplete. The Foundation is considered a component unit of the University and their statements are discretely presented in the University’s financial statements. The Foundation’s financial statements have been prepared on the accrual basis of accounting in accordance with generally accepted accounting principles as prescribed by the FASB ASC 958-205, Presentation of Financial Statements. Net assets, which are classified on the existence or absence of donor imposed restrictions, are classified and reported according to the following classes:
• Unrestricted: Net assets that are not subject to donor imposed stipulations.
• Temporarily Restricted: Net assets subject to donor imposed restrictions as to how the assets are to be used.
• Permanently Restricted: Net assets subject to donor imposed stipulations that they be maintained permanently by each foundation. Generally, the donors of these assets permit the foundation to use all or part of the income earned on any related investments for general or specific purposes.
The University has an agreement with the Minnesota State University, Mankato Foundation whereby the University has agreed to furnish services for the operation of the Foundation. The values of such services are estimated at $1,404,418 and $1,478,598, for fiscal years 2011 and 2010, respectively, and are included in the university’s expenses. During fiscal years 2011 and 2010, the foundation expended $3,035,984 and $3,400,280, respectively, for University educational program purposes. Approximately $956,416 and $1,120,166 of the total went to support student scholarships, talent grants, and other awards in fiscal years 2011 and 2010, respectively. In addition to providing the University with supplemental funds for current operations, the Foundation’s net assets increased by $7,384,885 and $5,988,805, for fiscal years 2011 and 2010, respectively. An estimated $754,567 and $1,154,461, of revenues and expenditures in fiscal years 2011 and 2010, respectively, are included in both the Foundation’s and the University’s revenues and expenditures. This
49
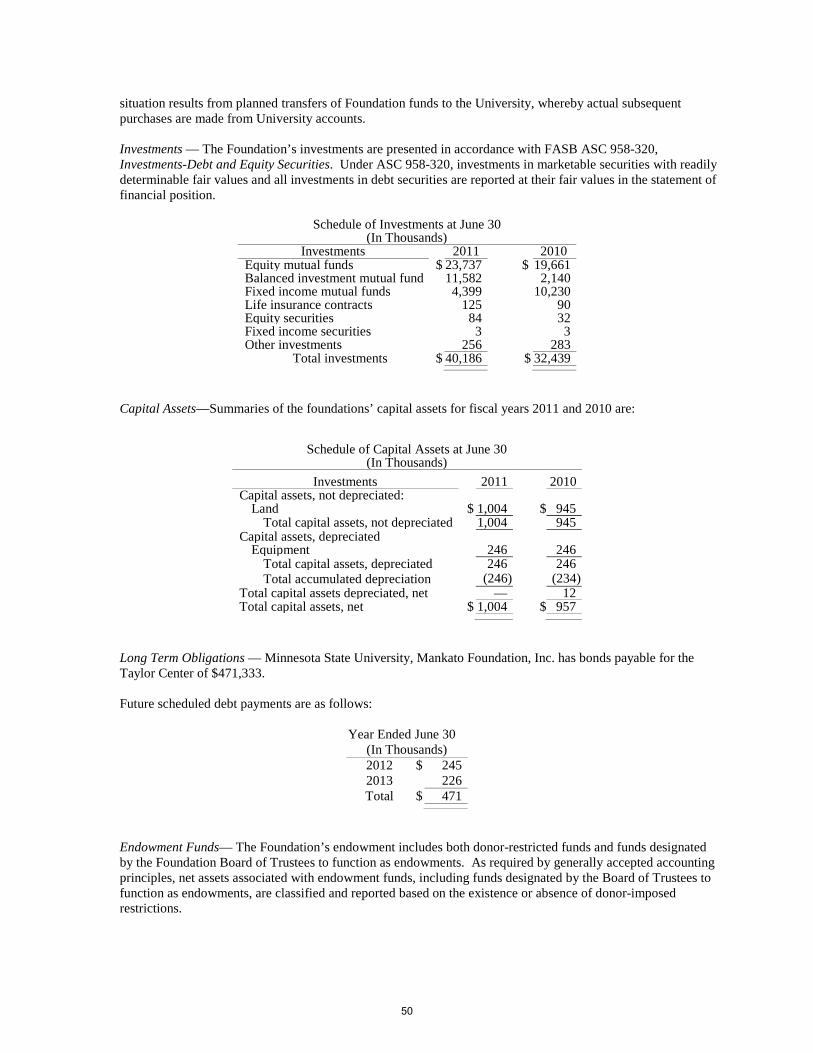
situation results from planned transfers of Foundation funds to the University, whereby actual subsequent purchases are made from University accounts. Investments — The Foundation’s investments are presented in accordance with FASB ASC 958-320, Investments-Debt and Equity Securities. Under ASC 958-320, investments in marketable securities with readily determinable fair values and all investments in debt securities are reported at their fair values in the statement of financial position.
Schedule of Investments at June 30
(In Thousands) Investments 2011 2010
Equity mutual funds $ 23,737 $ 19,661 Balanced investment mutual fund 11,582 2,140 Fixed income mutual funds 4,399 10,230 Life insurance contracts 125 90 Equity securities 84 32 Fixed income securities 3 3 Other investments 256 283 Total investments $ 40,186 $ 32,439
Capital Assets—Summaries of the foundations’ capital assets for fiscal years 2011 and 2010 are:
Schedule of Capital Assets at June 30 (In Thousands)
Investments 2011 2010 Capital assets, not depreciated:
Land $ 1,004 $ 945 Total capital assets, not depreciated 1,004 945
Capital assets, depreciated Equipment 246 246
Total capital assets, depreciated 246 246 Total accumulated depreciation (246) (234)
Total capital assets depreciated, net — 12 Total capital assets, net $ 1,004 $ 957
Long Term Obligations — Minnesota State University, Mankato Foundation, Inc. has bonds payable for the Taylor Center of $471,333. Future scheduled debt payments are as follows:
Year Ended June 30 (In Thousands) 2012 $ 245 2013 226 Total $ 471
Endowment Funds— The Foundation’s endowment includes both donor-restricted funds and funds designated by the Foundation Board of Trustees to function as endowments. As required by generally accepted accounting principles, net assets associated with endowment funds, including funds designated by the Board of Trustees to function as endowments, are classified and reported based on the existence or absence of donor-imposed restrictions.
50
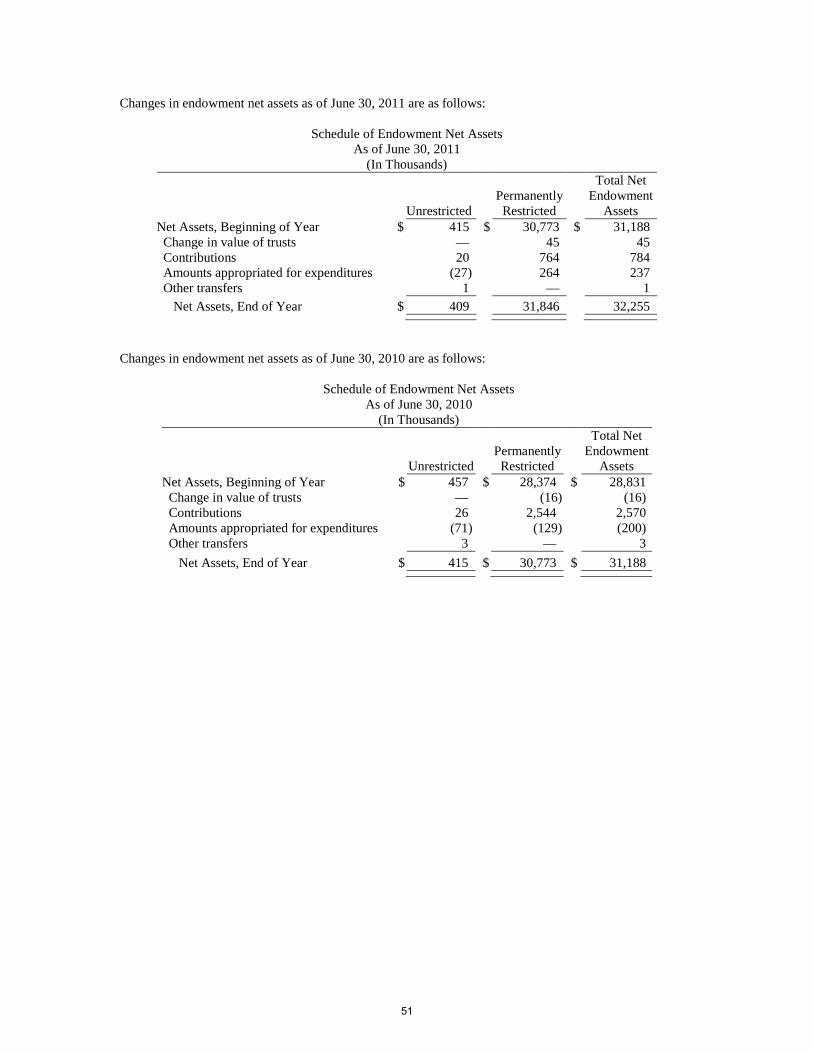
Changes in endowment net assets as of June 30, 2011 are as follows:
Schedule of Endowment Net Assets As of June 30, 2011
(In Thousands)
Unrestricted Permanently Restricted
Total Net Endowment
Assets Net Assets, Beginning of Year $ 415 $ 30,773 $ 31,188 Change in value of trusts — 45 45 Contributions 20 764 784 Amounts appropriated for expenditures (27) 264 237 Other transfers 1 — 1 Net Assets, End of Year $ 409 31,846 32,255
Changes in endowment net assets as of June 30, 2010 are as follows:
Schedule of Endowment Net Assets As of June 30, 2010
(In Thousands)
Unrestricted Permanently Restricted
Total Net Endowment
Assets Net Assets, Beginning of Year $ 457 $ 28,374 $ 28,831 Change in value of trusts — (16) (16) Contributions 26 2,544 2,570 Amounts appropriated for expenditures (71) (129) (200) Other transfers 3 — 3 Net Assets, End of Year $ 415 $ 30,773 $ 31,188
51

This page intentionally left blank
52
REQUIRED SUPPLEMENTARY INFORMATION SECTION
53

This page intentionally left blank.
54
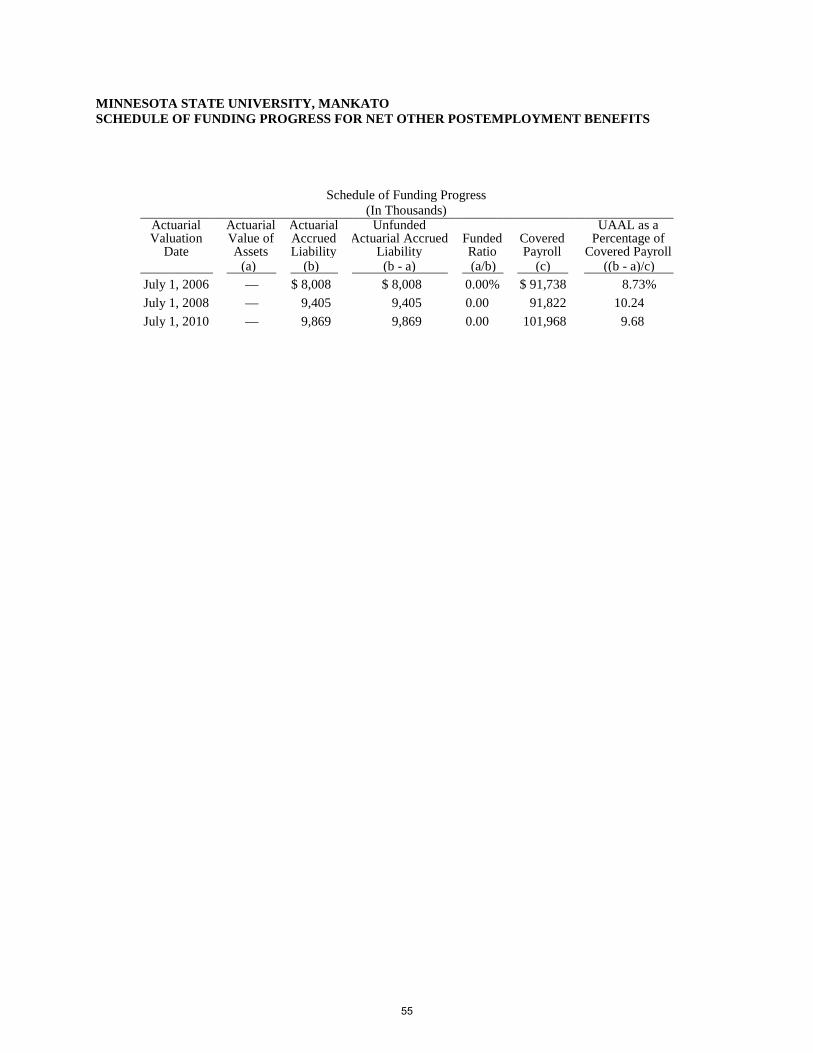
MINNESOTA STATE UNIVERSITY, MANKATO SCHEDULE OF FUNDING PROGRESS FOR NET OTHER POSTEMPLOYMENT BENEFITS
Schedule of Funding Progress (In Thousands)
Actuarial Valuation
Date
Actuarial Value of Assets
Actuarial Accrued Liability
Unfunded Actuarial Accrued
Liability
Funded Ratio
Covered Payroll
UAAL as a Percentage of
Covered Payroll (a) (b) (b - a) (a/b) (c) ((b - a)/c)
July 1, 2006 — $ 8,008 $ 8,008 0.00% $ 91,738 8.73% July 1, 2008 — 9,405 9,405 0.00 91,822 10.24 July 1, 2010 — 9,869 9,869 0.00 101,968 9.68
55

This page intentionally left blank
56

SUPPLEMENTARY SECTION
57
58
~DVExpert advice. When you need it. SM
REPORT ON INTERNAL CONTROL OVER FINANCIAL REPORTINGAND ON COMPLIANCE AND OTHER MATTERS BASED ON AN AUDITOF FINANCIAL STATEMENTS PERFORMED IN ACCORDANCE WITH
GOVERNMENTAUDITING STANDARDS
Board of TrusteesMinnesota State University, MankatoMinnesota State Colleges and UniversitiesS1. Paul, Minnesota
We have audited the financial statements of Minnesota State University, Mankato, a campus ofMinnesota State Colleges and Universities, as of and for the year ended June 30, 2011, and haveissued our report thereon dated October 28, 2011. We did not audit the financial statements ofMinnesota State University, Mankato Foundation Inc., a component unit ofthe University.These statements were audited by other auditors for the year ended June 30, 2011. Weconducted our audit in accordance with U.S. generally accepted auditing standards and thestandards applicable to financial audits contained in Government Auditing Standards, issued bythe Comptroller General of the United States. The financial statements of Minnesota StateUniversity, Mankato Foundation Inc. were not audited in accordance with Government AuditingStandards.
INTERNAL CONTROL OVER FINANCIAL REPORTING
In planning and performing our audit, we considered the University's internal control overfinancial reporting as a basis for designing our auditing procedures for the purpose of expressingour opinion on the financial statements, but not for the purpose of expressing an opinion on theeffectiveness of the University's internal control over financial reporting. Accordingly, we donot express an opinion on the effectiveness of the University's internal control over financialreporting.
A deficiency in internal control exists when the design or operation ofa control does not allowmanagement or employees, in the normal course ofperforming their assigned functions, toprevent or detect and correct misstatements on a timely basis. A material weakness is adeficiency, or combination of deficiencies, in internal control such that there is a reasonablepossibility that a material misstatement of the financial statements will not be prevented ordetected and corrected on a timely basis.
59
~DV
Our consideration of internal control over financial reporting was for the limited purposedescribed in the first paragraph ofthis section and was not designed to identify all deficiencies inthe internal control that might be deficiencies, significant deficiencies or material weaknesses.We did not identify any deficiencies in internal control over financial reporting that we considerto be material weaknesses, as defined above.
COMPLIANCE AND OTHER MATTERS
As part of obtaining reasonable assurance about whether the University's financial statements arefree ofmaterial misstatement, we performed tests of its compliance with certain provisions oflaws, regulations, contracts and grant agreements, noncompliance with which could have a directand material effect on the determination of financial statement amounts. However, providing anopinion on compliance with those provisions was not an objective of our audit and, accordingly,we do not express such an opinion. The results ofour tests disclosed no instances ofnoncompliance or other matters that are required to be reported under Government AuditingStandards.
This report is intended solely for the information of the audit committee, management, the Boardof Trustees and state regulatory agencies and is not intended to be and should not be used byanyone other than those specified parties.
~,7)~W~4J V~, ~KERN, DEWENTER, VIERE, LTD.Bloomington, MinnesotaOctober 28, 2011

This page intentionally left blank
60