Embed Size (px)
Citation preview
Quality Tools and Topics
Quality Tools and Topics V7.5 - Slide 2
© 2012 Massachusetts Institute of Technology
Learning Objectives
At the end of this module, you will be able to:
• Describe how quality is essential to Lean in achieving customer satisfaction
• Use basic quality tools
Quality Tools and Topics V7.5 - Slide 3
© 2012 Massachusetts Institute of Technology
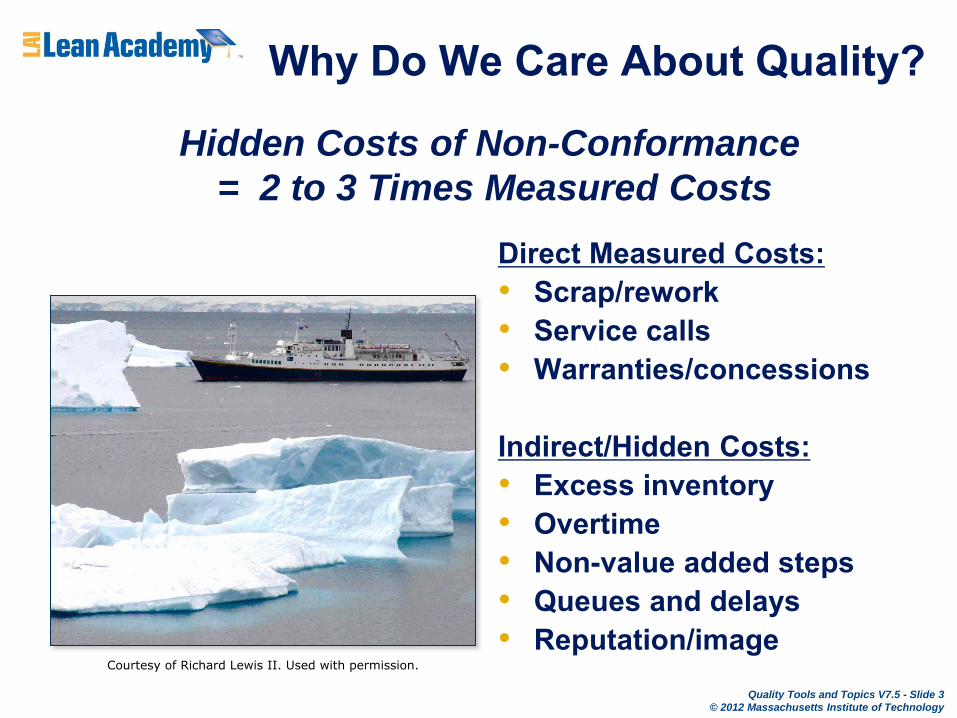
Hidden Costs of Non-Conformance
= 2 to 3 Times Measured Costs
Why Do We Care About Quality?
Direct Measured Costs: • Scrap/rework • Service calls • Warranties/concessions
Indirect/Hidden Costs: • Excess inventory • Overtime • Non-value added steps • Queues and delays • Reputation/image
Courtesy of Richard Lewis II. Used with permission.
Quality Tools and Topics V7.5 - Slide 4
© 2012 Massachusetts Institute of Technology
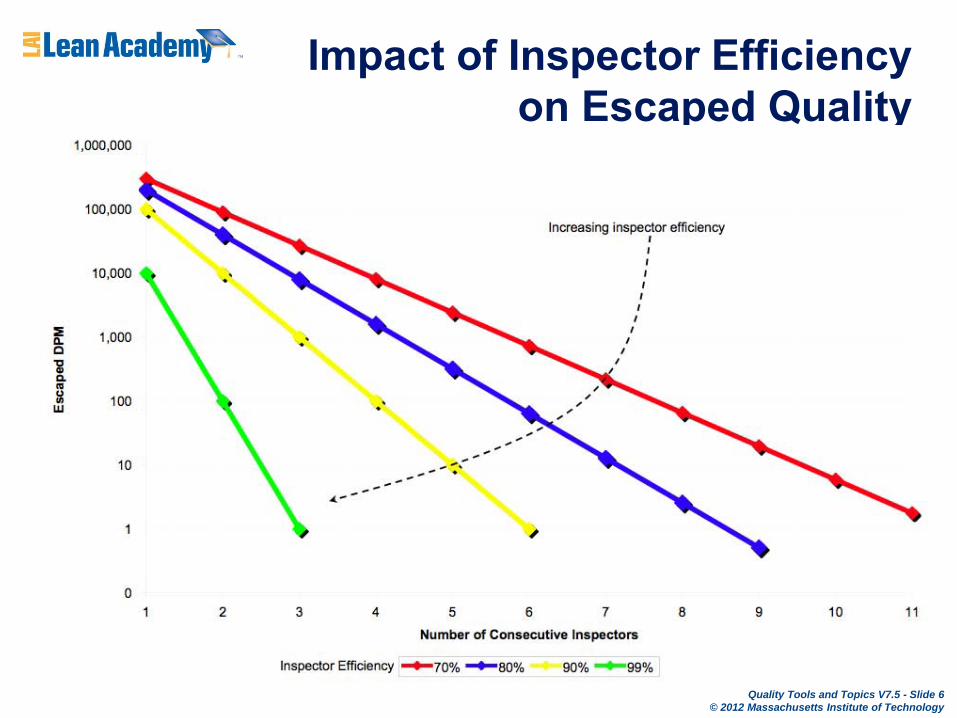
Problems with Inspection Based Quality Control
• Inspection does not add value to the customer – it simply screens or detects (most of the time) defective products from leaving the factory.
• Inspection is subject to multiple errors • Inspector skill and attention • Measurement capability • Environment (Human Factors)
Quality Tools and Topics V7.5 - Slide 5
© 2012 Massachusetts Institute of Technology
Inspection Exercise
This exercise will be in two 30 second sessions Task: Find all of the fs or Fs on a page of text • Take out the Inspection Exercise from the
student folder and turn it face down. • On “GO”, circle all the fs or Fs you find • On “STOP”, and turn over your sheet and pass
the sheet to the person on your right. • On “GO”, mark Xs all the other fs or Fs you find • On “STOP”, count up the number of fs and Fs
that are circled and the number with Xs.
Quality Tools and Topics V7.5 - Slide 6
© 2012 Massachusetts Institute of Technology
Impact of Inspector Efficiency on Escaped Quality
Quality Tools and Topics V7.5 - Slide 7
© 2012 Massachusetts Institute of Technology
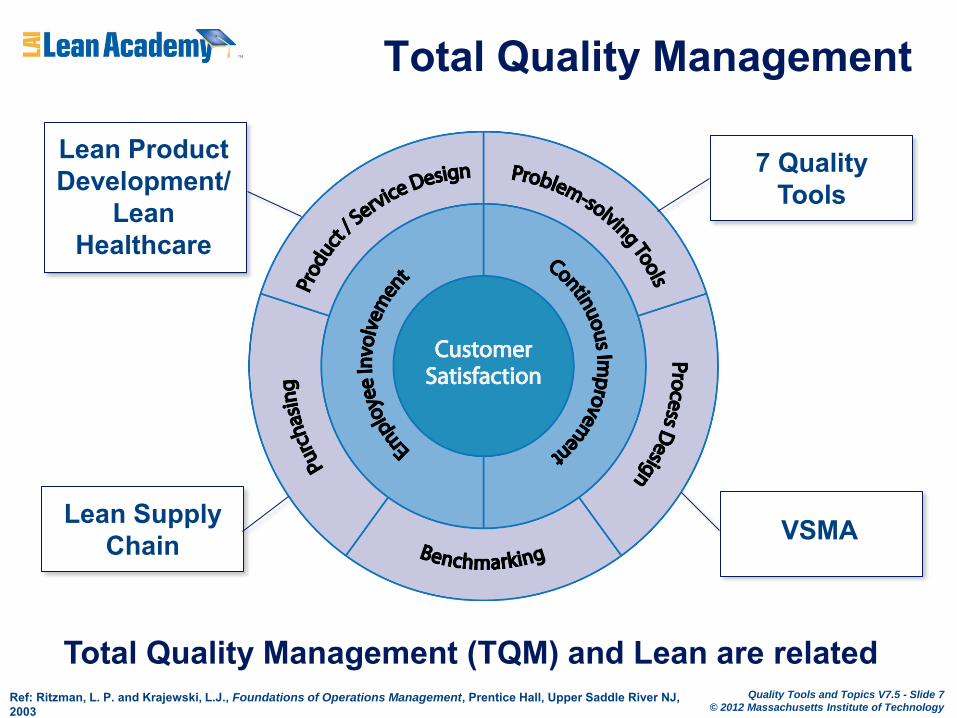
Total Quality Management
Total Quality Management (TQM) and Lean are related
Lean Supply Chain VSMA
Lean Product Development/
Lean Healthcare
7 Quality Tools
Ref: Ritzman, L. P. and Krajewski, L.J., Foundations of Operations Management, Prentice Hall, Upper Saddle River NJ, 2003
Quality Tools and Topics V7.5 - Slide 8
© 2012 Massachusetts Institute of Technology
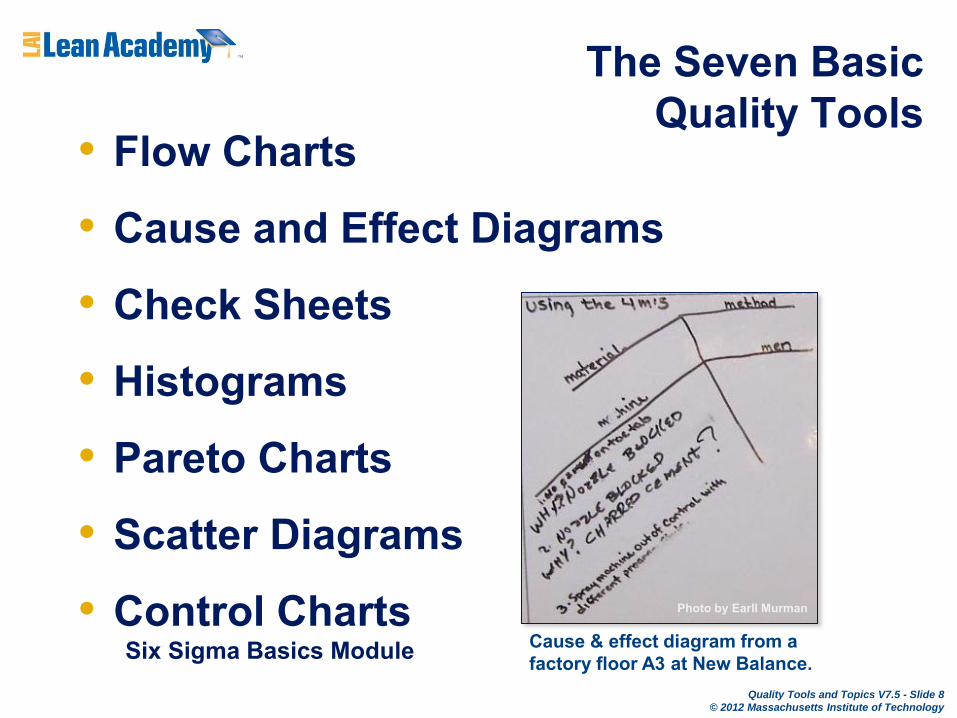
The Seven Basic Quality Tools
• Flow Charts
• Cause and Effect Diagrams
• Check Sheets
• Histograms
• Pareto Charts
• Scatter Diagrams
• Control Charts Six Sigma Basics Module Cause & effect diagram from a
factory floor A3 at New Balance.
Photo by Earll Murman
Quality Tools and Topics V7.5 - Slide 9
© 2012 Massachusetts Institute of Technology
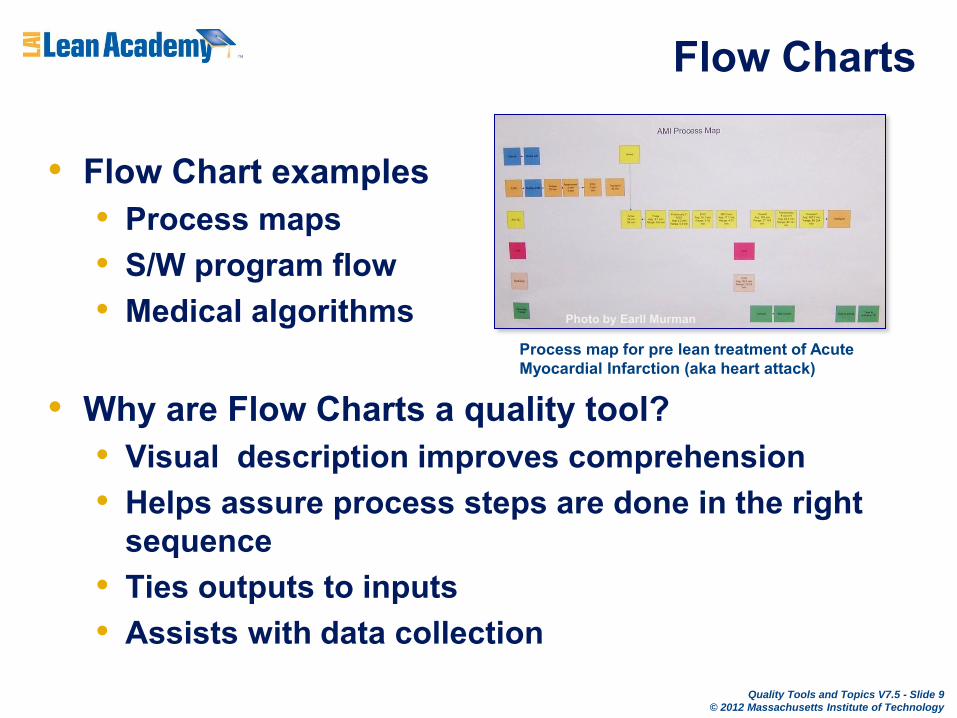
Flow Charts
• Flow Chart examples • Process maps • S/W program flow • Medical algorithms
• Why are Flow Charts a quality tool?
• Visual description improves comprehension • Helps assure process steps are done in the right
sequence • Ties outputs to inputs • Assists with data collection
Photo by Earll Murman
Process map for pre lean treatment of Acute Myocardial Infarction (aka heart attack)
Quality Tools and Topics V7.5 - Slide 10
© 2012 Massachusetts Institute of Technology
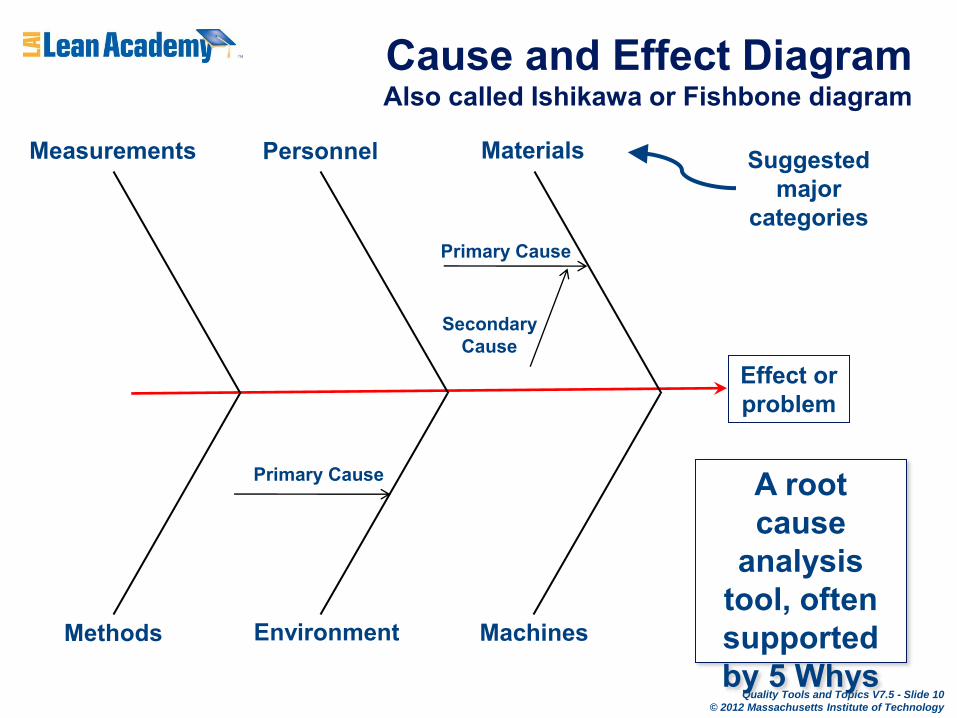
Measurements Personnel Materials
Methods Environment Machines
Cause and Effect Diagram Also called Ishikawa or Fishbone diagram
Effect or problem
Primary Cause
Primary Cause
Secondary Cause
Suggested major
categories
A root cause
analysis tool, often supported by 5 Whys
Quality Tools and Topics V7.5 - Slide 11
© 2012 Massachusetts Institute of Technology
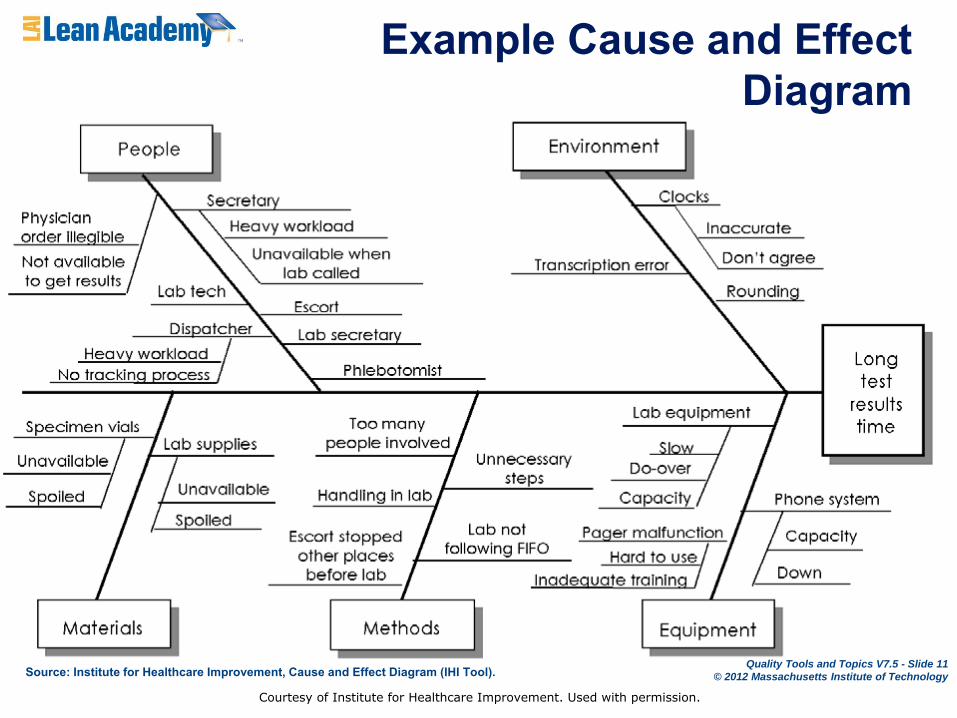
Example Cause and Effect Diagram
Source: Institute for Healthcare Improvement, Cause and Effect Diagram (IHI Tool).
Courtesy of Institute for Healthcare Improvement. Used with permission.
Quality Tools and Topics V7.5 - Slide 12
© 2012 Massachusetts Institute of Technology
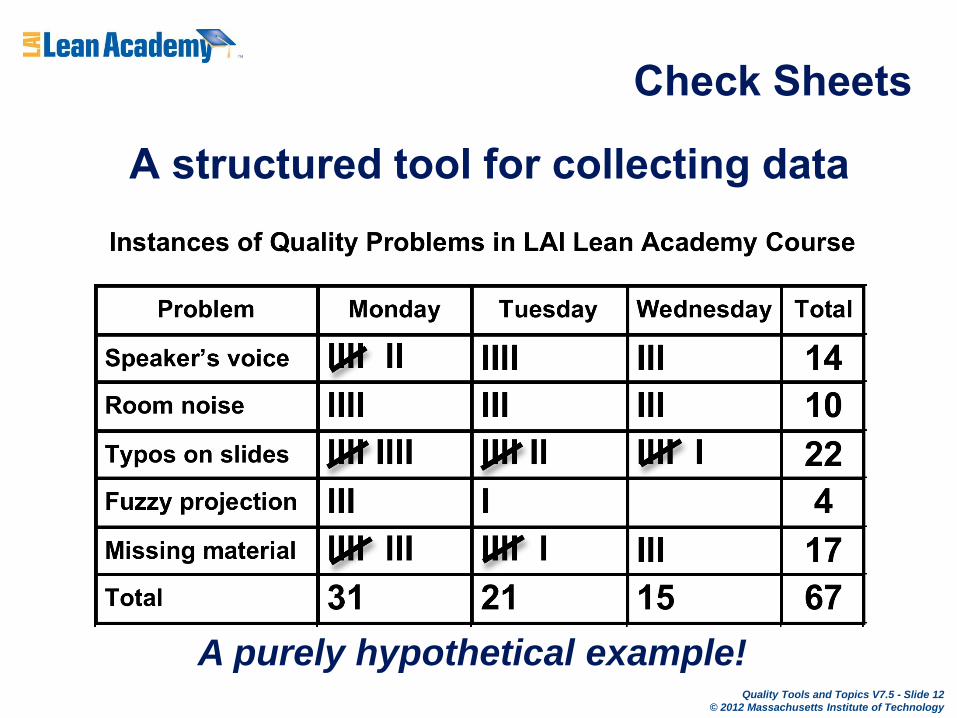
Check Sheets
A structured tool for collecting data
A purely hypothetical example!
Quality Tools and Topics V7.5 - Slide 13
© 2012 Massachusetts Institute of Technology
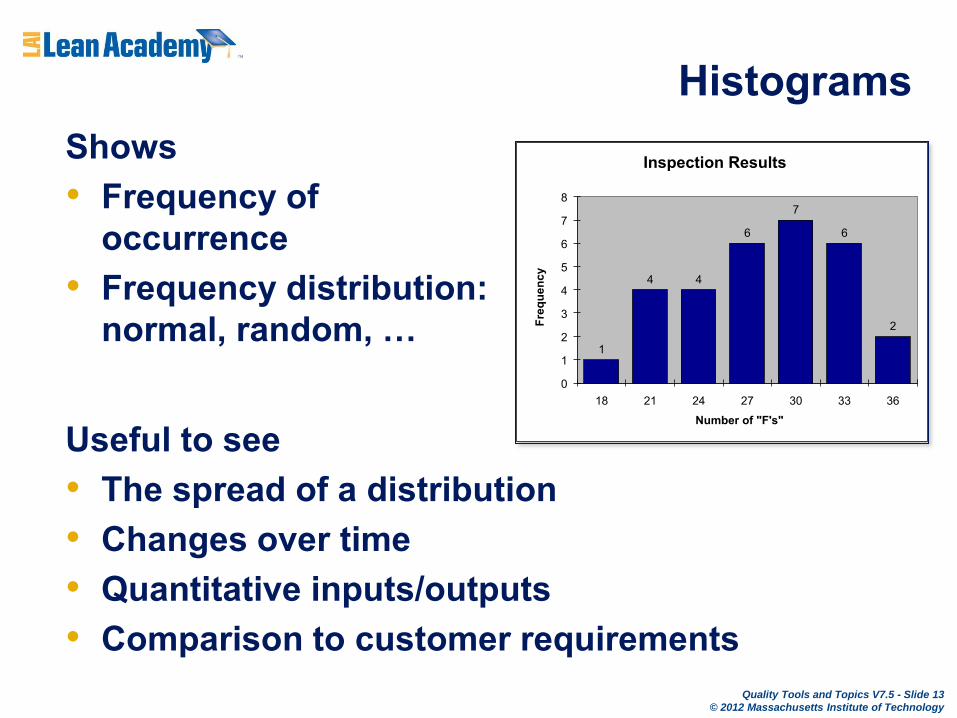
Histograms Shows • Frequency of
occurrence • Frequency distribution:
normal, random, … 1
4 4
6
7
6
2
0
1
2
3
4
5
6
7
8
18 21 24 27 30 33 36
Fre
qu
en
cy
Number of "F's"
Inspection Results
Useful to see • The spread of a distribution • Changes over time • Quantitative inputs/outputs • Comparison to customer requirements
Quality Tools and Topics V7.5 - Slide 14
© 2012 Massachusetts Institute of Technology
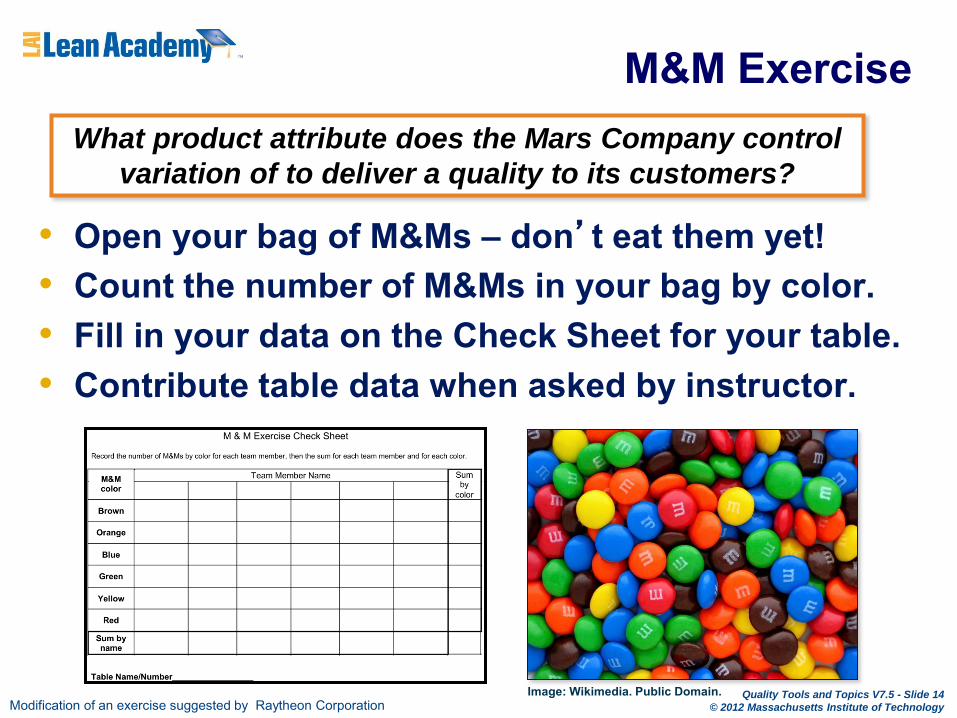
M&M Exercise
• Open your bag of M&Ms – don’t eat them yet! • Count the number of M&Ms in your bag by color. • Fill in your data on the Check Sheet for your table. • Contribute table data when asked by instructor.
Modification of an exercise suggested by Raytheon Corporation
What product attribute does the Mars Company control
variation of to deliver a quality to its customers?
Image: Wikimedia. Public Domain.
Quality Tools and Topics V7.5 - Slide 15
© 2012 Massachusetts Institute of Technology
Class Poll What M&M attribute to you think Mars
Company uses quality principles to control variation of? • Total M&Ms in a bag? • Color distribution? • Something else • I don’t know
Hold up the colored 3 x 5 card of your choice
Quality Tools and Topics V7.5 - Slide 16
© 2012 Massachusetts Institute of Technology
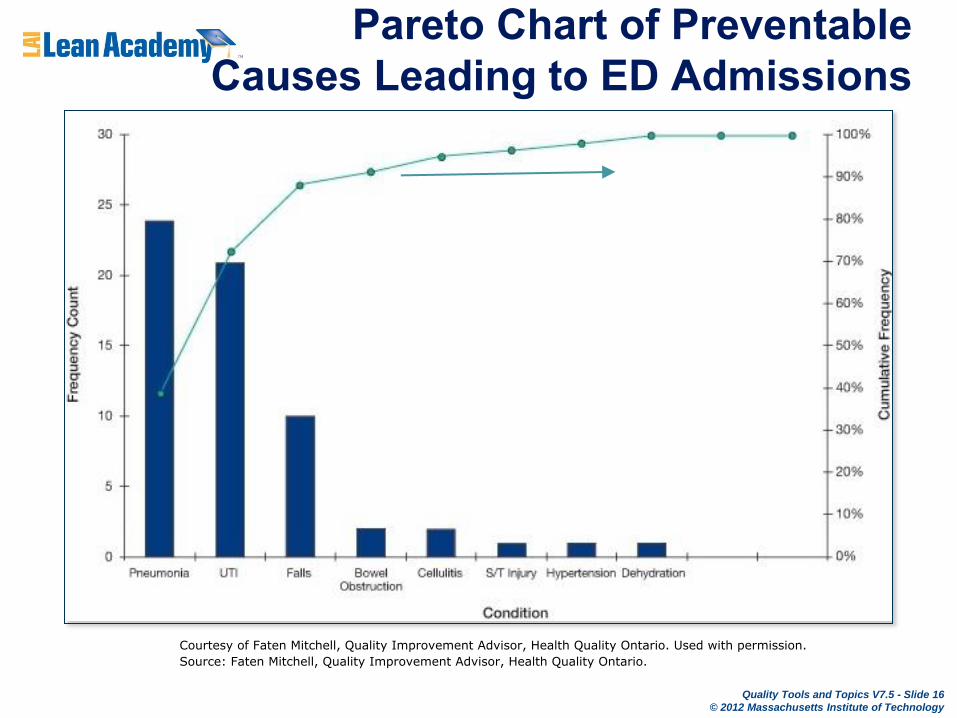
Pareto Chart of Preventable Causes Leading to ED Admissions
Courtesy of Faten Mitchell, Quality Improvement Advisor, Health Quality Ontario. Used with permission.Source: Faten Mitchell, Quality Improvement Advisor, Health Quality Ontario.
Quality Tools and Topics V7.5 - Slide 17
© 2012 Massachusetts Institute of Technology
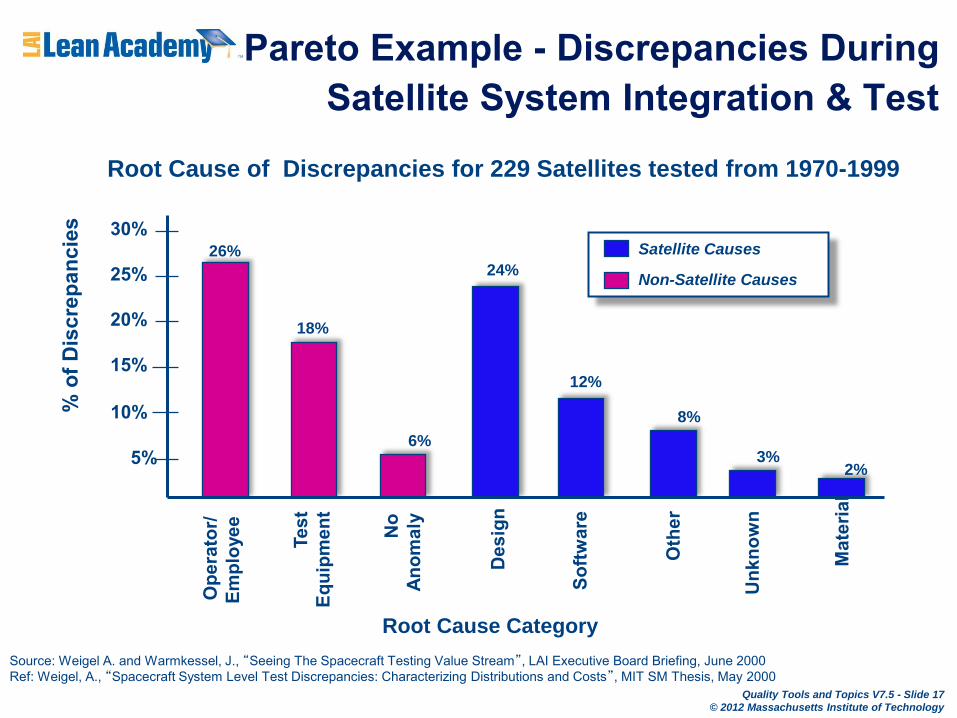
Pareto Example - Discrepancies During Satellite System Integration & Test
% o
f Dis
crep
anci
es
Root Cause Category
Root Cause of Discrepancies for 229 Satellites tested from 1970-1999
Ope
rato
r/ Em
ploy
ee
Test
Eq
uipm
ent
Softw
are
26%
18%
24%
6%
12%
30%
25%
20%
15%
10%
5%
No
Anom
aly
Des
ign
2% 3%
8%
Oth
er
Unk
now
n
Mat
eria
l
Satellite Causes
Non-Satellite Causes
Source: Weigel A. and Warmkessel, J., “Seeing The Spacecraft Testing Value Stream”, LAI Executive Board Briefing, June 2000 Ref: Weigel, A., “Spacecraft System Level Test Discrepancies: Characterizing Distributions and Costs”, MIT SM Thesis, May 2000
Quality Tools and Topics V7.5 - Slide 18
© 2012 Massachusetts Institute of Technology
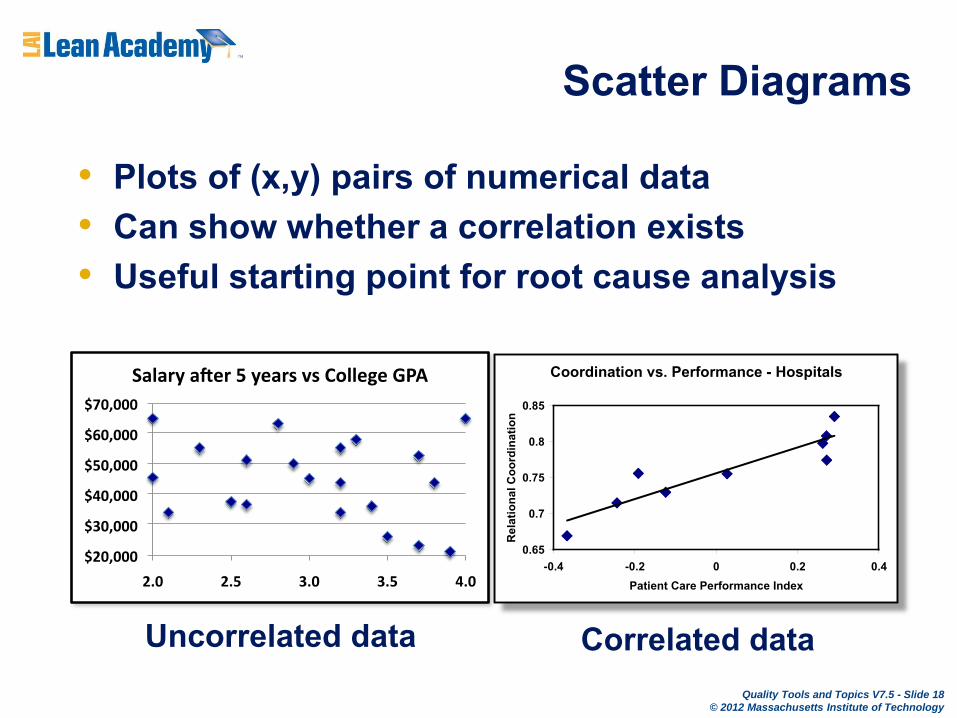
Scatter Diagrams
• Plots of (x,y) pairs of numerical data • Can show whether a correlation exists • Useful starting point for root cause analysis
Coordination vs. Performance - Hospitals
0.65
0.7
0.75
0.8
0.85
-0.4 -0.2 0 0.2 0.4
Patient Care Performance Index
Re
lati
on
al
Co
ord
ina
tio
n
Uncorrelated data Correlated data
Quality Tools and Topics V7.5 - Slide 19
© 2012 Massachusetts Institute of Technology
Summing Up
• Inspection is an ineffective way to produce high quality products and services
• Total Quality Management and Lean Thinking are closely related
• Lean Thinking and TQM both utilized simple, structured, quantitative and qualitative tools to achieve quality
• There are seven basic quality tools • But remember – capable people are the most
important factor in achieving quality
Quality Tools and Topics V7.5 - Slide 20
© 2012 Massachusetts Institute of Technology
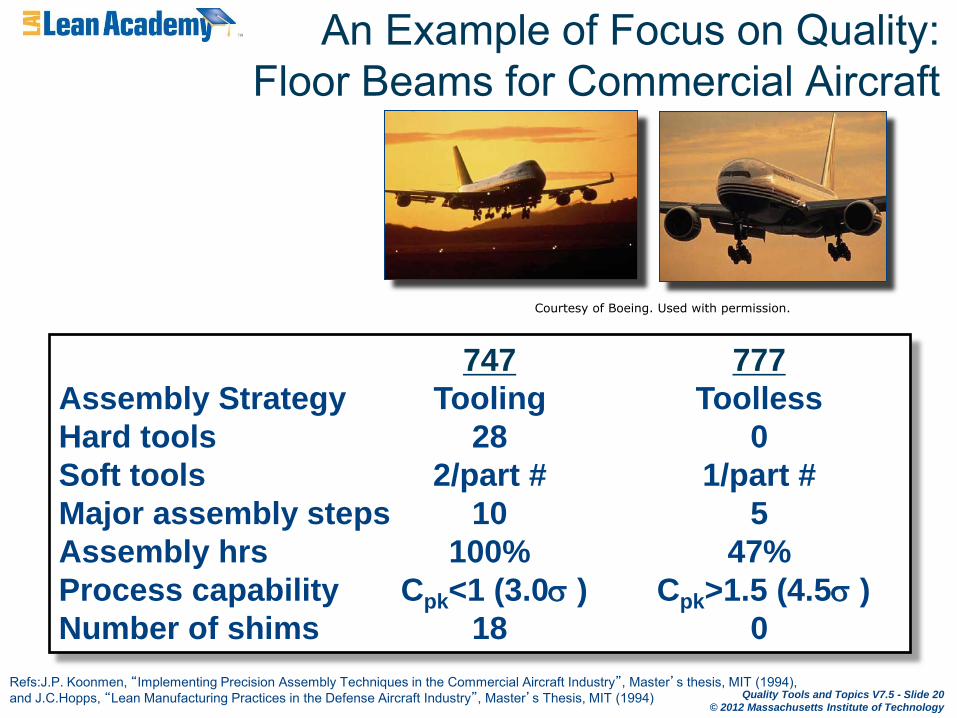
An Example of Focus on Quality: Floor Beams for Commercial Aircraft
747 777
Assembly Strategy Tooling Toolless
Hard tools 28 0
Soft tools 2/part # 1/part #
Major assembly steps 10 5
Assembly hrs 100% 47%
Process capability Cpk<1 (3.0 ) Cpk>1.5 (4.5 )
Number of shims 18 0
Refs:J.P. Koonmen, “Implementing Precision Assembly Techniques in the Commercial Aircraft Industry”, Master’s thesis, MIT (1994), and J.C.Hopps, “Lean Manufacturing Practices in the Defense Aircraft Industry”, Master’s Thesis, MIT (1994)
Courtesy of Boeing. Used with permission.
Quality Tools and Topics V7.5 - Slide 21
© 2012 Massachusetts Institute of Technology
Reading List
Deming, E., Out of Crisis, The MIT Press, Cambridge, MA, 2000 Hopp, W.J. and Spearman, M.L., Factory Physics, 3rd Edition, McGraw-Hill/Irwin, 2007 Juran, J.M., Juran on Quality by Design, The Free Press, New York, 1992 Nelson, E.C., Batalden, P.B., Godfrey, M. M., Quality By Design: A
Clinical Micosystems Approach, John Wiley and Sons, New York, 2007 Ritzman, L.P. and Krajewski, L.J., Foundations of Operations
Management, Prentice Hall, Upper Saddle Brook NJ, 2003 Tague, N.R., The Quality Tool Box, Second Edition, ASQ Quality Press, 2004
Quality Tools and Topics V7.5 - Slide 22
© 2012 Massachusetts Institute of Technology
Acknowledgements
Contributors •Dick Lewis – Rolls-Royce (ret.) •Jose Macedo – Cal Poly, San Luis Obispo •Hugh McManus – Metis Design •Earll Murman – MIT •Steve Shade – Purdue University •Alexis Stanke – MIT Collaborators •Tom Callarman – Arizona State University •Phil Farrington – University of Alabama in Huntsville •Al Haggerty – MIT, Boeing (ret.) •Jan Martinson – Boeing, IDS •Faten Mitchell – Health Quality Ontario •Bo Oppenheim – Loyola Marymount University •Sue Siferd – ASU •Barrett Thomas – University of Iowa
MIT OpenCourseWarehttp://ocw.mit.edu
16.660J / ESD.62J / 16.853 Introduction to Lean Six Sigma MethodsIAP 2012
For information about citing these materials or our Terms of Use, visit: http://ocw.mit.edu/terms.