Embed Size (px)
Citation preview
280
American Scientific Research Journal for Engineering, Technology, and Sciences (ASRJETS) ISSN (Print) 2313-4410, ISSN (Online) 2313-4402
© Global Society of Scientific Research and Researchers
http://asrjetsjournal.org/
Mitigation Measures of Flood and Drought for
Ayeyarwady Basin
Minn Ko Ko Kyaw a*, Nilar Aye b
a,b Department of Civil Engineering, Mandalay Technological University, Mandalay,
The Republic of the Union of Myanmar aEmail: [email protected]
bEmail: [email protected]
Abstract
This research represents about the mitigation measures of flood and drought for Ayeyarwady Basin. The
objective of this study is to propose the mitigation effect of flood and drought in Ayeyarwady Basin. In this
study, flood vulnerable areas for Ayeyarwady Basin are assessed by using Hydrologic Engineering Center’s
River Analysis System (HEC-RAS) model, GIS and Remote Sensing technique. Landuse classification map
(2014 year) is extracted from Google Earth Engine based on land satellite LANDSAT-7 data and then Curve
Number (CN) grid map is developed. Landuse classification in year 2014, the closed forest is found as about
48.9% and deciduous forest is about 26.3% of Ayeyarwady Basin. After delineating the flood plain area in
HEC-RAS, the flood map for Ayeyarwady basin is developed by using Arc-GIS. The flood area by using 2014
landuse classification is 10414.18 km2 and the flooded regions are part of Mandalay, Sagaing, Monywa,
Pakokku, Magway, Yaynanchaung and Thayet. According to the landuse classification in 2000 year, closed
forest is 62.8% and deciduous forest is 28.05%. The flooded area is about 7081.03 km2. According to these
scenarios, it is found that flooded area can be reduced about 32% due to forestation. For the spatial
characterization of drought, Spatial interpolation (Spline) method in Geographic Information System (GIS) is
used to generate drought severity maps. According to the drought severity map and severity values, Aunglan,
Magway and Nyaungoo are the most severity regions and which are considered as pilot regions in this study.
Two scenarios of rainwater harvesting are proposed to mitigate the drought severity area. In the first scenario,
rainwater is collected from the roof top and stored in the storage tank.
------------------------------------------------------------------------ * Corresponding author.
brought to you by COREView metadata, citation and similar papers at core.ac.uk
provided by American Scientific Research Journal for Engineering, Technology, and Sciences...
American Scientific Research Journal for Engineering, Technology, and Sciences (ASRJETS) (2018) Volume 45, No 1, pp 280-298
281
The average maximum monthly collected rainwater per house hold for three types of roofing area are 4.423 m3,
13.539 m3 and 27.214 m3 respectively. The second scenario is to recharge the rainwater volume directly over the
different types of landuse area and soil group. As a result, the recharge volume for Aunglan, Magway and
Nyaungoo regions are 530.85 Mm3/year, 219.312 Mm3/year and 224.863 Mm3/year respectively. Finally, these
scenarios are proposed to mitigate the effect of flood and drought in Ayeyarwady Basin.
Keywords: Drought, Flood, Mitigation Measures, Forestation, Rainwater Harvesting.
1. Introduction
Nowadays, most of the places in the world suffer climate change including Myanmar. Among them, flooding is
one of the most importance problems in our country. Most of the flooding in the lower Ayeyarwady is caused by
flooding in Chindwin and upper Ayeyarwady. In addition, Doakehtawady River, tributary of Ayeyarwady, also
set off major floods. Floods, in consequence, can occur over a wide range of region especially in lower basin
(Sagaing to Pyay). Myanmar is one of the vulnerability to climate change impacts in terms of extreme
temperature, severe drought, cyclones, floods, heavy rainfall and less precipitation, landslides, earthquakes and
tsunami [9]. In 2004, the flood has been occurred a result of intense rainfall in the upper portion of the
Ayeyarwady River. Rainfall peak and water level peak are different since local rain is not affected in the study
area. Most of the flood in the study area is mainly related to upstream rain effects [16].
According to Natural Disaster Risk Assessment country report, 50% of the total number of disasters in
Myanmar was related to floods followed by storm (23%), earthquake (15%), and mass movement-wet (12%),
whereas 73% of the total affected people by disasters were due to storm followed by floods [16]. Flood event
occurred in 2011, which was caused damages in Magway and Mandalay in the central areas and Sagaing in the
northern region. Flash floods hit Pakokku and collapsed a bridge. In Sagaing Division, more than 190,000 acres
of the farmlands are flooded and 18,000 acres were destroyed. Similarly, Kalay and Kanbalu Township were
severely affected by flooding. Overspills of Mone and Man creek affected 300 villages as well as town area in
Pwintphyu, Saytotetayar and Ngape [16]. There is a rapid increasing of urbanization so that the landuse and
landcover are simultaneously changing year after year. The flood or other natural hazard are occurred due to the
effect of urbanization, deforestation and other human impact. So that the flooded area can be reduced as
conserve forest and prevent the forest become extinct.
Drought is one of the major environmental disasters, which have been occurring in almost all climatic zones and
damage to the environment and economies of several countries has been extensive. Drought has become one of
the most important elements for water resources planning and management in Ayeyarwady basin especially in
dry zone. Drought damages are more pronounced or prominent in areas where there is a direct threat to
livelihoods. In drought management, making the transition from crisis to risk management is difficult because
little has been done to understand and address the risks associated with drought.
Now in Myanmar, meteorological drought occurs when the seasonal rainfall received over an area less than 750
mm especially in dry zone. Drought causes problems in water resources and agricultural sector. Drought
American Scientific Research Journal for Engineering, Technology, and Sciences (ASRJETS) (2018) Volume 45, No 1, pp 280-298
282
condition occurs during the dry season in the regions where the main cities include Magway, Chauk,
Yenangyaung and Saytotetayar in Magway region and Kyaukpadaung and Myinchan in Mandalay region [9]. In
2014, water shortage in Nyaungoo and Kyaukpadaung and the reservoir was dried up in Mya Kan near Bagan.
Water shortage is the most severe in Ayeyarwady, Sagaing, Yangon, Mandalay and Bago Regions and Mon,
Rakhine and Shan States. Most of the wells were dried up due to the depletion of underground water supply
because of late of monsoon onset and so the scarcity of drinking water problems occurred in Myanmar [9].
In this study, Geographic Information System (GIS) is used to generate the drought severity map for different
time scales of Standardized Precipitation Index (SPI). SPI is calculated by the stand alone PC software which
was used to calculate the drought severity. Spline spatial interpolation method is used to create the drought
severity map based on the severity values for different rainfall stations in Ayeyarwady Basin. Central dry zone
of the Ayeyarwady Basin has occurred high severity in which area is suffered water shortage in summer. In
Myanmar, central dry zone is comprised of many township and region, among them, Aunglan, Magway and
Nyaungoo regions are considered as three pilot regions. To reduce the actual impacts and losses during the next
drought, it is necessary to be on alert-based preparedness under the light of mitigation activities and plans.
Different mitigation strategies can be applied depending on the type of drought [6].
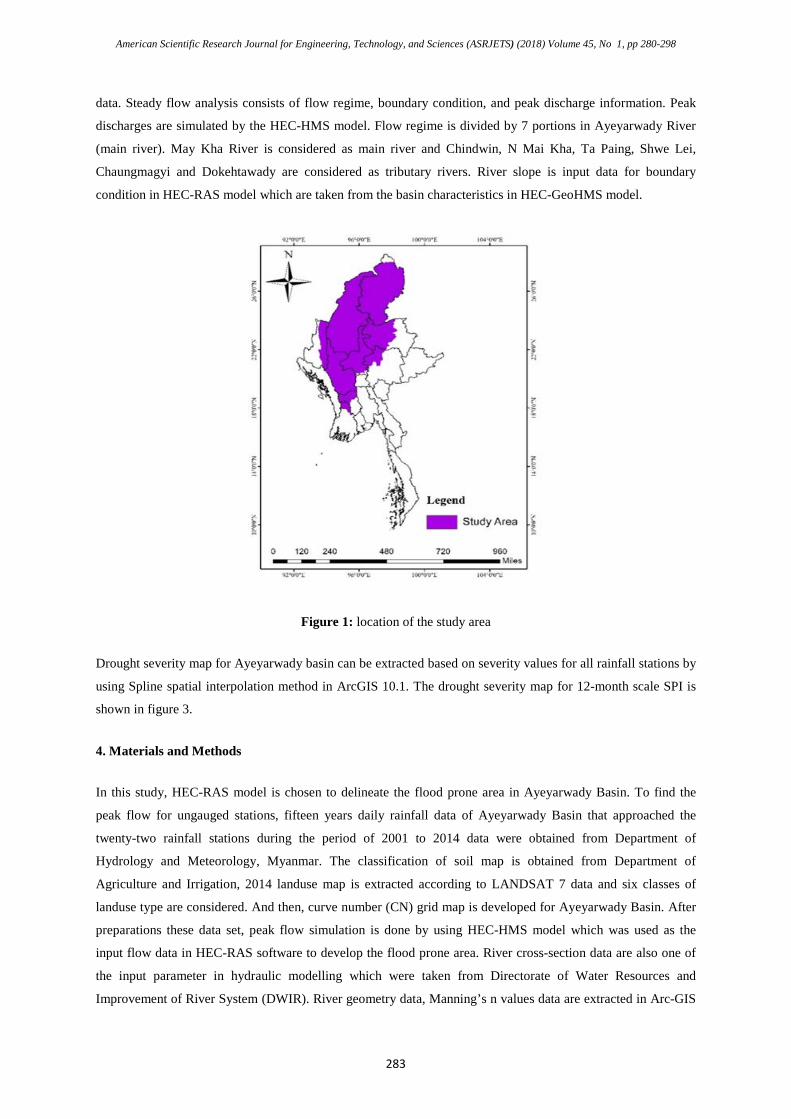
2. Location of the Study Area
The Ayeyarwady River is the largest river in Myanmar and it arises from the confluence of the May-Kha and
Mali-Kha rivers. It is running through the centre of the country and the most important commercial waterway in
Myanmar (about 1350 miles or 2170 km) long. In this study, research area is started from May-Kha and Mali-
Kha and terminated in Pyay (outlet). Study area is about 363280 km2 and lie between north latitude 20˚ 22' and
28• 31' and east longitude 94• 56' and 98• 45'. It is covered by Kachin State, Mandalay Division, Sagaing
Division and Shan State and Bago Division. The location of study area is shown in figure 1.
3. Background of the Study
Firstly, the RAS background file is created to delineate the flood prone area by using HEC-GeoRAS. HEC-RAS
5.0.1 is used to develop the flood prone area and Arc-GIS helps to develop the flood map and drought severity
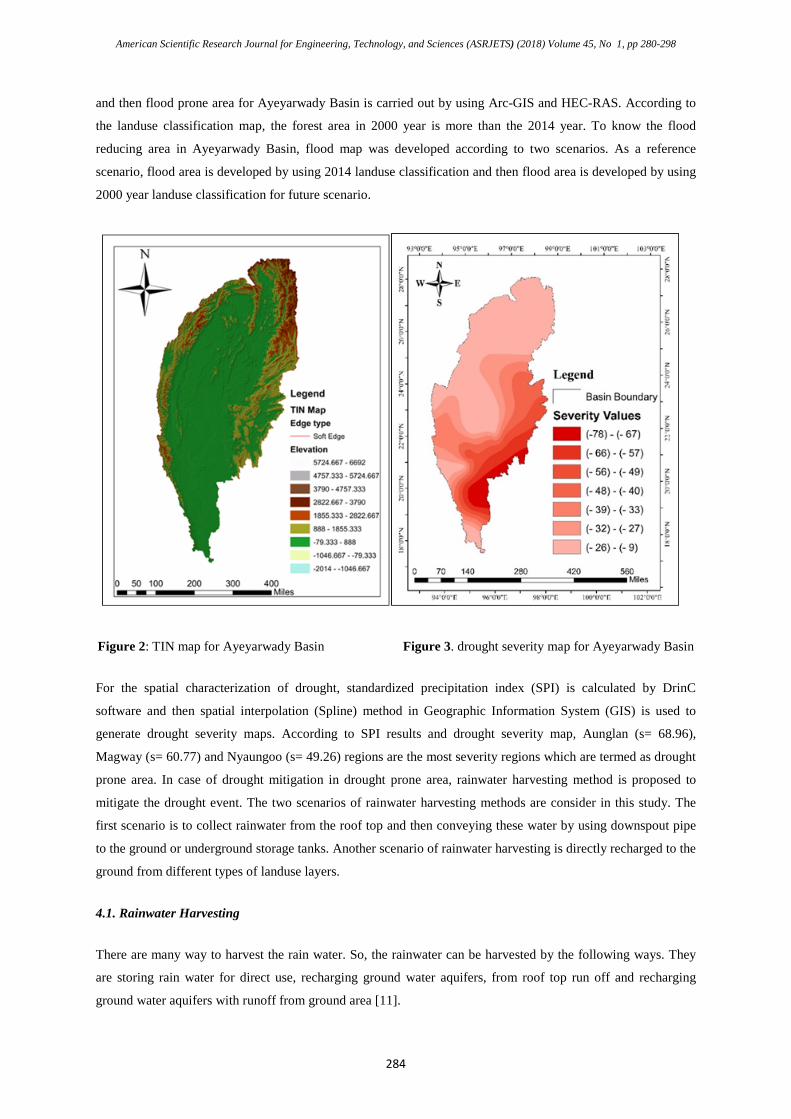
map for Ayeyarwady basin. As seen in figure 2, TIN map is the basic data to extract the flood plain area and it
can be converted from DEM (30 m) resolution map by 3D conversion tool in ArcGIS 10.1. After extracting TIN
maps, RAS layers are created in RAS Geometry tool in HEC-Geo RAS. RAS layers are stream centerline, bank
line, flow path centerlines, XS cut lines, land use area and manning's n values [1, 2, 13]. HEC-RAS is the
hydraulic model which is used to calculate the water-surface profiles, steady-state, gradually-varied flow
analysis. The data needed are geometry data and steady flow data. Geometry data are required for any of the
analyses performed within HEC-RAS. The basic geometric data consists of establishing the connectivity of the
river system, cross-section data, reach length, energy loss coefficient [1, 2]. In this study, river cross section data
are obtained from Directorate of Water Resources and Improvement of River System (DWIR). Input cross
section data at the upstream and downstream for each flow regime are assigned with Latitude and Longitude.
Cross-section lines spacing are not equal and data are not available in every station which is used as the terrain
American Scientific Research Journal for Engineering, Technology, and Sciences (ASRJETS) (2018) Volume 45, No 1, pp 280-298
283
data. Steady flow analysis consists of flow regime, boundary condition, and peak discharge information. Peak
discharges are simulated by the HEC-HMS model. Flow regime is divided by 7 portions in Ayeyarwady River
(main river). May Kha River is considered as main river and Chindwin, N Mai Kha, Ta Paing, Shwe Lei,
Chaungmagyi and Dokehtawady are considered as tributary rivers. River slope is input data for boundary
condition in HEC-RAS model which are taken from the basin characteristics in HEC-GeoHMS model.
Figure 1: location of the study area
Drought severity map for Ayeyarwady basin can be extracted based on severity values for all rainfall stations by
using Spline spatial interpolation method in ArcGIS 10.1. The drought severity map for 12-month scale SPI is
shown in figure 3.
4. Materials and Methods
In this study, HEC-RAS model is chosen to delineate the flood prone area in Ayeyarwady Basin. To find the
peak flow for ungauged stations, fifteen years daily rainfall data of Ayeyarwady Basin that approached the
twenty-two rainfall stations during the period of 2001 to 2014 data were obtained from Department of
Hydrology and Meteorology, Myanmar. The classification of soil map is obtained from Department of
Agriculture and Irrigation, 2014 landuse map is extracted according to LANDSAT 7 data and six classes of
landuse type are considered. And then, curve number (CN) grid map is developed for Ayeyarwady Basin. After
preparations these data set, peak flow simulation is done by using HEC-HMS model which was used as the
input flow data in HEC-RAS software to develop the flood prone area. River cross-section data are also one of
the input parameter in hydraulic modelling which were taken from Directorate of Water Resources and
Improvement of River System (DWIR). River geometry data, Manning’s n values data are extracted in Arc-GIS
American Scientific Research Journal for Engineering, Technology, and Sciences (ASRJETS) (2018) Volume 45, No 1, pp 280-298
284
and then flood prone area for Ayeyarwady Basin is carried out by using Arc-GIS and HEC-RAS. According to
the landuse classification map, the forest area in 2000 year is more than the 2014 year. To know the flood
reducing area in Ayeyarwady Basin, flood map was developed according to two scenarios. As a reference
scenario, flood area is developed by using 2014 landuse classification and then flood area is developed by using
2000 year landuse classification for future scenario.
Figure 2: TIN map for Ayeyarwady Basin Figure 3. drought severity map for Ayeyarwady Basin
For the spatial characterization of drought, standardized precipitation index (SPI) is calculated by DrinC
software and then spatial interpolation (Spline) method in Geographic Information System (GIS) is used to
generate drought severity maps. According to SPI results and drought severity map, Aunglan (s= 68.96),
Magway (s= 60.77) and Nyaungoo (s= 49.26) regions are the most severity regions which are termed as drought
prone area. In case of drought mitigation in drought prone area, rainwater harvesting method is proposed to
mitigate the drought event. The two scenarios of rainwater harvesting methods are consider in this study. The
first scenario is to collect rainwater from the roof top and then conveying these water by using downspout pipe
to the ground or underground storage tanks. Another scenario of rainwater harvesting is directly recharged to the
ground from different types of landuse layers.
4.1. Rainwater Harvesting
There are many way to harvest the rain water. So, the rainwater can be harvested by the following ways. They
are storing rain water for direct use, recharging ground water aquifers, from roof top run off and recharging
ground water aquifers with runoff from ground area [11].
American Scientific Research Journal for Engineering, Technology, and Sciences (ASRJETS) (2018) Volume 45, No 1, pp 280-298
285
A. Collected Rainfall from Rooftop
Rainfall can be collected directly from the roof top. The rain water harvesting system consists of the basic
components. They are catchment area, coarse mesh / leaf screen, gutter, downspout or conduit, first flushing
device, filter, storage tank and recharge structure. The design catchment area is selected 37.16, 111.48 and
222.96 m2 and the materials type of GI sheet, aluminum sheet, cement slabs and tiles are mostly found in pilot
area. The amount of rainfall can be collected from the rooftop by using the following Equation (1).
Collected Rainfall = Area x Rainfall x Coefficient (1)
The rain water collected on the roof top is transported down to storage facility through down spouts or conduits.
Conduits can be of any material like PVC, GI or cast iron. The number of downspout pipe can be calculated by
using the Equation (2).
downspout per servedarea drainage roof Maximumarea drainage Roofdownspout of Number = (2)
B. Rainwater Recharge Volume
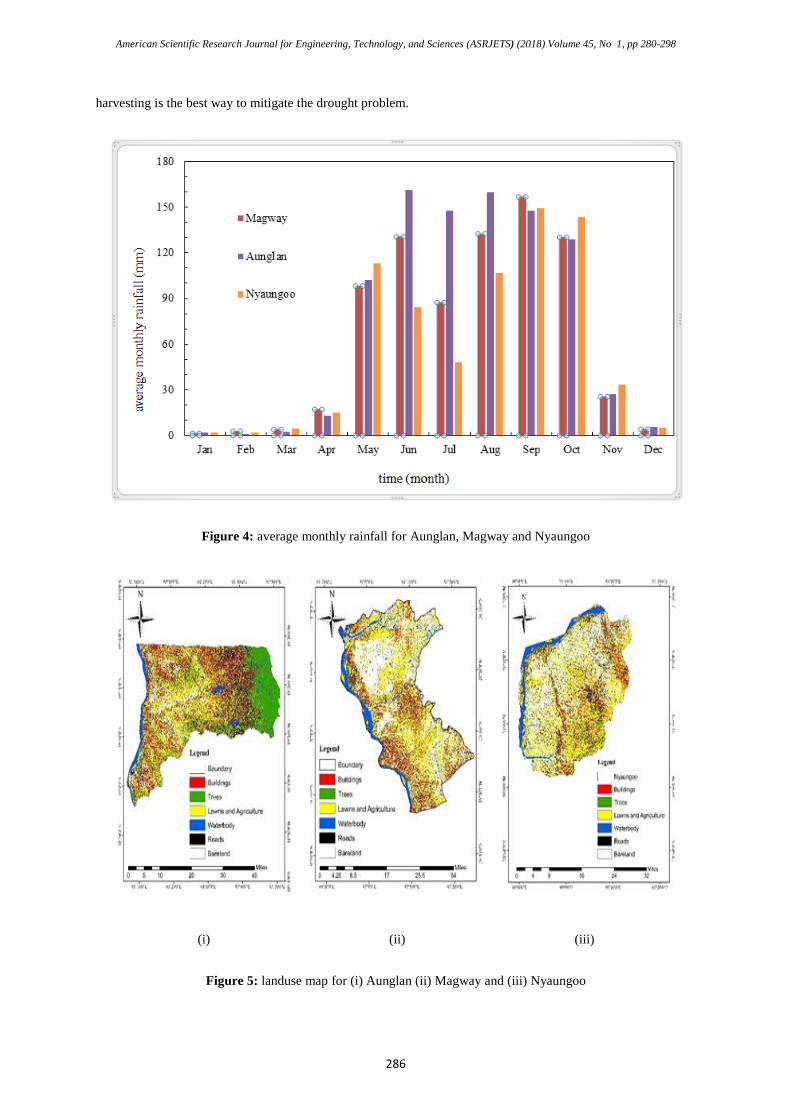
Rainwater can be recharged directly to the ground from landuse classification layers. The ground cover types for
three pilot area are classified by using LANDSAT 7 data which are residential, roads, trees, lawns and
agriculture, water body and bareland. The area of the ground cover portions are shown in the following table 1.
The recharge volume can be calculated by difference of precipitation volume and runoff volume. Runoff volume
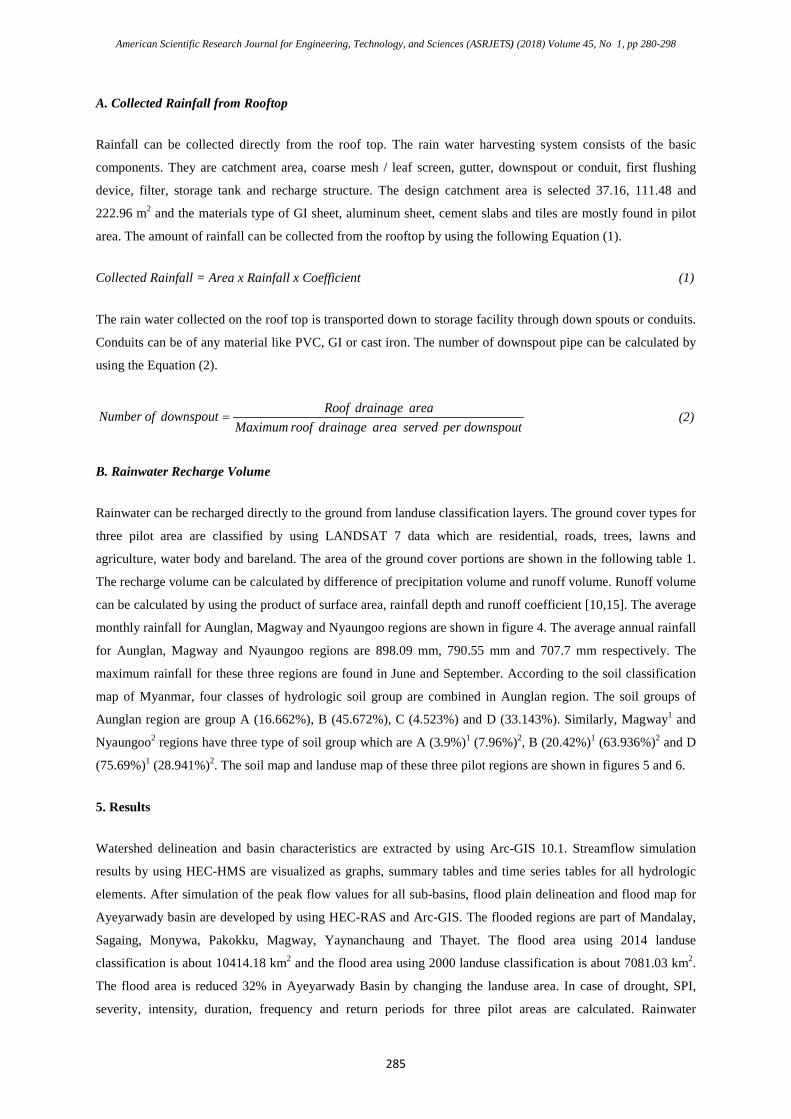
can be calculated by using the product of surface area, rainfall depth and runoff coefficient [10,15]. The average
monthly rainfall for Aunglan, Magway and Nyaungoo regions are shown in figure 4. The average annual rainfall
for Aunglan, Magway and Nyaungoo regions are 898.09 mm, 790.55 mm and 707.7 mm respectively. The
maximum rainfall for these three regions are found in June and September. According to the soil classification
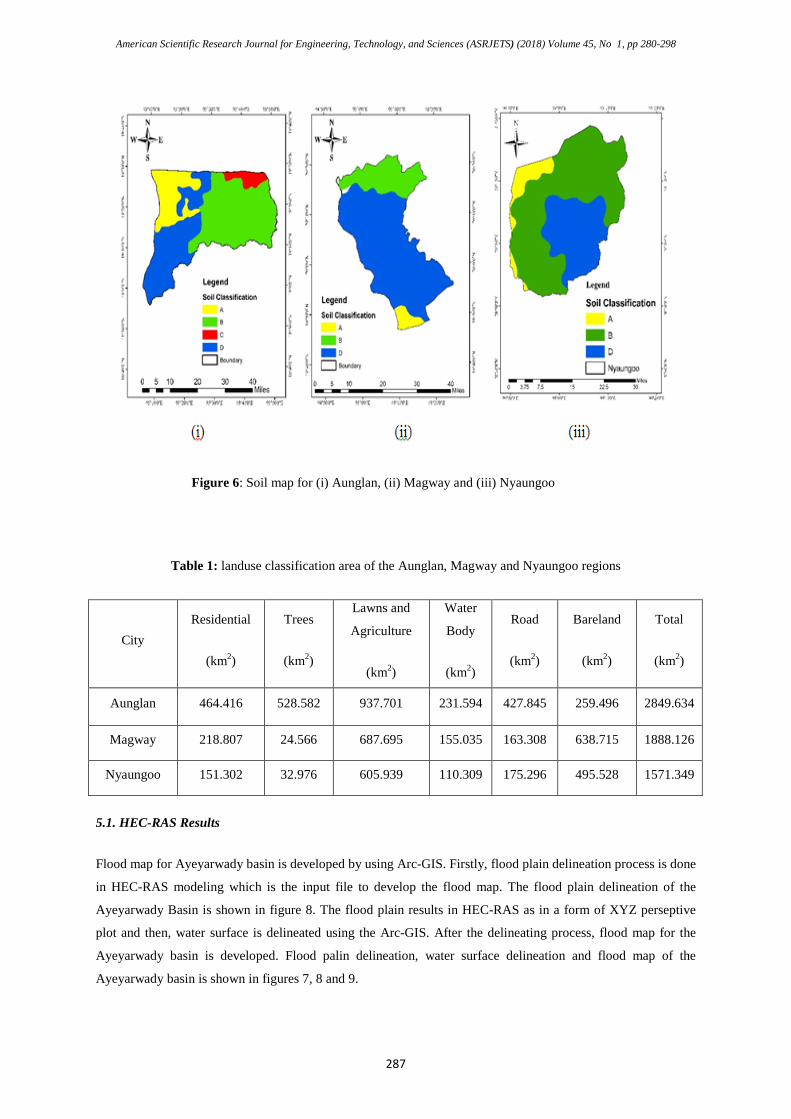
map of Myanmar, four classes of hydrologic soil group are combined in Aunglan region. The soil groups of
Aunglan region are group A (16.662%), B (45.672%), C (4.523%) and D (33.143%). Similarly, Magway1 and
Nyaungoo2 regions have three type of soil group which are A (3.9%)1 (7.96%)2, B (20.42%)1 (63.936%)2 and D
(75.69%)1 (28.941%)2. The soil map and landuse map of these three pilot regions are shown in figures 5 and 6.
5. Results
Watershed delineation and basin characteristics are extracted by using Arc-GIS 10.1. Streamflow simulation
results by using HEC-HMS are visualized as graphs, summary tables and time series tables for all hydrologic
elements. After simulation of the peak flow values for all sub-basins, flood plain delineation and flood map for
Ayeyarwady basin are developed by using HEC-RAS and Arc-GIS. The flooded regions are part of Mandalay,
Sagaing, Monywa, Pakokku, Magway, Yaynanchaung and Thayet. The flood area using 2014 landuse
classification is about 10414.18 km2 and the flood area using 2000 landuse classification is about 7081.03 km2.
The flood area is reduced 32% in Ayeyarwady Basin by changing the landuse area. In case of drought, SPI,
severity, intensity, duration, frequency and return periods for three pilot areas are calculated. Rainwater
American Scientific Research Journal for Engineering, Technology, and Sciences (ASRJETS) (2018) Volume 45, No 1, pp 280-298
286
harvesting is the best way to mitigate the drought problem.
Figure 4: average monthly rainfall for Aunglan, Magway and Nyaungoo
(i) (ii) (iii)
Figure 5: landuse map for (i) Aunglan (ii) Magway and (iii) Nyaungoo
American Scientific Research Journal for Engineering, Technology, and Sciences (ASRJETS) (2018) Volume 45, No 1, pp 280-298
287
Figure 6: Soil map for (i) Aunglan, (ii) Magway and (iii) Nyaungoo
Table 1: landuse classification area of the Aunglan, Magway and Nyaungoo regions
City Residential
(km2)
Trees
(km2)
Lawns and
Agriculture
(km2)
Water
Body
(km2)
Road
(km2)
Bareland
(km2)
Total
(km2)
Aunglan 464.416 528.582 937.701 231.594 427.845 259.496 2849.634
Magway 218.807 24.566 687.695 155.035 163.308 638.715 1888.126
Nyaungoo 151.302 32.976 605.939 110.309 175.296 495.528 1571.349
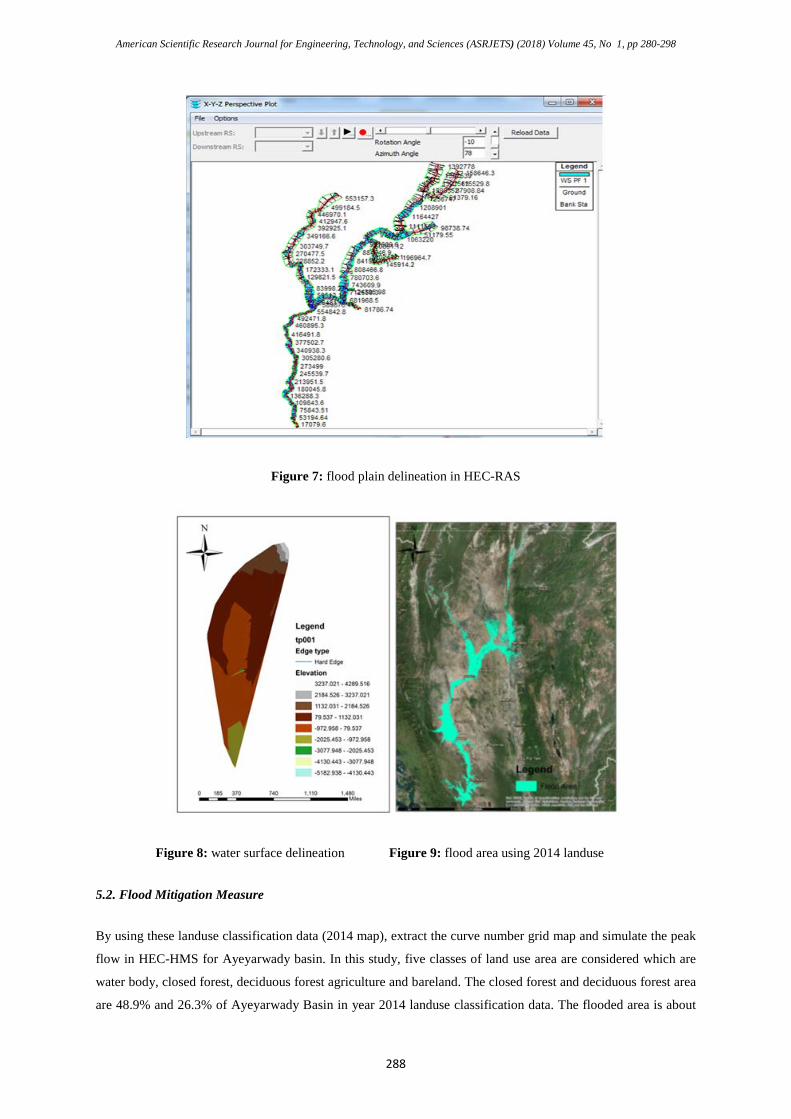
5.1. HEC-RAS Results
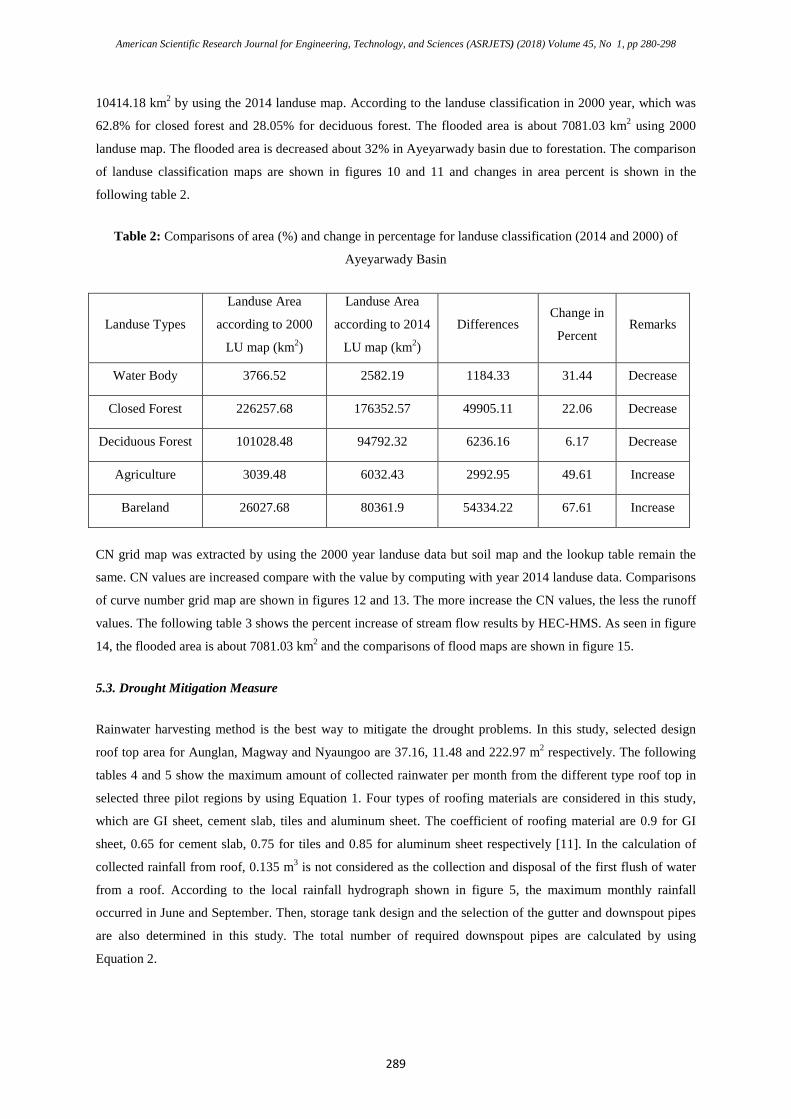
Flood map for Ayeyarwady basin is developed by using Arc-GIS. Firstly, flood plain delineation process is done
in HEC-RAS modeling which is the input file to develop the flood map. The flood plain delineation of the
Ayeyarwady Basin is shown in figure 8. The flood plain results in HEC-RAS as in a form of XYZ perseptive
plot and then, water surface is delineated using the Arc-GIS. After the delineating process, flood map for the
Ayeyarwady basin is developed. Flood palin delineation, water surface delineation and flood map of the
Ayeyarwady basin is shown in figures 7, 8 and 9.
American Scientific Research Journal for Engineering, Technology, and Sciences (ASRJETS) (2018) Volume 45, No 1, pp 280-298
288
Figure 7: flood plain delineation in HEC-RAS
Figure 8: water surface delineation Figure 9: flood area using 2014 landuse
5.2. Flood Mitigation Measure
By using these landuse classification data (2014 map), extract the curve number grid map and simulate the peak
flow in HEC-HMS for Ayeyarwady basin. In this study, five classes of land use area are considered which are
water body, closed forest, deciduous forest agriculture and bareland. The closed forest and deciduous forest area
are 48.9% and 26.3% of Ayeyarwady Basin in year 2014 landuse classification data. The flooded area is about
American Scientific Research Journal for Engineering, Technology, and Sciences (ASRJETS) (2018) Volume 45, No 1, pp 280-298
289
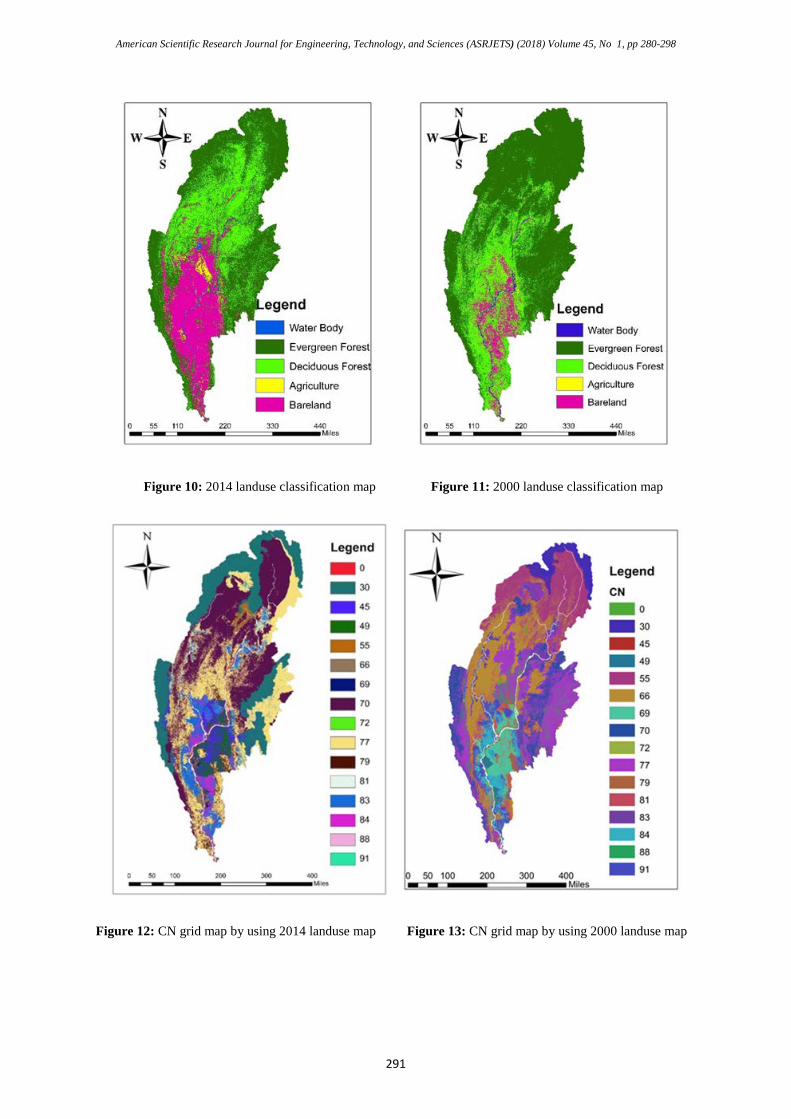
10414.18 km2 by using the 2014 landuse map. According to the landuse classification in 2000 year, which was
62.8% for closed forest and 28.05% for deciduous forest. The flooded area is about 7081.03 km2 using 2000
landuse map. The flooded area is decreased about 32% in Ayeyarwady basin due to forestation. The comparison
of landuse classification maps are shown in figures 10 and 11 and changes in area percent is shown in the
following table 2.
Table 2: Comparisons of area (%) and change in percentage for landuse classification (2014 and 2000) of
Ayeyarwady Basin
Landuse Types
Landuse Area
according to 2000
LU map (km2)
Landuse Area
according to 2014
LU map (km2)
Differences Change in
Percent Remarks
Water Body 3766.52 2582.19 1184.33 31.44 Decrease
Closed Forest 226257.68 176352.57 49905.11 22.06 Decrease
Deciduous Forest 101028.48 94792.32 6236.16 6.17 Decrease
Agriculture 3039.48 6032.43 2992.95 49.61 Increase
Bareland 26027.68 80361.9 54334.22 67.61 Increase
CN grid map was extracted by using the 2000 year landuse data but soil map and the lookup table remain the
same. CN values are increased compare with the value by computing with year 2014 landuse data. Comparisons
of curve number grid map are shown in figures 12 and 13. The more increase the CN values, the less the runoff
values. The following table 3 shows the percent increase of stream flow results by HEC-HMS. As seen in figure
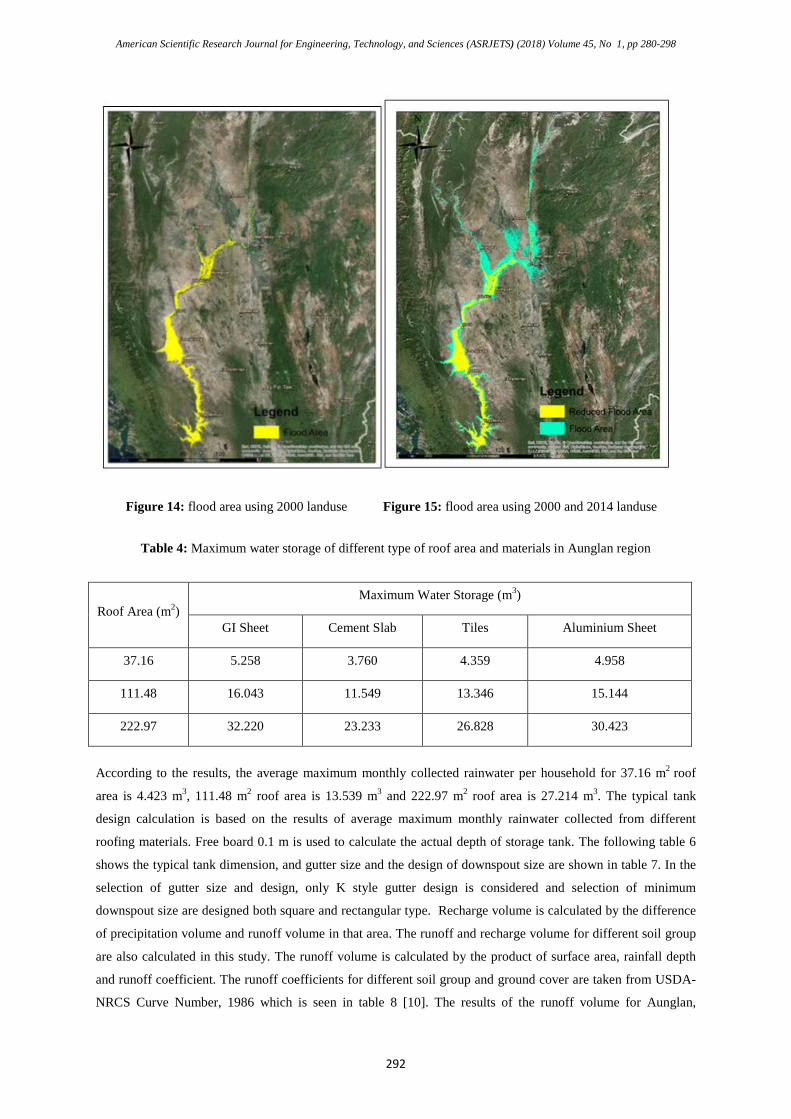
14, the flooded area is about 7081.03 km2 and the comparisons of flood maps are shown in figure 15.
5.3. Drought Mitigation Measure
Rainwater harvesting method is the best way to mitigate the drought problems. In this study, selected design
roof top area for Aunglan, Magway and Nyaungoo are 37.16, 11.48 and 222.97 m2 respectively. The following
tables 4 and 5 show the maximum amount of collected rainwater per month from the different type roof top in
selected three pilot regions by using Equation 1. Four types of roofing materials are considered in this study,
which are GI sheet, cement slab, tiles and aluminum sheet. The coefficient of roofing material are 0.9 for GI
sheet, 0.65 for cement slab, 0.75 for tiles and 0.85 for aluminum sheet respectively [11]. In the calculation of
collected rainfall from roof, 0.135 m3 is not considered as the collection and disposal of the first flush of water
from a roof. According to the local rainfall hydrograph shown in figure 5, the maximum monthly rainfall
occurred in June and September. Then, storage tank design and the selection of the gutter and downspout pipes
are also determined in this study. The total number of required downspout pipes are calculated by using
Equation 2.

American Scientific Research Journal for Engineering, Technology, and Sciences (ASRJETS) (2018) Volume 45, No 1, pp 280-298
290
Table 3: Change in percentage of stream flow Results for subbasin (SB) by HEC-HMS
Name
Peak
Flow
(CN by
2000 LU
Map)
(m3/sec)
Peak
Flow
(CN by
2014 LU
Map)
(m3/sec)
Difference
Percent
Increase
(%)
Name
Peak
Flow
(CN by
2000 LU
Map)
(m3/sec)
Peak
Flow
(CN by
2014 LU
Map)
(m3/sec)
Difference
Percent
Increase
(%)
SB-1 10550.9 11442.4 891.5 8.45 SB-26 5945.3 6663.6 718.3 12.08
SB-2 8300.9 8504.2 203.3 2.45 SB-25 5452.6 6379 926.4 16.99
SB-4 9078.1 9408.6 330.5 3.64 SB-28 4909.4 5757 847.6 17.26
SB-3 8771 8789.3 18.3 0.21 SB-27 5405.8 6341 935.2 17.30
SB-7 7605.6 7875.9 270.3 3.55 SB-30 9470.6 10655.7 1185.1 12.51
SB-6 7409.4 7733.7 324.3 4.38 SB-29 2562.4 4449.5 1887.1 73.65
SB-5 6797.2 7149.9 352.7 5.19 SB-31 2205 2396.6 191.6 8.69
SB-47 1405.2 1433 27.8 1.98 SB-32 6018.4 6990.1 971.7 16.15
SB-8 835.5 1128.5 293 35.07 SB-35 6988 6988.9 0.9 0.01
SB-9 665.7 764.7 99 14.87 SB-36 8044.8 9498.8 1454 18.07
SB-39 1064.9 1194.3 129.4 12.15 SB-33 4150.1 5158.9 1008.8 24.31
SB-40 884.1 936.7 52.6 5.95 SB-34 4238.3 4997.2 758.9 17.91
SB-42 1217.5 1355.5 138 11.33 SB-37 4049.5 4230.4 180.9 4.47
SB-41 633.2 705.5 72.3 11.42 SB-13 1617.6 1640.4 22.8 1.41
SB-45 1354.2 1653.4 299.2 22.09 SB-15 2500 2500 0 0.00
SB-44 1344.5 1691.2 346.7 25.79 SB-14 2000 2000 0 0.00
SB-43 1217.1 1604.8 387.7 31.85 SB-17 569.4 1026.3 456.9 80.24
SB-46 92.5 117.8 25.3 27.35 SB-16 639.6 702.1 62.5 9.77
SB-10 271 303 32 11.81 SB-18 640.8 779 138.2 21.57
SB-12 44.4 57.6 13.2 29.73 SB-19 361.3 503 141.7 39.22
SB-38 2373.3 3044.9 671.6 28.30 SB-20 607.8 758.3 150.5 24.76
SB-11 529.8 567.3 37.5 7.08 SB-21 719.1 850.7 131.6 18.30
SB-23 5442.5 7784.9 2342.4 43.04 SB-22 1868.2 2218.7 350.5 18.76
SB-24 4656.5 4974.6 318.1 6.83 Outlet 117435.9 124193.6 6757.7 5.75
American Scientific Research Journal for Engineering, Technology, and Sciences (ASRJETS) (2018) Volume 45, No 1, pp 280-298
291
Figure 10: 2014 landuse classification map Figure 11: 2000 landuse classification map
Figure 12: CN grid map by using 2014 landuse map Figure 13: CN grid map by using 2000 landuse map
American Scientific Research Journal for Engineering, Technology, and Sciences (ASRJETS) (2018) Volume 45, No 1, pp 280-298
292
Figure 14: flood area using 2000 landuse Figure 15: flood area using 2000 and 2014 landuse
Table 4: Maximum water storage of different type of roof area and materials in Aunglan region
Roof Area (m2) Maximum Water Storage (m3)
GI Sheet Cement Slab Tiles Aluminium Sheet
37.16 5.258 3.760 4.359 4.958
111.48 16.043 11.549 13.346 15.144
222.97 32.220 23.233 26.828 30.423
According to the results, the average maximum monthly collected rainwater per household for 37.16 m2 roof
area is 4.423 m3, 111.48 m2 roof area is 13.539 m3 and 222.97 m2 roof area is 27.214 m3. The typical tank
design calculation is based on the results of average maximum monthly rainwater collected from different
roofing materials. Free board 0.1 m is used to calculate the actual depth of storage tank. The following table 6
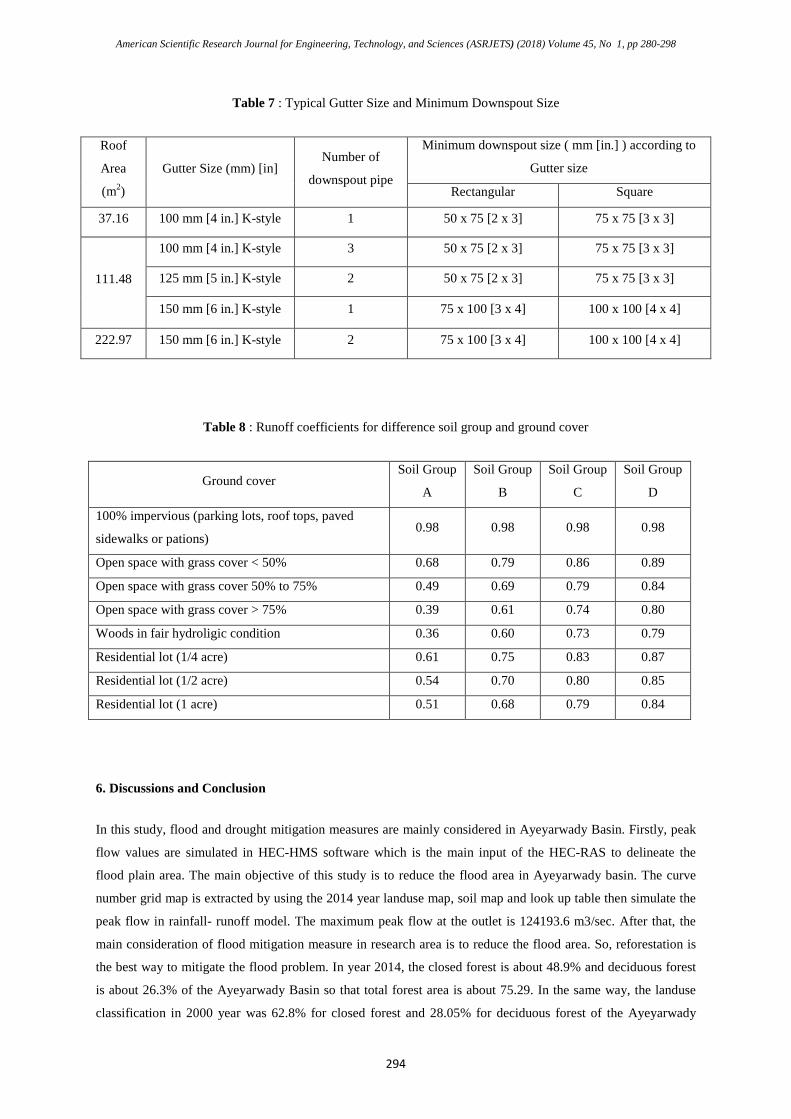
shows the typical tank dimension, and gutter size and the design of downspout size are shown in table 7. In the
selection of gutter size and design, only K style gutter design is considered and selection of minimum
downspout size are designed both square and rectangular type. Recharge volume is calculated by the difference
of precipitation volume and runoff volume in that area. The runoff and recharge volume for different soil group
are also calculated in this study. The runoff volume is calculated by the product of surface area, rainfall depth
and runoff coefficient. The runoff coefficients for different soil group and ground cover are taken from USDA-
NRCS Curve Number, 1986 which is seen in table 8 [10]. The results of the runoff volume for Aunglan,
American Scientific Research Journal for Engineering, Technology, and Sciences (ASRJETS) (2018) Volume 45, No 1, pp 280-298
293
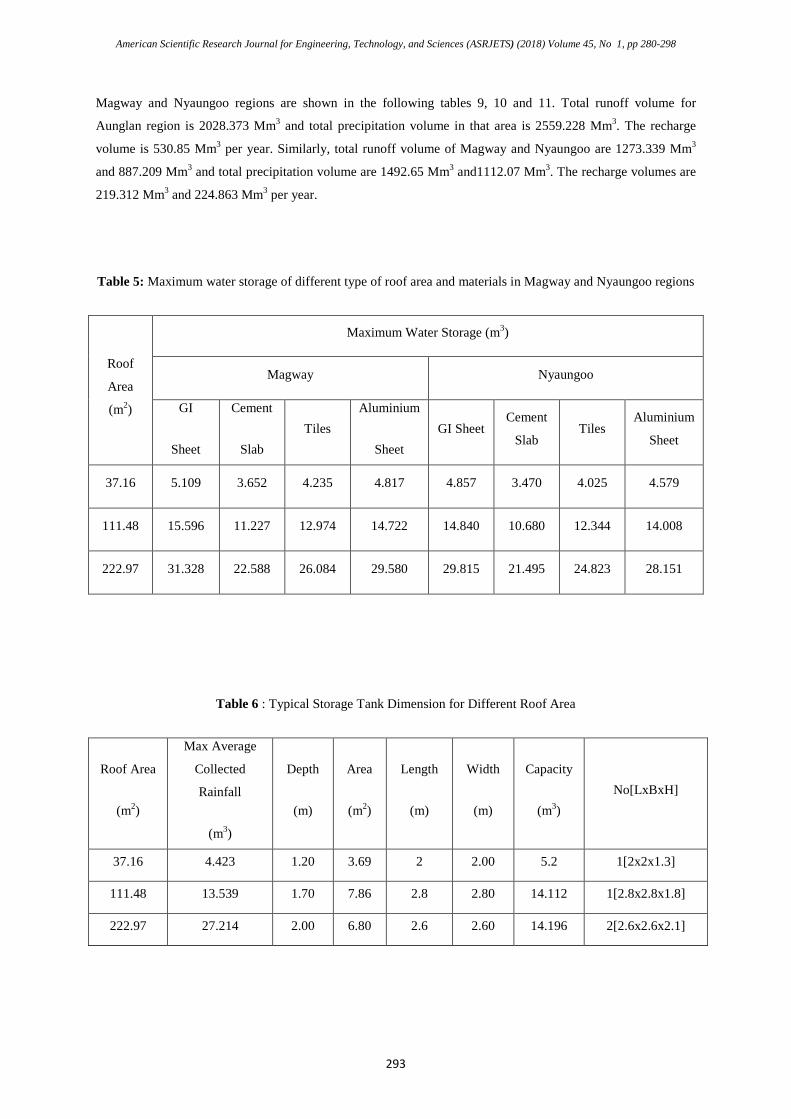
Magway and Nyaungoo regions are shown in the following tables 9, 10 and 11. Total runoff volume for
Aunglan region is 2028.373 Mm3 and total precipitation volume in that area is 2559.228 Mm3. The recharge
volume is 530.85 Mm3 per year. Similarly, total runoff volume of Magway and Nyaungoo are 1273.339 Mm3
and 887.209 Mm3 and total precipitation volume are 1492.65 Mm3 and1112.07 Mm3. The recharge volumes are
219.312 Mm3 and 224.863 Mm3 per year.
Table 5: Maximum water storage of different type of roof area and materials in Magway and Nyaungoo regions
Roof
Area
(m2)
Maximum Water Storage (m3)
Magway Nyaungoo
GI
Sheet
Cement
Slab Tiles
Aluminium
Sheet GI Sheet
Cement
Slab Tiles
Aluminium
Sheet
37.16 5.109 3.652 4.235 4.817 4.857 3.470 4.025 4.579
111.48 15.596 11.227 12.974 14.722 14.840 10.680 12.344 14.008
222.97 31.328 22.588 26.084 29.580 29.815 21.495 24.823 28.151
Table 6 : Typical Storage Tank Dimension for Different Roof Area
Roof Area
(m2)
Max Average
Collected
Rainfall
(m3)
Depth
(m)
Area
(m2)
Length
(m)
Width
(m)
Capacity
(m3) No[LxBxH]
37.16 4.423 1.20 3.69 2 2.00 5.2 1[2x2x1.3]
111.48 13.539 1.70 7.86 2.8 2.80 14.112 1[2.8x2.8x1.8]
222.97 27.214 2.00 6.80 2.6 2.60 14.196 2[2.6x2.6x2.1]
American Scientific Research Journal for Engineering, Technology, and Sciences (ASRJETS) (2018) Volume 45, No 1, pp 280-298
294
Table 7 : Typical Gutter Size and Minimum Downspout Size
Roof
Area
(m2)
Gutter Size (mm) [in] Number of
downspout pipe
Minimum downspout size ( mm [in.] ) according to
Gutter size
Rectangular Square
37.16 100 mm [4 in.] K-style 1 50 x 75 [2 x 3] 75 x 75 [3 x 3]
111.48
100 mm [4 in.] K-style 3 50 x 75 [2 x 3] 75 x 75 [3 x 3]
125 mm [5 in.] K-style 2 50 x 75 [2 x 3] 75 x 75 [3 x 3]
150 mm [6 in.] K-style 1 75 x 100 [3 x 4] 100 x 100 [4 x 4]
222.97 150 mm [6 in.] K-style 2 75 x 100 [3 x 4] 100 x 100 [4 x 4]
Table 8 : Runoff coefficients for difference soil group and ground cover
Ground cover Soil Group
A
Soil Group
B
Soil Group
C
Soil Group
D
100% impervious (parking lots, roof tops, paved
sidewalks or pations) 0.98 0.98 0.98 0.98
Open space with grass cover < 50% 0.68 0.79 0.86 0.89
Open space with grass cover 50% to 75% 0.49 0.69 0.79 0.84
Open space with grass cover > 75% 0.39 0.61 0.74 0.80
Woods in fair hydroligic condition 0.36 0.60 0.73 0.79
Residential lot (1/4 acre) 0.61 0.75 0.83 0.87
Residential lot (1/2 acre) 0.54 0.70 0.80 0.85
Residential lot (1 acre) 0.51 0.68 0.79 0.84
6. Discussions and Conclusion
In this study, flood and drought mitigation measures are mainly considered in Ayeyarwady Basin. Firstly, peak
flow values are simulated in HEC-HMS software which is the main input of the HEC-RAS to delineate the
flood plain area. The main objective of this study is to reduce the flood area in Ayeyarwady basin. The curve
number grid map is extracted by using the 2014 year landuse map, soil map and look up table then simulate the
peak flow in rainfall- runoff model. The maximum peak flow at the outlet is 124193.6 m3/sec. After that, the
main consideration of flood mitigation measure in research area is to reduce the flood area. So, reforestation is
the best way to mitigate the flood problem. In year 2014, the closed forest is about 48.9% and deciduous forest
is about 26.3% of the Ayeyarwady Basin so that total forest area is about 75.29. In the same way, the landuse
classification in 2000 year was 62.8% for closed forest and 28.05% for deciduous forest of the Ayeyarwady
American Scientific Research Journal for Engineering, Technology, and Sciences (ASRJETS) (2018) Volume 45, No 1, pp 280-298
295
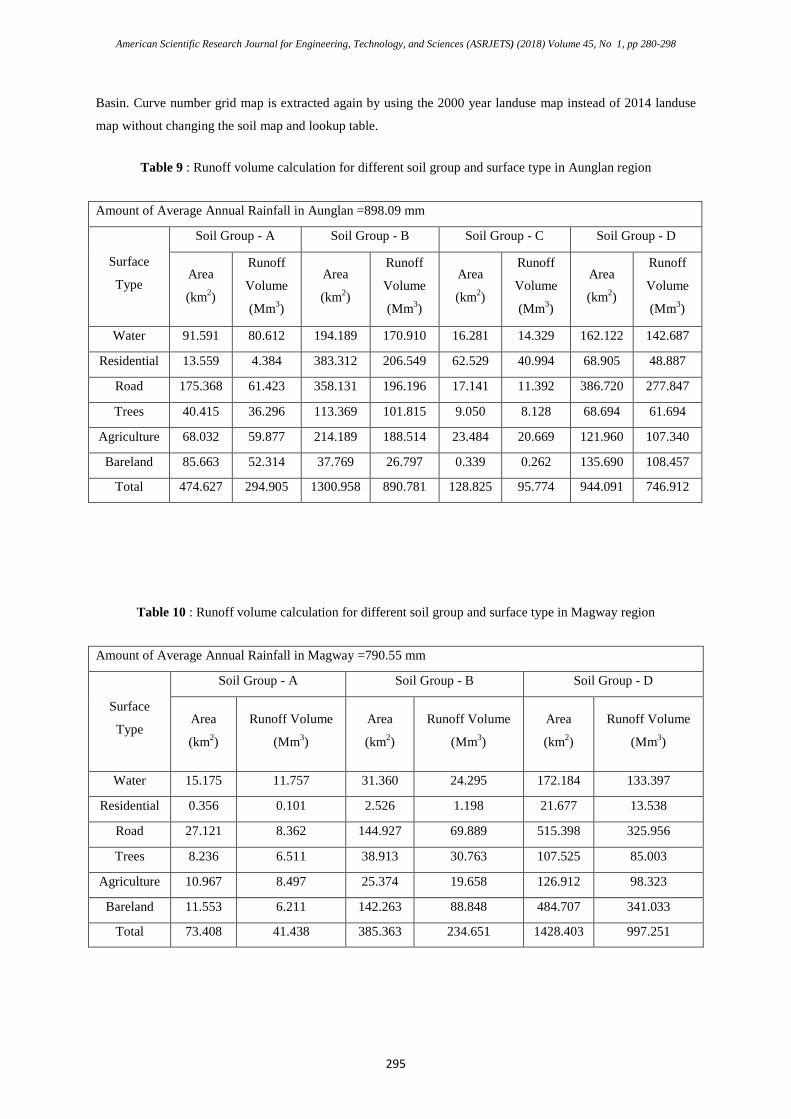
Basin. Curve number grid map is extracted again by using the 2000 year landuse map instead of 2014 landuse
map without changing the soil map and lookup table.
Table 9 : Runoff volume calculation for different soil group and surface type in Aunglan region
Amount of Average Annual Rainfall in Aunglan =898.09 mm
Surface
Type
Soil Group - A Soil Group - B Soil Group - C Soil Group - D
Area
(km2)
Runoff
Volume
(Mm3)
Area
(km2)
Runoff
Volume
(Mm3)
Area
(km2)
Runoff
Volume
(Mm3)
Area
(km2)
Runoff
Volume
(Mm3)
Water 91.591 80.612 194.189 170.910 16.281 14.329 162.122 142.687
Residential 13.559 4.384 383.312 206.549 62.529 40.994 68.905 48.887
Road 175.368 61.423 358.131 196.196 17.141 11.392 386.720 277.847
Trees 40.415 36.296 113.369 101.815 9.050 8.128 68.694 61.694
Agriculture 68.032 59.877 214.189 188.514 23.484 20.669 121.960 107.340
Bareland 85.663 52.314 37.769 26.797 0.339 0.262 135.690 108.457
Total 474.627 294.905 1300.958 890.781 128.825 95.774 944.091 746.912
Table 10 : Runoff volume calculation for different soil group and surface type in Magway region
Amount of Average Annual Rainfall in Magway =790.55 mm
Surface
Type
Soil Group - A Soil Group - B Soil Group - D
Area
(km2)
Runoff Volume
(Mm3)
Area
(km2)
Runoff Volume
(Mm3)
Area
(km2)
Runoff Volume
(Mm3)
Water 15.175 11.757 31.360 24.295 172.184 133.397
Residential 0.356 0.101 2.526 1.198 21.677 13.538
Road 27.121 8.362 144.927 69.889 515.398 325.956
Trees 8.236 6.511 38.913 30.763 107.525 85.003
Agriculture 10.967 8.497 25.374 19.658 126.912 98.323
Bareland 11.553 6.211 142.263 88.848 484.707 341.033
Total 73.408 41.438 385.363 234.651 1428.403 997.251

American Scientific Research Journal for Engineering, Technology, and Sciences (ASRJETS) (2018) Volume 45, No 1, pp 280-298
296
Table 11 : Runoff volume calculation for different soil group and surface type in Nyaungoo region
Amount of Average Annual Rainfall in Nyaungoo =707.7 mm
Surface
Type
Soil Group - A Soil Group - B Soil Group - D
Area
(km2)
Runoff Volume
(Mm3)
Area
(km2)
Runoff Volume
(Mm3)
Area
(km2)
Runoff Volume
(Mm3)
Water 10.063 6.979 77.757 53.930 63.455 44.010
Residential 5.268 1.342 10.753 4.566 16.941 9.471
Road 29.328 8.095 361.969 156.265 214.448 121.415
Trees 36.389 25.753 61.619 43.609 12.261 8.677
Agriculture 11.457 7.946 102.112 70.821 61.663 42.767
Bareland 18.971 9.130 390.553 218.357 85.853 54.076
Total 111.476 59.245 1004.764 547.548 454.619 280.416
The peak flow value at the outlet is 117435.9 m3/sec. The stream flow value is reduced about 6757.7 m3/sec.
After simulation the peak flow value for all subbasin in Ayeyarwady Basin, flood maps are developed in
hydraulic model by using the results of stream flow. The flooded regions are more evidenced in part of
Mandalay, Sagaing, Monywa, Pakokku, Magway, Yaynanchaung and Thayet. The forest area in year 2000 is
more than the area in year 2014. After passing more than a decade, the forest are depleted 22.1% for evergreen
forest and 6.2 % for deciduous forest. Due to deforestation, the bareland area and agriculture area are wider
about 68% and 49.6 % in Ayeyarwady Basin. According to the results, the flood area developed by using 2014
landuse is about 10414.18 km2 and by using 2000 landuse is about 7081.03 km2. The flood area about 3333.15
km2 (32%) can be reduced by reforestation as the year 2000. Drought mitigation is also considered in this study
and drought severity map is firstly extracted by using Arc-GIS. According to the drought severity map, the
region of Aunglan, Magway and Nyaungoo have the high severity value than those of other regions as seen in
figure 2. The regional area of Aunglan, Magway and Nyaungoo are 2849.634, 1888.126 and 1571.349 km2
respectively. In this study, two methods of rainwater harvesting are considered. The first way is collected
rainwater from the roof top and the second method is the rainwater recharged directly to the ground. The design
roof area for three pilot area as 37.16, 111.48 and 222.97 m2 and four type of roofing materials are considered.
The average maximum collected rainwater per household for 37.16 m2 roof area is 4.423 m3, 111.48 m2 roof
area is 13.539 m3 and 222.97 m2 roof area is 27.214 m3 respectively. Again, the rainwater is recharged from
pervious area and runoff volume are determined according to the soil group in selected regions. The soil groups
in Aunglan region are group A, B, C and D, Nyaungoo and Magway regions have soil group of A, B and D. The
calculated runoff volume in Aunglan region is 294.905 Mm3/year in soil group A, 890.781 Mm3/year in soil
group B, 95.774 Mm3/year in soil group C and 746.912 Mm3/year in soil group D respectively. Total runoff
volume for Aunglan area is 2028.373 Mm3/year and total precipitation volume in that area is 2559.228
Mm3/year. So, the recharge volume in Aunglan is 530.85 Mm3/year. Similarly, total runoff volume of Magway
American Scientific Research Journal for Engineering, Technology, and Sciences (ASRJETS) (2018) Volume 45, No 1, pp 280-298
297
region is 41.438 Mm3/year in soil group A, 234.651Mm3/year in soil group B and 997.251Mm3/year in soil
group D. Same as the runoff volume in Nyaungoo region is 59.245 Mm3/year in soil group A, 547.548
Mm3/year in soil group B and 280.416 Mm3/year in soil group D. So, the total runoff volume in Magway and
Nyaungoo are 12173.339 Mm3/year and 887.207 Mm3/year. The precipitation volumes are 1492.65 Mm3/year in
Magway region and 1112.07 Mm3/year separately. After that the recharge volume in Magway region is 219.312
Mm3/year and 224.836 in Nyaungoo region respectively. As a conclusion, reforestation is considered for flood
mitigation measure and rainwater harvesting method is considered for drought mitigation measure. This study
will help to reduce the flood area and drought mitigation as rainwater harvesting for Ayeyarwady Basin.
Acknowledgement
First of all, the author wishes to express special thanks to his parents for their kind support and encouragement.
The author owes a debt of gratitude to Daw Aye Aye Thant, Lecturer of Department of Civil Engineering,
Mandalay Technological University, for her true-line guidance and precious co-supervision. The author would
like to express his heartfelt gratitude to Dr. Kyaw Zayar Htun, Lecturer, Remote Sensing Department, Yangon
Technological University and all teachers for their supports, valuable suggestions and discussions.
References
[1]. US Army Corps of Engineer, Hydrologic Engineering Center, “HEC-GeoRAS, GIS Tools for Support
of HEC-RAS using ArcGIS”, User’s Manual, Version 4.2, September 2009.
[2]. US Army Corps of Engineer, Hydrologic Engineering Center, “HEC-RAS, River Analysis System, 2D
Modeling Use’s Manual”, User’s Manual, Version 5.0, February 2016.
[3]. Matthew J. Fleming, James H. Doan, “HEC-GeoHMS Geospatial Hydrologic Modeling Extension
User's Manual”, Version 10.1, US Army Corps of Engineers, Institute for Water Resources Hydrologic
Engineering Center, February, (2013).
[4]. Jeongwoo Han, “Streamflow Analysis Using ArcGIS and HEC GeoHMS”, Texas A&M University,
Zachry Department of Civil Engineering, December, (2010).
[5]. Dimitris Tigkas, Harris Vangelis and George Tsakiris, DrinC: a software for drought analysis based on
drought indices, Laboratory of Reclamation Works and Water Resources Management.
[6]. Moumita Palchaudhuri, Sujata Biswas, “Analysis of Meteorological Drought Using Standardized
Precipitation Index”, International Journal of Environmental, Chemical, Ecological, Geological and
Geophysical Engineering Vol:7, No:3, 2013.
[7]. Jaber Almedeij, “Drought Analysis for Kuwait Using Standardized Precipitation Index”; Hindawi
Publishing Corporation,The Scientific World Journal, Volume 2014, Article ID 451841.
[8]. T. B. McKee, N. J. Doesken, and J. Kleist, “Drought monitoring with multiple time scales,” in
Proceedings of the 9th AMS Conference on Applied Climatology, American Meteorological Society, Boston,
Mass, USA, January 1995.
[9]. Win Naing Tun, M.A, M.Res(Archaeology), “ Climate Change in Myanmar and Central Dry Zone”,
International Conferences on Climate Change and Water& Environment Management in Monsoon Asia, THA
2015.
American Scientific Research Journal for Engineering, Technology, and Sciences (ASRJETS) (2018) Volume 45, No 1, pp 280-298
298
[10]. River Link Initiative, “Calculating of Strom Water Runoff” [on-line], www.riverlink.org, [On-Line]
[11]. A.K. Gupta, Professor, IRICEN-Pune, “Rainwater Harvesting”, Indian Railways Institute of Civil
Engineering Pune-411001, August 2016.
[12]. Desalegn Chemeda Edossa, Mukand Singh Babel and Ashim Das Gupta, “Drought Analysis in the
Awash River Basin, Ethiopia”, 10 September 2009.
[13]. Khin Thandar Win, Nilar Aye and Kyaw Zayar Htun, “Vulnerability of Flood Hazard in Selected
Ayeyarwdy Delta Region, Myanmar”, International Journal of Science and Engineering Application, Volume 3,
Issue 3, ISSN-2319-7560 [On-Line].
[14]. “Calculating the Amount of Rainwater Capturable from Your Roof”,
www.nationalpolyindustries.com.au, [On-Line].
[15]. Puskar Pande, and Shailesh Telang, “Calculation of Rainwater Harvesting Potential by Using Mean
Annual Rainfall, Surface Runoff and Catchment Area”, Green Clean Guide, India, Global Advanced Research
Journal of Agricultural Science (ISSN: 2315-5094) Vol. 3(7) pp. 200-204, July, 2014.
[16]. Country Report Myanmar, “Natural Disaster Risk Assessment and Area Business Continuity Plan
Formulation for Industrial Agglomerated Areas in the ASEAN Region”, AHA CENTR Japan International
Cooperation Agency, March, 2015.