Embed Size (px)
Citation preview
Mobile call termination: the relationship between mobile
termination rates, market share and competition
Supplemental consultation
Publication date: 29 November 2010
Closing Date for Responses: 4 January 2010

Mobile Call Termination
Contents
Section Page
1 The relationship between mobile termination rates, market share and competition 1
Annex Page
1 Responding to this consultation 14
2 Ofcom’s consultation principles 16
3 Consultation response cover sheet 17
4 Description of Ofcom’s spreadsheet model 19
Mobile Call Termination
1
Section 1
1 The relationship between mobile termination rates, market share and competition Introduction
1.1 This consultation supplements our consultation published on 1 April 2010 (the ‘April 2010 consultation’)1 as part of our review of the markets in which mobile call termination (MCT) on individual mobile networks is supplied in the UK.2
1.2 In the April 2010 consultation, we defined markets for MCT on individual mobile networks and proposed rules addressing the significant market power of mobile communications providers (MCPs) supplying MCT. Those proposed rules included:
1.2.1 On the four national MCPs, a charge control on MCT. We proposed that the charge control should require mobile termination rates (MTRs) to fall to the long-run incremental cost of providing MCT to third parties (i.e. pure LRIC); and
1.2.2 On other MCPs, a requirement to provide MCT on fair and reasonable terms.
1.3 In proposing to adopt pure LRIC, we considered what outcomes were likely to be best overall for consumers. In making any final decision, we will also take utmost account of the European Commission Recommendation on the Regulatory Treatment of Fixed and Mobile Termination Rates in the EU (the EC Recommendation).3
1.4 In assessing whether to adopt pure LRIC, we considered four factors:
1.4.1 economic efficiency;
1.4.2 effect on competition;
1.4.3 distributional effects on consumers; and
1.4.4 commercial and regulatory consequences.
1.5 We conducted a consultation on our proposals, and our assessment of these four factors. We also obtained relevant data from communications providers. This supplemental consultation asks an additional question to assist us in our consideration of the competitive impact (1.4.2) of our proposals.
1 http://stakeholders.ofcom.org.uk/consultations/wmctr/ 2 When fixed and mobile providers offer their customers the ability to call UK mobile numbers, they pay mobile communications providers a wholesale charge to complete those calls. The rates that providers pay are called ‘mobile call termination’ (MCT) charges or more commonly ‘mobile termination rates’ (MTRs). 3 Recommendation of 7 May 2009 on the Regulatory Treatment of Fixed and Mobile Termination Rates in the EU (2009/396/EC)

Mobile Call Termination
2
1.6 In the April 2010 consultation we considered the effects of different approaches to setting MTRs on competition between fixed communications providers (FCPs) and MCPs, and competition among MCPs. That analysis4 focussed primarily on the effects of differences in price between on-net and off-net calls. In light of responses to that consultation, we consider that there are other aspects of the interaction between the regulation of MTRs and competition between MCPs that merit further examination.
1.7 In particular, we are interested in understanding what weight, if any, we should place on the potential for MTRs to affect competition between MCPs with an asymmetric market share of subscribers (that is, between large and small MCPs).
1.8 The relationship between MTRs and asymmetric market shares was identified by the Commission, among other factors, in support of its recommendation for pure LRIC. In the recital to its Recommendation, it stated that “Termination markets represent a situation of two-way access where both interconnecting operators are presumed to benefit from the arrangement but, as these operators are also in competition with each other for subscribers, termination rates can have important strategic and competitive implications. […] In addition, in markets where operators have asymmetric market shares, this can result in significant payments from smaller to larger competitors.”5 The Explanatory Note to the Recommendation, also explained that“[a]bove-cost termination rates can give rise to competitive distortions between operators with asymmetric market shares and traffic flows. Termination rates that are set above an efficient level of cost result in higher off-net wholesale and retail prices. As smaller networks typically have a large proportion of off-net calls, this leads to significant payments to their larger competitors and hampers their ability to compete with on-net/off-net retail offers of larger incumbents. This can reinforce the network effects of larger networks and increase barriers to smaller operators entering and expanding within markets.”6
Responses to our consultations
1.9 In response to our preliminary consultation on MCT in May 2009,7 H3Gargued that “relatively high” MTRs create a strategic incentive for incumbent MCPs to use retail price discrimination between on-net and off-net calls to create a competitive advantage which smaller, later entrants are unable to replicate (or, at a minimum, find it costly to replicate).8 The Federation of Communication Services (FCS) also argued that we should address what it saw as the disadvantages of high MTRs to new entrants.9 The FCS argued that, in order to get market share in a saturated market, entrants have to be able to offer very competitive pricing - not just for on-net calls (as they have yet to establish a big enough community), but also off-net calls.
4 See paragraphs 7.122 – 7.123, and paragraphs A12.88 to 12.100 in our April 2010 consultation. 5 See recital (3) to the Recommendation. 6 See page 16 of the Commission Staff Working Document accompanying the Commission Recommendation on the Regulatory Treatment of Fixed and Mobile Termination Rates in the EU, Explanatory Note, 7 May 2009, SEC (2009) 600. 7 http://stakeholders.ofcom.org.uk/consultations/mobilecallterm/ 8 H3G characterised “relatively high” as meaning, in its view “MTRs … set at a level which recovers significant proportions of common costs (for example, the approach used in the current charge control period) and are considered to be relatively low when set at “pure” incremental or marginal cost levels”. See section 1.1 and footnote 3 of the H3G response (available at: http://stakeholders.ofcom.org.uk/binaries/consultations/mobilecallterm/responses/Hutchison_3G_UK_Limited.pdf). 9 http://stakeholders.ofcom.org.uk/binaries/consultations/mobilecallterm/responses/FCS.pdf
Mobile Call Termination
3
1.10 In our April 2010 consultation, we responded to these points, noting the submission from H3G indicated that given the need to offer competitive pricing for calls to win new subscribers, new entrants’ initial customer base may have a higher propensity to make outbound off-net calls to other mobiles, than to receive calls from those networks.10 H3G’s response to our preliminary consultation suggested that later entrant operators will have a traffic imbalance between incoming and outgoing calls with the incumbent operators, which means that the higher the MTRs, the greater the financial outflow from small to large operators. MTRs (they submit) can therefore be seen as a barrier to entry and growth in mobile markets, creating competitive distortions.11
1.11 Responding to the April 2010 consultation, H3G submitted that “Ofcom’s current LRIC+ approach to setting MTRs distorts competition and is unnecessary. All customer tariffs must take into account the likely cost to a mobile network operator (MNO) of serving a customer. For MNOs, the largest variable cost of serving a customer is the cost of outbound calls to other networks (“off-net” calls)… Moreover, the current system imposes a disproportionate cost on new entrants and smaller MNOs. This is because the cost of outbound calls for smaller MNOs is magnified by the larger proportion of smaller MNOs’ off-net calls. This is an inevitable consequence of smaller MNOs’ smaller market share, nothing else, as a greater proportion of its subscribers’ calls are always likely to be terminated off-net than for a larger MNO.”12
1.12 H3G’s submission states that MTRs above pure LRIC create a tilted playing-field between MCPs with different market shares. H3G argues that this asymmetry arises because MTRs above pure LRIC drive a wedge between the cost of on-net and off-net calls. (Pure LRIC, by definition, reflects the incremental cost of the terminating leg of an on-net call; the MTR is the incremental cost to the originating provider for termination of an off-net call). If the perceived incremental costs of on-net and off-net calls are different, then the competitive position of providers will be affected by the split of their calls that are on- or off-net. Put another way, if MTRs are above pure LRIC, then as the proportion of calls that go off-net made by a subscriber increases, the retail profitability of that subscriber falls, all else being equal.13
1.13 According to the argument, this difference in profitability could force some MCPs to focus on a limited set of subscribers. The effect is to make it harder for smaller providers to expand their share of certain groups of subscribers, thereby reducing the
10 H3G argues that traffic between the four largest mobile operators (O2, Orange, T-Mobile and Vodafone) is largely balanced. H3G argues that it suffers from a net deficit because it is a relatively new entrant. O2 argues that the traffic patterns ought not be considered exogenous given that operators can have control of such variables not only by acting on MTRs but also by attracting customers with particular call profiles. 11 Para 5.8 of the April 2010 consultation. 12 http://stakeholders.ofcom.org.uk/binaries/consultations/mobile_call_term/responses/h3g.pdf paragraph 6 - 8 13 This assumes MCPs can only partially mitigate this effect by focussing marketing efforts on calling circles and other retail initiatives to increase their on-net traffic. H3G argues that the market evidence (such as its lack of success in pursuing this sort of strategy to reduce MTR-driven out payments) undermines the view that these barriers can be overcome. Data submitted to us by H3G also show that its share of subscribers across different consumer segments differ significantly with a pattern that is consistent with its arguments. Annex B in H3G’s submission also discusses some of the recent economic literature on this issue including a recent paper by Lopez and Rey (Lopez, Angel and Patrick Rey (2009), “Foreclosing Competition through Access Charges and Price Discrimination”, IDEI Working Paper 570 available at http://papers.ssrn.com/sol3/papers.cfm?abstract_id=1440157).
Mobile Call Termination
4
choices open to consumers – particularly for those groups of consumers where this effect is most pronounced.
1.14 H3G further submits that this effect has increased in importance since the 2007 market review as the market has moved away from relatively balanced shares of subscribers into a more asymmetric market structure following the merger of Orange and T-Mobile.
1.15 In its response to the April 2010 consultation, O2 submitted that “[t]he claim that high termination rates are necessarily bad for new or smaller entrants is not borne out by the evidence. While it is true that smaller and/or newer mobile communication providers tend to display a proportionately higher off net call profile, what is relevant is the relative volume of inbound and outbound traffic. Some mobile communication providers adopt a commercial policy of selling high value retail tariffs with a large number of inclusive cross net minutes. Customers attracted to these tariffs tend to make proportionately more calls (and, therefore more cross net calls) than they receive. Therefore, these mobile communication providers can expect to send more traffic to other mobile communication providers than they receive, and be net payers of mobile termination rates. Conversely, other small mobile communication providers concentrate on lower spending customers who receive proportionately more calls than they make. These providers would, other things being equal, expect to be net receivers of mobile termination payments.”
1.16 O2 also noted that “[c]rucially, Ofcom needs to consider that on-/off-net discrimination is essentially a matter of economies of scale and network effects and, as such, is normal in competitive markets. The absence of any evidence that Orange or T-Mobile, which entered the market at a later stage, have been constrained in their ability to compete would mean that on-/off-net differentials are not a strong reason to justify changing the regulatory system. In this respect, Ofcom’s current thinking appears to be inconsistent with its previous approach. As an example, during the previous CC investigation, the CC noted: “As to H3G’s second argument (that its traffic imbalance was caused by being a new entrant in a saturated market and the commercial strategy it had to adopt), Ofcom characterized H3G’s case as a plea for entry assistance. Ofcom did not consider that using MCT rates to provide entry assistance was an appropriate policy.”14
1.17 In light of the responses to date, we are consulting further on this issue and on the further analysis and data we have gathered. This may be a relevant factor in relation in evaluating the options of setting MTRs at LRIC+ or pure LRIC.
What is the relationship between MTRs, market share and competition?
Competitive effects: Impacts on different market segments – the theory
1.18 The submission by H3G is that providers with fewer subscribers will find it harder to compete for higher-revenue (typically post-pay) customers when the MTR is above incremental cost.15First we explain our understanding of the theory that underpins this competition effect, then we consider whether this effect is borne out by the available evidence.
14 Paragraph 134 and 140 of O2’s submission http://stakeholders.ofcom.org.uk/binaries/consultations/wmctr/responses/O2.pdf 15 See for example Annex B of H3G’s submission.
Mobile Call Termination
5
1.19 A preliminary point is that the argument hinges on MCPs responding to differences in the perceived marginal cost of providing on-net and off-net calls:16
1.19.1 For off-net calls, the marginal cost of termination is the MTR set by rival networks.
1.19.2 For on-net calls, the marginal cost is assumed to be equal to the incremental cost of termination. This assumption has been made in the submissions received and we have adopted the same assumption in the analysis set out in this supplemental consultation.
1.20 The central question is: does a difference between the MTR (that is, the marginal cost of off-net calls) and pure LRIC (the marginal cost of on-net calls) affect the profitability of consumer segments with different calling patterns (specifically, different ratios of calls made to calls received) for MCPs with different shares of subscribers?
1.21 If calls between networks are in proportion to their share of subscribers, for smaller MCPs (that is, MCPs with fewer subscribers), a greater proportion of out-bound calls will be passed to another MCP (terminate off-net) than for a larger MCP with more subscribers.17
1.22 This implies that all else equal a smaller MCP will incur greater out-payments compared to a MCP with a larger subscriber share (for whom more of this traffic remains on-net).
1.23 If traffic flows were balanced, these additional outpayments would be off-set against the equally high proportion of calls to the smaller MCP’s subscribers that originate on another network.
1.24 For customers who make more calls than they receive, this off-setting effect is incomplete, leading to a net out-flow in MTR payments. As a result of this cost (not faced to the same extent by larger rivals) smaller MCPs are disadvantaged when competing for those customers (other things equal).
1.25 Therefore, the argument runs, offering a service to consumers with a high outbound/inbound ratio is less attractive for MCPs with fewer subscribers.
1.26 A corollary of this argument (discussed to a lesser degree in H3G’s submission) is that, if subscribers who generate less revenue in general receive proportionately more calls than they make (i.e. have lower outbound/inbound calling ratios), this effect operates in reverse. This would lead to higher net in-payments if the MCP has a smaller subscriber share. As a result, a MCP with fewer subscribers could earn more profit per subscriber in the low-end of the market than larger rivals.
1.27 This means that MCPs with fewer subscribers will have less incentive to attract consumers with high outbound/inbound calling ratios – generally high-volume users and high average revenue per user (ARPU) consumers – as they are less profitable to them (than for operators with relatively high market shares).
16 The reasoning here assumes that MCPs behave in a way consistent with standard economic theory by making profit maximising decisions – which requires optimisation on the basis of marginal costs. In the context of telecoms networks costing, incremental cost is typically taken as the marginal cost standard (or proxy there for). 17 Note that an MCP in this context means an MCP which operates its own access network; MVNOs might have different commercial agreements with the host network that may, or may not, expose them to the incentives described in this section.
Mobile Call Termination
6
1.28 In addition, MCPs with a large share of subscribers will have a reduced incentive to attract consumers with low outbound/inbound calling ratios – generally low users and lower ARPU consumers.
1.29 This implies a reduction in competitive pressure between MCPs for consumer types with imbalanced calling patterns. This impact on competition remains (in theory) while there is a difference between the MTR and the pure LRIC of completing mobile-to-mobile calls.
1.30 It is not clear that these two effects are similar in their impact. For example, it may be the case that:
1.30.1 on a per subscriber basis, the disadvantage for a small MCP in competing for a high usage subscriber may be sufficiently large as to affect the marketing and sales incentives used to attract such subscribers (compared to large rivals);
1.30.2 the advantage (in the low-end of the market) for small MCPs may be too small to actually make a significant difference in its ability to market to and induce such subscribers to switch to it.
1.31 To explore these effects further we have built a spreadsheet model of competition (described below) calibrated to publicly available market data and based on modelling assumptions where publicly available information was not available. We requested detailed data from the 8 largest providers to help analyse this issue.18 We then used this data to establish whether the results implied by our spreadsheet model were likely to reflect events in the real market. This spreadsheet model is being published as part of this supplemental consultation.
1.32 As with any modelling exercise, our spreadsheet is a simplified representation of actual competition. Many other variables will affect competition among MCPs and we recognise that behaviour and market outcomes will not be driven solely by the asymmetric market share effects considered in this consultation. Specifically, in considering the results obtained from the stylised model, calibrated using market data gathered from the 8 largest MCPs, we are mindful that:
1.32.1 MCPs may be able to counter the impact of attracting consumers with calling ratios that are out of balance in a number of ways, and we expect that these strategies would reduce the observed variation in the outbound/inbound ratio; and
1.32.2 MCPs may accept lower contribution margins (at least temporarily) to ensure their offers are competitive at the retail level.
Spreadsheet modelling of the asymmetric market share effects
1.33 The spreadsheet model considers how profit per subscriber may vary for different customer segments for MCPs with different market shares.
1.34 We have segmented the market into three illustrative19 groups:
18 Vodafone; O2; Everything Everywhere; H3G; Virgin Mobile; Tesco Mobile; Asda Mobile; Lycamobile 19 These average consumer profiles were chosen in part because they are widely understood in the industry.
Mobile Call Termination
7
1.34.1 PAYG (who receive more calls than they make);
1.34.2 low-spending post-pay customers (with a balanced traffic profile); and
1.34.3 high-spending post-pay customers who make many more calls than they receive.
1.35 The spreadsheet model calculates a notional profit (the “contribution margin”)per subscriber for each segment arising from mobile-to-mobile (MTM) calls.20 The spreadsheet model enables the contribution margin to be calculated as the ratio and volume of inbound and outbound calls varies, and therefore isolates this effect from other market factors.
1.36 The version of the model accompanying this consultation is calibrated on the number of subscribers and the average inbound and outbound (MTM) monthly minutes by segment based on data in our 2010 Communications Market Review21 and using specific price and cost assumptions.22 We repeated the calculation of the contribution margin for different consumer segments for different MCP market shares (assuming that market share determines the proportion of on-net and off-net calls).
1.37 The results of this spreadsheet modelling are set out below under two scenarios: current MTRs (Table 1) and under MTRs reduced to the estimates published in the April 2010 consultation for LRIC+ in 2014/15 (Table 2).23
20 We refer to a “contribution margin” rather than profit per subscriber as the latter would need to account for a number of other potential costs, such as costs from other non-modelled services and retail overheads, and revenues from other services. The contribution margin modelled shows the difference between:
the assumed wholesale costs (either an operator’s own incremental network costs of origination and termination) or payments to other operators in the form of MTRs; and
call revenues, which include wholesale payments from other operators for inbound off-net calls and any margin on outbound calls based on an assumed average retail price per outbound call.
21 Base case outbound call assumptions (minutes per subscriber per month) were as follows: PAYG : 38 minutes (Source : CMR 2010); Contract customers: 147 minutes (Source : CMR 2010), of which:
o “Low end” contract customers - 100 minutes per month (model assumption). o “High end” contract customers – 288 minutes per month (model assumption).
Base case inbound calls (minutes per subscriber per month) were based on our assumed outbound: inbound call ratio for each cohort:
PAYG : 0:5 to 1, (i.e. 71 inbound minutes) PAYM “low-end” (balanced): 1:1 (i.e. 100 inbound minutes). PAYM “high-end”: 2.9 to 1 (i.e. 100 inbound minutes).
22 See notes to Tables 1 and 2 for a summary of our assumptions. A further explanation of these assumptions is provided in Annex 5. 23 We have not presented the scenario of MTRs being set to pure LRIC, since if MTRs were set at pure LRIC these effects would disappear as the cost of an outbound call would be the same both for on- and off-net calls.
Mobile Call Termination
8
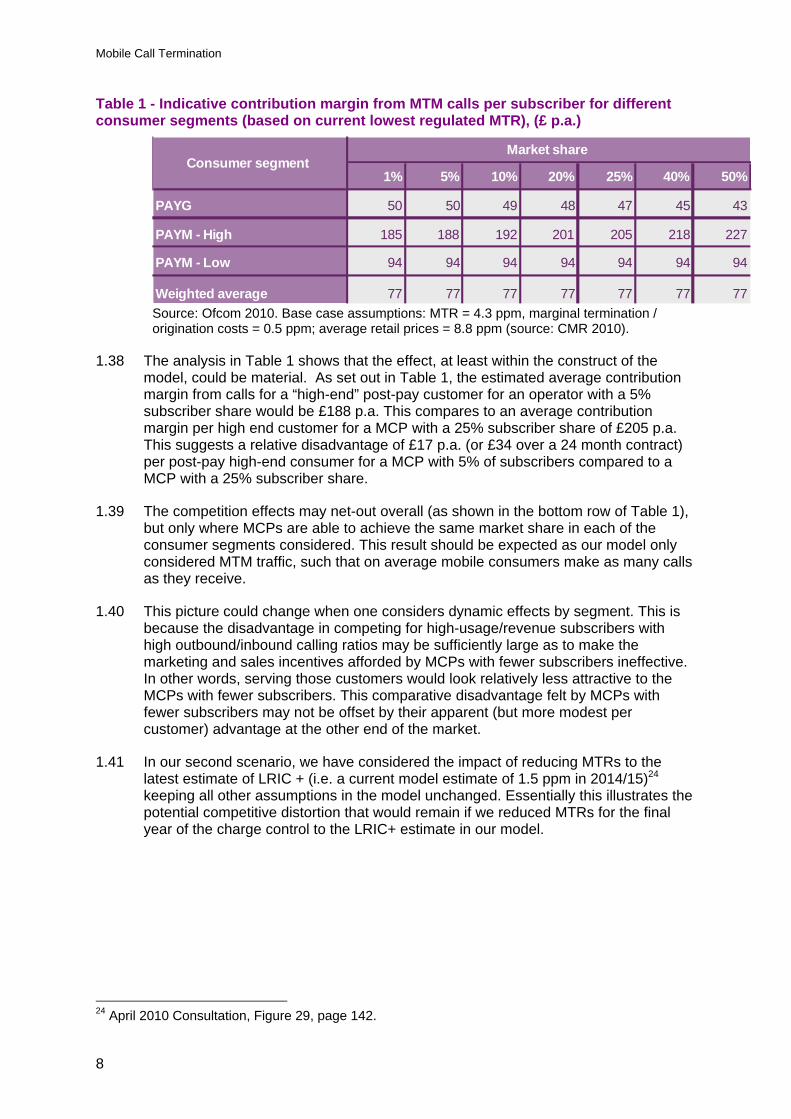
Table 1 - Indicative contribution margin from MTM calls per subscriber for different consumer segments (based on current lowest regulated MTR), (£ p.a.)
1% 5% 10% 20% 25% 40% 50%
PAYG 50 50 49 48 47 45 43
PAYM - High 185 188 192 201 205 218 227
PAYM - Low 94 94 94 94 94 94 94
Weighted average 77 77 77 77 77 77 77
Market shareConsumer segment
Source: Ofcom 2010. Base case assumptions: MTR = 4.3 ppm, marginal termination / origination costs = 0.5 ppm; average retail prices = 8.8 ppm (source: CMR 2010).
1.38 The analysis in Table 1 shows that the effect, at least within the construct of the model, could be material. As set out in Table 1, the estimated average contribution margin from calls for a “high-end” post-pay customer for an operator with a 5% subscriber share would be £188 p.a. This compares to an average contribution margin per high end customer for a MCP with a 25% subscriber share of £205 p.a. This suggests a relative disadvantage of £17 p.a. (or £34 over a 24 month contract) per post-pay high-end consumer for a MCP with 5% of subscribers compared to a MCP with a 25% subscriber share.
1.39 The competition effects may net-out overall (as shown in the bottom row of Table 1), but only where MCPs are able to achieve the same market share in each of the consumer segments considered. This result should be expected as our model only considered MTM traffic, such that on average mobile consumers make as many calls as they receive.
1.40 This picture could change when one considers dynamic effects by segment. This is because the disadvantage in competing for high-usage/revenue subscribers with high outbound/inbound calling ratios may be sufficiently large as to make the marketing and sales incentives afforded by MCPs with fewer subscribers ineffective. In other words, serving those customers would look relatively less attractive to the MCPs with fewer subscribers. This comparative disadvantage felt by MCPs with fewer subscribers may not be offset by their apparent (but more modest per customer) advantage at the other end of the market.
1.41 In our second scenario, we have considered the impact of reducing MTRs to the latest estimate of LRIC + (i.e. a current model estimate of 1.5 ppm in 2014/15)24 keeping all other assumptions in the model unchanged. Essentially this illustrates the potential competitive distortion that would remain if we reduced MTRs for the final year of the charge control to the LRIC+ estimate in our model.
24 April 2010 Consultation, Figure 29, page 142.
Mobile Call Termination
9
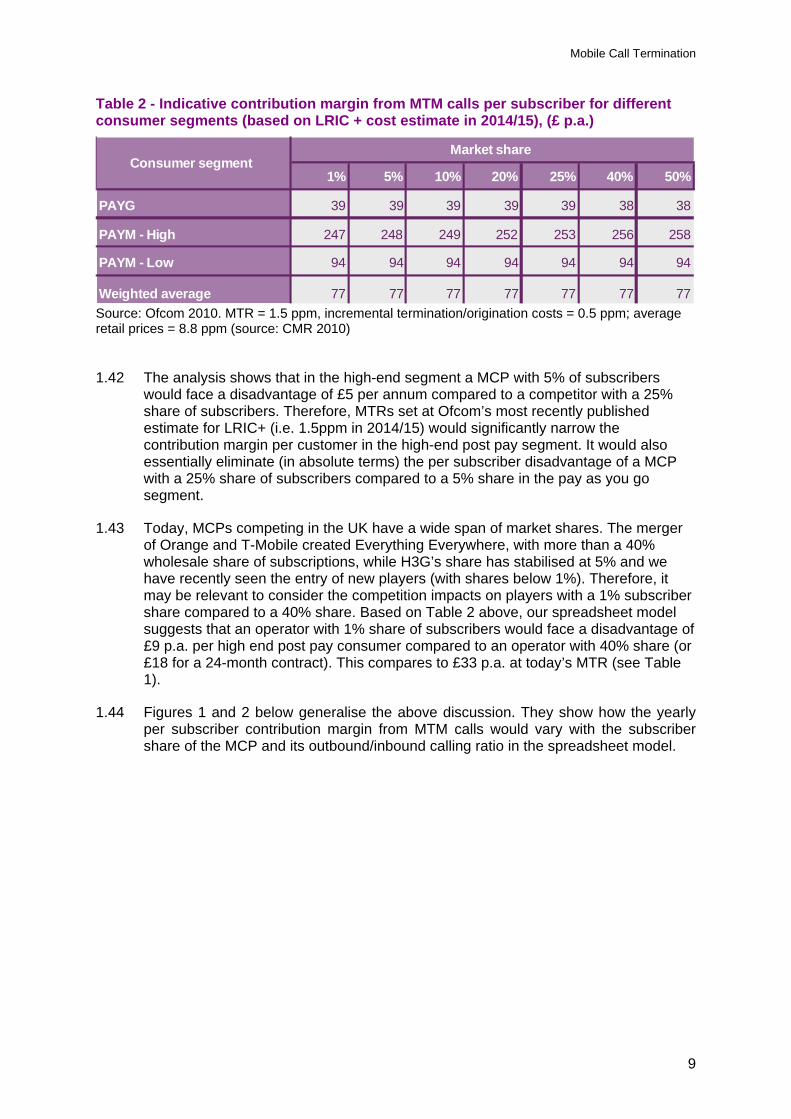
Table 2 - Indicative contribution margin from MTM calls per subscriber for different consumer segments (based on LRIC + cost estimate in 2014/15), (£ p.a.)
1% 5% 10% 20% 25% 40% 50%
PAYG 39 39 39 39 39 38 38
PAYM - High 247 248 249 252 253 256 258
PAYM - Low 94 94 94 94 94 94 94
Weighted average 77 77 77 77 77 77 77
Market shareConsumer segment
Source: Ofcom 2010. MTR = 1.5 ppm, incremental termination/origination costs = 0.5 ppm; average retail prices = 8.8 ppm (source: CMR 2010)
1.42 The analysis shows that in the high-end segment a MCP with 5% of subscribers would face a disadvantage of £5 per annum compared to a competitor with a 25% share of subscribers. Therefore, MTRs set at Ofcom’s most recently published estimate for LRIC+ (i.e. 1.5ppm in 2014/15) would significantly narrow the contribution margin per customer in the high-end post pay segment. It would also essentially eliminate (in absolute terms) the per subscriber disadvantage of a MCP with a 25% share of subscribers compared to a 5% share in the pay as you go segment.
1.43 Today, MCPs competing in the UK have a wide span of market shares. The merger of Orange and T-Mobile created Everything Everywhere, with more than a 40% wholesale share of subscriptions, while H3G’s share has stabilised at 5% and we have recently seen the entry of new players (with shares below 1%). Therefore, it may be relevant to consider the competition impacts on players with a 1% subscriber share compared to a 40% share. Based on Table 2 above, our spreadsheet model suggests that an operator with 1% share of subscribers would face a disadvantage of £9 p.a. per high end post pay consumer compared to an operator with 40% share (or £18 for a 24-month contract). This compares to £33 p.a. at today’s MTR (see Table 1).
1.44 Figures 1 and 2 below generalise the above discussion. They show how the yearly per subscriber contribution margin from MTM calls would vary with the subscriber share of the MCP and its outbound/inbound calling ratio in the spreadsheet model.

Mobile Call Termination
10
Figure 1 - High-end” contribution margin per subscriber per annum by operator market share and for different outbound : to inbound ratios
1
2
3
4
150 200 250 300
1% market share
5% market share
25% market share
40% market share
1:1
4:1
3:1
2:1
Figure 2 : Pre-pay contribution margin per subscriber per annum by operator market share and for different outbound : inbound ratios
‐4
‐3
‐2
‐1
0
0 20 40 60 80 100
1% market share
5% market share
25% market share
40% market share
1:1
1:4
1:3
1:2
Source: Ofcom 2010.Base case assumptions: MTR = 4.3 ppm, marginal termination / origination costs = 0.5 ppm; average retail prices = 8.8 ppm (source: CMR 2010).
1.45 Figure 1 shows that the higher the net outflow of minutes for high-end consumer segments the greater the difference in contribution margin for operators with asymmetric market shares (when symmetric MTRs are above incremental cost). Figure 2 shows that the higher the net inflow for pre-pay consumer segments the larger the margin difference: but this time the lower the market share the higher the contribution margin per subscriber.
Calibrating the model with market data
1.46 While the inbound and outbound minutes used in the spreadsheet modelling described above were sourced from our Communications Market Report 2010, we had to make assumptions over the inbound and outbound ratios for particular
Mobile Call Termination
11
consumer segments since these were not available from publicly available information.
1.47 With this in mind, we required MCPs to provide data that would allow us to better understand the outbound/inbound ratios of their customers and how these varied across consumer segments in relation to spend on mobile services.
1.48 These data need to be interpreted carefully because market outcomes will reflect, among other things, MCPs’ attempts to minimise the impact of the asymmetric market share effects described above. Caution is also required because the data received also covers fixed-to-mobile (FTM) and mobile-to-fixed (MTF) traffic and few MCPs split the traffic both by what was FTM (from inbound traffic) or what was MTF (from outbound traffic) for each consumer segment. Also, in some cases, MCPs have not provided sufficiently granular data to allow us to look at inbound and outbound traffic volumes and ratios for different expenditure cohorts within the pre-pay or post-pay segments. We are still clarifying with some individual stakeholders some final aspects of the data submitted, although we do not expect these clarifications to make a material difference to our analysis.
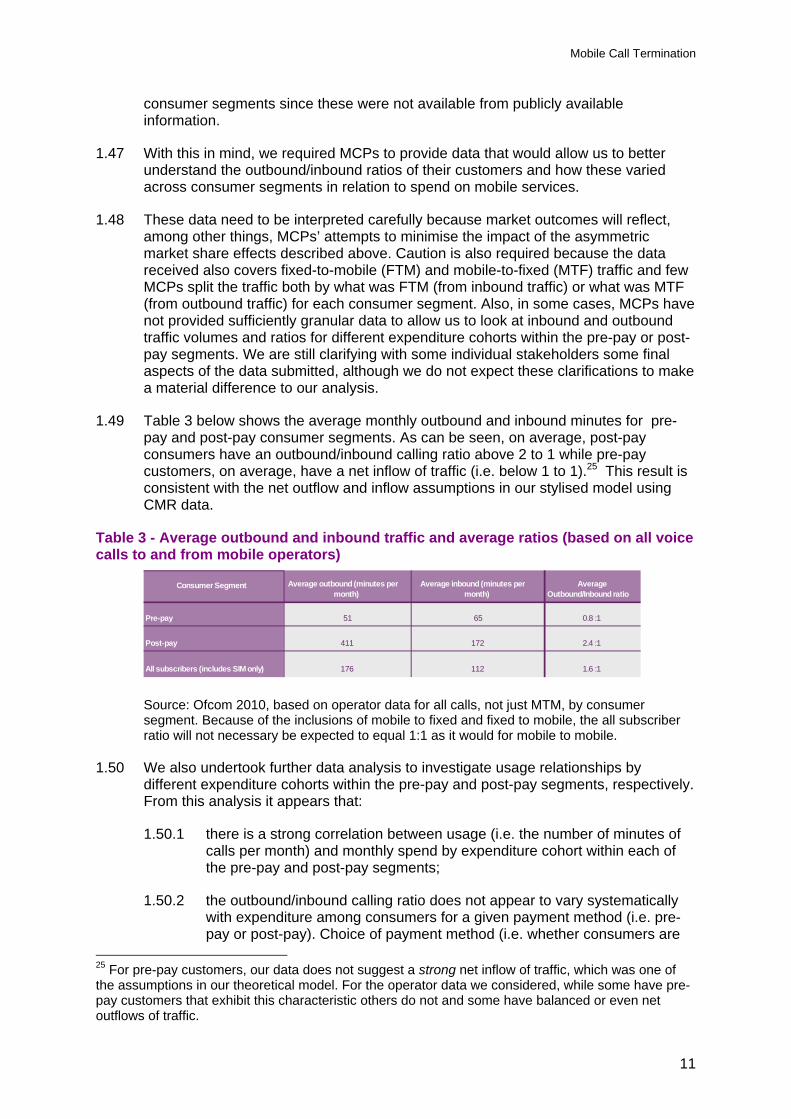
1.49 Table 3 below shows the average monthly outbound and inbound minutes for pre-pay and post-pay consumer segments. As can be seen, on average, post-pay consumers have an outbound/inbound calling ratio above 2 to 1 while pre-pay customers, on average, have a net inflow of traffic (i.e. below 1 to 1).25 This result is consistent with the net outflow and inflow assumptions in our stylised model using CMR data.
Table 3 - Average outbound and inbound traffic and average ratios (based on all voice calls to and from mobile operators)
Source: Ofcom 2010, based on operator data for all calls, not just MTM, by consumer segment. Because of the inclusions of mobile to fixed and fixed to mobile, the all subscriber ratio will not necessary be expected to equal 1:1 as it would for mobile to mobile.
1.50 We also undertook further data analysis to investigate usage relationships by different expenditure cohorts within the pre-pay and post-pay segments, respectively. From this analysis it appears that:
1.50.1 there is a strong correlation between usage (i.e. the number of minutes of calls per month) and monthly spend by expenditure cohort within each of the pre-pay and post-pay segments;
1.50.2 the outbound/inbound calling ratio does not appear to vary systematically with expenditure among consumers for a given payment method (i.e. pre-pay or post-pay). Choice of payment method (i.e. whether consumers are
25 For pre-pay customers, our data does not suggest a strong net inflow of traffic, which was one of the assumptions in our theoretical model. For the operator data we considered, while some have pre-pay customers that exhibit this characteristic others do not and some have balanced or even net outflows of traffic.
Con su mer S eg ment A verag e
o utbound
(minutes
per
month)Average
inbound
(minutes
per
month)
Average Outb o u n d/In b oun d ratio
Pre- p ay 51 65 0.8 : 1
Post- p ay
411 172 2.4 : 1
All su b scribers
( inclu des
SIM
o n l y) 176 112 1.6 : 1
Mobile Call Termination
12
pre-pay or post-pay) appears to be the only factor – within the data gathered – that generates a detectable difference in outbound/inbound calling ratios (this latter point being shown in Table 3).
1.51 From the data gathered for this market review, it appears that post-pay customers make considerably more calls than they receive and as higher spending post-pay customers make significantly more use of their mobile phone, in absolute terms there is a significant net outflow of minutes for “high end” customers (even if the ratio of outbound to inbound usage is not markedly different for “high end” post-pay customers compared to average post-pay customers).
1.52 Therefore, the data gathered for this market review suggests that low market share MCPs will face a relative disadvantage across all post pay segments; with the greatest disadvantage being for higher spend (higher use) consumers where the absolute gap between inbound and outbound minutes is largest.
For pre-pay, the data gathered for this market review suggests a net inflow of calls, though perhaps not to the extent assumed in our preliminary analysis at Tables 1 and 2 above. Therefore, the market evidence suggests that the relative advantage for smaller MCPs in the pre-pay segment may be below what we might have initially expected.
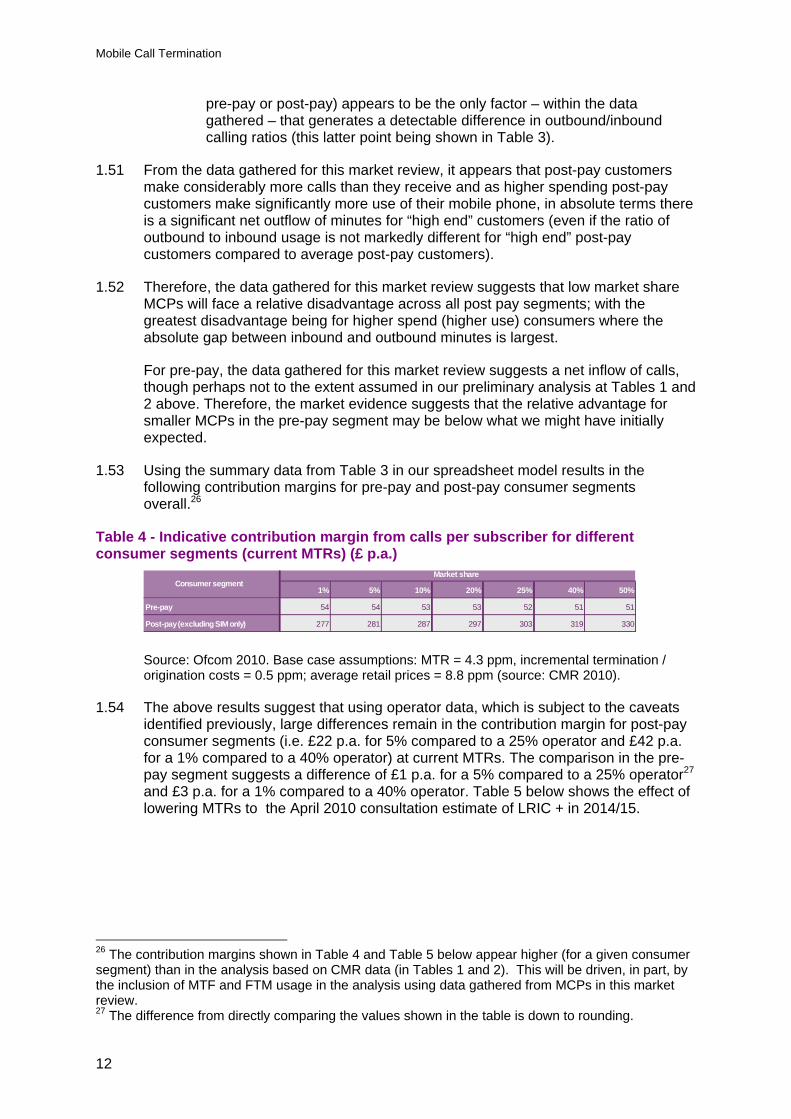
1.53 Using the summary data from Table 3 in our spreadsheet model results in the following contribution margins for pre-pay and post-pay consumer segments overall.26
Table 4 - Indicative contribution margin from calls per subscriber for different consumer segments (current MTRs) (£ p.a.)
Source: Ofcom 2010. Base case assumptions: MTR = 4.3 ppm, incremental termination / origination costs = 0.5 ppm; average retail prices = 8.8 ppm (source: CMR 2010).
1.54 The above results suggest that using operator data, which is subject to the caveats identified previously, large differences remain in the contribution margin for post-pay consumer segments (i.e. £22 p.a. for 5% compared to a 25% operator and £42 p.a. for a 1% compared to a 40% operator) at current MTRs. The comparison in the pre-pay segment suggests a difference of £1 p.a. for a 5% compared to a 25% operator27 and £3 p.a. for a 1% compared to a 40% operator. Table 5 below shows the effect of lowering MTRs to the April 2010 consultation estimate of LRIC + in 2014/15.
26 The contribution margins shown in Table 4 and Table 5 below appear higher (for a given consumer segment) than in the analysis based on CMR data (in Tables 1 and 2). This will be driven, in part, by the inclusion of MTF and FTM usage in the analysis using data gathered from MCPs in this market review. 27 The difference from directly comparing the values shown in the table is down to rounding.
1% 5% 10% 20% 25% 40% 50%
Pre-p ay 54 54 53 53 52 51 51
Po st-p ay (excl u ding
S I M
only) 277 281 287 297 303 319 330
Market share
C o nsu mer seg m ent
Mobile Call Termination
13
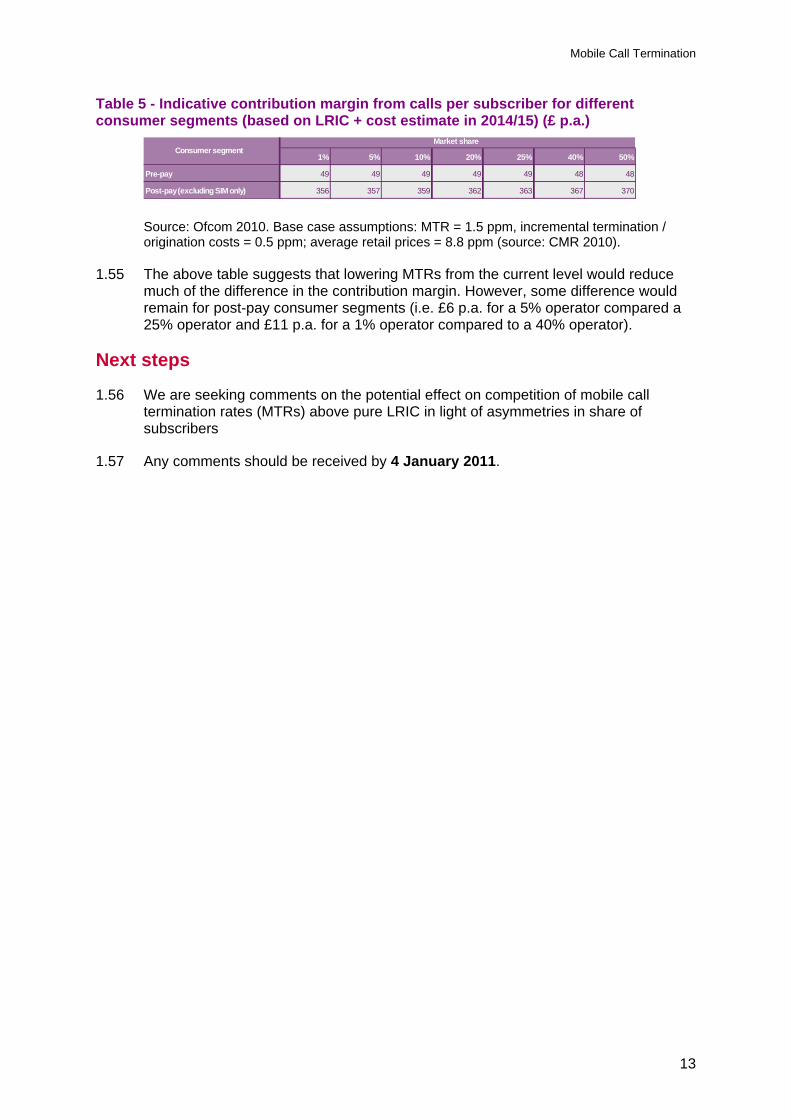
Table 5 - Indicative contribution margin from calls per subscriber for different consumer segments (based on LRIC + cost estimate in 2014/15) (£ p.a.)
Source: Ofcom 2010. Base case assumptions: MTR = 1.5 ppm, incremental termination / origination costs = 0.5 ppm; average retail prices = 8.8 ppm (source: CMR 2010).
1.55 The above table suggests that lowering MTRs from the current level would reduce much of the difference in the contribution margin. However, some difference would remain for post-pay consumer segments (i.e. £6 p.a. for a 5% operator compared a 25% operator and £11 p.a. for a 1% operator compared to a 40% operator).
Next steps
1.56 We are seeking comments on the potential effect on competition of mobile call termination rates (MTRs) above pure LRIC in light of asymmetries in share of subscribers
1.57 Any comments should be received by 4 January 2011.
1% 5% 10% 20% 25% 40% 50%
Pre-p ay 49 49 49 49 49 48 48
Po st- p ay (excl u ding
S I M only) 356 357 359 362 363 367 370
Market share
C o nsu mer seg ment

Mobile Call Termination
14
Annex 1
1 Responding to this consultation How to respond
A1.1 Ofcom invites written views and comments on the issues raised in this document, to be made by 5pm on 4 January 2011.
A1.2 Ofcom strongly prefers to receive responses using the online web form at http://stakeholders.ofcom.org.uk/consultations/mtr, as this helps us to process the responses quickly and efficiently. We would also be grateful if you could assist us by completing a response cover sheet (see Annex 3), to indicate whether or not there are confidentiality issues. This response coversheet is incorporated into the online web form questionnaire.
A1.3 For larger consultation responses - particularly those with supporting charts, tables or other data - please email [email protected] attaching your response in Microsoft Word format, together with a consultation response coversheet.
A1.4 Responses may alternatively be posted or faxed to the address below, marked with the title of the consultation. Paul Jacobus 4th Floor Competition Group Riverside House 2A Southwark Bridge Road London SE1 9HA
A1.5 Note that we do not need a hard copy in addition to an electronic version. Ofcom will acknowledge receipt of responses if they are submitted using the online web form but not otherwise.
A1.6 It would be helpful if your response could include direct answers to the questions asked in this document, which are listed together at Annex X. It would also help if you can explain why you hold your views and how Ofcom’s proposals would impact on you.
Further information
A1.7 If you want to discuss the issues and questions raised in this consultation, or need advice on the appropriate form of response, please contact Paul Jacobus on 020 7981 3574.
Confidentiality
A1.8 We believe it is important for everyone interested in an issue to see the views expressed by consultation respondents. We will therefore usually publish all responses on our website, www.ofcom.org.uk, ideally on receipt. If you think your response should be kept confidential, can you please specify what part or whether
Mobile Call Termination
15
all of your response should be kept confidential, and specify why. Please also place such parts in a separate annex.
A1.9 If someone asks us to keep part or all of a response confidential, we will treat this request seriously and will try to respect this. But sometimes we will need to publish all responses, including those that are marked as confidential, in order to meet legal obligations.
A1.10 Please also note that copyright and all other intellectual property in responses will be assumed to be licensed to Ofcom to use. Ofcom’s approach on intellectual property rights is explained further on its website at http://www.ofcom.org.uk/about/accoun/disclaimer/
Next steps
A1.11 Following the end of the consultation period, Ofcom intends to publish a statement in the first quarter 2011.
A1.12 Please note that you can register to receive free mail Updates alerting you to the publications of relevant Ofcom documents. For more details please see: http://www.ofcom.org.uk/static/subscribe/select_list.htm
Ofcom's consultation processes
A1.13 Ofcom seeks to ensure that responding to a consultation is easy as possible. For more information please see our consultation principles in Annex 2.
A1.14 If you have any comments or suggestions on how Ofcom conducts its consultations, please call our consultation helpdesk on 020 7981 3003 or e-mail us at [email protected] . We would particularly welcome thoughts on how Ofcom could more effectively seek the views of those groups or individuals, such as small businesses or particular types of residential consumers, who are less likely to give their opinions through a formal consultation.
A1.15 If you would like to discuss these issues or Ofcom's consultation processes more generally you can alternatively contact Vicki Nash, Director Scotland, who is Ofcom’s consultation champion:
Vicki Nash Ofcom Sutherland House 149 St. Vincent Street Glasgow G2 5NW Tel: 0141 229 7401 Fax: 0141 229 7433 Email [email protected]
Mobile Call Termination
16
Annex 2
2 Ofcom’s consultation principles A2.16 Ofcom has published the following seven principles that it will follow for each public
written consultation:
Before the consultation
A2.17 Where possible, we will hold informal talks with people and organisations before announcing a big consultation to find out whether we are thinking in the right direction. If we do not have enough time to do this, we will hold an open meeting to explain our proposals shortly after announcing the consultation.
During the consultation
A2.18 We will be clear about who we are consulting, why, on what questions and for how long.
A2.19 We will make the consultation document as short and simple as possible with a summary of no more than two pages. We will try to make it as easy as possible to give us a written response. If the consultation is complicated, we may provide a shortened Plain English Guide for smaller organisations or individuals who would otherwise not be able to spare the time to share their views.
A2.20 We will consult for up to 10 weeks depending on the potential impact of our proposals.
A2.21 A person within Ofcom will be in charge of making sure we follow our own guidelines and reach out to the largest number of people and organisations interested in the outcome of our decisions. Ofcom’s ‘Consultation Champion’ will also be the main person to contact with views on the way we run our consultations.
A2.22 If we are not able to follow one of these principles, we will explain why.
After the consultation
A2.23 We think it is important for everyone interested in an issue to see the views of others during a consultation. We would usually publish all the responses we have received on our website. In our statement, we will give reasons for our decisions and will give an account of how the views of those concerned helped shape those decisions.
Mobile Call Termination
17
Annex 3
3 Consultation response cover sheet A3.24 In the interests of transparency and good regulatory practice, we will publish all
consultation responses in full on our website, www.ofcom.org.uk.
A3.25 We have produced a coversheet for responses (see below) and would be very grateful if you could send one with your response (this is incorporated into the online web form if you respond in this way). This will speed up our processing of responses, and help to maintain confidentiality where appropriate.
A3.26 The quality of consultation can be enhanced by publishing responses before the consultation period closes. In particular, this can help those individuals and organisations with limited resources or familiarity with the issues to respond in a more informed way. Therefore Ofcom would encourage respondents to complete their coversheet in a way that allows Ofcom to publish their responses upon receipt, rather than waiting until the consultation period has ended.
A3.27 We strongly prefer to receive responses via the online web form which incorporates the coversheet. If you are responding via email, post or fax you can download an electronic copy of this coversheet in Word or RTF format from the ‘Consultations’ section of our website at www.ofcom.org.uk/consult/.
A3.28 Please put any parts of your response you consider should be kept confidential in a separate annex to your response and include your reasons why this part of your response should not be published. This can include information such as your personal background and experience. If you want your name, address, other contact details, or job title to remain confidential, please provide them in your cover sheet only, so that we don’t have to edit your response.
Mobile Call Termination
18
Cover sheet for response to an Ofcom consultation
BASIC DETAILS
Consultation title:
To (Ofcom contact):
Name of respondent:
Representing (self or organisation/s):
Address (if not received by email):
CONFIDENTIALITY
Please tick below what part of your response you consider is confidential, giving your reasons why
Nothing Name/contact details/job title
Whole response Organisation
Part of the response If there is no separate annex, which parts?
If you want part of your response, your name or your organisation not to be published, can Ofcom still publish a reference to the contents of your response (including, for any confidential parts, a general summary that does not disclose the specific information or enable you to be identified)?
DECLARATION
I confirm that the correspondence supplied with this cover sheet is a formal consultation response that Ofcom can publish. However, in supplying this response, I understand that Ofcom may need to publish all responses, including those which are marked as confidential, in order to meet legal obligations. If I have sent my response by email, Ofcom can disregard any standard e-mail text about not disclosing email contents and attachments.
Ofcom seeks to publish responses on receipt. If your response is non-confidential (in whole or in part), and you would prefer us to publish your response only once the consultation has ended, please tick here.
Name Signed (if hard copy)
Mobile Call Termination
19
Annex 4
4 Description of Ofcom’s spreadsheet model Introduction
A4.29 In this Annex we describe the spreadsheet model we propose to use as one of the inputs into our analysis of the competition effects of high (symmetric) MTRs.
Model description
Overview
A4.30 The key modelling output is the average annual contribution margin per subscriber, which we calculate for consumers in one of three main consumer types:
PAYG consumers: these consumers receive more calls than they make. They also make the fewest number of calls in aggregate;
“Low end” post-pay consumer: these consumers have a balanced traffic profile but make fewer calls in aggregate than high end post-pay consumers; and
“High end” post-pay consumer: these consumers make more calls than they receive. This consumer type is assumed to make the most calls.
A4.31 As described in Section 1, we are interested in any differences in the contribution margin for the average subscriber in each of different consumer segments for operators with different market shares. This is based on the assumption that the proportion of on-net calls is highly correlated with an operator’s market share (see Section 1 and paragraphs Error! Reference source not found. to Error! Reference source not found. below for further explanation).
A4.32 In our base case, we only modelled the effects of MTM calls (i.e. we do not consider revenues and costs associated with FTM or MTF calls).
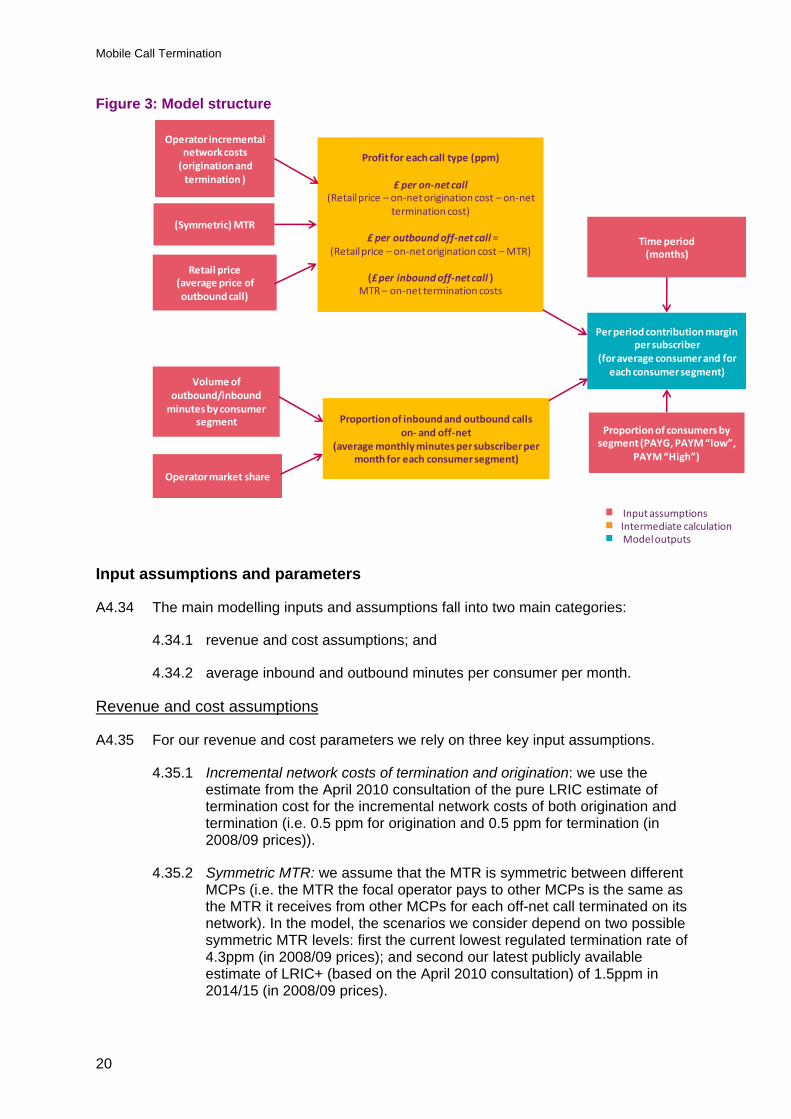
A4.33 In order to generate the notional contribution margin per subscriber in each consumer segment we used a number of other model inputs and assumptions. We describe our model assumptions and calculation steps in figure 3 below.
Mobile Call Termination
20
Figure 3: Model structure
Proportion of consumers by segment (PAYG, PAYM “low”,
PAYM “High”)
Operator incremental network costs (origination and termination )
Input assumptionsIntermediate calculationModel outputs
Per period contribution margin per subscriber
(for average consumer and for each consumer segment)
(Symmetric) MTR
Retail price(average price of outbound call)
Volume of outbound/inbound minutes by consumer
segment
Operator market share
Profit for each call type (ppm)
£ per on‐net call (Retailprice – on‐net origination cost – on‐net
termination cost)
£ per outbound off‐net call = (Retail price – on‐net origination cost –MTR)
(£ per inbound off‐net call )MTR – on‐net termination costs
Proportion of inbound and outbound calls on‐ and off‐net
(average monthly minutes per subscriber per month for each consumer segment)
Time period(months)
Input assumptions and parameters
A4.34 The main modelling inputs and assumptions fall into two main categories:
4.34.1 revenue and cost assumptions; and
4.34.2 average inbound and outbound minutes per consumer per month.
Revenue and cost assumptions
A4.35 For our revenue and cost parameters we rely on three key input assumptions.
4.35.1 Incremental network costs of termination and origination: we use the estimate from the April 2010 consultation of the pure LRIC estimate of termination cost for the incremental network costs of both origination and termination (i.e. 0.5 ppm for origination and 0.5 ppm for termination (in 2008/09 prices)).
4.35.2 Symmetric MTR: we assume that the MTR is symmetric between different MCPs (i.e. the MTR the focal operator pays to other MCPs is the same as the MTR it receives from other MCPs for each off-net call terminated on its network). In the model, the scenarios we consider depend on two possible symmetric MTR levels: first the current lowest regulated termination rate of 4.3ppm (in 2008/09 prices); and second our latest publicly available estimate of LRIC+ (based on the April 2010 consultation) of 1.5ppm in 2014/15 (in 2008/09 prices).
Mobile Call Termination
21
4.35.3 Retail prices (i.e. the average price of an outbound call): in terms of retail prices, we have used data from Ofcom’s Communications Market Report 2010 (Figure 5.76) for the average retail price of an outbound call of 8.8 ppm, which we have assumed applies uniformly across all consumer types.
Outbound and inbound minutes by consumer segment
A4.36 For each consumer segment, in our base case we have used aggregate industry data to estimate the average monthly minutes of outbound and inbound calls.
A4.37 Our base case outbound MTM call assumptions (minutes per subscriber per month) are:
4.37.1 PAYG : 38 minutes per month;
4.37.2 PAYM “low-end: 100 minutes per month
4.37.3 PAYM “high-end”: 288 minutes per month
A4.38 These assumptions over monthly outbound minutes of MTM calls are based on aggregate industry data from Ofcom’s Communications Market Report 2010.28
A4.39 Our base case inbound call assumptions (minutes per subscriber per month) are:
4.39.1 PAYG : 71 minutes per month;
4.39.2 PAYM “low-end: 100 minutes per month
4.39.3 PAYM “high-end”: 100 minutes per month
A4.40 We derived these inbound call assumptions based on “low end” post pay consumers having balanced traffic. For simplicity, we also assumed that “high-end” post pay consumers receive the same volume of minutes as “low end” post pay. We then derived the implied volume of calls to PAYG consumers such that in total the volume of outbound calls to mobiles was equal to the volume of inbound calls to mobiles.
A4.41 As an alternative calibration exercise, we have also considered data derived from an information request we issued on 17 September 2010 under section 135 of the Communications Act 2003 to each of the 8 largest MCPs. Using this data we considered the contribution margin associated with two consumer segments: pre-pay and all post-pay. This was based on the total inbound and outbound monthly minutes (including to and from fixed):
28 See CMR 2010: http://stakeholders.ofcom.org.uk/binaries/research/cmr/753567/UK-telecoms.pdf Figure 5.72 of the CMR shows for the average mobile consumer the volume of outbound minutes per month by destination (on-net, off-net mobile, off-net to fixed etc). Combined with data in the CMR 2010 in Figure 5.73 on total outbound minutes for pre-pay and contract consumers, we were able to estimate the monthly minutes of outbound calls to mobiles (38 minutes for pre-pay consumers and 147 minutes for contract consumers). We further split contract consumers into “high-end” and “low-end”, and we made certain assumptions over the volume of outbound calls to mobiles generated by each consumer segment. For simplicity, we assumed “low end” contract consumers made 100 minutes of calls per month. Given the total number of 147 minutes and the proportion of consumers in the “low-end” and “high-end” segments, we calculated that “high end” consumer segment would make 288 minutes of calls per month.
Mobile Call Termination
22
4.41.1 Pre-pay: 51 minutes outbound; 65 minutes inbound
4.41.2 Post-pay: 411 minutes outbound; 172 inbound.
Calculation steps
A4.42 Using the assumptions discussed above as inputs, there are two main calculation steps in our model relating to:
4.42.1 contribution margin per call type; and
4.42.2 the proportion of inbound and outbound calls that are on- and off-net.
Contribution margin per call type
A4.43 The model calculates on a pence per minute basis, the notional profit derived from different call types. There are three call types considered in our model: on-net calls, outbound off-net calls and inbound off-net calls.
A4.44 As shown in Figure 3, we calculate the (ppm) profit per call type based on the following:
4.44.1 Contribution margin per end-to-end on-net call = Retail price – on-net origination cost – on-net termination cost
4.44.2 Contribution margin per outbound off-net call = Retail price – on-net origination cost – MTR
4.44.3 Contribution margin per inbound off-net call = MTR – on-net termination costs
The proportion of inbound and outbound calls that are on- and off-net.
A4.45 As set out above, a key input to the model is the number of monthly outbound and inbound minutes for each of the identified consumer segments (i.e. PAYG, PAYM “low” and PAYM “high”). Since we are interested in the impact of MTRs on operators with different subscriber shares, we therefore calculated for a given subscriber share the proportion of outbound calls that are on- and off-net and the proportion of inbound calls that are off-net.
A4.46 For outbound calls – we assumed that the proportion of calls that were on-net exactly equals an operator’s share of subscribers. So an operator with a 5% share of subscribers would see 5% of its outbound calls on-net and 95% off-net. For inbound calls to this 5% operator, we assume that 95% of calls will be originated off-net and 5% originated on-net.
Model outputs
A4.47 As the final step, we multiplied the contribution margin for each of the three call types by the associated number of average minutes (for the corresponding call type) for the particular consumer segment. The output of this calculation is the annual contribution margin per subscriber for each consumer segment. Finally, we

Mobile Call Termination
23
used data on the number of subscribers to calculate the overall weighted average contribution margin per consumer segment.29
29 On the basis of Ofcom’s market data (http://www.ofcom.org.uk/static/cmr-10/UKCM-5.47.html), we assumed that PAYG represents 59% of total mobile subscriptions. We assumed that for the remaining market “high end” contract consumers comprise 10% of all mobile subscribers and “low end” contract consumers 31% of all mobile subscribers).