Embed Size (px)
Citation preview
SAMZODHANA – “Journal of Management Research”
ISSN 2347 - 4270
Vol 6 Issue 1, April 2016
An International, Double-Blind Peer-Reviewed, Open-Access Journal
www.eecmbajournal.in 87
MOBILE PHONE SERVICES IN RURAL INDIA: ITS GROWTH AND USERS’
SATISFACTION
Dr. B. ANGAMUTHU M.Com, MPhil, Ph.D.
Assistant Professor of Commerce,
Kovai Kalaimagal College of Arts and Science,
Vellimalaipattinam, Narasipuram (po), Thondamuthur (via),
Coimbatore – 641 109, Tamilnadu, India
E-mail: [email protected]
Abstract
India is the second largest mobile market in the world. The rapid growth and
use of mobile phones has made the telecom companies like BSNL, Idea, Reliance,
Bharat, Vodafone, Airtel, Aircel, MTNL, etc. more conscious to provide world class and
best facilities to their customers in order to maintain their market. Also, these telecom
companies are coming up with new ideas and methodology to provide new and easy
services to their customers. This current research aims to measure the growth of mobile
phone services in the rural India and analyze the satisfaction level of mobile phone
users in the rural areas. Secondary data as regards mobile phone subscriber base has
been used for measuring the growth of mobile phone services during the study periods
from 2006-2007 to 2015-2016. It is reported that the rural subscriber base is steadily
increasing year by year and this study predicted that mobile phone subscribers in rural
areas has crossed to 532 million at the end of 31st March 2020 with compound annual
growth of 5% over the year 2015-2016. Self-designed questionnaire has been used to
collect data from various villages in Thondamuthur block of Coimbatore South Taluk,
Tamil Nadu. Multi-stage sampling technique is the most appropriate for the current
study. It is reported that 79.84% of the respondents are highly satisfied about mobile
phone services in the rural areas. The chi-square analysis reported that there is no
significant association between gender, age group, education, occupation, period of
SAMZODHANA – “Journal of Management Research”
ISSN 2347 - 4270
Vol 6 Issue 1, April 2016
An International, Double-Blind Peer-Reviewed, Open-Access Journal
www.eecmbajournal.in 88
mobile phone usage of the respondents and their satisfaction level towards mobile
phone services.
Keywords: Mobile phone, Cell phone, Mobile technology, Rural areas, Mobile Services
Introduction and Execution of the Study
Mobile technology has very quickly become common among the people. There
were times when an individual dreamt of having own mobile phone as it was expensive
at the beginning. But as the world is getting advanced day-by-day, mobile and cell
phones technology is now the most common department of the advanced technology.
The mobile subscriptions across the world equal to the global population of 7.3 billion.
Among this growth, India and China alone constitute more than 2 billion mobile
subscriptions in the world. India continues to be one of the fastest growing major
telecom markets in the world. Over the last few years, the Indian government continued
its commitment to opening up the market to more competition and investment. This has
resulted in, among other things, low tariffs and low handset prices. Indian cellular
services are among the least expensive in the world. Early 2016, India has wireless
subscriber base 1026.66 million and the private companies held 91.38% market share of
the mobile phone subscribers whereas BSNL and MTNL, the two Public Sector Units
access service providers, had only a market share of 8.62%. According to TRAI reports
at the end of February 2016, India has 587.55 million urban and 439.11 million rural
mobile subscribers. The rural subscriber base accounts for 42.7% of all mobile
subscribers. As an affordable and accessible means of communication, both men and
women are realizing the potential of this technology to create economic opportunities
and strengthen social networks in rural areas. The mobile telephone is no longer just an
audio communication tool but capable of providing additional integrated functions.
Further, Mobile telephony effectively reduces the "distance" between individuals and
institutions, making the sharing of information and knowledge easier and more
effective. Mobile phones are the success story of bridging the rural digital divide,
SAMZODHANA – “Journal of Management Research”
ISSN 2347 - 4270
Vol 6 Issue 1, April 2016
An International, Double-Blind Peer-Reviewed, Open-Access Journal
www.eecmbajournal.in 89
bringing tangible economic benefits and acting as agents of social mobilization through
improved communication.
Major players in Mobile Phone Service in India
The major players like Bharti Airtel (24.22%), Vodafone (19.16%), Idea
(17.01%), Reliance (9.93%) and BSNL (8.26%) has been contributing 78.58% market
share in the mobile phone service.
Bharti Airtel: The company has been established 7th
July’1995 as a Public Limited
Company, Headquartered in New Delhi and is a leading global telecommunications
company with operations presence in 20 countries across Asia and Africa. Moreover,
Bharti Airtel ranks amongst the top 4 mobile service providers globally in terms of
subscribers. In India, Bharti Airtel had 357 million customers across its operations at the
end of March 2016 and the company's product offerings include 2G, 3G and 4G
wireless services, mobile commerce, fixed line services, high speed broadband services,
etc. The company has its proportionate revenue touched with Rs. 2,50,000 million in the
FY 2015-2016.
Vodafone India: Vodafone India is a 100% subsidiary of Vodafone Group. It
commenced operations in 1994 when its predecessor Hutchison Telecom acquired the
cellular license for Mumbai. Brand Vodafone was launched in India in September 2007,
after Vodafone Plc. acquired a majority stake in Hutchinson Essar in May 2007. From a
single operation base with 31 million customers, the company has expanded its
operations across the country to cover all 22 telecom circles and given service to 180
million customers.
Bharat Sanchar Nigam Limited (BSNL): BSNL is the only service provider, making
focused efforts and planned initiatives to bridge the rural-urban digital divide in ICT
sector. In fact there is no telecom operator in the country to beat its reach with its wide
network giving services in every nook & corner of the country & operates across India
except New Delhi & Mumbai. BSNL was incorporated on 15th
September 2000. It took
over the business of providing of telecom services and network management from the
erstwhile Central Government Departments of Telecom Services (DTS) and Telecom
SAMZODHANA – “Journal of Management Research”
ISSN 2347 - 4270
Vol 6 Issue 1, April 2016
An International, Double-Blind Peer-Reviewed, Open-Access Journal
www.eecmbajournal.in 90
Operations (DTO), with effect from 1st October’ 2000 on an going concern basis. It is
one of the largest and leading public sector units providing comprehensive range of
telecom services in India. Today, it has about 43.74 million line basic telephone
capacity, 8.83 million WLL capacity, 72.60 million GSM capacity, 37,885 fixed
exchanges, 68,162 GSM BTSs, 12,071 CDMA Towers, 197 Satellite Stations, 6,86,644
RKm. of OFC, 50,430 RKm. of microwave network connecting 623 districts, 7330
cities/towns and 5.8 lakhs villages.
Reliance Communications: Reliance Communications is India's foremost and truly
integrated telecommunications service provider. With over 150 million subscribers
across India, Reliance Mobile is India’s largest mobile service brand. Reliance Mobile
services now cover over 24,000 towns, 6 lakh villages, and still counting. Reliance
Communications corporate clientele includes over 39,000 Indian and multinational
corporations including small and medium enterprises and over 290 global, regional and
domestic carriers. Moreover, the company owns and operates the world's largest next
generation IP enabled connectivity infrastructure, comprising over 280,000 kilometers
of fibre optic cable systems in India, USA, Europe, Middle East and the Asia Pacific
region.
IDEA Cellular Network: Idea Cellular is an Aditya Birla Group Company, India's first
truly multinational corporation. Idea is the sixth largest mobile operator in the world. In
India, the company has subscriber base of over 165 million and is one of the top 3
mobile operators. Presently, the company has a deep rooted network across the length
and breadth of the country comprising of over 1,49,196 cell sites covering 7,513 towns
and 3,63,580 villages.
Statement of the Problem
Expansion of literacy rate, intervention of technology in democratization of the
market and growing role of women and children in purchase decisions of family have
helped marketers including mobile phone service provider to target greater surplus
income in the rural market more than in the urban market in recent years. This has
resulted into more players in the cell phone industry and the subscribers are provided
SAMZODHANA – “Journal of Management Research”
ISSN 2347 - 4270
Vol 6 Issue 1, April 2016
An International, Double-Blind Peer-Reviewed, Open-Access Journal
www.eecmbajournal.in 91
with various innovations of cell phone services. But still the market for cell phone
services in rural areas has become very competitive due to poor area coverage, non-
existence of towers, over billing, abrupt call cuts, etc. The subscribers may be possible
to change their mobile phone service provider whenever they face such issues, retaining
their existing mobile number.
The above related issues raised the following questions in the minds of the
researcher. What is the level of growth on mobile phone services in rural India? What
are the factors that are responsible for discriminating the satisfaction level? Does an
association exist with regard to satisfaction level among various groups?
In order to find out the answers for the above raised issues the researcher has
undertaken this research work.
Objectives of the study
To find out the growth of mobile phone services in rural India.
To assess & analyze the satisfaction level of mobile phone users in rural areas
To explore the responsible factors on determinants of satisfaction level among
the users of mobile phone service
Hypotheses of the study
Null hypothesis: There is a slow growth of mobile phone services in rural India.
Null hypothesis: There is no significant association of satisfaction level among
various groups of respondents.
Methods and Materials
This empirical and analytical research used both secondary and primary data.
The secondary data related to mobile phone subscriber base helps to measure the growth
of mobile phone services in rural India and the related statistics have been collected
from official records of TRAI (Telecom Regulatory Authority of India) during the
periods of 2006-2007 to 2015-2016 (Upto February). The self-designed questionnaire
has been used to collect primary data from five villages in Thondamuthur Block of
SAMZODHANA – “Journal of Management Research”
ISSN 2347 - 4270
Vol 6 Issue 1, April 2016
An International, Double-Blind Peer-Reviewed, Open-Access Journal
www.eecmbajournal.in 92
Coimbatore South Taluk. Totally, 250 questionnaires were distributed, 241 responses
were obtained from the respondents but based on the application of Discriminant function
only 124 responses were used for final study. Five villages, namely, Molapalayam,
Vadivelampalayam, Nathegoundenpudur, Naraseepuram and Ikkarai Boluvampatti were
selected using multi-stage sampling technique. Moreover, the researcher is familiar with
the selected villages. The primary data were collected during the period from
November’ 2015 to January’ 2016. The statistical tools like Trend analysis, Mean,
Compound Annual Growth Rate, Chi-square analysis and Discriminant function were
used to draw the conclusion.
Review of Literature
Arvind and Claudia Kubowicz (2013) in their study explored the switching
behavior of mobile service customers in the USA with a focus on service quality,
innovation and lock-in strategies as deterrents of switching. Chaitanya (2013) has
investigated customers' choice for the mobile phones with a right blend of features and
price. A survey conducted among 214 Indian undergraduate student mobile phone users
reveal their criteria for selecting mobile phone with maximum features and an
affordable price. Feature-wise comparison is also made between mobile phones of most
preferred companies. Mobile handset manufacturers and network providers can
implement customers' feedback and suggestions to improve their products or services.
Dhevika et al (2013) studied brand switching among cellular network service users and
found that users’ satisfaction is the main influencing factor for brand switching. Juha
(2008) investigated customers' intentions to purchase mobile communications services
and how these intentions are affected by the customers' price perceptions in the Finnish
mobile services market. The author indicated that there is a significant and positive
relationship that exists between customers' price perceptions and their purchase
intentions, and that the formation of price perceptions is significantly influenced by
satisfaction with pricing and services. Ramakrishnan et al (2008) aimed to address the
significance of product attributes in brand switching behaviour through multi-
dimensional scaling and results suggest that a set of product attributes trigger the
SAMZODHANA – “Journal of Management Research”
ISSN 2347 - 4270
Vol 6 Issue 1, April 2016
An International, Double-Blind Peer-Reviewed, Open-Access Journal
www.eecmbajournal.in 93
intention to switch the current brand. Vijayakumar (2006) reported that the satisfaction
derived by the subscribers of Airtel Network has been influenced by the clarity of
signals, availability of plan options, low call charges and activation formalities. Revathy
et al (2005) found that the factors like lower service charges offered by Department of
Telecommunications (DOT) than other private players, convenience of contact,
accessibility, improvement of own business/profession, prestige and status symbol as
the influencing factors for the possession of cell phone connections. Nadine (2002) in
her study revealed that the various punctual reasons that motivate the use of the mobile
phone (such as, its functionality, its cost, its ease of access), as well as the type of
communications placed from a mobile phone. These reasons and communication types
all concur to make this device the support of fluid and flexible social interactions and
coordination. As to text messaging, it is considered as a medium in its own right, whose
use is largely governed by emerging social conventions. Oliver (1981) defined customer
satisfaction as the summary psychological state resulting when the emotion surrounding
disconfirmed expectations is coupled with the consumer’s prior feelings about the
consumption experience.
Analysis and Interpretation
Growth of Mobile Phone service in the Rural India
The growth of mobile phone services in rural areas can be measured through the
mobile phone subscriber base since 2006-2007 and it is discussed in brief. For this
purpose, the researcher has applied appropriate statistical tools. They are
Mean: The value is obtained by adding together all the items in the ‘X’ series
and then dividing the total number of observations (N). It can be find out through the
equation of ∑Х/N.
Trend analysis: The foremost objective of least-square trend analysis is to
measure the changes of data/observation between the periods and prediction of future on
the basis of past experience. The present research work focuses on secular trend analysis
among different components, because it studies the movements of data either upward or
downward or constant direction over a period of time using linear trend by the method
SAMZODHANA – “Journal of Management Research”
ISSN 2347 - 4270
Vol 6 Issue 1, April 2016
An International, Double-Blind Peer-Reviewed, Open-Access Journal
www.eecmbajournal.in 94
of least squares. This is the best method for obtaining the trend values.
It provides a convenient basis for obtaining the line of best fit in a series. The line of the
best fit is a line from which the sum of the deviations of various points on either side is
zero (actual values of Y from the computed values of Yc). Further the sum of the
squares of the deviations of the actual values of Y and computed values of Yc is least.
So, it is called the method of least squares and line obtained by this method is called the
line of best fit or straight line trend and it is derived from the equation of Yc = a + bx
Where,
Yc = Trend values for a period
a= Y intercept / trend value at origin when X = 0
b = the amount of change in trend value per unit (i.e., per year)
x = Time unit (i.e., per year)
The current study covered the following three things
Origin (Mid-year) – 2011-2012
X unit – one year
Y unit – Mobile phone subscription
Moreover, the values of two constants ‘a’ and ‘b’ are estimated by solving the
following two normal equations.
∑Y = Na + b∑X and ∑XY = a∑X + b∑X2
Compound Annual Growth Rate (CAGR) : The CAGR is calculated by taking
the nth
root of the total percentage growth rate, where ‘n’ is the number of years in the
period being considered.
CAGR=(Ending Value/Beginning Value) (1/# of years)
- 1
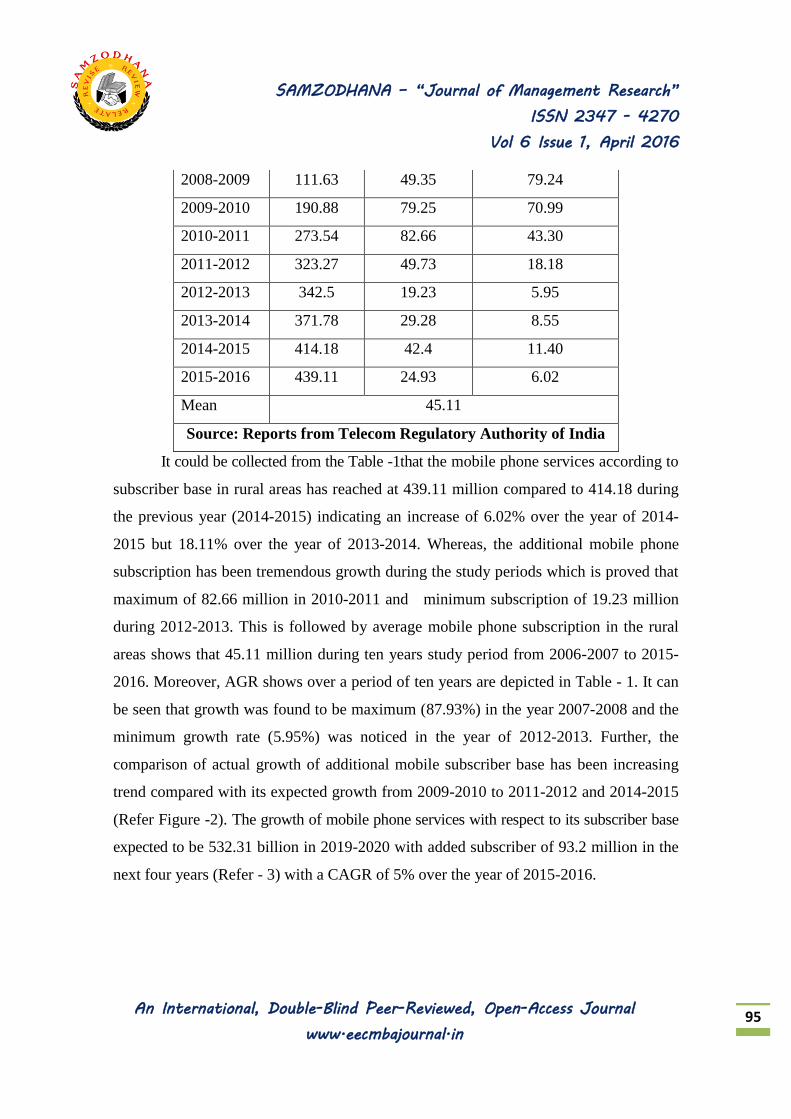
Table - 1: Growth of Mobile Phone Services in Rural India (in
millions)
Year Subscribers
Actual
growth
Growth rate (in
%)
2006-2007 33.14 - -
2007-2008 62.28 29.14 87.93
SAMZODHANA – “Journal of Management Research”
ISSN 2347 - 4270
Vol 6 Issue 1, April 2016
An International, Double-Blind Peer-Reviewed, Open-Access Journal
www.eecmbajournal.in 95
2008-2009 111.63 49.35 79.24
2009-2010 190.88 79.25 70.99
2010-2011 273.54 82.66 43.30
2011-2012 323.27 49.73 18.18
2012-2013 342.5 19.23 5.95
2013-2014 371.78 29.28 8.55
2014-2015 414.18 42.4 11.40
2015-2016 439.11 24.93 6.02
Mean 45.11
Source: Reports from Telecom Regulatory Authority of India
It could be collected from the Table -1that the mobile phone services according to
subscriber base in rural areas has reached at 439.11 million compared to 414.18 during
the previous year (2014-2015) indicating an increase of 6.02% over the year of 2014-
2015 but 18.11% over the year of 2013-2014. Whereas, the additional mobile phone
subscription has been tremendous growth during the study periods which is proved that
maximum of 82.66 million in 2010-2011 and minimum subscription of 19.23 million
during 2012-2013. This is followed by average mobile phone subscription in the rural
areas shows that 45.11 million during ten years study period from 2006-2007 to 2015-
2016. Moreover, AGR shows over a period of ten years are depicted in Table - 1. It can
be seen that growth was found to be maximum (87.93%) in the year 2007-2008 and the
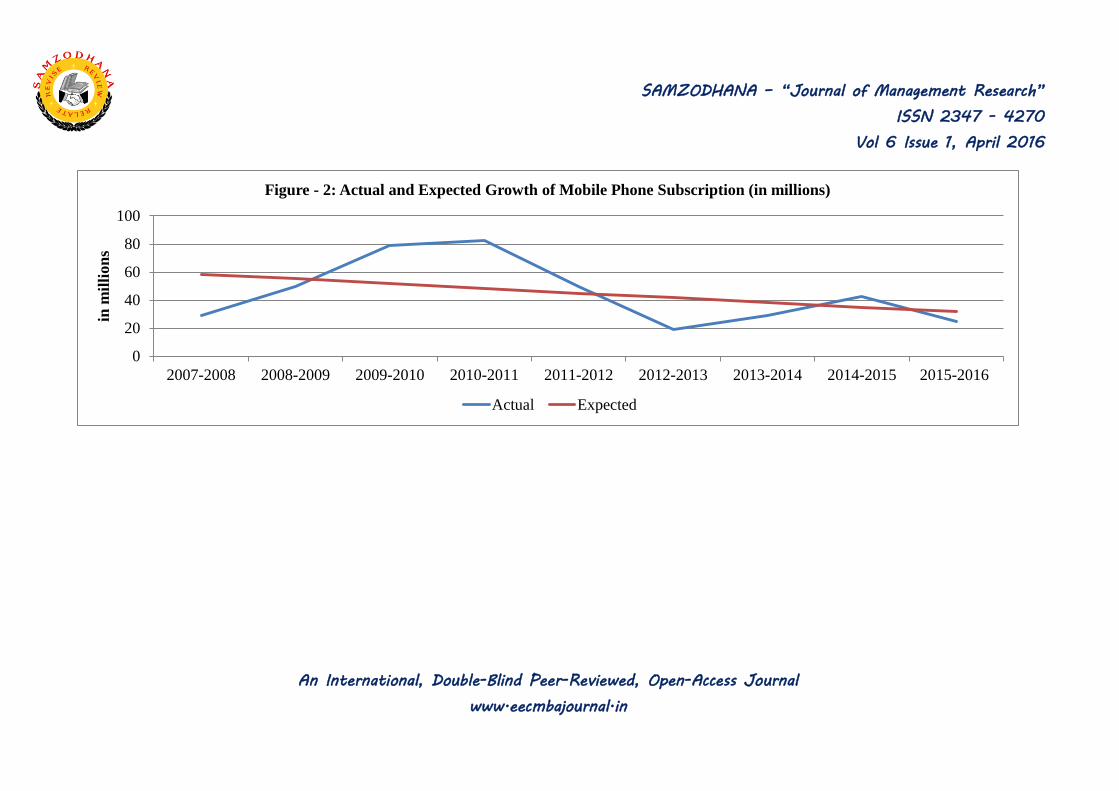
minimum growth rate (5.95%) was noticed in the year of 2012-2013. Further, the
comparison of actual growth of additional mobile subscriber base has been increasing
trend compared with its expected growth from 2009-2010 to 2011-2012 and 2014-2015
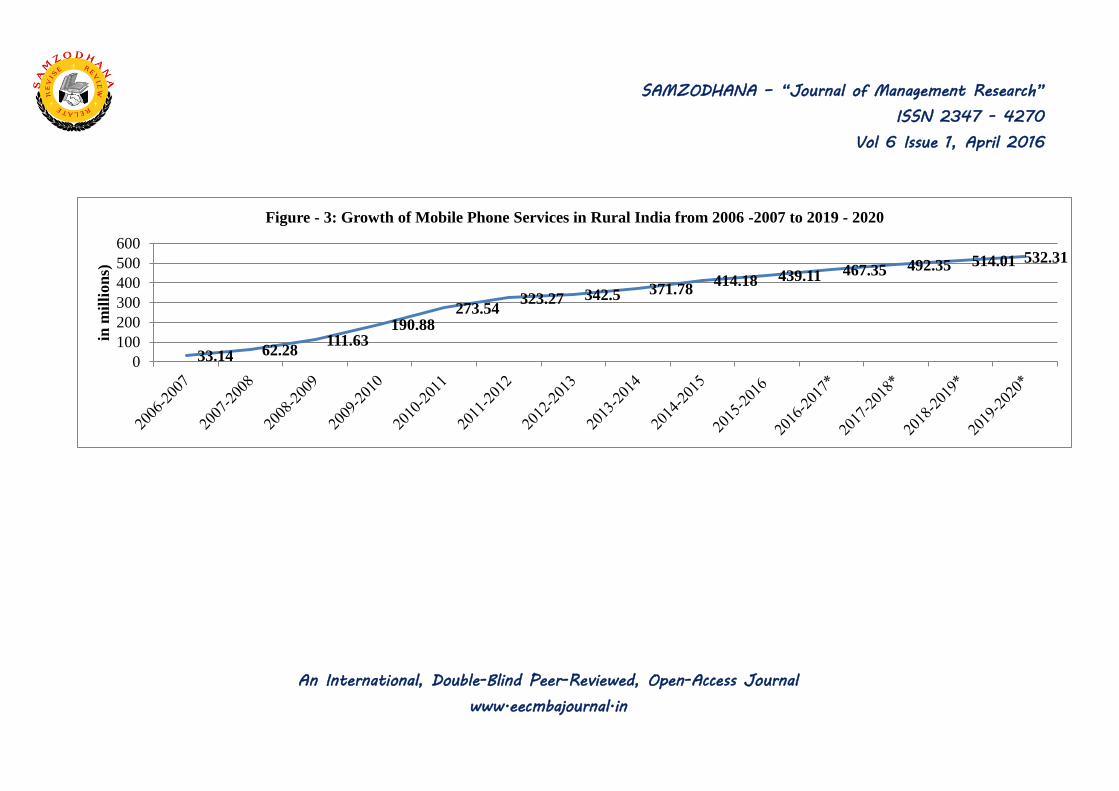
(Refer Figure -2). The growth of mobile phone services with respect to its subscriber base
expected to be 532.31 billion in 2019-2020 with added subscriber of 93.2 million in the
next four years (Refer - 3) with a CAGR of 5% over the year of 2015-2016.
SAMZODHANA – “Journal of Management Research”
ISSN 2347 - 4270
Vol 6 Issue 1, April 2016
An International, Double-Blind Peer-Reviewed, Open-Access Journal
www.eecmbajournal.in
0
20
40
60
80
100
2007-2008 2008-2009 2009-2010 2010-2011 2011-2012 2012-2013 2013-2014 2014-2015 2015-2016
in m
illi
on
s
Figure - 2: Actual and Expected Growth of Mobile Phone Subscription (in millions)
Actual Expected
SAMZODHANA – “Journal of Management Research”
ISSN 2347 - 4270
Vol 6 Issue 1, April 2016
An International, Double-Blind Peer-Reviewed, Open-Access Journal
www.eecmbajournal.in
33.14 62.28 111.63
190.88 273.54
323.27 342.5 371.78 414.18 439.11 467.35 492.35 514.01 532.31
0
100
200
300
400
500
600
in m
illi
on
s)
Figure - 3: Growth of Mobile Phone Services in Rural India from 2006 -2007 to 2019 - 2020
SAMZODHANA – “Journal of Management Research”
ISSN 2347 - 4270
Vol 6 Issue 1, April 2016
An International, Double-Blind Peer-Reviewed, Open-Access Journal
www.eecmbajournal.in 98
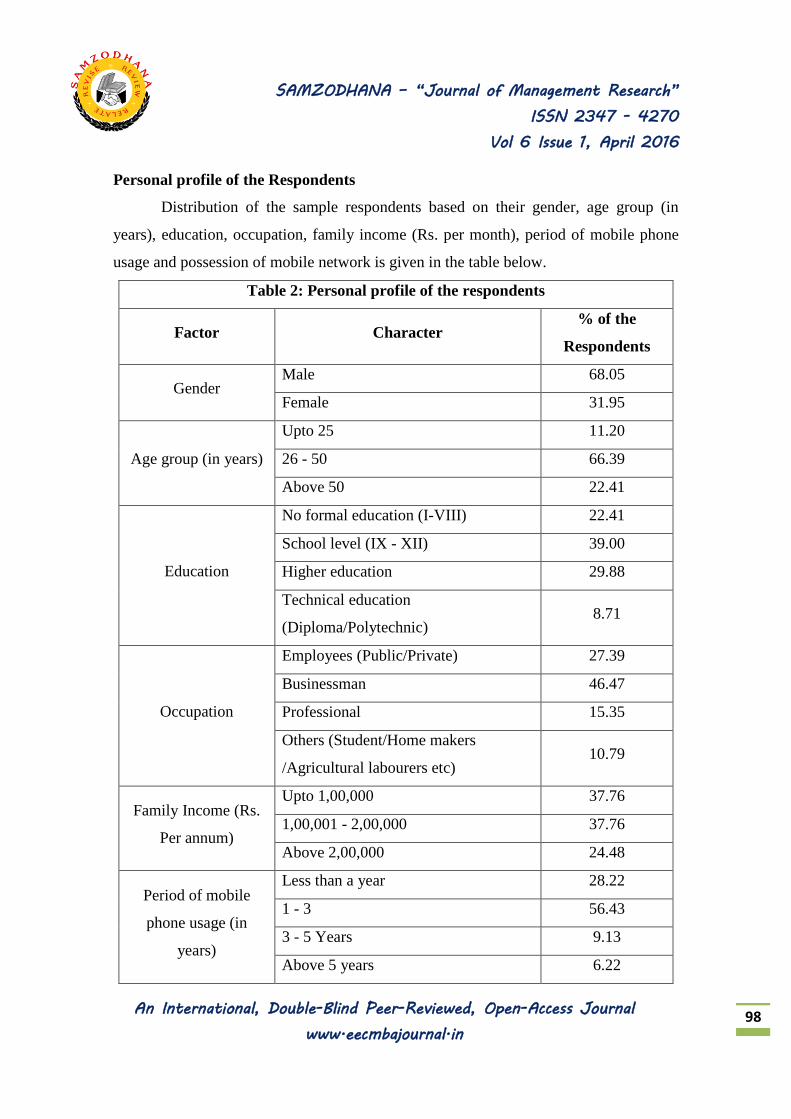
Personal profile of the Respondents
Distribution of the sample respondents based on their gender, age group (in
years), education, occupation, family income (Rs. per month), period of mobile phone
usage and possession of mobile network is given in the table below.
Table 2: Personal profile of the respondents
Factor Character % of the
Respondents
Gender Male 68.05
Female 31.95
Age group (in years)
Upto 25 11.20
26 - 50 66.39
Above 50 22.41
Education
No formal education (I-VIII) 22.41
School level (IX - XII) 39.00
Higher education 29.88
Technical education
(Diploma/Polytechnic) 8.71
Occupation
Employees (Public/Private) 27.39
Businessman 46.47
Professional 15.35
Others (Student/Home makers
/Agricultural labourers etc) 10.79
Family Income (Rs.
Per annum)
Upto 1,00,000 37.76
1,00,001 - 2,00,000 37.76
Above 2,00,000 24.48
Period of mobile
phone usage (in
years)
Less than a year 28.22
1 - 3 56.43
3 - 5 Years 9.13
Above 5 years 6.22
SAMZODHANA – “Journal of Management Research”
ISSN 2347 - 4270
Vol 6 Issue 1, April 2016
An International, Double-Blind Peer-Reviewed, Open-Access Journal
www.eecmbajournal.in 99
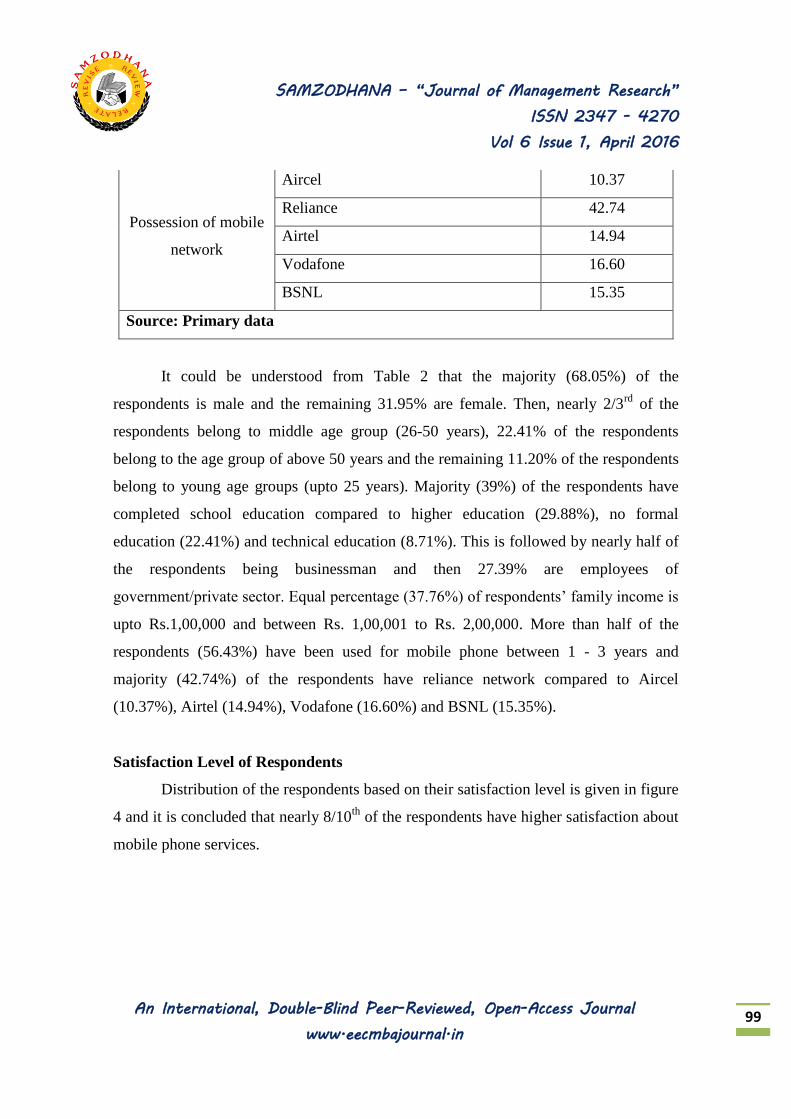
Possession of mobile
network
Aircel 10.37
Reliance 42.74
Airtel 14.94
Vodafone 16.60
BSNL 15.35
Source: Primary data
It could be understood from Table 2 that the majority (68.05%) of the
respondents is male and the remaining 31.95% are female. Then, nearly 2/3rd
of the
respondents belong to middle age group (26-50 years), 22.41% of the respondents
belong to the age group of above 50 years and the remaining 11.20% of the respondents
belong to young age groups (upto 25 years). Majority (39%) of the respondents have
completed school education compared to higher education (29.88%), no formal
education (22.41%) and technical education (8.71%). This is followed by nearly half of
the respondents being businessman and then 27.39% are employees of
government/private sector. Equal percentage (37.76%) of respondents’ family income is
upto Rs.1,00,000 and between Rs. 1,00,001 to Rs. 2,00,000. More than half of the
respondents (56.43%) have been used for mobile phone between 1 - 3 years and
majority (42.74%) of the respondents have reliance network compared to Aircel
(10.37%), Airtel (14.94%), Vodafone (16.60%) and BSNL (15.35%).
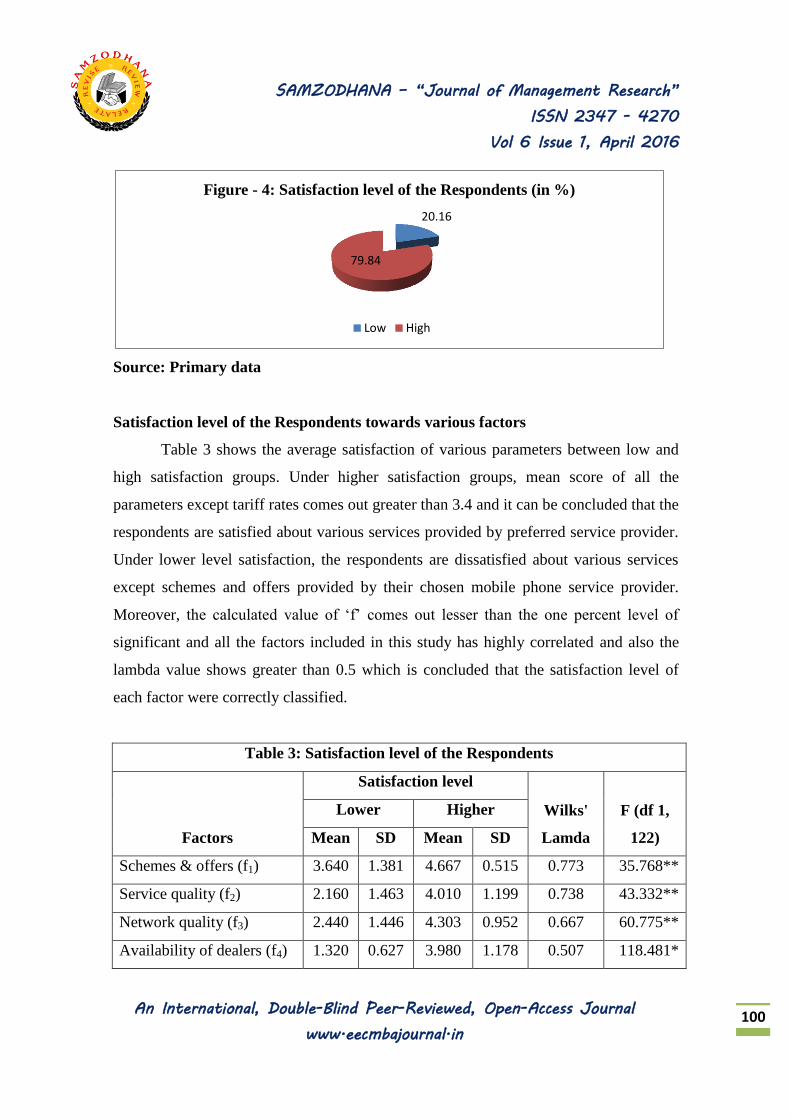
Satisfaction Level of Respondents
Distribution of the respondents based on their satisfaction level is given in figure
4 and it is concluded that nearly 8/10th
of the respondents have higher satisfaction about
mobile phone services.
SAMZODHANA – “Journal of Management Research”
ISSN 2347 - 4270
Vol 6 Issue 1, April 2016
An International, Double-Blind Peer-Reviewed, Open-Access Journal
www.eecmbajournal.in 100
Source: Primary data
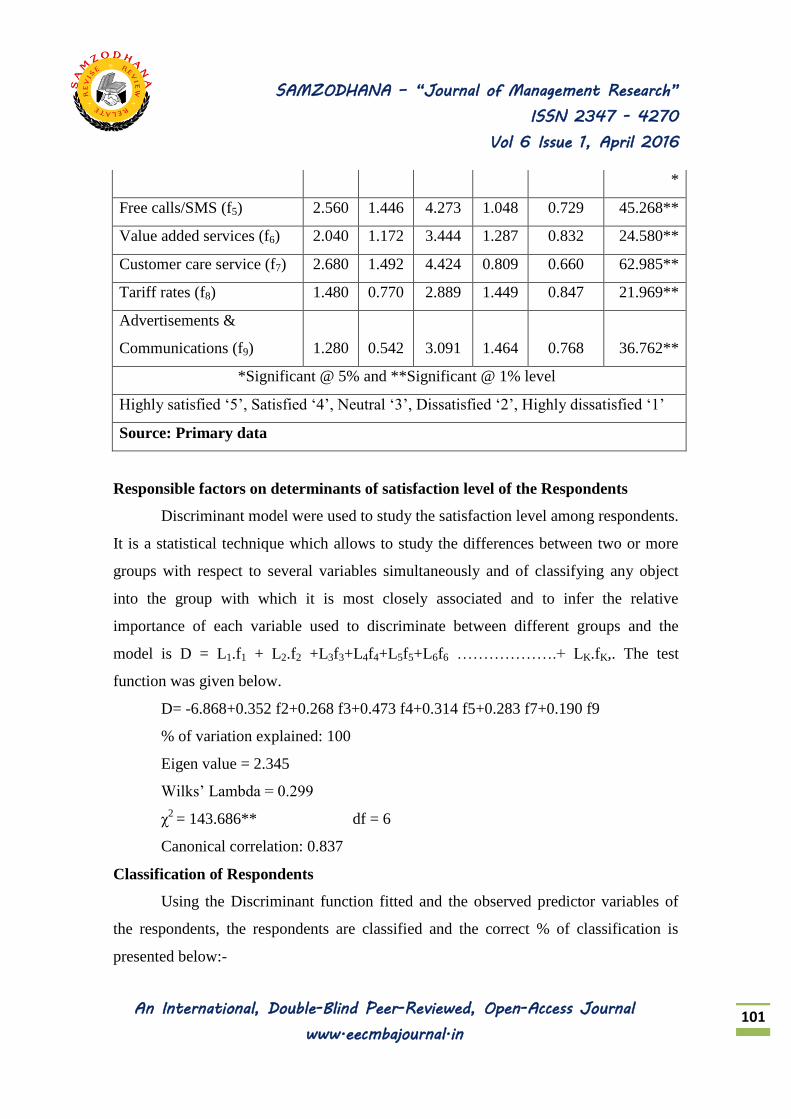
Satisfaction level of the Respondents towards various factors
Table 3 shows the average satisfaction of various parameters between low and
high satisfaction groups. Under higher satisfaction groups, mean score of all the
parameters except tariff rates comes out greater than 3.4 and it can be concluded that the
respondents are satisfied about various services provided by preferred service provider.
Under lower level satisfaction, the respondents are dissatisfied about various services
except schemes and offers provided by their chosen mobile phone service provider.
Moreover, the calculated value of ‘f’ comes out lesser than the one percent level of
significant and all the factors included in this study has highly correlated and also the
lambda value shows greater than 0.5 which is concluded that the satisfaction level of
each factor were correctly classified.
Table 3: Satisfaction level of the Respondents
Factors
Satisfaction level
Wilks'
Lamda
F (df 1,
122)
Lower Higher
Mean SD Mean SD
Schemes & offers (f1) 3.640 1.381 4.667 0.515 0.773 35.768**
Service quality (f2) 2.160 1.463 4.010 1.199 0.738 43.332**
Network quality (f3) 2.440 1.446 4.303 0.952 0.667 60.775**
Availability of dealers (f4) 1.320 0.627 3.980 1.178 0.507 118.481*
20.16
79.84
Figure - 4: Satisfaction level of the Respondents (in %)
Low High
SAMZODHANA – “Journal of Management Research”
ISSN 2347 - 4270
Vol 6 Issue 1, April 2016
An International, Double-Blind Peer-Reviewed, Open-Access Journal
www.eecmbajournal.in 101
*
Free calls/SMS (f5) 2.560 1.446 4.273 1.048 0.729 45.268**
Value added services (f6) 2.040 1.172 3.444 1.287 0.832 24.580**
Customer care service (f7) 2.680 1.492 4.424 0.809 0.660 62.985**
Tariff rates (f8) 1.480 0.770 2.889 1.449 0.847 21.969**
Advertisements &
Communications (f9) 1.280 0.542 3.091 1.464 0.768 36.762**
*Significant @ 5% and **Significant @ 1% level
Highly satisfied ‘5’, Satisfied ‘4’, Neutral ‘3’, Dissatisfied ‘2’, Highly dissatisfied ‘1’
Source: Primary data
Responsible factors on determinants of satisfaction level of the Respondents
Discriminant model were used to study the satisfaction level among respondents.
It is a statistical technique which allows to study the differences between two or more
groups with respect to several variables simultaneously and of classifying any object
into the group with which it is most closely associated and to infer the relative
importance of each variable used to discriminate between different groups and the
model is D = L1.f1 + L2.f2 +L3f3+L4f4+L5f5+L6f6 ……………….+ LK.fK,. The test
function was given below.
D= -6.868+0.352 f2+0.268 f3+0.473 f4+0.314 f5+0.283 f7+0.190 f9
% of variation explained: 100
Eigen value = 2.345
Wilks’ Lambda = 0.299
χ2
= 143.686** df = 6
Canonical correlation: 0.837
Classification of Respondents
Using the Discriminant function fitted and the observed predictor variables of
the respondents, the respondents are classified and the correct % of classification is
presented below:-
SAMZODHANA – “Journal of Management Research”
ISSN 2347 - 4270
Vol 6 Issue 1, April 2016
An International, Double-Blind Peer-Reviewed, Open-Access Journal
www.eecmbajournal.in 102
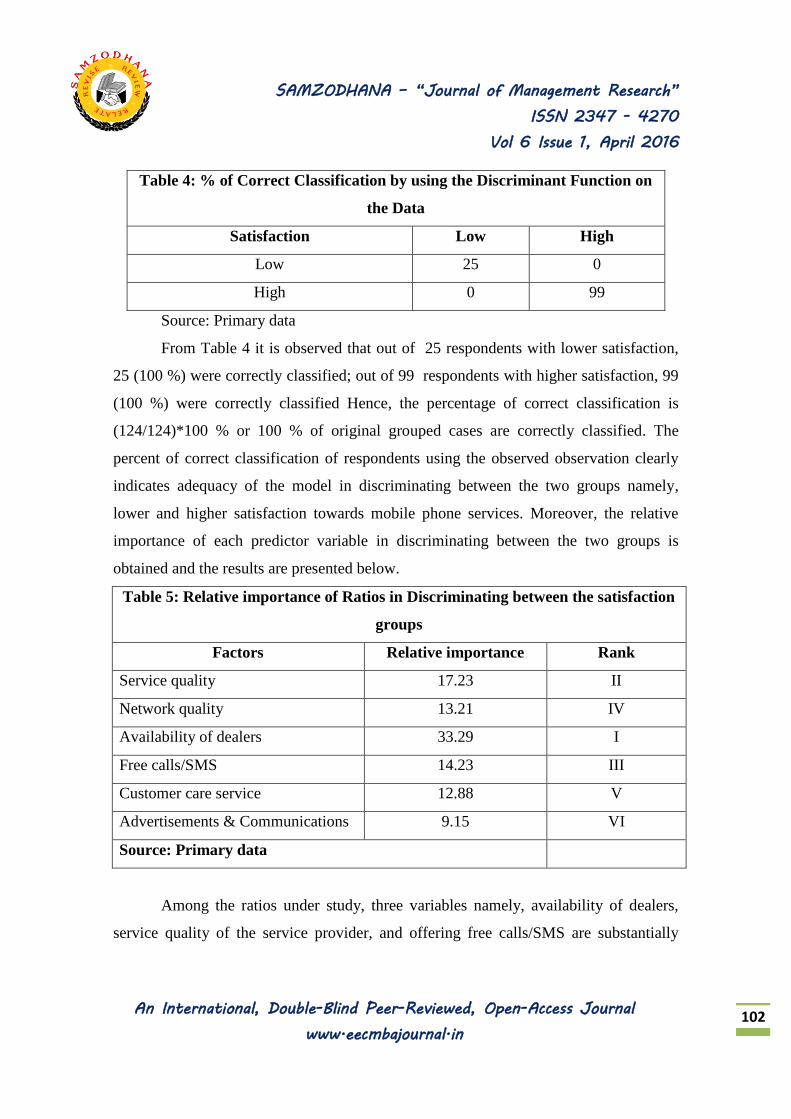
Table 4: % of Correct Classification by using the Discriminant Function on
the Data
Satisfaction Low High
Low 25 0
High 0 99
Source: Primary data
From Table 4 it is observed that out of 25 respondents with lower satisfaction,
25 (100 %) were correctly classified; out of 99 respondents with higher satisfaction, 99
(100 %) were correctly classified Hence, the percentage of correct classification is
(124/124)*100 % or 100 % of original grouped cases are correctly classified. The
percent of correct classification of respondents using the observed observation clearly
indicates adequacy of the model in discriminating between the two groups namely,
lower and higher satisfaction towards mobile phone services. Moreover, the relative
importance of each predictor variable in discriminating between the two groups is
obtained and the results are presented below.
Table 5: Relative importance of Ratios in Discriminating between the satisfaction
groups
Factors Relative importance Rank
Service quality 17.23 II
Network quality 13.21 IV
Availability of dealers 33.29 I
Free calls/SMS 14.23 III
Customer care service 12.88 V
Advertisements & Communications 9.15 VI
Source: Primary data
Among the ratios under study, three variables namely, availability of dealers,
service quality of the service provider, and offering free calls/SMS are substantially
SAMZODHANA – “Journal of Management Research”
ISSN 2347 - 4270
Vol 6 Issue 1, April 2016
An International, Double-Blind Peer-Reviewed, Open-Access Journal
www.eecmbajournal.in 103
important factors, in discriminating between groups of respondents namely with lower
satisfaction and with higher satisfaction.
Relationship of personal profile of the respondents and satisfaction level –
Application of chi-square analysis
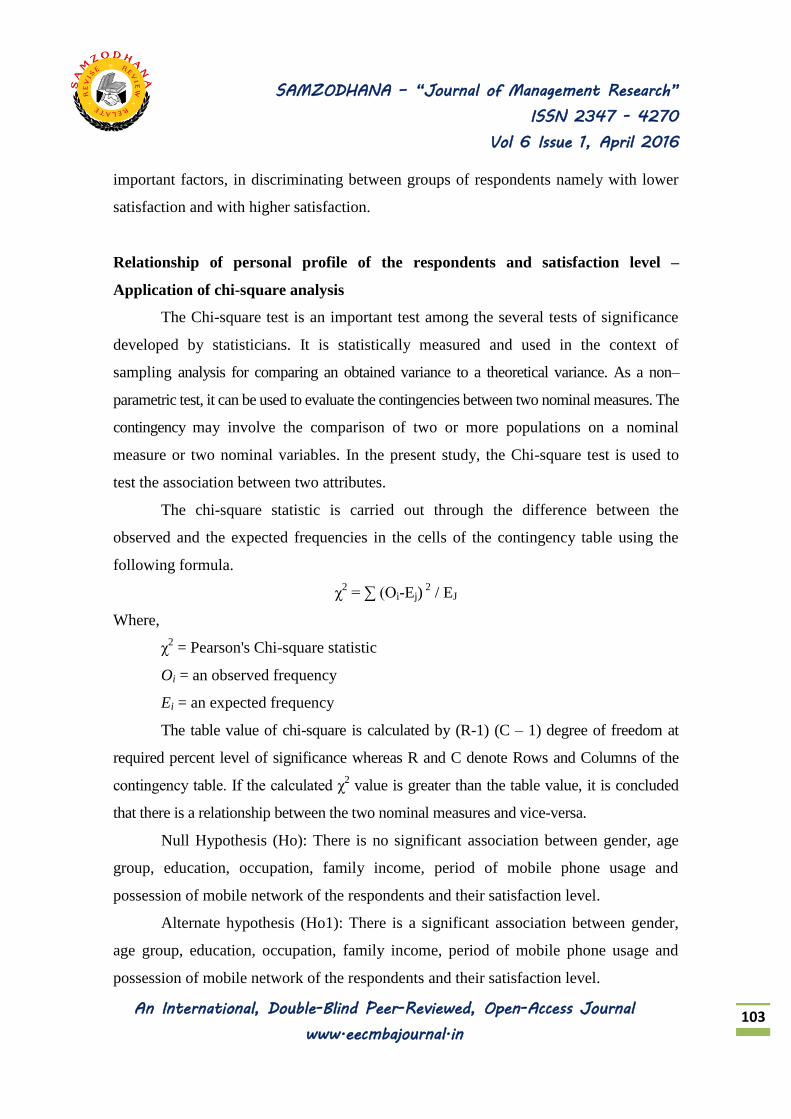
The Chi-square test is an important test among the several tests of significance
developed by statisticians. It is statistically measured and used in the context of
sampling analysis for comparing an obtained variance to a theoretical variance. As a non–
parametric test, it can be used to evaluate the contingencies between two nominal measures. The
contingency may involve the comparison of two or more populations on a nominal
measure or two nominal variables. In the present study, the Chi-square test is used to
test the association between two attributes.
The chi-square statistic is carried out through the difference between the
observed and the expected frequencies in the cells of the contingency table using the
following formula.
χ2 = ∑ (Oi-Ej)
2 / EJ
Where,
χ2 = Pearson's Chi-square statistic
Oi = an observed frequency
Ei = an expected frequency
The table value of chi-square is calculated by (R-1) (C – 1) degree of freedom at
required percent level of significance whereas R and C denote Rows and Columns of the
contingency table. If the calculated χ2 value is greater than the table value, it is concluded
that there is a relationship between the two nominal measures and vice-versa.
Null Hypothesis (Ho): There is no significant association between gender, age
group, education, occupation, family income, period of mobile phone usage and
possession of mobile network of the respondents and their satisfaction level.
Alternate hypothesis (Ho1): There is a significant association between gender,
age group, education, occupation, family income, period of mobile phone usage and
possession of mobile network of the respondents and their satisfaction level.
SAMZODHANA – “Journal of Management Research”
ISSN 2347 - 4270
Vol 6 Issue 1, April 2016
An International, Double-Blind Peer-Reviewed, Open-Access Journal
www.eecmbajournal.in 104
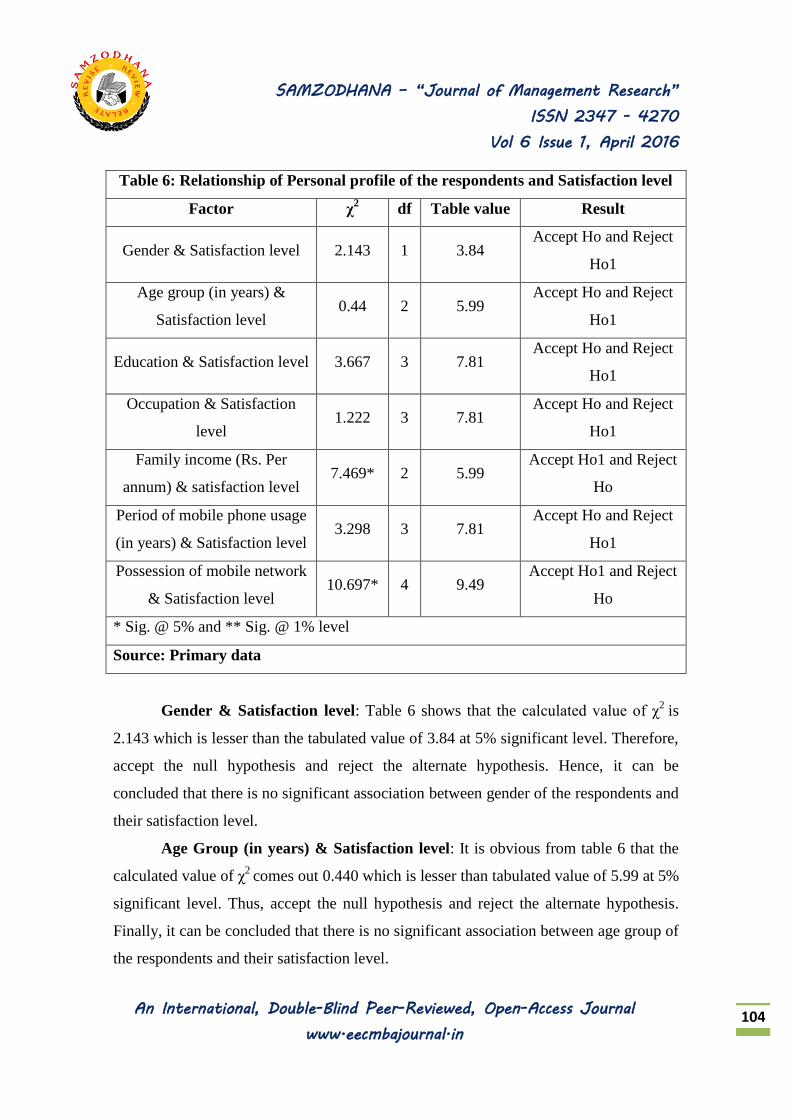
Table 6: Relationship of Personal profile of the respondents and Satisfaction level
Factor χ2 df Table value Result
Gender & Satisfaction level 2.143 1 3.84 Accept Ho and Reject
Ho1
Age group (in years) &
Satisfaction level 0.44 2 5.99
Accept Ho and Reject
Ho1
Education & Satisfaction level 3.667 3 7.81 Accept Ho and Reject
Ho1
Occupation & Satisfaction
level 1.222 3 7.81
Accept Ho and Reject
Ho1
Family income (Rs. Per
annum) & satisfaction level 7.469* 2 5.99
Accept Ho1 and Reject
Ho
Period of mobile phone usage
(in years) & Satisfaction level 3.298 3 7.81
Accept Ho and Reject
Ho1
Possession of mobile network
& Satisfaction level 10.697* 4 9.49
Accept Ho1 and Reject
Ho
* Sig. @ 5% and ** Sig. @ 1% level
Source: Primary data
Gender & Satisfaction level: Table 6 shows that the calculated value of χ2
is
2.143 which is lesser than the tabulated value of 3.84 at 5% significant level. Therefore,
accept the null hypothesis and reject the alternate hypothesis. Hence, it can be
concluded that there is no significant association between gender of the respondents and
their satisfaction level.
Age Group (in years) & Satisfaction level: It is obvious from table 6 that the
calculated value of χ2
comes out 0.440 which is lesser than tabulated value of 5.99 at 5%
significant level. Thus, accept the null hypothesis and reject the alternate hypothesis.
Finally, it can be concluded that there is no significant association between age group of
the respondents and their satisfaction level.
SAMZODHANA – “Journal of Management Research”
ISSN 2347 - 4270
Vol 6 Issue 1, April 2016
An International, Double-Blind Peer-Reviewed, Open-Access Journal
www.eecmbajournal.in 105
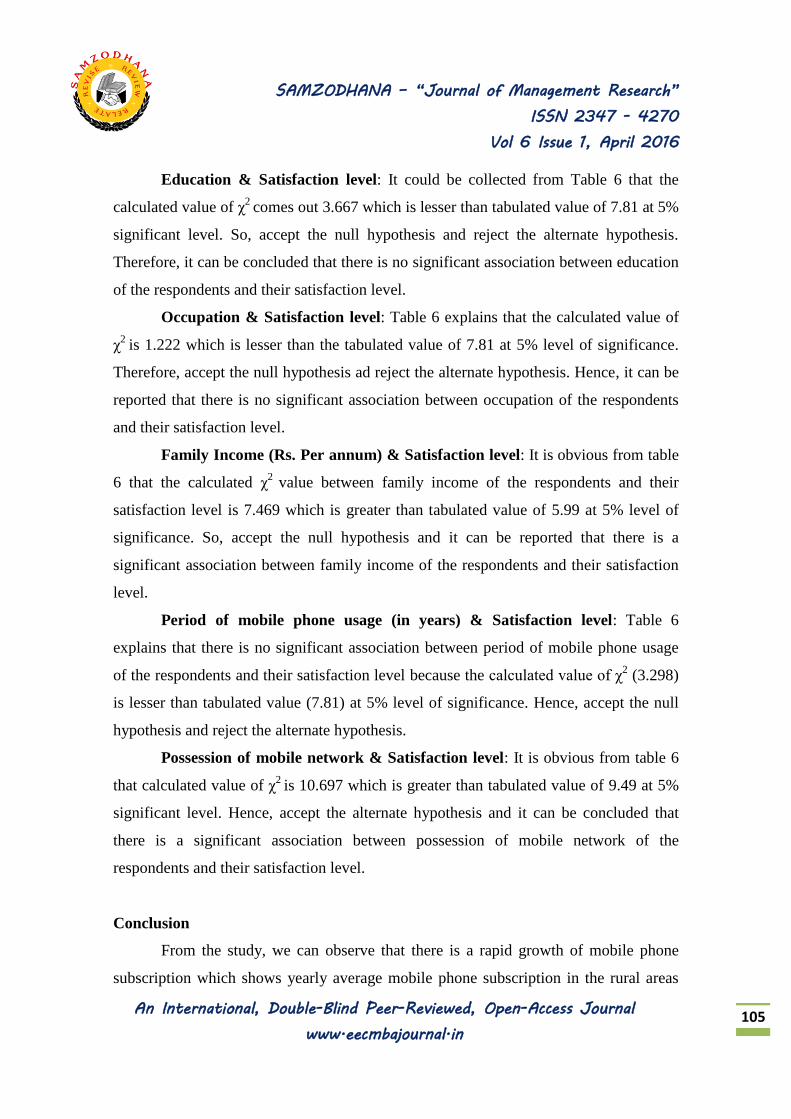
Education & Satisfaction level: It could be collected from Table 6 that the
calculated value of χ2
comes out 3.667 which is lesser than tabulated value of 7.81 at 5%
significant level. So, accept the null hypothesis and reject the alternate hypothesis.
Therefore, it can be concluded that there is no significant association between education
of the respondents and their satisfaction level.
Occupation & Satisfaction level: Table 6 explains that the calculated value of
χ2
is 1.222 which is lesser than the tabulated value of 7.81 at 5% level of significance.
Therefore, accept the null hypothesis ad reject the alternate hypothesis. Hence, it can be
reported that there is no significant association between occupation of the respondents
and their satisfaction level.
Family Income (Rs. Per annum) & Satisfaction level: It is obvious from table
6 that the calculated χ2
value between family income of the respondents and their
satisfaction level is 7.469 which is greater than tabulated value of 5.99 at 5% level of
significance. So, accept the null hypothesis and it can be reported that there is a
significant association between family income of the respondents and their satisfaction
level.
Period of mobile phone usage (in years) & Satisfaction level: Table 6
explains that there is no significant association between period of mobile phone usage
of the respondents and their satisfaction level because the calculated value of χ2 (3.298)
is lesser than tabulated value (7.81) at 5% level of significance. Hence, accept the null
hypothesis and reject the alternate hypothesis.
Possession of mobile network & Satisfaction level: It is obvious from table 6
that calculated value of χ2
is 10.697 which is greater than tabulated value of 9.49 at 5%
significant level. Hence, accept the alternate hypothesis and it can be concluded that
there is a significant association between possession of mobile network of the
respondents and their satisfaction level.
Conclusion
From the study, we can observe that there is a rapid growth of mobile phone
subscription which shows yearly average mobile phone subscription in the rural areas
SAMZODHANA – “Journal of Management Research”
ISSN 2347 - 4270
Vol 6 Issue 1, April 2016
An International, Double-Blind Peer-Reviewed, Open-Access Journal
www.eecmbajournal.in 106
crossed 45 million and totally, mobile phone services with respect to its subscriber base is
expected to be 532.31 billion in 2019-2020 with added subscriber of 93.2 million in
2019-2020. At present, 8/10th
of the mobile phone users in the rural areas are highly
satisfied with their preferred network. Availability of dealers, service quality and free
calls/SMS are substantially important factors on determination of satisfaction level of
the mobile phone users. Finally this study suggested that the Cell phone service
providers should try to reduce service charges for various value added services in order
to retain the existing customers and sustain growth.
References
1. Arvind, M., and Claudia Kubowicz, M., 2013. Exploring switching behavior of
US mobile service customers. Journal of Services Marketing, 27(1), 13 – 24.
2. Chaitanya, V., (2013). What do Indian customers want in a cell phone?
Strategies for network providers and handset manufacturers. International
Journal of Indian Culture and Business Management, 7(3), 384 – 398.
3. Dhevika, V.P.T., Latasri, O.T.V., & Maruthamuthu, S., (2013). A study
on brand switching among cellular network service users in Tiruchirappalli.
International Journals of Marketing and Technology, 3(4), 160-176.
4. Juha, M., (2008). Customers' purchase intentions as a reflection of price
perception. Journal of Product & Brand Management, 17(3), 188 – 196.
5. Nadine, O., (2002). Exploring the Use of the Mobile Phone”, IFIP — The
International Federation for Information Processing. 99, 89-102.
6. Oliver, R. L., (1981). Measurement and evaluation of satisfaction processes in
retail settings. Journal of Retailing, 57(3), 25–48.
7. Ramakrishnan,V., Ramkumar, D., and Thillai Rajan, P., (2008). Perception of
Product Attributes in Brand Switching Behaviour — An Explanation Through
Multidimensional Scaling. Management and Labour Studies, 33(1), 142-156.
8. Revathi, S., and Padmavathy, S., (2005). Preference in cellular service providers
in the post liberalization era. Indian Journal of marketing, 35(2), 6-10.
SAMZODHANA – “Journal of Management Research”
ISSN 2347 - 4270
Vol 6 Issue 1, April 2016
An International, Double-Blind Peer-Reviewed, Open-Access Journal
www.eecmbajournal.in 107
9. Vijay Kumar, R., and Ruthra Priya, P., (2006). Satisfaction derived by the Airtel
subscribers in Coimbatore. Indian Journal of Marketing, 36(1), P.No. 3
10. http://www.e-agriculture.org/mobile-telephony-rural-areas
11. http://www.aspeninstitute.org/policy-work/communications-society/programs-
topic/communications-policy/india/cs-joint-roundtable-co
12. http://www.fao.org/docrep/017/ap738e/ap738e.pdf
13. http://www.business-standard.com/article/economy-policy/almost-68-
households-in-rural-india-have-cell-phones-115070300034_1.html
14. http://www.thehindu.com/business/Industry/rural-india-to-drive-mobile-phone-
market-growth-report/article1118628.ece
15. http://www.gsma.com/connectedwomen/wp-content/uploads/2014/07/Use-of-
Mobile-Financial-Services-Among-Poor-Women-in-Rural-India-and-the-
Philippines.pdf
16. http://www.bsnl.in/opencms/bsnl/BSNL/about_us/company/about_bsnl.html
17. http://www.thehindubusinessline.com/economy/no-difference-in-consumer-
behaviour-in-rural-urban-markets-experts/article7593845.ece
18. www.vodafone.in
19. www.rcom.co.in/
20. www.ideacellular.com
21. www.trai.gov.in