Embed Size (px)
Citation preview
1 Mobility 2030 and beyond_SHOWN.pptx
1
Campinas, October 4th, 2013
E-mobility 2030 Megatrends, technologies and implications for CPFL
Dr. Wolfgang Bernhart, Senior Partner
A Energia na Cidade do Futuro
2 Mobility 2030 and beyond_SHOWN.pptx
2
Contents
A Urban Mobility 2030
B New powertrain technologies
C Battery and fuel cell economics
D New business models in infrastructure provision and connectivity services
3 Mobility 2030 and beyond_SHOWN.pptx
A. Urban Mobility 2030
4 Mobility 2030 and beyond_SHOWN.pptx
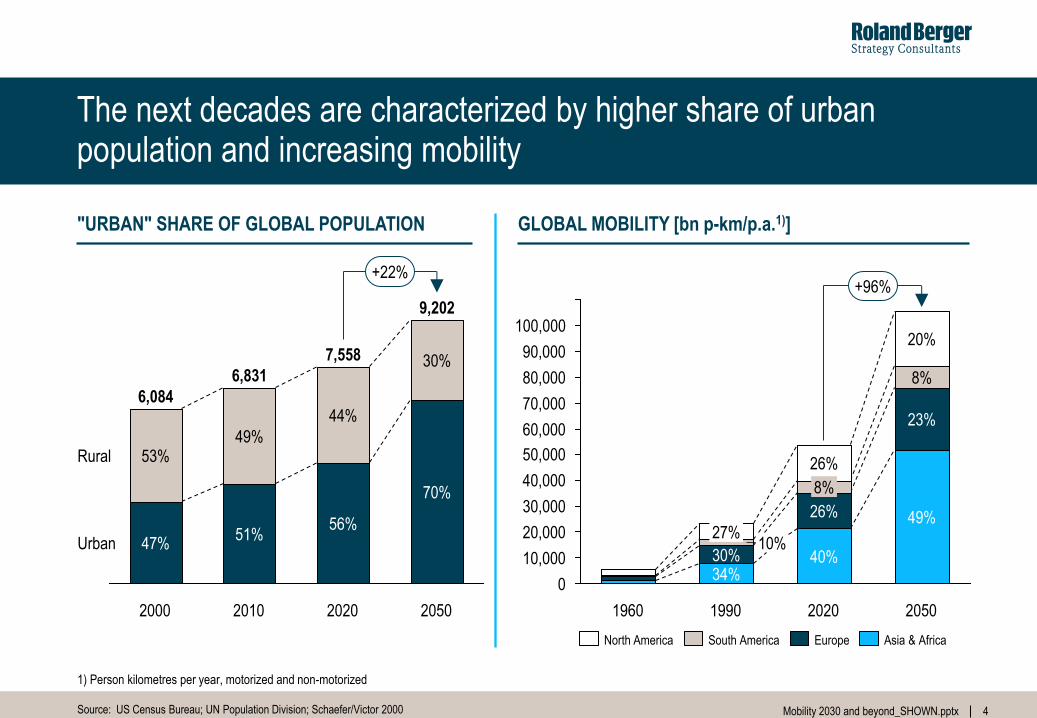
The next decades are characterized by higher share of urban population and increasing mobility
4
1) Person kilometres per year, motorized and non-motorized
Source: US Census Bureau; UN Population Division; Schaefer/Victor 2000
"URBAN" SHARE OF GLOBAL POPULATION GLOBAL MOBILITY [bn p-km/p.a.1)]
70%
30%
2020
7,558
56%
44%
2010
6,831
51%
49%
2000
6,084
+22%
Urban
Rural
2050
9,202
47%
53%
100,000
90,000
80,000
70,000
60,000
50,000
30,000 26%
40% 34%
2020
8%
23%
49%
2050
+96%
40,000
0
30% 10,000
20,000
1990
10% 27%
20%
26%
8%
1960
Asia & Africa Europe South America North America
5 Mobility 2030 and beyond_SHOWN.pptx
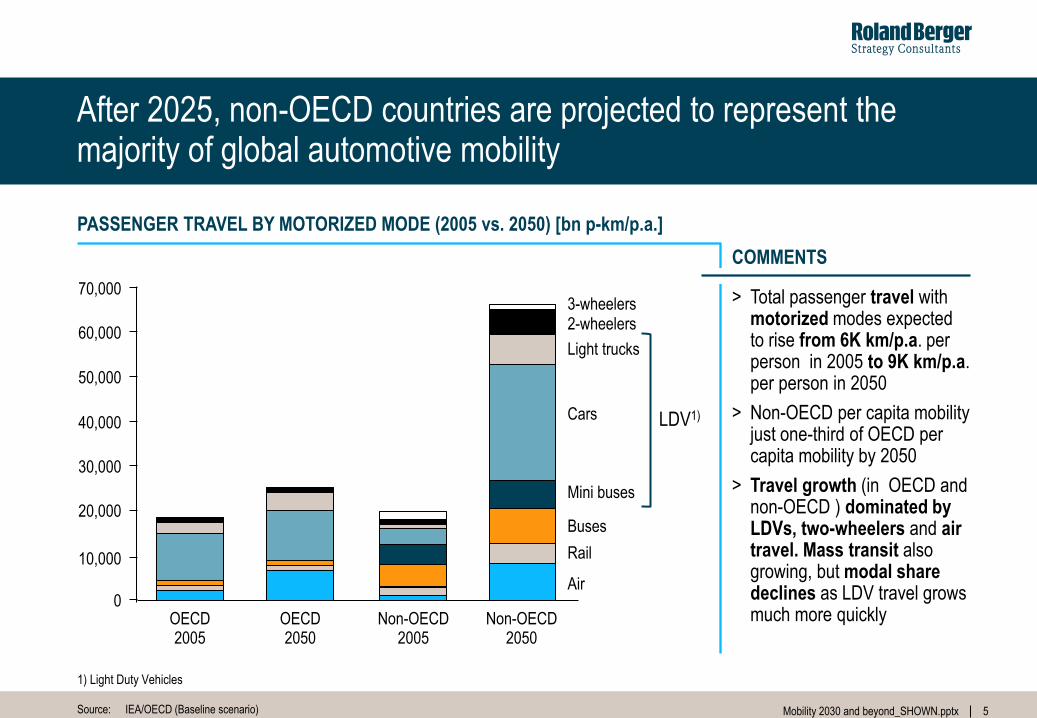
After 2025, non-OECD countries are projected to represent the majority of global automotive mobility
Source: IEA/OECD (Baseline scenario)
> Total passenger travel with motorized modes expected to rise from 6K km/p.a. per person in 2005 to 9K km/p.a. per person in 2050
> Non-OECD per capita mobility just one-third of OECD per capita mobility by 2050
> Travel growth (in OECD and non-OECD ) dominated by LDVs, two-wheelers and air travel. Mass transit also growing, but modal share declines as LDV travel grows much more quickly
COMMENTS
PASSENGER TRAVEL BY MOTORIZED MODE (2005 vs. 2050) [bn p-km/p.a.]
3-wheelers 2-wheelers
Light trucks
Cars
Mini buses
Buses
Rail
Air 0
10,000
20,000
30,000
50,000
60,000
40,000
70,000
OECD 2005
OECD 2050
Non-OECD 2005
Non-OECD 2050
LDV1)
1) Light Duty Vehicles
6 Mobility 2030 and beyond_SHOWN.pptx
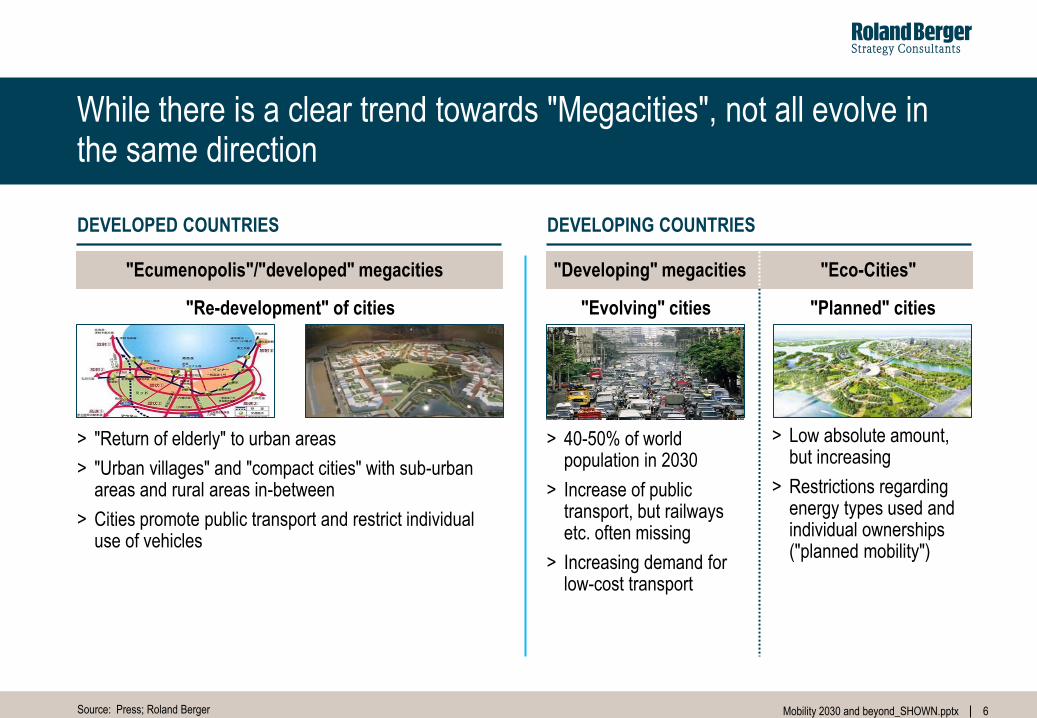
While there is a clear trend towards "Megacities", not all evolve in the same direction
6
Source: Press; Roland Berger
DEVELOPED COUNTRIES DEVELOPING COUNTRIES
"Ecumenopolis"/"developed" megacities "Developing" megacities "Eco-Cities"
"Re-development" of cities
> "Return of elderly" to urban areas
> "Urban villages" and "compact cities" with sub-urban areas and rural areas in-between
> Cities promote public transport and restrict individual use of vehicles
"Evolving" cities "Planned" cities
> 40-50% of world population in 2030
> Increase of public transport, but railways etc. often missing
> Increasing demand for low-cost transport
> Low absolute amount, but increasing
> Restrictions regarding energy types used and individual ownerships ("planned mobility")
7 Mobility 2030 and beyond_SHOWN.pptx
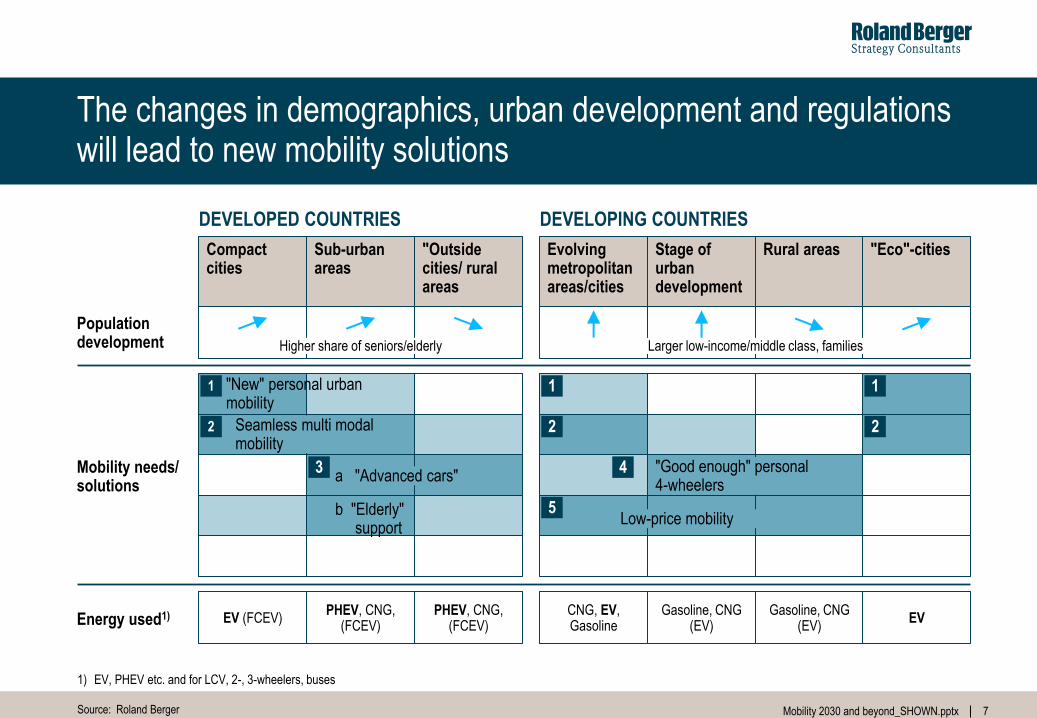
The changes in demographics, urban development and regulations will lead to new mobility solutions
7
Source: Roland Berger
DEVELOPED COUNTRIES DEVELOPING COUNTRIES
Compact cities
Sub-urban areas
"Outside cities/ rural areas
Evolving metropolitan areas/cities
Stage of urban development
Rural areas "Eco"-cities
EV (FCEV) PHEV, CNG,
(FCEV) PHEV, CNG,
(FCEV) CNG, EV, Gasoline
Gasoline, CNG (EV)
Gasoline, CNG (EV)
EV
Population development
Mobility needs/ solutions
Energy used1)
1) EV, PHEV etc. and for LCV, 2-, 3-wheelers, buses
Higher share of seniors/elderly Larger low-income/middle class, families
1
2
3
1
2
5
4
1
2
"New" personal urban mobility
Seamless multi modal mobility
a "Advanced cars"
b "Elderly" support
Low-price mobility
"Good enough" personal 4-wheelers
8 Mobility 2030 and beyond_SHOWN.pptx
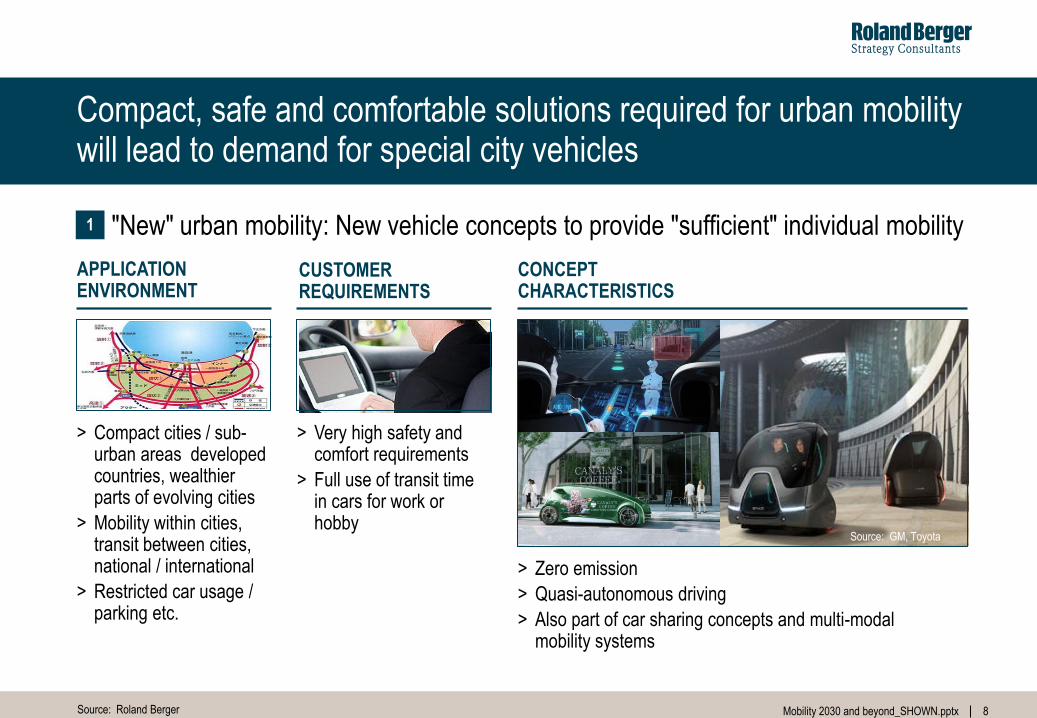
Compact, safe and comfortable solutions required for urban mobility will lead to demand for special city vehicles
8
Source: Roland Berger
"New" urban mobility: New vehicle concepts to provide "sufficient" individual mobility
> Compact cities / sub-urban areas developed countries, wealthier parts of evolving cities
> Mobility within cities, transit between cities, national / international
> Restricted car usage / parking etc.
APPLICATION ENVIRONMENT
CUSTOMER REQUIREMENTS
> Very high safety and comfort requirements
> Full use of transit time in cars for work or hobby
> Zero emission
> Quasi-autonomous driving
> Also part of car sharing concepts and multi-modal mobility systems
CONCEPT CHARACTERISTICS
1
Source: GM, Toyota
9 Mobility 2030 and beyond_SHOWN.pptx
Source: Cisco
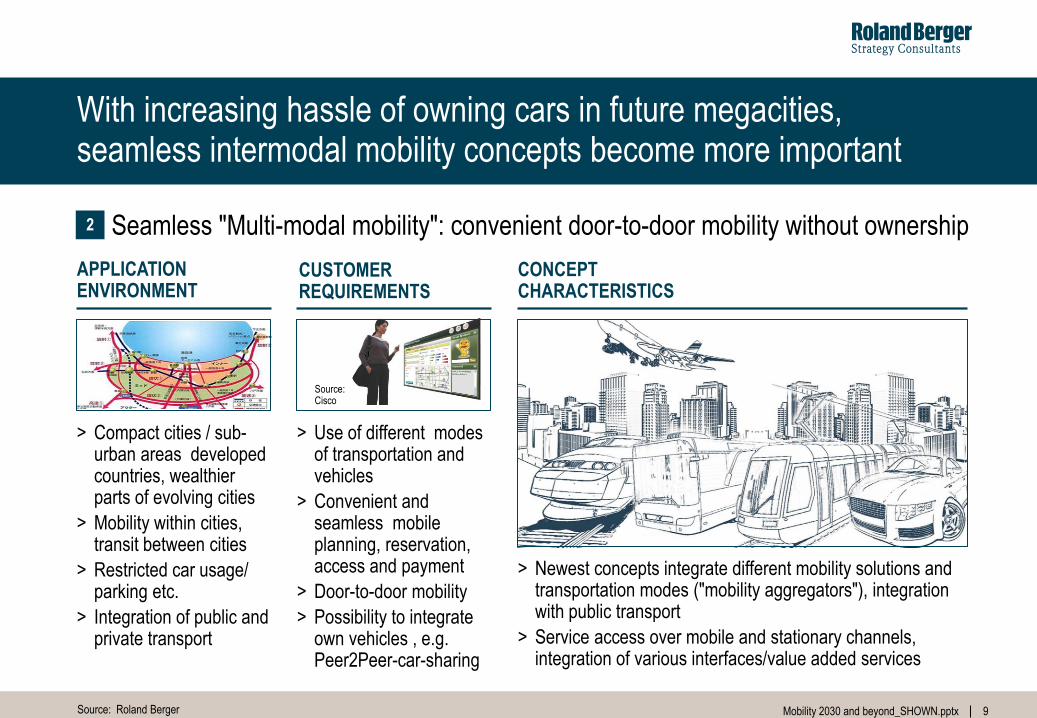
With increasing hassle of owning cars in future megacities, seamless intermodal mobility concepts become more important
9
Source: Roland Berger
Seamless "Multi-modal mobility": convenient door-to-door mobility without ownership
> Compact cities / sub-urban areas developed countries, wealthier parts of evolving cities
> Mobility within cities, transit between cities
> Restricted car usage/ parking etc.
> Integration of public and private transport
> Use of different modes of transportation and vehicles
> Convenient and seamless mobile planning, reservation, access and payment
> Door-to-door mobility
> Possibility to integrate own vehicles , e.g. Peer2Peer-car-sharing
> Newest concepts integrate different mobility solutions and transportation modes ("mobility aggregators"), integration with public transport
> Service access over mobile and stationary channels, integration of various interfaces/value added services
2
APPLICATION ENVIRONMENT
CUSTOMER REQUIREMENTS
CONCEPT CHARACTERISTICS
10 Mobility 2030 and beyond_SHOWN.pptx
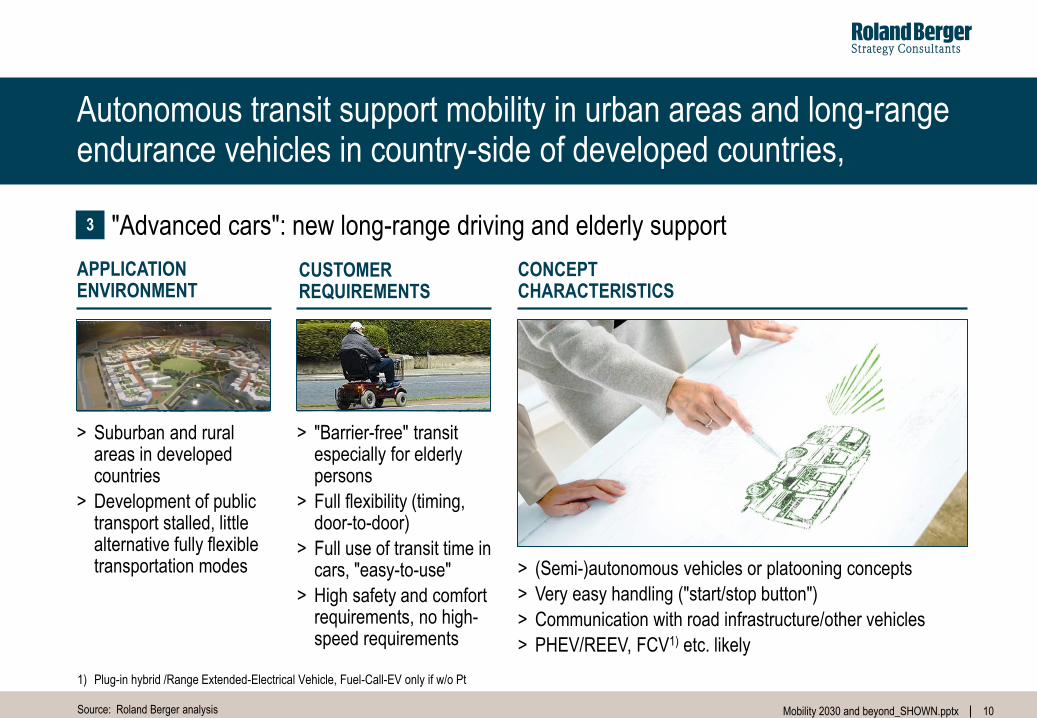
Autonomous transit support mobility in urban areas and long-range endurance vehicles in country-side of developed countries,
10
Source: Roland Berger analysis
"Advanced cars": new long-range driving and elderly support 3
> Suburban and rural areas in developed countries
> Development of public transport stalled, little alternative fully flexible transportation modes
> "Barrier-free" transit especially for elderly persons
> Full flexibility (timing, door-to-door)
> Full use of transit time in cars, "easy-to-use"
> High safety and comfort requirements, no high-speed requirements
> (Semi-)autonomous vehicles or platooning concepts
> Very easy handling ("start/stop button")
> Communication with road infrastructure/other vehicles
> PHEV/REEV, FCV1) etc. likely
APPLICATION ENVIRONMENT
CUSTOMER REQUIREMENTS
CONCEPT CHARACTERISTICS
1) Plug-in hybrid /Range Extended-Electrical Vehicle, Fuel-Call-EV only if w/o Pt
11 Mobility 2030 and beyond_SHOWN.pptx
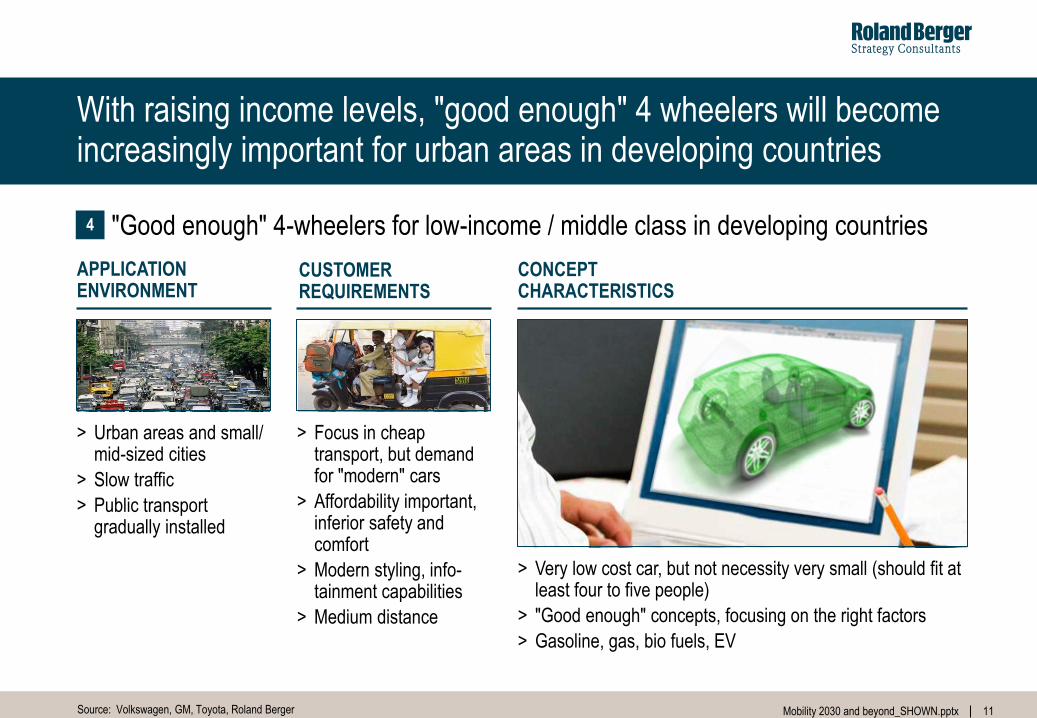
With raising income levels, "good enough" 4 wheelers will become increasingly important for urban areas in developing countries
11
Source: Volkswagen, GM, Toyota, Roland Berger
"Good enough" 4-wheelers for low-income / middle class in developing countries 4
> Urban areas and small/ mid-sized cities
> Slow traffic
> Public transport gradually installed
> Focus in cheap transport, but demand for "modern" cars
> Affordability important, inferior safety and comfort
> Modern styling, info-tainment capabilities
> Medium distance
> Very low cost car, but not necessity very small (should fit at least four to five people)
> "Good enough" concepts, focusing on the right factors
> Gasoline, gas, bio fuels, EV
APPLICATION ENVIRONMENT
CUSTOMER REQUIREMENTS
CONCEPT CHARACTERISTICS
12 Mobility 2030 and beyond_SHOWN.pptx
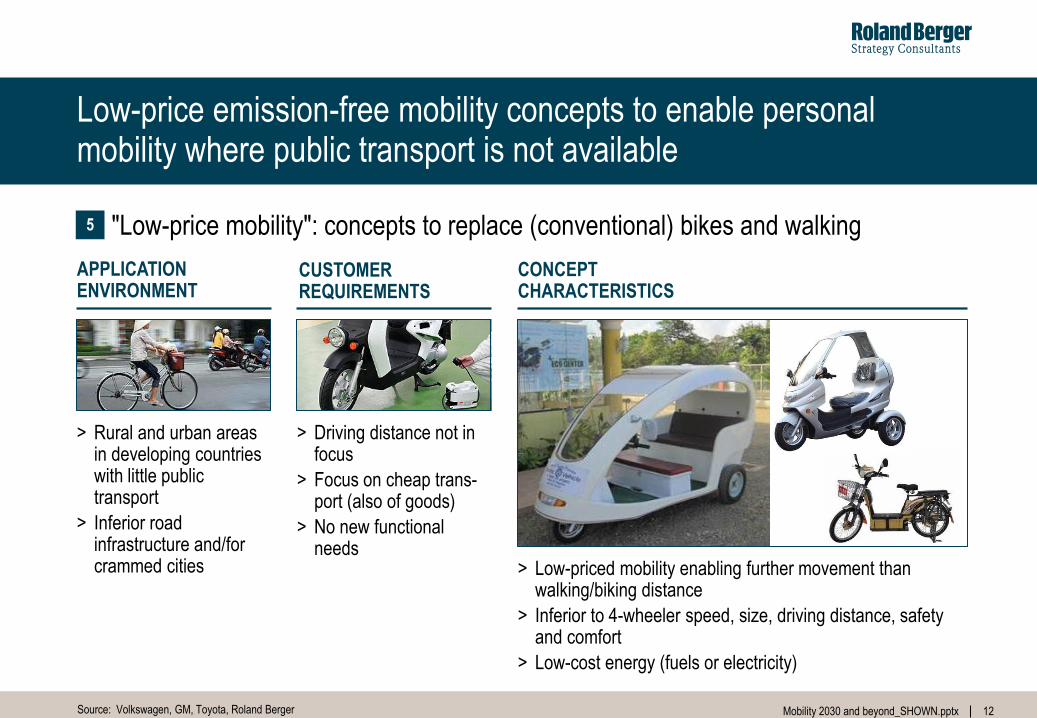
Low-price emission-free mobility concepts to enable personal mobility where public transport is not available
12
Source: Volkswagen, GM, Toyota, Roland Berger
"Low-price mobility": concepts to replace (conventional) bikes and walking 5
> Rural and urban areas in developing countries with little public transport
> Inferior road infrastructure and/for crammed cities
> Driving distance not in focus
> Focus on cheap trans-port (also of goods)
> No new functional needs
> Low-priced mobility enabling further movement than walking/biking distance
> Inferior to 4-wheeler speed, size, driving distance, safety and comfort
> Low-cost energy (fuels or electricity)
APPLICATION ENVIRONMENT
CUSTOMER REQUIREMENTS
CONCEPT CHARACTERISTICS
13 Mobility 2030 and beyond_SHOWN.pptx
B. New powertrain technologies
14 Mobility 2030 and beyond_SHOWN.pptx
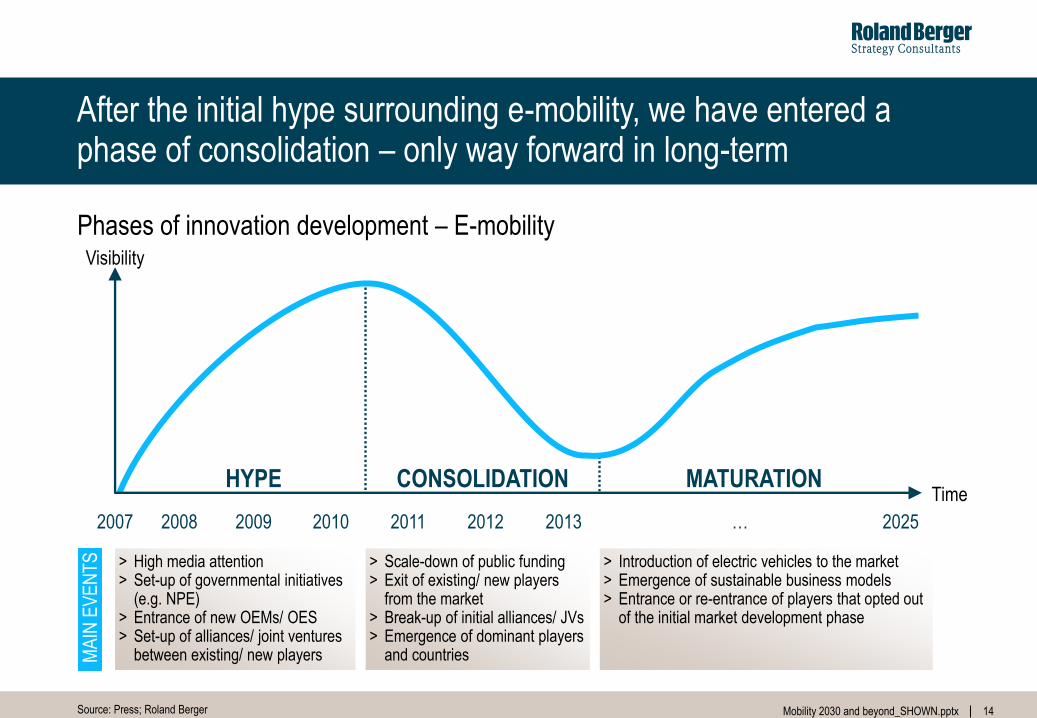
After the initial hype surrounding e-mobility, we have entered a phase of consolidation – only way forward in long-term
14
Phases of innovation development – E-mobility
> High media attention > Set-up of governmental initiatives
(e.g. NPE) > Entrance of new OEMs/ OES > Set-up of alliances/ joint ventures
between existing/ new players
> Scale-down of public funding > Exit of existing/ new players
from the market > Break-up of initial alliances/ JVs > Emergence of dominant players
and countries
> Introduction of electric vehicles to the market > Emergence of sustainable business models > Entrance or re-entrance of players that opted out
of the initial market development phase
MA
IN E
VE
NT
S
Source: Press; Roland Berger
2007 2008 2009 2010 2011 2012 2013 … 2025
HYPE CONSOLIDATION MATURATION Time
Visibility
15 Mobility 2030 and beyond_SHOWN.pptx
15
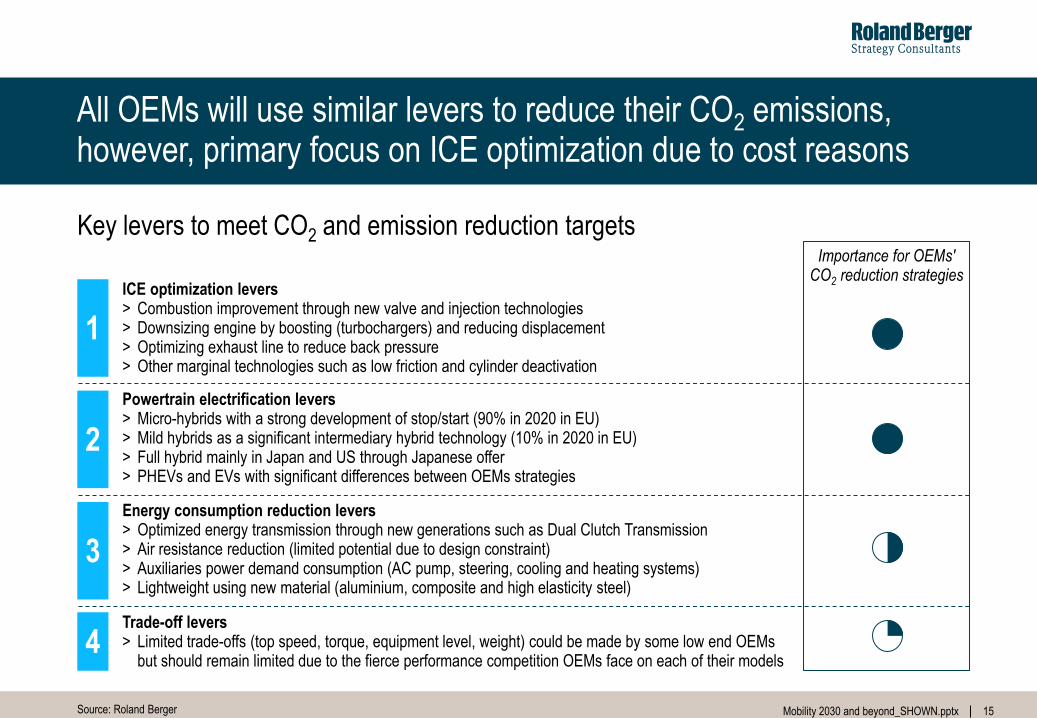
All OEMs will use similar levers to reduce their CO2 emissions, however, primary focus on ICE optimization due to cost reasons
1
2
3
4
Importance for OEMs' CO2 reduction strategies
Key levers to meet CO2 and emission reduction targets
Source: Roland Berger
ICE optimization levers > Combustion improvement through new valve and injection technologies > Downsizing engine by boosting (turbochargers) and reducing displacement > Optimizing exhaust line to reduce back pressure > Other marginal technologies such as low friction and cylinder deactivation
Powertrain electrification levers > Micro-hybrids with a strong development of stop/start (90% in 2020 in EU) > Mild hybrids as a significant intermediary hybrid technology (10% in 2020 in EU) > Full hybrid mainly in Japan and US through Japanese offer > PHEVs and EVs with significant differences between OEMs strategies
Energy consumption reduction levers > Optimized energy transmission through new generations such as Dual Clutch Transmission > Air resistance reduction (limited potential due to design constraint) > Auxiliaries power demand consumption (AC pump, steering, cooling and heating systems) > Lightweight using new material (aluminium, composite and high elasticity steel)
Trade-off levers > Limited trade-offs (top speed, torque, equipment level, weight) could be made by some low end OEMs
but should remain limited due to the fierce performance competition OEMs face on each of their models
16 Mobility 2030 and beyond_SHOWN.pptx
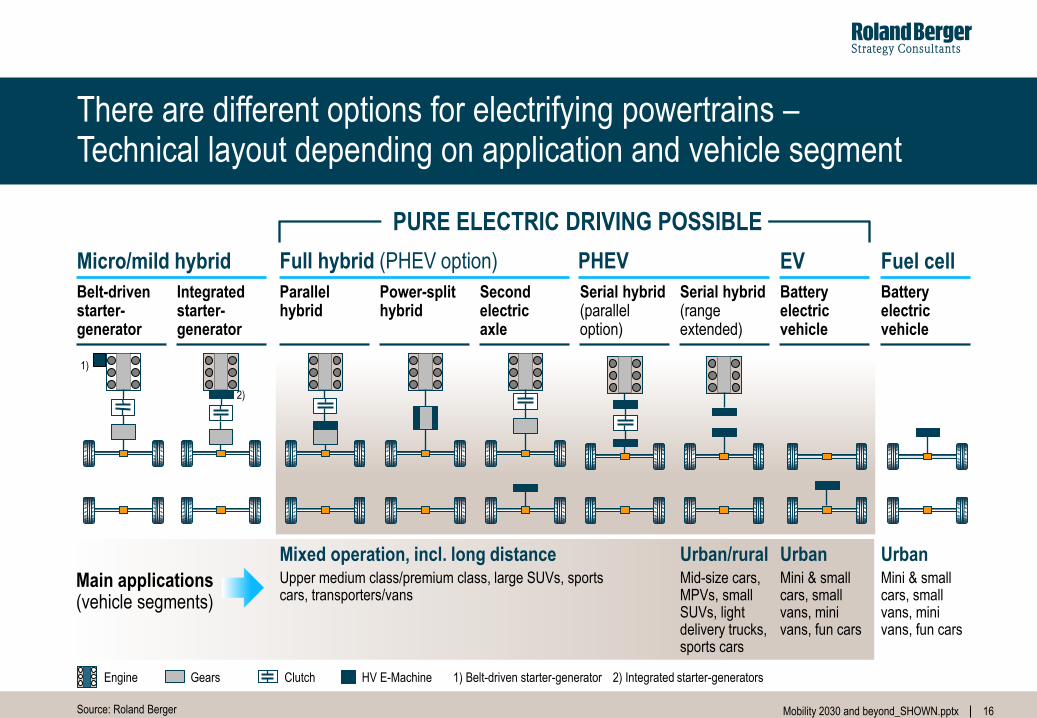
There are different options for electrifying powertrains – Technical layout depending on application and vehicle segment
Engine Gears Clutch HV E-Machine 1) Belt-driven starter-generator 2) Integrated starter-generators
Source: Roland Berger
Micro/mild hybrid
Belt-driven starter-generator
Integrated starter- generator
Full hybrid (PHEV option)
Second electric axle
Serial hybrid (range extended)
Parallel hybrid
Power-split hybrid
Battery electric vehicle
EV
Serial hybrid (parallel option)
PHEV
PURE ELECTRIC DRIVING POSSIBLE
Battery electric vehicle
Fuel cell
1)
2)
Mixed operation, incl. long distance Urban/rural Urban Mini & small cars, small vans, mini vans, fun cars
Mid-size cars, MPVs, small SUVs, light delivery trucks, sports cars
Upper medium class/premium class, large SUVs, sports cars, transporters/vans
Main applications (vehicle segments)
Urban Mini & small cars, small vans, mini vans, fun cars
17 Mobility 2030 and beyond_SHOWN.pptx
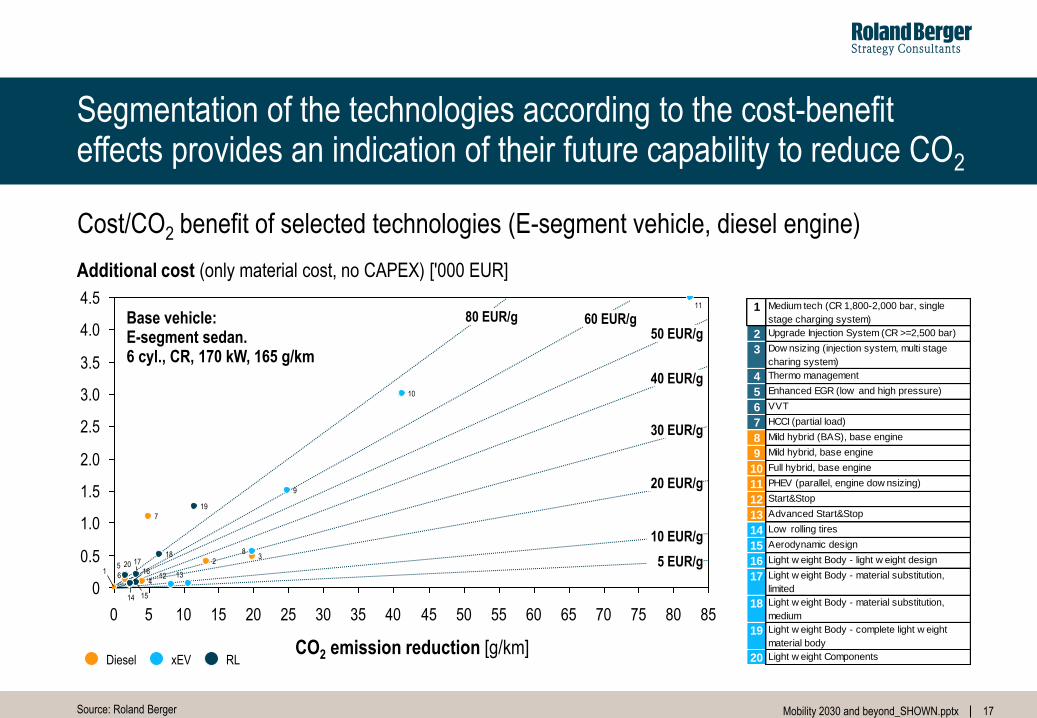
Segmentation of the technologies according to the cost-benefit effects provides an indication of their future capability to reduce CO2
Source: Roland Berger
Additional cost (only material cost, no CAPEX) ['000 EUR]
CO2 emission reduction [g/km]
Base vehicle: E-segment sedan. 6 cyl., CR, 170 kW, 165 g/km
RL xEV Diesel
40 EUR/g
30 EUR/g
20 EUR/g
10 EUR/g
5 EUR/g
50 EUR/g 80 EUR/g 60 EUR/g
60 0 40 75 70 65
3.5
55 50 45
4.5
4.0
3.0
2.5
2.0
1.5
1.0
0.5
0
85 80 35 30 25 20 15 10 5
19
18 17
16
15 14
13 12
20
10
9
8
7
6
11
4
3 2
1 5
1 Medium tech (CR 1,800-2,000 bar, single
stage charging system)
2 Upgrade Injection System (CR >=2,500 bar)
3 Dow nsizing (injection system, multi stage
charing system)
4 Thermo management
5 Enhanced EGR (low and high pressure)
6 VVT
7 HCCI (partial load)
8 Mild hybrid (BAS), base engine
9 Mild hybrid, base engine
10 Full hybrid, base engine
11 PHEV (parallel, engine dow nsizing)
12 Start&Stop
13 Advanced Start&Stop
14 Low rolling tires
15 Aerodynamic design
16 Light w eight Body - light w eight design
17 Light w eight Body - material substitution,
limited
18 Light w eight Body - material substitution,
medium
19 Light w eight Body - complete light w eight
material body
20 Light w eight Components
Cost/CO2 benefit of selected technologies (E-segment vehicle, diesel engine)
18 Mobility 2030 and beyond_SHOWN.pptx
18
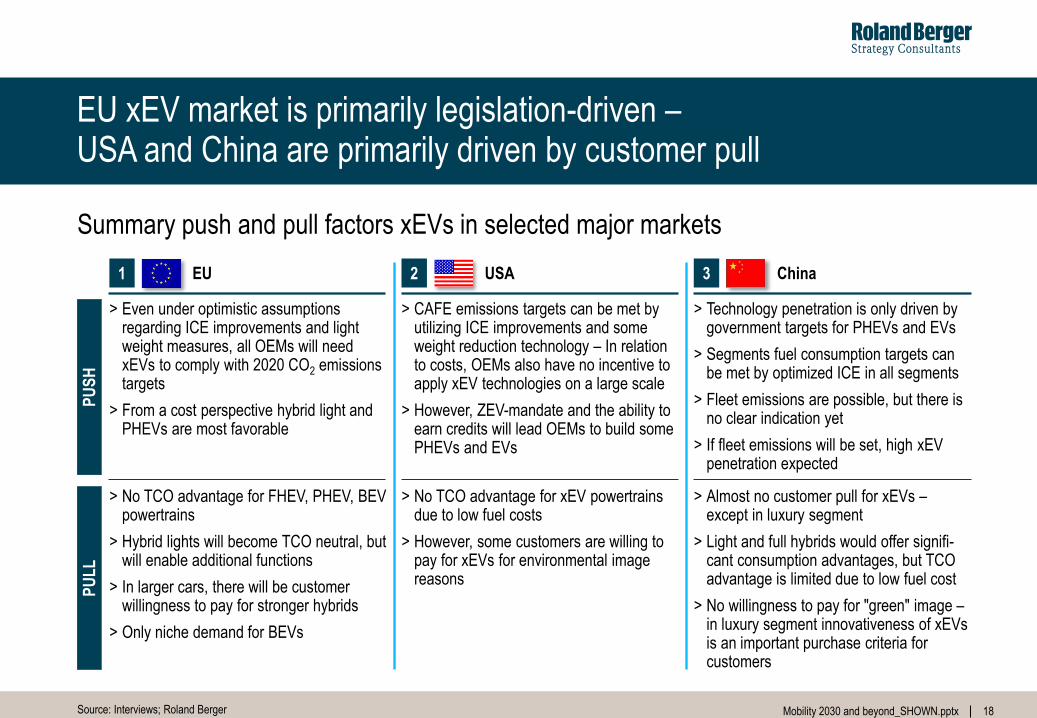
EU xEV market is primarily legislation-driven – USA and China are primarily driven by customer pull
EU 1 USA 2
PU
SH
> Even under optimistic assumptions regarding ICE improvements and light weight measures, all OEMs will need xEVs to comply with 2020 CO2 emissions targets
> From a cost perspective hybrid light and PHEVs are most favorable
> CAFE emissions targets can be met by utilizing ICE improvements and some weight reduction technology – In relation to costs, OEMs also have no incentive to apply xEV technologies on a large scale
> However, ZEV-mandate and the ability to earn credits will lead OEMs to build some PHEVs and EVs
> Technology penetration is only driven by government targets for PHEVs and EVs
> Segments fuel consumption targets can be met by optimized ICE in all segments
> Fleet emissions are possible, but there is no clear indication yet
> If fleet emissions will be set, high xEV penetration expected
China 3
PU
LL
> No TCO advantage for FHEV, PHEV, BEV powertrains
> Hybrid lights will become TCO neutral, but will enable additional functions
> In larger cars, there will be customer willingness to pay for stronger hybrids
> Only niche demand for BEVs
> No TCO advantage for xEV powertrains due to low fuel costs
> However, some customers are willing to pay for xEVs for environmental image reasons
> Almost no customer pull for xEVs – except in luxury segment
> Light and full hybrids would offer signifi-cant consumption advantages, but TCO advantage is limited due to low fuel cost
> No willingness to pay for "green" image – in luxury segment innovativeness of xEVs is an important purchase criteria for customers
Source: Interviews; Roland Berger
Summary push and pull factors xEVs in selected major markets
19 Mobility 2030 and beyond_SHOWN.pptx
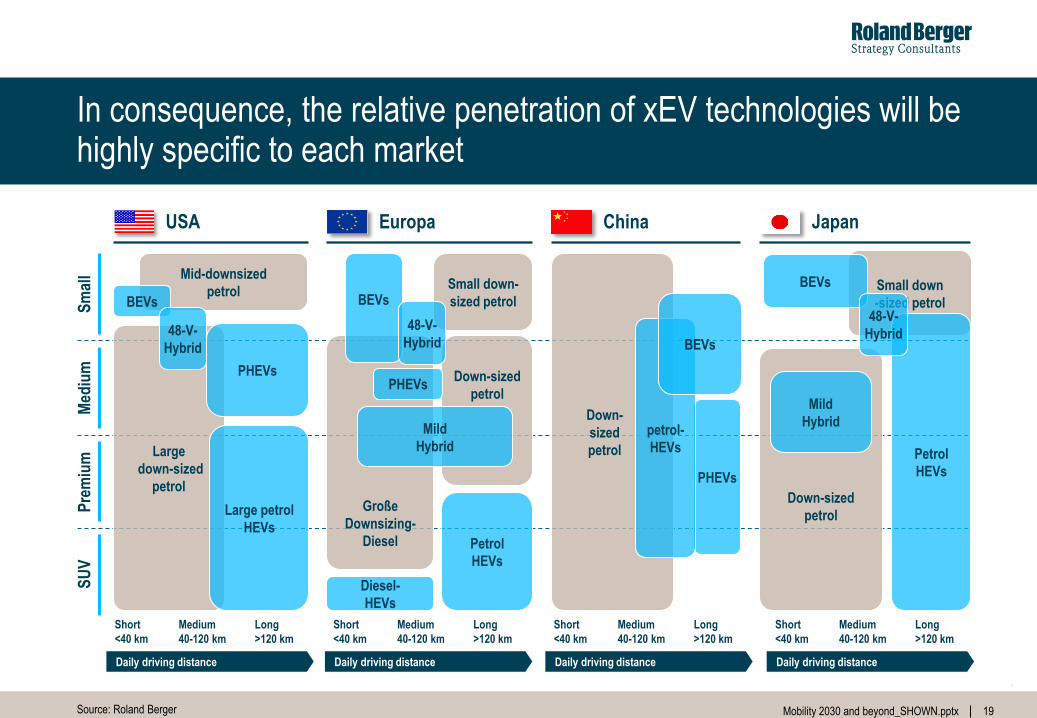
Short
<40 km
Medium
40-120 km
Long
>120 km
19
In consequence, the relative penetration of xEV technologies will be highly specific to each market
USA Japan China Europa
Down-
sized
petrol
Große
Downsizing-
Diesel
Small down-
sized petrol
Down-sized
petrol
Petrol
HEVs
Mild
Hybrid
Diesel-
HEVs
PHEVs
Pre
miu
m
Med
ium
S
UV
S
mal
l
Small down
-sized petrol
Petrol
HEVs
Large
down-sized
petrol
Large petrol
HEVs
PHEVs
Mid-downsized
petrol
Down-sized
petrol
BEVs
Mild
Hybrid
48-V-
Hybrid
Daily driving distance Daily driving distance Daily driving distance Daily driving distance
Short
<40 km
Medium
40-120 km
Long
>120 km
Source: Roland Berger
PHEVs
BEVs
48-V-
Hybrid
petrol-
HEVs
BEVs
BEVs
48-V-
Hybrid
Short
<40 km
Medium
40-120 km
Long
>120 km
Short
<40 km
Medium
40-120 km
Long
>120 km
20 Mobility 2030 and beyond_SHOWN.pptx
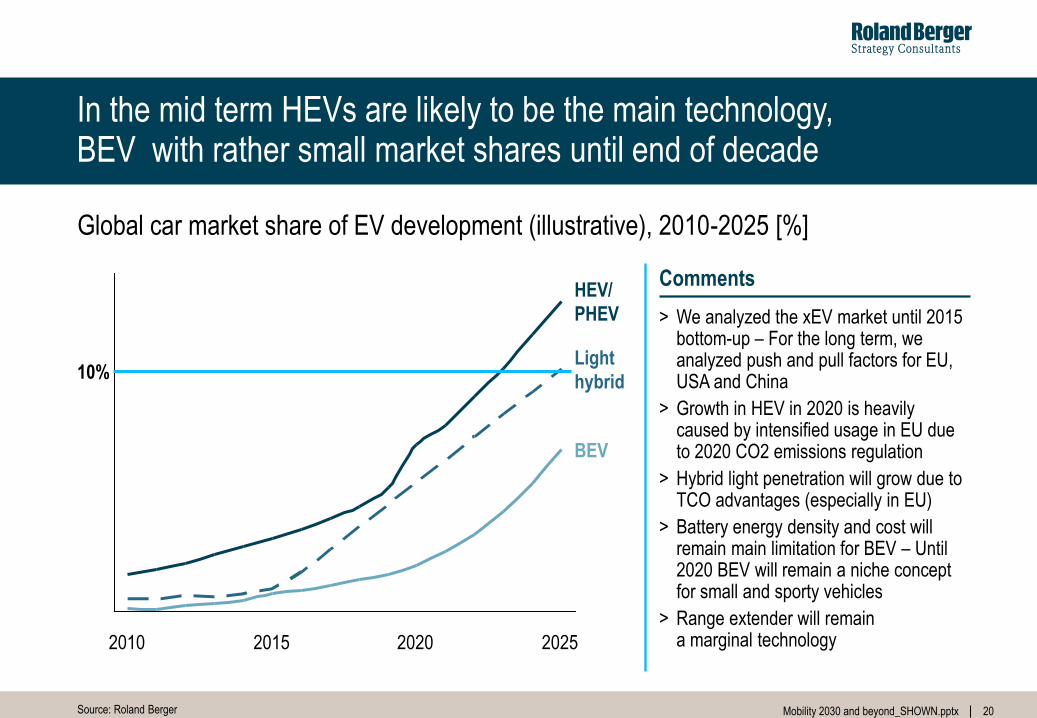
Light
hybrid
BEV
HEV/
PHEV
2025 2020 2015 2010
Source: Roland Berger
Global car market share of EV development (illustrative), 2010-2025 [%]
In the mid term HEVs are likely to be the main technology, BEV with rather small market shares until end of decade
> We analyzed the xEV market until 2015 bottom-up – For the long term, we analyzed push and pull factors for EU, USA and China
> Growth in HEV in 2020 is heavily caused by intensified usage in EU due to 2020 CO2 emissions regulation
> Hybrid light penetration will grow due to TCO advantages (especially in EU)
> Battery energy density and cost will remain main limitation for BEV – Until 2020 BEV will remain a niche concept for small and sporty vehicles
> Range extender will remain a marginal technology
Comments
10%
21 Mobility 2030 and beyond_SHOWN.pptx
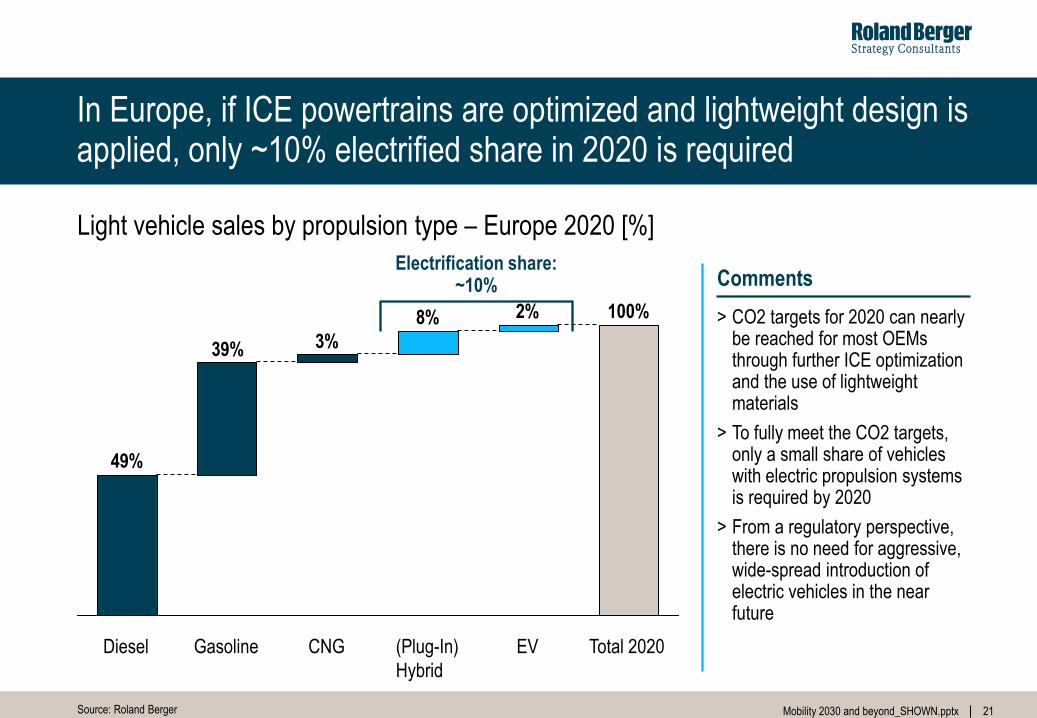
In Europe, if ICE powertrains are optimized and lightweight design is applied, only ~10% electrified share in 2020 is required
21
Light vehicle sales by propulsion type – Europe 2020 [%]
Source: Roland Berger
> CO2 targets for 2020 can nearly be reached for most OEMs through further ICE optimization and the use of lightweight materials
> To fully meet the CO2 targets, only a small share of vehicles with electric propulsion systems is required by 2020
> From a regulatory perspective, there is no need for aggressive, wide-spread introduction of electric vehicles in the near future
Comments
2%8%
3%39%
49%
Diesel CNG EV (Plug-In)
Hybrid
100%
Total 2020 Gasoline
Electrification share: ~10%
22 Mobility 2030 and beyond_SHOWN.pptx
C. Battery and fuel cell economics
23 Mobility 2030 and beyond_SHOWN.pptx
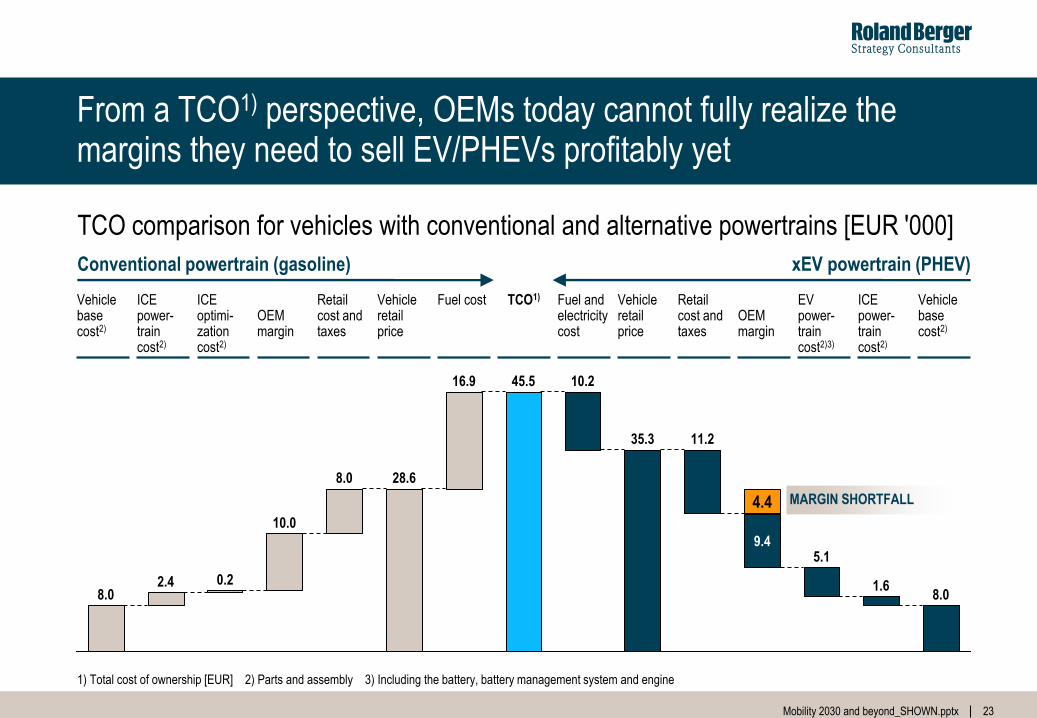
28.6 8.0
10.0
0.2 2.4 8.0
11.2 35.3
10.2 45.5 16.9
8.0 1.6
5.1
4.4
9.4
From a TCO1) perspective, OEMs today cannot fully realize the margins they need to sell EV/PHEVs profitably yet
23
TCO comparison for vehicles with conventional and alternative powertrains [EUR '000]
1) Total cost of ownership [EUR] 2) Parts and assembly 3) Including the battery, battery management system and engine
MARGIN SHORTFALL
Conventional powertrain (gasoline) xEV powertrain (PHEV)
Retail cost and taxes
Vehicle retail price
ICE power-train cost2)
OEM margin
ICE optimi-zation cost2)
TCO1) Fuel and electricity cost
Vehicle base cost2)
Retail cost and taxes
Vehicle retail price
Fuel cost OEM margin
EV power-train cost2)3)
ICE power-train cost2)
Vehicle base cost2)
24 Mobility 2030 and beyond_SHOWN.pptx
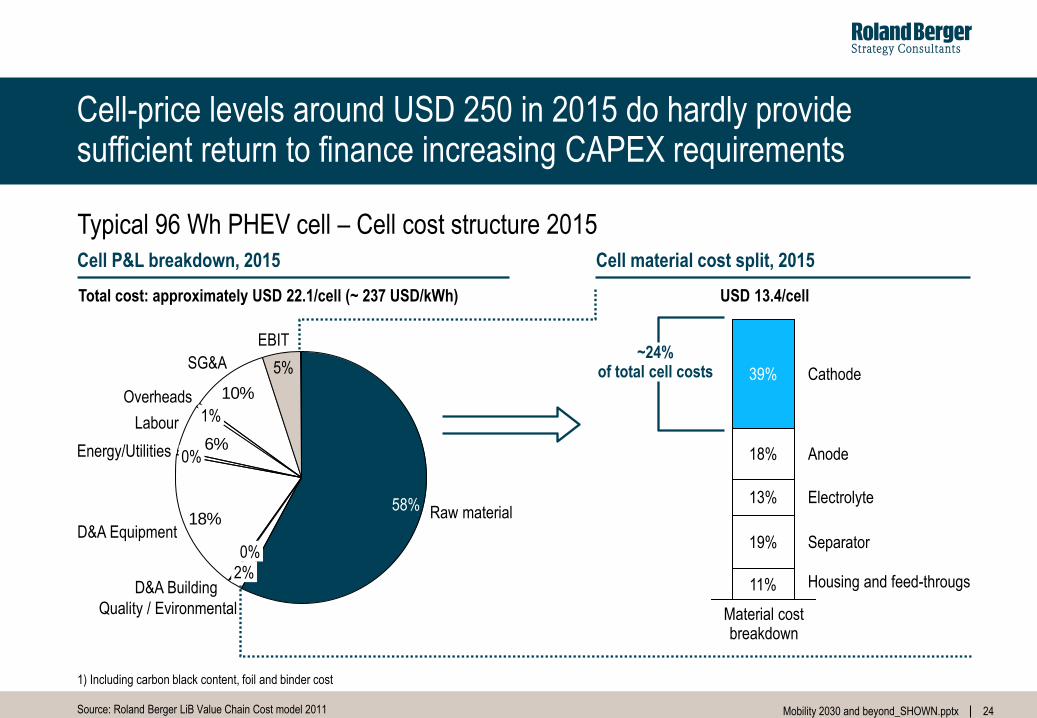
Cell-price levels around USD 250 in 2015 do hardly provide sufficient return to finance increasing CAPEX requirements
Source: Roland Berger LiB Value Chain Cost model 2011
Cell P&L breakdown, 2015 Cell material cost split, 2015
6%
10%
18%
EBIT
5% SG&A
Overheads 1% Labour
Energy/Utilities 0%
D&A Equipment
D&A Building
0%
Quality / Evironmental
2%
Raw material 58%
Total cost: approximately USD 22.1/cell (~ 237 USD/kWh)
18%
39%
Separator
Housing and feed-througs
Anode
Electrolyte
11%
Cathode
13%
19%
Material cost breakdown
USD 13.4/cell
~24% of total cell costs
1) Including carbon black content, foil and binder cost
Typical 96 Wh PHEV cell – Cell cost structure 2015
25 Mobility 2030 and beyond_SHOWN.pptx
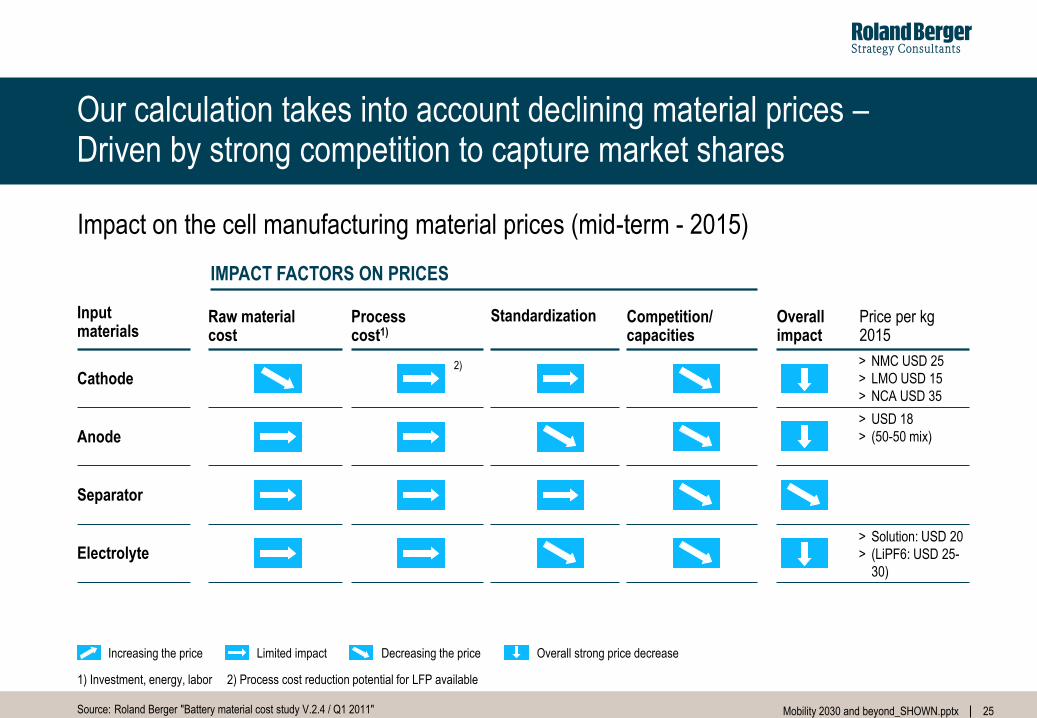
Our calculation takes into account declining material prices – Driven by strong competition to capture market shares
Increasing the price Limited impact Decreasing the price
Input materials
Raw material cost
Process cost1)
Standardization Competition/ capacities
IMPACT FACTORS ON PRICES
Separator
Anode
Electrolyte
Cathode 2)
Overall strong price decrease
Source: Roland Berger "Battery material cost study V.2.4 / Q1 2011"
Overall impact
> NMC USD 25
> LMO USD 15
> NCA USD 35
Price per kg 2015
> USD 18
> (50-50 mix)
> Solution: USD 20
> (LiPF6: USD 25-
30)
Impact on the cell manufacturing material prices (mid-term - 2015)
1) Investment, energy, labor 2) Process cost reduction potential for LFP available
26 Mobility 2030 and beyond_SHOWN.pptx
26
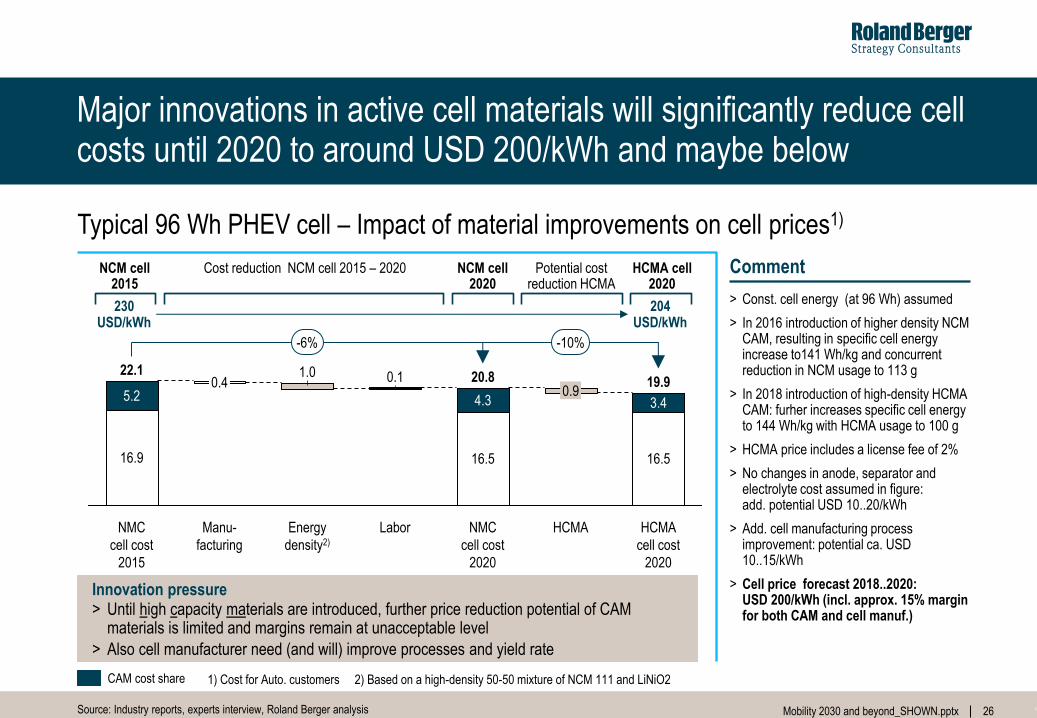
Major innovations in active cell materials will significantly reduce cell costs until 2020 to around USD 200/kWh and maybe below
26
> Const. cell energy (at 96 Wh) assumed
> In 2016 introduction of higher density NCM CAM, resulting in specific cell energy increase to141 Wh/kg and concurrent reduction in NCM usage to 113 g
> In 2018 introduction of high-density HCMA CAM: furher increases specific cell energy to 144 Wh/kg with HCMA usage to 100 g
> HCMA price includes a license fee of 2%
> No changes in anode, separator and electrolyte cost assumed in figure: add. potential USD 10..20/kWh
> Add. cell manufacturing process improvement: potential ca. USD 10..15/kWh
> Cell price forecast 2018..2020: USD 200/kWh (incl. approx. 15% margin for both CAM and cell manuf.)
CAM cost share
-10% -6%
HCMA
cell cost
2020
19.9
16.5
4.3
Labor
0.1
Energy
density2)
1.0
Manu-
facturing
0.4
NMC
cell cost
2015
22.1
16.9
5.2 3.4
HCMA
0.9
NMC
cell cost
2020
20.8
16.5
Cost reduction NCM cell 2015 – 2020 NCM cell 2015
NCM cell 2020
HCMA cell 2020
Potential cost reduction HCMA
230 USD/kWh
204 USD/kWh
Comment
Source: Roland Berger LiB Value Chain Cost model 2011
Source: Industry reports, experts interview, Roland Berger analysis
> Until high capacity materials are introduced, further price reduction potential of CAM materials is limited and margins remain at unacceptable level
> Also cell manufacturer need (and will) improve processes and yield rate
Innovation pressure
1) Cost for Auto. customers 2) Based on a high-density 50-50 mixture of NCM 111 and LiNiO2
Typical 96 Wh PHEV cell – Impact of material improvements on cell prices1)
27 Mobility 2030 and beyond_SHOWN.pptx
27
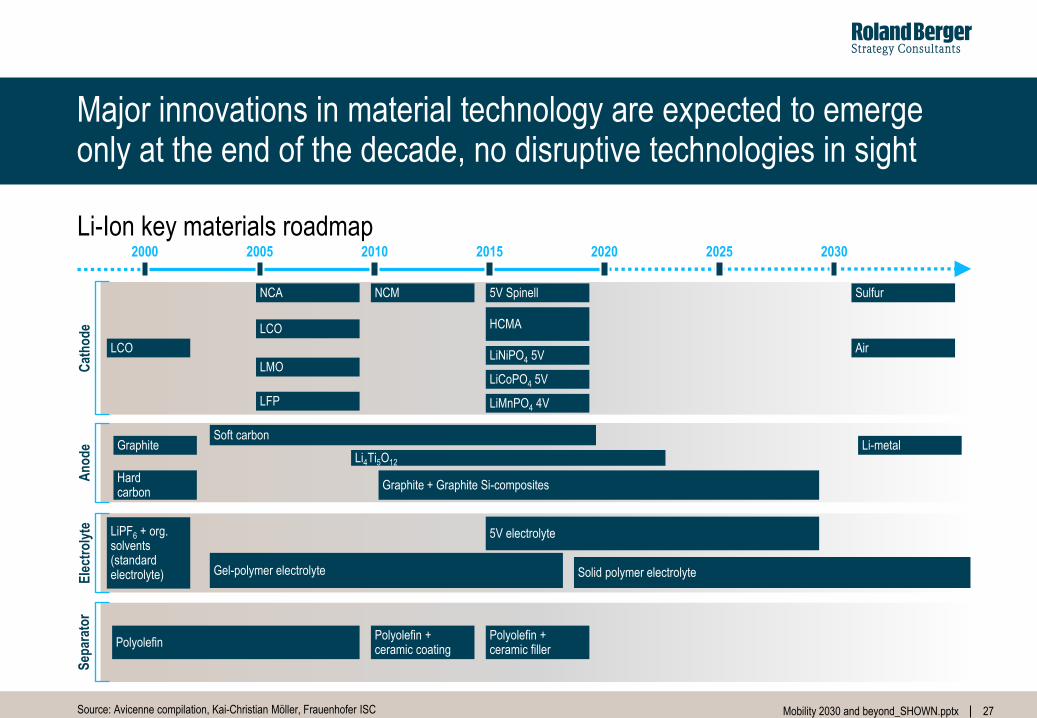
Major innovations in material technology are expected to emerge only at the end of the decade, no disruptive technologies in sight
2000 2015 2010 2005
Cat
ho
de
2020 2030 2025
An
od
e E
lect
roly
te
Sep
arat
or
Li-Ion key materials roadmap
Source: Avicenne compilation, Kai-Christian Möller, Frauenhofer ISC
LCO
LiPF6 + org. solvents (standard electrolyte)
Polyolefin
LCO
LMO
LFP
Air
NCA NCM 5V Spinell
HCMA
LiNiPO4 5V
LiCoPO4 5V
LiMnPO4 4V
Sulfur
Graphite
Hard carbon
Soft carbon
Li4Ti5O12
Graphite + Graphite Si-composites
Li-metal
Gel-polymer electrolyte
5V electrolyte
Solid polymer electrolyte
Polyolefin + ceramic coating
Polyolefin + ceramic filler
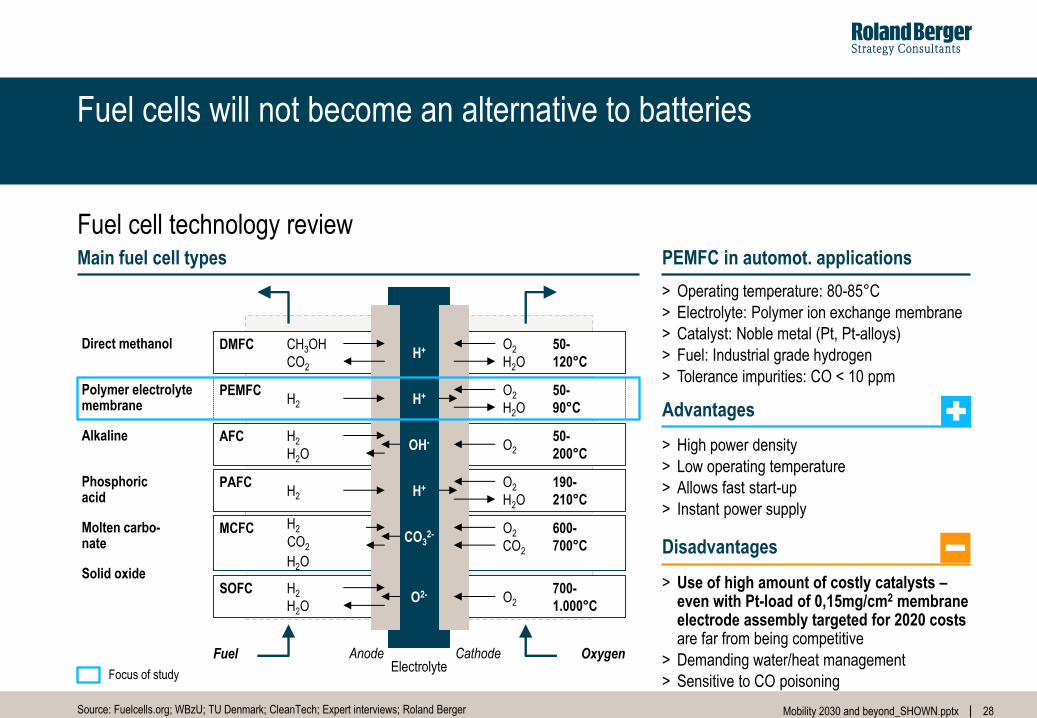
28 Mobility 2030 and beyond_SHOWN.pptx
> Operating temperature: 80-85°C
> Electrolyte: Polymer ion exchange membrane
> Catalyst: Noble metal (Pt, Pt-alloys)
> Fuel: Industrial grade hydrogen
> Tolerance impurities: CO < 10 ppm
PEMFC in automot. applications
28
Fuel cells will not become an alternative to batteries
Source: Fuelcells.org; WBzU; TU Denmark; CleanTech; Expert interviews; Roland Berger
Main fuel cell types
Direct methanol
Polymer electrolyte membrane
Alkaline
Phosphoric acid
Molten carbo- nate
Solid oxide
Cathode Anode
DMFC CH3OH
CO2
50-
120°C
O2
H2O
PEMFC H2
50-
90°C
O2
H2O
AFC H2
H2O
50-
200°C O2
PAFC 190-
210°C
O2
H2O
MCFC H2
H2O
600-
700°C
O2
CO2
SOFC H2
H2O
700-
1.000°C O2
Electrolyte
H+
H+
OH-
H+
CO32-
O2-
H2
Fuel Oxygen
Advantages
> High power density
> Low operating temperature
> Allows fast start-up
> Instant power supply
> Use of high amount of costly catalysts – even with Pt-load of 0,15mg/cm2 membrane electrode assembly targeted for 2020 costs are far from being competitive
> Demanding water/heat management
> Sensitive to CO poisoning
Disadvantages
Focus of study
CO2
Fuel cell technology review
29 Mobility 2030 and beyond_SHOWN.pptx
29
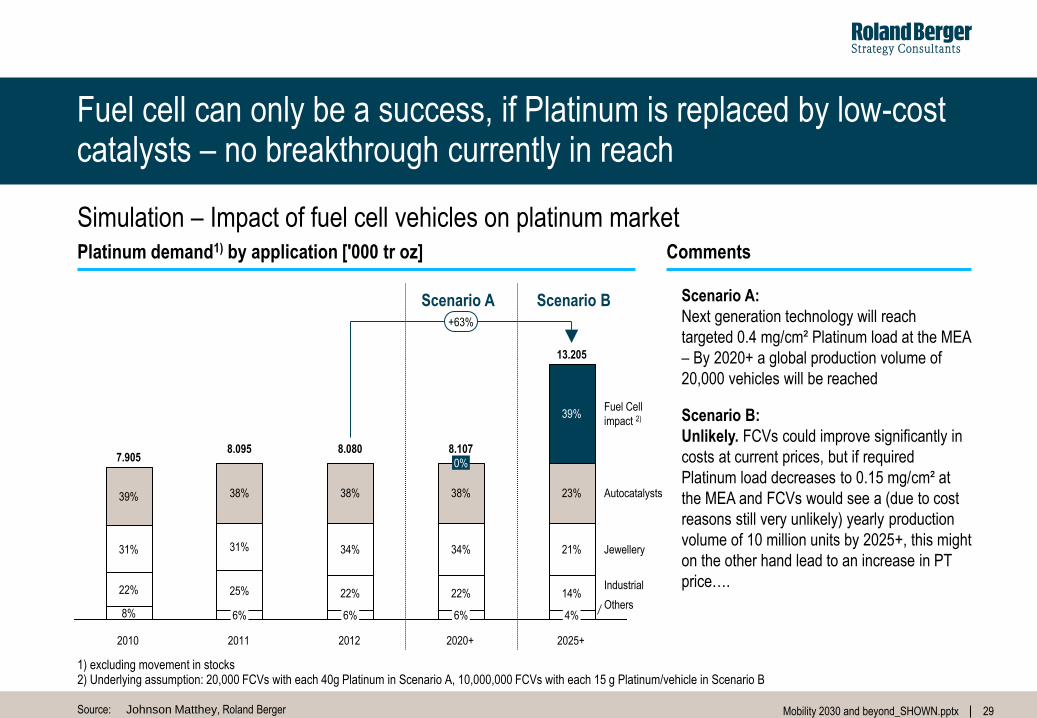
Fuel cell can only be a success, if Platinum is replaced by low-cost catalysts – no breakthrough currently in reach
Simulation – Impact of fuel cell vehicles on platinum market
Source: Johnson Matthey, Roland Berger
Platinum demand1) by application ['000 tr oz] Comments
Scenario A:
Next generation technology will reach
targeted 0.4 mg/cm² Platinum load at the MEA
– By 2020+ a global production volume of
20,000 vehicles will be reached
Scenario B:
Unlikely. FCVs could improve significantly in
costs at current prices, but if required
Platinum load decreases to 0.15 mg/cm² at
the MEA and FCVs would see a (due to cost
reasons still very unlikely) yearly production
volume of 10 million units by 2025+, this might
on the other hand lead to an increase in PT
price….
+63%
Others
Industrial
Jewellery
Autocatalysts
Fuel Cell
impact 2)
2025+
13.205
4%
14%
21%
23%
39%
2020+
8.107
6%
22%
34%
38%
0%
2012
8.080
6%
22%
34%
38%
2011
8.095
6%
25%
31%
38%
2010
7.905
8%
22%
31%
39%
Scenario A
1) excluding movement in stocks 2) Underlying assumption: 20,000 FCVs with each 40g Platinum in Scenario A, 10,000,000 FCVs with each 15 g Platinum/vehicle in Scenario B
Scenario B
30 Mobility 2030 and beyond_SHOWN.pptx
D. New business models in infrastructure provision and connectivity services
31 Mobility 2030 and beyond_SHOWN.pptx
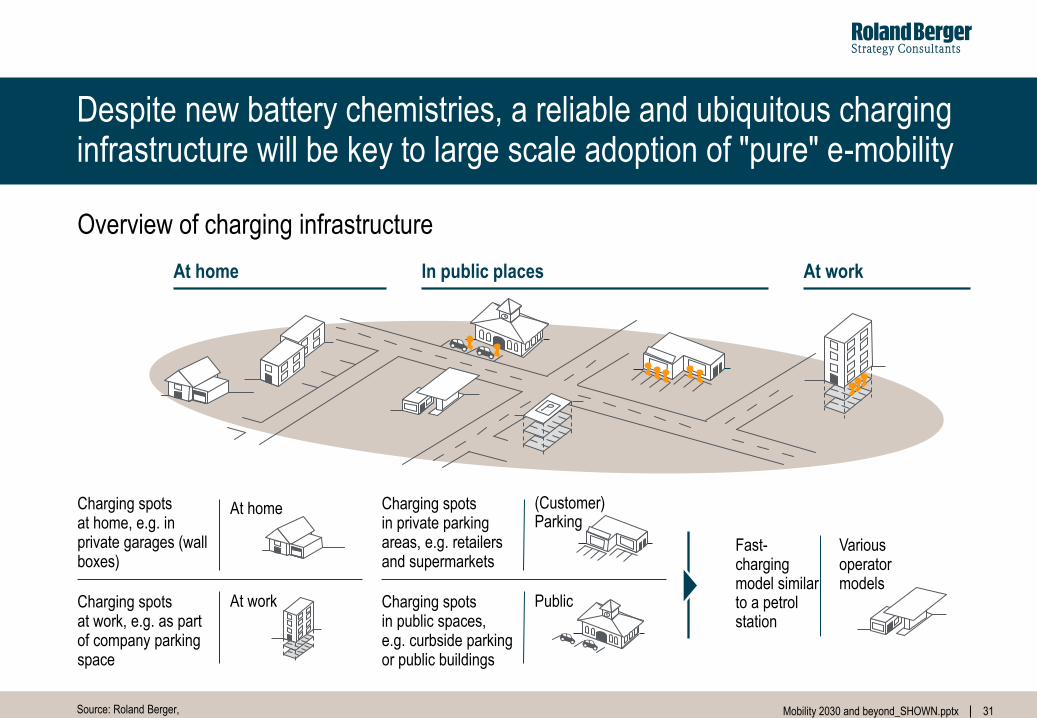
Despite new battery chemistries, a reliable and ubiquitous charging infrastructure will be key to large scale adoption of "pure" e-mobility
At home In public places At work
Charging spots at work, e.g. as part of company parking space
Charging spots at home, e.g. in private garages (wall boxes)
At home
At work Charging spots in public spaces, e.g. curbside parking or public buildings
Charging spots in private parking areas, e.g. retailers and supermarkets
(Customer) Parking
Public
Various operator models
Fast- charging model similar to a petrol station
Overview of charging infrastructure
Source: Roland Berger,
32 Mobility 2030 and beyond_SHOWN.pptx
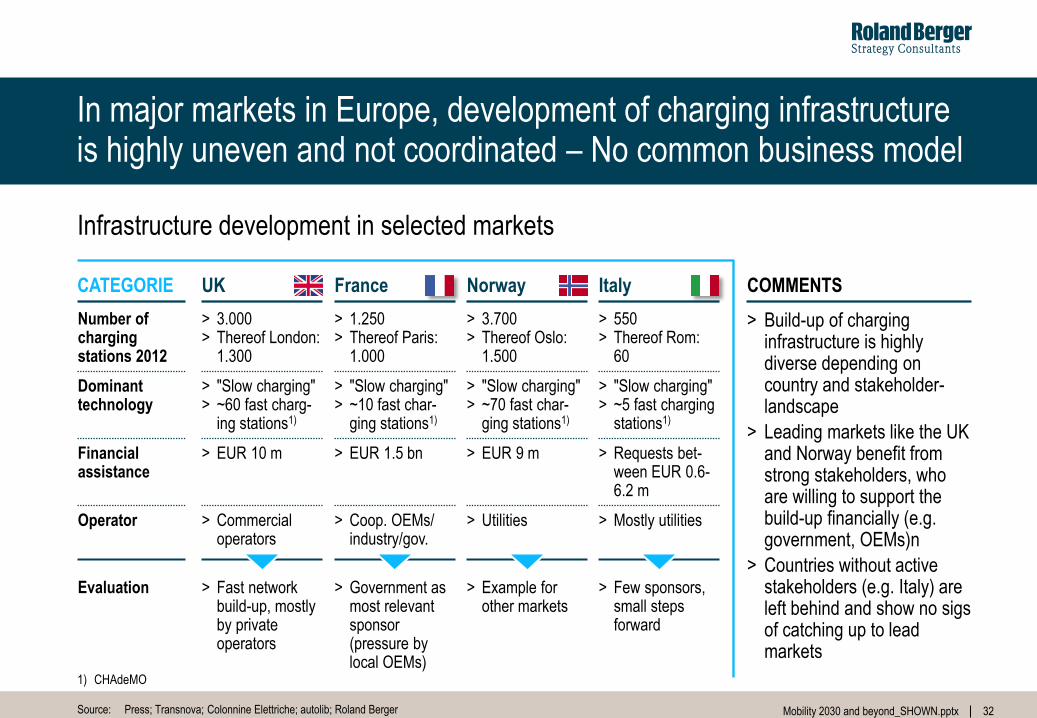
In major markets in Europe, development of charging infrastructure is highly uneven and not coordinated – No common business model
32
Source: Press; Transnova; Colonnine Elettriche; autolib; Roland Berger
> Build-up of charging infrastructure is highly diverse depending on country and stakeholder-landscape
> Leading markets like the UK and Norway benefit from strong stakeholders, who are willing to support the build-up financially (e.g. government, OEMs)n
> Countries without active stakeholders (e.g. Italy) are left behind and show no sigs of catching up to lead markets
COMMENTS CATEGORIE UK France Norway Italy
Number of charging stations 2012
> 3.000 > Thereof London:
1.300
> 1.250 > Thereof Paris:
1.000
> 3.700 > Thereof Oslo:
1.500
> 550 > Thereof Rom:
60
Dominant technology
> "Slow charging" > ~60 fast charg-
ing stations1)
> "Slow charging" > ~10 fast char-
ging stations1)
> "Slow charging" > ~70 fast char-
ging stations1)
> "Slow charging" > ~5 fast charging
stations1)
Financial assistance
> EUR 10 m > EUR 1.5 bn > EUR 9 m > Requests bet-ween EUR 0.6-6.2 m
Operator > Commercial operators
> Coop. OEMs/ industry/gov.
> Utilities > Mostly utilities
Evaluation > Fast network build-up, mostly by private operators
> Government as most relevant sponsor (pressure by local OEMs)
> Example for other markets
> Few sponsors, small steps forward
1) CHAdeMO
Infrastructure development in selected markets
33 Mobility 2030 and beyond_SHOWN.pptx
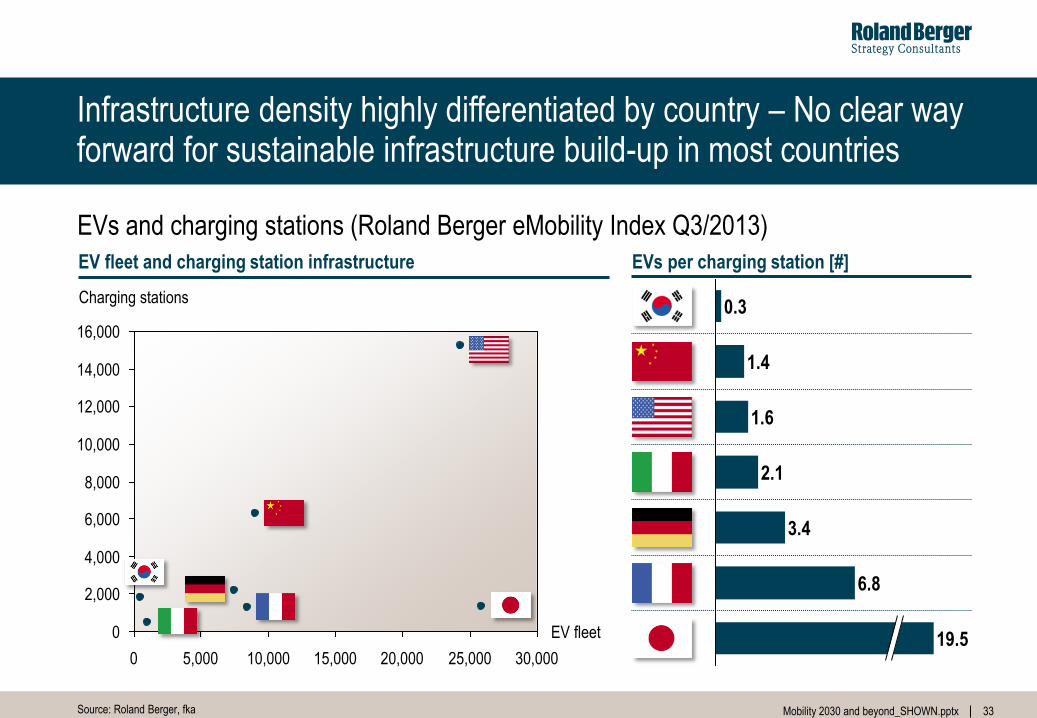
Infrastructure density highly differentiated by country – No clear way forward for sustainable infrastructure build-up in most countries
33
Source: Roland Berger, fka
EV fleet and charging station infrastructure
16,000
14,000
12,000
10,000
8,000
6,000
4,000
2,000
0
30,000 25,000 20,000 15,000 10,000 5,000 0
Charging stations
EV fleet
FR GER
CN
J
US
EVs per charging station [#]
19.5
6.8
3.4
2.1
1.6
1.4
0.3
EVs and charging stations (Roland Berger eMobility Index Q3/2013)
34 Mobility 2030 and beyond_SHOWN.pptx
34
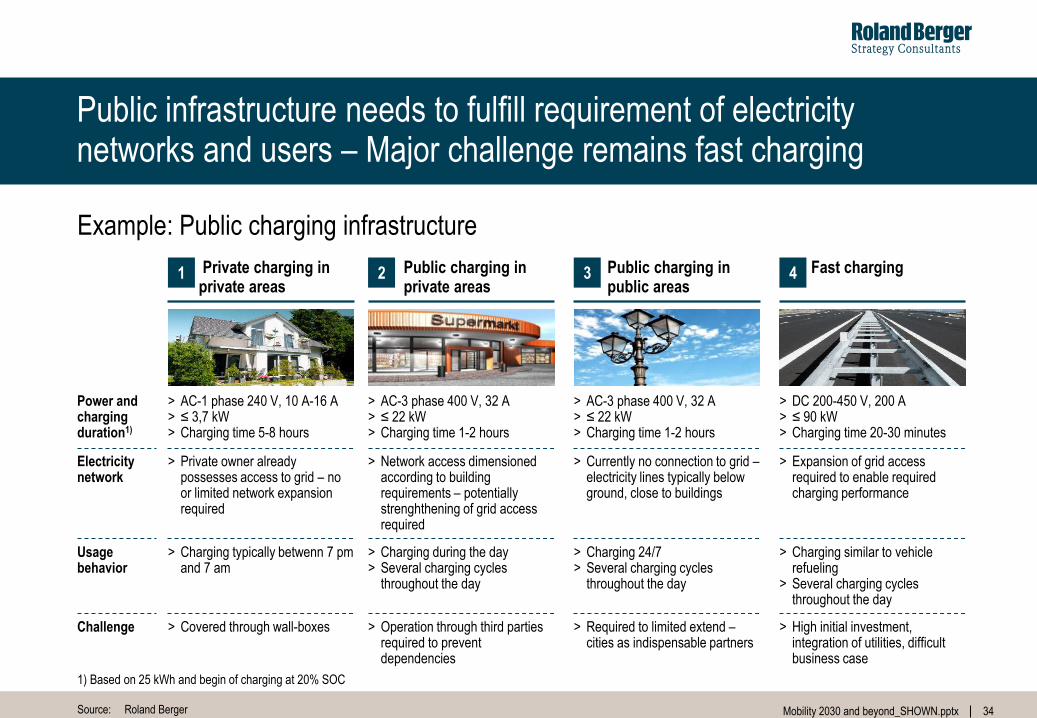
Public infrastructure needs to fulfill requirement of electricity networks and users – Major challenge remains fast charging
Private charging in private areas
1 Public charging in private areas
2 Fast charging 4 Public charging in public areas
3
> AC-1 phase 240 V, 10 A-16 A > ≤ 3,7 kW > Charging time 5-8 hours
> AC-3 phase 400 V, 32 A > ≤ 22 kW > Charging time 1-2 hours
> AC-3 phase 400 V, 32 A > ≤ 22 kW > Charging time 1-2 hours
> DC 200-450 V, 200 A > ≤ 90 kW > Charging time 20-30 minutes
Power and charging duration1)
> Charging typically betwenn 7 pm and 7 am
> Charging during the day > Several charging cycles
throughout the day
> Charging 24/7 > Several charging cycles
throughout the day
> Charging similar to vehicle refueling
> Several charging cycles throughout the day
Usage behavior
> Private owner already possesses access to grid – no or limited network expansion required
> Network access dimensioned according to building requirements – potentially strenghthening of grid access required
> Currently no connection to grid – electricity lines typically below ground, close to buildings
> Expansion of grid access required to enable required charging performance
Electricity network
1) Based on 25 kWh and begin of charging at 20% SOC
> Covered through wall-boxes > Operation through third parties required to prevent dependencies
> Required to limited extend – cities as indispensable partners
> High initial investment, integration of utilities, difficult business case
Challenge
Source: Roland Berger
Example: Public charging infrastructure
35 Mobility 2030 and beyond_SHOWN.pptx
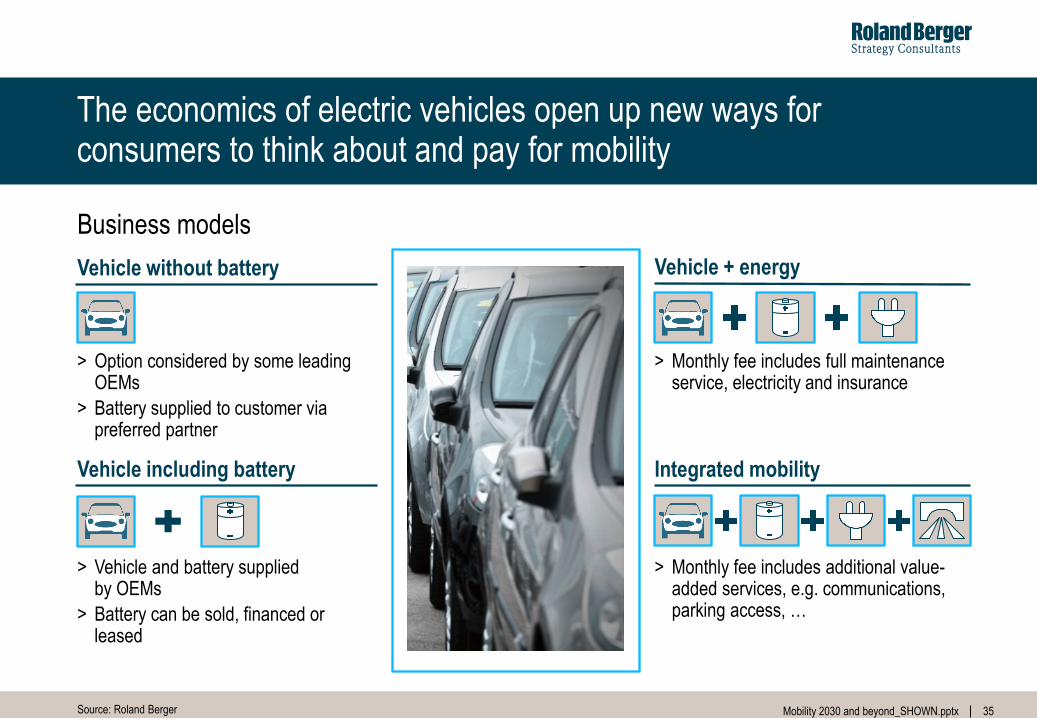
The economics of electric vehicles open up new ways for consumers to think about and pay for mobility
Vehicle + energy
> Monthly fee includes full maintenance service, electricity and insurance
Integrated mobility
> Monthly fee includes additional value-added services, e.g. communications, parking access, …
> Vehicle and battery supplied by OEMs
> Battery can be sold, financed or leased
> Option considered by some leading OEMs
> Battery supplied to customer via preferred partner
Vehicle including battery
Vehicle without battery
Business models
Source: Roland Berger
36 Mobility 2030 and beyond_SHOWN.pptx
36