Embed Size (px)
Citation preview
TS07F - Task Force on Surveyors and the Climate Change II, 6099 1/17 Olusina, J.O. & O.M. Odumade Modeling Climatic Variation Parameters Of Nigeria Using The Statistical Downscaling Approach FIG Working Week 2012 Knowing to manage the territory, protect the environment, evaluate the cultural heritage Rome, Italy, 6-10 May 2012
Modeling Climatic Variation Parameters of Nigeria Using the Statistical Downscaling Approach
Olusina, J.O. & O.M. Odumade
Department of Surveying & Geoinformatics, Faculty of Engineering, University of Lagos,
Akoka, Lagos, Nigeria.
ABSTRACT
Climate unpredictability and change in climatic parameters have direct influence on environment
and human existence. A negative change in the climate, always have its corresponding
dysfunctional impacts on man and the ecosystem globally or locally. Flooding, poor agricultural
yields, famine, and even death are some of the catastrophic effects of drastic climate change.
Knowledge and information on the climatic variation parameters in an environment is very vital
for environmental study assessment and proper planning. Therefore, the importance of knowing
the future climatic variation parameters cannot be under-estimated.
This research was aimed at determination of the future climatic variation parameters of Nigeria
for the next fifty years (2000-2050). Due to the complex and multidimensional nature of the
variables involved, the parameters considered in the work were limited to temperature and
rainfall. Statistical downscaling concept was adapted to the WORLDCLIM past and future data
for 50years to obtain climatic parameters for Nigeria. Past temperature and rainfall data were
also obtained from the Nigeria Meteorological Agency (NIMET) to check the validity of the past
WORLDCLIM data at the national level. DIVA-GIS and Arc-GIS were basically used in this
research. Further corrections were applied to the future WORLDCLIM data to model the future
climatic variation parameters for Nigeria.
Polynomials were developed to represent the predicted climatic variation parameters of some
parts of Nigeria, as case study. A database of the projected climatic variation parameters of all
Local Government Areas in Nigeria was developed. Also, twelve (12) base-maps of Nigeria
TS07F - Task Force on Surveyors and the Climate Change II, 6099 2/17 Olusina, J.O. & O.M. Odumade Modeling Climatic Variation Parameters Of Nigeria Using The Statistical Downscaling Approach FIG Working Week 2012 Knowing to manage the territory, protect the environment, evaluate the cultural heritage Rome, Italy, 6-10 May 2012
were created which attributes and depicts the predicted climatic variation parameters for every
month. Results of future climatic prediction, 2000-2005, show that the Northern region will
experience more decrease in rainfall even during wet season resulting in desertification while the
Southern region will experience a reverse situation. The socio-economic consequences of the
climatic variations were discussed. The results obtained provide advance information for various
stakeholders to make adequate provision for the future.
1.0 INTRODUCTION
The most general definition of climate change is a change in the statistical properties of the climate
system when considered over long periods of time, regardless of cause. Accordingly, fluctuations over
periods shorter than a few decades, such as El Niño, do not represent climate change. On the broadest
scale, the rate at which energy is received from the sun and the rate at which it is lost to space determine
the equilibrium temperature and climate of Earth. This energy is distributed around the globe by winds,
ocean currents, and other mechanisms to affect climates of different regions (Wikipedia, 2012; Awosika,
Ojo and Ajayi, 1994; Ayoade, 1988; Buba, 2004),
Understanding the spatial and temporary variations in climate within a zone or region, and their
relationships with other factors, is important in activities related to climate change and the
management of the natural resources, such as environmental planning, land-use planning,
watershed management and territorial ordering (Zuviría, 2011).
According to Tamuno (2009), there are two major causes of climate change, namely:
anthropogenic and natural. Anthropogenic causes relate to those activities of man which help to
change the chemical composition of the atmosphere as they relate to increasing the volume of
greenhouse gases like Carbon dioxide (CO2), Methane (CH4), Sulphur Dioxide (SO2), etc. While
the natural causes of climate change are based on: (a) Terrestrial (Earth) causes which are
affected through- Changes in the distribution of land and water surface, Changes in the earth’s
topography, Changes in atmospheric chemistry and Changes in the cryosphere; (b) Astronomical
causes (Milankovitch theories) which are effected through- Changes in the eccentricity of the
TS07F - Task Force on Surveyors and the Climate Change II, 6099 3/17 Olusina, J.O. & O.M. Odumade Modeling Climatic Variation Parameters Of Nigeria Using The Statistical Downscaling Approach FIG Working Week 2012 Knowing to manage the territory, protect the environment, evaluate the cultural heritage Rome, Italy, 6-10 May 2012
earth’s orbit, Changes in the precession of the equinoxes and Changes in the obliquity of the
plane of ecliptic; (c) Extra terrestrial causes effected through- Variations in the solar radiation
amount and Variation in the absorption of solar radiation outside the earth’s atmosphere. The
combined effects of the anthropogenic and natural causes actually bring about climate change in
the ratio of about 60:40 respectively.
There has been growing awareness that the earth’s climate is changing at an alarming rate and
the Fourth Assessment Report of the Intergovernmental Panel on Climate Change (IPCC, 2007)
affirms that climate change is no longer in doubt but is now unequivocally apparent based on
evidence from scientific observations of increases in global average air and ocean temperatures
(Odjugo, 2010; Porbeni, 2004).
Researchers have shown that Nigeria is already being plagued with diverse ecological problems,
which have been directly linked to the on-going climate change. The most crucial things about
the concept of climate change is not only the time periods involved but also the degree of
variability that the change is subjected to as well as the duration and impact of such variability
on man and the ecosystem (Odjugo, 2010; Kalkstein and Vailimont, 1987; McQuire, Macon,
Kilburn, 2002; Nwafor, 2006).
This paper discussed a research on modelling future (predicted) climate of Nigeria from 2000 –
2050 using Geographic Information Systems (GIS). Present climate data from WorldClim Model
(1950-2000) were downscale and compared with Present national climate data from Nigeria
Meteorological Agency (NIMET) (1950-2000). The differential was applied to the Future
WorldClim Model (2000-2050) to obtain Polymonial for predicting Future Temperature and
Rainfall change for any part of Nigeria (2000-2050). Results revealed that the Future Range of
the Changes in Rainfall and Maximum Temperature are between -192 to 198 (mm) and -1.59 to
2.48 (°C) respectively. The socio-economic consequences of the climatic variations were
discussed. Analysis on the possible effects of the predicted temperature and rainfall change were
made.
TS07F - Task Force on Surveyors and the Climate Change II, 6099 4/17 Olusina, J.O. & O.M. Odumade Modeling Climatic Variation Parameters Of Nigeria Using The Statistical Downscaling Approach FIG Working Week 2012 Knowing to manage the territory, protect the environment, evaluate the cultural heritage Rome, Italy, 6-10 May 2012
2.0 STUDY AREA
The total area of Nigeria is 923,768km² of which 910,768km² is land, while water takes up
13,000 km². Nigeria's total boundaries are 4,047km in length. The border with Benin is 773 km,
with Cameroon is 1,690km, Chad's is 87km, and Niger is 1,497km. Nigeria's climate is
characterized by strong latitudinal zones, becoming progressively drier as one moves north from
the coast. Nigeria's climate is marked by two seasons, dry and rainy seasons, the dry season is
also known as Harmattan (Wikipedia, 2012; The Library of Congress Country Studies, 1991).
3.0 METHODOLOGY
In this research, the following methodology was adopted:
3.1 Data Acquisition
Present and Future climate data were acquired from WORLDCLIM model and Nigeria
Meteorological Service (NIMET).
Worldclim Model Data: Worldclim data was chosen and downscaled from Global Circulation
Models. The data were in .clm and .cli formats and the database can be accessed through Diva-
GIS. The datasets obtained were:
• Present Climate (Minimum Temperature, Maximum Temperature, Mean temperature,
Precipitation) 1950-2000.
• Future Climate (Minimum Temperature, Maximum Temperature, Mean temperature,
Precipitation) 2000-2050.
Meteorological Climate Data: Data was acquired from Nigeria Meteorological Service (NIMET),
Oshodi Lagos State. The data obtained were from four meteorological stations (Lagos, Owerri,
Port Harcourt, Bauchi). The datasets includes:
� Maximum and Minimum Temperature (1950-2000)
� Rainfall (1950-2000)
TS07F - Task Force on Surveyors and the Climate Change II, 6099 5/17 Olusina, J.O. & O.M. Odumade Modeling Climatic Variation Parameters Of Nigeria Using The Statistical Downscaling Approach FIG Working Week 2012 Knowing to manage the territory, protect the environment, evaluate the cultural heritage Rome, Italy, 6-10 May 2012
The maximum and minimum temperatures were in degree Fahrenheit, but were converted to
degree Celsius, and the rainfall was in Inches, but was converted to Millimeters.
3.2 Data Processing
The datasets from Worldclim (.clm and .cli files) were opened in DIVA-GIS, to extract the
Bioclim world maps in grid file. This was carried out for both the present and future climate
data. A gridfile consists of two separate files .GRI and .GRD, both integrated in DIVAGIS as one
file. The .GRI file has the actual data, and the .GRD file has metadata and a number of
parameters that are needed to read the .GRI file properly.
In creating the raster maps, the climate database was specified i.e. Present dataset (1950-2000)
and Future dataset (2000-2050). The climate grid maps were created by selecting the desired
parameters such as minimum, mean and maximum temperature and rainfall as output, for the
different months in a year. This made a total of ninety-six (96) grid maps created. The grid
(raster) maps created were converted to shape-file, World, which is the dominant file format used
for spatial data analysis.
3.2.1 Data Manipulation in ArcGIS
Using Arc-catalog, the various shape-files, World, were based on Geographic Coordinate System
(GCS), WGS 1984. Nigeria boundary map was overlaid on the shape-files to query regions
within its boundary. The various Average Temperature and Rainfall for each Local Government
Area (LGA) were extracted and exported to Microsoft Excel.
3.2.2 Working with Meteorological Data
The data obtained from NIMET were daily data of minimum temperature, maximum
temperature, and rainfall for the four different stations over a period of 50 years (1950-2000).
Monthly data were obtained by averaging the daily data for temperature data and summation for
the rainfall data. For the various stations, the local data from NIMET was compared with the
TS07F - Task Force on Surveyors and the Climate Change II, 6099 6/17 Olusina, J.O. & O.M. Odumade Modeling Climatic Variation Parameters Of Nigeria Using The Statistical Downscaling Approach FIG Working Week 2012 Knowing to manage the territory, protect the environment, evaluate the cultural heritage Rome, Italy, 6-10 May 2012
present climate data obtained from Worldclim model, and analysis were carried out using
Microsoft Excel.
3.2.3 Modelling Nigeria’s Future Climatic Variation Parameters
When the present NIMET data (1950-2000) obtained from the meteorological stations were
compared with that obtained from the Worldclime model, the model was confirmed to be very
close (Figures 1-3). Therefore, the local climate (NIMET) data validated the Worldclim model
data. The differentials were randomly applied to the future temperature and rainfall from the
Worldclim model to obtain the database for the future temperature and rainfall for Nigeria
(Figure 5).
From the database obtained for the various climatic parameters and exported to Microsoft Excel,
polynimials were derived with their R² value from the Best-Fit trendlines (Figure 4).
4.0 RESULTS AND ANALYSIS
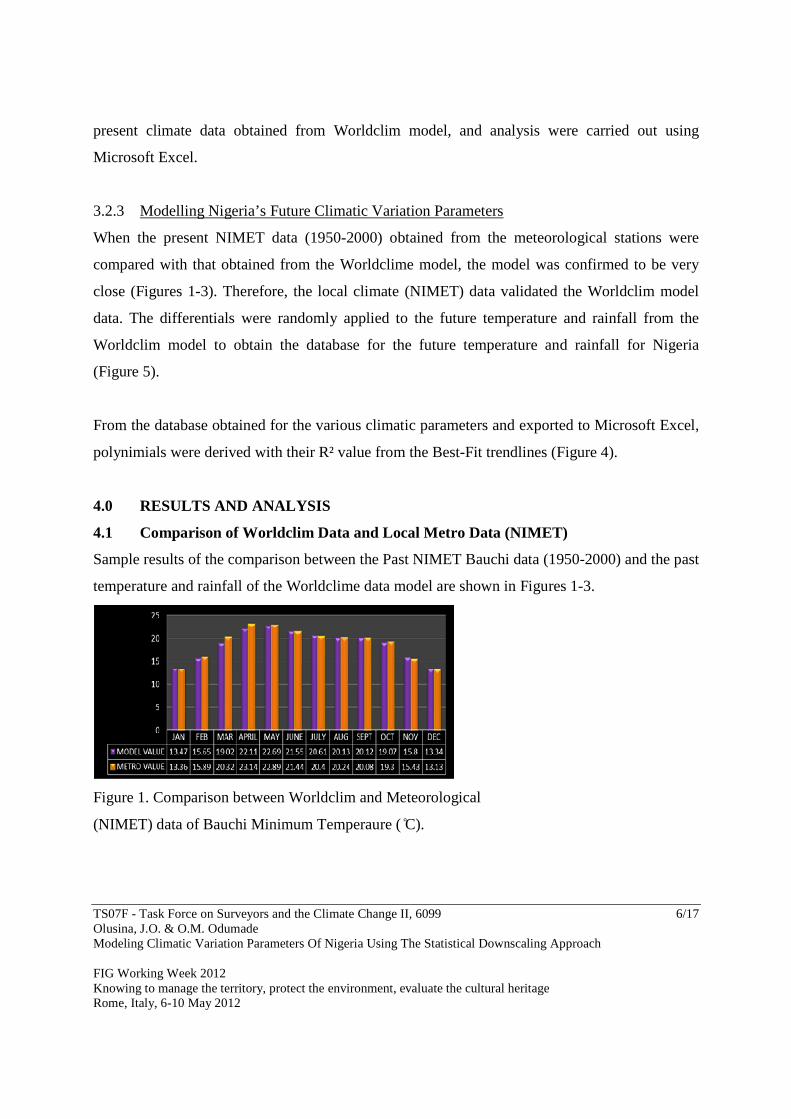
4.1 Comparison of Worldclim Data and Local Metro Data (NIMET)
Sample results of the comparison between the Past NIMET Bauchi data (1950-2000) and the past
temperature and rainfall of the Worldclime data model are shown in Figures 1-3.
Figure 1. Comparison between Worldclim and Meteorological
(NIMET) data of Bauchi Minimum Temperaure ( ̊C).
TS07F - Task Force on Surveyors and the Climate Change II, 6099 7/17 Olusina, J.O. & O.M. Odumade Modeling Climatic Variation Parameters Of Nigeria Using The Statistical Downscaling Approach FIG Working Week 2012 Knowing to manage the territory, protect the environment, evaluate the cultural heritage Rome, Italy, 6-10 May 2012
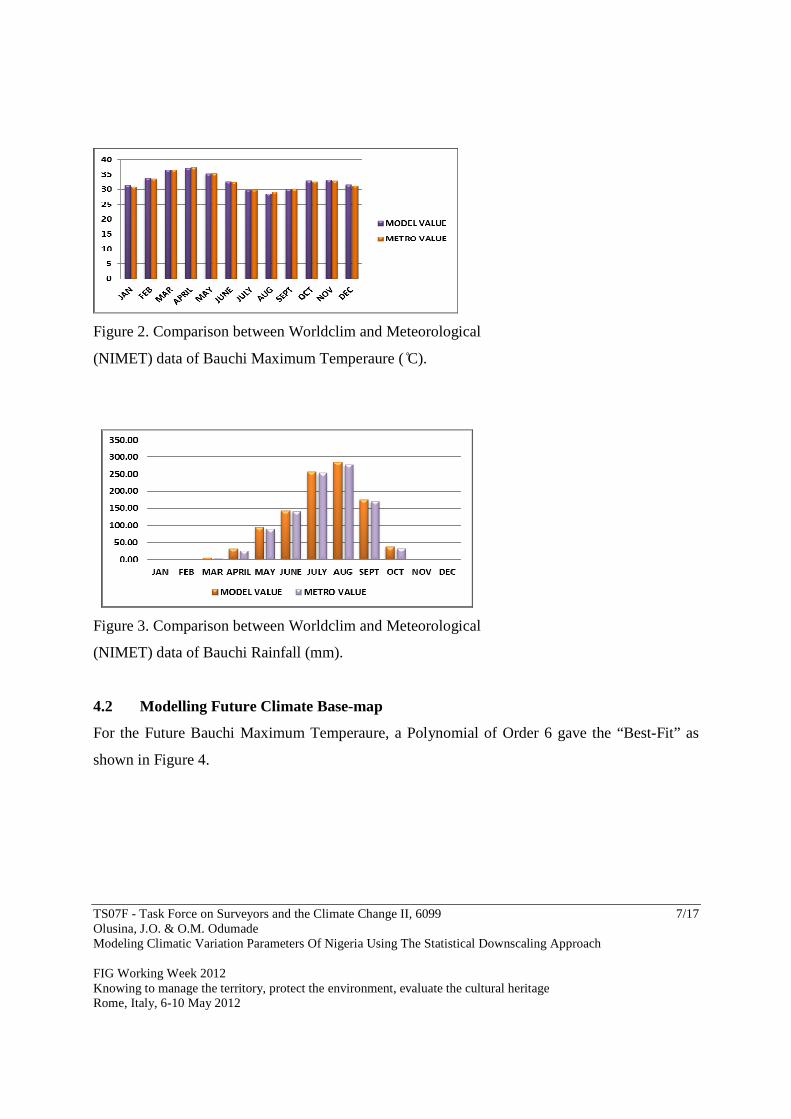
Figure 2. Comparison between Worldclim and Meteorological
(NIMET) data of Bauchi Maximum Temperaure ( ̊C).
Figure 3. Comparison between Worldclim and Meteorological
(NIMET) data of Bauchi Rainfall (mm).
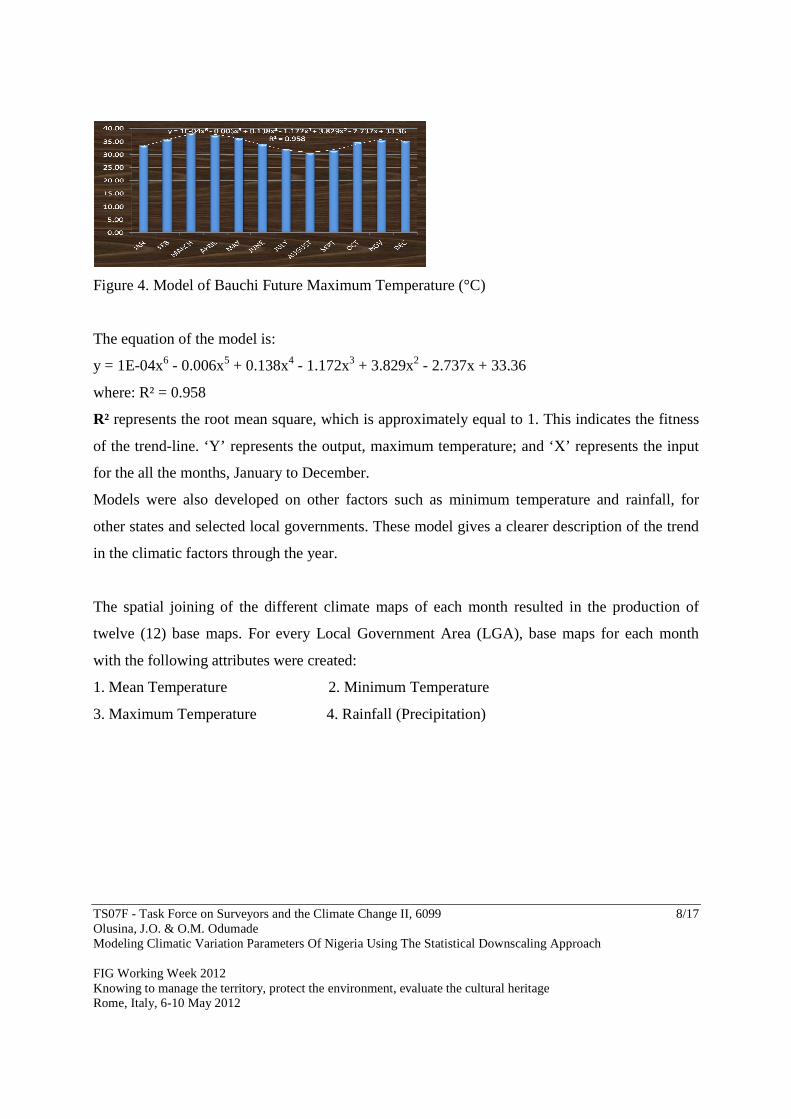
4.2 Modelling Future Climate Base-map
For the Future Bauchi Maximum Temperaure, a Polynomial of Order 6 gave the “Best-Fit” as
shown in Figure 4.
TS07F - Task Force on Surveyors and the Climate Change II, 6099 8/17 Olusina, J.O. & O.M. Odumade Modeling Climatic Variation Parameters Of Nigeria Using The Statistical Downscaling Approach FIG Working Week 2012 Knowing to manage the territory, protect the environment, evaluate the cultural heritage Rome, Italy, 6-10 May 2012
Figure 4. Model of Bauchi Future Maximum Temperature (°C)
The equation of the model is:
y = 1E-04x6 - 0.006x5 + 0.138x4 - 1.172x3 + 3.829x2 - 2.737x + 33.36
where: R² = 0.958
R² represents the root mean square, which is approximately equal to 1. This indicates the fitness
of the trend-line. ‘Y’ represents the output, maximum temperature; and ‘X’ represents the input
for the all the months, January to December.
Models were also developed on other factors such as minimum temperature and rainfall, for
other states and selected local governments. These model gives a clearer description of the trend
in the climatic factors through the year.
The spatial joining of the different climate maps of each month resulted in the production of
twelve (12) base maps. For every Local Government Area (LGA), base maps for each month
with the following attributes were created:
1. Mean Temperature 2. Minimum Temperature
3. Maximum Temperature 4. Rainfall (Precipitation)
TS07F - Task Force on Surveyors and the Climate Change II, 6099 9/17 Olusina, J.O. & O.M. Odumade Modeling Climatic Variation Parameters Of Nigeria Using The Statistical Downscaling Approach FIG Working Week 2012 Knowing to manage the territory, protect the environment, evaluate the cultural heritage Rome, Italy, 6-10 May 2012
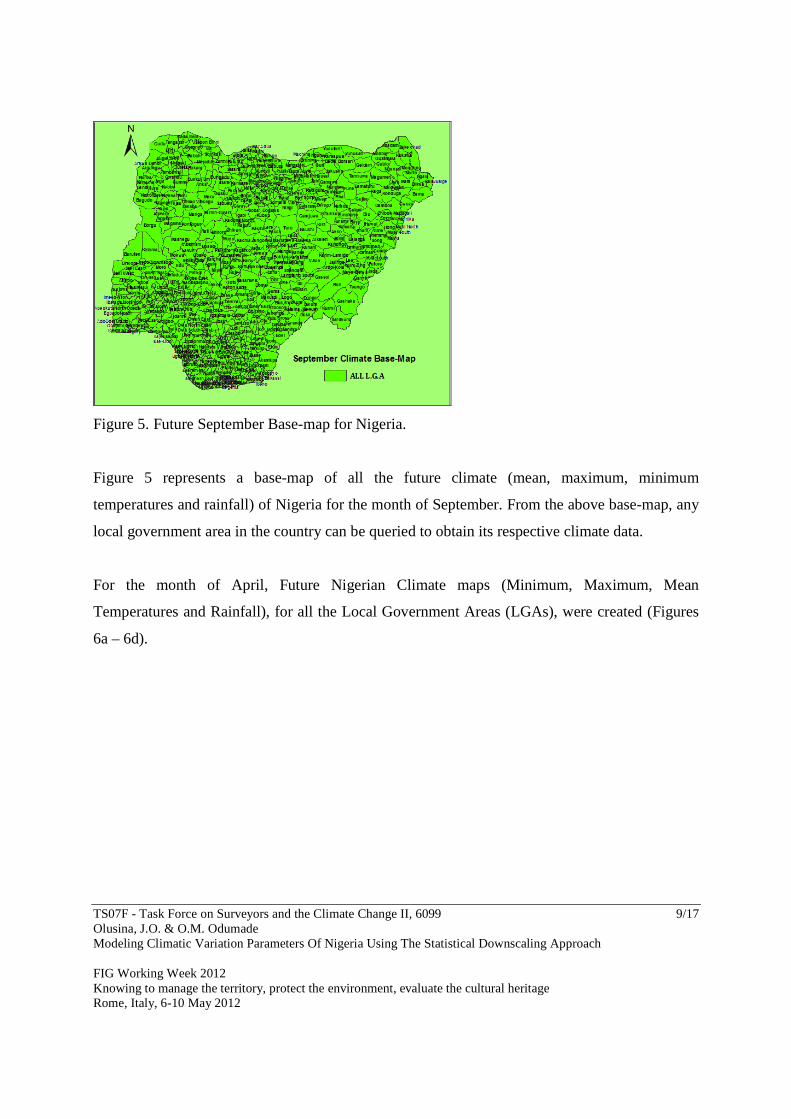
Figure 5. Future September Base-map for Nigeria.
Figure 5 represents a base-map of all the future climate (mean, maximum, minimum
temperatures and rainfall) of Nigeria for the month of September. From the above base-map, any
local government area in the country can be queried to obtain its respective climate data.
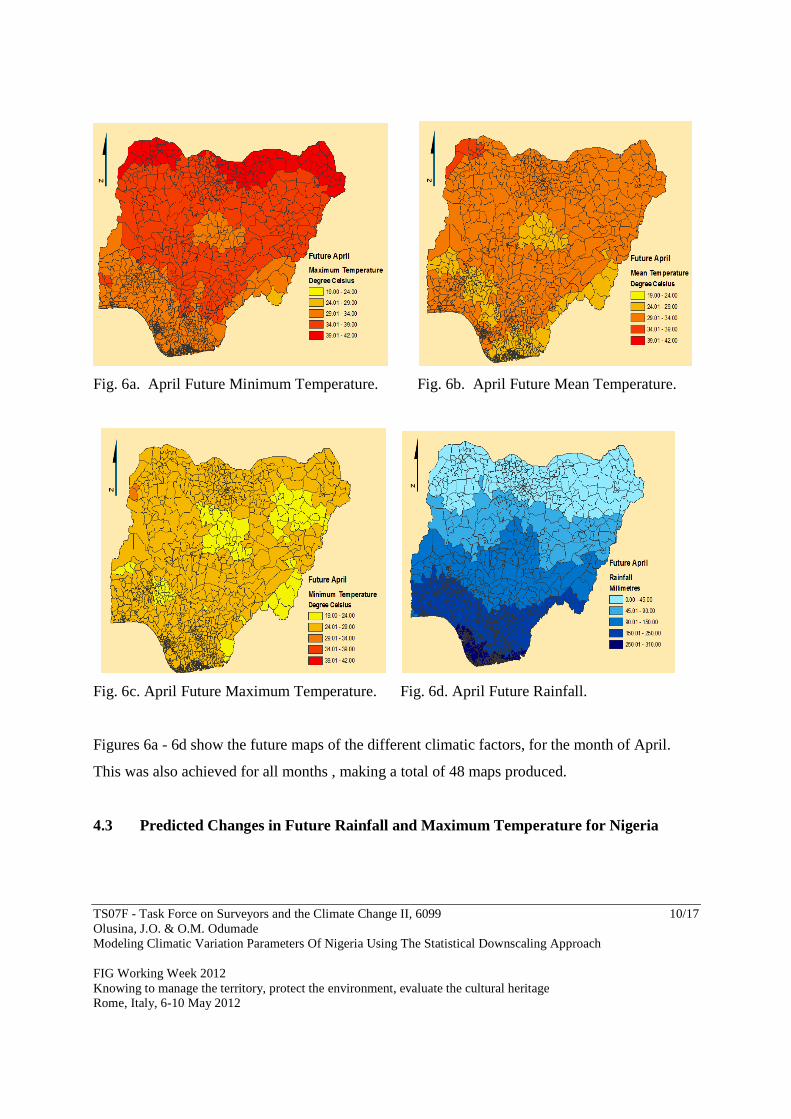
For the month of April, Future Nigerian Climate maps (Minimum, Maximum, Mean
Temperatures and Rainfall), for all the Local Government Areas (LGAs), were created (Figures
6a – 6d).
TS07F - Task Force on Surveyors and the Climate Change II, 6099 10/17 Olusina, J.O. & O.M. Odumade Modeling Climatic Variation Parameters Of Nigeria Using The Statistical Downscaling Approach FIG Working Week 2012 Knowing to manage the territory, protect the environment, evaluate the cultural heritage Rome, Italy, 6-10 May 2012
Fig. 6a. April Future Minimum Temperature. Fig. 6b. April Future Mean Temperature.
Fig. 6c. April Future Maximum Temperature. Fig. 6d. April Future Rainfall.
Figures 6a - 6d show the future maps of the different climatic factors, for the month of April.
This was also achieved for all months , making a total of 48 maps produced.
4.3 Predicted Changes in Future Rainfall and Maximum Temperature for Nigeria
TS07F - Task Force on Surveyors and the Climate Change II, 6099 11/17 Olusina, J.O. & O.M. Odumade Modeling Climatic Variation Parameters Of Nigeria Using The Statistical Downscaling Approach FIG Working Week 2012 Knowing to manage the territory, protect the environment, evaluate the cultural heritage Rome, Italy, 6-10 May 2012
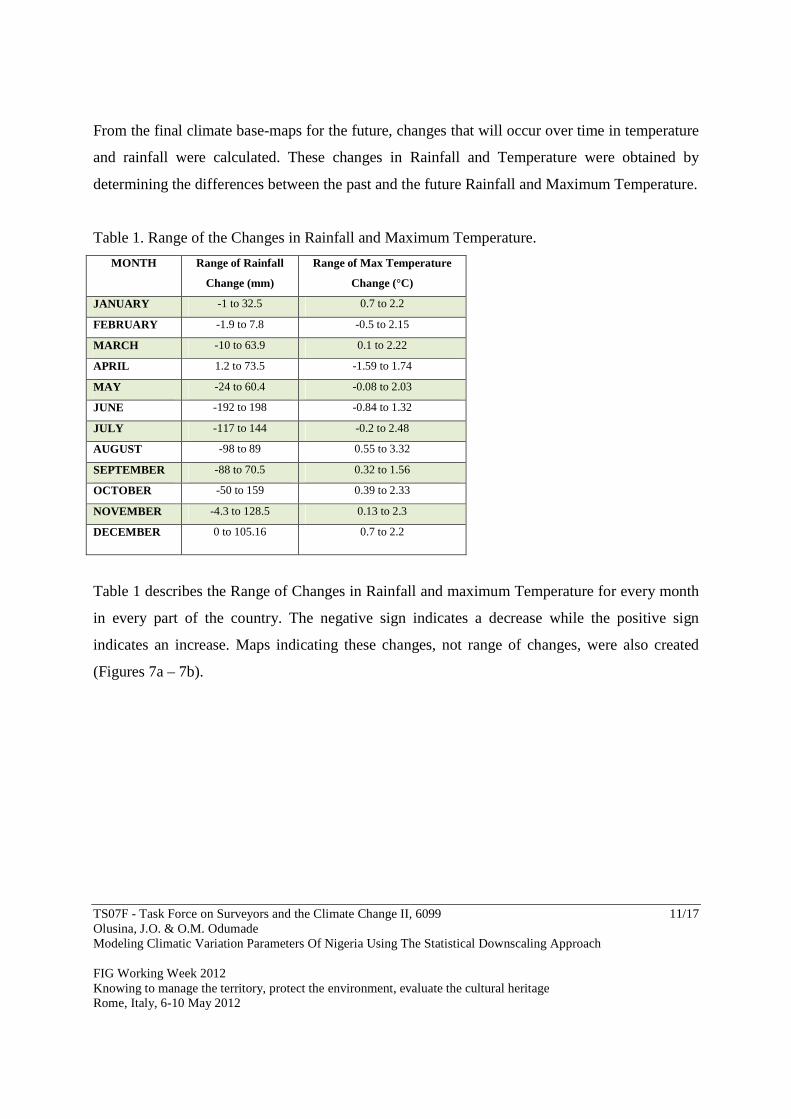
From the final climate base-maps for the future, changes that will occur over time in temperature
and rainfall were calculated. These changes in Rainfall and Temperature were obtained by
determining the differences between the past and the future Rainfall and Maximum Temperature.
Table 1. Range of the Changes in Rainfall and Maximum Temperature.
MONTH Range of Rainfall
Change (mm)
Range of Max Temperature
Change (°C)
JANUARY -1 to 32.5 0.7 to 2.2
FEBRUARY -1.9 to 7.8 -0.5 to 2.15
MARCH -10 to 63.9 0.1 to 2.22
APRIL 1.2 to 73.5 -1.59 to 1.74
MAY -24 to 60.4 -0.08 to 2.03
JUNE -192 to 198 -0.84 to 1.32
JULY -117 to 144 -0.2 to 2.48
AUGUST -98 to 89 0.55 to 3.32
SEPTEMBER -88 to 70.5 0.32 to 1.56
OCTOBER -50 to 159 0.39 to 2.33
NOVEMBER -4.3 to 128.5 0.13 to 2.3
DECEMBER 0 to 105.16 0.7 to 2.2
Table 1 describes the Range of Changes in Rainfall and maximum Temperature for every month
in every part of the country. The negative sign indicates a decrease while the positive sign
indicates an increase. Maps indicating these changes, not range of changes, were also created
(Figures 7a – 7b).
TS07F - Task Force on Surveyors and the Climate Change II, 6099 12/17 Olusina, J.O. & O.M. Odumade Modeling Climatic Variation Parameters Of Nigeria Using The Statistical Downscaling Approach FIG Working Week 2012 Knowing to manage the territory, protect the environment, evaluate the cultural heritage Rome, Italy, 6-10 May 2012
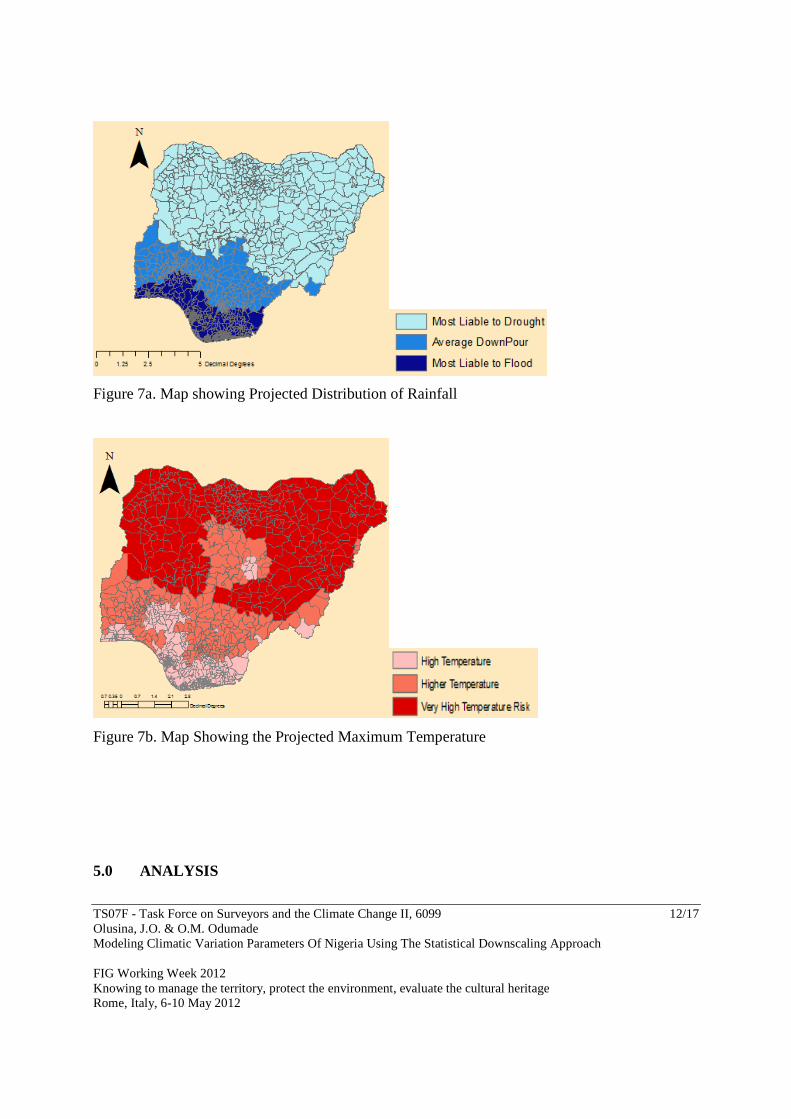
Figure 7a. Map showing Projected Distribution of Rainfall
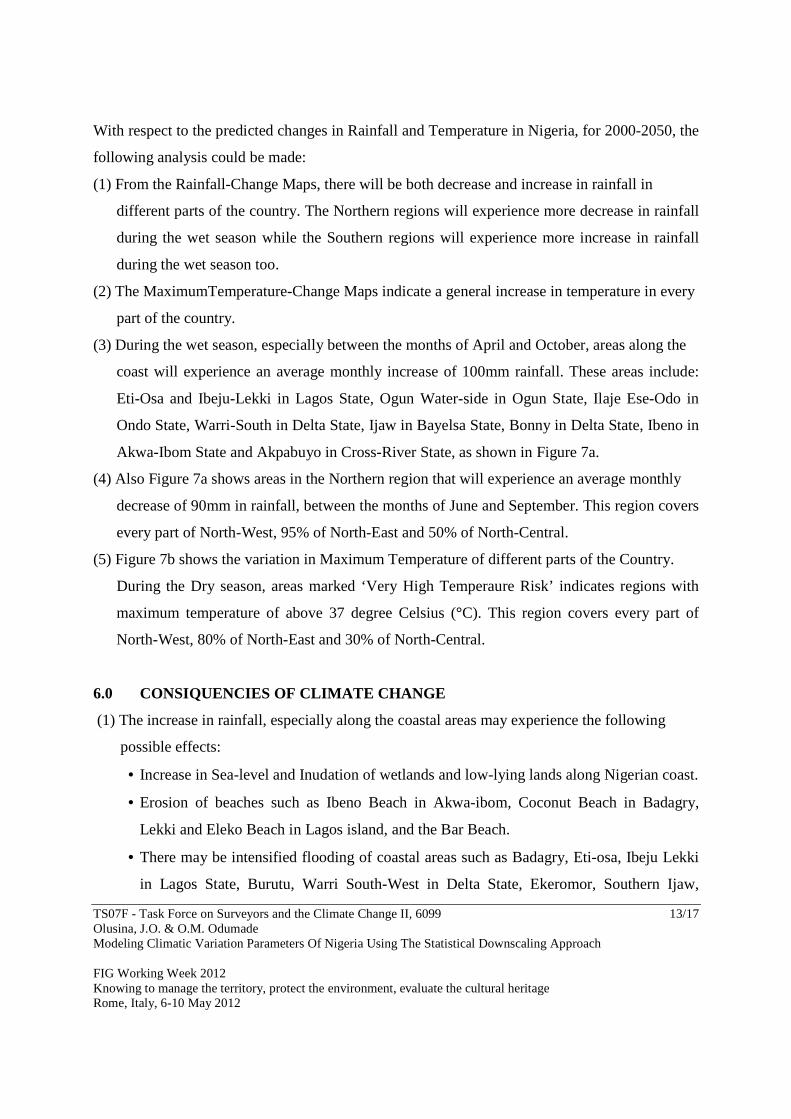
Figure 7b. Map Showing the Projected Maximum Temperature
5.0 ANALYSIS
TS07F - Task Force on Surveyors and the Climate Change II, 6099 13/17 Olusina, J.O. & O.M. Odumade Modeling Climatic Variation Parameters Of Nigeria Using The Statistical Downscaling Approach FIG Working Week 2012 Knowing to manage the territory, protect the environment, evaluate the cultural heritage Rome, Italy, 6-10 May 2012
With respect to the predicted changes in Rainfall and Temperature in Nigeria, for 2000-2050, the
following analysis could be made:
(1) From the Rainfall-Change Maps, there will be both decrease and increase in rainfall in
different parts of the country. The Northern regions will experience more decrease in rainfall
during the wet season while the Southern regions will experience more increase in rainfall
during the wet season too.
(2) The MaximumTemperature-Change Maps indicate a general increase in temperature in every
part of the country.
(3) During the wet season, especially between the months of April and October, areas along the
coast will experience an average monthly increase of 100mm rainfall. These areas include:
Eti-Osa and Ibeju-Lekki in Lagos State, Ogun Water-side in Ogun State, Ilaje Ese-Odo in
Ondo State, Warri-South in Delta State, Ijaw in Bayelsa State, Bonny in Delta State, Ibeno in
Akwa-Ibom State and Akpabuyo in Cross-River State, as shown in Figure 7a.
(4) Also Figure 7a shows areas in the Northern region that will experience an average monthly
decrease of 90mm in rainfall, between the months of June and September. This region covers
every part of North-West, 95% of North-East and 50% of North-Central.
(5) Figure 7b shows the variation in Maximum Temperature of different parts of the Country.
During the Dry season, areas marked ‘Very High Temperaure Risk’ indicates regions with
maximum temperature of above 37 degree Celsius (°C). This region covers every part of
North-West, 80% of North-East and 30% of North-Central.
6.0 CONSIQUENCIES OF CLIMATE CHANGE
(1) The increase in rainfall, especially along the coastal areas may experience the following
possible effects:
• Increase in Sea-level and Inudation of wetlands and low-lying lands along Nigerian coast.
• Erosion of beaches such as Ibeno Beach in Akwa-ibom, Coconut Beach in Badagry,
Lekki and Eleko Beach in Lagos island, and the Bar Beach.
• There may be intensified flooding of coastal areas such as Badagry, Eti-osa, Ibeju Lekki
in Lagos State, Burutu, Warri South-West in Delta State, Ekeromor, Southern Ijaw,
TS07F - Task Force on Surveyors and the Climate Change II, 6099 14/17 Olusina, J.O. & O.M. Odumade Modeling Climatic Variation Parameters Of Nigeria Using The Statistical Downscaling Approach FIG Working Week 2012 Knowing to manage the territory, protect the environment, evaluate the cultural heritage Rome, Italy, 6-10 May 2012
Nembe, Brass in Bayelsa State, Bonny, Akakutor in Rivers State, Ikot Abasi, Eket, Ibeno,
Mbo in Akwa-Ibom, and Akamkpa in Cross-River during storm.
• Increase in salinity of rivers, bays such as Tarkwa Bay along Lagos Habour and
groundwater.
(2) Health
• The body responds to thermal stress by forcing blood into peripheral areas to promote
heat loss through the skin, therefore health disorders are expected at higher temperature.
Regions with very high temperature risk such as Sokoto, Bauchi, Zamfara, Katsina,
Kano, Jigawa, Niger, will likely experience high rate of morbidity. Medical disorder such
as heart failure, bronchitis, peptic ulcer, adrenal ulcer, glaucoma, goiter, eczema, and
herpes zoster are liable to these regions.
• In areas along the coast with high risk of intensified flooding, there will likely be risk of
some infectious diseases, particularly those diseases that are spread by mosquitoes and
other insects.
(3) Drought- Nigeria as a nation may experience the following drought in future:
(a) Economic
• Loss of national economic growth, slowing down of economic development, damage to
crop quality, less food production, increase in food prices, Increased importation of food
(at higher costs), insect infestation, plant diseases, loss from dairy and livestock
production, unavailability of water and feed for livestock which leads to high livestock
mortality rates, increased predation, range fires and wild land fires, damage to fish
habitat, loss from fishery production, income loss for farmers and others affected,
• Unemployment as a result of production declines, loss to recreational and tourism
industry, loss of hydroelectric power, loss of navigability of rivers and canals.
(b) Environmental and Social
• The Northern region may witness an increased desertification, damage to animal species,
reduction and degradation of fish and wildlife habitat, lack of feed and drinking water,
disease, Increased number and severity of fires, wind and water erosion of soils.
TS07F - Task Force on Surveyors and the Climate Change II, 6099 15/17 Olusina, J.O. & O.M. Odumade Modeling Climatic Variation Parameters Of Nigeria Using The Statistical Downscaling Approach FIG Working Week 2012 Knowing to manage the territory, protect the environment, evaluate the cultural heritage Rome, Italy, 6-10 May 2012
Food shortage, heat, mental and physical stress, water user conflicts, social unrest, inequity in the
distribution of drought relief, loss of cultural sites, reduced quality of life which leads to changes
in lifestyle, increased poverty and population migrations.
7.0 CONCLUSION AND RECOMMENDATIONS
7.1 Conclusion
This research was carried out to be able to predict what the future weather, temperature and
rainfall, conditions will be in Nigeria for the next 50 years (2000-2050). From the work, climate
change scenarios indicate that the climatic variability currently being experienced is likely to
increase and intensify in future. Droughts, floods and storms are likely to increase in both
frequency and intensity.
By this prediction, Nigeria will fit into the following categories of extreme events:
• Warmer and more frequent hot days and nights over most land areas;
• Warm spells/heat waves-frequency increases over most land areas;
• Heavy precipitation events-frequency (or proportion of total rainfall from heavy falls)
increases over most areas; and
• Area affected by droughts may increase.
The on-going climate change and its associated global warming are expected to cause
characteristic climate patterns in different climatic regions and will have its negative impact on
the ecosystem. Therefore, changes in climate factors such as temperature and rainfall should not
be taken for granted.
7.2 Recommendations
In general, Nigeria like many developing nations, will need to prepare adequately for the
negative impact of climate change. All hands must be onboard in order to achieve a positive
result in combating adverse change in climate. Government agencies, private sector, civil
societies, communities and individuals must be involved. Researchers must be involved in
modeling climate change periodically, government agencies must create the awareness through
TS07F - Task Force on Surveyors and the Climate Change II, 6099 16/17 Olusina, J.O. & O.M. Odumade Modeling Climatic Variation Parameters Of Nigeria Using The Statistical Downscaling Approach FIG Working Week 2012 Knowing to manage the territory, protect the environment, evaluate the cultural heritage Rome, Italy, 6-10 May 2012
information dissemination including early warning, financial and logistic supports, while the
local communities must cooperate with other stakeholders.
It is therefore recommended that:
� the various projected climate maps and database developed, should present a platform for
all concerned disciplines to better understand our climate system and to offer a means to
access, plan and implement sustainable programs that will assist in combating these
changes and to make our nation less vulnerable, and
� as more climatic data are available, further research needs to be carried out to model
variations based on decades, yearly, monthly and daily.
REFERENCES
1. Awosika L., Ojo O. and Ajayi T. (1994), “Implications of Climate Change and Sea Level
Rise on the Niger Delta, Nigeria” – Phase 1. A report for the United Nations
Environmental Programme.
2. Ayoade, J.O (1988), “Introduction to Climatologic for the tropics”. Abiprint and Pak
Limited, Ibadan.
3. Buba AD (2004), “Climate change and water problems in Chad Republic”, J. Arid
Environ., 3(2). 42 – 50.
4. Intergovernmental Panel on Climate Change (IPCC) Fourth assessment report, 2007.
5. Laurence s. Kalkstein and Kathleen M. Vailimont 1987. “Climate Effects on Human
Health”. U.S. Environmental Protection Agency (EPA) Science and Advisory Committee
Monograph No. 25389, 122-52. Washington, D.C.
6. McQuire B, Macon I, Kilburn C (2002). “Natural Hazards and Environmental Change”.
Arnold, London, 13 - 61.
7. New Mark, David Lister, Mike Hulme, Ian Makin (2000). "A High-Resolution data set of
Surface Climate over Global Land Areas". Climate Research 21: 1-25.
TS07F - Task Force on Surveyors and the Climate Change II, 6099 17/17 Olusina, J.O. & O.M. Odumade Modeling Climatic Variation Parameters Of Nigeria Using The Statistical Downscaling Approach FIG Working Week 2012 Knowing to manage the territory, protect the environment, evaluate the cultural heritage Rome, Italy, 6-10 May 2012
8. Nwafor JC (2006). “Environmental impact assessment for sustainable development: The
Nigerian perspective, Enugu, Environmental and development policy centre for Africa,
372-385.
9. Odjugo, P. A. O. (2010). Regional evidence of climate change in Nigeria. Journal of
Geography and Regional Planning Vol. 3(6), pp. 142-150, June 2010
Available online at http://www.academicjournals.org/JGRP. ISSN 2070-1845© 2010
Academic Journals.
10. Olaniran O.J. (2002). “Rainfall anomalies in Nigeria: The contemporary understanding”.
Paper presented at the 55th Inaugural Lecture, University of Ilorin, Nigeria, p. 55.
11. Tamuno, T. T. (2009). Climate Change and Human Wellbeing. 'IAIA09 Conference
Proceedings', Impact Assessment and Human Well-Being 29th Annual Conference of the
International Association for Impact Assessment, 16-22 May 2009, Accra International
Conference Center, Accra, Ghana (www.iaia.org).
12. The Library of Congress Country Studies (1991).The Climate of Nigeria. Available
Online: http://www.geography-site.co.uk/pages/countries/climate/nigeria_climate.html
13. Wikipedia (2012), the free encyclopedia. Geography of Nigeria. Available Online:
http://en.wikipedia.org/wiki/Geography_of_Nigeria.
14. Wikipedia (2012), the free encyclopedia. Available Online:
http://en.wikipedia.org/wiki/Climate_change.
15. www.diva-gis.org/Data
16. www.worldclim.org/node/1
17. Zuviría, M. de (2011). Spatial Modeling of Climatic Parameter Fluctuation Mapping
Temperature Variation in the Bermejo Basin from 1901 to 2000. GISdevelopment.net
Available Online: www.gisdevelopment.net/application/environment/.../mi03095pf.htm.
(Saved, Nov. 2011)