Embed Size (px)
Citation preview
Modeling of Leachate Characteristics and Clogging of GravelDrainage Mesocosms Permeated with Landfill Leachate
R. Kerry Rowe, F.ASCE1; and Yan Yu2
Abstract: A two-dimensional numerical model, BioClog, is used to estimate the leachate characteristics and leachate-induced clogging oflaboratory mesocosms permeated with real municipal solid waste landfill leachate. The model is used to examine mesocosms with 38-mm(nominal diameter) gravel subjected to different durations of leachate permeation, mesocosms run-in series, and mesocosms with 19-mmgravel. A comparison of the calculated and measured leachate concentrations indicates that the model provided reasonable predictions ofthe effluent chemical oxygen demand (COD) and calcium concentrations. The calculated porosities within the saturated drainage layers aregeneral in encouraging agreement with the measured values from all experimental mesocosms. The calculated and measured hydraulic con-ductivities are in reasonable agreement. The modeling results indicated that reducing the mass loading for the drainage layers and increasingthe particle size of granular media can be expected to extend the time before clogging of drainage layers, and therefore, to extend the service lifeof landfill leachate collection systems. DOI: 10.1061/(ASCE)GT.1943-5606.0000834. © 2013 American Society of Civil Engineers.
CE Database subject headings: Experimentation; Numerical models; Gravel; Landfills; Clogging.
Author keywords: Experimental cells; Numerical modeling; Leachate characteristics; Clogging; Leachate collection systems; Landfills.
Introduction
Modern municipal solid waste (MSW) landfills are generally re-quired to have a barrier system to minimize contaminant migrationinto the surrounding environment (Rowe et al. 2004; Rowe 2005).Two components are normally included in a barrier system: (1)a high permeability leachate collection system (LCS), and (2) anunderlying low permeability liner. Although much has been writtenon liner performance (Bacas et al. 2011; Chappel et al. 2012; Eid2011; Fox et al. 2011; Gudina and Brachman 2011; Rayhani et al.2011; Rowe 2011, 2012a, b; Rowe et al. 2012), much less has beenwritten on the other key component of the barrier system—the LCS.The LCS in a landfill is intended to allow the leachate within thegranular drainage layer to freely drain to the perforated drainagepipes and from the pipes to sumps where the leachate is removedfrom the landfill for treatment. To reduce the potential impact onhuman health and the environment by the leakage of leachate intothe groundwater and surface water, the leachate head on the bottomliner is typically required to be less than the design thickness of thegranular drainage layer (0.3–0.5 m) (Rowe et al. 2004).
Field studies have shown that, when permeated with landfillleachate, the drainage material within the LCSs is prone to the de-velopment of a clog mass within the void spaces because of the bio-geochemical processes that result in the growth of biomass, deposition
of suspended particles, and precipitation of minerals [Bass 1986;Brune et al. 1991;Koerner et al. 1993, 1994;McBeanet al. 1993;Rowe1998; Fleming et al. 1999; Craven et al. 1999; Maliva et al. 2000;Bouchez et al. 2003; Levine et al. 2005 (EPA, Research Triangle Park,NC, unpublished internal report, 1982)]. The accumulation of clogmass, which reduces the porosity and hydraulic conductivity ofdrainagematerial, causes the leachate head to buildupwithin theLCSs.
A numerical model, BioClog, was developed to model both lab-oratorycolumntests (Cooke et al. 2005a) and LCSs (Cooke andRowe2008a). Cooke et al. (2005b) and VanGulck and Rowe (2008) foundthat, for columnexperiments, theBioClogmodel gave a good estimateof the effluent leachate characteristics compared with the measureddata. It also gave a good estimate of the clog mass within the porousmedia from the influent to the effluent end. Cooke and Rowe (2008b)used BioClog to model two laboratory mesocosms reported byMcIsaac andRowe (2007). Themodeling results showed that the clogmass at the upper regions of the saturated gravel layer estimated bythe numerical model agreed well with the measured values, whereasthemodel underestimated the clogging of gravel at lower regions. TheBioClogmodelwas enhanced byYuandRowe (2012a) to address thislimitation of the original BioClog model.
The objective of this paper is to evaluate the performance of theenhanced BioClog model for predicting the changes in leachatecharacteristics and clogging of saturated gravel drainage layers bycomparing the calculated performance with that observed in severallaboratory mesocosms (Fleming 1999; Fleming and Rowe 2004;McIsaac 2007;McIsaac andRowe 2007). Considerationwill be givento thecellsoriginallyexaminedbyCookeandRowe(2008b)with38-mmgravel (C03, C04), mesocosms run-in series (C03-C23-C24-C25,C04-C26), and mesocosms with 19-mm gravel (C19, C20).
BioClog Model (Summary)
BioClogmodels the fate and transport of key constituents in leachateand the formation of clog mass within the porous media (Cooke andRowe2008a;Yu andRowe2012a). Three volatile fatty acids (acetate,butyrate, and propionate) are modeled because they contribute most
1Professor and Canada Research Chair in Geotechnical and Geoenvir-onmental Engineering, GeoEngineering Centre at Queen’s-RMC, Dept. ofCivil Engineering, Queen’s Univ., Kingston, ON, Canada K7L 3N6 (cor-responding author). E-mail: [email protected]
2Postdoctoral Fellow, GeoEngineering Centre at Queen’s-RMC, Dept.of Civil Engineering, Queen’s Univ., Kingston, ON, Canada K7L 3N6.E-mail: [email protected]
Note. This manuscript was submitted on December 21, 2011; approvedon September 10, 2012; published online on September 12, 2012. Discus-sion period open until December 1, 2013; separate discussions must besubmitted for individual papers. This paper is part of the Journal ofGeotechnical and Geoenvironmental Engineering, Vol. 139, No. 7, July1, 2013. ©ASCE, ISSN 1090-0241/2013/7-1022–1034/$25.00.
1022 / JOURNAL OF GEOTECHNICAL AND GEOENVIRONMENTAL ENGINEERING © ASCE / JULY 2013
J. Geotech. Geoenviron. Eng. 2013.139:1022-1034.
Dow
nloa
ded
from
asc
elib
rary
.org
by
Que
en's
Uni
vers
ity L
ibra
ries
on
06/1
9/14
. Cop
yrig
ht A
SCE
. For
per
sona
l use
onl
y; a
ll ri
ghts
res
erve
d.
of chemical oxygen demand (COD) in normal MSW leachate, andthey are also relatively easily biodegraded, resulting, inter alia, in theproduction of carbonic acid, which is the source of carbonate that isa predominate contributor to clogging (Bennett et al. 2000; VanGulcket al. 2003). Both the suspended organic biomass and inorganic solidsin leachate are modeled, where the suspended organic biomassincludes the suspended active biomass and inert biomass, and thedecay of the suspended active biomass is converted to the suspendedinert biomass. The dissolved calcium in leachate is also modeled.
The clog mass within the porous media is quantified in terms ofthe thicknesses of five separate films attached to the surface ofporous media (three active biofilms, inert biofilm, and inorganicsolids film). The active biofilms (acetate, butyrate, and propionatedegraders) increase the mass from the deposition of suspended ac-tive biomass and growth of active biofilms. They losemass by decayand through detachment from the shear stress, as described in detailby Rittmann (1982). The inert biofilm increases the mass by thedecay of active biofilms and from the deposition of suspended inertbiomass. The inert biofilm decreases the mass through detachmentfrom shearing. The inorganic solids film increases the mass from thedeposition of suspended inorganic solid particles and precipitationof calcium carbonate and other minerals. In the enhanced BioClogmodel (Yu and Rowe 2012a), the deposition of suspended particleswithin the saturated porous media is modeled based on the at-tachment of suspended particles using amodel proposed byTien andRamarao (2007), but is further modified to include a depositionfactor where the effect of particle size range (0.001–0.1 mm) ofsediment and microorganisms from real landfill leachate (Koernerand Koerner 1992; McIsaac 2007) was taken into account.
The finite-element method (FEM) is used to solve the partial dif-ferential equations for fluid flow and species transport (Istok 1989).The surface of the leachate mound is found using an iterative method(Cooke 2007). The increase in total thickness of films (the accu-mulation of clog mass) reduces the void spaces within the porousmedia. The porosity and specific surface of porous media are cal-culated with a geometric model (Yu and Rowe 2012b). The decreasein porosity causes a reduction in hydraulic conductivity of porousmedia that changes the flow field within the saturated drainage layerand results in leachate mounding into the previous unsaturated zone.
Laboratory Mesocosms
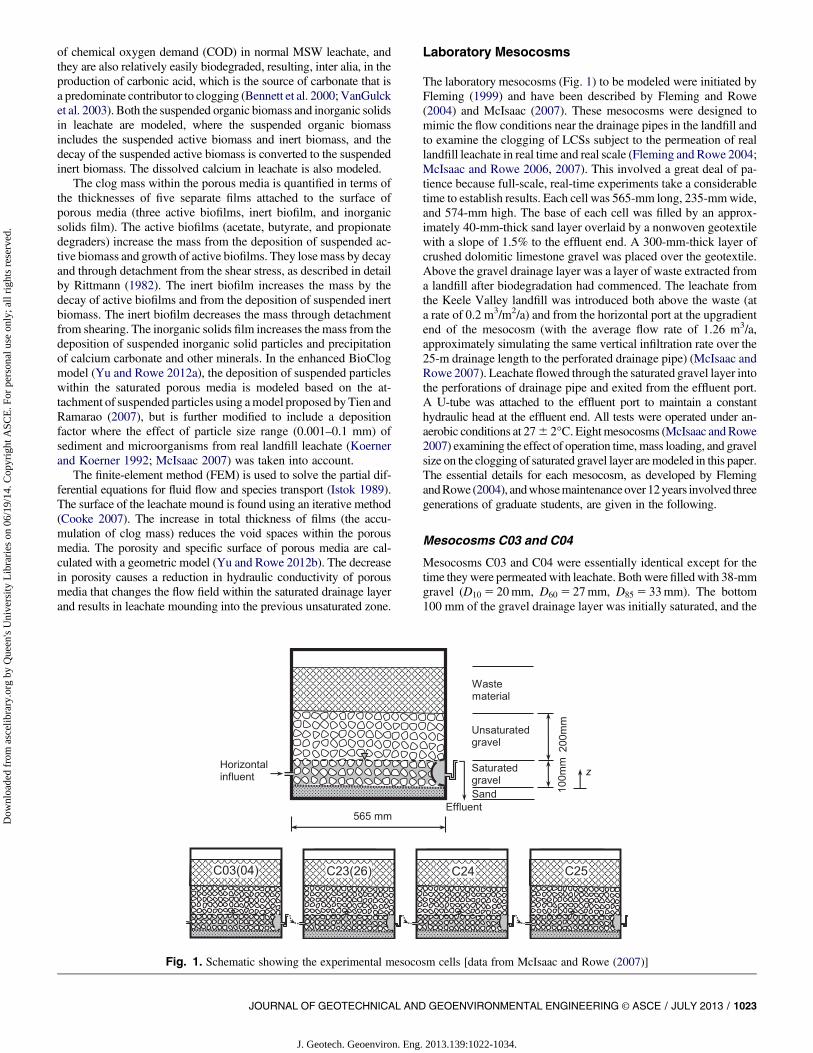
The laboratory mesocosms (Fig. 1) to be modeled were initiated byFleming (1999) and have been described by Fleming and Rowe(2004) and McIsaac (2007). These mesocosms were designed tomimic the flow conditions near the drainage pipes in the landfill andto examine the clogging of LCSs subject to the permeation of reallandfill leachate in real time and real scale (Fleming and Rowe 2004;McIsaac and Rowe 2006, 2007). This involved a great deal of pa-tience because full-scale, real-time experiments take a considerabletime to establish results. Each cell was 565-mm long, 235-mmwide,and 574-mm high. The base of each cell was filled by an approx-imately 40-mm-thick sand layer overlaid by a nonwoven geotextilewith a slope of 1.5% to the effluent end. A 300-mm-thick layer ofcrushed dolomitic limestone gravel was placed over the geotextile.Above the gravel drainage layer was a layer of waste extracted froma landfill after biodegradation had commenced. The leachate fromthe Keele Valley landfill was introduced both above the waste (ata rate of 0.2 m3/m2/a) and from the horizontal port at the upgradientend of the mesocosm (with the average flow rate of 1.26 m3/a,approximately simulating the same vertical infiltration rate over the25-m drainage length to the perforated drainage pipe) (McIsaac andRowe 2007). Leachate flowed through the saturated gravel layer intothe perforations of drainage pipe and exited from the effluent port.A U-tube was attached to the effluent port to maintain a constanthydraulic head at the effluent end. All tests were operated under an-aerobic conditions at 276 2�C. Eightmesocosms (McIsaac andRowe2007) examining the effect of operation time,mass loading, and gravelsize on the clogging of saturated gravel layer aremodeled in this paper.The essential details for each mesocosm, as developed by FlemingandRowe (2004), andwhosemaintenanceover 12years involved threegenerations of graduate students, are given in the following.
Mesocosms C03 and C04
Mesocosms C03 and C04 were essentially identical except for thetime theywere permeatedwith leachate. Both werefilled with 38-mmgravel (D10 5 20mm, D60 5 27mm, D85 5 33mm). The bottom100 mm of the gravel drainage layer was initially saturated, and the
Fig. 1. Schematic showing the experimental mesocosm cells [data from McIsaac and Rowe (2007)]
JOURNAL OF GEOTECHNICAL AND GEOENVIRONMENTAL ENGINEERING © ASCE / JULY 2013 / 1023
J. Geotech. Geoenviron. Eng. 2013.139:1022-1034.
Dow
nloa
ded
from
asc
elib
rary
.org
by
Que
en's
Uni
vers
ity L
ibra
ries
on
06/1
9/14
. Cop
yrig
ht A
SCE
. For
per
sona
l use
onl
y; a
ll ri
ghts
res
erve
d.
rest of the drainage layer was unsaturated. Mesocosm C04 was ex-humed after approximately 6 years, whereas mesocosm C03 wasexhumed after 12 years. Mesocosms C03 and C04 were previouslymodeled byCooke andRowe (2008b) using the initial BioClogmodel(Cooke and Rowe 2008a). These mesocosms are re-examined in thispaper using the enhanced BioClog model (Yu and Rowe 2012a).
Mesocosms Run-In Series C04-C26 andC03-C23-C24-C25
Because each mesocosm was 0.565-m long, these mesocosms wereintended to examine clogging when leachate flows through a1.13-m-long (C04-C26) and 2.26-m-long (C03-C23-C24-C25)gravel system by connecting the mesocosms in series, such thatthe leachate passing through the first mesocosm (C03 or C04) wasinput as the horizontal influent to the next mesocosm in the series(C23 or C26); for the second series, after flowing through thismesocosm, it became the influent to the next mesocosm (C24),whose outflow finally was the influent for the last mesocosm in theseries (C25). Allmesocosms received similar fresh [fromKeeleValleyLandfill (KVL)] leachate at a rate equivalent to approximately 0.2 m/year introduced above the waste overlying the gravel. Each of thesemesocosms had a 300-mm thick layer of 38-mm gravel. Similar tomesocsoms C03 and C04 (described previously), the bottom 100 mmof gravel was saturated and the top 200mm of gravel was unsaturated.After approximately 6 years of operation, mesocosms C23, C24, C25,C04, and C26 were exhumed to examine the clogging.
Mesocosms C19 and C20
MesocosmC19 and its duplicate C20 both had a 300-mm-thick layerof 19-mm gravel (D10 5 10mm, D60 5 16mm, D85 5 19mm).Thesemesocosmswere similar toC03 andC04, except for the size ofthe gravel used. The bottom 100mmof gravel drainage layer in eachmesocosm was initially saturated, and the remaining 200-mm-thickgravel layer was initially unsaturated. These mesocosms (C19 andC20) were exhumed after approximately 6 years.
Modeling
Modeling involved two stages at each time step: (1) modeling ofthe flow region using the porosities and hydraulic conductivitiesestablished based on the transport modeling in the previous timestep, and (2) transport modeling and assessment of the change inporosities and hydraulic conductivities because of clogging in thistime step. The following subsections summarize the key aspects ofthe modeling and the relevant parameters.
Boundary Conditions for Modeling
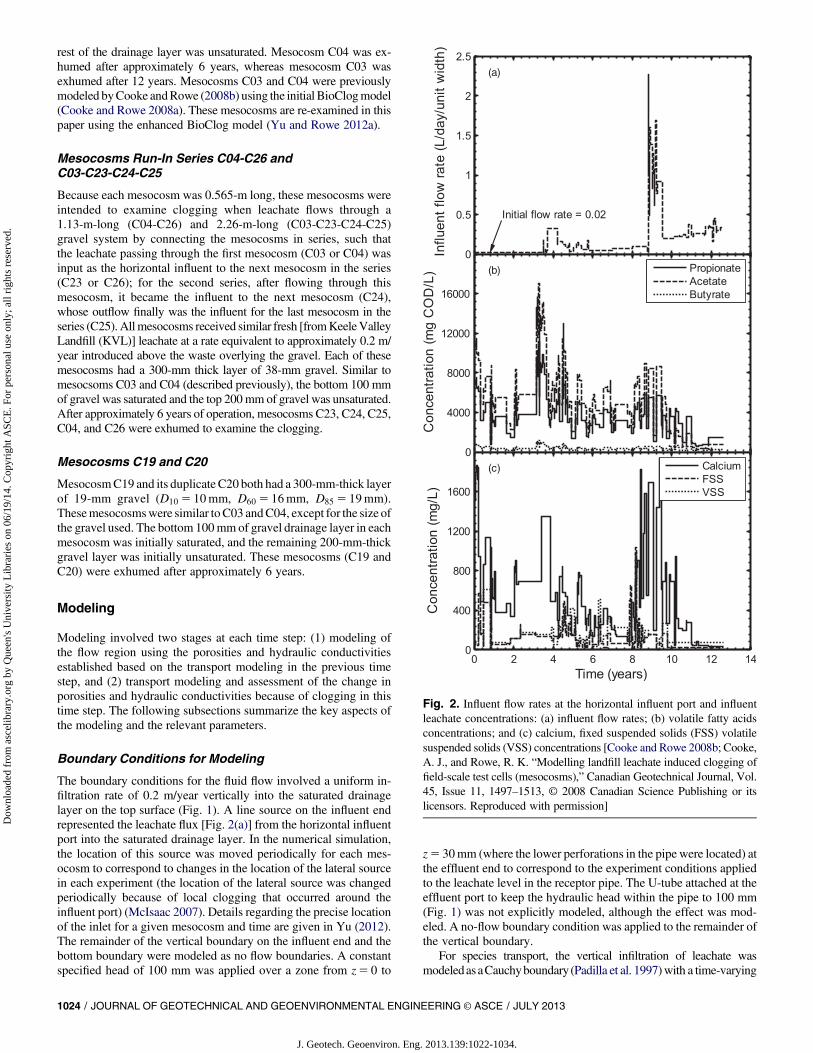
The boundary conditions for the fluid flow involved a uniform in-filtration rate of 0.2 m/year vertically into the saturated drainagelayer on the top surface (Fig. 1). A line source on the influent endrepresented the leachate flux [Fig. 2(a)] from the horizontal influentport into the saturated drainage layer. In the numerical simulation,the location of this source was moved periodically for each mes-ocosm to correspond to changes in the location of the lateral sourcein each experiment (the location of the lateral source was changedperiodically because of local clogging that occurred around theinfluent port) (McIsaac 2007). Details regarding the precise locationof the inlet for a given mesocosm and time are given in Yu (2012).The remainder of the vertical boundary on the influent end and thebottom boundary were modeled as no flow boundaries. A constantspecified head of 100 mm was applied over a zone from z5 0 to
z5 30mm (where the lower perforations in the pipe were located) atthe effluent end to correspond to the experiment conditions appliedto the leachate level in the receptor pipe. The U-tube attached at theeffluent port to keep the hydraulic head within the pipe to 100 mm(Fig. 1) was not explicitly modeled, although the effect was mod-eled. A no-flow boundary condition was applied to the remainder ofthe vertical boundary.
For species transport, the vertical infiltration of leachate wasmodeledasaCauchyboundary (Padilla et al. 1997)with a time-varying
Fig. 2. Influent flow rates at the horizontal influent port and influentleachate concentrations: (a) influent flow rates; (b) volatile fatty acidsconcentrations; and (c) calcium, fixed suspended solids (FSS) volatilesuspended solids (VSS) concentrations [Cooke and Rowe 2008b; Cooke,A. J., and Rowe, R. K. “Modelling landfill leachate induced clogging offield-scale test cells (mesocosms),” Canadian Geotechnical Journal, Vol.45, Issue 11, 1497–1513, © 2008 Canadian Science Publishing or itslicensors. Reproduced with permission]
1024 / JOURNAL OF GEOTECHNICAL AND GEOENVIRONMENTAL ENGINEERING © ASCE / JULY 2013
J. Geotech. Geoenviron. Eng. 2013.139:1022-1034.
Dow
nloa
ded
from
asc
elib
rary
.org
by
Que
en's
Uni
vers
ity L
ibra
ries
on
06/1
9/14
. Cop
yrig
ht A
SCE
. For
per
sona
l use
onl
y; a
ll ri
ghts
res
erve
d.
specific species total flux selected to correspond to the experimentaldata. The horizontal flow was modeled as a line source with a time-varying concentration based on experimental data. The effect of thewaste and unsaturated gravel layer on the leachate characteristicsfrom the vertical influent ports were not considered because theleachate causing the clogging of the saturated drainage layer wasmostly from the lateral influent port in this experiment, and hence,the effect of the infiltration through the waste was minor in theseparticular experiments. The location of the line source variedsomewhat depending on the mesocosm and time [because it had tobe moved periodically because of clogging near the inlet as notedpreviously and as described by McIsaac (2007)]. The upstreamvertical boundary (apart from the line source) andbaseweremodeled aszero flux boundaries. The downstream vertical boundary was modeledas an open zone from z5 0 to z5 30mm with a nonprescribed dis-persive flux [the free-exit condition; Frind (1988)] to model thepresence of the perforations in the drainage pipe at this location, and theremainder of this boundary was zero flux because of symmetry.
Finite-Element Model Mesh
The saturated gravel drainage layer in mesocosms C03 and C04 wasmodeled using 738 three-noded triangle elements and 420 nodes.A mesh with total 1,660 nodes and 2,952 three-noded triangle ele-ments was used for modeling each of the four mesocosms in seriesC03(04), C23(26), C24, and C25. The mesh for modeling meso-cosms C19 (20) was the same as that used for modeling mesocosmsC03(04).
Porosity of Granular Material and Relationship betweenHydraulic Conductivity and Porosity
The initial porosities of 38- and 19-mm gravel were 0.41 and 0.37,respectively (McIsaac 2007). The D60 value from the grading curvewas used to represent the ideal grain size of granular material inthe BioClog modeling. The D60 values were 27 and 16 mm for the38- and 19-mm gravel, respectively. Based on experimental data(McIsaac 2007), the initial hydraulic conductivities were taken to be0.12 and 0.03 m/s for the 38- and 19-mm gravel, respectively.
The accumulation of clog mass within the pore spaces decreasesboth the porosity and hydraulic conductivity of porous media whenpermeated with landfill leachate. An exponential relationship be-tween the hydraulic conductivity and porosity was established forporous media based on laboratory data over a range of porosity(Armstrong 1998; Rowe et al. 2002; VanGulck 2003; VanGulck andRowe 2004a, b; Cooke et al. 2005b)
k ¼ Akebkn ð1Þ
where k 5 hydraulic conductivity of clogged porous media; n 5porosity; and the coefficients Ak and bk were obtained from themeasured data with regression analysis. For the gravel modeled inthis paper, the adopted values of Ak and bk are given in Table 1together with the applicable range in porosity.
Influent Flow Rates and Leachate Characteristics
The influent flow rates (Fig. 2) and leachate characteristics (Table 2and Fig. 2) used as inputs for modeling mesocosms C03 (04) werebased on Cooke and Rowe (2008b), Fleming (1999), and McIsaac(2007). The same influent flow rates and leachate characteristics forthe first 6.2 years were used as input to the first mesocosm in theseries C03-C23-C24-C25 and C04-C26, and to both mesocosmsC19 and C20. These parameters were assumed to be constant be-tween every two times when the flow rate and concentrations were
measured. The same leachate was applied at both horizontal andvertical influent ports.
Fatty Acids and Biomass-Related Coefficients
The degradation rate for each fatty acid and the growth and decay ofbiomass are controlled by four kinetic rate coefficients (the maxi-mum specific rate of substrate utilization, bq; the half-maximum ratesubstrate concentration, Ks; the endogenous decay coefficient, bd;and the maximum yield coefficient, Y). The values of these coef-ficients are influenced by many factors (Cooke and Rowe 2008b),and a large variation in values has been reported (Pavlostathis andGiraldo-Gomez 1991). Two sets of values for the kinetic rate co-efficients (Case 1 andCase 2 listed inTable 3)were used byCooke andRowe (2008b) for modeling mesocosms C03(04). The Case 1 kineticrate coefficients were values reported by Cooke et al. (2005b) usingdata from the laboratory columns operated at 21�C, and the Case 2kinetic rate coefficients were values reported by Babcock (2005) andRowe and Babcock (2007) using data from laboratory columns op-erated at 27�C. Both Cases 1 and 2 are considered in this paper.
The growth of each active biofilm (Rittmann and Brunner 1984)was evaluated from the flux of substrate into the biofilm through theeffective diffusion layer (Rittmann and McCarty 1981). The coef-ficients of molecular diffusion of substrates in the free solution, Do
and within the biofilm Df (Table 3), were based on measured valuesreported by Yu and Pinder (1994) at 35�C. The thickness of the ef-fective diffusion layerwas calculated by amethod proposed byYu andRowe (2012a) that was modified fromWilson and Geankoplis (1966).The fraction of active biomass degradable by decaywas taken to be 0.8(Rittmann and Snoeyink 1984). The mass from decay of active bio-mass that was not degraded was converted to the inert biomass.
Clog Mass Parameters
Provided that therewas sufficient calcium available in the leachate toprecipitate, the amount of clog mass from the precipitation of cal-cium carbonate was based primarily on the production of carbonicacid generated by the biodegradation of the volatile fatty acids in the
Table 1. Gravel Properties
Particle size Hydraulic conductivity coefficient
dg 5D60 (mm) Ak (m/s) bk Applicable range in porosity (n)
27a 9:83 10�6 22.9 0:21# n# 0:412:43 10�8 51.0 0, n, 0:21
16 3:53 10�7 30.9 0:21# n# 0:372:03 10�8 44.3 0, n, 0:21
aCooke and Rowe (2008b).
Table 2. Influent Leachate Characteristics [data from Cooke and Rowe(2008b)]
Parameters Time period (years) Value
fPAB 0–9.7 0.905fPAB 9.7–12.6 0.6VFA ratio (Pr:Ac:Bu) 0–9.7 0.38:0.58:0.04VFA ratio (Pr:Ac:Bu) 9.7–12.6 0.59:0.32:0.09VFAs, Ca, VSS, FSS (mg/L) 0–12.6 Variable (see Fig. 2)VSS % active 0–12.6 70VSS ratio Pr:Ac:Bu 0–12.6 1:1:1
Note: Ca 5 calcium; FSS 5 fixed suspended solids; fPAB 5 fraction ofchemical oxygen demand (COD) that is from propionate (Pr), acetate (Ac),and butyrate (Bu); VFA 5 volatile fatty acid; VSS 5 volatile suspendedsolids.
JOURNAL OF GEOTECHNICAL AND GEOENVIRONMENTAL ENGINEERING © ASCE / JULY 2013 / 1025
J. Geotech. Geoenviron. Eng. 2013.139:1022-1034.
Dow
nloa
ded
from
asc
elib
rary
.org
by
Que
en's
Uni
vers
ity L
ibra
ries
on
06/1
9/14
. Cop
yrig
ht A
SCE
. For
per
sona
l use
onl
y; a
ll ri
ghts
res
erve
d.
leachate multiplied by the carbonic acid yield coefficient (VanGulcket al. 2003). The maximum value of carbonic acid yield coefficientYH,Max was set to 0.05 based on experimental data (Cooke et al.2005b). The availability of calciumwasmodeled, and as the calciumconcentration approached zero, the precipitationwas reduced to zeroas described in Yu (2012). The ratio of the volume of mineralprecipitation (other than calcium carbonate) to the volume of cal-cium carbonate precipitated [fOP; Cooke et al. (2005a)] was set to0.06 as measured in column experiments by VanGulck and Rowe(2004b). Based on experimental data from McIsaac (2007), theformation of clogmass in the unsaturated zone just above the surfaceof the leachate mound was modeled as described by Yu and Rowe(2012a) using parameters given in Table 4 (ALf 5 0:0025 andBLf 5 4:4). The density of biofilm was evaluated using parameters(AX and BX) given in Table 4, which are based on experimental data(Cooke et al. 2005a). The inorganic film density was taken to be2,750 mg/cm3 as measured by VanGulck et al. (2003).
Suspended Particles–Related Parameters
The deposition of suspended particles on the surface of porousmedia was modeled based on Tien and Ramarao (2007) and a de-position factor as described in Yu and Rowe (2012a). The organicand inorganic particle densities (Table 4) were based on VanGulck(2003) and VanGulck and Rowe (2008). The effective diameter forthe organic particles was taken to be 0.0001 cm (Metcalf and Eddy,Inc. 1991). The inorganic particles had an effective diameter of0.0002 cm, which was within the range of particle sizes found inlandfill leachate (Koerner and Koerner 1992). The deposition factorparameters ASP and BSP were taken to be 40 and 5, respectively(Table 4). The shear stress (Rittmann 1982) was considered formodeling the detachment of biofilms. It was assumed that there wasno detachment for inorganic film. The inert biofilm detachment waslimited by the protection coefficient P5 0:00104 cm (Cooke et al.2005a; Cooke and Rowe 2008b).
Other Parameters
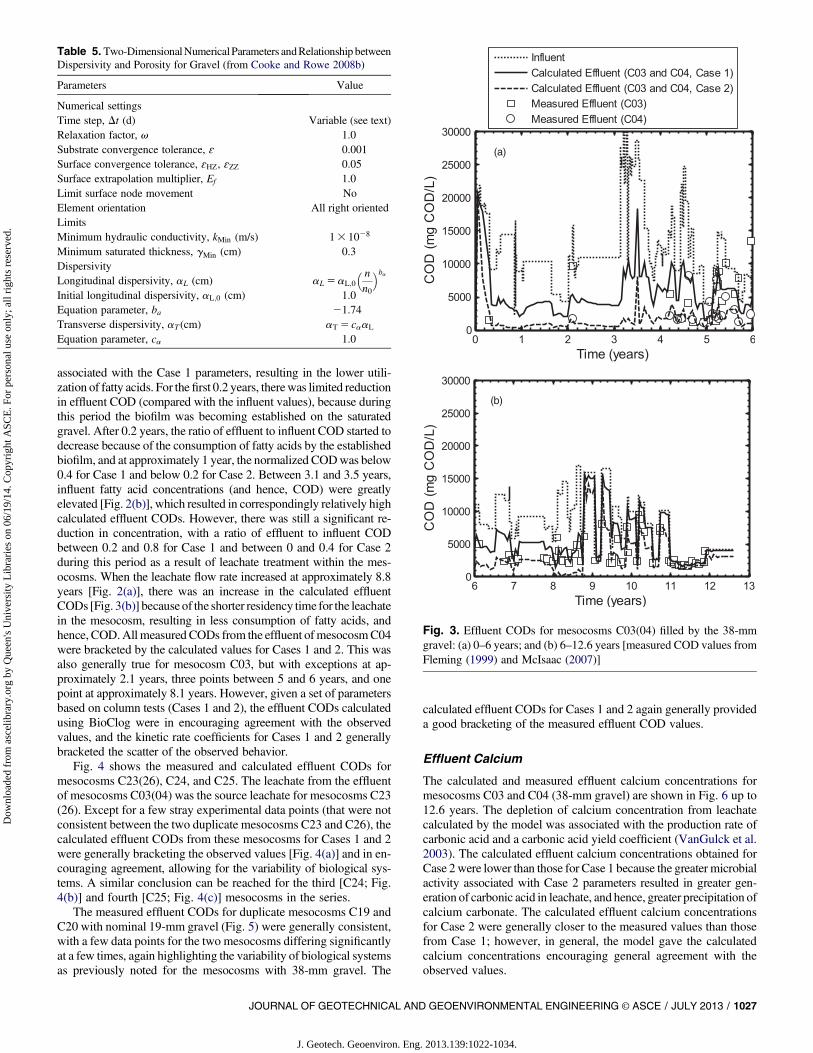
The same time step was used for modeling the fluid flow and formodeling the species transport. The time step was 0.025 day from0 to 3.5 years, 0.01 day from 3.5 to 8.6 years, and 0.0025 day from8.6 to 12.6 years for mesocosms C03(04), C23(26), C24, and C25.
The time step was 0.0025 day for mesocosms C19(20). The longi-tudinal dispersivity of saturated gravel was increased as the porosityreduced because of the clogging of porous media (Table 5) based onan equation (Cooke and Rowe 2008a) modified from Taylor andJaffe (1990). The transverse dispersivity was assumed to be the sameas the longitudinal dispersivity because of the relatively uniformnature of the media and small scale modeled.
Results and Discussion
Effluent Chemical Oxygen Demand
The measured and calculated effluent CODs for mesocosms C03(from 0 to 12.6 years) andC04 (from 0 to 6 years)with 38-mmgravelare shown in Fig. 3. Over the first 6 years, mesocosms C03 and C04were nominally identical, and hence, the variation in experimentaldata shown in Fig. 3 indicates the experimental variability that canoccur in these systems. The effluent CODs calculated for Case 1 werehigher than those for Case 2 because of the lower microbial activity
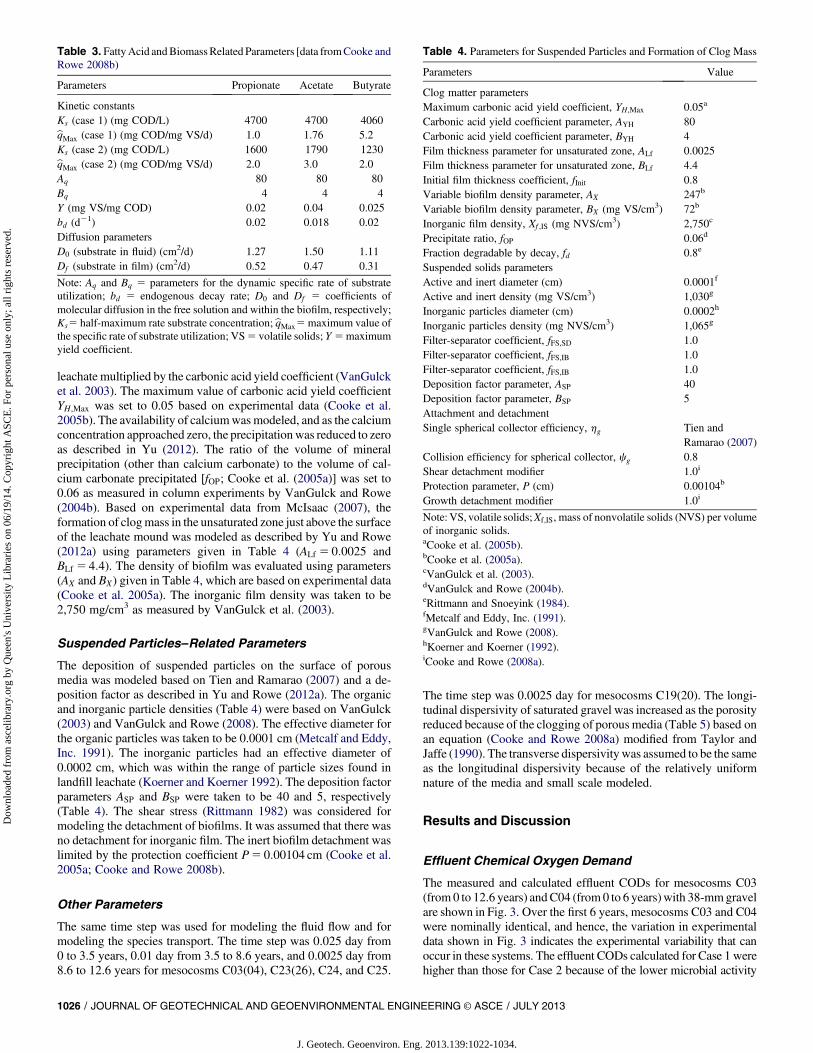
Table 3. FattyAcid andBiomassRelated Parameters [data fromCooke andRowe 2008b)
Parameters Propionate Acetate Butyrate
Kinetic constantsKs (case 1) (mg COD/L) 4700 4700 4060bqMax (case 1) (mg COD/mg VS/d) 1.0 1.76 5.2Ks (case 2) (mg COD/L) 1600 1790 1230bqMax (case 2) (mg COD/mg VS/d) 2.0 3.0 2.0Aq 80 80 80Bq 4 4 4Y (mg VS/mg COD) 0.02 0.04 0.025bd (d21) 0.02 0.018 0.02Diffusion parametersD0 (substrate in fluid) (cm2/d) 1.27 1.50 1.11Df (substrate in film) (cm2/d) 0.52 0.47 0.31
Note: Aq and Bq 5 parameters for the dynamic specific rate of substrateutilization; bd 5 endogenous decay rate; D0 and Df 5 coefficients ofmolecular diffusion in the free solution and within the biofilm, respectively;Ks5 half-maximum rate substrate concentration; bqMax5maximum value ofthe specific rate of substrate utilization; VS5 volatile solids; Y 5maximumyield coefficient.
Table 4. Parameters for Suspended Particles and Formation of Clog Mass
Parameters Value
Clog matter parametersMaximum carbonic acid yield coefficient, YH,Max 0.05a
Carbonic acid yield coefficient parameter, AYH 80Carbonic acid yield coefficient parameter, BYH 4Film thickness parameter for unsaturated zone, ALf 0.0025Film thickness parameter for unsaturated zone, BLf 4.4Initial film thickness coefficient, fInit 0.8Variable biofilm density parameter, AX 247b
Variable biofilm density parameter, BX (mg VS/cm3) 72b
Inorganic film density, Xf ,IS (mg NVS/cm3) 2,750c
Precipitate ratio, fOP 0.06d
Fraction degradable by decay, fd 0.8e
Suspended solids parametersActive and inert diameter (cm) 0.0001f
Active and inert density (mg VS/cm3) 1,030g
Inorganic particles diameter (cm) 0.0002h
Inorganic particles density (mg NVS/cm3) 1,065g
Filter-separator coefficient, fFS,SD 1.0Filter-separator coefficient, fFS,IB 1.0Filter-separator coefficient, fFS,IB 1.0Deposition factor parameter, ASP 40Deposition factor parameter, BSP 5Attachment and detachmentSingle spherical collector efficiency, hg Tien and
Ramarao (2007)Collision efficiency for spherical collector, cg 0.8Shear detachment modifier 1.0i
Protection parameter, P (cm) 0.00104b
Growth detachment modifier 1.0i
Note: VS, volatile solids;Xf,IS, mass of nonvolatile solids (NVS) per volumeof inorganic solids.aCooke et al. (2005b).bCooke et al. (2005a).cVanGulck et al. (2003).dVanGulck and Rowe (2004b).eRittmann and Snoeyink (1984).fMetcalf and Eddy, Inc. (1991).gVanGulck and Rowe (2008).hKoerner and Koerner (1992).iCooke and Rowe (2008a).
1026 / JOURNAL OF GEOTECHNICAL AND GEOENVIRONMENTAL ENGINEERING © ASCE / JULY 2013
J. Geotech. Geoenviron. Eng. 2013.139:1022-1034.
Dow
nloa
ded
from
asc
elib
rary
.org
by
Que
en's
Uni
vers
ity L
ibra
ries
on
06/1
9/14
. Cop
yrig
ht A
SCE
. For
per
sona
l use
onl
y; a
ll ri
ghts
res
erve
d.
associated with the Case 1 parameters, resulting in the lower utili-zation of fatty acids. For the first 0.2 years, therewas limited reductionin effluent COD (compared with the influent values), because duringthis period the biofilm was becoming established on the saturatedgravel. After 0.2 years, the ratio of effluent to influent COD started todecrease because of the consumption of fatty acids by the establishedbiofilm, and at approximately 1 year, the normalized CODwas below0.4 for Case 1 and below 0.2 for Case 2. Between 3.1 and 3.5 years,influent fatty acid concentrations (and hence, COD) were greatlyelevated [Fig. 2(b)], which resulted in correspondingly relatively highcalculated effluent CODs. However, there was still a significant re-duction in concentration, with a ratio of effluent to influent CODbetween 0.2 and 0.8 for Case 1 and between 0 and 0.4 for Case 2during this period as a result of leachate treatment within the mes-ocosms. When the leachate flow rate increased at approximately 8.8years [Fig. 2(a)], there was an increase in the calculated effluentCODs [Fig. 3(b)] because of the shorter residency time for the leachatein the mesocosm, resulting in less consumption of fatty acids, andhence, COD.Allmeasured CODs from the effluent ofmesocosmC04were bracketed by the calculated values for Cases 1 and 2. This wasalso generally true for mesocosm C03, but with exceptions at ap-proximately 2.1 years, three points between 5 and 6 years, and onepoint at approximately 8.1 years. However, given a set of parametersbased on column tests (Cases 1 and 2), the effluent CODs calculatedusing BioClog were in encouraging agreement with the observedvalues, and the kinetic rate coefficients for Cases 1 and 2 generallybracketed the scatter of the observed behavior.
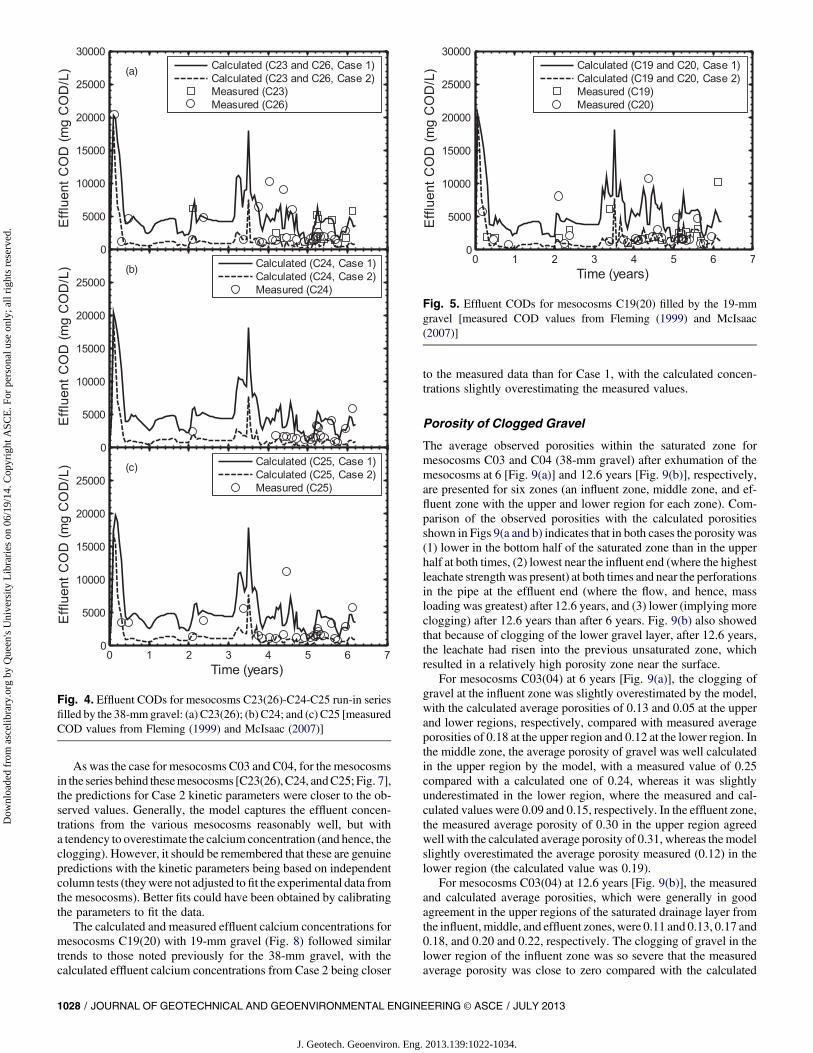
Fig. 4 shows the measured and calculated effluent CODs formesocosms C23(26), C24, and C25. The leachate from the effluentof mesocosms C03(04) was the source leachate for mesocosms C23(26). Except for a few stray experimental data points (that were notconsistent between the two duplicate mesocosms C23 and C26), thecalculated effluent CODs from these mesocosms for Cases 1 and 2were generally bracketing the observed values [Fig. 4(a)] and in en-couraging agreement, allowing for the variability of biological sys-tems. A similar conclusion can be reached for the third [C24; Fig.4(b)] and fourth [C25; Fig. 4(c)] mesocosms in the series.
The measured effluent CODs for duplicate mesocosms C19 andC20 with nominal 19-mm gravel (Fig. 5) were generally consistent,with a few data points for the two mesocosms differing significantlyat a few times, again highlighting the variability of biological systemsas previously noted for the mesocosms with 38-mm gravel. The
calculated effluent CODs for Cases 1 and 2 again generally provideda good bracketing of the measured effluent COD values.
Effluent Calcium
The calculated and measured effluent calcium concentrations formesocosms C03 and C04 (38-mm gravel) are shown in Fig. 6 up to12.6 years. The depletion of calcium concentration from leachatecalculated by the model was associated with the production rate ofcarbonic acid and a carbonic acid yield coefficient (VanGulck et al.2003). The calculated effluent calcium concentrations obtained forCase 2were lower than those for Case 1 because the greater microbialactivity associated with Case 2 parameters resulted in greater gen-eration of carbonic acid in leachate, and hence, greater precipitation ofcalcium carbonate. The calculated effluent calcium concentrationsfor Case 2 were generally closer to the measured values than thosefrom Case 1; however, in general, the model gave the calculatedcalcium concentrations encouraging general agreement with theobserved values.
Table 5. Two-DimensionalNumerical Parameters andRelationship betweenDispersivity and Porosity for Gravel (from Cooke and Rowe 2008b)
Parameters Value
Numerical settingsTime step, Dt (d) Variable (see text)Relaxation factor, v 1.0Substrate convergence tolerance, ɛ 0.001Surface convergence tolerance, ɛHZ, ɛZZ 0.05Surface extrapolation multiplier, Ef 1.0Limit surface node movement NoElement orientation All right orientedLimitsMinimum hydraulic conductivity, kMin (m/s) 13 1028
Minimum saturated thickness, gMin (cm) 0.3DispersivityLongitudinal dispersivity, aL (cm) aL 5aL;0
� n
n0
�baInitial longitudinal dispersivity, aL;0 (cm) 1.0Equation parameter, ba 21.74Transverse dispersivity, aT (cm) aT 5 caaL
Equation parameter, ca 1.0
Fig. 3. Effluent CODs for mesocosms C03(04) filled by the 38-mmgravel: (a) 0–6 years; and (b) 6–12.6 years [measured COD values fromFleming (1999) and McIsaac (2007)]
JOURNAL OF GEOTECHNICAL AND GEOENVIRONMENTAL ENGINEERING © ASCE / JULY 2013 / 1027
J. Geotech. Geoenviron. Eng. 2013.139:1022-1034.
Dow
nloa
ded
from
asc
elib
rary
.org
by
Que
en's
Uni
vers
ity L
ibra
ries
on
06/1
9/14
. Cop
yrig
ht A
SCE
. For
per
sona
l use
onl
y; a
ll ri
ghts
res
erve
d.
As was the case for mesocosms C03 and C04, for the mesocosmsin the series behind thesemesocosms [C23(26),C24, andC25; Fig. 7],the predictions for Case 2 kinetic parameters were closer to the ob-served values. Generally, the model captures the effluent concen-trations from the various mesocosms reasonably well, but witha tendency to overestimate the calcium concentration (and hence, theclogging). However, it should be remembered that these are genuinepredictions with the kinetic parameters being based on independentcolumn tests (theywere not adjusted tofit the experimental data fromthe mesocosms). Better fits could have been obtained by calibratingthe parameters to fit the data.
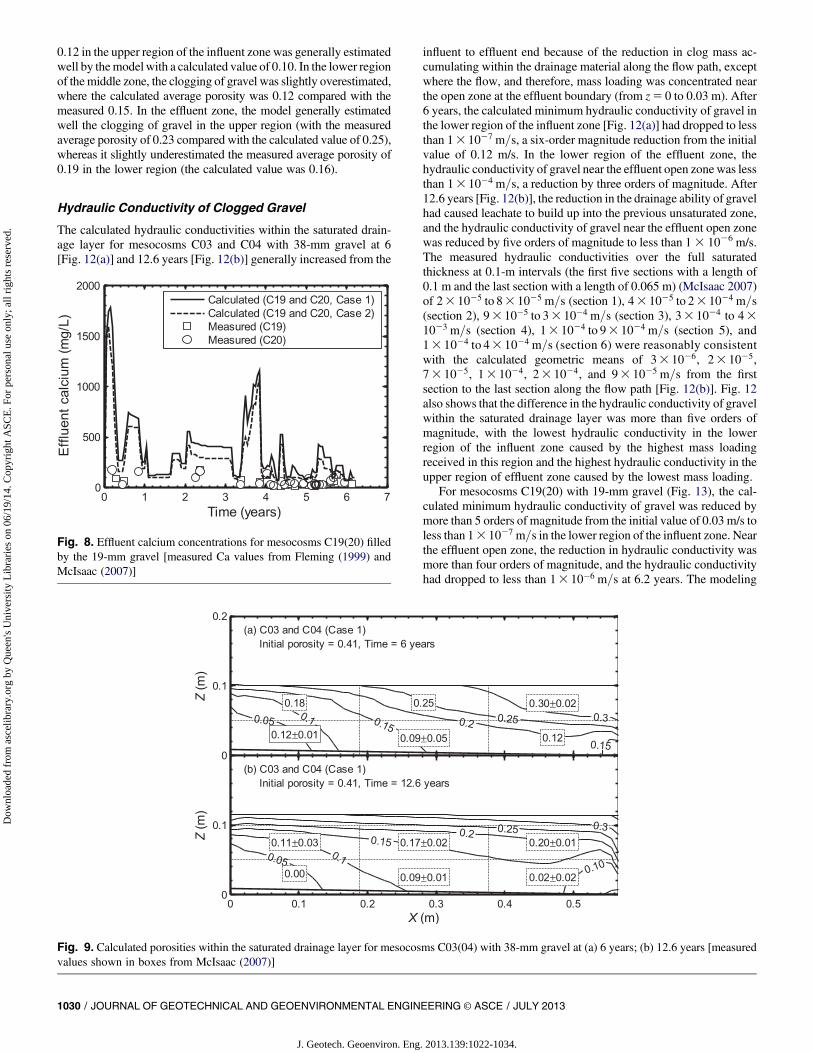
The calculated and measured effluent calcium concentrations formesocosms C19(20) with 19-mm gravel (Fig. 8) followed similartrends to those noted previously for the 38-mm gravel, with thecalculated effluent calcium concentrations from Case 2 being closer
to the measured data than for Case 1, with the calculated concen-trations slightly overestimating the measured values.
Porosity of Clogged Gravel
The average observed porosities within the saturated zone formesocosms C03 and C04 (38-mm gravel) after exhumation of themesocosms at 6 [Fig. 9(a)] and 12.6 years [Fig. 9(b)], respectively,are presented for six zones (an influent zone, middle zone, and ef-fluent zone with the upper and lower region for each zone). Com-parison of the observed porosities with the calculated porositiesshown in Figs 9(a and b) indicates that in both cases the porosity was(1) lower in the bottom half of the saturated zone than in the upperhalf at both times, (2) lowest near the influent end (where the highestleachate strengthwas present) at both times and near the perforationsin the pipe at the effluent end (where the flow, and hence, massloading was greatest) after 12.6 years, and (3) lower (implying moreclogging) after 12.6 years than after 6 years. Fig. 9(b) also showedthat because of clogging of the lower gravel layer, after 12.6 years,the leachate had risen into the previous unsaturated zone, whichresulted in a relatively high porosity zone near the surface.
For mesocosms C03(04) at 6 years [Fig. 9(a)], the clogging ofgravel at the influent zone was slightly overestimated by the model,with the calculated average porosities of 0.13 and 0.05 at the upperand lower regions, respectively, compared with measured averageporosities of 0.18 at the upper region and 0.12 at the lower region. Inthe middle zone, the average porosity of gravel was well calculatedin the upper region by the model, with a measured value of 0.25compared with a calculated one of 0.24, whereas it was slightlyunderestimated in the lower region, where the measured and cal-culated values were 0.09 and 0.15, respectively. In the effluent zone,the measured average porosity of 0.30 in the upper region agreedwell with the calculated average porosity of 0.31, whereas themodelslightly overestimated the average porosity measured (0.12) in thelower region (the calculated value was 0.19).
For mesocosms C03(04) at 12.6 years [Fig. 9(b)], the measuredand calculated average porosities, which were generally in goodagreement in the upper regions of the saturated drainage layer fromthe influent, middle, and effluent zones, were 0.11 and 0.13, 0.17 and0.18, and 0.20 and 0.22, respectively. The clogging of gravel in thelower region of the influent zone was so severe that the measuredaverage porosity was close to zero compared with the calculated
Fig. 4. Effluent CODs for mesocosms C23(26)-C24-C25 run-in seriesfilled by the 38-mm gravel: (a) C23(26); (b) C24; and (c) C25 [measuredCOD values from Fleming (1999) and McIsaac (2007)]
Fig. 5. Effluent CODs for mesocosms C19(20) filled by the 19-mmgravel [measured COD values from Fleming (1999) and McIsaac(2007)]
1028 / JOURNAL OF GEOTECHNICAL AND GEOENVIRONMENTAL ENGINEERING © ASCE / JULY 2013
J. Geotech. Geoenviron. Eng. 2013.139:1022-1034.
Dow
nloa
ded
from
asc
elib
rary
.org
by
Que
en's
Uni
vers
ity L
ibra
ries
on
06/1
9/14
. Cop
yrig
ht A
SCE
. For
per
sona
l use
onl
y; a
ll ri
ghts
res
erve
d.
average value of 0.04 [Fig. 9(b)]. In the lower region of the middlezone, the measured and calculated average porosities were in goodagreement (0.09 versus 0.11). In the lower region of the effluentzone, the calculated average porosity of 0.11 was higher than themeasured 0.02 indicated, which the model underestimated in theclogging of gravel in this region.
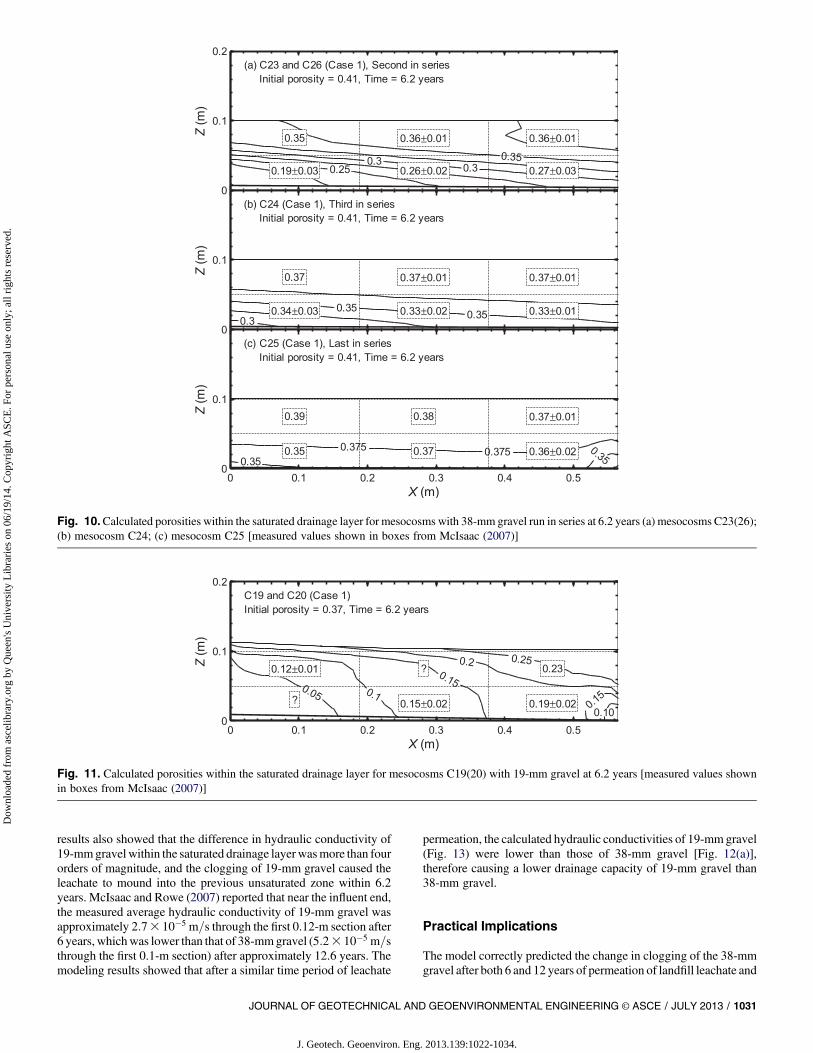
Fig. 10 shows the porosity of 38-mm gravel within the saturateddrainage layer at 6.2 years for the mesocosms C23(26), C24, C25run-in series. The results from both the measured and calculatedporosities showed that the clogging of gravel within the saturateddrainage layer from the first to the last mesocosm in the series wasreduced because of the reduced leachate strength along theflowpath.For mesocosms C23(26), as shown in Fig. 10(a), the measured av-erage porosities of 0.35, 0.36, and 0.36 at the upper regions from theinfluent, middle, and effluent zones, respectively, were estimatedwellby the model, where the calculated average porosities from the in-fluent, middle, and effluent zones were 0.34, 0.36, and 0.38, re-spectively. The calculated average porosity (0.23) in the lower regionof the influent zone slightly overestimated the measured value (0.19).
In the lower region of themiddle zone, the calculated average porosity(0.28) agreedwell with themeasured value (0.26). In the lower regionof the effluent zone, the clogging of gravel was slightly under-estimated, with a calculated average porosity of 0.33 compared withthe measured 0.27. For the third mesocosm in the series [C24; Fig. 10(b)], the clogging of gravel was estimated well by the model, with thegreatest discrepancy being in the lower region of the effluent zonewhere the measured average porosity was 0.33 compared witha calculated value of 0.36. For the last mesocosm in the series [C25;Fig. 10(c)], the model provided good predications of the porosities inall six regions.
Fig. 11 shows the measured and calculated porosities of 19-mmgravel in mesocosms C19(20). The measured average porosity of
Fig. 6. Effluent calcium concentrations for mesocosms C03(04) filledby the 38-mm gravel: (a) 0–6 years; and (b) 6–12.6 years [measured Cavalues from Fleming (1999) and McIsaac (2007)]
Fig. 7. Effluent calcium concentrations for mesocosms C23(26)-C24-C25 run-in series filled by the 38-mm gravel: (a) C23(26); (b) C24; and(c) C25 [measured Ca values from Fleming (1999) andMcIsaac (2007)]
JOURNAL OF GEOTECHNICAL AND GEOENVIRONMENTAL ENGINEERING © ASCE / JULY 2013 / 1029
J. Geotech. Geoenviron. Eng. 2013.139:1022-1034.
Dow
nloa
ded
from
asc
elib
rary
.org
by
Que
en's
Uni
vers
ity L
ibra
ries
on
06/1
9/14
. Cop
yrig
ht A
SCE
. For
per
sona
l use
onl
y; a
ll ri
ghts
res
erve
d.
0.12 in the upper region of the influent zone was generally estimatedwell by themodel with a calculated value of 0.10. In the lower regionof themiddle zone, the clogging of gravel was slightly overestimated,where the calculated average porosity was 0.12 compared with themeasured 0.15. In the effluent zone, the model generally estimatedwell the clogging of gravel in the upper region (with the measuredaverage porosity of 0.23 compared with the calculated value of 0.25),whereas it slightly underestimated the measured average porosity of0.19 in the lower region (the calculated value was 0.16).
Hydraulic Conductivity of Clogged Gravel
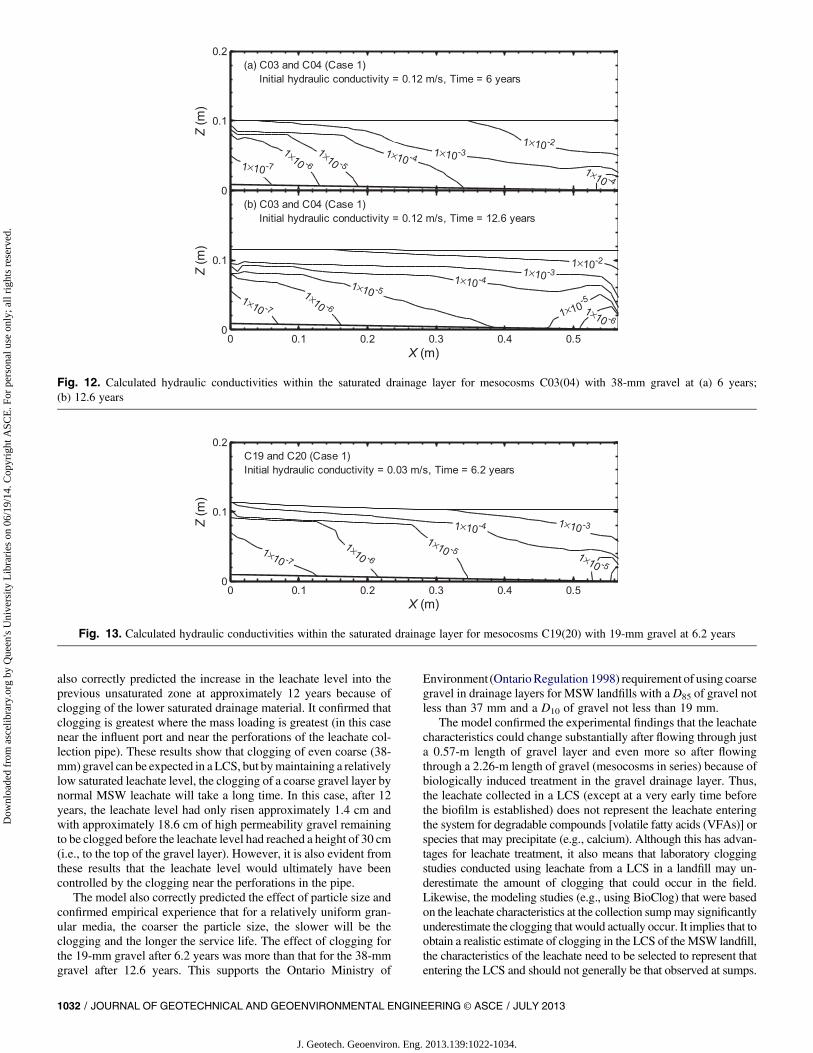
The calculated hydraulic conductivities within the saturated drain-age layer for mesocosms C03 and C04 with 38-mm gravel at 6[Fig. 12(a)] and 12.6 years [Fig. 12(b)] generally increased from the
influent to effluent end because of the reduction in clog mass ac-cumulating within the drainage material along the flow path, exceptwhere the flow, and therefore, mass loading was concentrated nearthe open zone at the effluent boundary (from z5 0 to 0.03 m). After6 years, the calculated minimum hydraulic conductivity of gravel inthe lower region of the influent zone [Fig. 12(a)] had dropped to lessthan 13 1027 m=s, a six-order magnitude reduction from the initialvalue of 0.12 m/s. In the lower region of the effluent zone, thehydraulic conductivity of gravel near the effluent open zone was lessthan 13 1024 m=s, a reduction by three orders of magnitude. After12.6 years [Fig. 12(b)], the reduction in the drainage ability of gravelhad caused leachate to build up into the previous unsaturated zone,and the hydraulic conductivity of gravel near the effluent open zonewas reduced by five orders of magnitude to less than 13 1026 m/s.The measured hydraulic conductivities over the full saturatedthickness at 0.1-m intervals (the first five sections with a length of0.1 m and the last section with a length of 0.065 m) (McIsaac 2007)of 23 1025 to 83 1025 m=s (section 1), 43 1025 to 23 1024 m=s(section 2), 93 10�5 to 33 10�4 m=s (section 3), 33 1024 to 431023 m=s (section 4), 13 1024 to 93 1024 m=s (section 5), and13 1024 to 43 1024 m=s (section 6) were reasonably consistentwith the calculated geometric means of 33 1026, 23 1025,73 1025, 13 1024, 23 1024, and 93 1025 m=s from the firstsection to the last section along the flow path [Fig. 12(b)]. Fig. 12also shows that the difference in the hydraulic conductivity of gravelwithin the saturated drainage layer was more than five orders ofmagnitude, with the lowest hydraulic conductivity in the lowerregion of the influent zone caused by the highest mass loadingreceived in this region and the highest hydraulic conductivity in theupper region of effluent zone caused by the lowest mass loading.
For mesocosms C19(20) with 19-mm gravel (Fig. 13), the cal-culated minimum hydraulic conductivity of gravel was reduced bymore than 5 orders of magnitude from the initial value of 0.03 m/s toless than 13 1027 m=s in the lower region of the influent zone. Nearthe effluent open zone, the reduction in hydraulic conductivity wasmore than four orders of magnitude, and the hydraulic conductivityhad dropped to less than 13 10�6 m=s at 6.2 years. The modeling
Fig. 8. Effluent calcium concentrations for mesocosms C19(20) filledby the 19-mm gravel [measured Ca values from Fleming (1999) andMcIsaac (2007)]
Fig. 9. Calculated porosities within the saturated drainage layer for mesocosms C03(04) with 38-mm gravel at (a) 6 years; (b) 12.6 years [measuredvalues shown in boxes from McIsaac (2007)]
1030 / JOURNAL OF GEOTECHNICAL AND GEOENVIRONMENTAL ENGINEERING © ASCE / JULY 2013
J. Geotech. Geoenviron. Eng. 2013.139:1022-1034.
Dow
nloa
ded
from
asc
elib
rary
.org
by
Que
en's
Uni
vers
ity L
ibra
ries
on
06/1
9/14
. Cop
yrig
ht A
SCE
. For
per
sona
l use
onl
y; a
ll ri
ghts
res
erve
d.
results also showed that the difference in hydraulic conductivity of19-mmgravel within the saturated drainage layer wasmore than fourorders of magnitude, and the clogging of 19-mm gravel caused theleachate to mound into the previous unsaturated zone within 6.2years. McIsaac and Rowe (2007) reported that near the influent end,the measured average hydraulic conductivity of 19-mm gravel wasapproximately 2:73 10�5 m=s through the first 0.12-m section after6 years, whichwas lower than that of 38-mmgravel (5:23 10�5 m=sthrough the first 0.1-m section) after approximately 12.6 years. Themodeling results showed that after a similar time period of leachate
permeation, the calculated hydraulic conductivities of 19-mmgravel(Fig. 13) were lower than those of 38-mm gravel [Fig. 12(a)],therefore causing a lower drainage capacity of 19-mm gravel than38-mm gravel.
Practical Implications
The model correctly predicted the change in clogging of the 38-mmgravel after both 6 and 12 years of permeation of landfill leachate and
Fig. 10.Calculated porosities within the saturated drainage layer for mesocosms with 38-mm gravel run in series at 6.2 years (a) mesocosms C23(26);(b) mesocosm C24; (c) mesocosm C25 [measured values shown in boxes from McIsaac (2007)]
Fig. 11. Calculated porosities within the saturated drainage layer for mesocosms C19(20) with 19-mm gravel at 6.2 years [measured values shownin boxes from McIsaac (2007)]
JOURNAL OF GEOTECHNICAL AND GEOENVIRONMENTAL ENGINEERING © ASCE / JULY 2013 / 1031
J. Geotech. Geoenviron. Eng. 2013.139:1022-1034.
Dow
nloa
ded
from
asc
elib
rary
.org
by
Que
en's
Uni
vers
ity L
ibra
ries
on
06/1
9/14
. Cop
yrig
ht A
SCE
. For
per
sona
l use
onl
y; a
ll ri
ghts
res
erve
d.
also correctly predicted the increase in the leachate level into theprevious unsaturated zone at approximately 12 years because ofclogging of the lower saturated drainage material. It confirmed thatclogging is greatest where the mass loading is greatest (in this casenear the influent port and near the perforations of the leachate col-lection pipe). These results show that clogging of even coarse (38-mm) gravel can be expected in a LCS, but bymaintaining a relativelylow saturated leachate level, the clogging of a coarse gravel layer bynormal MSW leachate will take a long time. In this case, after 12years, the leachate level had only risen approximately 1.4 cm andwith approximately 18.6 cm of high permeability gravel remainingto be clogged before the leachate level had reached a height of 30 cm(i.e., to the top of the gravel layer). However, it is also evident fromthese results that the leachate level would ultimately have beencontrolled by the clogging near the perforations in the pipe.
The model also correctly predicted the effect of particle size andconfirmed empirical experience that for a relatively uniform gran-ular media, the coarser the particle size, the slower will be theclogging and the longer the service life. The effect of clogging forthe 19-mm gravel after 6.2 years was more than that for the 38-mmgravel after 12.6 years. This supports the Ontario Ministry of
Environment (OntarioRegulation 1998) requirement of using coarsegravel in drainage layers for MSW landfills with a D85 of gravel notless than 37 mm and a D10 of gravel not less than 19 mm.
The model confirmed the experimental findings that the leachatecharacteristics could change substantially after flowing through justa 0.57-m length of gravel layer and even more so after flowingthrough a 2.26-m length of gravel (mesocosms in series) because ofbiologically induced treatment in the gravel drainage layer. Thus,the leachate collected in a LCS (except at a very early time beforethe biofilm is established) does not represent the leachate enteringthe system for degradable compounds [volatile fatty acids (VFAs)] orspecies that may precipitate (e.g., calcium). Although this has advan-tages for leachate treatment, it also means that laboratory cloggingstudies conducted using leachate from a LCS in a landfill may un-derestimate the amount of clogging that could occur in the field.Likewise, the modeling studies (e.g., using BioClog) that were basedon the leachate characteristics at the collection sumpmay significantlyunderestimate the clogging that would actually occur. It implies that toobtain a realistic estimate of clogging in the LCS of theMSW landfill,the characteristics of the leachate need to be selected to represent thatentering the LCS and should not generally be that observed at sumps.
Fig. 12. Calculated hydraulic conductivities within the saturated drainage layer for mesocosms C03(04) with 38-mm gravel at (a) 6 years;(b) 12.6 years
Fig. 13. Calculated hydraulic conductivities within the saturated drainage layer for mesocosms C19(20) with 19-mm gravel at 6.2 years
1032 / JOURNAL OF GEOTECHNICAL AND GEOENVIRONMENTAL ENGINEERING © ASCE / JULY 2013
J. Geotech. Geoenviron. Eng. 2013.139:1022-1034.
Dow
nloa
ded
from
asc
elib
rary
.org
by
Que
en's
Uni
vers
ity L
ibra
ries
on
06/1
9/14
. Cop
yrig
ht A
SCE
. For
per
sona
l use
onl
y; a
ll ri
ghts
res
erve
d.
Conclusions
The original numerical model (BioClog) was enhanced to allow themodeling of the deposition of suspended particles within the satu-rated gravel drainage layers by the attachment of suspended particles(modeling suspended organic biomass with a diameter of 0.001 mmand suspended inorganic solids with a diameter of 0.002 mm) andby a deposition factor (considering the particle size range ofsuspended solids in real landfill leachate from 0.001 to 0.1 mm).This enhanced BioClog model was used to calculate the leachatecharacteristics and leachate-induced clogging of gravel within thesaturated drainage layer of laboratory mesocosms. These meso-cosms were run in full scale and permeated with real MSW landfillleachate (McIsaac 2007). Modeling was performed on mesocosmswith 38- and 19-mm gravel, and for mesocosms with 38-mmgravel run-in series. Two sets of microbial kinetic rates wereconsidered based on values calibrated for two independent sets ofcolumn tests (Case 1 for columns at 21�C and Case 2 for columnsat 27�C).
Based on the predictive modeling of the mesocosm (usingparameters established from others sources and not adjusted to fit theexperimental data), the following conclusions were reached:1. Allowing for the variability in the observed results for nom-
inally identical mesocosms, the two sets of kinetic parametersgenerally bracketed the observed COD in the effluent overa 12-year period when experimental data were available. A lagperiod was initially predicted while the biofilm was develop-ing, followed by a substantial decrease in COD values (basedon reduced VFA concentrations).
2. Likewise, the model generally captured the changes in thecalcium concentrations, although to the extent that it erred, ittended to overestimate the calcium concentrations in the ef-fluent (i.e., underestimate the loss of calcium in the system).
3. There was substantial reduction in both COD and calciumconcentrations after the leachate permeated a 0.56-m length ofdrainage gravel and a very substantial reduction after perme-ation through a 2.26-m length of drainage gravel in both theexperimental observations and model predictions.
4. The calculated average porosities at both 6 and 12.6 yearswerein encouraging agreement with the measured values both forsingle mesocosms and up to four mesocosm in series. Thepredictions for the porosity of 38-mm gravel within meso-cosms C03(04) from this paper were better than those fromCooke and Rowe (2008b) compared with the measured data,especially in the lower saturated drainage layer.
5. Themodel correctly predicted that the saturated drainage layerwith 38-mm gravel at 12.6 years was more severely cloggedthan that at 6 years because of the increased mass loading overthe extended period of permeation with leachate, and alsocorrectly predicted a rise in leachate level into the initiallyunsaturated zone of the gravel as a result of clogging between6 and 12.6 years.
6. Themodel correctly predicted that the drainage layerwith 19-mmgravel would clog faster than that with 38-mm gravel, and thatthe clogging would cause a rise in leachate level in the 19-mmgravel layer but not in the 38-mm gravel layer after approxi-mately 6 years, when both sets of mesocosms were permeatedwith same leachate.
7. The calculated geometric means of hydraulic conductivityover full saturated thickness from the influent end to theeffluent end were in encouraging agreement with the mea-sured values for the 38-mm gravel after 12 years of leachatepermeation.
Acknowledgments
This research was funded by a grant from the Natural Sciences andEngineering Research Council of Canada (NSERC). The authors arevery grateful for the valuable discussions with Dr. Andrew Cooke.
References
Armstrong, M. D. (1998). “Laboratory program to study clogging ina leachate collection system.”Masters thesis, Univ. of Western Ontario,London, ON, Canada.
Babcock, D. R. P. (2005). “An evaluation of model parameters for cloggingof coarse drainage materials in landfill leachate collection systems.”Masters thesis, Queen’s Univ., Kingston, ON, Canada.
Bacas, B. M., Konietzky, H., Berini, J. C., and Sagaseta, C. (2011). “A newconstitutive model for textured geomembrane/geotextile interfaces.”J. Geotextile Geomembr., 29(2), 137–148.
Bass, J. M. (1986).“Avoiding failure of leachate collection and cap drainagesystems.” EPA-600/2-86-058, EPA, Land Pollution Control Division,Hazardous Waste Engineering Research Laboratory, Cincinnati, OH.
Bennett, P. J., Longstaffe, F. J., and Rowe, R. K. (2000). “The stability ofdolomite in landfill leachate collection systems.”Can.Geotech. J., 37(2),371–378.
Bouchez, T., Munoz, M. L., Vessigaud, S., Bordier, C., Aran, C., andDuquennoi, C. (2003). “Clogging of MSW landfill leachate collectionsystems: Prediction methods and in situ diagnosis.” Proc., Sardinia2003, 9th Int. Waste Management and Landfill Symp., CISA, Envi-ronmental Sanitary Engineering Centre, Cagliari, Italy (CD-ROM).
Brune, M., Ramke, H. G., Collins, H. J., and Hanert, H. H. (1991). “In-crustation processes in drainage systems of sanitary landfills.” Proc.,Sardinia 91, 3rd Int. Landfill Symp., CISA, Environmental SanitaryEngineering Centre, Cagliari, Italy, 999–1035.
Cooke, A. J. (2007). “Modelling of clogging in landfill leachate collectionsystems.” Ph.D. thesis, Univ. ofWestern Ontario, London, ON, Canada.
Cooke, A. J., and Rowe, R.K. (2008a). “2Dmodelling of clogging in landfillleachate collection systems.” Can. Geotech. J., 45(10), 1393–1409.
Cooke, A. J., and Rowe, R. K. (2008b). “Modelling landfill leachate in-duced clogging of field-scale test cells (mesocosms).”Can. Geotech. J.,45(11), 1497–1513.
Cooke, A. J., Rowe, R. K., and Rittmann, B. E. (2005a). “Modelling speciesfate and porous media effects for landfill leachate flow.” Can. Geotech.J., 42(4), 1116–1132.
Cooke, A. J., Rowe, R. K., VanGulck, J. F., and Rittmann, B. E. (2005b).“Application of the BioClog model for landfill leachate clogging ofgravel-packed columns.” Can. Geotech. J., 42(6), 1600–1614.
Chappel, M. J., Brachman, R. W. I., Take, W. A., and Rowe, R. K. (2012).“Large-scale quantification of wrinkles in a smooth, black, HDPEgeomembrane.” J. Geotech. Geoenviron. Eng., 138(6), 671–679.
Craven, W., Townsend, T. G., Vogel, K., and Laux, S. (1999). “Fieldinvestigation of landfill leachate collection system clogging.” Pract.Period. Hazard. Toxic Radioact. Waste Manage., 3(1), 2–9.
Eid, H. T. (2011). “Shear strength of geosynthetic composite systems fordesign of landfill liner and cover slopes.” J. Geotextile Geomembr.,29(3), 335–344.
Fleming, I. R. (1999). “Biogeochemical processes and clogging of landfillleachate collection systems.” Ph.D. thesis, Univ. of Western Ontario,London, ON, Canada.
Fleming, I. R., and Rowe, R. K. (2004). “Laboratory studies of clogging oflandfill leachate collection and drainage systems.” Can. Geotech. J.,41(1), 134–153.
Fleming, I. R., Rowe, R. K., and Cullimore, D. R. (1999). “Field obser-vations of clogging in a landfill leachate collection system.” Can.Geotech. J., 36(4), 685–707.
Fox, P. J., Ross, J. D., Sura, J. M., and Thiel, R. S. (2011). “Geomembranedamage due to static and cyclic shearing over compacted gravelly sand.”Geosynthetics Int., 16(5), 272–279.
Frind, E. O. (1988). “Solution of the advection-dispersion equation with freeexit boundary.” Numer. Methods Partial Differ. Equ., 4(4), 301–313.
JOURNAL OF GEOTECHNICAL AND GEOENVIRONMENTAL ENGINEERING © ASCE / JULY 2013 / 1033
J. Geotech. Geoenviron. Eng. 2013.139:1022-1034.
Dow
nloa
ded
from
asc
elib
rary
.org
by
Que
en's
Uni
vers
ity L
ibra
ries
on
06/1
9/14
. Cop
yrig
ht A
SCE
. For
per
sona
l use
onl
y; a
ll ri
ghts
res
erve
d.
Gudina, S., and Brachman, R. W. I. (2011). “Geomembrane strains fromwrinkle deformations.” J. Geotextile Geomembr., 29(2), 181–189.
Istok, J. (1989). Groundwater modeling by the finite element method,American Geophysical Union, Washington, DC.
Koerner, G. R., and Koerner, R. M. (1992). “Leachate flow rate behaviourthrough geotextile and soil filters and possible remediation methods.”J. Geotextile Geomembr., 11(4–6), 401–430.
Koerner, G. R., Koerner, R. M., and Martin, P. M. (1993). “Field perfor-mance of leachate collection systems and design implications.” Proc., of31st Annual Int. Solid Waste Exposition, Solid Waste Association ofNorth America, Silver Spring, MD., 365–380.
Koerner, G. R., Koerner, R. M., andMartin, J. P. (1994). “Design of landfillleachate collection filters.” J. Geotech. Eng., 120(10), 1792–1801.
Levine, A. D., Cardoso, A. J., Nayak, B., Rhea, L. R., Dodge, B. M., andHarwood, V. J. (2005). “Assessment of biogeochemical deposits inlandfill leachate drainage systems.” Project Final Rep., Center for Solidand Hazardous Waste Management, Gainesville, FL.
Maliva, R. G., et al. (2000). “Unusual calcite stromatolites and pisoids froma landfill leachate collection system.” Geology, 28(10), 931–934.
McBean, E. A., Mosher, F. R., and Rovers, F. A. (1993). “Reliability-baseddesign for leachate collection systems.” Proc. of Sardinia 93, 3rd Int.Landfill Symp., Santa Margherita di Pula, Cagliari, Italy, CISA, Envi-ronmental Sanitary Engineering Centre, Cagliari, Italy, 433–441.
McIsaac, R. (2007). “An experimental investigation of clogging in landfillleachate collection systems.” Ph.D. thesis, Univ. of Western Ontario,London, ON, Canada.
McIsaac, R., and Rowe, R. K. (2006). “Effect of filter-separators on thecloggingof leachate collection systems.”Can.Geotech. J., 43(7), 674–693.
McIsaac, R., and Rowe, R. K. (2007). “Clogging of gravel drainage layerspermeated with landfill leachate.” J. Geotech. Geoenviron. Eng., 133(8),1026–1039.
Metcalf and Eddy, Inc. (1991). Wastewater engineering: Treatment, dis-posal, and reuse, 3rd Ed., McGraw Hill, New York.
Ontario Regulation. (1998). “Environmental Protection Act Ontario.”Ontario Regulation 232/98, PIBS 3651E, Ontario Ministry of the En-vironment, Toronto.
Padilla, F., Secretan, Y., and Leclerc,M. (1997). “On open boundaries in thefinite element approximation of two-dimensional advection-diffusionflows.” Int. J. Numer. Methods Eng., 40(13), 2493–2516.
Pavlostathis, S. G., and Giraldo-Gomez, E. (1991). “Kinestics of anaerobictreatment: A critical review.” Crit. Rev. Environ. Control, 21(5-6), 411–490.
Rayhani,M. T., Rowe, R.K., Brachman, R.W. I., Take,W.A., and Siemens,G. (2011). “Factors affecting GCL hydration under isothermal con-ditions.” J. Geotextile Geomembr., 29(6), 525–533.
Rittman, B. E. (1982). “The effect of shear stress on biofilm loss rate.”Biotechnol. Bioeng., 24(2), 501–506.
Rittmann, B. E., and Brunner, C. M. (1984). “The non-steady state biofilmprocess for advanced organics removal.” J. Water Pollut. Control Fed.,56(7), 874–880.
Rittmann, B. E., and McCarty, P. L. (1981). “Substrate flux into biofilms ofany thickness.” J. Environ. Eng., 107(4), 831–849.
Rittmann, B. E., and Snoeyink, V. L. (1984). “Achieving biologically stabledrinking water.” J. Am. Water Works Assoc., 76(10), 106–114.
Rowe, R. K. (1998). “From the past to the future of landfill engineeringthrough case histories.” Proc., 4th Int. Conf. on Case Histories in
Geotechnical Engineering, Univ. of Missouri-Rolla, Rolla, MO, 145–166.
Rowe, R. K. (2005). “Long-term performance of contaminant barrier sys-tems. 45th Rankine Lecture.” Geotechnique, 55(9), 631–678.
Rowe, R. K. (2011). “Systems engineering the design and operations ofmunicipal solid waste landfills to minimize leakage of contaminants togroundwater.” Geosynthetics Int., 18(6), 391–404.
Rowe, R. K. (2012a). “Short and long-term leakage through compositeliners.” Can. Geotech. J., 49(2), 141–169.
Rowe, R. K. (2012b). “Third Indian Geotechnical Society: Ferroco Terzaghioration design and construction of barrier systems to minimize envi-ronmental impacts due tomunicipal solidwaste leachate and gas.” IndianGeotech. J., 42(4), 223–256.
Rowe,R.K., andBabcock,D. (2007). “Modelling the clogging of coarse graveland tire shreds in column tests.” Can. Geotech. J., 44(11), 1273–1285.
Rowe, R. K., Chappel, M. J., Brachman, R. W. I., and Take, W. A. (2012).“A field study of wrinkles in a geomembrane at a composite liner testsite.” Can. Geotech. J., 49(10), 1196–1211.
Rowe, R. K., Quigley, R. M., Brachman, R. W. I., and Booker, J. R. (2004).Barrier systems for waste disposal facilities. Taylor & Francis BooksLtd, London.
Rowe, R. K., VanGulck, J. F., and Millward, S. (2002). “Biologically in-duced clogging of a granular media permeated with synthetic leachate.”J. Environ. Eng. Sci., 1(2), 135–156.
Taylor, S.W., and Jaffe, P.R. (1990). “Biofilmgrowth and the related changesin the physical properties of a porous medium, Part 3: Dispersivity andmodel verification.” Water Resour. Res., 26(9), 2153–2159.
Tien, C., and Ramarao, B. V. (2007). Granular filtration of aerosols andhydrosols, Elsevier, Oxford, U.K.
VanGulck, J. F. (2003). “Biodegradation and clogging in gravel sizematerial.” Ph.D. thesis, Queen’s Univ., Kingston, ON, Canada.
VanGulck, J. F., andRowe,R.K. (2004a). “Evolution of clog formationwithtime in columns permeated with synthetic landfill leachate.” J. Contam.Hydrol., 75(1–2), 115–135.
VanGulck, J. F., and Rowe, R. K. (2004b). “Influence of landfill leachatesuspended solids on clog (biorock) formation.” Waste Manag., 24(7),723–738.
VanGulck, J. F., and Rowe, R. K. (2008). “Parameter estimation formodelling clogging of granular medium permeated with leachate.” Can.Geotech. J., 45(6), 812–823.
VanGulck, J. F., Rowe, R. K., Rittmann, B. E., and Cooke, A. J. (2003).“Predicting biogeochemical calcium precipitation in landfill leachatecollection systems.” Biodegradation, 14(5), 331–346.
Wilson, E. J. and Geankoplis, C. J. (1966). “Liquid mass transfer at verylow Reynolds numbers in packed beds.” Industrial and EngineeringChemistry Fundamentals, 5(1), 9–14.
Yu, J., and Pinder, K. L. (1994). “Effective diffusivities of volatile fatty acidsin methanogenic biofilms.” Bioresour. Technol., 48(2), 155–161.
Yu, Y. (2012). “Modelling MSW leachate characteristics and clogging.”Ph.D. thesis. Dept. of Civil Engineering, Queen’s Univ., KingstonON, Canada.
Yu, Y., and Rowe, R. K. (2012a). “Modelling leachate-induced cloggingof porous media.” Can. Geotech. J., 49(8), 877–890.
Yu, Y., and Rowe, R. K. (2012b). “Improved solutions for porosity andspecific surface of a uniform porous medium with attached film.”J. Environ. Eng., 138(4), 436–445.
1034 / JOURNAL OF GEOTECHNICAL AND GEOENVIRONMENTAL ENGINEERING © ASCE / JULY 2013
J. Geotech. Geoenviron. Eng. 2013.139:1022-1034.
Dow
nloa
ded
from
asc
elib
rary
.org
by
Que
en's
Uni
vers
ity L
ibra
ries
on
06/1
9/14
. Cop
yrig
ht A
SCE
. For
per
sona
l use
onl
y; a
ll ri
ghts
res
erve
d.


![Leachate Basic Design[1]](https://img.pdfslide.net/doc/110x75/54744d63b4af9f09648b45f9/leachate-basic-design1.jpg)