Embed Size (px)
Citation preview
Modelling Canadian prairie wetland hydrology using asemi-distributed stream¯ow model
M. Su,1 W. J. Stolte1* and G. van der Kamp21Department of Civil Engineering, University of Saskatchewan, Saskatoon, Saskatchewan, S7N 5A9, Canada
2National Water Research Institute, Saskatoon, Saskatchewan, S7N 3H5, Canada
Abstract:A hydrological model (SLURP) that was designed for simulating hydrological processes taking place in large riverbasins was, with minimal modi®cation, used successfully to simulate water level variations over a 28-year period(1969±1996) for a 3-ha prairie wetland in Saskatchewan.The model calculates a water balance based on precipitation, snowmelt, evaporation, surface runo� and
subsurface ¯ow on a daily time-step. The model was ®rst calibrated for two periods (1969±1973 for cropland and1987±1990 for grassland), then it was applied to records outside the calibration periods. The model reproduced thewetland water level variations during a 28-year period with good accuracy. The wetland water levels were mostsensitive to the in®ltration coe�cient of surface soil under frozen conditions and to maximum soil moisturestorage. The applicability of the model and the calibrated parameters to a smaller wetland, with an area of 0�24 ha,was examined. This simulation indicated that scale e�ects are important, probably largely in relation to snowredistribution by wind. Copyright # 2000 John Wiley & Sons, Ltd.
KEY WORDS wetlands; wetland hydrology; modelling; land use
INTRODUCTION
In the northern glaciated plains of North America, there are millions of small wetlands, commonly referredto as prairie pot holes or sloughs. The wetlands have a very high level of biological productivity (Murkin,1998) and the northern prairies are a waterfowl breeding area of continental signi®cance. Most of thewetlands occur in small hydrologically closed basins and the water levels in the wetland are subject to largeannual and multi-year ¯uctuations in response to climatic variability (Winter, 1989; Woo, 1992).
The interannual changes of water levels in the wetlands are a signi®cant factor in the breeding success ofwaterfowl (Bethke and Nudds, 1995; Larson, 1995) and in the hydrology of the prairie region (Miller andNudds, 1996; Winter and Rosenberry, 1998). Climate change and gradual but pervasive changes of land useare also likely to have major impacts on the water balance of the wetlands (Covich et al., 1997). Prediction ofthe water level regime of the wetlands is therefore important for the management of water resources and ofwildlife in the region. Such predictions are likely to require physically based hydrological models, which candeal with changing climatic and land surface conditions.
Several investigators have made estimates of the average annual water balance of typical wetlands (Shje¯o,1972; Woo and Rowsell, 1993; Hayashi et al., 1998). Winter and Rosenberry (1998) used the Palmer DroughtSeverity Index to characterize the general hydrological conditions of prairie wetlands or lakes. Poiani et al.(1996) developed a model for water levels in prairie wetlands on a monthly basis by coupling existing models
Copyright # 2000 John Wiley & Sons, Ltd. Received 26 March 1999Accepted 15 January 2000
HYDROLOGICAL PROCESSESHydrol. Process. 14, 2405±2422 (2000)
* Correspondence to: W. J. Stolte, Department of Civil Engineering, University of Saskatchewan, 57 Campus Drive, Saskatoon,Saskatchewan, S7N 5A9, Canada. E-mail: [email protected]
Contract/grant sponsor: National Science and Engineering Research Council of Canada.
for evapotranspiration by crops and for hillslope erosion by water. The model successfully simulated a 30-year water level regime for a semi-permanent wetland, and was also used to investigate the potential e�ects ofclimate change (Poiani and Johnson, 1993). The model implicitly assumes a large subsurface ¯ux of waterout of the drainage basin, however, and does not allow for in®ltration of snowmelt water in the upland areas.Process-based hydrological models that maintain a rigorous water balance may prove to be more useful fordealing with the complexity of wetland hydrology under changing hydrological conditions.
This paper reports on the results of adapting a standard hydrological model, to simulate the water levelregime of two prairie wetlands in Saskatchewan, Canada. The model used is SLURP (Kite, 1996), a semi-distributed model developed for simulating stream¯ow. This paper will report on the results of the modellingand how the model is used to represent the various parts of the hydrological cycle of the wetland. Thecriterion for determining the suitability of the model for small-scale hydrological representation is thecorrespondence of the modelled variations in the wetland water levels to those recorded during a 28-yearperiod.
SUMMARY OF THE HYDROLOGY OF NORTH AMERICAN PRAIRIE WETLANDS
Numerous studies dealing with the water balance of small prairie wetlands have been carried out (Meyboom,1966, 1967; Millar, 1971; Shje¯o, 1972; Sloan, 1972; Price, 1993; Woo and Rowsell, 1993; Winter andRosenberry, 1995; LaBaugh et al., 1996; Hayashi et al., 1998). These studies have shown that springsnowmelt, including runo� from the catchment, and summer rainfall on the wetlands are the principalsources of water and are of roughly comparable magnitude. Runo� of rain water from the catchment duringthe summer season occurs only during occasional intense precipitation events and is a relatively minorcomponent of the long-term water balance.
Water is lost by evapotranspiration from the open water area and by seepage. Seepage from the pond hasnot always been clearly de®ned. It is, however, a major factor in the wetland water balance and needs to beconsidered carefully. The seepage is almost entirely lost to evapotranspiration from the moist surroundingedges (Winter and Rosenberry, 1995; Hayashi et al., 1998). Groundwater ¯ow in or out of the catchment areais usually relatively small owing to the generally low hydraulic conductivity of the underlying clay-rich glacialdeposits. Recharge rates to regional aquifers may range from 2 to 45 mm/year averaged over the area of thecatchments (van der Kamp and Hayashi, 1998), but the high rates occur only where there are shallowregional aquifers and strong downward hydraulic gradients from the wetlands to the underlying aquifers.
The springtime in¯ux of snowmelt water is critical to the existence of the wetlands (Winter, 1989). Theinput from summer runo� from the catchment plus rain on the ponds is considerably smaller thanevapotranspiration and seepage and probably would not su�ce to maintain open water. Only a fraction ofthe total snowfall on the catchment, however, enters the pond as direct precipitation on the pond, aswindblown snow, or as snowmelt runo�. The remainder of the snowmelt water in®ltrates into the soil and ismostly lost by evapotranspiration.
STUDY AREA
The St Denis National Wildlife Area (106816 'W, 51813 'N) is located 45 km east of Saskatoon. The localtopography is dominated by strongly sloping or moderately rolling knob-and-kettle moraine. Over 100wetlands are scattered about the area. Among these wetlands, wetland No. 50 was selected for calibrationand veri®cation of the model, in part, because its hydrology has been described by Woo and Rowsell (1993),and a large amount of background data stemming from that study was available.
Wetland No. 50 comprises a pond and uplands (Figure 1). Before 1983, the uplands surrounding thewetland were used only as cropland. After 1983, about one-quarter of the upland was converted to ungrazedgrassland. The slopes contiguous to the wetland are currently covered with brome grass (Bromus spp.),except for the cultivated ®eld at its eastern fringe (Figure 1). The total upland area is 469 000 m2. The area of
2406 M. SU, W. J. STOLTE AND G. VAN DER KAMP
Copyright # 2000 John Wiley & Sons, Ltd. Hydrol. Process. 14, 2405±2422 (2000)
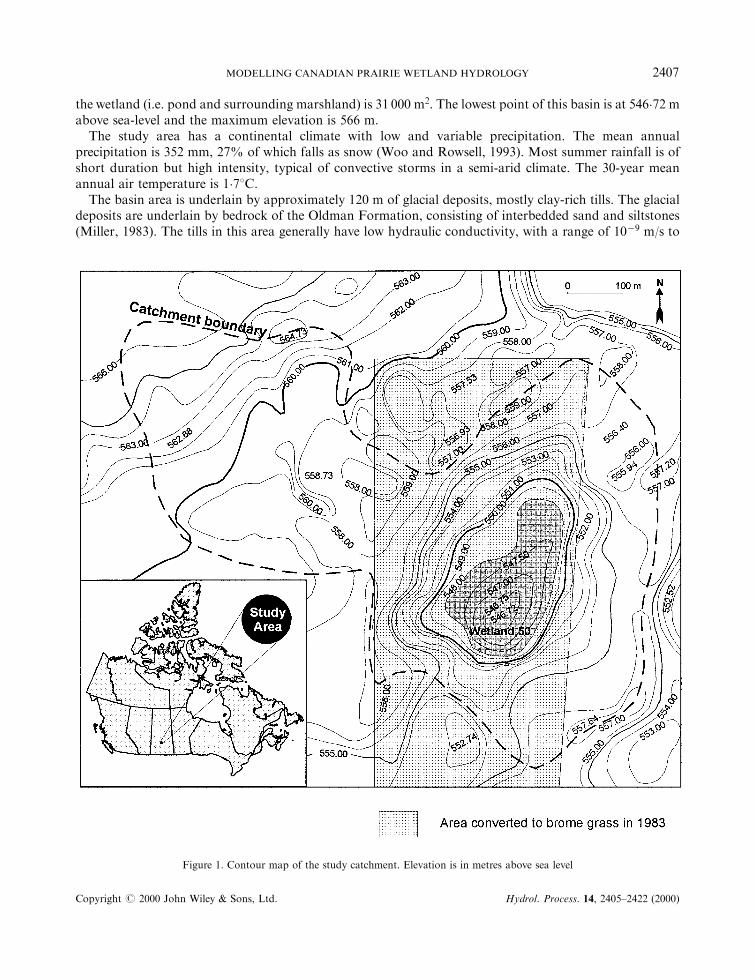
the wetland (i.e. pond and surrounding marshland) is 31 000 m2. The lowest point of this basin is at 546�72 mabove sea-level and the maximum elevation is 566 m.
The study area has a continental climate with low and variable precipitation. The mean annualprecipitation is 352 mm, 27% of which falls as snow (Woo and Rowsell, 1993). Most summer rainfall is ofshort duration but high intensity, typical of convective storms in a semi-arid climate. The 30-year meanannual air temperature is 1�78C.
The basin area is underlain by approximately 120 m of glacial deposits, mostly clay-rich tills. The glacialdeposits are underlain by bedrock of the Oldman Formation, consisting of interbedded sand and siltstones(Miller, 1983). The tills in this area generally have low hydraulic conductivity, with a range of 10ÿ9 m/s to
Figure 1. Contour map of the study catchment. Elevation is in metres above sea level
MODELLING CANADIAN PRAIRIE WETLAND HYDROLOGY 2407
Copyright # 2000 John Wiley & Sons, Ltd. Hydrol. Process. 14, 2405±2422 (2000)
10ÿ8 m/s (Miller et al., 1985; Hayashi et al., 1998). The presence of fractures as a result of desiccation nearthe ground surface gives a higher permeability, and the hydraulic conductivity may exceed 10ÿ6 m/s atdepths of less than 5 m. There is a thin sand aquifer about 25 m below the bottom of the wetland (Hayashi etal., 1998).
Exchange of groundwater between the pond and the underlying aquifer at 25 m depth is probably slight,because the hydraulic head in the aquifer is approximately equal to the level of the water in the pond, and theintervening tills have low permeability. On the uplands surrounding the wetland the water table generally isseveral metres below the ground surface, and several metres above the level of the pond in wetland No. 50.Thus there is some shallow groundwater ¯ow towards the wetland. However, the magnitude of this ¯ow islimited by the low permeability of the glacial tills and the low lateral gradients. No seepage areas could beidenti®ed around the margins of the pond, even in late autumn when the pond water level was low andevapotranspiration by phreatophytes at the pond edge had ceased.
WETLAND MODEL
Rather than developing an entirely new model, it was decided to modify an existing physically basedhydrological model to simulate water level ¯uctuations in prairie wetlands. The SLURP (Simple LUmpedReservoir Parametric in the original (1975) version of the model but in the current, semi-disturbed version,the acronym no longer has any meaning (Kite, 1996)) model was chosen for this purpose. The currentSLURP is a semi-distributed model that ®ts between lumped basin models at one extreme and fullydistributed physically based models at the other extreme (Kite, 1996). It is used more commonly to representthe hydrology of large river basins such as the Mackenzie River basin. The structure of the model issu�ciently deterministic, however, that it is applicable to small drainage basins and wetlands with minormodi®cations.
The SLURP model requires the division of a watershed into aggregated simulation areas (ASAs). EachASA is then subdivided into areas of di�erent land covers. For each land cover area, the model carries out avertical water balance at a daily time-step. Figure 2 shows a simpli®ed ¯ow chart of SLURP, Version 10.
Four tanks are used in each ASA to represent the capacities of canopy interception (canopy tank),snowpack, surface storage and soil moisture storage, respectively (Kite, 1996). The canopy tank was notimportant in this study because it applies mainly to forested areas. Precipitation is either added to thesnowpack tank or the surface storage (`fast') tank according to the critical temperature (usually 08C). Meltfrom the snowpack tank goes to the fast tank and then in®ltrates from the fast tank into the subsurface soilmoisture storage (`slow') tank according to the Philip (1954) expression (see Figure 2) for ¯ow in porousmedia.
When the depth of water remaining in the fast tank after in®ltration is greater than depression storage,surface runo� from the upland to the wetland ASA will be generated at a rate based on the product of aconstant of 1�86 and the depth in the fast store, Dr, and the square root of the land slope. This relationship isderived from the Manning equation for overland ¯ow and leads to all surface runo� from the uplandentering the wetland within a few days after a snowmelt or rainfall event.
The slow tank contributes to subsurface ¯ow out of the upland ASAs to the wetland ASA at a ratedepending on how full the tank is and on the water transfer coe�cient of the subsurface soil (see Figure 2).
For the wetland ASA, only the slow tank was of relevance and then only because it was used to representthe contents of the wetland. In®ltration and subsurface ¯ow rates are not factors within the wetland ASA.Rainfall, runo�, snowmelt and evaporation all add to or subtract from the contents of the slow tank withinthe wetland ASA. No out¯ow occurred from the wetland.
Evaporation is calculated for each land cover area in each ASA and is satis®ed, if possible, ®rst from thecanopy tank, then the snowpack tank (if it is not empty), then from the fast tank and ®nally from the slowtank. Several methods for calculating evaporation are available within SLURP (Barr et al., 1997), but onlythe Granger method (Granger and Gray, 1989), expressed as follows, was used in this study. The equation is
2408 M. SU, W. J. STOLTE AND G. VAN DER KAMP
Copyright # 2000 John Wiley & Sons, Ltd. Hydrol. Process. 14, 2405±2422 (2000)
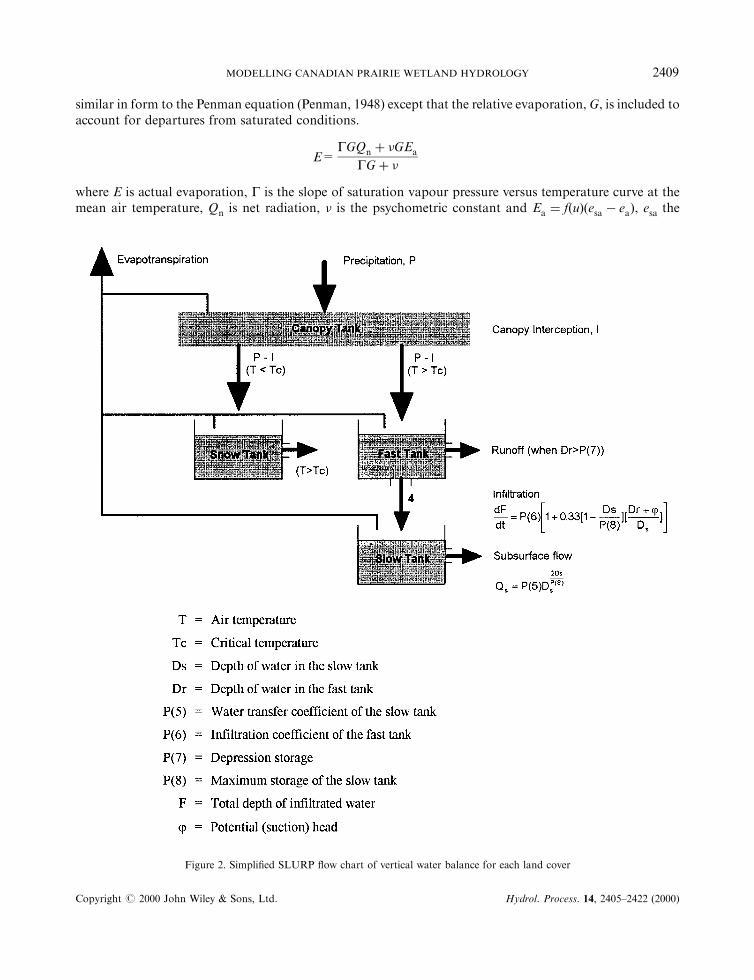
similar in form to the Penman equation (Penman, 1948) except that the relative evaporation, G, is included toaccount for departures from saturated conditions.
GGQn � �GEa
GG� �where E is actual evaporation, G is the slope of saturation vapour pressure versus temperature curve at themean air temperature, Qn is net radiation, � is the psychometric constant and Ea � f�u��esa ÿ ea�, esa the
Figure 2. Simpli®ed SLURP ¯ow chart of vertical water balance for each land cover
E=
MODELLING CANADIAN PRAIRIE WETLAND HYDROLOGY 2409
Copyright # 2000 John Wiley & Sons, Ltd. Hydrol. Process. 14, 2405±2422 (2000)
saturation vapour pressure at the mean air temperature, ea the actual vapour pressure of air above theevaporating surface and f(u) a windspeed function.
Variable G is a complex function of the ratio of the drying power, Ea, to the sum of Ea and the netradiation. For the relative humidities occurring at the site studied, G tends to increase with the drying powerand so does the evaporation.
None of the methods available, including the Granger method, deals with the di�erences one might expectbetween evaporation and evapotranspiration. The evapotranspiration from the upland is not reduced by thee�ect of reducing soil moisture, so the fast and slow tanks, i.e. the surface water and the soil moisture, areemptied faster than they would be under actual conditions. Evapotranspiration is zero when all the storagetanks are empty. This has little e�ect on the results, however, because wetland water levels are governedmainly by spring melt and evaporation from the saturated surfaces of the wetland. It is only rarely that thereis any runo� into the wetland from rainfall. Thus, although a more realistic variation of evapotranspirationwith the contents of the slow store, i.e. the soil moisture storage, would a�ect the partitioning of rainfall intoin®ltration and runo�, it would rarely a�ect actual wetland levels.
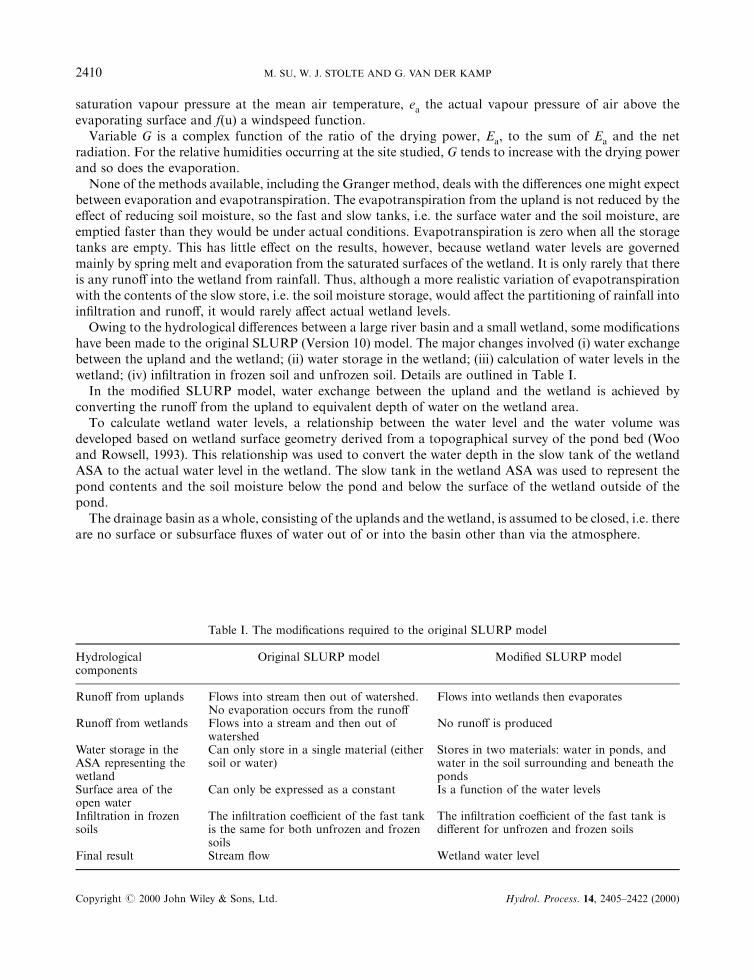
Owing to the hydrological di�erences between a large river basin and a small wetland, some modi®cationshave been made to the original SLURP (Version 10) model. The major changes involved (i) water exchangebetween the upland and the wetland; (ii) water storage in the wetland; (iii) calculation of water levels in thewetland; (iv) in®ltration in frozen soil and unfrozen soil. Details are outlined in Table I.
In the modi®ed SLURP model, water exchange between the upland and the wetland is achieved byconverting the runo� from the upland to equivalent depth of water on the wetland area.
To calculate wetland water levels, a relationship between the water level and the water volume wasdeveloped based on wetland surface geometry derived from a topographical survey of the pond bed (Wooand Rowsell, 1993). This relationship was used to convert the water depth in the slow tank of the wetlandASA to the actual water level in the wetland. The slow tank in the wetland ASA was used to represent thepond contents and the soil moisture below the pond and below the surface of the wetland outside of thepond.
The drainage basin as a whole, consisting of the uplands and the wetland, is assumed to be closed, i.e. thereare no surface or subsurface ¯uxes of water out of or into the basin other than via the atmosphere.
Table I. The modi®cations required to the original SLURP model
Hydrologicalcomponents
Original SLURP model Modi®ed SLURP model
Runo� from uplands Flows into stream then out of watershed.No evaporation occurs from the runo�
Flows into wetlands then evaporates
Runo� from wetlands Flows into a stream and then out ofwatershed
No runo� is produced
Water storage in theASA representing thewetland
Can only store in a single material (eithersoil or water)
Stores in two materials: water in ponds, andwater in the soil surrounding and beneath theponds
Surface area of theopen water
Can only be expressed as a constant Is a function of the water levels
In®ltration in frozensoils
The in®ltration coe�cient of the fast tankis the same for both unfrozen and frozensoils
The in®ltration coe�cient of the fast tank isdi�erent for unfrozen and frozen soils
Final result Stream ¯ow Wetland water level
2410 M. SU, W. J. STOLTE AND G. VAN DER KAMP
Copyright # 2000 John Wiley & Sons, Ltd. Hydrol. Process. 14, 2405±2422 (2000)
METHODS
Model data
The data used in the modelling included meteorological and water-level data. The meteorological datacame from two sources: the study site (summers in 1989±1994) and Saskatoon Airport Weather Station(1969±1996, except for summers 1989±1994). The Saskatoon Airport Weather Station, about 40 km west, isthe nearest long-term weather station of the Meteorological Service of Canada (Environment Canada) to thesite. The meteorological data included precipitation, air temperature, relative humidity and sunshine hours.
Water level data for wetland No. 50 have been collected by the Canadian Wildlife Service and others since1968 (Conly and van der Kamp, in press). Measurements were made several times during the open-waterperiod of each year, and are reported as water level relative to the pond bottom at the deepest part of thepond. No measured data are available during the winter periods when the pond is frozen.
Parameter determination
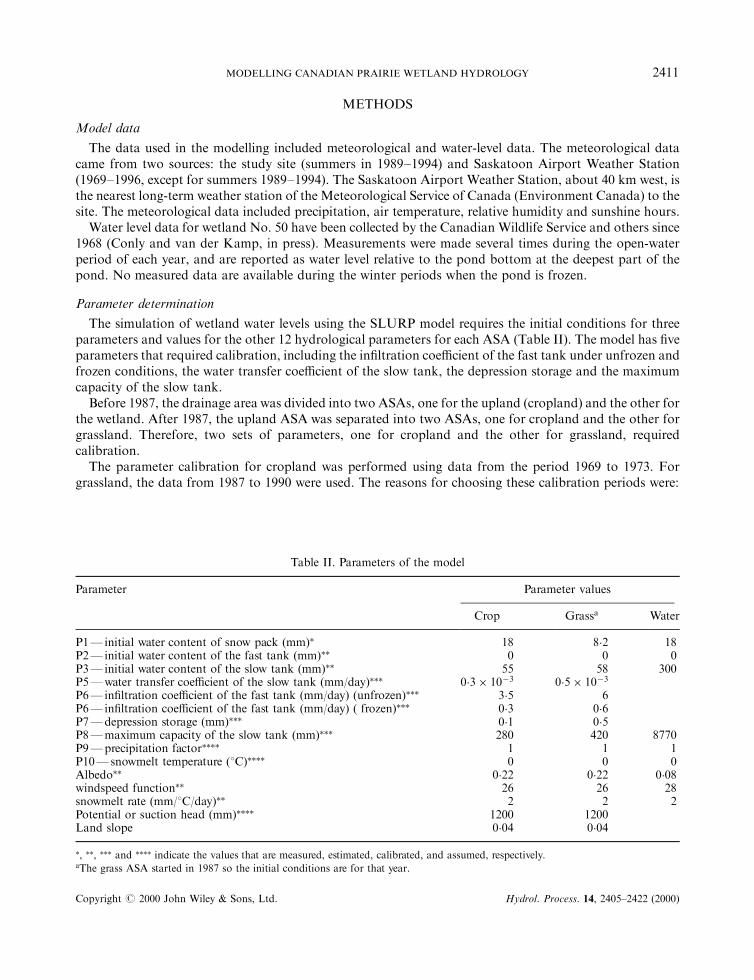
The simulation of wetland water levels using the SLURP model requires the initial conditions for threeparameters and values for the other 12 hydrological parameters for each ASA (Table II). The model has ®veparameters that required calibration, including the in®ltration coe�cient of the fast tank under unfrozen andfrozen conditions, the water transfer coe�cient of the slow tank, the depression storage and the maximumcapacity of the slow tank.
Before 1987, the drainage area was divided into two ASAs, one for the upland (cropland) and the other forthe wetland. After 1987, the upland ASA was separated into two ASAs, one for cropland and the other forgrassland. Therefore, two sets of parameters, one for cropland and the other for grassland, requiredcalibration.
The parameter calibration for cropland was performed using data from the period 1969 to 1973. Forgrassland, the data from 1987 to 1990 were used. The reasons for choosing these calibration periods were:
Table II. Parameters of the model
Parameter Parameter values
Crop Grassa Water
P1Ð initial water content of snow pack (mm)� 18 8�2 18P2Ð initial water content of the fast tank (mm)�� 0 0 0P3Ð initial water content of the slow tank (mm)�� 55 58 300P5Ðwater transfer coe�cient of the slow tank (mm/day)��� 0�3� 10ÿ3 0�5� 10ÿ3P6Ð in®ltration coe�cient of the fast tank (mm/day) (unfrozen)��� 3�5 6P6Ð in®ltration coe�cient of the fast tank (mm/day) ( frozen)��� 0�3 0�6P7Ðdepression storage (mm)��� 0�1 0�5P8Ðmaximum capacity of the slow tank (mm)��� 280 420 8770P9Ðprecipitation factor���� 1 1 1P10Ðsnowmelt temperature (8C)���� 0 0 0Albedo�� 0�22 0�22 0�08windspeed function�� 26 26 28snowmelt rate (mm/8C/day)�� 2 2 2Potential or suction head (mm)���� 1200 1200Land slope 0�04 0�04�, ��, ��� and ���� indicate the values that are measured, estimated, calibrated, and assumed, respectively.aThe grass ASA started in 1987 so the initial conditions are for that year.
MODELLING CANADIAN PRAIRIE WETLAND HYDROLOGY 2411
Copyright # 2000 John Wiley & Sons, Ltd. Hydrol. Process. 14, 2405±2422 (2000)
(1) the dry±wet climatic conditions during these two periods allowed a range of hydrological responses to besimulatedÐsome of the chosen years (1969, 1970, 1971 and 1973) received above-average precipitation,whereas 1972, 1987, 1988, 1989 and 1990 were relatively dry;
(2) the e�ects of land-use change on the water levels are not obvious within the ®rst 3±4 years afterconversion from cultivation to permanent grass cover (van der Kamp, et al., 1999), so it isassumed that there is no di�erence between cultivation and grass cover until 1987.
The calibration was performed by setting individual parameter values, making a series of simulations,generating water levels and then comparing the computed water levels with observed water levels using theobjective function below (Blackie and Eeles, 1985). This process was repeated until no further reduction inthe value of F could be e�ected by modifying the parameter values, and so a set of acceptable parameters wasobtained
F �Xni�1
�Hpred ÿHmeasd
�2where Hpred is predicted water levels (m) and Hmeasd is measured water levels (m).
It should be noted that the F value was calculated on the basis of the simulated data only when recordeddata were available. Furthermore, it was assumed that the wetland water levels did not change over winter.
Long-term simulation
After calibration, the model was veri®ed by evaluating a longer period of input data ( from 1969 to 1996).The parameters for cropland were obtained from the 1969 to 1973 calibration and used to simulateconditions for the remainder of the period from 1974 to 1996. The parameters for grassland were obtainedfrom the 1987 to 1990 calibration and used to simulate conditions for the remainder of the post-1987 periodfrom 1991 to 1996.
The initial water contents of the tanks in 1969 (start year) were set as follows:
(1) the initial content of the snowpack tank was set to be equal to the sum of measured precipitation inNovember and December of 1968;
(2) the initial content of the fast tank was set to zero because there is no surface ¯ow during winter time;(3) the initial content of the slow tank was set to be equal to 20% of its maximum capacity.
Once the initial water conditions were speci®ed, the model automatically used the water conditions in thelast day of the previous year as the initial conditions for the next year and then continuously simulated thenext year's water levels.
Sensitivity analysis of the parameters
A sensitivity analysis was performed to assess the relative change in the water levels resulting from achange in model parameters. Sensitivity results are provided only to illustrate the wetland water levelsresponse to changes in several important parameters for the upland ASA, such as the in®ltration coe�cientof the fast tank and maximum capacity of the slow tank. The method used in this sensitivity analysis was to®rst develop a base case in which the modelled water levels were in good agreement with the recorded waterlevels. In the succeeding computations, each individual parameter was allowed to deviate from its base valuewithin a predetermined range (change+10%), with all other parameters at their base values. Comparisonsare made between the water levels under the base case conditions and those that obtained under the newconditions, in order to illustrate the in¯uence of the parameter on the water levels.
2412 M. SU, W. J. STOLTE AND G. VAN DER KAMP
Copyright # 2000 John Wiley & Sons, Ltd. Hydrol. Process. 14, 2405±2422 (2000)
RESULTS AND DISCUSSION
Parameter values
Table II lists the parameters of the model and their values, indicating whether they are measured,estimated, calibrated, or assumed.
Simulated water levels versus recorded water levels
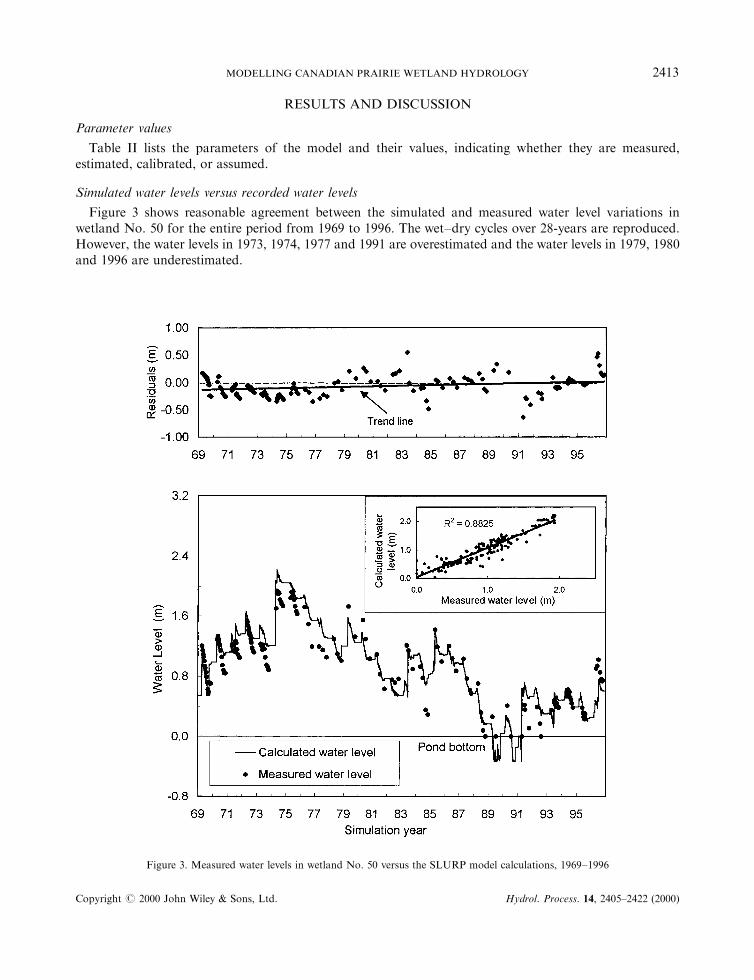
Figure 3 shows reasonable agreement between the simulated and measured water level variations inwetland No. 50 for the entire period from 1969 to 1996. The wet±dry cycles over 28-years are reproduced.However, the water levels in 1973, 1974, 1977 and 1991 are overestimated and the water levels in 1979, 1980and 1996 are underestimated.
Figure 3. Measured water levels in wetland No. 50 versus the SLURP model calculations, 1969±1996
MODELLING CANADIAN PRAIRIE WETLAND HYDROLOGY 2413
Copyright # 2000 John Wiley & Sons, Ltd. Hydrol. Process. 14, 2405±2422 (2000)
The residuals are shown in the two plots superimposed on the main plot of Figure 3. The scatter plot of thecalculated versus measured water levels indicates a high R2 value, and a general clustering of the data aboutthe 1:1 line but with some slight tendency for underestimation of water level. The top plot of residuals(measured minus simulated water level) versus time shows that they do seem to have trends which are,however, not obviously associated with high or low water levels.
The standard errors, s � ��������F=np
(n is the number of measured water levels), calculated from the data for thetwo calibration periods, 1969 to 1973 and 1987 to 1996, are 0�175 m and 0�155 m, respectively. The standarderror, s, for the data of the entire period from 1969 to 1996 was 0�190 m, which is higher than those obtainedfor the two calibration periods.
Simulation of the main hydrological processes
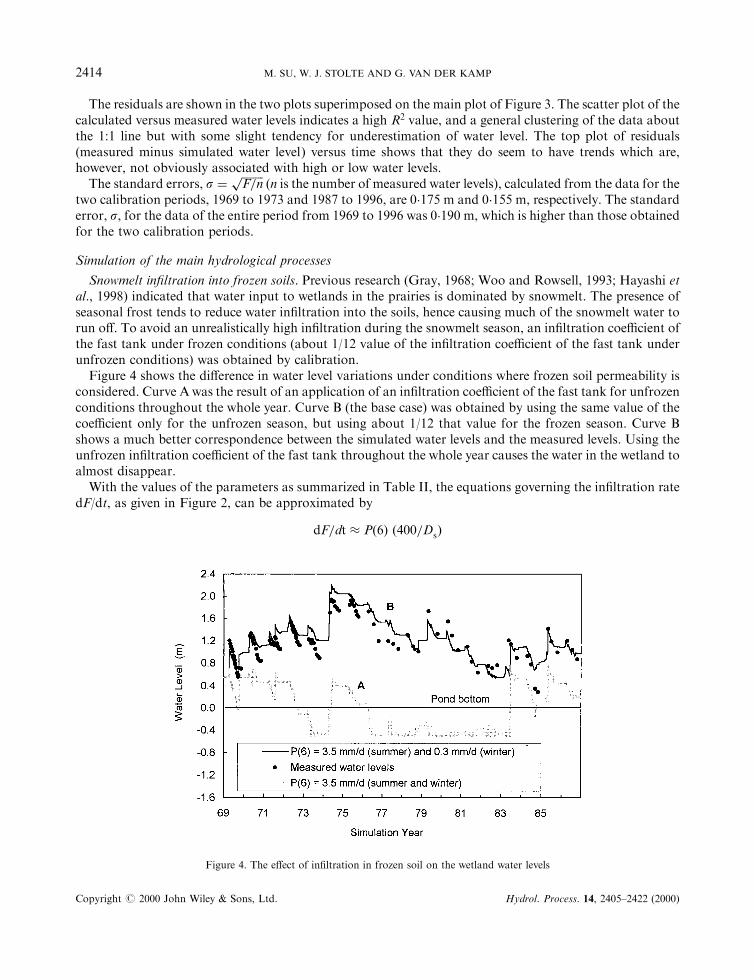
Snowmelt in®ltration into frozen soils. Previous research (Gray, 1968; Woo and Rowsell, 1993; Hayashi etal., 1998) indicated that water input to wetlands in the prairies is dominated by snowmelt. The presence ofseasonal frost tends to reduce water in®ltration into the soils, hence causing much of the snowmelt water torun o�. To avoid an unrealistically high in®ltration during the snowmelt season, an in®ltration coe�cient ofthe fast tank under frozen conditions (about 1/12 value of the in®ltration coe�cient of the fast tank underunfrozen conditions) was obtained by calibration.
Figure 4 shows the di�erence in water level variations under conditions where frozen soil permeability isconsidered. Curve Awas the result of an application of an in®ltration coe�cient of the fast tank for unfrozenconditions throughout the whole year. Curve B (the base case) was obtained by using the same value of thecoe�cient only for the unfrozen season, but using about 1/12 that value for the frozen season. Curve Bshows a much better correspondence between the simulated water levels and the measured levels. Using theunfrozen in®ltration coe�cient of the fast tank throughout the whole year causes the water in the wetland toalmost disappear.
With the values of the parameters as summarized in Table II, the equations governing the in®ltration ratedF/dt, as given in Figure 2, can be approximated by
dF=dt � P�6� �400=Ds�
Figure 4. The e�ect of in®ltration in frozen soil on the wetland water levels
2414 M. SU, W. J. STOLTE AND G. VAN DER KAMP
Copyright # 2000 John Wiley & Sons, Ltd. Hydrol. Process. 14, 2405±2422 (2000)

The approximate relationship for in®ltration shows that the daily in®ltration rate dF/dt can be very highwhen the amount of moisture in the slow (subsurface) tank is much less than 400 mm, but dF/dt decreases tonear the in®ltration capacity (3�5 mm/day in summer) when the slow tank is nearly full. Thus this equationrepresents the tendency of summer runo� to occur only if the soil is already moist and there is intense rain,exceeding tens of millimetres per day. During the snowmelt season the in®ltration is more strongly limited bythe in®ltration capacity of the frozen soil (0�3 mm/day) so that considerable runo� occurs on days of highsnowmelt rates, which may be as high as 25 mm/day (Woo and Rowsell, 1993).
It is important to note that the model assumes a uniform depth of snowpack. However, in actuality,signi®cant snow redistribution occurs in the prairies. Wetlands with substantial rings of trees and bushesaround them will trap much more snow than those that do not have these features. Snowmelt runo� intowetlands with tree rings would be higher than for wetlands without because the snowmelt occurs nearer thewetland where in®ltration is limited and ¯ow distances are shorter. This snowmelt is `seen' as runo� by themodel. This apparent runo� will lead to the use of a lower frozen in®ltration capacity in the modelling thanwould occur if the e�ects of snow redistribution were portrayed more accurately.
The daily surface runo� is limited by the amount of water, Dr, remaining in the fast tank after in®ltration.With the slope estimated to equal 0�04, the runo� is given by
R � 0:37 Dr
Thus even after intense summer rainstorms only a fraction of the water runs o�, and the rest in®ltrates or islost to evapotranspiration. During the snowmelt season a larger fraction of the snowmelt water makes itsway to the wetland over a period of several days because the in®ltration rate and the rate ofevapotranspiration are low.
Evapotranspiration and evaporation. Figure 5 shows the yearly evapotranspiration from the upland and theevaporation from the wetland. Two characteristics of the simulation are evident. Firstly, the simulatedannual evaporation from the wetland over 28 years was 550 mm, much higher than the 333 mm ofevapotranspiration from the upland (Table III). Note that the average annual precipitation over thesimulation period was 348 mm, which is much less than wetland evaporation. Secondly, the evaporationfrom the wetland was relatively stable, excepting 1989 and 1990 when the wetland dried out, but theevaporation from the upland varied widely with available water, because all tanks were dry on occasion.
Figure 5. Annual evaporation from the upland and the wetland
MODELLING CANADIAN PRAIRIE WETLAND HYDROLOGY 2415
Copyright # 2000 John Wiley & Sons, Ltd. Hydrol. Process. 14, 2405±2422 (2000)
Subsurface runo�. The subsurface runo� from the slow tank, or subsurface soil storage, is given by
Qs � 3 � 10ÿ4
DDs=140s
For a maximum capacity of the slow tank of 280 mm, it can be seen that the daily subsurface runo� is verysmall, of the order of 10ÿ3 mm/day. This slow rate of subsurface runo� corresponds to the low hydraulicconductivity of the subsurface material. The subsurface runo� is small and has little e�ect.
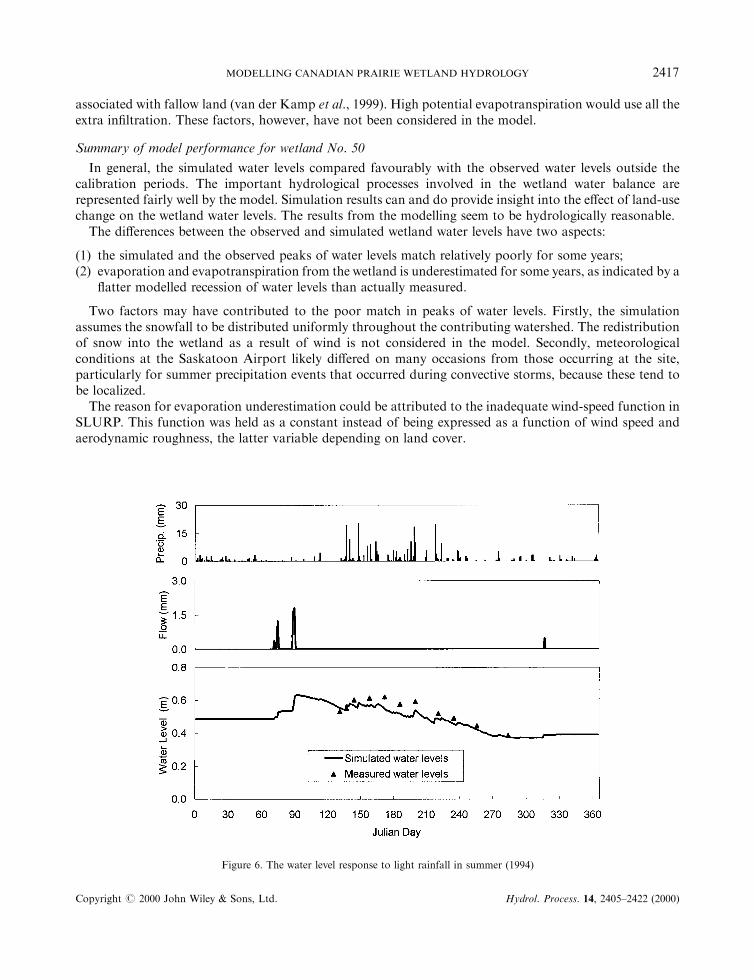
Response to rainfall. The model generates appropriate responses of the wetland water levels to variations inintensity and time of rainfalls. For example, Figure 6 presents the response of the wetland water levels tomany single light rainfall events occurring during the summer of 1994. Usually, the soil moisture content islow during the summer season as a result of intensive evapotranspiration, so precipitation ®rst in®ltrates intosoil to ®ll the storage, and there is no runo� generated from the upland. Hence, there was no strong rise in thewetland water level as a result of these rainfalls.
In some years, the water level rose rapidly after a rainfall with intensity so large that it exceeded the storageand/or the in®ltration capacity of the soil. This is shown in Figure 7, where it is noted that on 4 and 5 July1993, daily rainfalls of 56 mm and 13 mm generated a total of 13�5 mm ¯ow from the upland, yielding acommensurate rise in the water level.
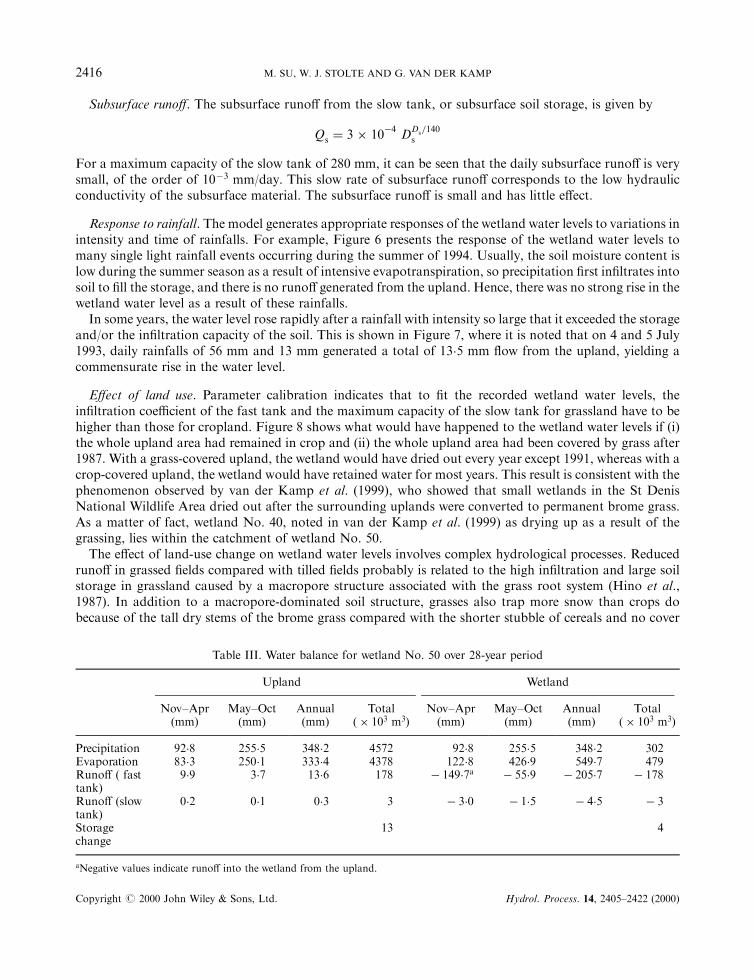
E�ect of land use. Parameter calibration indicates that to ®t the recorded wetland water levels, thein®ltration coe�cient of the fast tank and the maximum capacity of the slow tank for grassland have to behigher than those for cropland. Figure 8 shows what would have happened to the wetland water levels if (i)the whole upland area had remained in crop and (ii) the whole upland area had been covered by grass after1987. With a grass-covered upland, the wetland would have dried out every year except 1991, whereas with acrop-covered upland, the wetland would have retained water for most years. This result is consistent with thephenomenon observed by van der Kamp et al. (1999), who showed that small wetlands in the St DenisNational Wildlife Area dried out after the surrounding uplands were converted to permanent brome grass.As a matter of fact, wetland No. 40, noted in van der Kamp et al. (1999) as drying up as a result of thegrassing, lies within the catchment of wetland No. 50.
The e�ect of land-use change on wetland water levels involves complex hydrological processes. Reducedruno� in grassed ®elds compared with tilled ®elds probably is related to the high in®ltration and large soilstorage in grassland caused by a macropore structure associated with the grass root system (Hino et al.,1987). In addition to a macropore-dominated soil structure, grasses also trap more snow than crops dobecause of the tall dry stems of the brome grass compared with the shorter stubble of cereals and no cover
Table III. Water balance for wetland No. 50 over 28-year period
Upland Wetland
Nov±Apr(mm)
May±Oct(mm)
Annual(mm)
Total(� 103 m3)
Nov±Apr(mm)
May±Oct(mm)
Annual(mm)
Total(� 103 m3)
Precipitation 92�8 255�5 348�2 4572 92�8 255�5 348�2 302Evaporation 83�3 250�1 333�4 4378 122�8 426�9 549�7 479Runo� ( fasttank)
9�9 3�7 13�6 178 ÿ 149�7a ÿ 55�9 ÿ 205�7 ÿ 178
Runo� (slowtank)
0�2 0�1 0�3 3 ÿ 3�0 ÿ 1�5 ÿ 4�5 ÿ 3
Storagechange
13 4
aNegative values indicate runo� into the wetland from the upland.
2416 M. SU, W. J. STOLTE AND G. VAN DER KAMP
Copyright # 2000 John Wiley & Sons, Ltd. Hydrol. Process. 14, 2405±2422 (2000)
associated with fallow land (van der Kamp et al., 1999). High potential evapotranspiration would use all theextra in®ltration. These factors, however, have not been considered in the model.
Summary of model performance for wetland No. 50
In general, the simulated water levels compared favourably with the observed water levels outside thecalibration periods. The important hydrological processes involved in the wetland water balance arerepresented fairly well by the model. Simulation results can and do provide insight into the e�ect of land-usechange on the wetland water levels. The results from the modelling seem to be hydrologically reasonable.
The di�erences between the observed and simulated wetland water levels have two aspects:
(1) the simulated and the observed peaks of water levels match relatively poorly for some years;(2) evaporation and evapotranspiration from the wetland is underestimated for some years, as indicated by a
¯atter modelled recession of water levels than actually measured.
Two factors may have contributed to the poor match in peaks of water levels. Firstly, the simulationassumes the snowfall to be distributed uniformly throughout the contributing watershed. The redistributionof snow into the wetland as a result of wind is not considered in the model. Secondly, meteorologicalconditions at the Saskatoon Airport likely di�ered on many occasions from those occurring at the site,particularly for summer precipitation events that occurred during convective storms, because these tend tobe localized.
The reason for evaporation underestimation could be attributed to the inadequate wind-speed function inSLURP. This function was held as a constant instead of being expressed as a function of wind speed andaerodynamic roughness, the latter variable depending on land cover.
Figure 6. The water level response to light rainfall in summer (1994)
MODELLING CANADIAN PRAIRIE WETLAND HYDROLOGY 2417
Copyright # 2000 John Wiley & Sons, Ltd. Hydrol. Process. 14, 2405±2422 (2000)
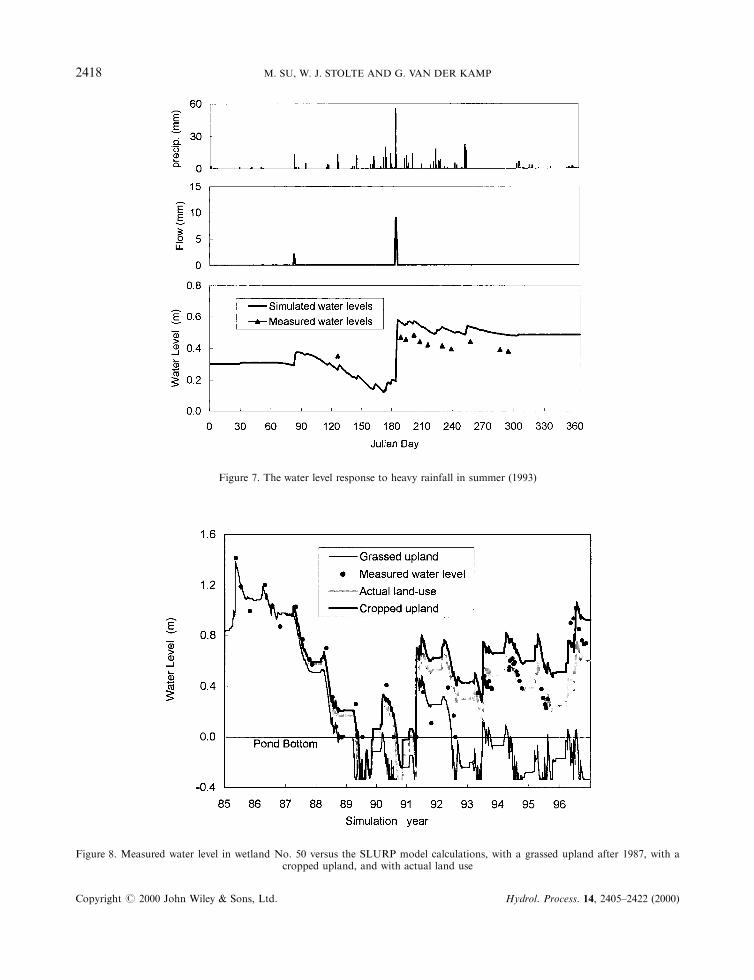
Figure 7. The water level response to heavy rainfall in summer (1993)
Figure 8. Measured water level in wetland No. 50 versus the SLURP model calculations, with a grassed upland after 1987, with acropped upland, and with actual land use
2418 M. SU, W. J. STOLTE AND G. VAN DER KAMP
Copyright # 2000 John Wiley & Sons, Ltd. Hydrol. Process. 14, 2405±2422 (2000)
SENSITIVITY ANALYSIS
During the calibration processes, it was noted that some parameters (such as the in®ltration coe�cient of thefast tank under frozen conditions and the maximum capacity of the slow tank) play more important roles butsome (such as the water transfer coe�cient of the slow tank and the depression storage) do not. Therefore, aseries of sensitivity simulations were performed to identify the in¯uence of changes in several importantmodel parameters on the water levels. The sensitivity analysis discussed below is limited to the parameters ofthe upland ASA.
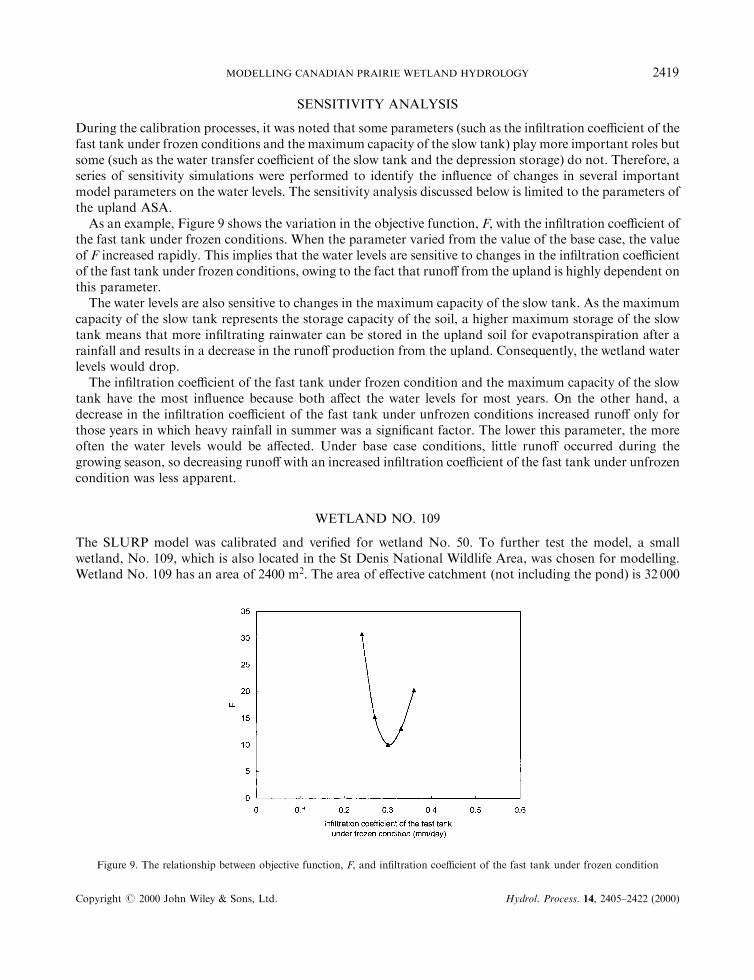
As an example, Figure 9 shows the variation in the objective function, F, with the in®ltration coe�cient ofthe fast tank under frozen conditions. When the parameter varied from the value of the base case, the valueof F increased rapidly. This implies that the water levels are sensitive to changes in the in®ltration coe�cientof the fast tank under frozen conditions, owing to the fact that runo� from the upland is highly dependent onthis parameter.
The water levels are also sensitive to changes in the maximum capacity of the slow tank. As the maximumcapacity of the slow tank represents the storage capacity of the soil, a higher maximum storage of the slowtank means that more in®ltrating rainwater can be stored in the upland soil for evapotranspiration after arainfall and results in a decrease in the runo� production from the upland. Consequently, the wetland waterlevels would drop.
The in®ltration coe�cient of the fast tank under frozen condition and the maximum capacity of the slowtank have the most in¯uence because both a�ect the water levels for most years. On the other hand, adecrease in the in®ltration coe�cient of the fast tank under unfrozen conditions increased runo� only forthose years in which heavy rainfall in summer was a signi®cant factor. The lower this parameter, the moreoften the water levels would be a�ected. Under base case conditions, little runo� occurred during thegrowing season, so decreasing runo� with an increased in®ltration coe�cient of the fast tank under unfrozencondition was less apparent.
WETLAND NO. 109
The SLURP model was calibrated and veri®ed for wetland No. 50. To further test the model, a smallwetland, No. 109, which is also located in the St Denis National Wildlife Area, was chosen for modelling.Wetland No. 109 has an area of 2400 m2. The area of e�ective catchment (not including the pond) is 32 000
Figure 9. The relationship between objective function, F, and in®ltration coe�cient of the fast tank under frozen condition
MODELLING CANADIAN PRAIRIE WETLAND HYDROLOGY 2419
Copyright # 2000 John Wiley & Sons, Ltd. Hydrol. Process. 14, 2405±2422 (2000)
m2 (about 15 times smaller than the catchment of wetland No. 50). Another di�erence between the twowetlands is that the upland area of wetland No. 109 was cropland during the entire 28-year simulationperiod. Furthermore, wetland No. 109 has a more complete willow ring outside the wetland (Hayashi et al.,1998).
The climatic data used in the modelling were the same as the data used for wetland No. 50. The water leveldata were obtained in a similar manner as for wetland No. 50. The parameters used in simulating thecatchment area of wetland No. 109 were those calibrated for the cropland catchment of wetland No. 50.
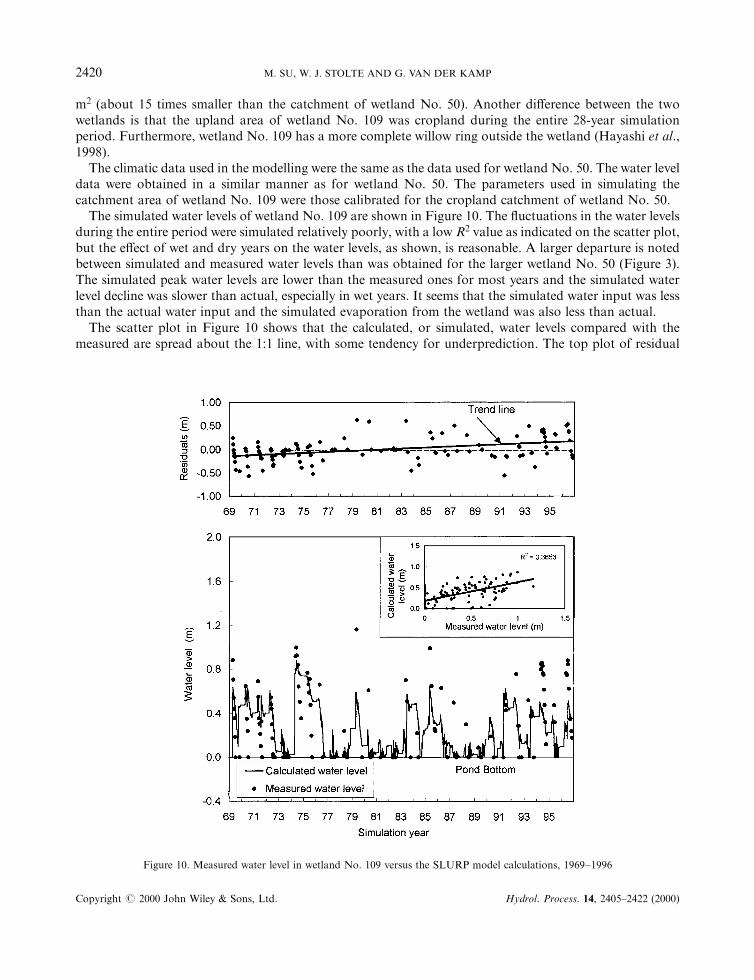
The simulated water levels of wetland No. 109 are shown in Figure 10. The ¯uctuations in the water levelsduring the entire period were simulated relatively poorly, with a low R2 value as indicated on the scatter plot,but the e�ect of wet and dry years on the water levels, as shown, is reasonable. A larger departure is notedbetween simulated and measured water levels than was obtained for the larger wetland No. 50 (Figure 3).The simulated peak water levels are lower than the measured ones for most years and the simulated waterlevel decline was slower than actual, especially in wet years. It seems that the simulated water input was lessthan the actual water input and the simulated evaporation from the wetland was also less than actual.
The scatter plot in Figure 10 shows that the calculated, or simulated, water levels compared with themeasured are spread about the 1:1 line, with some tendency for underprediction. The top plot of residual
Figure 10. Measured water level in wetland No. 109 versus the SLURP model calculations, 1969±1996
2420 M. SU, W. J. STOLTE AND G. VAN DER KAMP
Copyright # 2000 John Wiley & Sons, Ltd. Hydrol. Process. 14, 2405±2422 (2000)

(measured minus simulated) versus time shows a relatively strong tendency for increasing underpredictionduring the later years. Reasons for these trends require further study.
It is likely that the existence of the willow ring, which is 5±10 m tall, just outside wetland No. 109 couldhave contributed to discrepancies between the measured and simulated hydrological responses of wetlandNo. 109. Previous studies indicate that the willow ring outside wetlands has a signi®cant in¯uence on thewetland water balance (Hayashi et al., 1998). They found that the willow ring traps more snow during winterand increases evapotranspiration in summer. As the in¯uence of the willow ring has not been considered inthe simulation, the underestimation of water input during the melt season and of evapotranspiration duringthe summer are as expected. For the larger wetland, No. 50, the in¯uence of the willow ring is less markedbecause it represents a much smaller portion of the total area of the catchment and thus both snowentrapment in the willow ring and evaporation from the willow ring are much smaller in proportion to theoverall water balance of the catchment and the wetland.
CONCLUSIONS
The results of the simulations done in this study indicate that the modi®ed SLURP model can adequatelyrepresent water level variations in prairie wetlands, especially for those wetlands in which the interactionbetween wetlands and ground water is not signi®cant. This ®nding suggests that the modi®ed SLURP modelhas the potential to be used for predicting wetland water levels and for exploring the possible e�ects ofclimate changes and changes of land use on wetland resources in the future. However, the model must berecalibrated for wetlands having highly di�erent characteristics. From this we must conclude thathydrological processes such as snow accumulation and evapotranspiration from phreatophytic vegetationare not well represented by the model. Further improvements to the model would likely includeconsideration of snow relocation and incorporation of the hydrological e�ects of the `willow ring' thatsurrounds most of the wetlands. Some of the evaporation and subsurface ¯ow routines also could beimproved.
The simulated wetland water levels are most sensitive to changes in the in®ltration coe�cient of the fasttank under frozen condition, and the maximum capacity of the slow tank, but the in®ltration coe�cient ofthe fast tank under unfrozen conditions is important in those years with heavy rainfall in summer. These®ndings are consistent with the conclusions of previous studies, which found that spring-time runo� ofsnowmelt water over frozen ground is crucial to the existence of the wetlands.
ACKNOWLEDGEMENTS
Financial assistance for the study was provided by the National Science and Engineering Research Councilof Canada. Data was made available by the National Hydrology Research Center and by the CanadianWildlife Service. Dr G. Kite provided the current version of SLURP and programming assistance. Theassistance of Mr Jack Millar is gratefully acknowledged.
REFERENCES
Barr RG, Kite GW, Granger R, Smith C. 1997. Evaluating three evapotranspiration methods in the SLURP macroscale hydrologicalmodel. Hydrological Processes 11: 1685±1705.
Bethke RW, Nudds TD. 1995. E�ects of climate change and land use on duck abundance in Canadian prairie parklands. EcologicalApplications 5(3): 588±600.
Blackie JR, Eeles WO. 1985. Lumped catchment models in hydrological forecasting, In Hydrological Forecasting, Anderson MG, BurtTP (eds). Wiley: Chichester, 311±345.
Conly FM, van der Kamp G. In press. Monitoring the hydrology of Canadian prairie wetlands to detect the e�ects of climate changeand land use changes. Journal of Environmental Monitoring and Assessment.
MODELLING CANADIAN PRAIRIE WETLAND HYDROLOGY 2421
Copyright # 2000 John Wiley & Sons, Ltd. Hydrol. Process. 14, 2405±2422 (2000)
Covich AP, Fritz SC, Lamb PJ, Marzolf RD, Matthews WJ, Poiani KA, Prepas EE, RichmanMB, Winter TC. 1997. Potential e�ects ofclimate change on aquatic ecosystems of the Great Plains of North America. Hydrological Processes 11: 993±1021.
Granger RJ, Gray DM. 1989. Evaporation from natural nonsaturated surfaces. Journal of Hydrology 111: 21±29.Gray DM. 1968. Snow hydrology of the prairie environment. In Snow Hydrology. Canadian National Committee the InternationalHydrological Decade: Ottawa, Ontario; 21±34.
Hayashi MG, van der Kamp G, Rudolph DL. 1998. Water and solute transfer between a prairie wetland and adjacent uplands, 1. Waterbalance. Journal of Hydrology 207: 42±55.
Hino M, Fujita K, Shutto H. 1987. A laboratory experiment on the role of grass for in®ltration and runo� processes. Journal ofHydrology 90: 303±325.
Kite GW. 1996.Manual for the SLURPHydrological Model, Version 10. National Hydrology Research Institute, Environment Canada:Saskatoon, SK.
LaBaugh JW, Winter TC, Swanson GA, Rosenberry DO, Nelson RD, Euliss NH. 1996. Changes in atmospheric circulation patternsa�ect midcontinent wetlands sensitive to climate. Limnology and Oceanography 41: 864±870.
Larson DL. 1995. E�ects of climate on numbers of northern prairie wetlands. Climatic Change 30: 169±180.Meyboom P. 1966. Unsteady groundwater ¯ow near a willow ring in hummocky moraine. Journal of Hydrology 4: 38±62.Meyboom P. 1967. Mass-transfer studies to determine the ground-water regime of permanent lakes in hummocky moraine of westernCanada. Journal of Hydrology 5: 117±142.
Millar JB. 1971. Shoreline-area ratio as a factor in rate of water loss from small sloughs. Journal of Hydrology 14: 259±284.Miller JJ. 1983.Hydrology of a morainic landscape near St Denis, Saskatchewan, in relation to the genesis, classi®cation and distribution ofsoils. MSc thesis. Department of Soil Science, University of Saskatchewan, Saskatoon.
Miller JJ, Acton DF, St Arnaud RJ. 1985. The e�ect of groundwater on soil formation in a morainal landscape in Saskatchewan.Canadian Journal of Soil Science 65: 293±307.
Miller MW, Nudds TN. 1996. Prairie landscape change and ¯ooding in the Mississippi River Valley. Conservation Biology 10(3): 847±853.
Murkin HR. 1998. Freshwater values and functions of wetlands. Great Plains Research 8(1): 3±15.Penman HL. 1948. Natural evaporation from open water, bare soil and grass. Proceedings of the Royal Society of London 193: 120±145.Philip JR. 1954. An in®ltration equation with physical signi®cance. Soil Science 77(1): 153±157.Poiani KA, Johnson WC. 1993. A spatial simulation model of hydrology and vegetation dynamics in semi-permanent prairie wetlands.Ecological Applications 3: 279±293.
Poiani KA, Johnson WC, Swanson GA, Winter TC. 1996. Climate change and northern prairie wetlands: simulations of long-termdynamics. Limnology and Oceanography 41: 871±881.
Price JS. 1993. Water level regimes in prairie sloughs. Canadian Water Resources Journal 18(2): 95±106.Shje¯o JB. 1972. Evapotranspiration and the water budget of prairie potholes in North Dakota. U.S. Geological Survey ProfessionalPaper 585-B: 49.
Sloan CE. 1972. Ground-water hydrology of prairie potholes in North Dakota. U.S. Geological Survey Professional Paper 585-C: 28.Van der Kamp G, Hayashi M. 1998. The groundwater recharge function of small wetlands in the semi-arid Northern Prairies. GreatPlains Research 8: 39±56.
Van der KampG, Stolte WJ, Clark RG. 1999. Drying out of small prairie wetlands after conversion of their catchments from cultivationto permanent brome grass. Journal of Hydrological Sciences 44(3): 386±397.
Winter TC. 1989. Hydrologic studies of wetlands in the northern prairies. InNorthern Prairie Wetlands, Van der Valk A (ed.). Iowa StateUniversity Press: Ames, IA; 16±54.
Winter TC, Rosenberry DO. 1995. The interaction of ground water with prairie pothole wetlands in the cottonwood lake area, east-central north Dakota 1979±1990. Wetlands 15(3): 193±211.
Winter TC, Rosenberry DO. 1998. Hydrology of prairie wetlands during drought and deluge: a 17-year study to the Cottonwood lakewetland complex in North Dakota in the perspective of longer term measured and proxy hydrologic records. Climatic Change 40(2):189±209.
Woo MK. 1992. Impacts of climate variability and change on Canadian wetlands. Canadian Water Resources Journal 17: 63±69.Woo MK, Rowsell RD. 1993. Hydrology of a prairie slough. Journal of Hydrology 146: 175±207.
2422 M. SU, W. J. STOLTE AND G. VAN DER KAMP
Copyright # 2000 John Wiley & Sons, Ltd. Hydrol. Process. 14, 2405±2422 (2000)