Embed Size (px)
Citation preview
Available online at www.sciencedirect.com
Building and Environment 38 (2003) 753–762
www.elsevier.com/locate/buildenv
Modelling !ow and heat transfer around a seated human bodyby computational !uid dynamics
Dan N(rtoft S(rensen∗, Lars K(llgaard VoigtDepartment of Mechanical Engineering, Fluid Mechanics Section and International Centre for Indoor Environment and Energy,
Technical University of Denmark, Building 403, DK-2800 Kgs. Lyngby, Denmark
Received 22 October 2002; received in revised form 6 January 2003; accepted 31 January 2003
Abstract
A database (http://www.ie.dtu.dk/manikin) containing a detailed representation of the surface geometry of a seated female human bodywas created from a surface scan of a thermal manikin (minus clothing and hair). The radiative heat transfer coe7cient and the naturalconvection !ow around the manikin were calculated using computational !uid dynamics. Results were compared to published data and tomeasurements by particle image velocimetry. The agreement was generally good and variations across the manikin well predicted. Theuniqueness of the present work is twofold: (1) the geometry of the computational manikin has all surface features of a human being; (2)the geometry is an exact copy of an experimental thermal manikin, enabling detailed comparisons between calculations and experiments.? 2003 Elsevier Science Ltd. All rights reserved.
Keywords: Human body; Thermal manikin; CFD; Radiation; Natural convection
1. Introduction
An important goal in research on the indoor environmentis an enhanced understanding of the mechanisms responsi-ble for human perception to di>erent exposures. Normally,human subjects are used for tests concerning perception ofthe indoor environment, while experiments with manikins,equipped to resemble humans, may provide valuable in-formation regarding velocities, temperature, pollutant con-centration in the breathing zone, etc. As an alternative tomanikins and human subjects, computational !uid dynam-ics (CFD) may be used to obtain detailed information aboutthe !ow Aeld and distributions of temperature and concen-trations inside a room and particularly in the close vicinityof a person.In several studies, the !ow around geometries
resembling a standing human body have been calculated.Brohus presents CFD calculations of three di>erent geo-metrical models, constructed using rectangular shapes, andcompares the results to measurements on a standing thermalmanikin [1,2]. The complexity of the models ranges froma simple rectangle to a manikin with legs, torso, and head.
∗ Corresponding author. Tel.: +45-4525-4300; fax: +45-4593-0663.E-mail address: [email protected] (D.N. S(rensen).
The manikins were placed in a wind tunnel facing down-stream, with a contaminant source placed in front of them.The results show that the contaminant concentration inthe breathing zone varies signiAcantly with the geometryof the manikin, but for all models, the results are moreaccurate than for the case without a manikin. Moreover,they conclude that inclusion of legs in the simulation isimportant when the source is located near the !oor at lowvelocities.The experimental set-up from [2] was used by Hyun
and Kleinstreuer [3] to calculate the !ow Aeld and concen-tration distribution for a breathing manikin constructed toresemble a human being with divided legs, cylindrical neckand spherical head. A comparison between inhaled pollu-tant concentration during constant inhalation and normal(transient) breathing was made, and a signiAcant in!u-ence from the breathing set-up was observed on the doseconcentrations, which are usually smaller for the transientcase.In a number of studies, Murakami and co-workers use
CFD to calculate the !ow around a smooth shape resem-bling the human body in standing posture. They investi-gate the coupling between convective heat transfer fromthe manikin and the buoyancy-driven !ow Aeld around themanikin placed in a low-velocity (almost stagnant) displace-
0360-1323/03/$ - see front matter ? 2003 Elsevier Science Ltd. All rights reserved.doi:10.1016/S0360-1323(03)00027-1
754 D.N. S-rensen, L.K. Voigt / Building and Environment 38 (2003) 753–762
ment ventilated room, as well as in a horizontal !ow Aeld(0:25 m=s), considering two levels of turbulence intensityin the supplied air [4]. The calculations show the buoyantplume and the distribution of surface temperature for thethree cases. The convective heat transfer coe7cient is cal-culated and compares well with previous experiments. Thestudy is extended with cases of upward and downward !ow,and a strong in!uence from the !ow direction is found, witha much higher heat transfer coe7cient in the downward !owcase than in any of the other cases. For the upward !owcase, the heat transfer coe7cient is almost the same as in thestagnant !ow case [5]. Also, the !ow, temperature, and heattransfer coe7cient are considered for two manikins placedclosely together as well as for a single manikin in outdoorsettings (horizontal velocity, 2:5 m=s) [6]. At the highervelocities, buoyancy e>ects are found to be very small.Finally, models are included for thermo-physiological reg-ulation internally in the body as well as moisture transportfrom sweating. These are coupled with the CFD and radi-ation models, resulting in a complete model for the energybalance of humans [7].The geometrical shapes of the manikins in the above stud-
ies are simpliAed to reduce the geometrical complexity, andthus the computational requirements. The arms are com-bined with the body, and all facial extremities are removed.In most cases, the e>ects of these simpliAcations are negli-gible. However, if detailed information is required in, say,the breathing zone, the presence of mouth, nose, and earsmay be required. Furthermore, as will be evidenced in thepresent study, the presence of arms, armpits, and a high res-olution of the legs signiAcantly in!uences local heat transferproperties.The unique feature of the present study is that the compu-
tational manikin is an exact copy of the experimental ther-mal manikin, enabling similar set-ups during calculationsand experiments. Furthermore, the geometrical resolution ishigh and includes all relevant features of the human body,except hair and clothes. The computational manikin pre-sented here was Arst used in [8], to study the natural convec-tion !ow around a human body. The manikin was also usedto study mixed convection !ow around a person (althoughwithout hands) in a wind tunnel [9,10]. Furthermore, de-tailed segment-to-segment view factors were calculated toestimate the radiative heat exchange between di>erent bodyparts of the manikin [11].A di7cult task to accomplish experimentally is the sepa-
ration between heat removal by convection to the !ow Aeldnear the body, and radiation to the surfaces of the room, asdiscussed by e.g. de Dear et al. [12]. This separation is eas-ily accomplished by CFD and in the present work the distri-bution of radiative heat transfer coe7cients over the entirebody was calculated. Furthermore, average values for di>er-ent segments of the body (i.e. head, arms, chest, etc.) werecalculated and compared to published measurements. Also,natural convection !ow around the manikin was calculatedand compared to measurements in a similar set-up. The cal-
culated heat transfer, integrated across individual segments,agreed well with measurements, as did the velocity abovethe head of the manikin. The latter was obtained by particleimage velocimetry (PIV).The geometry of the manikin described in this article may
be downloaded from http://www.ie.dtu.dk/manikin, whereinformation concerning the Ale structure and format is givenas well. The availability of the presented geometry for down-loading through the internet will hopefully motivate otherresearchers to use the same geometry. In this way, much ofthe uncertainty—namely the di>ering geometries—of dif-ferent CFD studies may be eliminated.
2. Methods
2.1. Geometry of the manikin
The type of thermal manikin 1 chosen for this studyhas been used in a number of experimental investigations[13–15]. The manikin was placed in a seated position withthe arms hanging down by the side. The manikin wasundressed and without hair, since those details could notbe accurately resolved by the laser scanning measuringtechnique used. Furthermore, modelling clothing and haircorrectly is a di7cult task.A laser scanning technique 2 was used to extract the
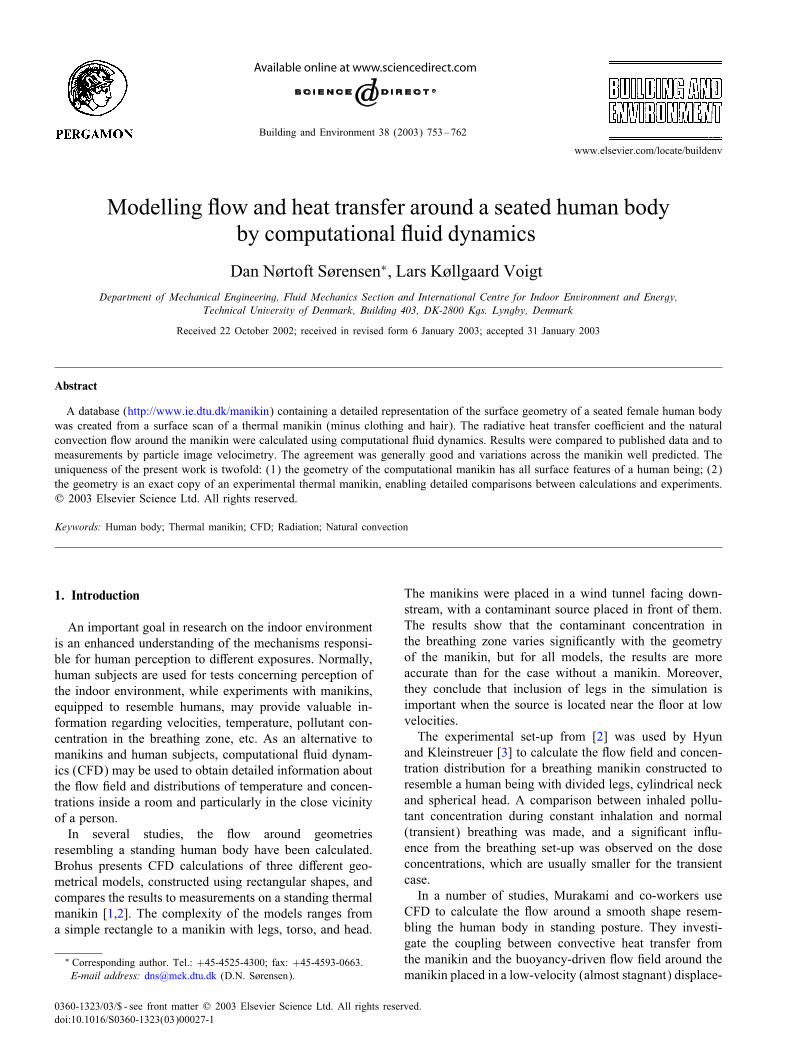
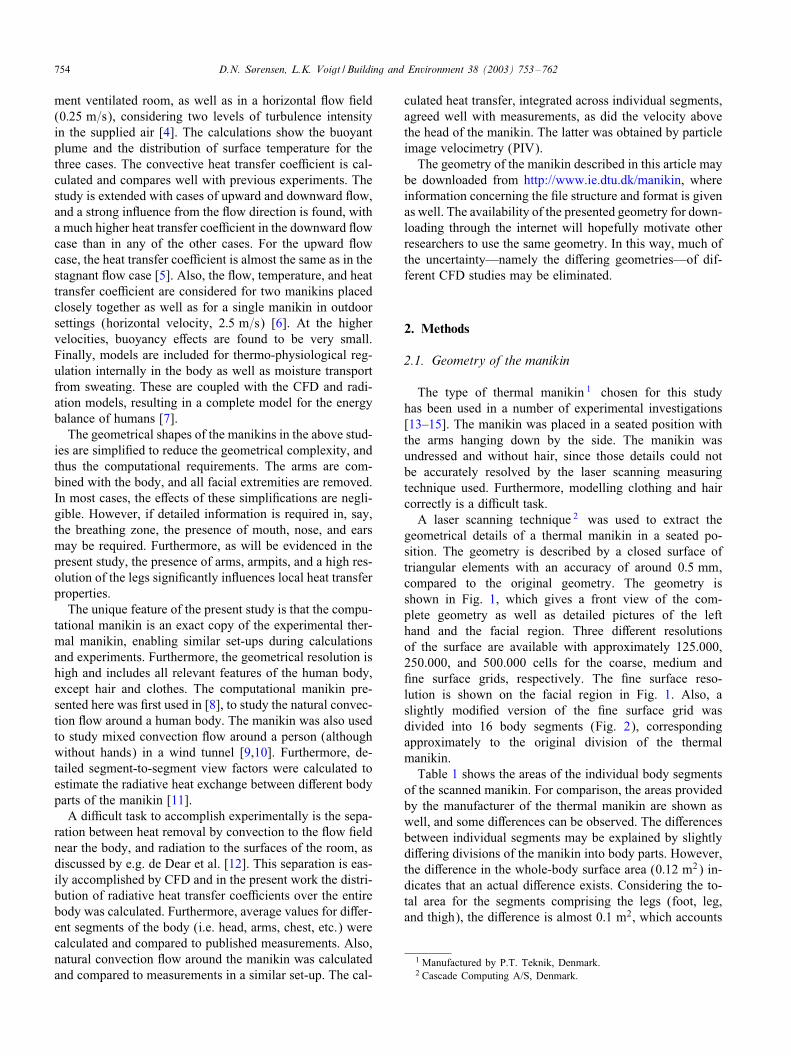
geometrical details of a thermal manikin in a seated po-sition. The geometry is described by a closed surface oftriangular elements with an accuracy of around 0:5 mm,compared to the original geometry. The geometry isshown in Fig. 1, which gives a front view of the com-plete geometry as well as detailed pictures of the lefthand and the facial region. Three di>erent resolutionsof the surface are available with approximately 125.000,250.000, and 500.000 cells for the coarse, medium andAne surface grids, respectively. The Ane surface reso-lution is shown on the facial region in Fig. 1. Also, aslightly modiAed version of the Ane surface grid wasdivided into 16 body segments (Fig. 2), correspondingapproximately to the original division of the thermalmanikin.Table 1 shows the areas of the individual body segments
of the scanned manikin. For comparison, the areas providedby the manufacturer of the thermal manikin are shown aswell, and some di>erences can be observed. The di>erencesbetween individual segments may be explained by slightlydi>ering divisions of the manikin into body parts. However,the di>erence in the whole-body surface area (0:12 m2) in-dicates that an actual di>erence exists. Considering the to-tal area for the segments comprising the legs (foot, leg,and thigh), the di>erence is almost 0:1 m2, which accounts
1 Manufactured by P.T. Teknik, Denmark.2 Cascade Computing A/S, Denmark.
D.N. S-rensen, L.K. Voigt / Building and Environment 38 (2003) 753–762 755
Fig. 1. View of the scanned manikin body, zoom of left hand and ofthe face. For the latter, the Ane-grid geometrical resolution of the surfacescan is shown.
Fig. 2. The division of the surface of the scanned manikin into segments.The head segment comprise the neck, face, mouth and nostrils. The handsegments include the thumbs.
for most of the missing surface. The reason for the largevariation for these segments is explained by the constructionof the knees of the thermal manikin, which includes an un-heated !exible joint made up of cloth. This part of the leg isnot included during the processing of the experimental data[16], whereas it is included in the surface of the scannedsurface and, correctly, in the CFD calculations.
Table 1Surface area of the individual segments of the manikina
Segment Area (CFD) Area (exp)
Lfoot 0.0452 0.043Rfoot 0.0456 0.041Lleg 0.1081 0.089Rleg 0.1083 0.089Lthigh 0.1858 0.160Rthigh 0.1894 0.165Lhand 0.0340 0.038Rhand 0.0315 0.037Larm 0.0507 0.052Rarm 0.0525 0.052Lshoulder 0.0745 0.073Rshoulder 0.0779 0.078Pelvis 0.1744 0.182Head 0.1206 0.100Chest 0.1530 0.144Back 0.1421 0.133
Whole body 1.594 1.476
aThe Arst column of data shows the areas (m2) calculated by the CFDprogram, from the laser scanned surface. The second column shows theareas provided by the manikin manufacturer.
2.2. Computational grid
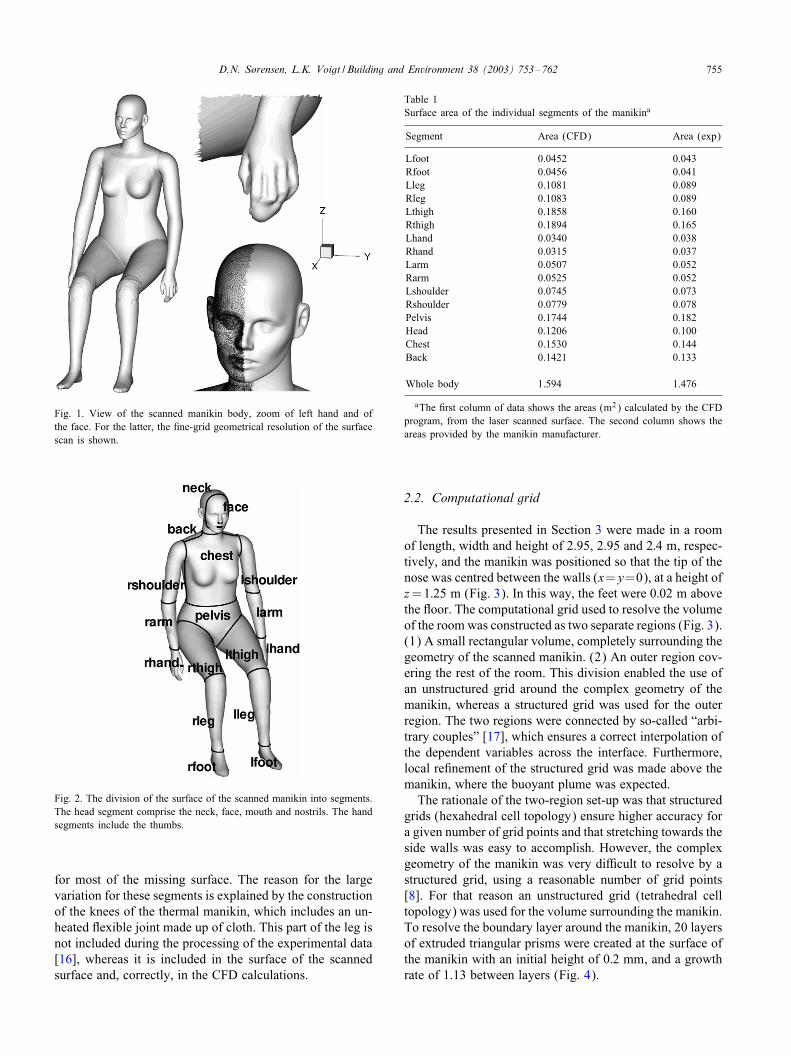
The results presented in Section 3 were made in a roomof length, width and height of 2.95, 2.95 and 2:4 m, respec-tively, and the manikin was positioned so that the tip of thenose was centred between the walls (x=y=0), at a height ofz=1:25 m (Fig. 3). In this way, the feet were 0:02 m abovethe !oor. The computational grid used to resolve the volumeof the roomwas constructed as two separate regions (Fig. 3).(1) A small rectangular volume, completely surrounding thegeometry of the scanned manikin. (2) An outer region cov-ering the rest of the room. This division enabled the use ofan unstructured grid around the complex geometry of themanikin, whereas a structured grid was used for the outerregion. The two regions were connected by so-called “arbi-trary couples” [17], which ensures a correct interpolation ofthe dependent variables across the interface. Furthermore,local reAnement of the structured grid was made above themanikin, where the buoyant plume was expected.The rationale of the two-region set-up was that structured
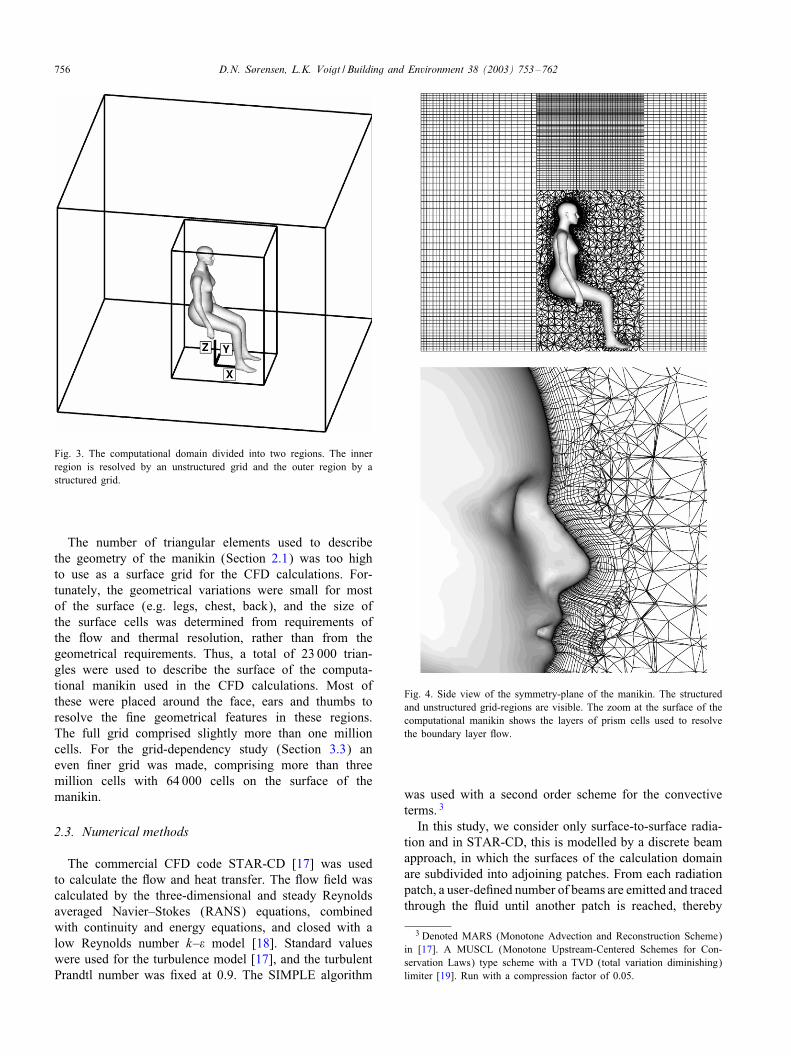
grids (hexahedral cell topology) ensure higher accuracy fora given number of grid points and that stretching towards theside walls was easy to accomplish. However, the complexgeometry of the manikin was very di7cult to resolve by astructured grid, using a reasonable number of grid points[8]. For that reason an unstructured grid (tetrahedral celltopology) was used for the volume surrounding the manikin.To resolve the boundary layer around the manikin, 20 layersof extruded triangular prisms were created at the surface ofthe manikin with an initial height of 0:2 mm, and a growthrate of 1.13 between layers (Fig. 4).
756 D.N. S-rensen, L.K. Voigt / Building and Environment 38 (2003) 753–762
Fig. 3. The computational domain divided into two regions. The innerregion is resolved by an unstructured grid and the outer region by astructured grid.
The number of triangular elements used to describethe geometry of the manikin (Section 2.1) was too highto use as a surface grid for the CFD calculations. For-tunately, the geometrical variations were small for mostof the surface (e.g. legs, chest, back), and the size ofthe surface cells was determined from requirements ofthe !ow and thermal resolution, rather than from thegeometrical requirements. Thus, a total of 23 000 trian-gles were used to describe the surface of the computa-tional manikin used in the CFD calculations. Most ofthese were placed around the face, ears and thumbs toresolve the Ane geometrical features in these regions.The full grid comprised slightly more than one millioncells. For the grid-dependency study (Section 3.3) aneven Aner grid was made, comprising more than threemillion cells with 64 000 cells on the surface of themanikin.
2.3. Numerical methods
The commercial CFD code STAR-CD [17] was usedto calculate the !ow and heat transfer. The !ow Aeld wascalculated by the three-dimensional and steady Reynoldsaveraged Navier–Stokes (RANS) equations, combinedwith continuity and energy equations, and closed with alow Reynolds number k–� model [18]. Standard valueswere used for the turbulence model [17], and the turbulentPrandtl number was Axed at 0.9. The SIMPLE algorithm
Fig. 4. Side view of the symmetry-plane of the manikin. The structuredand unstructured grid-regions are visible. The zoom at the surface of thecomputational manikin shows the layers of prism cells used to resolvethe boundary layer !ow.
was used with a second order scheme for the convectiveterms. 3
In this study, we consider only surface-to-surface radia-tion and in STAR-CD, this is modelled by a discrete beamapproach, in which the surfaces of the calculation domainare subdivided into adjoining patches. From each radiationpatch, a user-deAned number of beams are emitted and tracedthrough the !uid until another patch is reached, thereby
3 Denoted MARS (Monotone Advection and Reconstruction Scheme)in [17]. A MUSCL (Monotone Upstream-Centered Schemes for Con-servation Laws) type scheme with a TVD (total variation diminishing)limiter [19]. Run with a compression factor of 0.05.
D.N. S-rensen, L.K. Voigt / Building and Environment 38 (2003) 753–762 757
creating a radiation-dependent pair of patches. The numberof beams between two such patches determines the viewfactor between the patches. The radiative heat exchange be-tween two patches is thus a function of the view factor be-tween the two patches and depends on the emissivity andaverage temperature of each of the two patches. All surfacesare treated as grey with a constant emissivity.The size of the radiation patches determines the resolu-
tion of the radiative heat exchange. For the walls, ceilingand !oor, the length of the patch was set at 0:3 m. For thesurface of the manikin, each boundary face was deAned as apatch. Because of the large number of boundary faces usedto resolve the details of the hands, the radiation patches forthe hands comprised several boundary faces to decrease thenumber of radiation patches. From the above, a very highresolution of the radiative heat transfer for the surface of themanikin may be expected.For the calculation of the radiative heat transfer coe7cient
without !ow (Section 3.1), only the energy equation wassolved with zero conductivity for the !ow, thereby isolatingthe e>ect of radiative heat exchange between surfaces.
3. Results and discussion
In Section 3.1, the radiative heat transfer coe7cients arecalculated and compared to measurements from de Dearet al. [12]. Section 3.2 compares calculated andmeasured ve-locity Aelds for natural convection !ow around the manikin.Finally, Section 3.3 discusses the accuracy of the numericalcalculations.
3.1. Radiative heat transfer coe9cients
The emissivity of the nude manikin was assumed to be0.95 [12], whereas the outer walls, !oor and ceiling of theroom were given an emissivity of one. The temperature ofthe room surfaces was Axed at 19◦C, whereas the tempera-ture of the surface of the computational manikin was 31◦C.For the calculations in this section, the main computing
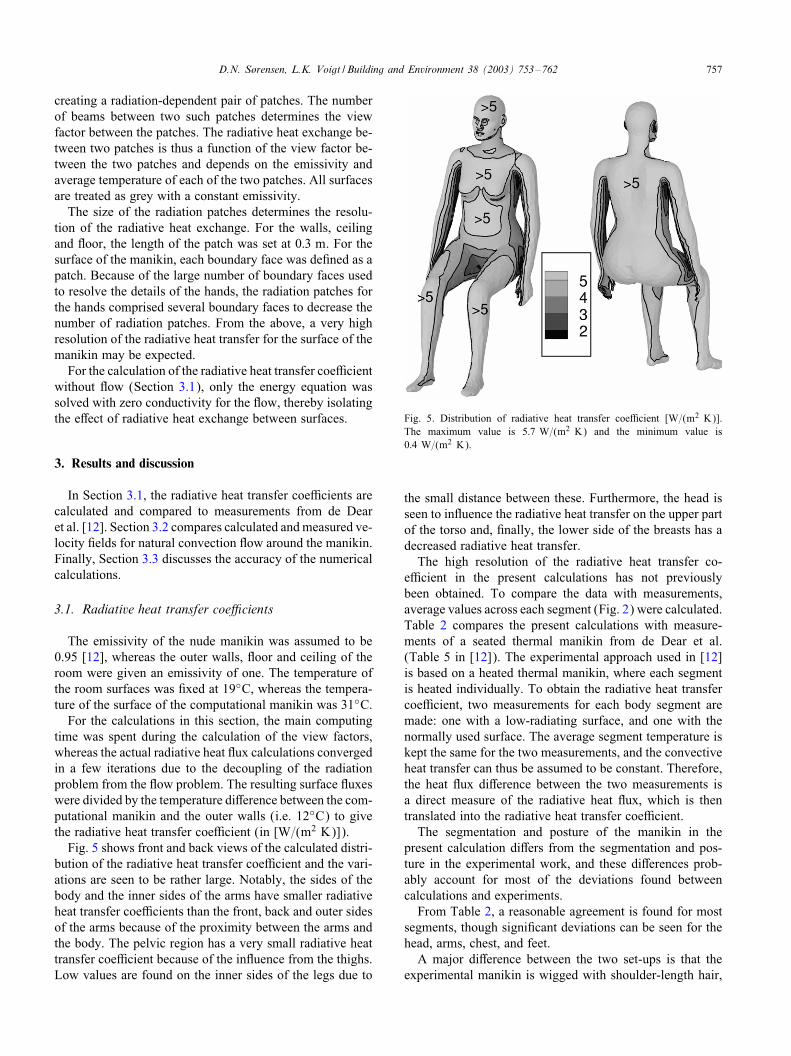
time was spent during the calculation of the view factors,whereas the actual radiative heat !ux calculations convergedin a few iterations due to the decoupling of the radiationproblem from the !ow problem. The resulting surface !uxeswere divided by the temperature di>erence between the com-putational manikin and the outer walls (i.e. 12◦C) to givethe radiative heat transfer coe7cient (in [W=(m2 K)]).Fig. 5 shows front and back views of the calculated distri-
bution of the radiative heat transfer coe7cient and the vari-ations are seen to be rather large. Notably, the sides of thebody and the inner sides of the arms have smaller radiativeheat transfer coe7cients than the front, back and outer sidesof the arms because of the proximity between the arms andthe body. The pelvic region has a very small radiative heattransfer coe7cient because of the in!uence from the thighs.Low values are found on the inner sides of the legs due to
Fig. 5. Distribution of radiative heat transfer coe7cient [W=(m2 K)].The maximum value is 5:7 W=(m2 K) and the minimum value is0:4 W=(m2 K).
the small distance between these. Furthermore, the head isseen to in!uence the radiative heat transfer on the upper partof the torso and, Anally, the lower side of the breasts has adecreased radiative heat transfer.The high resolution of the radiative heat transfer co-
e7cient in the present calculations has not previouslybeen obtained. To compare the data with measurements,average values across each segment (Fig. 2) were calculated.Table 2 compares the present calculations with measure-ments of a seated thermal manikin from de Dear et al.(Table 5 in [12]). The experimental approach used in [12]is based on a heated thermal manikin, where each segmentis heated individually. To obtain the radiative heat transfercoe7cient, two measurements for each body segment aremade: one with a low-radiating surface, and one with thenormally used surface. The average segment temperature iskept the same for the two measurements, and the convectiveheat transfer can thus be assumed to be constant. Therefore,the heat !ux di>erence between the two measurements isa direct measure of the radiative heat !ux, which is thentranslated into the radiative heat transfer coe7cient.The segmentation and posture of the manikin in the
present calculation di>ers from the segmentation and pos-ture in the experimental work, and these di>erences prob-ably account for most of the deviations found betweencalculations and experiments.From Table 2, a reasonable agreement is found for most
segments, though signiAcant deviations can be seen for thehead, arms, chest, and feet.A major di>erence between the two set-ups is that the
experimental manikin is wigged with shoulder-length hair,
758 D.N. S-rensen, L.K. Voigt / Building and Environment 38 (2003) 753–762
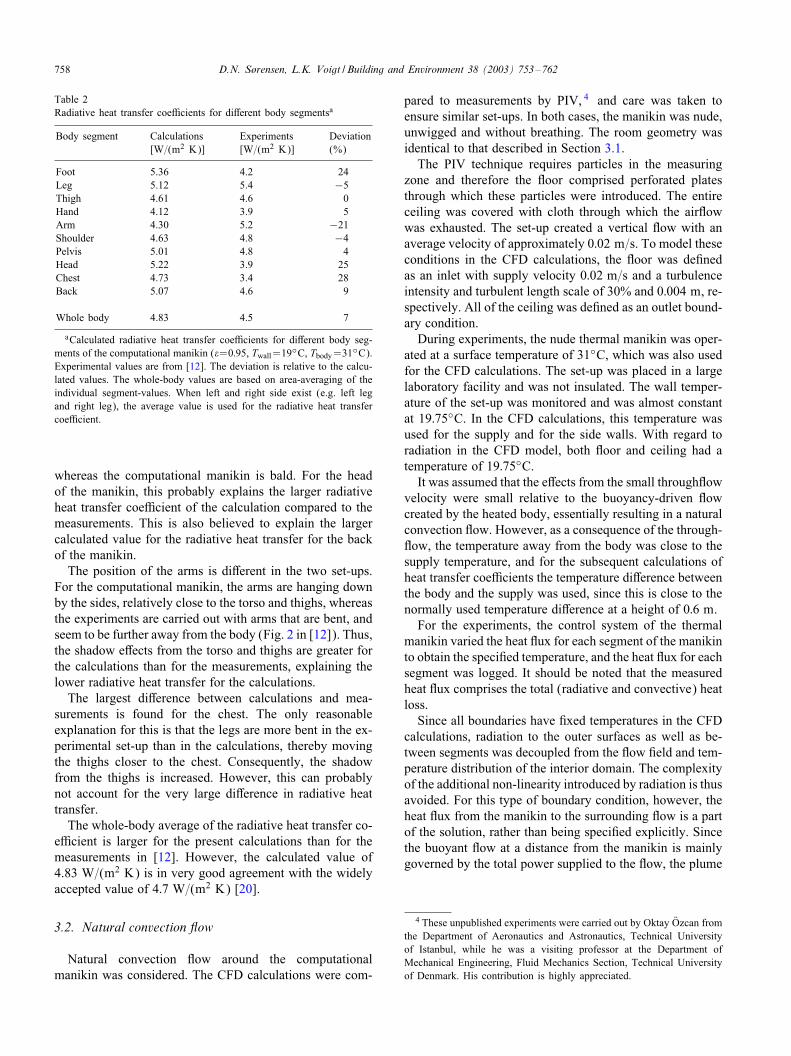
Table 2Radiative heat transfer coe7cients for di>erent body segmentsa
Body segment Calculations Experiments Deviation[W=(m2 K)] [W=(m2 K)] (%)
Foot 5.36 4.2 24Leg 5.12 5.4 −5Thigh 4.61 4.6 0Hand 4.12 3.9 5Arm 4.30 5.2 −21Shoulder 4.63 4.8 −4Pelvis 5.01 4.8 4Head 5.22 3.9 25Chest 4.73 3.4 28Back 5.07 4.6 9
Whole body 4.83 4.5 7
aCalculated radiative heat transfer coe7cients for di>erent body seg-ments of the computational manikin (�=0:95, Twall=19◦C, Tbody=31◦C).Experimental values are from [12]. The deviation is relative to the calcu-lated values. The whole-body values are based on area-averaging of theindividual segment-values. When left and right side exist (e.g. left legand right leg), the average value is used for the radiative heat transfercoe7cient.
whereas the computational manikin is bald. For the headof the manikin, this probably explains the larger radiativeheat transfer coe7cient of the calculation compared to themeasurements. This is also believed to explain the largercalculated value for the radiative heat transfer for the backof the manikin.The position of the arms is di>erent in the two set-ups.
For the computational manikin, the arms are hanging downby the sides, relatively close to the torso and thighs, whereasthe experiments are carried out with arms that are bent, andseem to be further away from the body (Fig. 2 in [12]). Thus,the shadow e>ects from the torso and thighs are greater forthe calculations than for the measurements, explaining thelower radiative heat transfer for the calculations.The largest di>erence between calculations and mea-
surements is found for the chest. The only reasonableexplanation for this is that the legs are more bent in the ex-perimental set-up than in the calculations, thereby movingthe thighs closer to the chest. Consequently, the shadowfrom the thighs is increased. However, this can probablynot account for the very large di>erence in radiative heattransfer.The whole-body average of the radiative heat transfer co-
e7cient is larger for the present calculations than for themeasurements in [12]. However, the calculated value of4.83 W=(m2 K) is in very good agreement with the widelyaccepted value of 4:7 W=(m2 K) [20].
3.2. Natural convection :ow
Natural convection !ow around the computationalmanikin was considered. The CFD calculations were com-
pared to measurements by PIV, 4 and care was taken toensure similar set-ups. In both cases, the manikin was nude,unwigged and without breathing. The room geometry wasidentical to that described in Section 3.1.The PIV technique requires particles in the measuring
zone and therefore the !oor comprised perforated platesthrough which these particles were introduced. The entireceiling was covered with cloth through which the air!owwas exhausted. The set-up created a vertical !ow with anaverage velocity of approximately 0:02 m=s. To model theseconditions in the CFD calculations, the !oor was deAnedas an inlet with supply velocity 0:02 m=s and a turbulenceintensity and turbulent length scale of 30% and 0:004 m, re-spectively. All of the ceiling was deAned as an outlet bound-ary condition.During experiments, the nude thermal manikin was oper-
ated at a surface temperature of 31◦C, which was also usedfor the CFD calculations. The set-up was placed in a largelaboratory facility and was not insulated. The wall temper-ature of the set-up was monitored and was almost constantat 19:75◦C. In the CFD calculations, this temperature wasused for the supply and for the side walls. With regard toradiation in the CFD model, both !oor and ceiling had atemperature of 19:75◦C.It was assumed that the e>ects from the small through!ow
velocity were small relative to the buoyancy-driven !owcreated by the heated body, essentially resulting in a naturalconvection !ow. However, as a consequence of the through-!ow, the temperature away from the body was close to thesupply temperature, and for the subsequent calculations ofheat transfer coe7cients the temperature di>erence betweenthe body and the supply was used, since this is close to thenormally used temperature di>erence at a height of 0:6 m.For the experiments, the control system of the thermal
manikin varied the heat !ux for each segment of the manikinto obtain the speciAed temperature, and the heat !ux for eachsegment was logged. It should be noted that the measuredheat !ux comprises the total (radiative and convective) heatloss.Since all boundaries have Axed temperatures in the CFD
calculations, radiation to the outer surfaces as well as be-tween segments was decoupled from the !ow Aeld and tem-perature distribution of the interior domain. The complexityof the additional non-linearity introduced by radiation is thusavoided. For this type of boundary condition, however, theheat !ux from the manikin to the surrounding !ow is a partof the solution, rather than being speciAed explicitly. Sincethe buoyant !ow at a distance from the manikin is mainlygoverned by the total power supplied to the !ow, the plume
4 These unpublished experiments were carried out by Oktay ROzcan fromthe Department of Aeronautics and Astronautics, Technical Universityof Istanbul, while he was a visiting professor at the Department ofMechanical Engineering, Fluid Mechanics Section, Technical Universityof Denmark. His contribution is highly appreciated.
D.N. S-rensen, L.K. Voigt / Building and Environment 38 (2003) 753–762 759
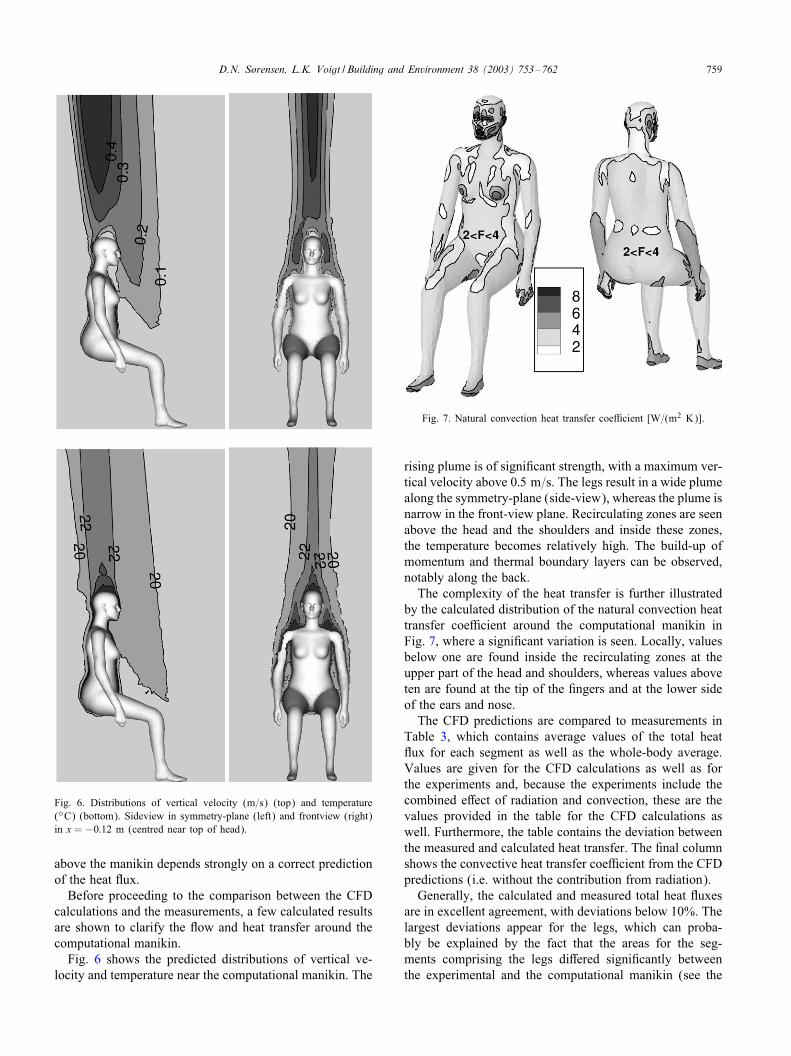
Fig. 6. Distributions of vertical velocity (m=s) (top) and temperature(◦C) (bottom). Sideview in symmetry-plane (left) and frontview (right)in x =−0:12 m (centred near top of head).
above the manikin depends strongly on a correct predictionof the heat !ux.Before proceeding to the comparison between the CFD
calculations and the measurements, a few calculated resultsare shown to clarify the !ow and heat transfer around thecomputational manikin.Fig. 6 shows the predicted distributions of vertical ve-
locity and temperature near the computational manikin. The
Fig. 7. Natural convection heat transfer coe7cient [W=(m2 K)].
rising plume is of signiAcant strength, with a maximum ver-tical velocity above 0:5 m=s. The legs result in a wide plumealong the symmetry-plane (side-view), whereas the plume isnarrow in the front-view plane. Recirculating zones are seenabove the head and the shoulders and inside these zones,the temperature becomes relatively high. The build-up ofmomentum and thermal boundary layers can be observed,notably along the back.The complexity of the heat transfer is further illustrated
by the calculated distribution of the natural convection heattransfer coe7cient around the computational manikin inFig. 7, where a signiAcant variation is seen. Locally, valuesbelow one are found inside the recirculating zones at theupper part of the head and shoulders, whereas values aboveten are found at the tip of the Angers and at the lower sideof the ears and nose.The CFD predictions are compared to measurements in
Table 3, which contains average values of the total heat!ux for each segment as well as the whole-body average.Values are given for the CFD calculations as well as forthe experiments and, because the experiments include thecombined e>ect of radiation and convection, these are thevalues provided in the table for the CFD calculations aswell. Furthermore, the table contains the deviation betweenthe measured and calculated heat transfer. The Anal columnshows the convective heat transfer coe7cient from the CFDpredictions (i.e. without the contribution from radiation).Generally, the calculated and measured total heat !uxes
are in excellent agreement, with deviations below 10%. Thelargest deviations appear for the legs, which can proba-bly be explained by the fact that the areas for the seg-ments comprising the legs di>ered signiAcantly betweenthe experimental and the computational manikin (see the
760 D.N. S-rensen, L.K. Voigt / Building and Environment 38 (2003) 753–762
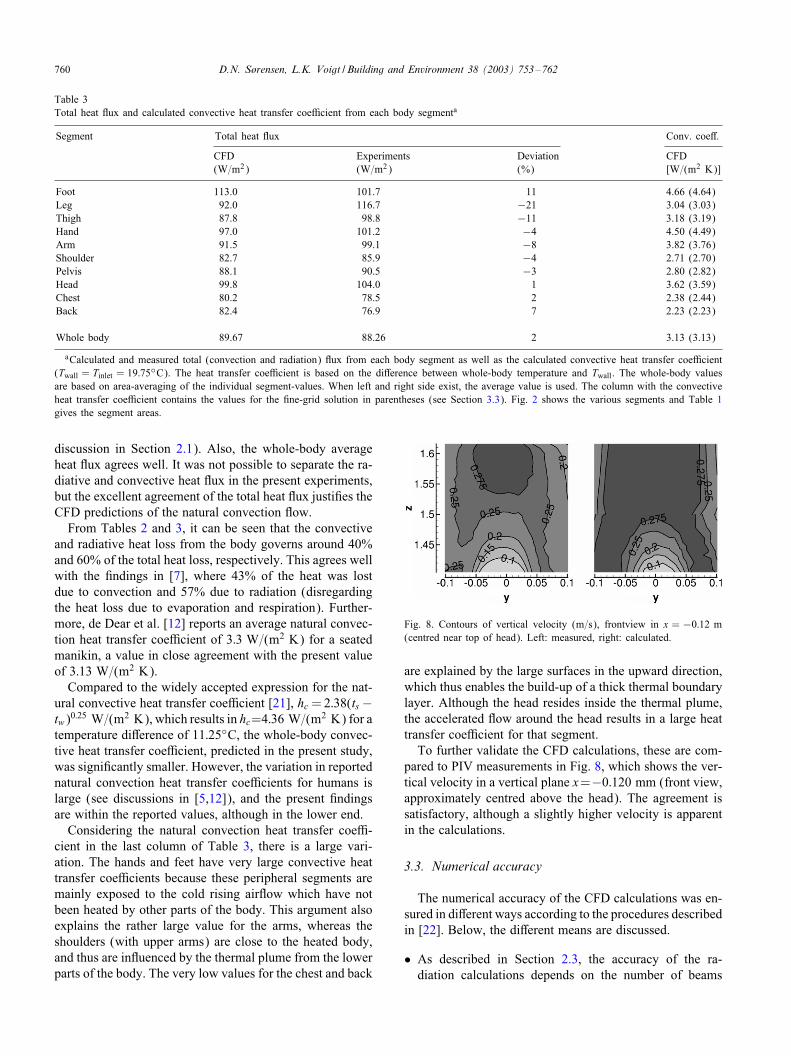
Table 3Total heat !ux and calculated convective heat transfer coe7cient from each body segmenta
Segment Total heat !ux Conv. coe>.
CFD Experiments Deviation CFD(W=m2) (W=m2) (%) [W=(m2 K)]
Foot 113.0 101.7 11 4.66 (4.64)Leg 92.0 116.7 −21 3.04 (3.03)Thigh 87.8 98.8 −11 3.18 (3.19)Hand 97.0 101.2 −4 4.50 (4.49)Arm 91.5 99.1 −8 3.82 (3.76)Shoulder 82.7 85.9 −4 2.71 (2.70)Pelvis 88.1 90.5 −3 2.80 (2.82)Head 99.8 104.0 1 3.62 (3.59)Chest 80.2 78.5 2 2.38 (2.44)Back 82.4 76.9 7 2.23 (2.23)
Whole body 89.67 88.26 2 3.13 (3.13)
aCalculated and measured total (convection and radiation) !ux from each body segment as well as the calculated convective heat transfer coe7cient(Twall = Tinlet = 19:75◦C). The heat transfer coe7cient is based on the di>erence between whole-body temperature and Twall. The whole-body valuesare based on area-averaging of the individual segment-values. When left and right side exist, the average value is used. The column with the convectiveheat transfer coe7cient contains the values for the Ane-grid solution in parentheses (see Section 3.3). Fig. 2 shows the various segments and Table 1gives the segment areas.
discussion in Section 2.1). Also, the whole-body averageheat !ux agrees well. It was not possible to separate the ra-diative and convective heat !ux in the present experiments,but the excellent agreement of the total heat !ux justiAes theCFD predictions of the natural convection !ow.From Tables 2 and 3, it can be seen that the convective
and radiative heat loss from the body governs around 40%and 60% of the total heat loss, respectively. This agrees wellwith the Andings in [7], where 43% of the heat was lostdue to convection and 57% due to radiation (disregardingthe heat loss due to evaporation and respiration). Further-more, de Dear et al. [12] reports an average natural convec-tion heat transfer coe7cient of 3:3 W=(m2 K) for a seatedmanikin, a value in close agreement with the present valueof 3:13 W=(m2 K).Compared to the widely accepted expression for the nat-
ural convective heat transfer coe7cient [21], hc =2:38(ts−tw)0:25 W=(m2 K), which results in hc=4:36 W=(m2 K) for atemperature di>erence of 11:25◦C, the whole-body convec-tive heat transfer coe7cient, predicted in the present study,was signiAcantly smaller. However, the variation in reportednatural convection heat transfer coe7cients for humans islarge (see discussions in [5,12]), and the present Andingsare within the reported values, although in the lower end.Considering the natural convection heat transfer coe7-
cient in the last column of Table 3, there is a large vari-ation. The hands and feet have very large convective heattransfer coe7cients because these peripheral segments aremainly exposed to the cold rising air!ow which have notbeen heated by other parts of the body. This argument alsoexplains the rather large value for the arms, whereas theshoulders (with upper arms) are close to the heated body,and thus are in!uenced by the thermal plume from the lowerparts of the body. The very low values for the chest and back
Fig. 8. Contours of vertical velocity (m=s), frontview in x = −0:12 m(centred near top of head). Left: measured, right: calculated.
are explained by the large surfaces in the upward direction,which thus enables the build-up of a thick thermal boundarylayer. Although the head resides inside the thermal plume,the accelerated !ow around the head results in a large heattransfer coe7cient for that segment.To further validate the CFD calculations, these are com-
pared to PIV measurements in Fig. 8, which shows the ver-tical velocity in a vertical plane x=−0:120 mm (front view,approximately centred above the head). The agreement issatisfactory, although a slightly higher velocity is apparentin the calculations.
3.3. Numerical accuracy
The numerical accuracy of the CFD calculations was en-sured in di>erent ways according to the procedures describedin [22]. Below, the di>erent means are discussed.
• As described in Section 2.3, the accuracy of the ra-diation calculations depends on the number of beams
D.N. S-rensen, L.K. Voigt / Building and Environment 38 (2003) 753–762 761
emitted from each radiation patch. The in!uence of thesegment-averaged radiative heat transfer coe7cient onthe number of beams was investigated for 100, 400, 1600and 6400 beams, and a signiAcant change was found from100 to 400 beams, and from 400 to 1600 beams, whereasthe change was very small from 1600 to 6400 beams.The results in Sections 3.1 and 3.2 were therefore madewith 6400 beams emitted from each radiation patch.
• To assess the in!uence from the number of grid pointson the natural convection !ow, the calculations in Sec-tion 3.2 were made using two di>erent grid resolutions(see description of the grids in Section 2.2). The resultspresented are for the coarse grid, except for the naturalconvection heat transfer coe7cient in Table 3, which in-cludes results for both grid resolutions. The di>erences inthe table are small, justifying the solution presented beingalmost independent of the computational grid.
• For the calculations in Section 3.2, the use of a lowReynolds number turbulence model requires a large num-ber of grid points normal to the surface and, furthermore,the centre of the computational cells closest to the surfaceshould be at a non-dimensional distance of y+¡ 1. 5 Forthe calculations presented y+ was below one everywhere,with an average value of 0.25. As described in Section2.2, the near-surface grid comprised 20 layers of extrudedprism-cells, which was deemed to be su7cient. Thus, thebasic requirement of the turbulence model was fulAlled.
4. Conclusions
This study presented the detailed geometry of the surfaceof a seated female, identical to a thermal manikin that is oftenused for laboratory experiments. The geometry was used inCFD calculations that were compared to measurements ofthe heat transfer and !ow around the manikin. The study isunique in two ways: (1) the high degree of detail for themanikin used in the calculations; and (2) the fact that wehave access to identical detailed geometries numerically andexperimentally.The radiation heat transfer coe7cient was predicted and
compared to published data [12] for various body parts,as well as to whole-body data [21]. The agreement withthe whole-body data is good, and di>ering posture probablyexplains the variations for the individual body parts.Measurements of the natural convection !ow around the
experimental, thermal manikin were compared to CFD cal-culations of an identical set-up and posture. Comparing mea-sured and calculated heat !uxes for the individual body parts,the agreement was found to be excellent and, furthermore,PIV measurements of the velocity above the head of themanikin were well predicted.
5 y+ = u�Ty1=�, where Ty1 is the distance normal to the surface, �the kinematic viscosity, and u� = (�w=�)1=2 is the friction velocity, � isthe density and �w the wall shear stress.
The surface geometry is available through the internet andwe hope that other researchers will take advantage of thisopportunity to use identical geometries for di>erent studies.
Acknowledgements
This work was supported by the Danish Technical Re-search Council (STVF) as part of the research programmeof the International Centre for Indoor Environment andEnergy.
References
[1] Brohus H, Nielsen PV. CFD models of persons evaluated byfull-scale wind channel experiments. In: Proceedings of Roomvent96, Yokohama, Japan, vol. 2, 1996. p. 137–44.
[2] Brohus H. Personal exposure to contaminant sources in ventilatedrooms. PhD thesis, Aalborg University, Denmark, 1997.
[3] Hyun S, Kleinstreuer C. Numerical simulation of mixed convectionheat and mass transfer in a human inhalation test chamber.International Journal of Heat and Mass Transfer 2001;44(12):2247–60.
[4] Murakami S, Kato S, Zeng J. Development of a computationalthermal manikin—CFD analysis of thermal environment aroundhuman body. In: Proceedings Tsinghua-HVAC-95, Beijing, 1995.p. 349–54.
[5] Murakami S, Kato S, Zeng J. Flow and temperature Aelds aroundhuman body with various room air distribution, part 1—CFDstudy on computational thermal manikin. ASHRAE Transactions1997;103(1):3–15.
[6] Murakami S, Zeng J, Hayashi T. CFD analysis of wind environmentaround a human body. Journal of Wind Engineering and IndustrialAerodynamics 1999;83:393–408.
[7] Murakami S, Kato S, Zeng J. Combined simulation of air!ow,radiation and moisture transport for heat release from a human body.Building and Environment 2000;35:489–500.
[8] Voigt LK. Navier–Stokes simulations of air!ow in rooms andaround a human body. PhD thesis, Technical University of Denmark,Denmark, 2001.
[9] Topp C, Nielsen PV, SHrensen DN. Application of computersimulated persons in indoor environmental modeling. ASHRAETransactions 2002;108(2):1084–9.
[10] Topp C. In!uence of geometry of a computer simulatedperson on contaminant distribution and personal exposure. In:ROOMVENT2002, Copenhagen, Denmark, 2002. p. 265–8.
[11] SHrensen DN. Radiation between segments of the seated human body.In: ROOMVENT2002, Copenhagen, Denmark, 2002, p. 317–20.
[12] de Dear RJ, Arens E, Hui Z, Oguro M. Convective and radiativeheat transfer coe7cients for individual human body segments.International Journal of Biometeorology 1997;40(3):141–56.
[13] Melikov A, Zhou H. Comparison of methods for determiningequivalent temperature under well-designed conditions. In: Proceed-ings of the Sixth International Conference FLORENCE ATA,Firenze, Italy, 1999.
[14] Tanabe S, Arens EA, Bauman FS, Zhang H, Madsen TL. Evaluatingthermal environments by using a thermal manikin with controlledskin surface temperature. ASHRAE Transactions 1994;100(1):39–48.
[15] Melikov A, Cermak R, Mayer M. Personalized ventilation:evaluation of di>erent air terminal devices. Energy and Buildings2002;34(8):829–36.

762 D.N. S-rensen, L.K. Voigt / Building and Environment 38 (2003) 753–762
[16] Trans P. Private communication. Regarding construction of thermalmanikin, 2002.
[17] STAR-CD. Methodology, STAR-CD Version 3.15. ComputationalDynamics Limited, 2001.
[18] Lien FS, Chen WL, Leschziner MA. Low-Reynolds-numbereddy-viscosity modelling based on non-linear stress–strain/vorticityrelations. In: Proceedings Third Symposium on EngineeringTurbulence Modelling and Measurements, Crete, Greece,1996.
[19] van Leer B. Towards the ultimate conservative di>erence scheme,V: a second-order sequel to Godunov’s method. Journal of Comput-ational Physics 1979;32:101–36.
[20] ASHRAE. Thermal comfort. In: ASHRAE handbook offundamentals. Atlanta: ASHRAE, 2001 [chapter 8].
[21] Fanger PO. Thermal comfort. Copenhagen: Danish Technical Press,1970.
[22] SHrensen DN, Nielsen PV. Quality control of computational !uiddynamics in indoor environments. Indoor Air 2003;13(1):2–17.