Embed Size (px)
Citation preview
Earth Surface Processes and LandformsEarth Surf. Process. Landforms 27, 1475–1489 (2002)Published online in Wiley InterScience (www.interscience.wiley.com). DOI: 10.1002/esp.442
MODELLING SOLUTE AND SEDIMENT TRANSPORT AT DIFFERENTSPATIAL AND TEMPORAL SCALES
HEYE R. BOGENA1* AND BERND DIEKKRUGER2
1 Systems Analysis and Technology Evaluation, Forschungszentrum Julich, D-52425, Julich, Germany2 Geological Institute, University of Bonn, D-53115 Bonn, Germany
Received 21 March 2001; Revised 30 August 2001; Accepted 30 August 2001
ABSTRACT
A concept for continuous modelling of solute and sediment transport at the catchment scale for a period of 50 yearsis presented. The simulation is based on the application of the OPUS model system, which is designed for long-termsimulations of agricultural processes. As OPUS is a hillslope model, the catchment is discretized into numerous slopes.Modifications and enhancements of the OPUS model were made in order to simulate interflow induced by macropores.The simulation results are compared with measurements at different spatial and temporal scales of a meso-scale catchmentused for drinking water supply. Five small subcatchments of 22 to 29 ha are used to validate the model at the local scale.The modified and validated model is then applied to the Wahnbach catchment with an area of about 54 km2. Simulationsat the local and the catchment scales are presented and compared with measurements.
To model the long-term behaviour of solute and sediment transport with a deterministic model, a complete set ofclimate and land-use data is necessary. In this case study a method was developed to overcome the lack of data by usinga weather generator. The long-term catchment simulations are validated by determining the mass of sediments trappedin the drinking-water reservoir. The results confirm that the model concept is applicable to a large range of scales fromsingle events to decades and from single slopes to meso-scale catchments. By using these methods it is conceivable tomake forecast simulations of the future solute and sediment discharge using land-use scenarios. Copyright 2002 JohnWiley & Sons, Ltd.
KEY WORDS: solute transport; sediment transport; scale-dependant modelling; modified model system OPUS
INTRODUCTION
Solute and sediment-transport processes occur on a wide range of temporal and spatial scales (Renschler,2000). Bloschl and Sivapalan (1995) differentiate between the observation and process scale that are definedby the extent, spacing and support of the samples and the modelling scale. Typical spatial modelling scalesare the local scale (1 m), the hillslope scale (100 m), the catchment scale (10 km) and the regional scale(1000 km); in time the typical modelling scales are the event scale (1 day), the seasonal scale (1 year) andthe long-term scale (100 years). They argue that the modelling scale often differs from the process scale,which necessitates an upscaling, downscaling or regionalization scheme. In this study, process investigationsat different scales are used for the temporal and spatial upscaling of a physically based erosion model and itsvalidation at different temporal and spatial scales.
Numerous models for simulating erosion, transport and sedimentation are available. While the UniversalSoil Loss Equation (USLE) model is able to simulate long-term erosion on single slopes without consideringsedimentation (Wischmeier, 1984), other approaches consider all processes. One has to differentiate betweenmodels applicable to single events and for continuous simulations and between models for simulating sin-gle slopes and whole catchments of different sizes. Most of the simulation models are designed for singleevents, e.g. EROSION3D (Schmidt et al., 1999), EUROSEM (Folly et al., 1999), KINEROS2 (Smith et al.,1999), ANSWERS (De Roo, 1993) and AgNPSm (Grunwald and Frede, 1999). The main problem of thistype of model is the correct determination of the initial conditions. Therefore these models are often used
* Correspondence to: H. R. Bogena, Systems Analysis and Technology Evaluation, Forschungszentrum Julich, D-52425, Julich, Germany.E-mail: [email protected]
Copyright 2002 John Wiley & Sons, Ltd.
1476 H. R. BOGENA AND B. DIEKKRUGER
to simulate design storms in order to study the effects of management practices on erosion, for example.Continuous simulation models, e.g. WEPP (Lane and Nearing, 1989) and OPUS (Smith, 1992), are morecomplex because they are also able to simulate other processes like soil-water dynamics and plant growth,which determine the interstorm processes. The advantage is that the initial condition for a storm is auto-matically provided and that series of storms can be calculated without difficulty. Continuous erosion modelsare mostly designed for single slopes and have to be differentiated from catchment models, which require aspatial discretization and parameterization. On this scale two different concepts can be found. One method isgrid-based discretization (EROSION3D, ANSWERS, AgNPSm). However, since the grid size does signifi-cantly influence the simulation results (Renschler et al., 1999) the maximum catchment size is determined bythe maximum number of grids. Another concept is to discretize the catchment into a number of representativeslopes (KINEROS2, EUROSEM). These slopes are linked via a channel that allows the simulation of erosion,transport and sedimentation in a catchment.
The validation of erosion models is a complicated task. As the results of different model comparisonsshow (e.g. Favis-Mortlock, 1998; Jetten et al., 1999), erosion models have to be calibrated to simulate thehydrographs and sedigraphs to an acceptable level. The main problem is the transferability of model parametersand initial conditions to unobserved sites and the applicability for long-term simulations. Validation at thelarge catchment scale is difficult because distributed data are rare. For long-term analysis it is necessary toinvestigate the age of deposited sediments in order to compare the results of long-term simulations withmeasurements.
In this study a combination of different approaches is used for the simulation of solute and sedimenttransport at different spatial and temporal scales. The idea of the KINEROS2 model is used to discretize thecatchment into a number of slopes. Each slope is simulated using the OPUS model system. Because of thespecial situation in the catchment some modifications to the original model were necessary.
Long-term modelling often involves the difficulty of missing input data, especially concerning physicallybased models. To overcome the lack of climate data, a part of the data set was completed using the weathergenerator WGEN (Richardson and Wright, 1984), which provides daily climate data (rainfall, temperatureand radiation). The model has already been successfully applied in Germany (Diekkruger et al., 1992).
THE RESEARCH AREA
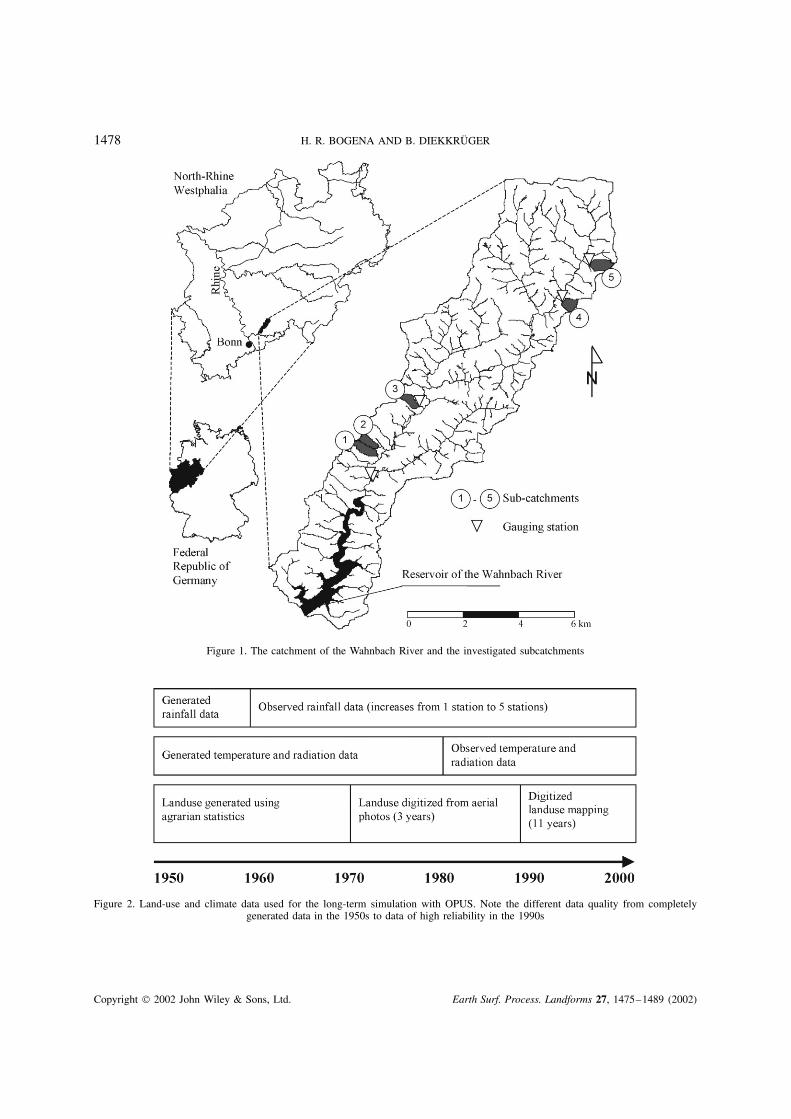
The catchment of the Wahnbach River is situated 25 km east of Bonn, Germany, on the border of theRhenish Massif (Figure 1). To guarantee the drinking-water supply for the inhabitants of the Rhein-Sieg-Kreis, a reservoir was built between 1954 and 1958. Today about 720 000 people are provided with drinkingwater from this reservoir. More than 50 per cent of the catchment, covering a surface area of about 54 km2,is productive land, with pasture predominant. Settlements and forests each occupy about 25 percent of thecatchment area. Because of the intensive agricultural land use, pollution from phosphate takes place (Klingelet al., 1997). The bedrock of the research area is built of clay rocks, silt rocks and sandstones which are oftenheavily weathered. In the southern part of the catchment, these Devonian sedimentary rocks are overlain byup to 5 m of loess cover, in which predominantly para-brown earth soils have developed. In the northernpart, where a complete loess cover is missing, the surface is mainly formed by solifluction and brown earthsoils are common.
The research area is considerably structured due to deep valley cuts. The elevation rises from about 125 min the SW to about 380 m in the NE. Due to this, a decrease of the annual mean temperature from 10 to8Ð7 °C and an increase of the annual rainfall from 850 to 1130 mm from the SW to the NE are observed.
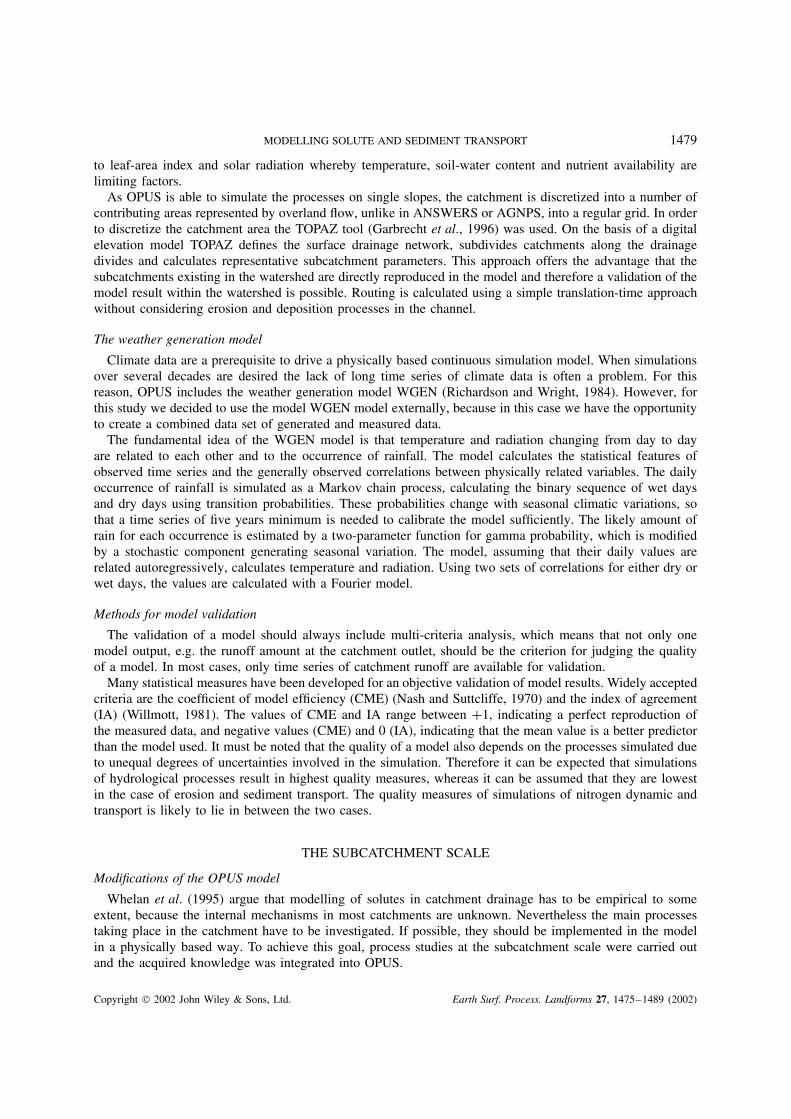
The spatial distribution of land use is an important factor in hydrological modelling and, therefore, hasto be considered as accurately as possible. By digitizing yearly mappings, a very precise spatial distributionof land use for the past 11 years was obtained (Figure 2). Furthermore, three sets of aerial photos wereavailable (1970, 1980 and 1986). As spatially distributed information is only available for the past thirtyyears, the land use before 1970 was stochastically distributed in the catchment using agrarian statistics andthe field boundaries digitized from aerial photos taken in 1970. The spatial distribution of soils is based on a
Copyright 2002 John Wiley & Sons, Ltd. Earth Surf. Process. Landforms 27, 1475–1489 (2002)
MODELLING SOLUTE AND SEDIMENT TRANSPORT 1477
digital soil map with a scale of 1 : 50 000 that, however, involves some uncertainty because of its relativelylow resolution.
ANALYSIS AND MODELLING CONCEPTS
Field sampling
The analysis and modelling concept takes into account several scales from point measurements at thehillslope scale to investigations of soil-erosion deposits in order to determine long-term sediment discharge(Bogena, 2001).
To test the applicability of the OPUS model system, five subcatchments were selected (Figure 1). Theirsurface area ranges from 22 to 29 ha and the land use is dominated by pasture (numbers 2 and 5), forest(number 4) and agriculture (numbers 1 and 3). Automatic gauging stations were installed in three of the testareas (3, 4 and 5) to facilitate validation of model results at the local scale. Since September 1998 rainfall,runoff, electrical conductivity and temperature have been continuously measured. Furthermore, anions andcations dissolved in stream and rainfall water are measured weekly and an intensive soil survey was carriedout in the subcatchment to provide the spatial variability of important soil hydraulic parameters (Herbst andDiekkruger, accepted).
To capture the sediment discharge, sediment traps and suspended load samplers were installed in the channelbeds. The measurements reveal a relationship between the different average concentrations of the materialdischarge (bed load transport, suspended load and solution load) and the land use in the test catchments.
The model concept
The OPUS model system was chosen because it simulates all necessary processes at different time scales(single events up to decades). The model has proven its usability in many investigations (e.g. Bonilla et al.,1999; Ma et al., 1999; Diekkruger et al., 1992). It combines a one-dimensional simulation of the soil pro-cesses with a one-dimensional simulation of the processes of the soil surface. OPUS was designed foragricultural ecosystems. As hydrologic processes are computed, the model can simultaneously simulate sev-eral other interactive processes, including erosion and sediment transport, nutrient cycling, plant growth andmanagement practices.
Water movement is simulated with a numerical solution of the well-known Richards equation (Richards,1931). The soil-water retention curve and the unsaturated hydraulic conductivity function are described bya modified version of the Brooks and Corey function. The infiltration can be calculated in two differentways, depending on the resolution of the rainfall data. In the case that breakpoint data are available, ananalytical solution of the Richards equation can be chosen to calculate water infiltration (Smith and Parlange,1976). Additionally, a simple approach for the simulation of surface crusting is implemented, reducing theinfiltration capacity in relationship to clay content and rainfall energy. The infiltration model is accompaniedby an unsteady-flow routing model of the surface water using the kinematic wave simplification of de Saint-Venant’s equations and a distributed calculation of sediment transport following the continuous equationdeveloped by Bennett (1974). Soil detachment is derived by using empirically derived relations of Foster(1982). In the case that only daily rainfall data are available, the Soil Conservation Service Curve Numberrunoff estimation method (USDA-SCS, 1972) has been included. This method relates the runoff amountconceptually to the precipitation amount, a soil-water storage value and an initial abstraction. The waterstorage is estimated from the soil-water content and the initial abstraction is related to the Curve Number, anempirically derived parameter. This method is accompanied by an empirically based calculation of erosion andsediment transport using the MUSLE approach (Williams, 1975). Potential evaporation (PET) is computedwith a model by Ritchie (1972), relating PET to daily maximum and minimum temperature and daily solarradiation. The nitrogen cycling is simulated in OPUS using the ‘Century’ organic residue decompositionmodel of Parton et al. (1988), which includes three pools of carbon material with different turnover rates.A convective transport model operating in parallel with the water movement model simulates the movementof solutes. The mechanistic plant-growth model integrated in OPUS relates daily dry matter production
Copyright 2002 John Wiley & Sons, Ltd. Earth Surf. Process. Landforms 27, 1475–1489 (2002)
1478 H. R. BOGENA AND B. DIEKKRUGER
Figure 1. The catchment of the Wahnbach River and the investigated subcatchments
Figure 2. Land-use and climate data used for the long-term simulation with OPUS. Note the different data quality from completelygenerated data in the 1950s to data of high reliability in the 1990s
Copyright 2002 John Wiley & Sons, Ltd. Earth Surf. Process. Landforms 27, 1475–1489 (2002)
MODELLING SOLUTE AND SEDIMENT TRANSPORT 1479
to leaf-area index and solar radiation whereby temperature, soil-water content and nutrient availability arelimiting factors.
As OPUS is able to simulate the processes on single slopes, the catchment is discretized into a number ofcontributing areas represented by overland flow, unlike in ANSWERS or AGNPS, into a regular grid. In orderto discretize the catchment area the TOPAZ tool (Garbrecht et al., 1996) was used. On the basis of a digitalelevation model TOPAZ defines the surface drainage network, subdivides catchments along the drainagedivides and calculates representative subcatchment parameters. This approach offers the advantage that thesubcatchments existing in the watershed are directly reproduced in the model and therefore a validation of themodel result within the watershed is possible. Routing is calculated using a simple translation-time approachwithout considering erosion and deposition processes in the channel.
The weather generation model
Climate data are a prerequisite to drive a physically based continuous simulation model. When simulationsover several decades are desired the lack of long time series of climate data is often a problem. For thisreason, OPUS includes the weather generation model WGEN (Richardson and Wright, 1984). However, forthis study we decided to use the model WGEN model externally, because in this case we have the opportunityto create a combined data set of generated and measured data.
The fundamental idea of the WGEN model is that temperature and radiation changing from day to dayare related to each other and to the occurrence of rainfall. The model calculates the statistical features ofobserved time series and the generally observed correlations between physically related variables. The dailyoccurrence of rainfall is simulated as a Markov chain process, calculating the binary sequence of wet daysand dry days using transition probabilities. These probabilities change with seasonal climatic variations, sothat a time series of five years minimum is needed to calibrate the model sufficiently. The likely amount ofrain for each occurrence is estimated by a two-parameter function for gamma probability, which is modifiedby a stochastic component generating seasonal variation. The model, assuming that their daily values arerelated autoregressively, calculates temperature and radiation. Using two sets of correlations for either dry orwet days, the values are calculated with a Fourier model.
Methods for model validation
The validation of a model should always include multi-criteria analysis, which means that not only onemodel output, e.g. the runoff amount at the catchment outlet, should be the criterion for judging the qualityof a model. In most cases, only time series of catchment runoff are available for validation.
Many statistical measures have been developed for an objective validation of model results. Widely acceptedcriteria are the coefficient of model efficiency (CME) (Nash and Suttcliffe, 1970) and the index of agreement(IA) (Willmott, 1981). The values of CME and IA range between C1, indicating a perfect reproduction ofthe measured data, and negative values (CME) and 0 (IA), indicating that the mean value is a better predictorthan the model used. It must be noted that the quality of a model also depends on the processes simulated dueto unequal degrees of uncertainties involved in the simulation. Therefore it can be expected that simulationsof hydrological processes result in highest quality measures, whereas it can be assumed that they are lowestin the case of erosion and sediment transport. The quality measures of simulations of nitrogen dynamic andtransport is likely to lie in between the two cases.
THE SUBCATCHMENT SCALE
Modifications of the OPUS model
Whelan et al. (1995) argue that modelling of solutes in catchment drainage has to be empirical to someextent, because the internal mechanisms in most catchments are unknown. Nevertheless the main processestaking place in the catchment have to be investigated. If possible, they should be implemented in the modelin a physically based way. To achieve this goal, process studies at the subcatchment scale were carried outand the acquired knowledge was integrated into OPUS.
Copyright 2002 John Wiley & Sons, Ltd. Earth Surf. Process. Landforms 27, 1475–1489 (2002)
1480 H. R. BOGENA AND B. DIEKKRUGER
The runoff during heavy rainfall occurrences in the winter season is dominated by interflow. This runoffis mainly caused by a very low permeability of the strongly weathered Devonian bedrock (Flugel and Smith,1999). An additional factor increasing interflow is the nature of the soil surface, which is heavily compactedby cattle, accompanied by a high number of macropores and pipes causing preferential flow. Due to thesecircumstances, a large part of the infiltration excess is drained by the macropore system and not by overlandflow. The importance of this process is described by many authors, e.g. Germann (1990) and Bronstert(1994). For simulating the correct amount of overland flow on hillslopes often a calibration of the saturatedhydraulic conductivity �Ks� value is carried out. Without the consideration of preferential flow, this causes anincrease in the nitrate washout simulated because the main solute flux would then take place through the soilmatrix. In order to model the water and solute transport successfully, the OPUS model system was extendedto facilitate the simulation of the interflow induced by macropores (Bogena, 2001). The infiltration excesssimulated by OPUS is divided into overland flow and macropore flow. Furthermore a small groundwaterreservoir is situated in the valley plain, which has a direct contact to the channel and causes a retardationof the downslope-transported water (quick groundwater). This reservoir is accounted for in the model usinga linear single storage model. To reproduce the base flow, a slow groundwater storage model is introduced.For simulation of solute transport in the catchment, each storage model is coupled with a simple completemixing model.
To test these modifications to OPUS, a simulation of the solute and sediment transport of the Berrensiefensubcatchment was undertaken. To consider the spatial variability of the soil properties the subcatchment wassubdivided into eight hillslopes. On the basis of the investigated soil data (Bogena, 2001), soil hydrologicalparameters were calculated using the Rawls and Brakensiek (1985) pedotransfer function. For the simulation,these parameters are averaged for every plane. Using a digital elevation model, representative slope profileswere derived for each hillslope. An application of the modified OPUS on the Berrensiefen subcatchmentwas carried out with a simulated period from 1 August 1998 until 31 December 2000 using the breakpointdata option.
Calibration of the OPUS modelIn this section the calibration of the Ks value of the topsoil and the percentage of infiltration excess water
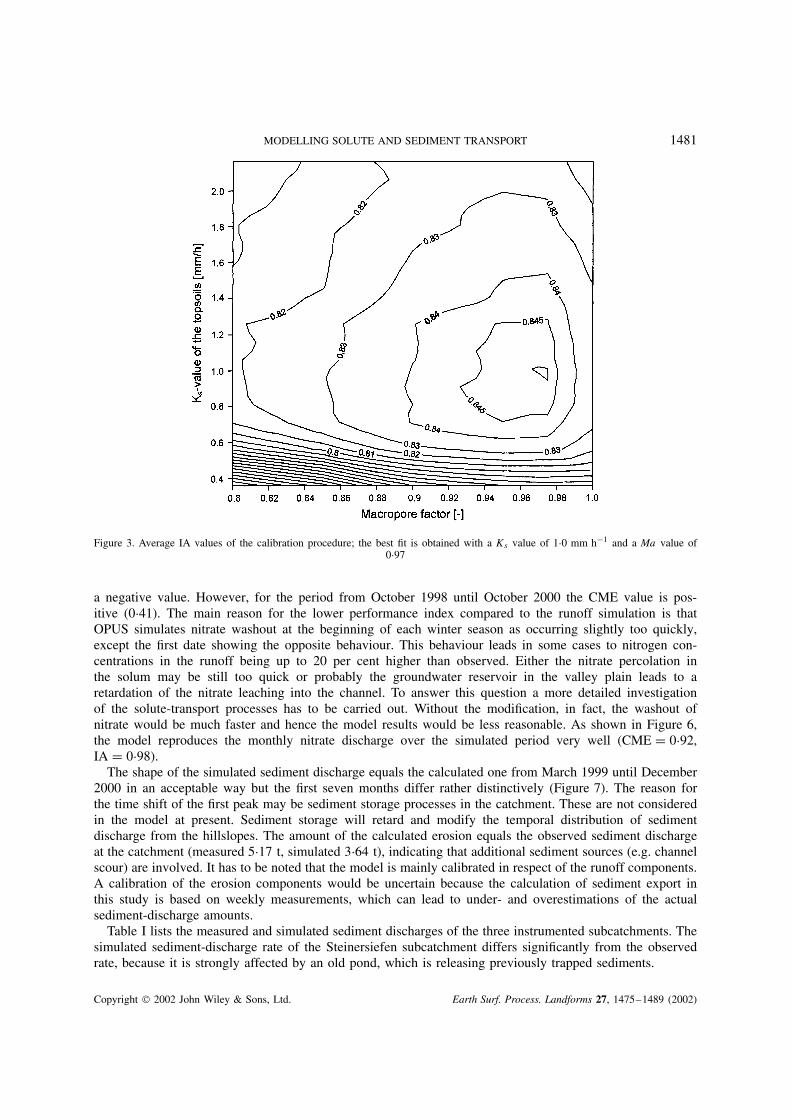
draining into the macropores (Ma) are presented in more detail. Both variables reveal a distinct sensitivity bythe simulation of the runoff generation process as well as for the transport of solute and sediment transportwith OPUS. Furthermore, both parameters are strongly correlated, because the Ks value determines the amountof water remaining on the soil surface and thus the amount that is potentially drained into the macropores. Forthis reason, a two-dimensional calibration procedure is applied in which both variables are varied alternately.The first year of observed runoff data is used for calibrating procedure.
The Ks measurements of the soil revealed a maximum in the class of 1 to 2 mm h�1 of the frequencydistribution. According to this result, a Ks value of 1Ð2 mm h�1 is used as starting point for the automaticcalibration procedure for the saturated hydraulic conductivity. The Ks value was varied in 10 per cent stepsupwards and downwards. The Ma factor, being an exclusively conceptual parameter, cannot be measuredin the field. Based upon the observation of frequent macropores in the soils, the base value of Ma waschosen to be relatively high. First trial-and-error simulations also revealed that the optimal value of Ma wasbetween 0Ð8 and 0Ð99. Within this range, the value of Ma was also varied in 10 per cent steps. The indexof agreement (IA) is selected as the numerical objective function in the calibration procedure. Besides thequality of runoff reproduction, the simulated course of nitrate concentration is also taken into considerationin judging the model performance. To facilitate a combination of both IA distributions as a criterion for thefinding of optimum values of Ks and Ma, an average spreading is calculated. The result is shown in Figure 3,indicating that the most appropriate value for Ks is 0Ð99 mm h�1 and for Ma 0Ð95 with an IA value of 0Ð848.
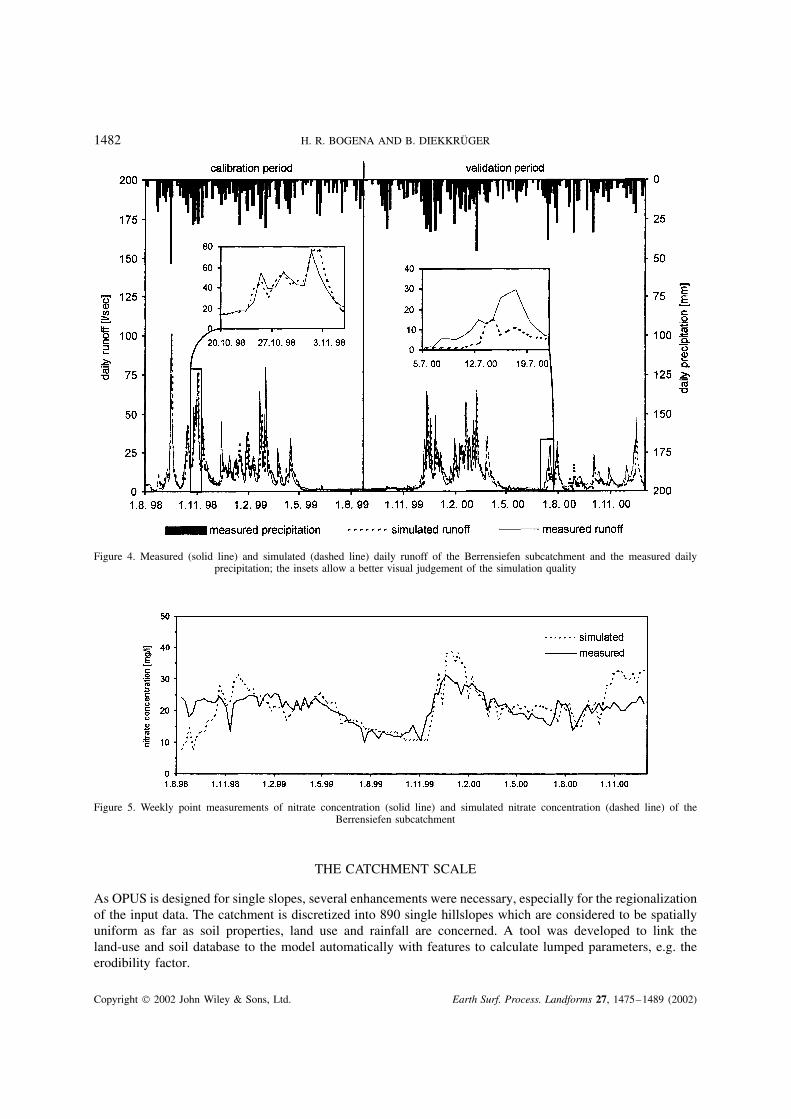
ResultsThe result of the runoff simulation of the Berrensiefen subcatchment is shown in Figure 4. The simu-
lated and the observed hydrograph are similar for the calibration period (IA D 0Ð95 and CME D 0Ð82) andeven for the validation period (IA D 0Ð95 and CME D 0Ð81). Comparing the weekly measured nitrate con-centrations with the simulation outcome (Figure 5) IA decreases to a value of 0Ð77 and CME decreases to
Copyright 2002 John Wiley & Sons, Ltd. Earth Surf. Process. Landforms 27, 1475–1489 (2002)
MODELLING SOLUTE AND SEDIMENT TRANSPORT 1481
Figure 3. Average IA values of the calibration procedure; the best fit is obtained with a Ks value of 1Ð0 mm h�1 and a Ma value of0Ð97
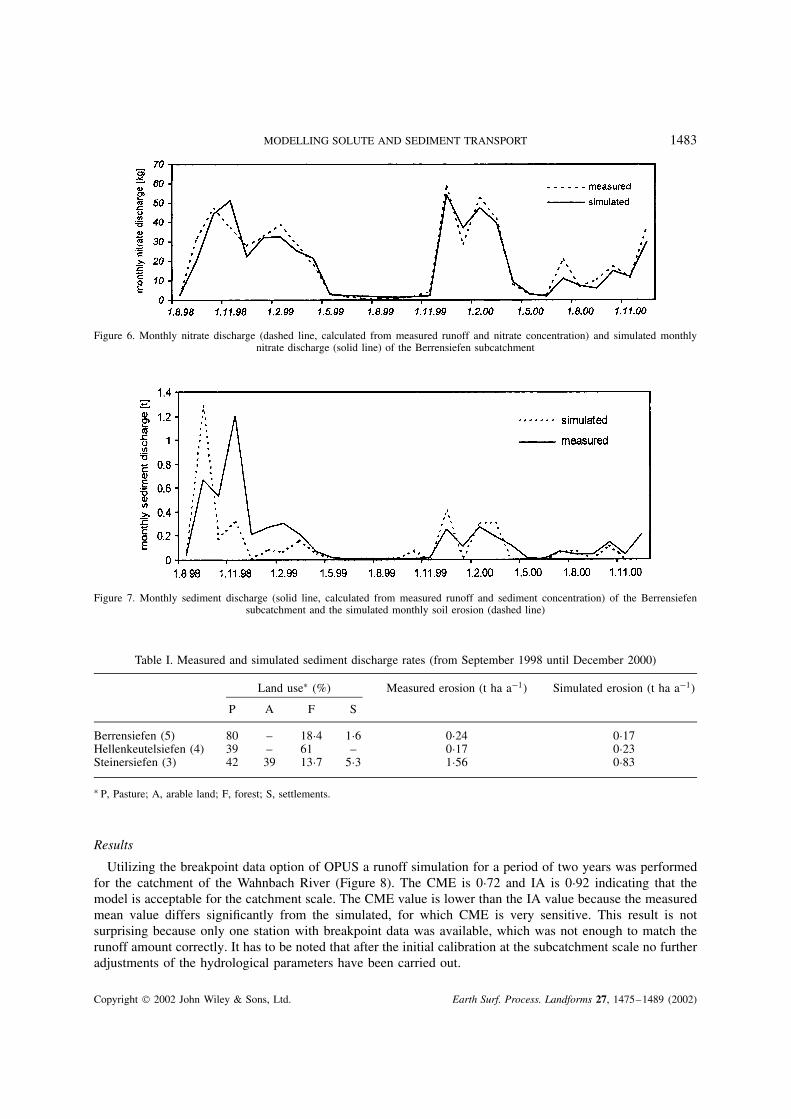
a negative value. However, for the period from October 1998 until October 2000 the CME value is pos-itive (0Ð41). The main reason for the lower performance index compared to the runoff simulation is thatOPUS simulates nitrate washout at the beginning of each winter season as occurring slightly too quickly,except the first date showing the opposite behaviour. This behaviour leads in some cases to nitrogen con-centrations in the runoff being up to 20 per cent higher than observed. Either the nitrate percolation inthe solum may be still too quick or probably the groundwater reservoir in the valley plain leads to aretardation of the nitrate leaching into the channel. To answer this question a more detailed investigationof the solute-transport processes has to be carried out. Without the modification, in fact, the washout ofnitrate would be much faster and hence the model results would be less reasonable. As shown in Figure 6,the model reproduces the monthly nitrate discharge over the simulated period very well (CME D 0Ð92,IA D 0Ð98).
The shape of the simulated sediment discharge equals the calculated one from March 1999 until December2000 in an acceptable way but the first seven months differ rather distinctively (Figure 7). The reason forthe time shift of the first peak may be sediment storage processes in the catchment. These are not consideredin the model at present. Sediment storage will retard and modify the temporal distribution of sedimentdischarge from the hillslopes. The amount of the calculated erosion equals the observed sediment dischargeat the catchment (measured 5Ð17 t, simulated 3Ð64 t), indicating that additional sediment sources (e.g. channelscour) are involved. It has to be noted that the model is mainly calibrated in respect of the runoff components.A calibration of the erosion components would be uncertain because the calculation of sediment export inthis study is based on weekly measurements, which can lead to under- and overestimations of the actualsediment-discharge amounts.
Table I lists the measured and simulated sediment discharges of the three instrumented subcatchments. Thesimulated sediment-discharge rate of the Steinersiefen subcatchment differs significantly from the observedrate, because it is strongly affected by an old pond, which is releasing previously trapped sediments.
Copyright 2002 John Wiley & Sons, Ltd. Earth Surf. Process. Landforms 27, 1475–1489 (2002)
1482 H. R. BOGENA AND B. DIEKKRUGER
Figure 4. Measured (solid line) and simulated (dashed line) daily runoff of the Berrensiefen subcatchment and the measured dailyprecipitation; the insets allow a better visual judgement of the simulation quality
Figure 5. Weekly point measurements of nitrate concentration (solid line) and simulated nitrate concentration (dashed line) of theBerrensiefen subcatchment
THE CATCHMENT SCALE
As OPUS is designed for single slopes, several enhancements were necessary, especially for the regionalizationof the input data. The catchment is discretized into 890 single hillslopes which are considered to be spatiallyuniform as far as soil properties, land use and rainfall are concerned. A tool was developed to link theland-use and soil database to the model automatically with features to calculate lumped parameters, e.g. theerodibility factor.
Copyright 2002 John Wiley & Sons, Ltd. Earth Surf. Process. Landforms 27, 1475–1489 (2002)
MODELLING SOLUTE AND SEDIMENT TRANSPORT 1483
Figure 6. Monthly nitrate discharge (dashed line, calculated from measured runoff and nitrate concentration) and simulated monthlynitrate discharge (solid line) of the Berrensiefen subcatchment
Figure 7. Monthly sediment discharge (solid line, calculated from measured runoff and sediment concentration) of the Berrensiefensubcatchment and the simulated monthly soil erosion (dashed line)
Table I. Measured and simulated sediment discharge rates (from September 1998 until December 2000)
Land useŁ (%) Measured erosion (t ha a�1) Simulated erosion (t ha a�1)
P A F S
Berrensiefen (5) 80 – 18Ð4 1Ð6 0Ð24 0Ð17Hellenkeutelsiefen (4) 39 – 61 – 0Ð17 0Ð23Steinersiefen (3) 42 39 13Ð7 5Ð3 1Ð56 0Ð83
Ł P, Pasture; A, arable land; F, forest; S, settlements.
Results
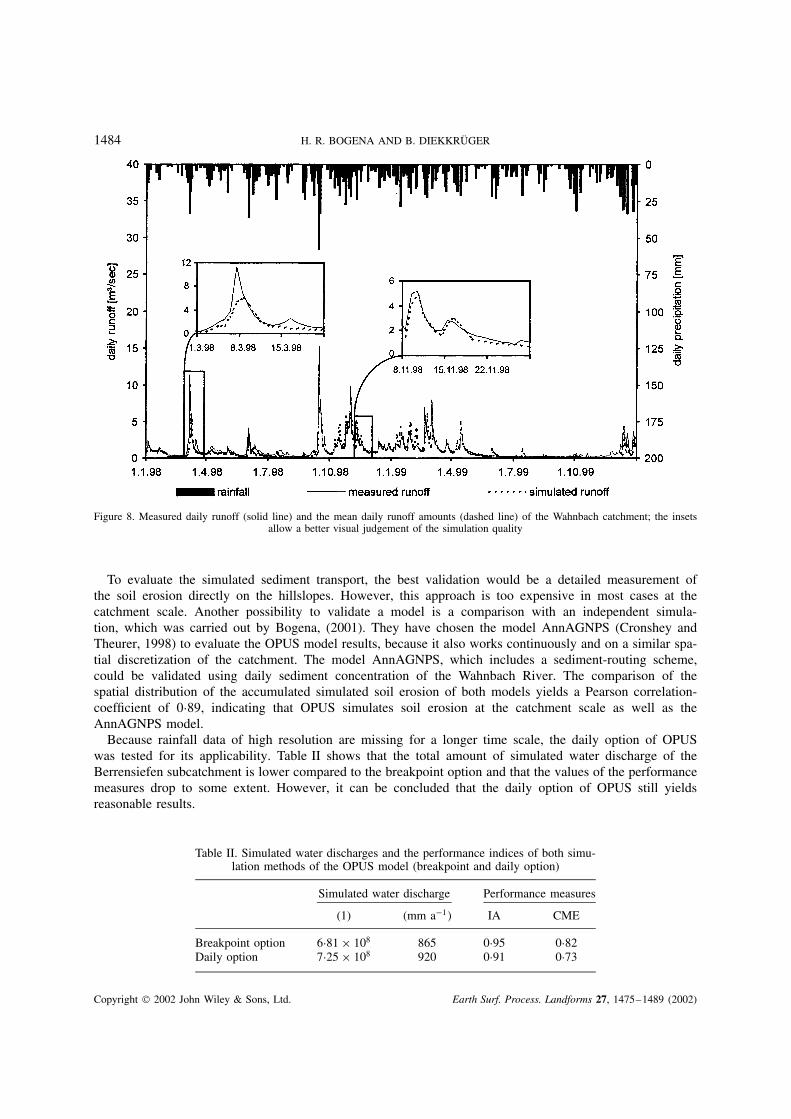
Utilizing the breakpoint data option of OPUS a runoff simulation for a period of two years was performedfor the catchment of the Wahnbach River (Figure 8). The CME is 0Ð72 and IA is 0Ð92 indicating that themodel is acceptable for the catchment scale. The CME value is lower than the IA value because the measuredmean value differs significantly from the simulated, for which CME is very sensitive. This result is notsurprising because only one station with breakpoint data was available, which was not enough to match therunoff amount correctly. It has to be noted that after the initial calibration at the subcatchment scale no furtheradjustments of the hydrological parameters have been carried out.
Copyright 2002 John Wiley & Sons, Ltd. Earth Surf. Process. Landforms 27, 1475–1489 (2002)
1484 H. R. BOGENA AND B. DIEKKRUGER
Figure 8. Measured daily runoff (solid line) and the mean daily runoff amounts (dashed line) of the Wahnbach catchment; the insetsallow a better visual judgement of the simulation quality
To evaluate the simulated sediment transport, the best validation would be a detailed measurement ofthe soil erosion directly on the hillslopes. However, this approach is too expensive in most cases at thecatchment scale. Another possibility to validate a model is a comparison with an independent simula-tion, which was carried out by Bogena, (2001). They have chosen the model AnnAGNPS (Cronshey andTheurer, 1998) to evaluate the OPUS model results, because it also works continuously and on a similar spa-tial discretization of the catchment. The model AnnAGNPS, which includes a sediment-routing scheme,could be validated using daily sediment concentration of the Wahnbach River. The comparison of thespatial distribution of the accumulated simulated soil erosion of both models yields a Pearson correlation-coefficient of 0Ð89, indicating that OPUS simulates soil erosion at the catchment scale as well as theAnnAGNPS model.
Because rainfall data of high resolution are missing for a longer time scale, the daily option of OPUSwas tested for its applicability. Table II shows that the total amount of simulated water discharge of theBerrensiefen subcatchment is lower compared to the breakpoint option and that the values of the performancemeasures drop to some extent. However, it can be concluded that the daily option of OPUS still yieldsreasonable results.
Table II. Simulated water discharges and the performance indices of both simu-lation methods of the OPUS model (breakpoint and daily option)
Simulated water discharge Performance measures
(1) �mm a�1� IA CME
Breakpoint option 6Ð81 ð 108 865 0Ð95 0Ð82Daily option 7Ð25 ð 108 920 0Ð91 0Ð73
Copyright 2002 John Wiley & Sons, Ltd. Earth Surf. Process. Landforms 27, 1475–1489 (2002)
MODELLING SOLUTE AND SEDIMENT TRANSPORT 1485
Figure 9. Measured (dashed line) and simulated (solid line) monthly runoff of the Wahnbach catchment
Figure 10. Measured (dashed line) and simulated (solid line) monthly nitrate discharge of the Wahnbach catchment
Figure 11. Monthly sediment discharge of the Wahnbach catchment (dashed line, calculated from measured runoff and turbidity) andmean monthly soil erosion on the simulated hillslopes (solid line)
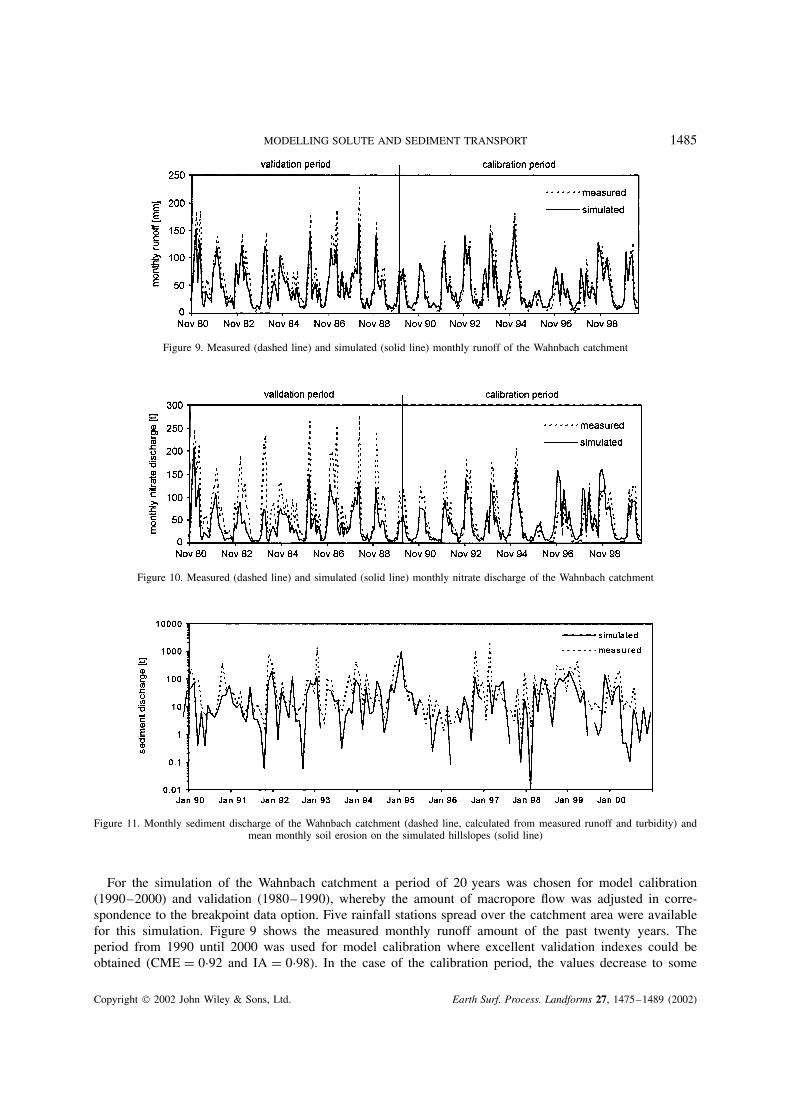
For the simulation of the Wahnbach catchment a period of 20 years was chosen for model calibration(1990–2000) and validation (1980–1990), whereby the amount of macropore flow was adjusted in corre-spondence to the breakpoint data option. Five rainfall stations spread over the catchment area were availablefor this simulation. Figure 9 shows the measured monthly runoff amount of the past twenty years. Theperiod from 1990 until 2000 was used for model calibration where excellent validation indexes could beobtained (CME D 0Ð92 and IA D 0Ð98). In the case of the calibration period, the values decrease to some
Copyright 2002 John Wiley & Sons, Ltd. Earth Surf. Process. Landforms 27, 1475–1489 (2002)
1486 H. R. BOGENA AND B. DIEKKRUGER
extent (CME D 0Ð84 and IA D 0Ð95), but are still very satisfactory. Figure 10 displays the simulated nitratedischarge with a good correspondence to the observed data (CME D 0Ð74 and IA D 0Ð92) during the calibra-tion period and acceptable values for the validation period (CME D 0Ð49 and IA D 0Ð81). The main problemhereby may be the inadequate information about the agricultural practice of the past; furthermore, the sim-ulated soil erosion compared with the measured sediment discharge with an IA value of 0Ð39 (Figure 11).Again this clearly indicates that for a correct simulation of the sediment discharge additional process under-standing has been integrated into the model. However, the results suggest that the daily option is adequatefor the catchment scale and can be used for long-term simulations.
THE LONG-TERM SCALE
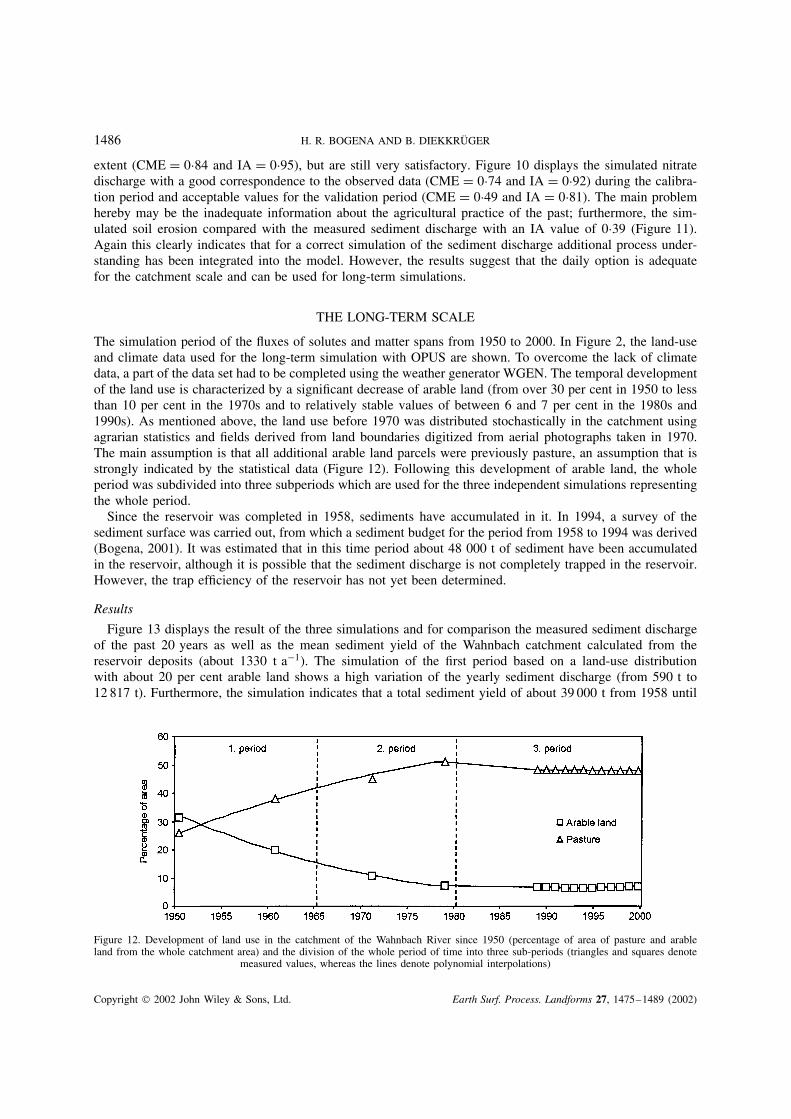
The simulation period of the fluxes of solutes and matter spans from 1950 to 2000. In Figure 2, the land-useand climate data used for the long-term simulation with OPUS are shown. To overcome the lack of climatedata, a part of the data set had to be completed using the weather generator WGEN. The temporal developmentof the land use is characterized by a significant decrease of arable land (from over 30 per cent in 1950 to lessthan 10 per cent in the 1970s and to relatively stable values of between 6 and 7 per cent in the 1980s and1990s). As mentioned above, the land use before 1970 was distributed stochastically in the catchment usingagrarian statistics and fields derived from land boundaries digitized from aerial photographs taken in 1970.The main assumption is that all additional arable land parcels were previously pasture, an assumption that isstrongly indicated by the statistical data (Figure 12). Following this development of arable land, the wholeperiod was subdivided into three subperiods which are used for the three independent simulations representingthe whole period.
Since the reservoir was completed in 1958, sediments have accumulated in it. In 1994, a survey of thesediment surface was carried out, from which a sediment budget for the period from 1958 to 1994 was derived(Bogena, 2001). It was estimated that in this time period about 48 000 t of sediment have been accumulatedin the reservoir, although it is possible that the sediment discharge is not completely trapped in the reservoir.However, the trap efficiency of the reservoir has not yet been determined.
Results
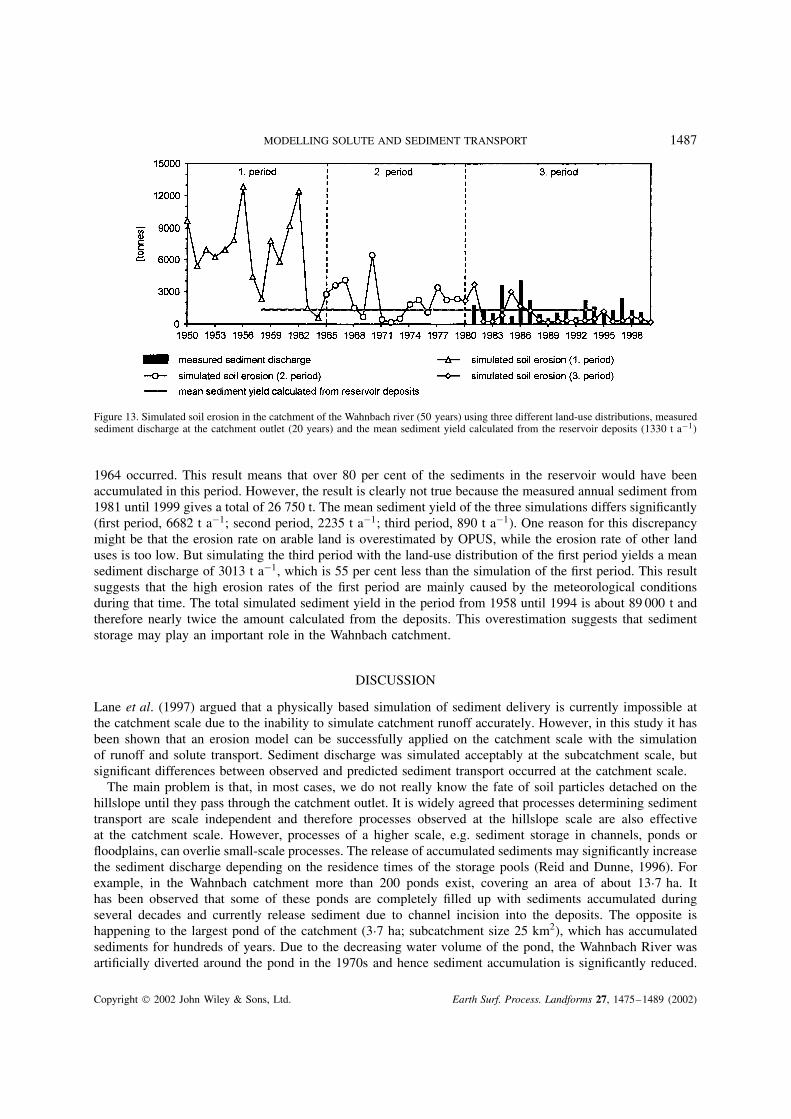
Figure 13 displays the result of the three simulations and for comparison the measured sediment dischargeof the past 20 years as well as the mean sediment yield of the Wahnbach catchment calculated from thereservoir deposits (about 1330 t a�1). The simulation of the first period based on a land-use distributionwith about 20 per cent arable land shows a high variation of the yearly sediment discharge (from 590 t to12 817 t). Furthermore, the simulation indicates that a total sediment yield of about 39 000 t from 1958 until
Figure 12. Development of land use in the catchment of the Wahnbach River since 1950 (percentage of area of pasture and arableland from the whole catchment area) and the division of the whole period of time into three sub-periods (triangles and squares denote
measured values, whereas the lines denote polynomial interpolations)
Copyright 2002 John Wiley & Sons, Ltd. Earth Surf. Process. Landforms 27, 1475–1489 (2002)
MODELLING SOLUTE AND SEDIMENT TRANSPORT 1487
Figure 13. Simulated soil erosion in the catchment of the Wahnbach river (50 years) using three different land-use distributions, measuredsediment discharge at the catchment outlet (20 years) and the mean sediment yield calculated from the reservoir deposits (1330 t a�1)
1964 occurred. This result means that over 80 per cent of the sediments in the reservoir would have beenaccumulated in this period. However, the result is clearly not true because the measured annual sediment from1981 until 1999 gives a total of 26 750 t. The mean sediment yield of the three simulations differs significantly(first period, 6682 t a�1; second period, 2235 t a�1; third period, 890 t a�1). One reason for this discrepancymight be that the erosion rate on arable land is overestimated by OPUS, while the erosion rate of other landuses is too low. But simulating the third period with the land-use distribution of the first period yields a meansediment discharge of 3013 t a�1, which is 55 per cent less than the simulation of the first period. This resultsuggests that the high erosion rates of the first period are mainly caused by the meteorological conditionsduring that time. The total simulated sediment yield in the period from 1958 until 1994 is about 89 000 t andtherefore nearly twice the amount calculated from the deposits. This overestimation suggests that sedimentstorage may play an important role in the Wahnbach catchment.
DISCUSSION
Lane et al. (1997) argued that a physically based simulation of sediment delivery is currently impossible atthe catchment scale due to the inability to simulate catchment runoff accurately. However, in this study it hasbeen shown that an erosion model can be successfully applied on the catchment scale with the simulationof runoff and solute transport. Sediment discharge was simulated acceptably at the subcatchment scale, butsignificant differences between observed and predicted sediment transport occurred at the catchment scale.
The main problem is that, in most cases, we do not really know the fate of soil particles detached on thehillslope until they pass through the catchment outlet. It is widely agreed that processes determining sedimenttransport are scale independent and therefore processes observed at the hillslope scale are also effectiveat the catchment scale. However, processes of a higher scale, e.g. sediment storage in channels, ponds orfloodplains, can overlie small-scale processes. The release of accumulated sediments may significantly increasethe sediment discharge depending on the residence times of the storage pools (Reid and Dunne, 1996). Forexample, in the Wahnbach catchment more than 200 ponds exist, covering an area of about 13Ð7 ha. Ithas been observed that some of these ponds are completely filled up with sediments accumulated duringseveral decades and currently release sediment due to channel incision into the deposits. The opposite ishappening to the largest pond of the catchment (3Ð7 ha; subcatchment size 25 km2), which has accumulatedsediments for hundreds of years. Due to the decreasing water volume of the pond, the Wahnbach River wasartificially diverted around the pond in the 1970s and hence sediment accumulation is significantly reduced.
Copyright 2002 John Wiley & Sons, Ltd. Earth Surf. Process. Landforms 27, 1475–1489 (2002)
1488 H. R. BOGENA AND B. DIEKKRUGER
These examples stress that for a successful application of a physically based model of sediment delivery, itis necessary to analyse the existence and the behaviour of storages and to include them in the model scheme.
Therefore analytical techniques have to be developed and applied to solve this problem. For example,in the case of a long-term examination, the fingerprint technique (Collins et al., 1997) in combination withradiometric dating of sediment deposits (Bogena, 2001) may be an adequate way to discern the internalprocesses of sediment transport in catchments.
CONCLUSIONS
A method to analyse transport processes in catchments at different temporal and spatial scales has beendescribed. The observed scales span from one day up to several decades and from the micro-scale (subcatch-ment) up to the meso-scale (catchment). The OPUS model system was assessed to investigate whether it isable to simulate the transport of matter at these scales.
After modifying OPUS, the model was able to simulate runoff and nitrate discharge in the Berrensiefensubcatchment reasonably well. It was possible to simulate runoff accurately with both the break-point and thedaily model option. The simulated water balance was better using the daily option, because five rain stationscould be used instead of one station with breakpoint data. Therefore, the use of a rain-disaggregation modelis planned, which is appropriate to generate break-point data from daily rainfall data. These models havealready shown their capability in hydrological modelling (Renschler, 2000).
A principal task in modelling soil erosion at the catchment scale is to solve the problem of how to link theslope with the channel and how to consider temporary channel storages. The processes involved are time-dependent and therefore it is important to know the time scale the relevant processes have. Accompanied byinvestigations of the recent sediment transport processes in subcatchments and radiometric dating of sediments,the model result could be used to analyse to what extent the channels and the valley plains may serve astemporary storages of soil erosion products.
For the simulation of sediment yield it could be shown that the sediment-transport processes within thecatchment are of significant importance especially concerning long-term treatments. Therefore, for a successfulsimulation of the sediment transport, these processes have to be implemented into the model.
Despite the shortcomings mentioned, the developed methods permit the long-term physically based simu-lation of solute and sediment transport. The results are encouraging enough to envision forecast simulationsof the future solute and sediment discharge using land-use scenarios.
ACKNOWLEDGEMENTS
This work was supported by the Deutsche Forschungsgemeinschaft (Collaboration Research Programme 350).The authors also thank the Wahnbachtalsperrenverband for providing weather, runoff and land-use data forthe Wahnbach.
REFERENCES
Bennett JP. 1974. Conceptions of mathematical modeling of sediment yield. Water Resources Research 10: 299–303.Bloschl G, Sivapalan M. 1995. Scale issues in hydrological modelling: A review. In Scale Issues in Hydrological Modelling , Kalma JD,
Sivalpalan M (eds). Wiley: Chichester; 9–49.Bogena H. 2001. Analyzing and modelling solute and sediment transport at different spatial and temporal scales – a case
study of the catchment of the Wahnbach River, Germany. PhD thesis, University of Bonn (http://hss.ulb.uni-bonn.de/ulb bonn/diss online/math nat fak/2001).
Bonilla CA, Munoz JF, Vauclin M. 1999. OPUS simulation of water dynamics and nitrate transport in a field plot. Ecological Modelling122: 69–80.
Bronstert A. 1994. Modellierung der Abfluˇbildung und der Bodenwasserdynamik von Hangen. IHW-Publication 46: Karlsruhe (inGerman).
Collins AL, Walling DE, Leeks GJL. 1997. Source type ascription for fluvial suspended sediment based on a quantitative compositefingerprinting technique. Catena 29: 1–27.
Cronshey RG, Theurer FD. 1998. AnnAGNPS – Non-Point Pollution Loading Model. Proceedings First Federal Interagency HydrologicModelling Conference, 19–23 April 1998 : 20–28.
Copyright 2002 John Wiley & Sons, Ltd. Earth Surf. Process. Landforms 27, 1475–1489 (2002)
MODELLING SOLUTE AND SEDIMENT TRANSPORT 1489
De Roo ADJ. 1993. Modelling surface runoff and soil erosion in catchments using Geographical Information Systems; Validity andapplicability of the ‘ANSWERS’ model in two catchments in the loess area of South Limburg (the Netherlands) and one in Devon(UK). Netherlands Geographical Studies 157: 1–304.
Diekkruger B, Smith RE, Krug D, Baumann R. 1992. Validation of the model system OPUS. Catena Supplement 19: 139–153.Favis-Mortlock DT. 1998. Validation of field-scale soil erosion models using common datasets. In Modelling Soil Erosion by Water ,
Boardman J, Favis-Mortlock DT (eds). NATO-ASI Series I-55: Berlin; 89–128.Flugel W-A, Smith RE. 1999. Integrated process studies and modelling simulations of hillslope hydrology and interflow dynamics using
the HILLS model. Environmental Modelling & Software 14: 153–160.Folly A, Quinton JN, Smith RE. 1999. Evaluation of the EUROSEM model using data from the Catsop watershed, The Netherlands.
Catena 37: 507–519.Foster GR. 1982. Modeling the erosion process. In Hydrologic Modeling of Small Watersheds , Haan CT et al. (eds). American Society
of Agricultural Engineers, Monograph 5: St. Joseph; 297–388.Garbrecht J, Starks PJ, Martz LW. 1996. New Digital Landscape Parameterisation Methodologies. Proceedings of the 32nd Annual
Conference and Symposium on GIS and Water Resources. Ft. Lauderdale, USA.Germann F. 1990. Macropores and hydrologic hillslope processes. In Process Studies in Hillslope Hydrology , Anderson MG, Burt T
(eds). Wiley: Chichester; 327–363.Grunwald S, Frede H-G. 1999. Using the modified agricultural non-point source pollution model in German watersheds. Catena 37:
319–328.Herbst M, Diekkruger B. Accepted. Modelling the spatial variability of soil moisture in a micro-scale catchment. Physics and Chemistry
of the Earth .Jetten V, de Roo A, Favis-Mortlock D. 1999. Evaluation of field-scale and catchment-scale soil erosion models. Catena 34: 521–541.Klingel R, Kramer R, Stoffels M, Thein J. 1997. Hydrogeochemisches Monitoring im Trinkwasserschutz dargestellt am Einzugsgebiet
der Wahnbachtalsperre. Zeitschrift d. deutschen Geologischen Gesellschaft 148: 357–367 (in German).Lane LJ, Nearing MA. 1989. USDA – Water Erosion Prediction Project: Hillslope profile model documentation. NSERL Report 2: West
Lafayette, USA.Lane LJ, Hernandez M, Nichols M. 1997. Processes controlling sediment yield from watersheds as functions of spatial scale.
Environmental Modelling & Software 12: 355–369.Ma QL, Hook JE, Wauchope RD. 1999. Evapotranspiration predictions: a comparison among GLEAMS, Opus, PRZM-2 and RZWQM
models in a humid and thermic climate. Agricultural Systems 59: 41–55.Nash JE, Suttcliffe JV. 1970. River flow forecasting through conceptional models, part I – A discussion of principles. Journal of
Hydrology 10: 282–290.Parton WJ, Mosier AR, Schimel DS. 1988. Rates and pathways of nitrous oxide production in a shortgrass steppe. Biogeochemistry 6:
45–58.Rawls WJ, Brakensiek DL. 1985. Prediction of soil water properties for hydrological modeling. In Proceedings of the Symposium on
Watershed Management in the Eighties , Jones E, Ward TJ (eds). ASCE: New York; 293–299.Reid MR, Dunne T. 1996. Rapid Evaluation of Sediment Budgets . Catena Verlag: Reiskirchen.Renschler CS. 2000. Strategies for implementing natural resource management tools – A geographical information science perspective
on water and sediment balance assessment at different scales. PhD thesis, University of Bonn.Renschler CS, Mannaerts C, Diekkruger B. 1999. Evaluating spatial and temporal variability of soil erosion risk – rainfall erosivity and
soil loss ratios in Andalusia, Spain. Catena 34: 209–225.Richards LA. 1931. Capillary conduction of liquids through porous media. Physics 1: 318–333.Richardson CW, Wright DA. 1984. WGEN: A model for generating daily weather variables. US Department of Agriculture, Agricultural
Research Service, ARS. 8.Ritchie JT. 1972. A model for predicting evaporation from a row crop with incomplete cover. Water Resources Research 8: 182–190.Schmidt J, Werner Mv, Michael A. 1999. Application of the EROSION 3D model to the CATSOP watershed, The Netherlands. Catena
37: 449–456.Smith RE. 1992. OPUS: An integrated simulation model for non-point source pollution transport at the field scale. Vol. I, Documentation.
USDA, ARS–98: Fort Collins, USA.Smith RE, Parlange J-Y. 1976. A parameter-efficient hydrologic infiltration model. Water Resources Research 14: 533–538.Smith RE, Goodrich DC, Unkrich CL. 1999. Simulation of selected events on the Catsop catchment by KINEROS2 – A report for the
GCTE conference on catchment scale erosion models. Catena 37: 457–475.USDA-SCS. 1972. National Engineering Handbook, Section 4. Hydrology . United States Department of Agriculture – Soil Conservation
Service.Whelan MJ, Kirby MJ, Burt TP. 1995. Predicting Nitrate Concentrations in Small Catchment Streams. In Solute Modelling in Catchment
Systems , Trudgill ST (ed.). Wiley: Chichester; 165–192.Williams JR. 1975. Sediment yield prediction with universal equation using runoff energy factor. United States Department of
Agriculture – Agricultural Research Service, ARS-S-40: 244–252.Willmott CJ. 1981. On the validation of models. Physical Geography 2: 184–194.Wischmeier W. 1984. The USLE – Some Reflections. Journal of Soil and Water Conservation 39: 105–107.
Copyright 2002 John Wiley & Sons, Ltd. Earth Surf. Process. Landforms 27, 1475–1489 (2002)


![Fluxes of water and solute in a coastal wetland …...Journal of Hydrology ELSEVIER [1] Journal of Hydrology 164(1995) 89-107 Fluxes of water and solute in a coastal wetland sediment](https://img.pdfslide.net/doc/110x75/5fab0ddcbf9557730c3401da/fluxes-of-water-and-solute-in-a-coastal-wetland-journal-of-hydrology-elsevier.jpg)