Embed Size (px)
Citation preview
Chapter 4
MODIFICATION BY ELASTOMERS
4.1 Introduction
4.1.1 Maleated rubbers
4.1.2 Functional rubbers
4.2. Experimental
4.2.1. Materials
4.2.2 Modification of epoxy resin by solid / functional elastomers
4.2.3 Modification of epoxy resin by reactive liquid elastomers
4.2.4 Effect of bisphenol-A on the blends of epoxies and elastomers
4.3 Results and discussion
4.3.1 Modification by solidi functional elastomers
4.3.2 Modification by reactive liquid elastomers
4.3.3 Effect of bisphenol A on the modification of epoxies by e1astomers
4.4. Conclusion
References
193
Chapter 4
4.1 INTRODUCTION
The most successful method for epoxy toughening is the incorporation of a
second elastomeric phase into the glassy epoxy matrix resulting in phase separation
[1].Toughening can be done by dispersing a small amount ofelastomer as discreet
phase or by incorporation of reactive liquid polymers [2]. This chapter deals with
the modification of commercial epoxy resin by blending with each of different
elastomers, maleated elastomers and functional elastomers. Masticated rubber was
dissolved in methyl ethyl ketone and blended with commercial epoxy resin.
Acrylonitrile butadiene rubber (NBR), maleated NBR (MA-g-NBR), cross-linked
NBR (NBR-C) and polyurethane rubber (PU) were incorporated into epoxy resin
by such solution blending. Blends of epoxy resin were also prepared with liquid
functional rubbers such as hydroxyl terminated polybutadiene (HTPB), hydroxyl
terminated natural rubber (HTNR) and carboxyl terminated butadiene-acrylonitrile
rubber (CTBN). The fracture behavior and the particle size distribution were studied
by scanning electron microscopy (SEM). The thermal properties of the toughened
resin were studied by thermo gravimetric analysis (TGA), dynamic mechanical
analysis (DMA) and DSC. The physical properties of the cured blends were
compared with those of the control resin.
The addition of elastomeric phases increases the overall ductility of the
polymer over a wide range of temperature and also improves toughness and impact
resistance. Reinforcement of the resin matrix with fibres can also improve
toughness properties. But reinforcement is not always feasible. Even when
reinforced, areas with relatively low amount of fibres are still prone to damage and
can suffer breakage when the product is in use. Hence the need for toughening the
matrix. Incorporation of elastomers has also been found to cause significant reduction
in mould shrinkage.
4.1.1 Maleated rubbers
Maleic anhydride (MA) is often used to functionalise elastomers. Farmer and
Wheeler [3] patented the method of modifying rubbers with MA. When a solution
of natural rubber is heated in the presence of MA and benzoyl peroxide for several
hours at 70-100°C, new elastomers with altered physical and chemical behaviour
are obtained. MA readily reacts with polymeric double bonds and free radicals by
194
I
Modification by elastomers
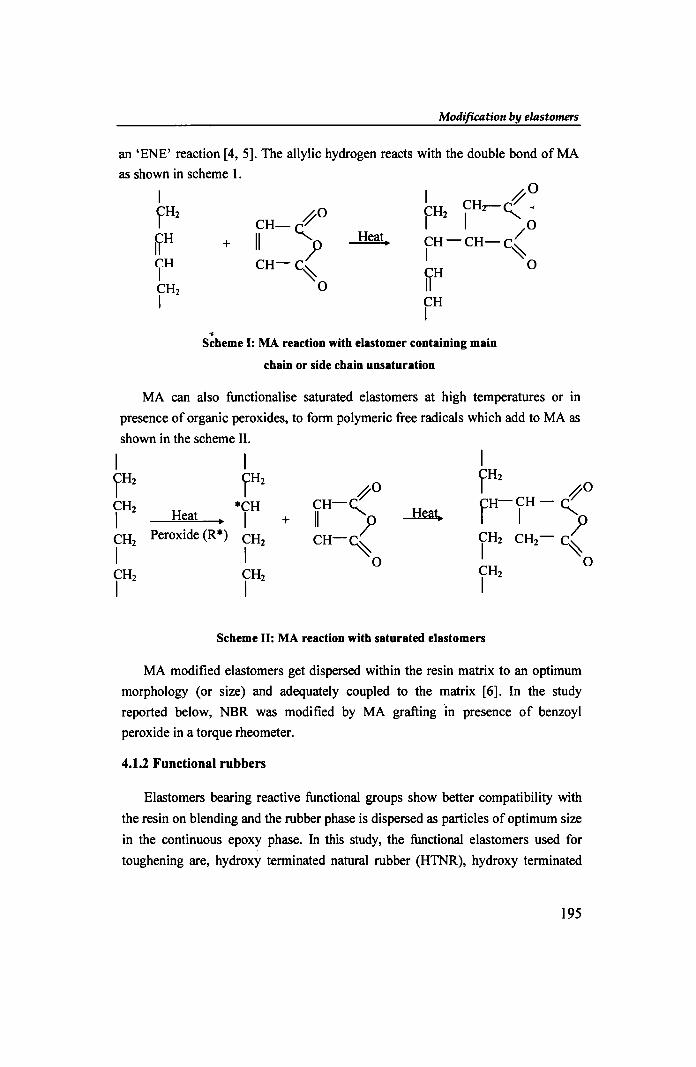
an 'ENE' reaction [4,5]. The allylic hydrogen reacts with the double bond of MA
as shown in scheme 1.
+
..
~o CH-cZ
11 ? CH-'\.
o
Heat.
I ~O CH CHr-C:'-< I 2 I """'0
CH-CH-C,( I ~ rrH 0 CH I
Scheme I: MA reaction with elastomer containing main
chain or side chain unsaturation
MA can also functionalise saturated elastomers at high temperatures or in
presence of organic peroxides, to form polymeric free radicals which add to MA as
shown in the scheme 11.
1 1
fH2 fH2 ~O
fH2
~O fH- CH - cZ CH2 Heat *CH CH-c.:..
Jkat. 1 I + I1 ? ~H-C? CH2
Peroxide (R *) CH2 CH-'\. CH2
1 2 ~
I 1 0 CH2 CH2
CH2
1 I 1
Scheme 11: MA reaction with saturated elastomers
MA modified elastomers get dispersed within the resin matrix to an optimum
morphology (or size) and adequately coupled to the matrix [6]. In the study
reported below, NBR was modified by MA grafting In presence of benzoyl
peroxide in a torque rheometer.
4.1.2 Functional rubbers
Elastomers bearing reactive functional groups show better compatibility with
the resin on blending and the rubber phase is dispersed as particles of optimum size
in the continuous epoxy phase. In this study, the functional elastomers used for
toughening are, hydroxy terminated natural rubber (HTNR), hydroxy terminated
195
0
Chapter 4
polybutadiene (HTPB), maleated nitrile rubber (MA-g-NBR) and carboxy
tenninated nitrile rubber (CTBN). Of these, maleated NBR and HTNR were
prepared in the laboratory.
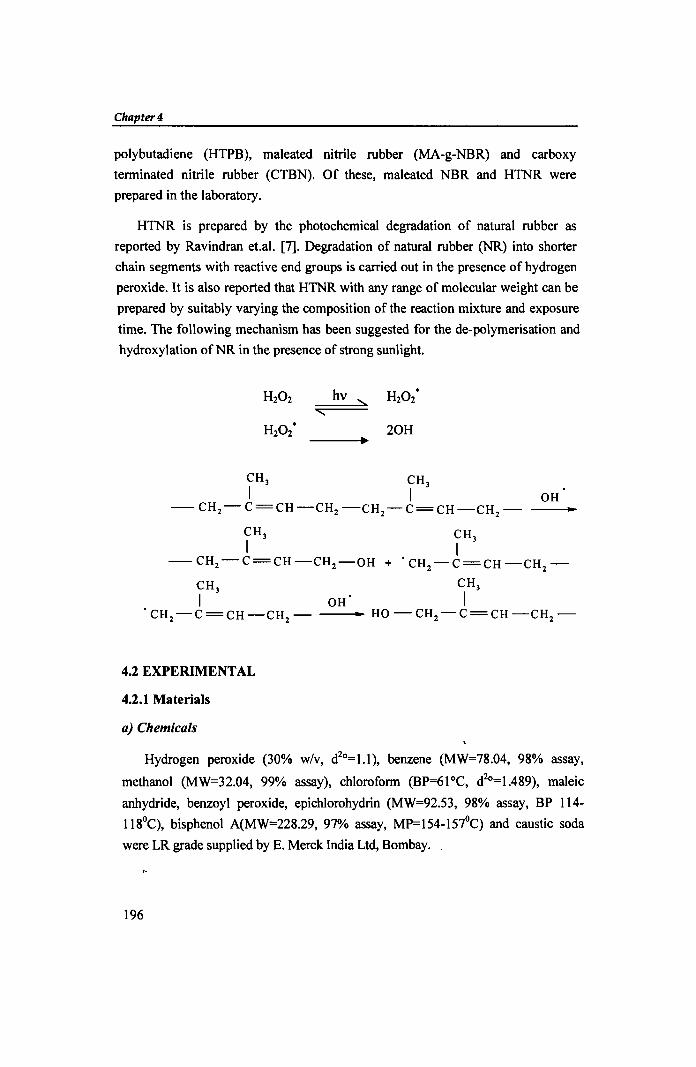
HTNR is prepared by the photochemical degradation of natural rubber as
reported by Ravindran et.a\. [7]. Degradation of natural rubber (NR) into shorter
chain segments with reactive end groups is carried out in the presence of hydrogen
peroxide. It is also reported that HTNR with any range of molecular weight can be
prepared by suitably varying the composition of the reaction mixture and exposure
time. The following mechanism has been suggested for the de-polymerisation and
hydroxylation of NR in the presence of strong sunlight.
20H
CH) CH)
I I OH -CH 2 -C=CH-CH 2 -CH 2 -C=CH-CH
2- ..
CH)
I -CH 2 -C=CH-CH 2 -OH +
CH) CH)
I OH I 'CH 2-C=CH-CH
2- --_ .. HO-CH2 -C=CH-CH 2 -
4.2 EXPERIMENTAL
4.2.1 Materials
a) Chemicals
Hydrogen peroxide (30% w/v, d2o=1.l), benzene (MW=78.04, 98% assay,
methanol (MW=32.04, 99% assay), chlorofonn (BP=61°C, d2°=1.489), maleic
anhydride, benzoyl peroxide, epichlorohydrin (MW=92.53, 98% assay, BP 114-
118°q, bisphenol A(MW=228.29, 97% assay, MP=154-1570q and caustic soda
were LR grade supplied by E. Merck India Ltd, Bombay.
196
Modification by elastomers
b) Elastomers
Aparene-N553 grade NBR was obtained from Apar Polymers Ltd., Gujarat,
India (Mooney viscosity, ML (1+4) at 100°C = 50, acrylonitrile content=33%]),
HTPB (Mn=2620) and CTBN (Mn =3500, ACN content=18%) were obtained from
Vikram Sarabhai Space Centre, Thiruvananthapuram, India.
The NBR cross-linking agent, PR 307 (X-Pro India Ltd., Melting range 75-850C,
Norton flow of 50-75 @1250C, 8-9% hexa content) was procured from MS.Grain
Rolls, Thrissur, Kerala., India.
Maleated elastomers were prepared by grafting elastomers with MA by the
following procedure. The elastomer was mixed with 2.5% MA and 0.25% benzoyl
peroxide in a Brabender torque rheometer at 100°C and 50 rpm speed for 10
minutes. The grafting reaction was confirmed by FTIR spectroscopy and titration
methods.
HTNR (Mn=3000 and hydroxyl value=36.35 mg of KOHlg) was prepared
from ISNR-5 grade natural rubber dissolved in toluene by photo-depolymerisation
in the presence of H20 2 [8]. Natural rubber was first masticated for 30 minutes. A 5
wt % solution of this NR in toluene was mixed with a 30 wt % H20 2 solution and
methanol in the volume ratio 20: 1:3 respectively. Irradiation using sunlight was
carried out in a closed glass vessel for 50 hrs with constant stirring. The
depolymerised and hydroxy terminated NR was recovered by precipitation with
methanol and purified by repeated precipitation. Molecular weight was determined
by end group analysis and the hydroxyl value was estimated by established
procedures.
4.2.2 Modification of epoxy resin by elastomersl functional elastomers
a) Unmodified solid elastomers
The blends were prepared by the following procedure. The elastomers were
initially masticated in a two-roll mill for about 7 minutes, at tight nip. The milled
sample was dissolved in methyl ethyl ketone (MEK) over a period of 24 hrs at a
concentration of 25 g/100 ml. The solution was further homogenised by gentle
agitation using a stirrer. Varying amounts of the elastomer solution were added to
the epoxy resin which was pre-heated to 70°C to reduce viscosity. The mixture was
stirred well with the hardener (and the rubber cross-linking agent in some
197
Chapter 4
fonnulations) to give a homogeneous liquid and poured into Teflon moulds. The
filled moulds were kept at room temperature in a vacuum oven. Evaporation of the
solvent and curing of the epoxy took place simultaneously in controlled vacuum for
48h. The blends were post-cured at 120°C for 4 h. The fonnulations containing
rubber cross-linking agent were heated at 140°C for 4h to cross-link the
acrylonitrile -butadiene rubber. The samples of both modified and unmodified
cured resin were subjected to all the tests outlined in Section 2.2.4( d).
b) MA- grafted elastomers
Both saturated and unsaturated elastomers were modified by the maleic
anhydride reaction by the following procedure. The e1astomer was mixed with 5%
MA and 0.5% benzoyl peroxide in a Brabender torque rheometer at 100DC and 50
rpm speed for 10 minutes. The amount of maleic anhydride reacted is detennined
by refluxing a solution of maleated NBR in xylene saturated with water for 1 hr
and then titrating with a solution of 0.05N ethanolic KOH using 1 % thymol blue
as an indicator [9].Varying amounts of MA modified elastomer solution in MEK
were blended with epoxy resin and cured by the procedure given in Section
4.2.2(a). The cured samples were tested.
4.2.3 Modification of epoxy resin by reactive liquid elastomers
a. Un-modified liquid elastomers: Varying amounts of the liquid e1astomer were
added to commercial epoxy resin and the mixtures were stirred with the hardener to
get a homogeneous solution. The mixtures were degassed in a vacuum oven before
pouring into the moulds. The samples were cured at room temperature for 24h and
post-cured at 120°C for 4h. The cured samples were subjected to the tests outlined
in Section 2.2.4( d). HTNR, HTPB and CTBN were the liquid elastomers employed
for modification.
b) Modified liquid elastomers:
i) Epoxidation: Hydroxy tenninated polybutadiene rubber (HTPB) was epoxidised
using epichlorohydrin in presence of alkali. 1 mole of epichlorohydrin was used for
65.5g of HTPB which corresponds to one equivalent of hydroxyl group. The
product was vacuum distilled to remove excess epichlorohydrin and then extracted
with benzene to remove NaCI. The epoxidised HTPB so fonned (designated as
ETPB) was dried in vacuum. The epoxide equivalent of ETPB was detennined by ,..
198
Modification by elastomers
the method cited in Section 2.2.4(b) and the presence of epoxide group was
confirmed by FTIR. Epoxy resin was blended with varying amounts of ETPB and
the hardener and cured by the same procedure given above.
ii) Carboxylation: HTPB was reacted with 10% maleic anhydride by refluxing over
a water bath for 5h. The amount of maleic anhydride reacted is determined by
refluxing the product with water for 1 hr and then titrating with a solution of
0.05N ethanolic KOH using 1 % thymol blue as an indicator. The product is
carboxyl terminated poly butadiene (CTPB) and this was confirmed by FTIR.
Epoxy resin was blended with varying amounts of CTPB and the hardener and
cured by the same procedure given above.
HTPB has been incorporated into DGEBA in the presence of a silane coupling
agent (SCA) also. Varying amounts of HTPB were added to commercial DGEBA
resin in presence of 1 % silane coupling agent (SI 69). The mixture was stirred well,
degassed and then cured using the procedure cited in Section 4.2.2(a).The
corresponding formulation was designated as HTPB-S.
4.2.4 Effect of bisphenol A on blends of epoxies and elastomers
Epoxy resin-elastomer systems show significant improvement in properties
when used along with bisphenol A (BPA) as chain extender [l 0, 11]. This technique
has been employed in preparing DGEBA-Iiquid elastomer blends. Elastomer
compositions which gave maximum improvement in properties (Section 4.2.3a)
were employed for this purpose. DGEBA resin was mixed with varying amounts
of bisphenol A (2.5-10%) and the mixtures were heated till the bisphenol particles
dissolved completely. The mixtures were cooled to room temperature and a fixed
amount of liquid elastomer and the epoxy hardener added to each formulation. The
resulting mixtures were stirred well and then degassed in vacuum for ten minutes.
Curing of the blends was done as described in Section 4.2.2a. The cured blends
were tested for mechanical and thermal properties. The liquid elastomers used were
10 wt % CTBN, 5 wt % HTPB and 5 wt % HTNR and the corresponding epoxy
blends were designated as CTBN-l, HTPB-l and HTNR-l respectively.
4.3 RESULTS AND DISCUSSION
Adequate interaction between the elastomer and matrix resin is necessary for
successfully modifying epoxies with elastomers. While liquid CTBN rubbers with
199
Chapter 4
low molecular weights and tenninal functionalities are the most frequently used
modifiers for epoxies, only limited attempts have been done to use solid
acrylonitrile butadiene rubber(NBR) with high molecular weight and no tenninal
functional groups to modify epoxies. This study highlights the modifying influence
of solid NBR (33% acrylonitrile content) and its modified versions such as MA-g
NBR and cross-linked NBR (NBR-C) on the toughness of epoxy resin. The
toughening effect of polyurethane rubber has also been investigated. The addition
of NBR to epoxy resin produced significant improvements in resin toughness. The
high volume fraction of epoxy resin (V p) in the modified resins noticed during
swelling studies indicates efficient cross-linking.
Liquid functional elastomers such as CTBN, HTPB and HTNR have also been
used for modification of epoxy resin. The epoxy-CTBN reaction is esterification of
the epoxy which takes place at higher temperature or in presence of a catalyst
(triphenylphosphine) at a lower temperature. The reaction between hydroxyl and
epoxy groups is very slow at ordinary conditions. To improve compatibility and to
felicitate interaction with epoxy resin HTPB has been modified by epoxidation
(ETPB) and esterification (CTPB). The ETPB resin prepared has been
characterised by detennining the epoxide equivalent and by FTIR spectroscopy.
The epoxide equivalent of ETPB was found to be 0.702 EqlKg corresponding to
wpe of 1424. The synthesised CTPB has been characterised by FTIR spectroscopy
and acid value. The acid value was found to be 39.72mg KOHlg. The effect of
addition of bisphenol A and silane coupling agents during the rubber modification
of epoxies has also been investigated.
Spectral data: The FTIR spectra of HTPB and ETPB are given in Fig.4.1.
200
; i;ani i I 1Nl II I I
i I
11 I
I
-
-
-
(b)
I I - - ---
Modification by elastomers
I ~ 11T III II 1\ .Iiln in I - - '"
Fig.4.l FTIR spectra of (a) HTPB and (b) ETPB
-
nu IIII
-
I 11
- ---,
u n I I I " 11 III I
- -Fig.4.1 FTIR spectrum of CTPB
The characteristic peaks of HTPB are; 3070cm-1 (C-H str. of CH2=CH2),
1640cm-I(C-C str. in -C=CH), 2917.6 cm-I(C-H str ofCH2), 3417.27cm-l( broad,
OH str) and 971.22 & 921.58cm-l( C=C bending). The epoxidised sample (Fig.4.1b
ETPB) shows typical absorptions at 911.77cm-1 and 1217.77cm-1 characteristic of
epoxide group. The FTIR spectrum of CTPB (Fig.4.2) shows the following
characteristic absorptions of ester at 1732.25 cm-I(C=O str.) and 1206.96 cm-I (C-O
str). The broad band around 3400cm-I(-OH str) which slopes into aliphatic C-H str.
band around 3073.76cm-1 is characteristic of the carboxyl group.
4.3.1 Modification by solid elastomerslfunctional elastomers
The solubility parameter of NBR (20.11-20.26 (MPa)ll2) is close to that of
epoxy resin (22.3(MPa)ll2) suggesting good compatibility with the resin. There is
also sufficient compatibility between PU rubber and epoxy resin.
201
Chapter 4
i. Tensile properties
Referring to Fig.4.3, tensile strength values obtained by adding NBR are higher
than that obtained by adding PU e1astomer. Tensile strength values reached a
maximum on adding progressively larger amounts of rubber, but addition of rubber
beyond this point resulted in a reduction of tensile strength. The improvement in
tensile strength, in comparison to that of the base resin at all levels of NBR
considered, is due to the high degree of compatibility and interaction ofNBR with
the epoxy matrix. More over, the high molecular weight of NBR imparts greater
entanglement and subsequently, tensile strength to the rubber. It can be expected
that interactions (like hydrogen bonds) between the nitrile group (-eN) in the
rubber and hydroxyl groups on the epoxy chain take place [12]. The fall in tensile
strength with increasing rubber content is more for PU rubber.
70
160
!. .c
~50 CD !; fII CD 'i 40 c
-+-NBR ___ MA.-g-NBR -+-NBR-C
{!. -o--PU
30 0 2 4 6 8 10
Rubber concentration % 12
Fig.4.3 Tensile strength of rubber modified resin versus rubber concentration.
27
25 l :lE 23 8 ~
~ 21 Cl! :::I '3 19 ~NBR 'a 0 __ MA.-g-t-2R
:lE 17 -+-t-2R-C
-4--PU
15 0 5 10 15
Rubber concentration %
>- Fig.4.4 Modulus of rubber modified resin versus rubber concentration.
202
Modification by elastomers
MA-g-NBR and cross-linked NBR were found to be superior to NBR in
improving tensile strength. Fig.4.4 shows the effect of e1astomers on tensile
modulus. For cross-linked NBR (NBR-C) and to some extent NBR, the modulus
increases slightly at a lower rubber loading and then decreases with incr~ase in
rubber concentration. But for other e1astomer samples, modulus decreases with
increase in rubber content. At higher rubber content, the rubber may be dissolved
to some extent in the epoxy resin and can impart a plasticizing effect. It has been
shown that higher acrylonitrile content enhances the compatibility between epoxy
and the rubber [13].
7r-------------------------------~
~6 ....: : 5 loo .a 1iI 4 c o i 3 Cl c o m 2
o
-o--NBR ___ MA-g-NBR -+-NBR-C -+-PU
2 4 6 8 10 12 Rubber concentration %
Fig.4.5 Elongation at break of rubber modified resin versus rubber concentration
The effect of e1astomer addition on the elongation at break is shown in Fig.4.5.
The addition of maleated NBR produced the greatest increase in elongation at
break, at 7.5% rubber concentration, indicating maximum compatibility. For PU
and the other NBR systems maximum elongation occurred at lower rubber
concentrations. Improvement in elongation may be the result of spatial molecular
rearrangements possible in the flexible matrix under stress and compatibility. The
elastomers presumably behave as inert fillers at higher concentrations.
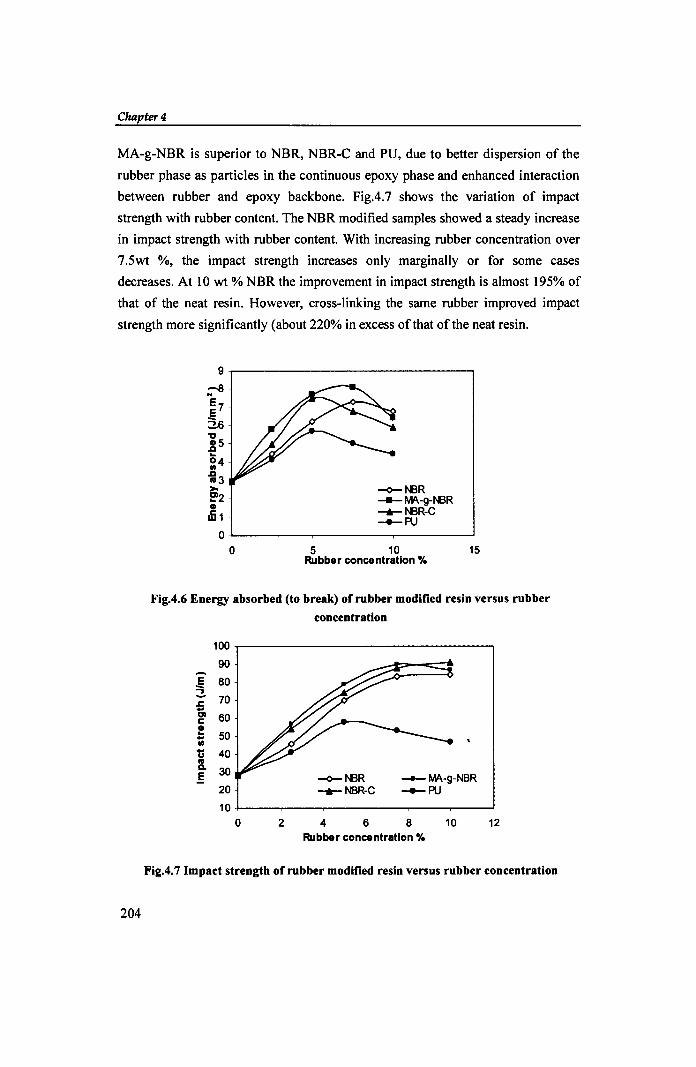
The variation in toughness of the cured resin with increase in rubber content
is shown in Fig. 4.6 as a function of energy absorbed to break. At 7.5% NBR
concentration, the energy absorption of the blend is at a maximum (about 174%
in excess of that of epoxy resin). This is due to higher compatibility between
epoxy and rubber resulting from high acrylonitrile content. The performance of
203
Chapter 4
MA-g-NBR is superior to NBR, NBR-C and PU, due to better dispersion of the
rubber phase as particles in the continuous epoxy phase and enhanced interaction
between rubber and epoxy backbone. FigA.7 shows the variation of impact
strength with rubber content. The NBR modified samples showed a steady increase
in impact strength with rubber content. With increasing rubber concentration over
7.5wt %, the impact strength increases only marginally or for some cases
decreases. At 10 wt % NBR the improvement in impact strength is almost 195% of
that of the neat resin. However, cross-linking the same rubber improved impact
strength more significantly (about 220% in excess of that of the neat resin.
204
9
:-8 E7 .e ::2.6
" .8 5 .. ~4 i3 >-~2 III
.n1 0
0
--o-I\BR ___ MA.-g-I\BR --'-I\BR-C -+-PIJ
5 10 15 Rubber concentration %
Fig.4.6 Energy absorbed (to break) of rubber modified resin versus rubber
concentration
100
90
~ 80
.c 70 .. Cl 60 c: III .. 50 .. III
t; 40 la Cl. 30 .5 --o-I\BR -MA.-g-NBR
20 --'-NBR-C -+- PIJ
10 0 2 4 6 8 10 12
Rubber concentration %
Fig.4.7 Impact strength of rubber modified resin versus rubber concentration
Modification by elastomers
Maleated NBR exhibited maximum impact strength at a lower (7.5%) rubber
concentration. The impact strength reaches a maximum at 5% and falls steeply at
higher levels of PU rubber. In this case also the blend of MA-g- NBR is superior to ...
other samples. The increase in impact strength results from improved compatibility
and better dispersion of the rubber phase in the epoxy phase. The rubber particles
absorb the energy of impact and crack propagation is prevented. The results for
NBR modified epoxies are comparable with those for the CTBN toughened
epoxies as reported in the literature [14].
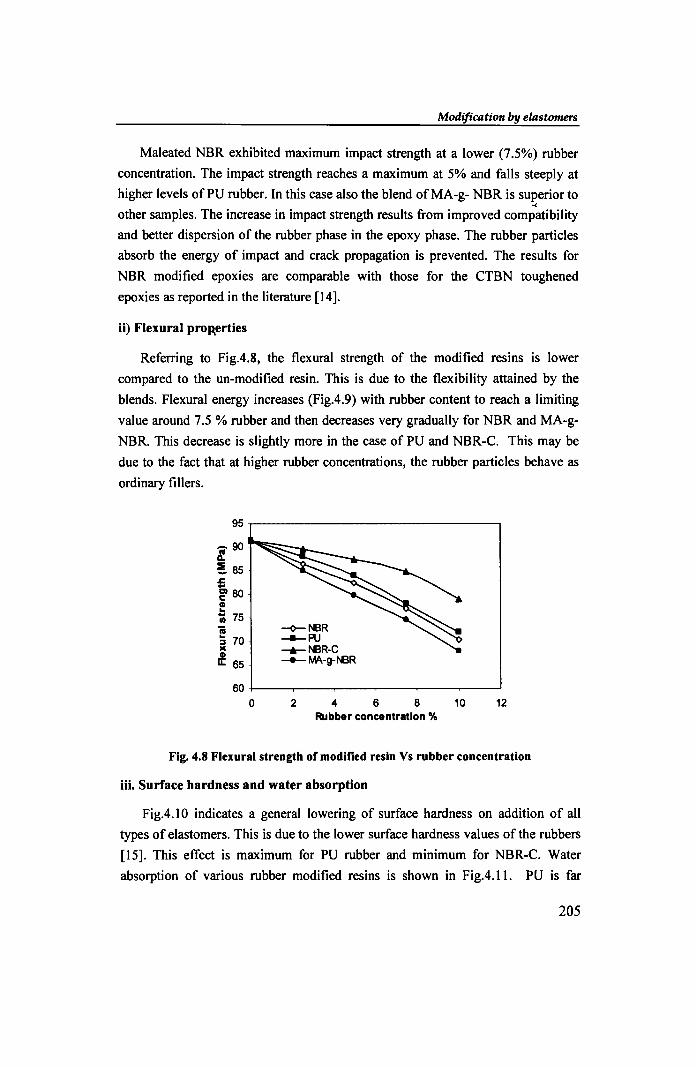
ii) Flexural prol).erties
Referring to Fig.4.8, the flexural strength of the modified resins is lower
compared to the un-modified resin. This is due to the flexibility attained by the
blends. Flexural energy increases (Fig.4.9) with rubber content to reach a limiting
value around 7.5 % rubber and then decreases very gradually for NBR and MA-g
NBR. This decrease is slightly more in the case of PU and NBR-C. This may be
due to the fact that at higher rubber concentrations, the rubber particles behave as
ordinary fillers.
95
- 90 l. !. 85 s:. .. g' 80 GI .. ';i 75 ii ~ 70 le GI Ii: 65
60 0
~NBR ----PU -+-NBR-C -+- MA-g-NBR
2 4 6 8 Rubber concentration %
10 12
Fig. 4.8 Flexural strength of modified resin Vs rubber concentration
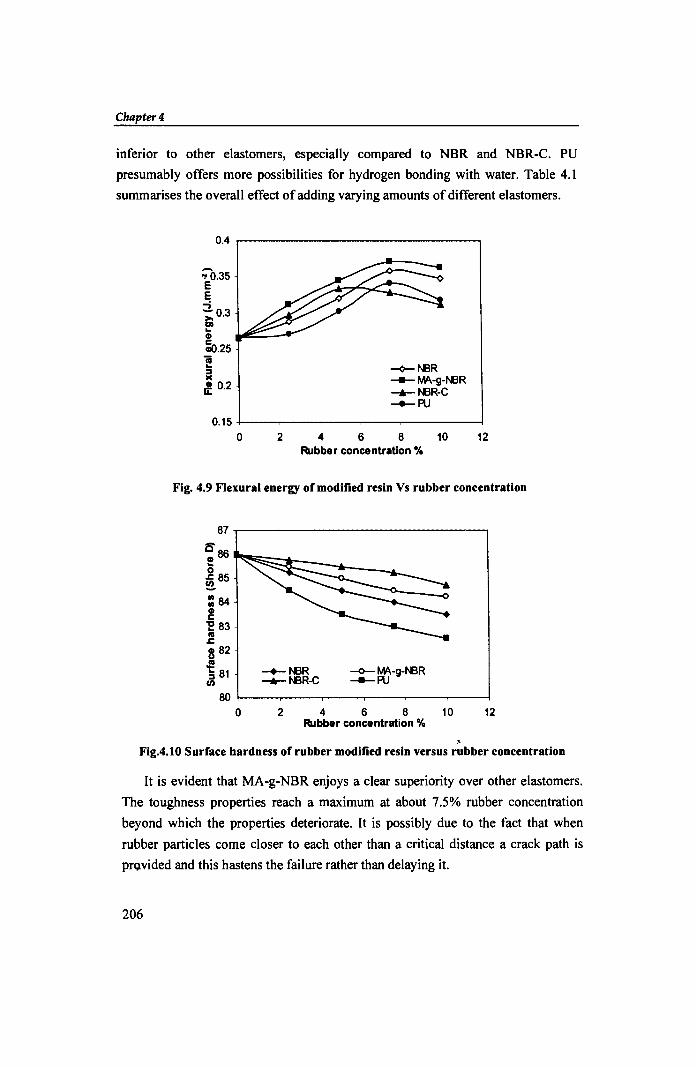
iii. Surface hardness and water absorption
Fig.4.10 indicates a general lowering of surface hardness on addition of all
types of elastomers. This is due to the lower surface hardness values of the rubbers
[15]. This effect is maximum for PU rubber and minimum for NBR-C. Water
absorption of various rubber modified resins is shown in Fig.4.II. PU is far
205
Chapter 4
inferior to other elastomers, especially compared to NBR and NBR-C. PU
presumably offers more possibilities for hydrogen bonding with water. Table 4.1
summarises the overall effect of adding varying amounts of different elastomers.
0.4..------------------,
;'0.35 E E -; ;: 0.3 01 .. ID
io.25 ii .. :::s »C J! 0.2
~N3R -e- MA.-g-N3R --.-N3R-C --*-RJ
0.15 +----.----.---..-----.,...---r--~
o 2 4 6 8 10 12 Rubber concentration %
Fig. 4.9 Flexural energy of modified resin Vs rubber concentration
87r----------------~
-+-N3R --.-N3R-C
-0- MA.-g-N3R -e-RJ
80+---r--~--~--~--_r_-~
o 2 4 6 8 10 12 Rubber concentration %
, Fig.4.10 Surface hardness of rubber modified resin versus rubber concentration
It is evident that MA-g-NBR enjoys a clear superiority over other elastomers.
The toughness properties reach a maximum at about 7.5% rubber concentration
beyond which the properties deteriorate. It is possibly due to the fact that when
rubber particles come closer to each other than a critical distance a crack path is
pro.vided and this hastens the failure rather than delaying it.
206
Modification by elastomers
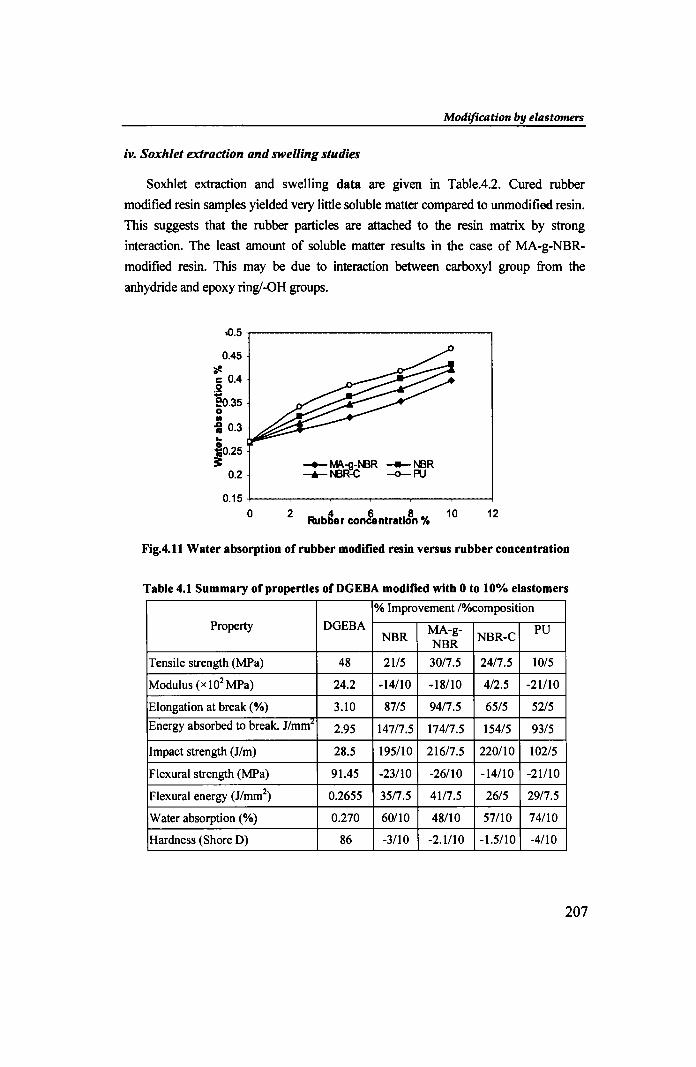
iv. Soxhlet extraction and swelling studies
Soxhlet extraction and swelling data are given in Table.4.2. Cured rubber
modified resin samples yielded very little soluble matter compared to unmodified resin.
This suggests that the rubber particles are attached to the resin matrix by strong
interaction. The least amount of soluble matter results in the case of MA-g-NBR
modified resin. This may be due to interaction between carboxyl group from the
anhydride and epoxy ring/-OH groups.
,0.5
0.45 if. c 0.4 0 ~ eo.35 0
" i 0.3 ... :50.25 ~
0.2
0.15 0 2 Rub~.r con&ntrat,J'n % 10 12
Fig.4.11 Water absorption of rubber modified resin versus rubber concentration
Table 4.1 Summary of properties ofDGEBA modified with 0 to 10% elastomers
% Improvement /%composition
Property DGEBA MA-g- PU NBR
NBR NBR-C
Tensile strength (MPa) 48 2115 3017.5 2417.5 10/5
Modulus (x 102 MPa) 24.2 -14/10 -18/10 4/2.5 -21110
Elongation at break (%) 3.10 87/5 9417.5 65/5 52/5
Energy absorbed to break. J/mm 2.95 14717.5 17417.5 154/5 93/5
Impact strength (J/m) 28.5 195/10 21617.5 220/10 102/5
Flexural strength (MPa) 91.45 -23/10 -26/10 -14/10 -21110
Flexural energy (J/mm2) 0.2655 35/7.5 4117.5 26/5 2917.5
Water absorption (%) 0.270 60/10 48/10 57/10 74/10
Hardness (Shore D) 86 -3/10 -2.1110 -1.5/10 -4/10
207
Chilptw 4
Table.4.1 SOIhld ednctiOD aDd swelliDC data ~Iastomer (5%) I DGEBA
Samples DGEBA NBR MA-g-NBR NBR-C PU
Soluble matter % 5.34 3.704 3.47 3.508 4.15
V, 0.904 0.931 0.963 0.957 0.922
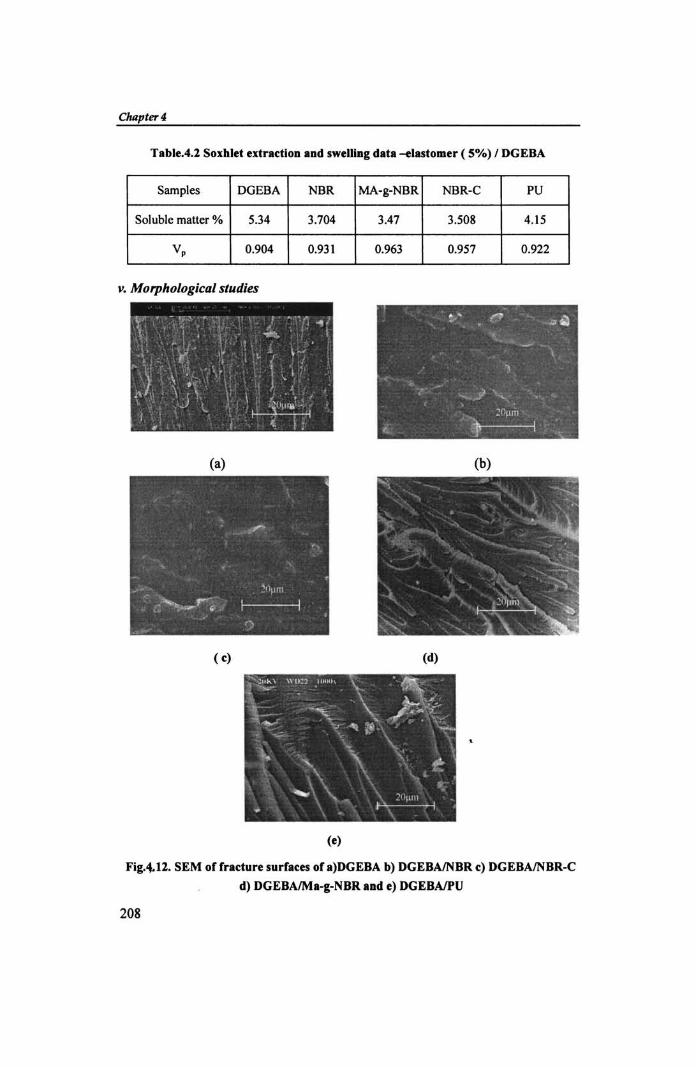
v. Morphological studies
(a) (b)
( ,) (d)
..... 'H*,' " ,,:1 ".", \ .~ -, .;c .. _
\ ~\',"-~ '. "- /~ .... )~-'~ ~,. .. . ~ ...
, '. " \ f' \ - , , > .. ,,'
f-'----l
(.)
Fig,4.l1. SEM of fradure surfaces of.)DGEBA b) DGEBAINBR c) DGEBAlNBR-C
d) DGEBAlMa-&-NBR and e) DGEBAlPU
208
Modification by elastomers
Scanning electron micrographs of unmodified and modified epoxy resin
fractured at low deformation rate are shown in Fig. 4.12. The micrograph (a) for
the fracture path for unmodified DGEBA resin indicates typical brittle fracture .. with failure bands and pulled out splinters. NBR modified resin fracture pattern is
shown in micrograph (b). Unlike in CTBN toughened epoxy resin (See Fig.4.25e)
the micrograph does not indicate any cavitation of rubber particles. The absence of
cavitation might be the result of the high molecular weight of solid NBR which
imparts greater tensile strength to the rubber. This high tensile strength not only
eliminates premature cavitation but gives higher tear energy. Consequently rubber
tearing should be a 'significant contributor to the failure energy of NBR modified
epoxy resins. Micrographs (c) and (d) corresponding to respectively cross-linked
NBR and MA-g-NBR modified epoxy resins also do not show any signs of
cavitaion of rubber. In (d) the fracture paths have a feathery texture with large
breadth. A peak like fibril pattern is formed along the rims of the grooves
characteristic of ductile fracture. However, PU modified epoxy resin (e) shows
long grooves which look like extended cavitation bands. A correlation between
toughness and plastic deformation on fracture surfaces suggests a mechanism based
on yielding and plastic shear flow of the matrix for rubber modified epoxies [16].
Thus, while multilevel fracture paths and rubber particle deformation (rubber tear)
contribute to the toughening mechanism in NBR modified epoxies, cavitation
followed by shear yielding explains the toughness of PU modified epoxies.
120
100
80 ~ ~
"§, 60
i 40
20
0 35 135 235 335 435
Temperature (D C)
.....--DGEBA _ MA.-g-I\IlR ~I\IlR-C
535 635
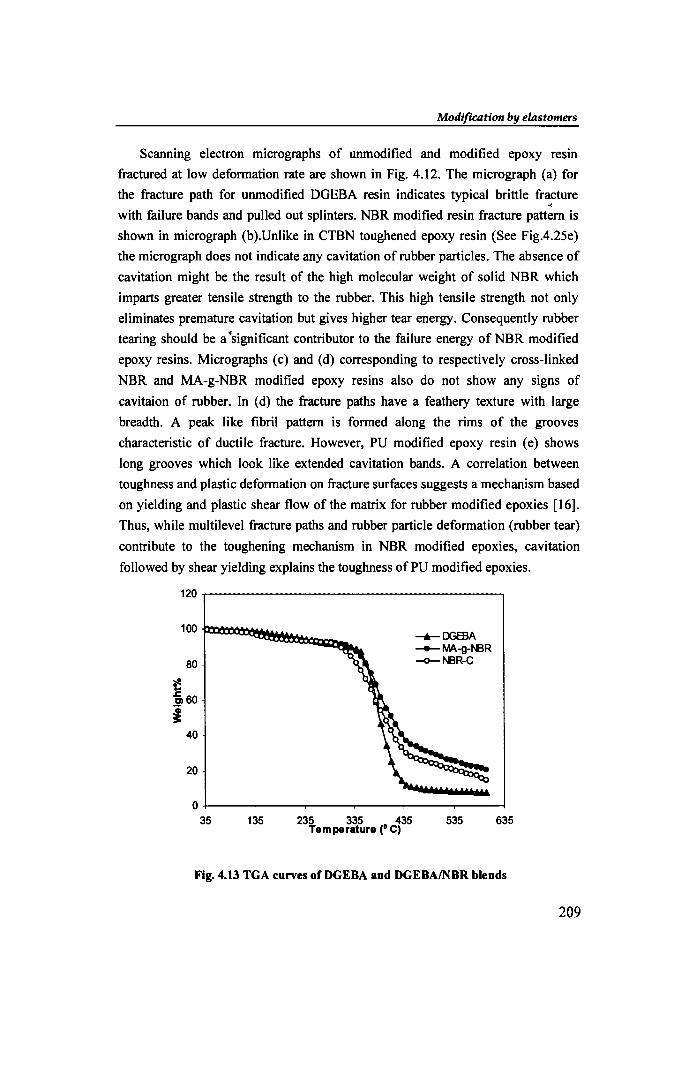
Fig. 4.13 TGA curves of DGEBA and DGEBAINBR blends
209
Chapter 4
vi) Thermal studies
i. TGA: The TGA curves for the unmodified and NBR modified epoxy resins are
shown in Fig, 4.13. MA-g-NBR and NBR-C modified resins yielded 20.36% and
14.64 % residue at 600°C respectively. This reflects their better thermal resistance.
Table 4.3 shows relatively better thermal stability for the blends, especially that of
MA-g-NBR. This can be due to an increased level of cross-linking / grafting.
Table 4.3 Thermal properties
Onset Temperature of Temperature
Residue % Resin of
temperature eC) maximum rate eC) half loss (OC)
(600°C)
DGEBA 310.56 386.12 387.24 7.664
DGEBAI MA-g-NBR 308.43 380.87 398.57 20.36
DGEBAINBR-C 300.87 376.94 391.22 14.64
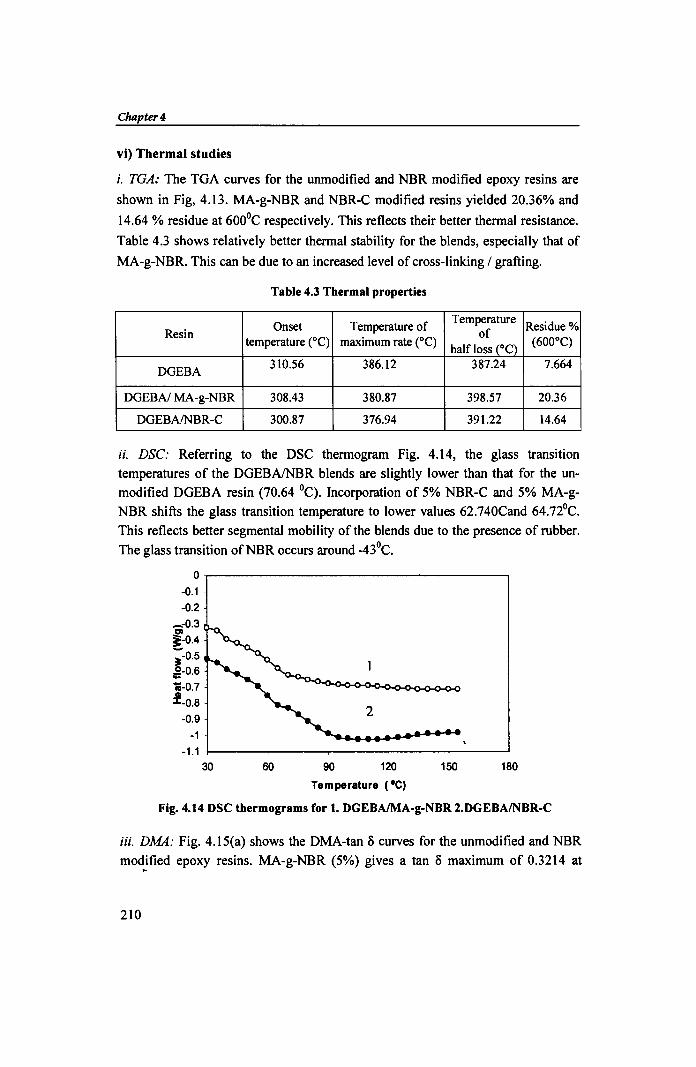
ii. DSC: Referring to the DSC thermogram Fig. 4.14, the glass transition
temperatures of the DGEBAlNBR blends are slightly lower than that for the unmodified DGEBA resin (70.64 0C). Incorporation of 5% NBR-C and 5% MA-g
NBR shifts the glass transition temperature to lower values 62.740Cand 64.72°C.
This reflects better segmental mobility of the blends due to the presence of rubber.
The glass transition ofNBR occurs around _43°C.
0
-0.1
-0.2
-.-0.3 Cl i-O.4
;-0.5 .2-0.6 .... '1ii-0.7 :!-0.8
-0.9 2
-1
-1.1 30 60 90 120 150 180
Temperature ('C)
Fig. 4.14 DSC thermograms for 1. DGEBAlMA-g-NBR 2.DGEBAINBR-C
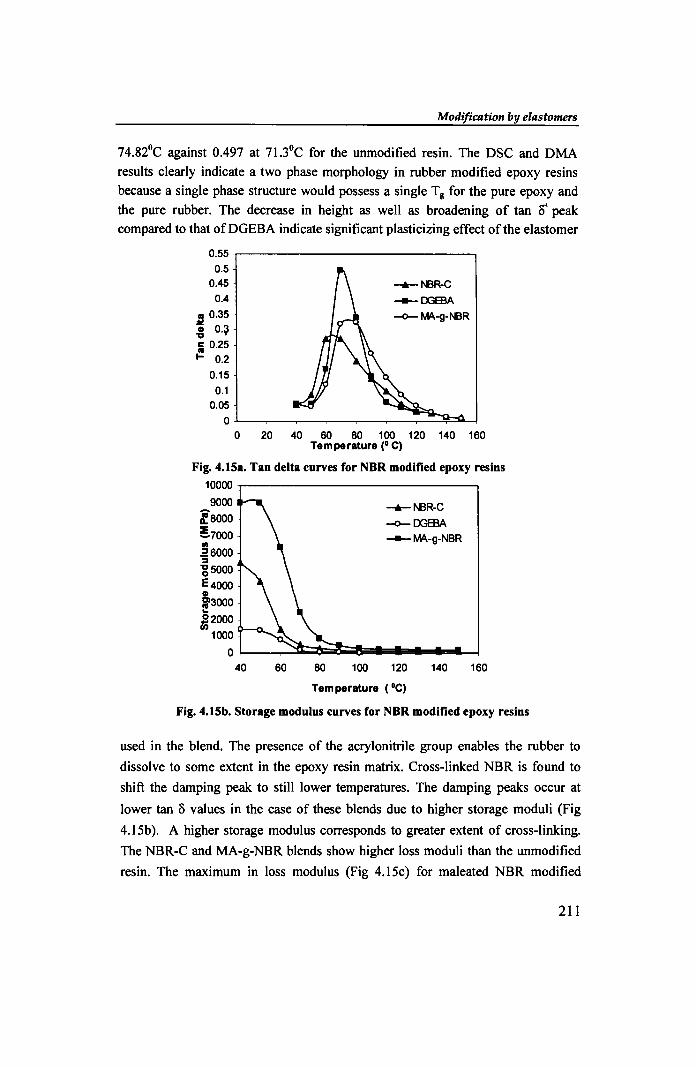
W. DMA: Fig. 4.15(a) shows the DMA-tan 0 curves for the unmodified and NBR
modified epoxy resins. MA-g-NBR (5%) gives a tan 0 maximum of 0.3214 at ,..
210
Modification by elastomers
74.82°C against 0.497 at 71.3°C for the unmodified resin. The DSC and DMA
results clearly indicate a two phase morphology in rubber modified epoxy resins
because a single phase structure would possess a single T g for the pure epoxy and
the pure rubber. The decrease in height as well as broadening of tan 0' peak compared to that ofDGEBA indicate significant plasticizing effect of the elastomer
0.55 0.5
0.45 0.4
~ 0.35 .g O.~
Ii 0.25 I- 0.2
0.15 0.1
0.05 0
0
--'-I\BR-C _DGEBA
~ MA.-g-I\BR
20 40 60 80 100 120 140 160 Temperature (0 C)
Fig. 4.15a. Tan delta curves for NBR modified epoxy resins 10000 .,..-----------------,
9000
:8000
!.7oo0 III .26000 :::I 'g5000 E4000 GI ji'3000
~2oo0 1000
--.-I\BR-C
~DGEBA
-MA.-g-NBR
O~--~~~~~ .. ~~~~ 40 60 80 100 120 140 160
Temperature (DC)
Fig. 4.15b. Storage modulus curves for NBR modified epoxy resins
used in the blend. The presence of the acrylonitrile group enables the rubber to
dissolve to some extent in the epoxy resin matrix. Cross-linked NBR is found to
shift the damping peak to still lower temperatures. The damping peaks occur at
lower tan 0 values in the case of these blends due to higher storage moduli (Fig
4.1Sb). A higher storage modulus corresponds to greater extent of cross-linking.
The NBR-C and MA-g-NBR blends show higher loss moduli than the unmodified
resin. The maximum in loss modulus (Fig 4.1Sc) for maleated NBR modified
211
Chapter 4
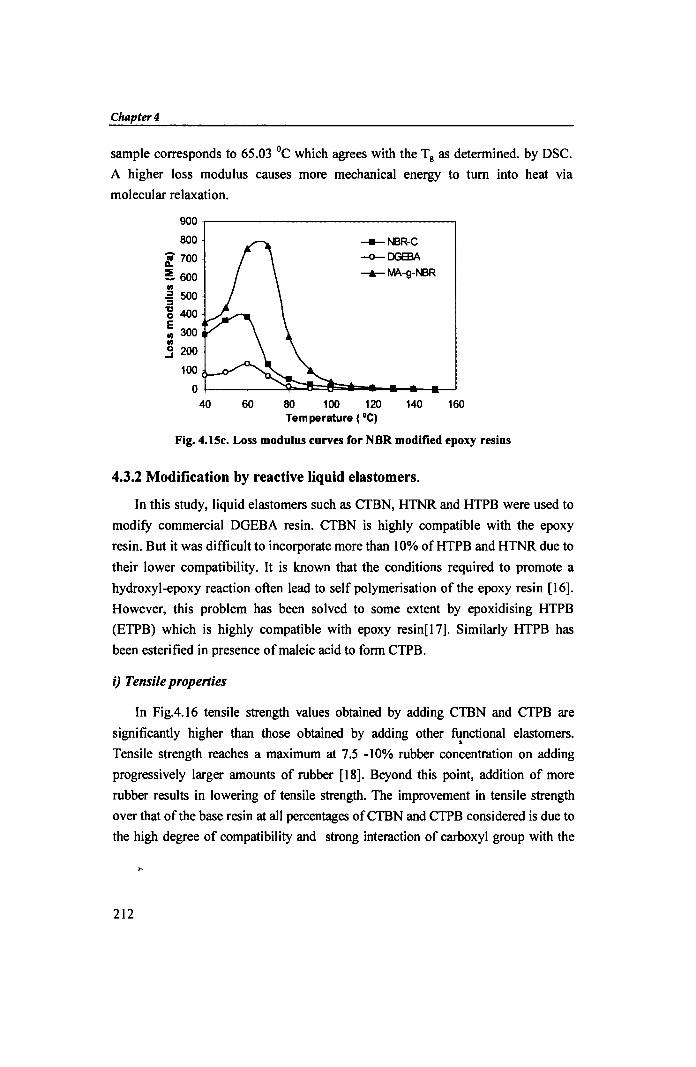
sample corresponds to 65.03 °c which agrees with the Tg as determined. by DSC.
A higher loss modulus causes more mechanical energy to turn into heat via
molecular relaxation.
900
800
:: 700
!. 600 III .= 500 :::J
-g 400
~ 300 III
.3 200
100
0 40 60 80 100
___ f'.BR-C
-o-DGEBA
-+- MA.-g-N:lR
120 140 Temperature (GC)
160
Fig. 4.1Sc. Loss modulus curves for NBR modified epoxy resins
4.3.2 Modification by reactive liquid elastomers.
In this study, liquid elastomers such as CTBN, HTNR and HTPB were used to
modify commercial DGEBA resin. CTBN is highly compatible with the epoxy
resin. But it was difficult to incorporate more than 10% ofHTPB and HTNR due to
their lower compatibility. It is known that the conditions required to promote a
hydroxyl-epoxy reaction often lead to self polymerisation of the epoxy resin [I6].
However, this problem has been solved to some extent by epoxidising HTPB
(ETPB) which is highly compatible with epoxy resin[17]. Similarly HTPB has
been esterified in presence of maleic acid to form CTPB.
i) Tensile properties
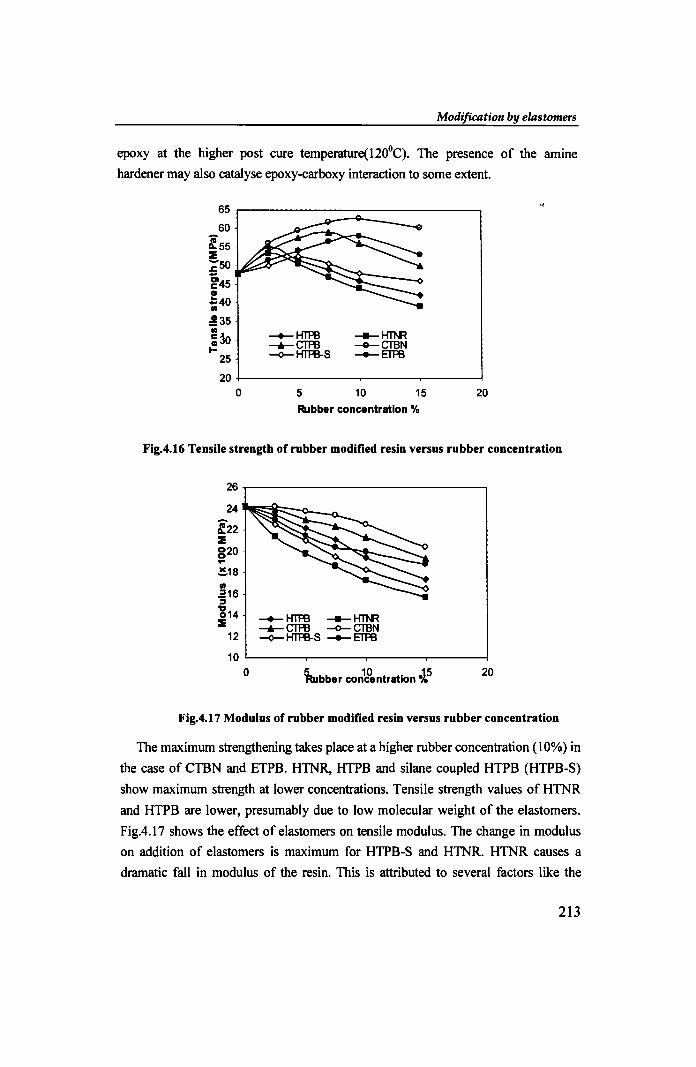
In FigA.16 tensile strength values obtained by adding CTBN and CTPB are
significantly higher than those obtained by adding other functional elastomers . •
Tensile strength reaches a maximum at 7.5 -10% rubber concentration on adding
progressively larger amounts of rubber [18]. Beyond this point, addition of more
rubber results in lowering of tensile strength. The improvement in tensile strength
over that of the base resin at all percentages of CTBN and CTPB considered is due to
the high degree of compatibility and strong interaction of carboxyl group with the
212
Modification byelastomers
epoxy at the higher post cure temperature(120°C). The presence of the amine
hardener may also catalyse epoxy-carboxy interaction to some extent.
65
60
l55 ~ ~50 .. ~45 CD
;40
:!35
" ~~O I-
25
20 0
--+-HTPB --.-CTFS ~HTPB-S
5
___ 1fI'II.R
-4-CTBN _ETPB
10 15 Rubber concentration %
20
Fig.4.16 Tensile strength of rubber modified resin versus rubber concentration
26,------------------------------,
24 1P\II6~F:::::_o._~
l22 ~ g20 ... ~18
" ':16 :::I
'814 ~
12
--+- HTPB ___ 1fI'II.R --.- CTFS -<>- CTBN ~ HTPB-S _ ETPB
10~------~------~----~~----~
o 5.- 10 .15 Rubber concentration·t.
20
Fig.4.17 Modulus of rubber modified resin versus rubber concentration
The maximum strengthening takes place at a higher rubber concentration (10%) in
the case of CTBN and ETPB. HTNR, HTPB and silane coupled HTPB (HTPB-S)
show maximum strength at lower concentrations. Tensile strength values of HTNR
and HTPB are lower, presumably due to low molecular weight of the elastomers.
FigA.17 shows the effect of elastomers on tensile modulus. The change in modulus
on addition of elastomers is maximum for HTPB-S and HTNR. HTNR causes a
dramatic fall in modulus of the resin. This is attributed to several factors like the
213
Chapter 4
presence of pendent methyl groups, comparatively lower molecular weight and a
lower extent of interaction with the matrix.
7
6 Cl': ~ 5 III CD .. .0 4 1iI c
3 .5! 1iI ~ 2 0 m
-+- HTPB ___ Iil1'.R -+- CTPB _ CTBN -Ir- HTPB-S _ ET'FB
0 0 5 10 15 20
Rubber concentration. %
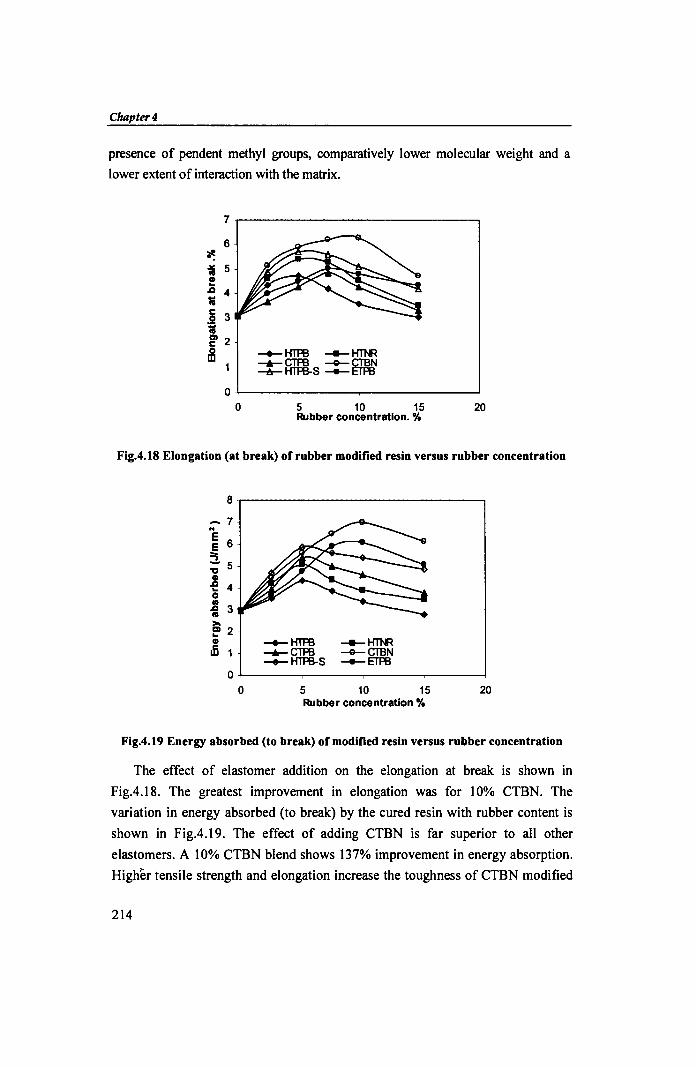
Fig.4.18 Elongation (at break) of rubber modified resin versus rubber concentration
8
-7 .. ~ 6 ::; :;- 5
~ 4 0
~ 3 III >-~ 2 CD
ID
0 0
-+-HTPB -+-CTPB ~HTPB-S
5
___ 1il1'.R
-CTBN _ET'FB
10 15 Rubber concentration %
20
Fig.4.19 Energy absorbed (to break) of modified resin versus rubber concentration
The effect of elastomer addition on the elongation at break is shown in
Fig.4.l8. The greatest improvement in elongation was for 10% CTBN. The
variation in energy absorbed (to break) by the cured resin with rubber content is
shown in Fig.4.19. The effect of adding CTBN is far superior to all other
elastomers. A 10% CTBN blend shows 137% improvement in energy absorption.
Higher tensile strength and elongation increase the toughness of CTBN modified
214
Modification by elastomers
resin. This can be attributed to better dispersion of the rubber phase as particles
in the continuous epoxy phase and to possible chemical interaction [19].
80
70
160 !. =50 Cl
~40 ... .. ~~O " .§20 -+- KTPB - Hll\R
10 -+- CTPB - CTBN -+- HTPB-S -+- Elm
0 0 ~bber co~&ntration';'5 20
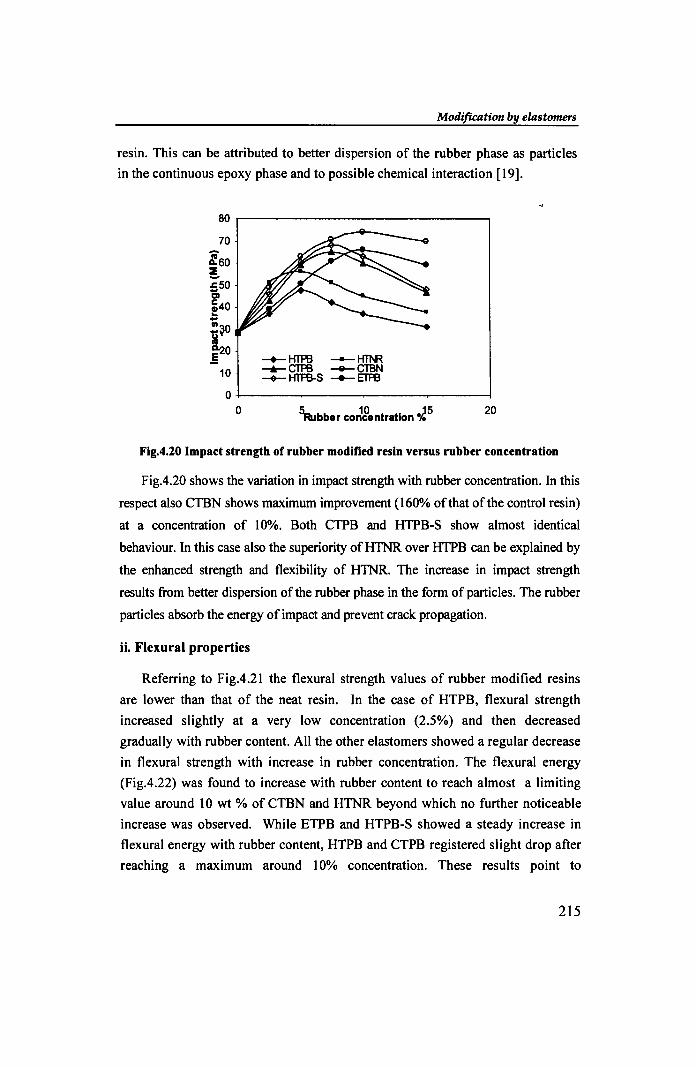
Fig.4.20 Impact strength of rubber modified resin versus rubber concentration
Fig.4.20 shows the variation in impact strength with rubber concentration. In this
respect also CTBN shows maximum improvement (160% of that of the control resin)
at a concentration of 10%. Both CTPB and HTPB-S show almost identical
behaviour. In this case also the superiority of HTNR over HTPB can be explained by
the enhanced strength and flexibility of HTNR. The increase in impact strength
results from better dispersion of the rubber phase in the form of particles. The rubber
particles absorb the energy of impact and prevent crack propagation.
H. Flexural properties
Referring to Fig.4.21 the flexural strength values of rubber modified resins
are lower than that of the neat resin. In the case of HTPB, flexural strength
increased slightly at a very low concentration (2.5%) and then decreased
gradually with rubber content. All the other elastomers showed a regular decrease
in flexural strength with increase in rubber concentration. The flexural energy
(Fig.4.22) was found to increase with rubber content to reach almost a limiting
value around 10 wt % of CTBN and HTNR beyond which no further noticeable
increase was observed. While ETPB and HTPB-S showed a steady increase in
flexural energy with rubber content, HTPB and CTPB registered slight drop after
reaching a maximum around 10% concentration. These results point to
215
Chapter 4
significant reduction in the stiffness of the blends which results from the
introduction of softer segments in the cured resin matrix
100
_90 :. !. 80 .s: .. g' 70
" .. Ui 60 ii .. ~ 50
" -+- H1'PB ___ HTNR
Ii: 40 -+- CTPB -e- CTBN -+- HTPB-S -+- ETPB
30 0
Rubber conce~~ration % 15 20
Fig.4.21 Flexural strength of rubber modified resin versus rubber concentration
0.5,-------------------,
:-0.45 E .e ::! 0.4 >-~035 ". c
" ii 0.3 .. ~ >C
i!0.25
-+- H1'PB ___ HTNR -+- CTPB -e- CTBN -+- HTPB-S -+- ETPB
0.2 +-----r-----r-----r------1 o 5 10 15 20
Rubber concentration (%)
Fig.4.22 Flexural energy of rubber modified resin versus rubber concentration .. iii. Surface hardness and water absorption
Fig.4.23 indicates a general lowering of surface hardness on addition of all types
of elastomers. This could be due to the lower surface hardness values of the
elastomers. This effect is maximum for HTPB and minimum for CTBN and
ETPB.
216
Modification by elastomers
88,---------------------------------,
IS' 87 GI
~ 86 ~~:!-. ... .c en -85 1/1 1/1
!84 'C
la 83 .c
882 J! ~ 81 en
-+-HTPB -H'l"fIR -.-CTPB -e-CTBN -+-HTPB-S --+-ETPB
80~------~--------~------_r------~
o 5 10 15 Rubber concentration %
20
Fig.4.23 Surface hardness of rubber modified resin versus rubber concentration
0.6
~0.5 c 0 iO.4 ... 0 1/1
iO.3 ... GI .. "' ~0.2 -+- HTPB - HTNR
-.-CTR3 -e-CTBN -+- HTPB-S --+- ETPB
0.1 0 5 10 15 20
Rubber concentration %
Fig.4.24 Water absorption of rubber modified resin versus rubber concentration
Water absorption of various modified resins is shown in Fig.4.24. HTNR
showed maximum water absorption. The non-rubber constituents of natural rubber
can be responsible for this. CTPB and EPPB also show substantial water
absorption possibly due to the presence of polar groups. Table 4.4 summarises the
properties of epoxy/liquid functional elastomer systems. The improvement in each
property and the corresponding composition are also tabulated.
iv. Soxhlet extraction and swelling studies
Soxhlet extraction studies show that very little soluble matter could be
extracted from functional rubber-modified DGEBA compared to unmodified
217
CIulpter4
DGEBA. This suggests that functional elastomers are tightly held to the epoxy
matrix by grafting and cross-linking between elastomer chains and epoxy chains.
Functional elastomers can also influence properties of epoxy resin either by
causing chain extension or by increasing inter-chain attraction by dipole-dipole
interactions. The grafting is indicated by higher values of V p during swelling
studies.
Table 4.4 Summary of properties of DGEBAlliquid functional elastomer blends
Property DGEBA % improvement / elastomer concentration (wt %)
HTPB H1NR CTPB CTBN HTPB-S ETPB
Tensile strength (MPa) 48 15/2.5 1112.5 23/7.5 31110 10/5 21110
Modulus (x 102 MPa) 24.2 -24115 -35/15 -21115 -16115 -30115 -22/15
Elongation at break. % 3.1 52/5 75/5 56/7.5 102110 84/5 63/7.5
Energy absorbed to 2.95 48/5 73/5 84/5 137/10 99/5 109110
break .(J/mm2)
Impact strength.( J/m) 28.5 67/5 98/5 128/7.5 161110 139/7.5 132/10
Flexural strength. MPa 91.45 3/2.5 -33/15 -23115 -38115 -30/15 -44115
Flexural energy. J/mm2 0.2655 53/5 72115 62/10 67115 54/15 70115
Water absorption (%) 0.270 51115 103115 81115 74115 65115 89115
Hardness (Shore D) 88 -5115 -3.5115 -3/15 -1.5/15 -4/15 -2.5/15
Table.4.5 Soxhlet extraction & swelling data- DGEBA /elastomer (5%)
Samples DGEBA HTPB H1NR CTPB CTBN HTPB-S ETPB
Soluble matter % 5.34 3.62 3.04 4.32 4.05 3.43 3.86
Vp 0.904 0.915 0.958 0.95 0.941 0.97 0.93
c) Morphological studies
Scanning electron micrographs of different elastomer modified epoxy resins
fractured at low deformation rate are shown in Fig.4.25. All the fracture surfaces
of the blends are characterised by a morphology in which tht~ rubber is segregated
into spherical shaped domains dispersed in the epoxy matrix. A bimodal
distribution of particle size and massive stress whitening are seen in most cases.
Unlike in NBR modified samples, these blends show extensive cavitations
associated with stress whitening. Micrograph (b) representing epoxylETPB blend
is characterised by shallow cavities as well as non-uniform ridges. The holes in the
stress-whitened regions presumably result from dilation and rupture of elastomer
218
ModifiClltion by ~Jastrmrers
particles [20]. Most of the large holes however contain round inclusions which are
hard. The initiation and growth of voids in the rubbery particles give rise to stress
whitening often observed before crack tip and on the fractured surface. Referring to "
CTBN modified resin (e), the fracture surface shows furrows and cavitation. The
circular depressions represent the sites of rubber domains. Excessive stress
whitening is also observed. The fracture surface ofCTPB modified resin (d) shows
(a) (b)
(e) (I)
Fig.4.15 Sunning ~1t(lroD mltrogr.pbs o( (r.tture SUrf.tH 0(.) DGEBAmTPB b)
DGEBAIETPB t)DGEBAlHTNR d)DGEBA/CTPB e) DGEBAlCTBN nd f} DGEBA
219
Chapter 4
broader and less continuous fracture paths. Compared to the fracture surface of the
neat resin (I), the elastomer blends show distinct signs of energy absorption by cavitation, stress whitening and broadening of fracture paths.
vi. Thermal properties
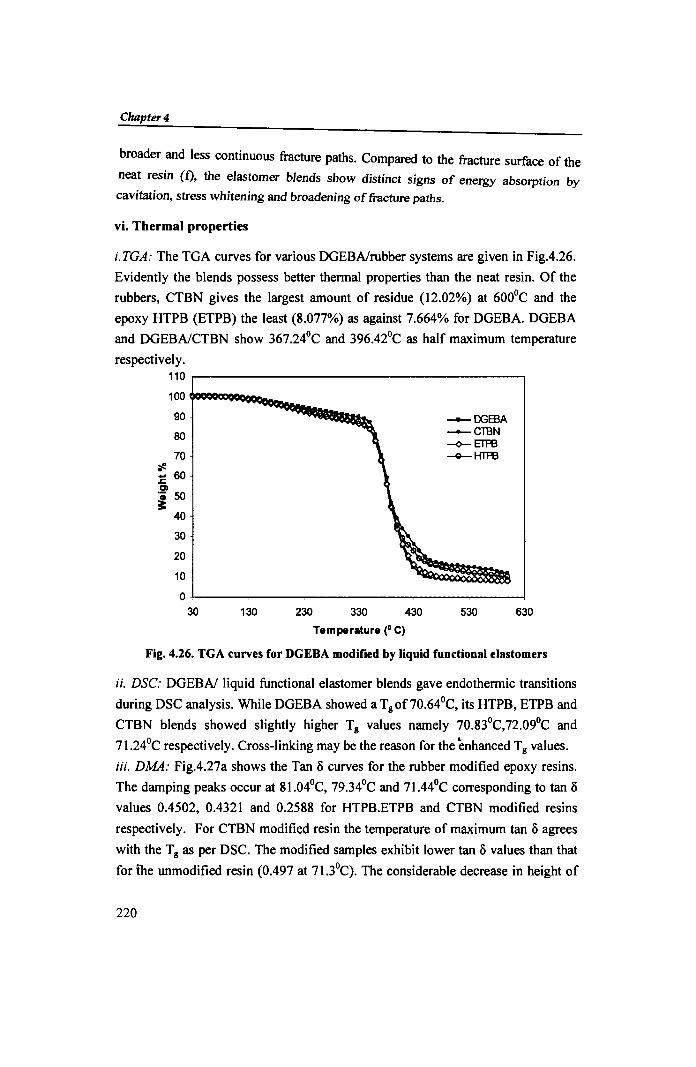
i. TGA: The TGA curves for various DGEBAlrubber systems are given in Fig.4.26.
Evidently the blends possess better thermal properties than the neat resin. Of the
rubbers, CTBN gives the largest amount of residue (12.02%) at 600°C and the
epoxy HTPB (ETPB) the least (8.077%) as against 7.664% for DGEBA. DGEBA
and DGEBAlCTBN show 367.24°C and 396.42°C as half maximum temperature
respectively. 110
100
90 -DGEBA
80 --CTBN -<>-ETPB
70 -4-HTPB ~ .
60 .. ..c:: Cl
i 50
40
30
20
10
0 30 130 230 330 430 530 630
Temperature (0 C)
Fig. 4.26. TGA curves for DGEBA modified by liquid functional elastomers
ii. DSC: DGEBAlliquid functional elastomer blends gave endothermic transitions
during DSC analysis. While DGEBA showed a Tgof70.64oC, its HTPB, ETPB and
CTBN blends showed slightly higher Tg values namely 70.830C,72.090C and
71.24°C respectively. Cross-linking may be the reason for the enhanced T g values.
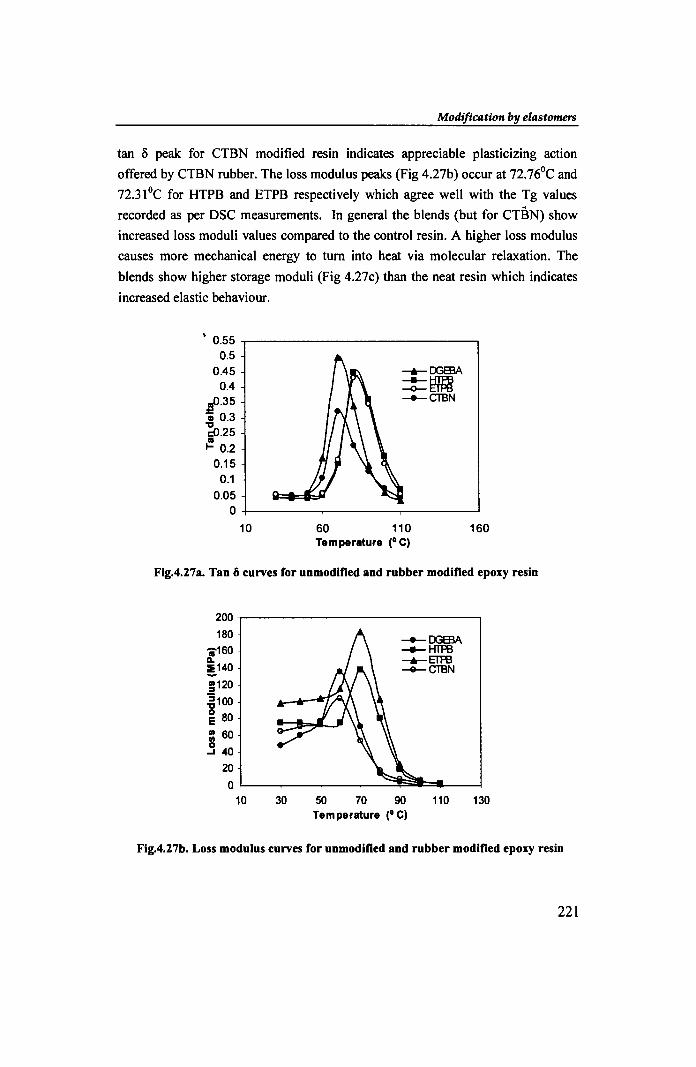
iii. DMA: Fig.4.27a shows the Tan ~ curves for the rubber modified epoxy resins.
The damping peaks occur at 81.04oC, 79.34°C and 71.44oC corresponding to tan ~
values 0.4502, 0.4321 and 0.2588 for HTPB.ETPB and CTBN modified resins
respectively. For CTBN modified resin the temperature of maximum tan ~ agrees
with the T g as per DSC. The modified samples exhibit lower tan ~ values than that
fortbe unmodified resin (0.497 at 71.3°C). The considerable decrease in height of
220
Modification by elastomers
tan 5 peak for CTBN modified resin indicates appreciable plasticizing action
offered by CTBN rubber. The loss modulus peaks (Fig 4.27b) occur at n.76°C and
n.31oC for HTPB and ETPB respectively which agree well with the Tg values
recorded as per DSC measurements. In general the blends (but for CTBN) show
increased loss moduli values compared to the control resin. A higher loss modulus
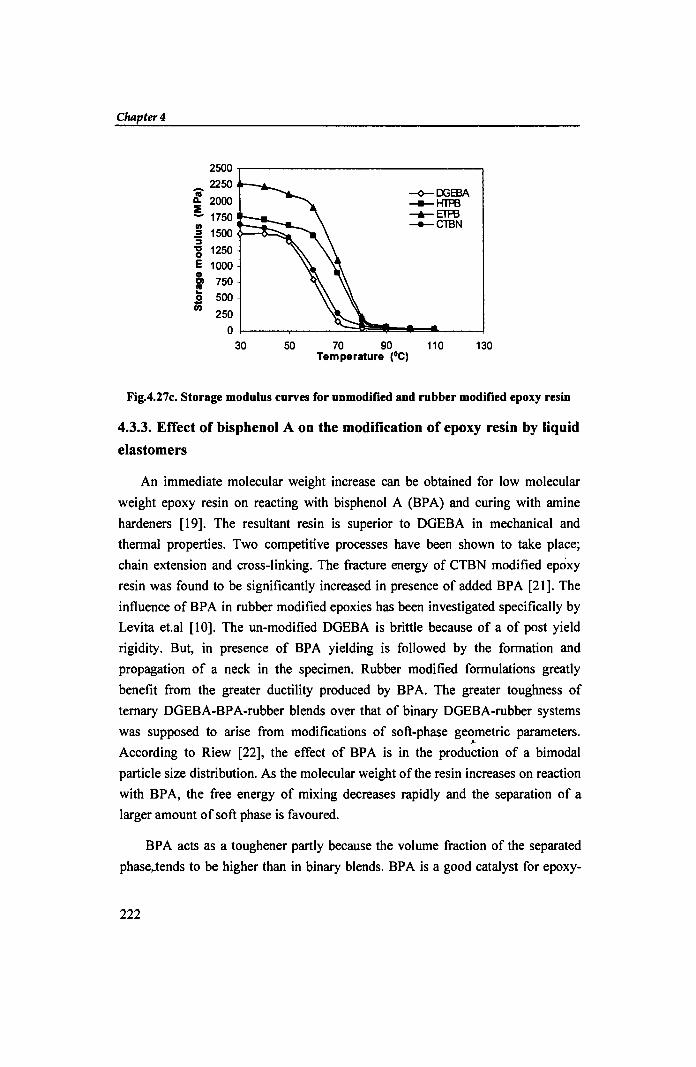
causes more mechanical energy to turn into heat via molecular relaxation. The
blends show higher storage moduli (Fig 4.27c) than the neat resin which indicates
increased elastic behaviour.
• 0.55 -,-----------------, 0.5
0.45 0.4
f·35 CD 0.3 'tI &25 .. I- 0.2
0.15 0.1
-.-DG83A ___ HTPB
-o-ETPB -CTBN
0.05 O-t------r-----,-------!
10 60 110 160 Temperature (0 C)
Fig.4.27a. Tan 0 curves for unmodified and rubber modified epoxy resin
200 180
l160 !,140
!l120 '3 100 'tI
~ 80
= 60 .3 40
20
0 10 30 50 70
-DG83A ___ HTPB
-.-ETPB -e-CTBN
90 110 Temperature (0 C)
130
Fig.4.27b. Loss modulus curves for unmodified and rubber modified epoxy resin
221
Chapter 4
2500.-----------------------------~
2250
~ ~~~~ 1/1 ..2 1500 0--0";::;:' .. :::J -g 1250 E 1000 3, 750 ca ..
--o--OOEBA ____ HTPB
......... ETFB _CTBN
~ 500 250 O~--~--~~~~~~--~
30 50 70 90 110 130 Temperature (GC)
Fig.4.27c. Storage modulus curves for unmodified and rubber modified epoxy resin
4.3.3. Effect of bisphenol A on the modification of epoxy resin by liquid
elastomers
An immediate molecular weight increase can be obtained for low molecular
weight epoxy resin on reacting with bisphenol A (BPA) and curing with amine
hardeners [19]. The resultant resin is superior to DGEBA in mechanical and
thermal properties. Two competitive processes have been shown to take place;
chain extension and cross-linking. The fracture energy of CTBN modified epoxy
resin was found to be significantly increased in presence of added BPA [21]. The
influence of BPA in rubber modified epoxies has been investigated specifically by
Levita et.al [10]. The un-modified DGEBA is brittle because of a of post yield
rigidity. But, in presence of BPA yielding is followed by the formation and
propagation of a neck in the specimen. Rubber modified formulations greatly
benefit from the greater ductility produced by BP A. The greater toughness of
ternary DGEBA-BPA-rubber blends over that of binary DGEBA-rubber systems
was supposed to arise from modifications of soft-phase geometric parameters . •
According to Riew [22], the effect of BPA is in the production of a bimodal
particle size distribution. As the molecular weight of the resin increases on reaction
with BPA, the free energy of mixing decreases rapidly and the separation of a
larger amount of soft phase is favoured.
BPA acts as a toughener partly because the volume fraction of the separated
phase,.tends to be higher than in binary blends. BPA is a good catalyst for epoxy-
222
Chapter 4
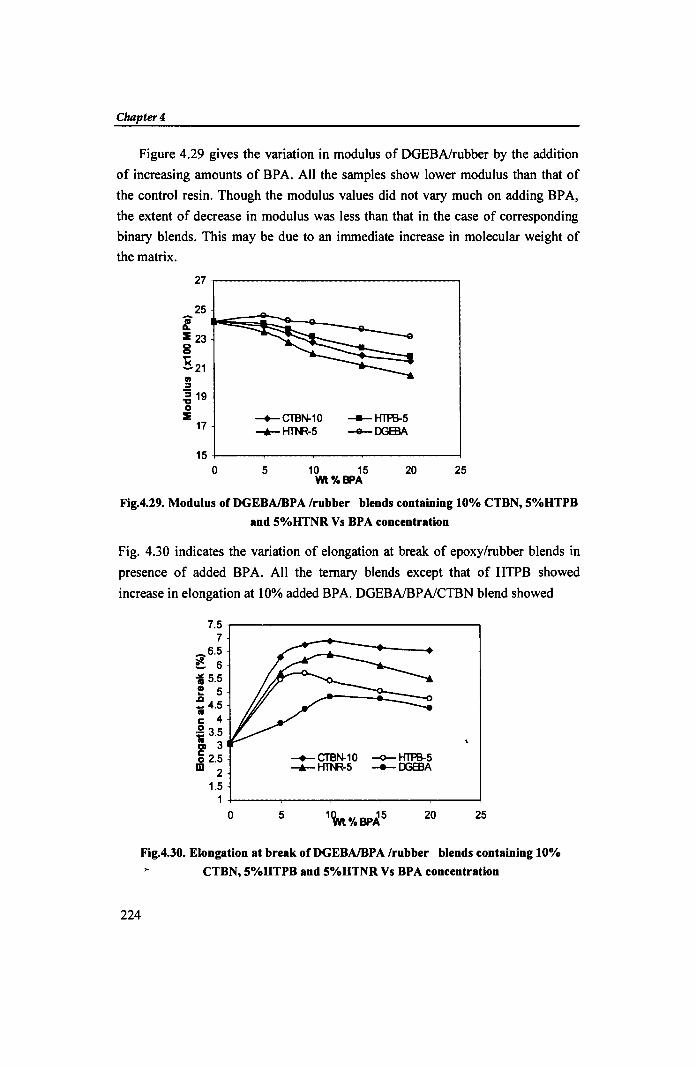
Figure 4.29 gives the variation in modulus of DGEBAlrubber by the addition
of increasing amounts of BPA. All the samples show lower modulus than that of
the control resin. Though the modulus values did not vary much on adding BPA,
the extent of decrease in modulus was less than that in the case of corresponding
binary blends. This may be due to an immediate increase in molecular weight of
the matrix.
27r-----------------------------~
-+-CTBN-10 -.- Hl'l\R-5
___ HTPB-5
-4-00EBA
15~----~----~----~----~~--__4
o 5 10 15 20 25 Wt%BPA
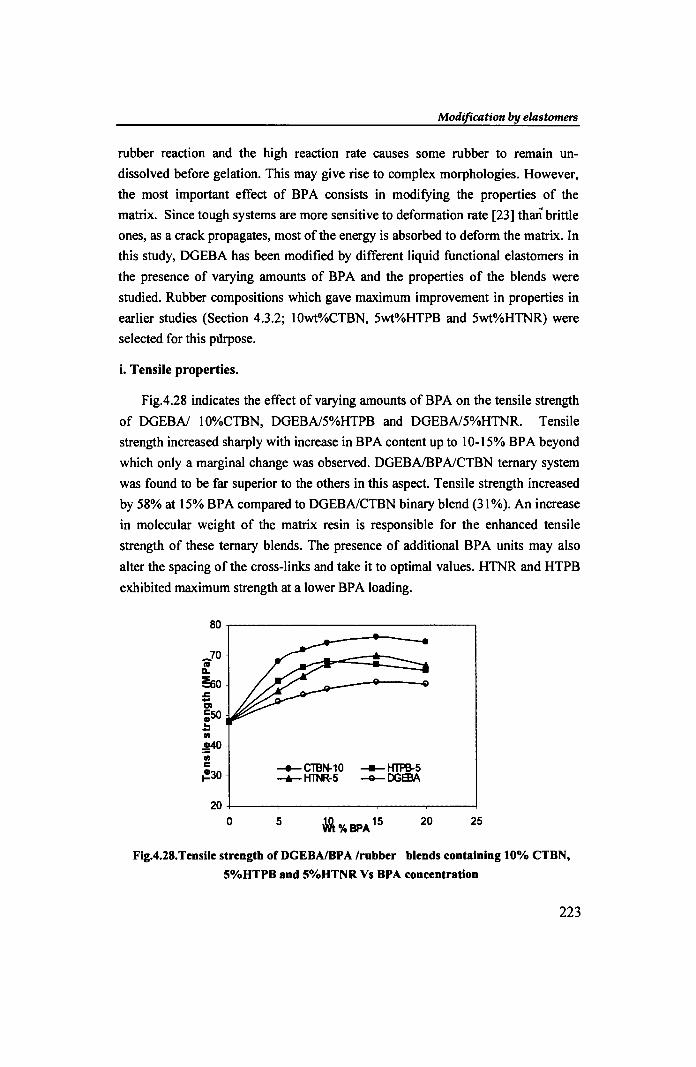
Fig.4.29. Modulus of DGEBAlBPA Irubber blends containing 10% CTBN, 5%HTPB
and 5%HTNR Vs BPA concentration
Fig. 4.30 indicates the variation of elongation at break of epoxy/rubber blends in
presence of added BPA. All the ternary blends except that of HTPB showed
increase in elongation at 10% added BPA. DGEBAfBPAlCTBN blend showed
7.5 -r-------------------------------...., 7
_6.5 ~ 6 '15.5 e 5 .a ,. 4.5 c 4 i 3.5 CD 3 S 2.5 m 2
1.5
,. -+- CTBN-10 -0- HTPB-5 -.- Hl'l\R-5 ~ OOEBA
1~----_.._----_.,..------.__----...__----~
o 5 25
Fig.4.30. Elongation at break of DGEBAlBP A Irubber blends containing 10%
CTBN, 5%HTPB and 5%HTNR Vs BPA concentration
224
ModificaHon by elastomers
122% increase in elongation compared to 102% in the absence ofBPA. This can be
due to straightening of the entangled chains. An increased entanglement of the
polymer chains is possible due to chain extension by BPA. The extended matrix
chains can induce greater spatial molecular rearrangements under the influen~e of
an applied stress. The ternary blend of HTNR was found to have better elongation
than HTPB blend. This is probably due to the presence of the pendant methyl
groups in HTNR
10,-------------------------------, 9
E 8
~ 7 ~ -0 6 • of 5 o .! 4 11
i;; 3
CD 2 .D ___ ClBN-1 0 -0- H1PB-5
......... 1iT'I'R-5 -+- DGEBA 1
O+-----~----~------~----~----~ o 5 20 25
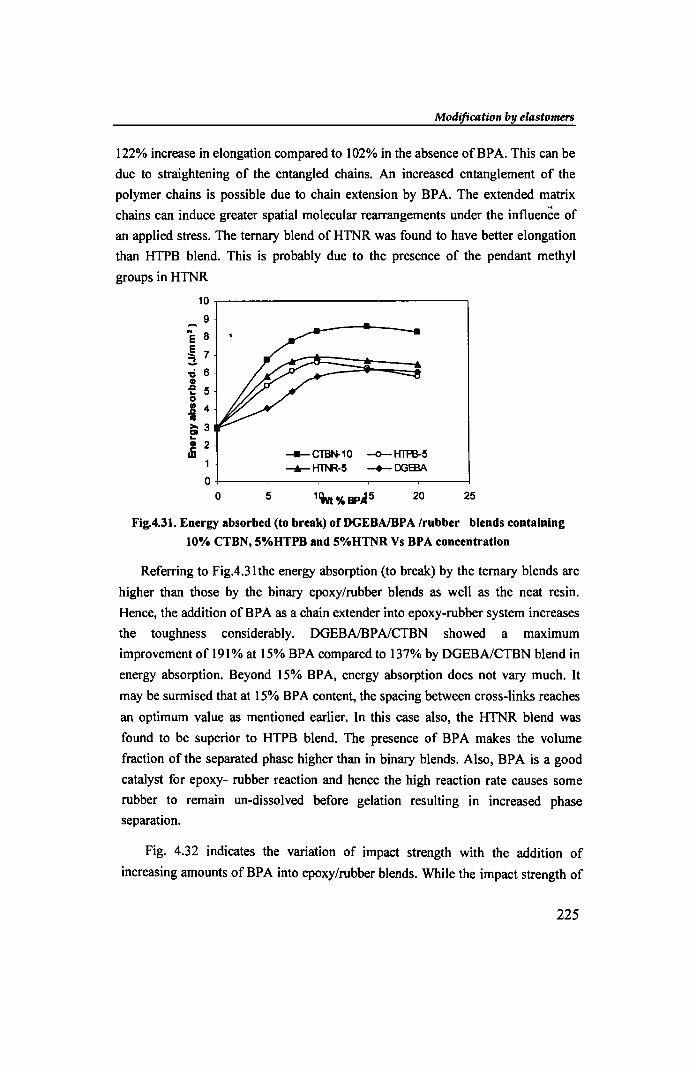
Fig.4.31. Energy absorbed (to break) ofDGEBAlBPA Irubber blends containing
10% eTBN, 5%HTPB and 5%HTNR Vs BPA concentration
Referring to Fig.4.31 the energy absorption (to break) by the ternary blends are
higher than those by the binary epoxy/rubber blends as well as the neat resin.
Hence, the addition of BP A as a chain extender into epoxy-rubber system increases
the toughness considerably. DGEBAlBPAlCTBN showed a maximum
improvement of 191% at 15% BPA compared to 137% by DGEBAlCTBN blend in
energy absorption. Beyond 15% BPA, energy absorption does not vary much. It
may be surmised that at 15% BPA content, the spacing between cross-links reaches
an optimum value as mentioned earlier. In this case also, the HTNR blend was
found to be superior to HTPB blend. The presence of BPA makes the volume
fraction of the separated phase higher than in binary blends. Also, BPA is a good
catalyst for epoxy- rubber reaction and hence the high reaction rate causes some
rubber to remain un-dissolved before gelation resulting in increased phase
separation.
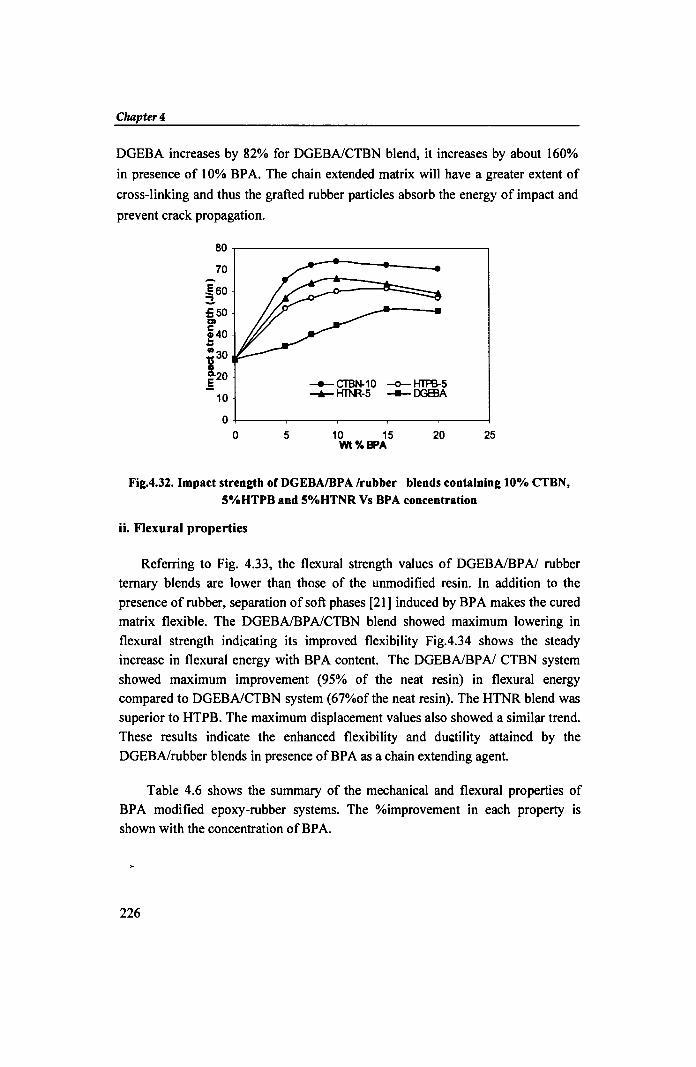
Fig. 4.32 indicates the variation of impact strength with the addition of
increasing amounts of BP A into epoxy/rubber blends. While the impact strength of
225
Chapter 4
DGEBA increases by 82% for DGEBAlCTBN blend, it increases by about 160%
in presence of 10% BPA. The chain extended matrix will have a greater extent of
cross-linking and thus the grafted rubber particles absorb the energy of impact and
prevent crack propagation.
80~----------------------------~
70
.E60 ~ =50 Cl
;40 .. -30 'tS 3.20 .§
10 -..- CTBN-10 -0- HTPB-5 ""'*- HThR-5 --- DG83A
O~----~----~----~----~----~ o 5 10 15 20 25
Wt%BPA
Fig.4.32. Impact strength ofDGEBAIBPA Irubber blends containing 10% CTBN, 5%HTPB and 5%HTNR Vs BPA concentration
ii. Flexural properties
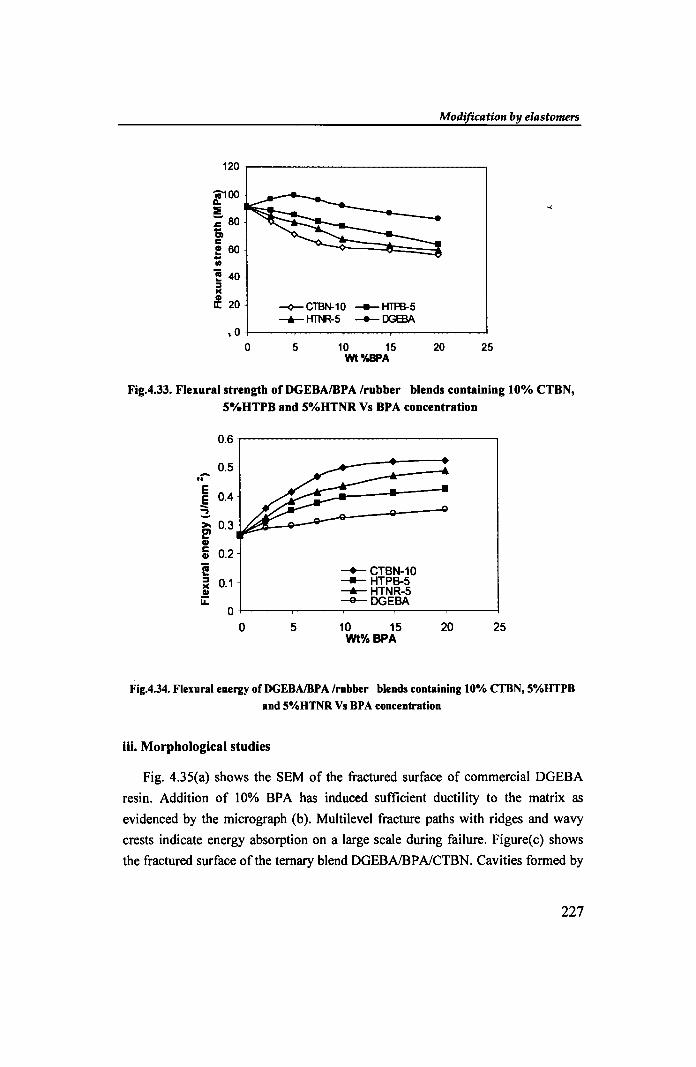
Referring to Fig. 4.33, the flexural strength values of DGEBAlBP AI rubber
ternary blends are lower than those of the unmodified resin. In addition to the
presence of rubber, separation of soft phases [21] induced by BPA makes the cured matrix flexible. The DGEBAlBPAlCTBN blend showed maximum lowering in
flexural strength indicating its improved flexibility FigA.34 shows the steady
increase in flexural energy with BPA content. The DGEBAlBP AI CTBN system
showed maximum improvement (95% of the neat resin) in flexural energy
compared to DGEBAlCTBN system (67%ofthe neat resin). The HTNR blend was
superior to HTPB. The maximum displacement values also showed a similar trend.
These results indicate the enhanced flexibility and dw;:tility attained by the
DGEBAlrubber blends in presence of BP A as a chain extending agent.
Table 4.6 shows the summary of the mechanical and flexural properties of
BPA modified epoxy-rubber systems. The %improvement in each property is
shown with the concentration of BPA.
226
Modification by elastomers
120
l100 :I ~ 80 .. Cl c ! 60 .. III
'! 40 :::I le
l 20 -<>- CTBN-10 ___ HTffi-5 -+- H'll\R-5 _ DGEBA
,0
0 5 10 15 20 25 Wt%BPA
Fig.4.33. Flexural strength of DGEBAIBPA Irubber blends containing 10% eTBN,
S%HTPB and S%HTNR Vs BPA concentration
0.6
0.5 -.. E E 0.4 -3->- 0.3 e' CII c 0.2 CII
i! -+- CTBN-10 :::I 0.1 ---- HTPB-5 le ---.- HTNR-5 CII ii: -e- DGEBA
0
0 5 10 15 20 25 Wt%BPA
Fig.4.34. Flexural energy ofDGEBAlBPA Irubber blends containing 10% CTBN, S%.HTPB and S%HTNR Vs BPA concentration
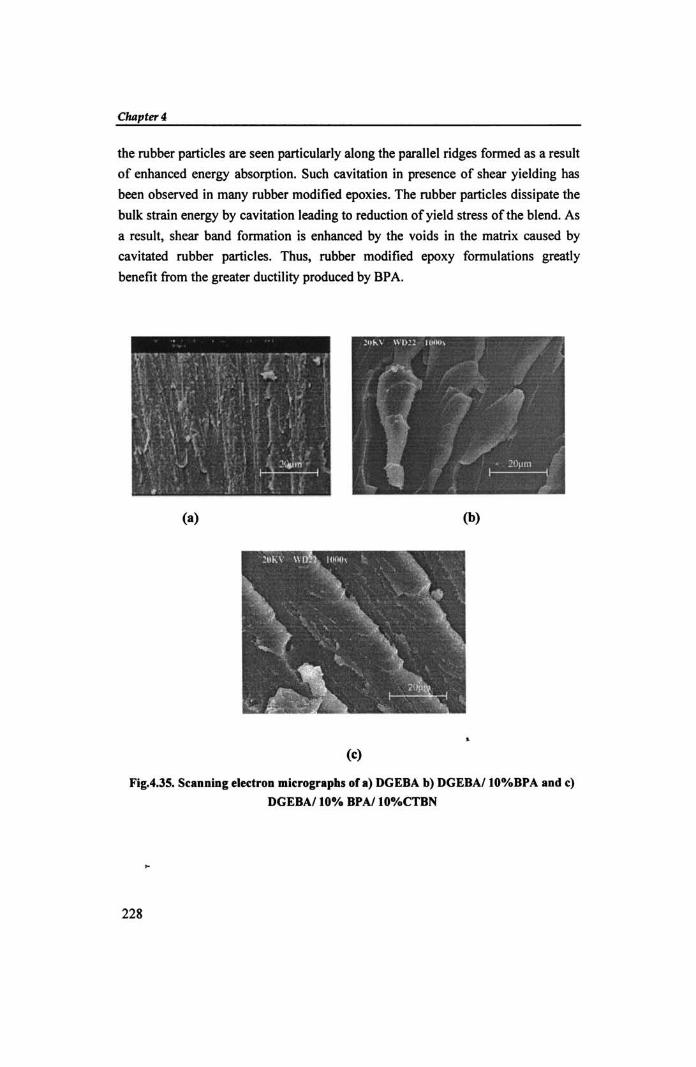
iii. Morphological studies
Fig. 4.35(a) shows the SEM of the fractured surface of commercial DGEBA
resin. Addition of 10% BPA has induced sufficient ductility to the matrix as
evidenced by the micrograph (b). Multilevel fracture paths with ridges and wavy
crests indicate energy absorption on a large scale during failure. Figure(c) shows
the fractured surface of the ternary blend DGEBAlBPNCTBN. Cavities formed by
227
ChRpta4
the rubber particles are seen particularly along the parallel ridges fonned as a result
of enhanced energy absorption. Such cavitation in presence of shear yielding has
been observed in many rubber modified epoxies. The rubber particles dissipate the
bulk strain energy by cavitation leading to reduction of yield stress of the blend. As
a result, shear band fonnation is enhanced. by the voids in the matrix caused by
cavitated rubber particles. Thus, rubber modified epoxy fonnulations greatly
benefit from the greater ductility produced by BP A.
(a) (b)
(c)
Fig.4.35. Sunaiag eledroa mic:rograpbs of a) DGEBA b) DGEBA/IO·/oBPA aad c:)
DGEBA/ IOo/. BPAlIO%CTBN
228
Modification by elastomers
Table 4.6 Properties ofDGEBAlBPA/rubber blends
Property Neat % Improvement Iroeomposition -<
Neat/BPA CTBNIBPA HTNRlBPA HTPBIBPA
Tensile strength (MPa) 48 28115 57-8/15 46115 42110
Modulus (x 100 MPa) 24.2 -4/20 -12/20 -15/20 -10120
• Elongation at break (%) 3.10 56110 122110 106110 8417.5
Energy absorbed (J.mm·2) 2.95 107115 191115 134110 122110
Impact strength (J.m-1) 28.5 82115 160110 132110 1/4115
Flexural energy ( lmm-2) 0.265 33/20 95/20 83/20 59120
Flexural strength (MPa) 91.45 1/15 -39120 -34120 -30120
iv. Thermal properties
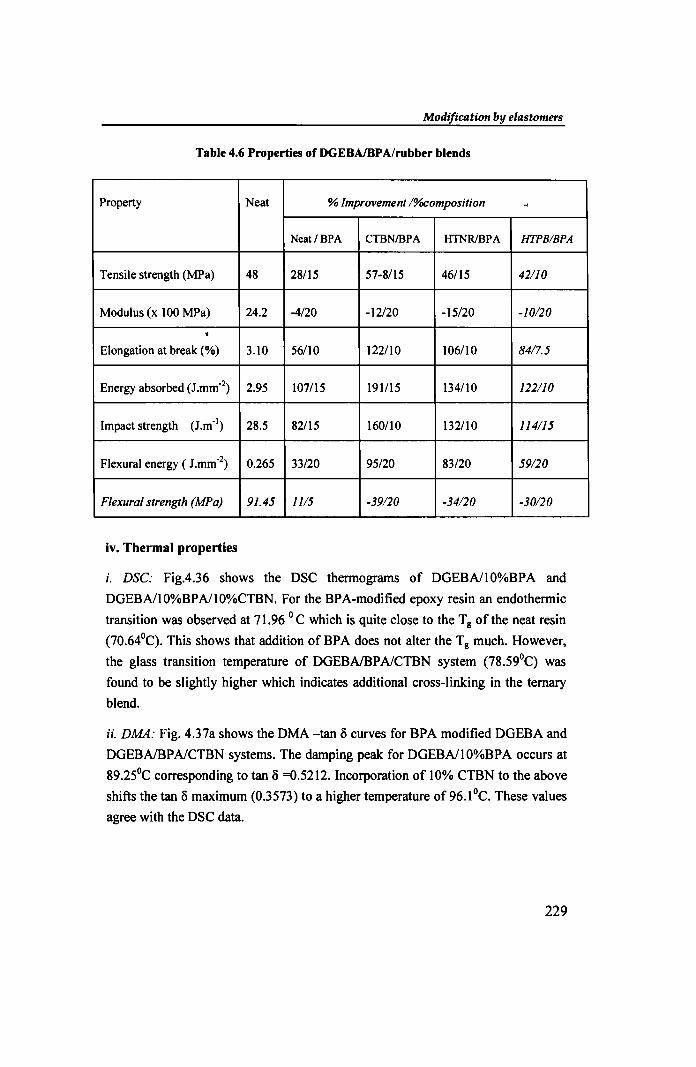
i. DSC: Fig.4.36 shows the DSC thennograms of DGEBAlI0%BPA and
DGEBAl1O%BPAl1O%CTBN. For the BPA-modified epoxy resin an endothennic
transition was observed at 71.96 ° C which is quite close to the T g of the neat resin
(70.640Q. This shows that addition of BPA does not alter the Tg much. However,
the glass transition temperature of DGEBAlBPAlCTBN system (78.59°q was
found to be slightly higher which indicates additional cross-linking in the ternary
blend.
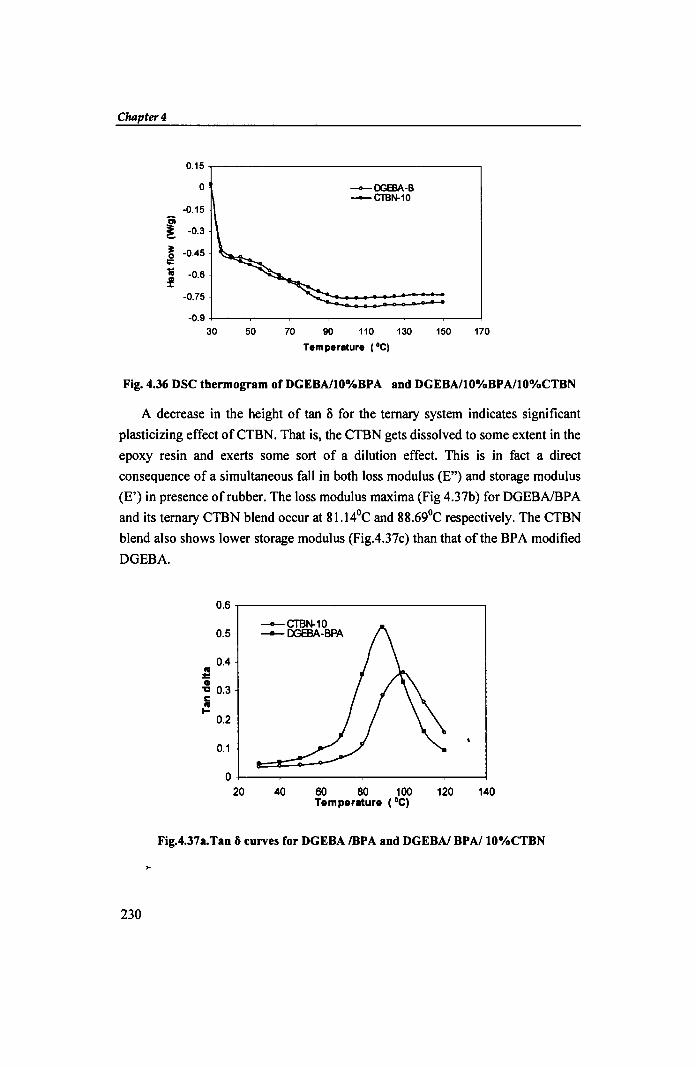
ii. DMA: Fig. 4.37a shows the DMA -tan 0 curves for BPA modified DGEBA and
DGEBAlBPAlCTBN systems. The damping peak for DGEBAI1 O%BPA occurs at
89.250C corresponding to tan 0 =0.5212. Incorporation of 10% CTBN to the above
shifts the tan 0 maximum (0.3573) to a higher temperature of 96.1 °c. These values
agree with the DSC data.
229
Chapter 4
0.15
0 --DGEBA-B --CTBN-10
-0.15 '6i ~ -0.3
• -0.45 0 I;:
~ -0.6 :!
-0.75
-0.9 30 50 70 90 110 130 150 170
Temperature (GC)
Fig. 4.36 DSC thermogram ofDGEBA/lO%BPA aDd DGEBA/IO%BPAllO%CTBN
A decrease in the height of tan S for the ternary system indicates significant
plasticizing effect ofCTBN. That is, the CTBN gets dissolved to some extent in the
epoxy resin and exerts some sort of a dilution effect. This is in fact a direct
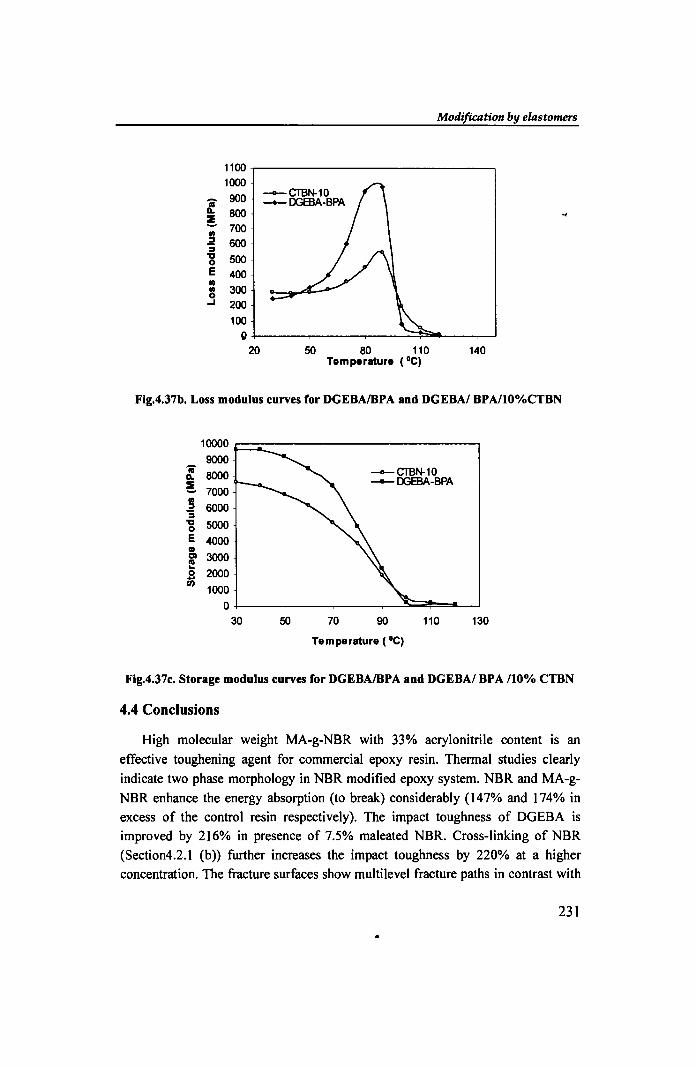
consequence of a simultaneous fall in both loss modulus (E") and storage modulus
(E') in presence of rubber. The loss modulus maxima (Fig 4.37b) for DGEBAlBPA
and its ternary CTBN blend occur at 8l.14°C and 88.690C respectively. The CTBN
blend also shows lower storage modulus (Fig.4.37c) than that of the BPA modified
DGEBA.
230
0.6
0.5
0.4 ~ CD "a 0.3 c la I-
0.2
0.1
0 20
--CTBN-10 --OOEBA-BPA
40 60 80 100 Temperature (GC)
120 140
Fig.4.37a.Tao a curves for DGEBA /BPA aDd DGEBAI BPAllO%CTBN
1100 1000
'i 900 800
!. 700 III .2 600 :::J 'a 500 0 E 400 III III 300 0
....I 200 100
0 20
--CTBN-10 _DGEBA-BPA
ModifiClltion by elastomers
50 80 110 140 Temperature (GC)
Fig.4.37b. Loss modulus curves for DGEBAIBPA and DGEBAI BPAlI0%CTBN
10000 9000
'iii 8000 0..
!. 7000 III :::J 6000 '3 'a 5000 0 E 4000 GI Cl! 3000 III ...
2000 0 -U) 1000
0 30 50
--CTBN-10 --- DGEBA-BPA
70 90
Temperature ( GC)
110 130
Fig.4.37c. Storage modulus curves for DGEBAIBPA and DGEBAI BPA 110% CTBN
4.4 Conclusions
High molecular weight MA-g-NBR with 33% acrylonitrile content is an
effective toughening agent for commercial epoxy resin. Thermal studies clearly
indicate two phase morphology in NBR modified epoxy system. NBR and MA-g
NBR enhance the energy absorption (to break) considerably (147% and 174% in excess of the control resin respectively). The impact toughness of DGEBA is improved by 216% in presence of 7.5% maleated NBR. Cross-linking of NBR
(Section4.2.1 (b» further increases the impact toughness by 220% at a higher concentration. The fracture surfaces show multilevel fracture paths in contrast with
231
Chapter 4
cavitated and smooth fracture surfaces of CTBN modified epoxies. Rubber tearing
and bridging predominate the toughening mechanism of NBR modified epoxies. PU rubber modifies the epoxy matrix to a lower extent compared to NBR and its
different derivatives.
Of the different reactive liquid rubbers CTBN is, by all means, most effective for toughening epoxy system. CTBN is highly compatible with epoxy resin and
atl 0% loading it shows maximum improvement in tensile and flexural properties. HTNR gives better results than HTPB and both are less compatible with epoxy
resin beyond 10% concentration. Compatibility as well as inter-component grafting of HTPB with epoxy resin is improved by re-functionaIization of the hydroxyl
groups by way of epoxidation (ETPB) and esterification (CTPB). These derivatives
produce better results in mechanical and thermal properties than HTPB when
blended with DGEBA resin. Further, the inclusion of small amount of silane
coupling agent (SCA) improves the mechanical properties of the HTPB blend.
Incorporation of bisphenol A is found to magnify the effect of rubber. A 10% CTBNIDGEBA system increases the energy absorption (to break) by 190 % when
15% BPA is added. In the absence of added BPA, the same system shows lesser
improvement in toughness (only 137%). The ternary blends such as
DGEBAl5%HTNRiBPA and DGEBAl5%HTPBIBPA also exhibit enhanced
tensile and toughness properties. This is because rubber modified epoxy
formulations greatly benefit from the greater ductility offered by BP A.
..
232
Modification by elastomers
References.
1. AJ. Kinloch, In Rubber Toughened Plastics: C.K. Riew, Ed. Advantes in
Chemistry, 222, American Chemical Society: Washington DC., p 67 (1989).
2. S. Montarnal et.a\. In Rubber Toughened Plastics., Ed. C.K Riew, Adv.
Chem. Ser; 222, 193-208 (1989).
3. E.H. Farmer and J. Wheeler., U.S. Patent 2,227,777 ( to British Rubber Products Research Association), January 6 (1940)
4. D.F. Lawson, W.L. Hergenrother and M.G. Matlock, J. Appl. Polym.
Sei., 39,2331 (1990).
5. B.C. Trivedi and B.M. Culbertson, Maleic Anhydride Plenum., pp-172-173, New York (1982)
6. A. A. Collyer, Ed. Rubber Toughened Engineering Plastics, Ch.5.,pp-160(1994)
7. T.Ravindran, M.R.G. Nair and Joseph Francis J. Appl.
Polym. Sei. , 35, 1227-1239(1988)
8. T.Ravindran, M.R.G. Nair and Joseph Francis, Makromol. Chem,
Rapid Commun, 7: 159-163(1986)
9. N. Gaylord, M. Mehta and R. Mehta., Am. Chem. Soc. Symp. Ser.,
364,438(1988)
10. G. Levita, A. Marchetta and E. Butta., Polymer, 26, III O( 1985)
11. A.F. Yee and R.A. Pearson, J. Mater. Sci., 21, 2462(1986)
12. M. Frounchi, M. Mehrabzadeh and M. Parvary., Polym. Int., 49, 163-
169(2000)
13. Y. Huang, AJ. Kinloch, RJ. Bertsch and A.R. Siebert In Toughened Plastics 1, Eds. C.K. Riew and AJ. Kinloch, Adv. In Chem. Ser. 233,
American Chemical society, Washington DC,p-193 (1993)
14. S. Bandopadhyay., Mater. Sci. Eng., A 125, 157 (1990)
15. D.C. Blackley., Synthetic Rubbers, their Chemistry and Technology,
Applied science Publishers, London & New York, 264 (1978)
233
Chapter 4
16. A. A. Collyer, Ed. Rubber Toughened Engineering Plastics.,Ch.6, p-170-177 (1994)
17. P.B. Latha, K. Adhinarayanan and R. Ramaswamy, Int. J. Adhes.
Adhe. 14,57(1994)
18. S. Montamal, J.P. Pascault and H. Sautereau., In Rubber Toughened
Plastics., Ed. C.K. Riew, Advances in Chemistry Series 222. American Chemical Society., Washington DC, pp-211-213 (1989)
19. V. Nigam, D.K. Seuta and G.N. Mathur, Rub. Chem. Technol,
73,830(2001)
20. M.L. Arias, P.M. Frontini and RJJ. Williams, Polymer, 44, 1537
(2003)
21. N. Hata and J. Kumanotani., J. Appl. Polym. Sci., 17, 354 5 (1973)
22. C.K. Riew, E.H. Rowe and A.R. Siebert In Toughness and Brittleness
of Plastics, R.D. Deanin and A.M. Crungola Eds. Advances in
Chemistry Series.,154, American Chemical Society., Washington DC,
pp-326 (1976)
23. W.D. Bascom, R.Y. Ting, RJ. Moulton, c.K. Riew and A.R. Siebert.,
J. Mater. Sei., 16,2697(1981).
234