Embed Size (px)
Citation preview
Photochemistry and Photobiology, 1997, 65(6): 969-973
Modification of Global Erythemally Effective lrradiance by Clouds
Stephan Thiel*, Karl Steiner and Harald K. Seidlitz GSF-National Research Center for Environment and Health, Exposure Chambers for Plants, Germany
Received 4 September 1996; accepted 10 March 1997
ABSTRACT
The role clouds play in the modification of global radia- tion is still a major uncertainty in the risk assessment of UV effects on ecological systems and human health. This study presents cloud transmission data obtained from measurements with Robertson-Berger meters and si- multaneous cloud observations. The global transmission of erythemally weighted irradiance depends strongly on cloud amount and can be described by a cubic function. The comparison with results derived from long-term re- cords of total global irradiance indicates no statistically significant difference between the attenuation of ery- themal and total global radiation. The large variance of data results from lumping together data from different cloud types. Classification of data according to cloud forms yields a more statisfactory fit. The coefficient of the cubic term characterizes the ability of various cloud forms to attenuate UV radiation. It varies between 0.4 for high clouds and approximately 1.0 for cumulonim- bus. This attenuation parameter allows a quantitative de- scription of the cloud influence on irradiance and there- fore a more accurate risk assessment.
The concern about the increase of shortwave ultraviolet global radiation, due to the depletion of the stratospheric ozone layer, has become the subject of a great number of studies. The latest UNEP report (1) summarizes the devel- opment at present. The actual impact of UV radiation on the biosphere, however, appears to be rather complex. Apart from reliably predictable and measurable parameters such as solar zenith angle and total ozone column, rapidly changing meteorological factors such as haze, aerosols, gaseous pol- lutants and clouds are affecting particularly the local UV irradiance. Clouds usually attenuate the incoming solar ra- diation and redistribute the ratio between direct and diffuse radiation due mainly to scattering. The actual irradiance val- ues depend strongly on cloud parameters like cloud form, thickness, height, cloud amount erc. Under specific circum- stances however, clouds may even cause a local increase of
*To whom correspondence should be addressed at: GSF-Forschung- szentrum fur Umwelt und Gesundheit, Expositionskammern, In- golstadter Landstr. 1, D-85764 Neuherberg, Germany. Fax: +49/89/3 187-443 1; e-mail: [email protected]
0 1997 American Society for Photobiology 003 1-8655/97 $5.00+0.00
the UV global irradiance as compared to a cloudless situa- tion (24) . In order to understand and describe systemati- cally the impact of clouds on global radiation, distinct pa- rameters quantifying the influence have to be investigated. The optical thickness, for instance, describes the efficiency by which radiation is scattered or absorbed by a cloud.
Methods for estimating the effect of cloudiness on ground-level UV irradiance, based on simultaneous long- term satellite observation of cloud cover and total ozone col- umn in combination with a model for radiative transfer cal- culation, were developed e.g. by Frederick and Erlick (5) and Lubin and Jensen (6). These methods allow a global watch. It is, however, limited by e.g. the satellite orbit pa- rameters and the difficulty to discriminate cloud cover from ice and snow cover in these satellite-based observations. In addition, the present horizontal resolution near 50 X 50 km yields no small-scale local data of radiation at the environ- ment of an organism (e.g. sun covered or not). Such local data can only be obtained by direct ground-based measure- ments.
Robertson-Berger (RB) UV-meters (7-9) are frequently used to characterize the influence of clouds on UV irradiance ( 10-1 3) because their spectral response closely approximates the human erythemal action spectrum (14). In addition, they can easily be deployed at remote sites and require little maintenance.
Various researchers (10,l 1 ,15) have proposed a power law function with exponents ranging from 1 to approximately 3.5 as a fit formula to describe the influence of cloudiness on erythemally weighted irradiance or total global irradiance (16.17). Most of the UV studies employed daily totals or even longer integration periods as their database. Therefore, short-term variation of cloud parameters, like cloud amount, cloud form, the coverage of the sun’s disk and the corre- sponding responses of fast-reacting biological systems, like human skin, are not adequately considered.
If global irradiance is solely plotted versus cloud amount, data scatter wildly and a functional dependency can hardly be seen. We will demonstrate, however, that the assignment of irradiation data to distinct cloud forms yields a much more satisfying fit, at the expense of an additional fit param- eter. This parameter characterizes the specific attenuation properties of various cloud forms. Furthermore, the new pa- rameter can be related to the liquid water content of the particular cloud type, thus pointing out a way for a physical model of UV attenuation of global irradiance by clouds.
969
970 Stephan Thiel et a/.
rpectroradiometer I Robertson-Berger meter I
6 8 10 12 14 16 18 20
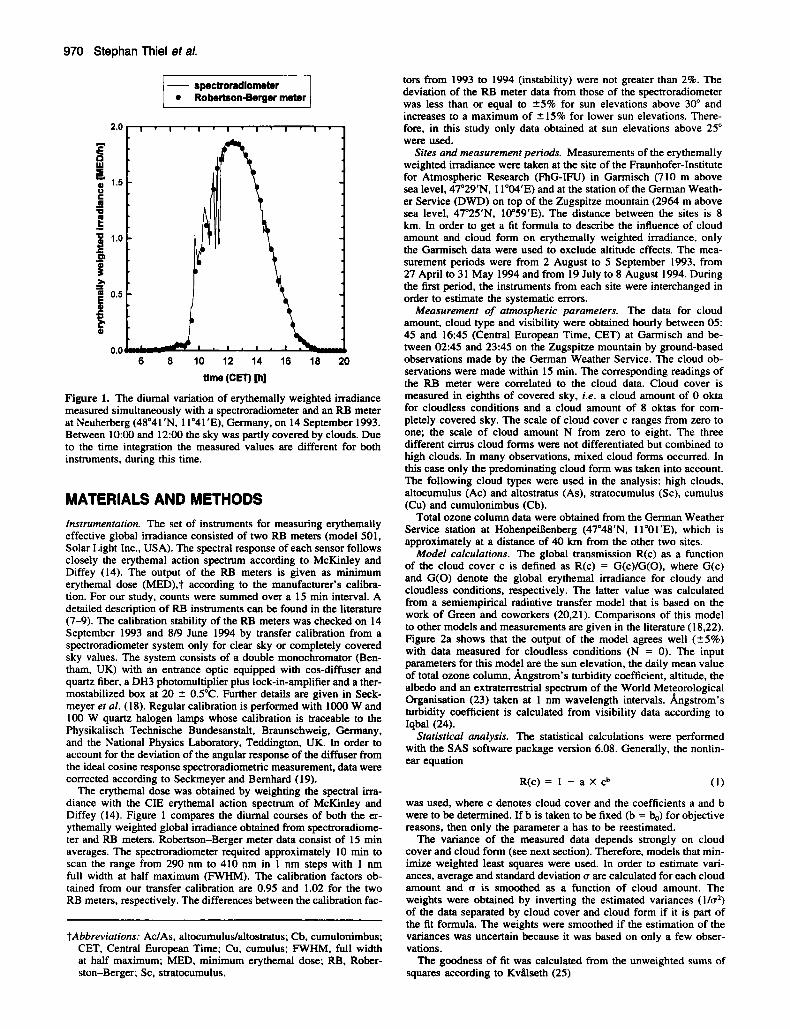
m e GET) m1 Figure 1. The diurnal variation of erythemally weighted irradiance measured simultaneously with a spectroradiometer and an RB meter at Neuherberg (48'41". ll"41'E). Germany, on 14 September 1993. Between 1O:W and 1200 the sky was partly covered by clouds. Due to the time integration the measured values are different for both instruments, during this time.
MATERIALS AND METHODS Instrumentation. The set of instruments for measuring erythemally effective global irradiance consisted of two RB meters (model 501, Solar Light Inc., USA). The spectral response of each sensor follows closely the erythemal action spectrum according to McKinley and Diffey (14). The output of the RB meters is given as minimum erythemal dose (MED),? according to the manufacturer's calibra- tion. For our study, counts were summed over a 15 min interval. A detailed description of RB instruments can be found in the literature (7-9). The calibration stability of the RB meters was checked on 14 September 1993 and 8/9 June 1994 by transfer calibration from a spectroradiometer system only for clear sky or completely covered sky values. The system consists of a double monochromator (Ben- tham, UK) with an entrance optic equipped with cos-diffuser and quartz fiber, a DH3 photomultiplier plus lock-in-amplifier and a ther- mostabilized box at 20 t 0.5"C. Further details are given in Seck- meyer et al. (18). Regular calibration is performed with lo00 W and 100 W quartz halogen lamps whose calibration is traceable to the Physikalisch Technische Bundesanstalt, Braunschweig. Germany, and the National Physics Laboratory. Teddington. UK. In order to account for the deviation of the angular response of the diffuser from the ideal cosine response spectroradiometric measurement, data were corrected according to Seckmeyer and Bernhard (19).
The erythemal dose was obtained by weighting the spectral irra- diance with the CIE erythemal action spectrum of McKinley and Diffey (14). Figure 1 compares the diurnal courses of both the er- ythemally weighted global irradiance obtained from spectroradiome- ter and RB meters. Robertson-Berger meter data consist of 15 min averages. The spectroradiometer required approximately 10 min to scan the range from 290 nm to 410 nm in 1 nm steps with 1 nm full width at half maximum (FWHh4). The calibration factors ob- tained from our transfer calibration are 0.95 and 1.02 for the two RB meters, respectively. The differences between the calibration fac-
tAbbreviations: Ac/As, altocumuluslaltostratus; Cb, cumulonimbus; CET, Central European Time; Cu, cumulus; FWHM, full width at half maximum; MED, minimum erythemal dose; RB, Rober- ston-Berger; Sc, stratocumulus.
tors from 1993 to 1994 (instability) were not greater than 2%. The deviation of the RB meter data from those of the spectroradiometer was less than or equal to 25% for sun elevations above 30" and increases to a maximum of 2 15% for lower sun elevations. There- fore, in this study only data obtained at sun elevations above 25" were used.
Sites and measurement periods. Measurements of the erythemally weighted irradiance were taken at the site of the Fraunhofer-Institute for Atmospheric Research (FhG-IFU) in Garmisch (710 m above sea level, 47'29'N, 11'04'E) and at the station of the German Weath- er Service (DWD) on top of the Zugspitze mountain (2964 m above sea level, 4725". 10'59'E). The distance between the sites is 8 km. In order to get a fit formula to describe the influence of cloud amount and cloud form on erythemally weighted irradiance, only the Garmisch data were used to exclude altitude effects. The mea- surement periods were from 2 August to 5 September 1993, from 27 April to 31 May 1994 and from 19 July to 8 August 1994. During the first period, the instruments from each site were interchanged in order to estimate the systematic errors.
Measurement of atmospheric parameters. The data for cloud amount, cloud type and visibility were obtained hourly between 05: 45 and 16:45 (Central European Time, CET) at Garmisch and be- tween 02:45 and 23:45 on the Zugspitze mountain by ground-based observations made by the German Weather Service. The cloud ob- servations were made within 15 min. The corresponding readings of the RB meter were correlated to the cloud data. Cloud cover is measured in eighths of covered sky, i.e. a cloud amount of 0 okta for cloudless conditions and a cloud amount of 8 oktas for com- pletely covered sky. The scale of cloud cover c ranges from zero to one; the scale of cloud amount N from zero to eight. The three different cirms cloud forms were not differentiated but combined to high clouds. In many observations, mixed cloud forms occurred. In this case only the predominating cloud form was taken into account. The following cloud types were used in the analysis: high clouds, altocumulus (Ac) and altostratus (As), stratocumulus (Sc), cumulus (Cu) and cumulonimbus (Cb).
Total ozone column data were obtained from the German Weather Service station at HohenpeiBenberg (47"48'N, 1 l"01'E). which is approximately at a distance of 40 km from the other two sites.
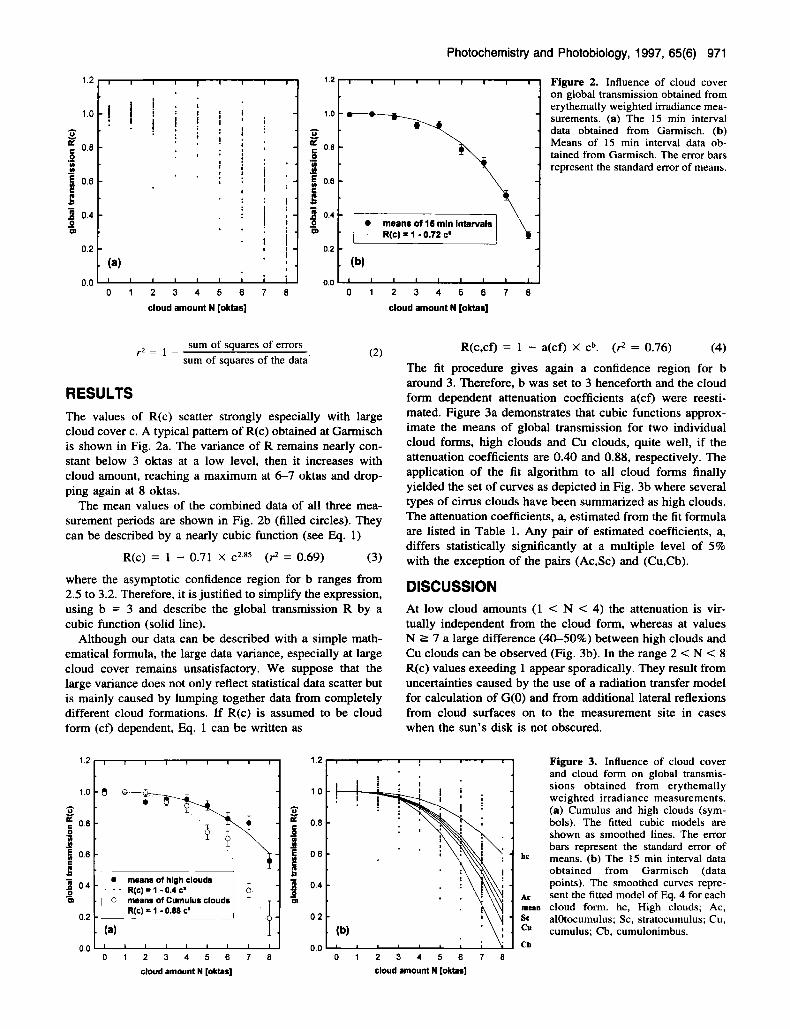
Model calculations. The global transmission R(c) as a function of the cloud cover c is defined as R(c) = G(c)/G(O), where G(c) and G(0) denote the global erythemal irradiance for cloudy and cloudless conditions, respectively. The latter value was calculated from a semiempirical radiative transfer model that is based on the work of Green and coworkers (20.21). Comparisons of this model to other models and measurements are given in the literature (18.22). Figure 2a shows that the output of the model agrees well ( 2 5 % ) with data measured for cloudless conditions (N = 0). The input parameters for this model are the sun elevation, the daily mean value of total ozone column, Angstrom's turbidity coefficient, altitude, the albedo and an extraterrestrial spectrum of the World Meteorological Organisation (23) taken at 1 nm wavelength intervals. Angstrom's turbidity coefficient is calculated from visibility data according to Iqbal (24).
Statistical analysis. The statistical calculations were performed with the SAS software package version 6.08. Generally, the nonlin- ear equation
R(c) = 1 - a X cb (1)
was used, where c denotes cloud cover and the coefficients a and b were to be determined. If b is taken to be fixed (b = b,) for objective reasons, then only the parameter a has to be reestimated.
The variance of the measured data depends strongly on cloud cover and cloud form (see next section). Therefore, models that min- imize weighted least squares were used. In order to estimate vari- ances, average and standard deviation u are calculated for each cloud amount and u is smoothed as a function of cloud amount. The weights were obtained by inverting the estimated variances ( l/u2) of the data separated by cloud cover and cloud form if it is part of the fit formula. The weights were smoothed if the estimation of the variances was uncertain because it was based on only a few obser- vations.
The goodness of fit was calculated from the unweighted sums of squares according to KvPlseth (25)
Photochemistry and Photobiology, 1997, 65(6) 971
1.0
0.8
0.6
0.4
0.2
n n
1.2
1 .o u - 5 0.8 0 la
5 0.6 .- - E c 9, I 0.4
-
-
-
-
-
-
1.2
1 .o
- : 0.8
B 5 0.8 b
0 - C
1 0.4 - m
-
.
-
: ! 1 o.2
hc
Ac m a n
- s e cu Cb
k 0 means of 16 mln Intervals
__ R(C) 1 - 0.72 C'
Figure 2. Influence of cloud cover on global transmission obtained from erythemally weighted irradiance mea- surements. (a) The 15 min interval data obtained from Garmisch. (b)
. . 0.01' ' I 1 1 1
0 1 2 3 4 5 6 1 8 0 1 2 3 4 5 6 1 8
cloud amount N [oktas] cloud amount N [oktas]
sum of squares of errors sum of squares of the data' r 2 = 1 - (2)
RESULTS The values of R(c) scatter strongly especially with large cloud cover c. A typical pattern of R(c) obtained at Garmisch is shown in Fig. 2a. The variance of R remains nearly con- stant below 3 oktas at a low level, then it increases with cloud amount, reaching a maximum at 6-7 oktas and drop- ping again at 8 oktas.
The mean values of the combined data of all three mea- surement periods are shown in Fig. 2b (filled circles). They can be described by a nearly cubic function (see Eq. 1)
(3)
where the asymptotic confidence region for b ranges from 2.5 to 3.2. Therefore, it is justified to simplify the expression, using b = 3 and describe the global transmission R by a cubic function (solid line).
Although our data can be described with a simple math- ematical formula, the large data variance, especially at large cloud cover remains unsatisfactory. We suppose that the large variance does not only reflect statistical data scatter but is mainly caused by lumping together data from completely different cloud formations. If R(c) is assumed to be cloud form (cf) dependent, Eq. 1 can be written as
R(c) = 1 - 0.71 X c ~ . ~ ~ (6 = 0.69)
1.0 - e - . ; 0.8 - - ; . $ 0.6 -
ul 0 means of Cumulus clouds
0 1 2 3 4 5 6 7 8
cloud amount N [oktas]
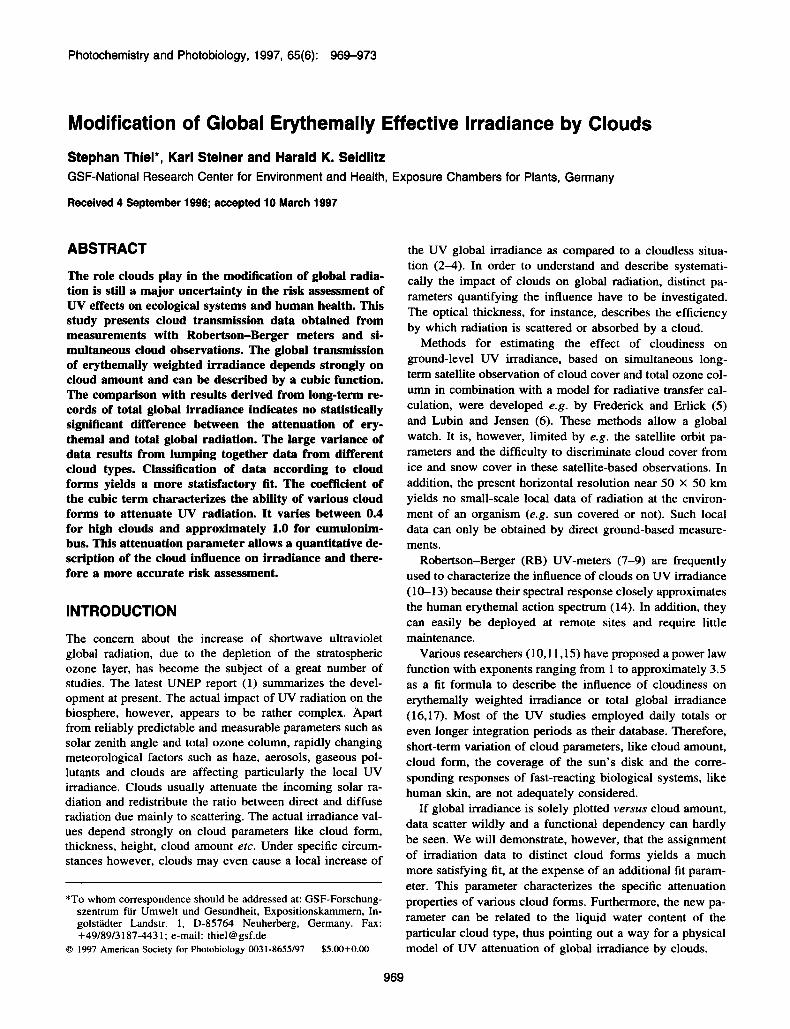
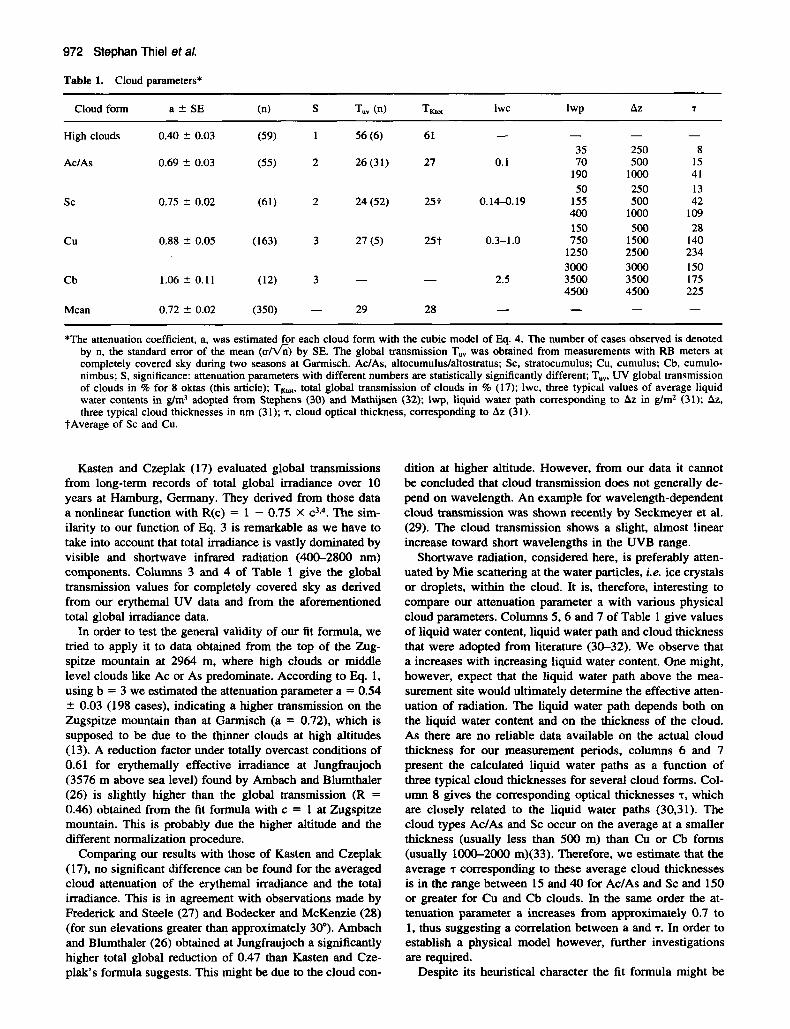
R(c,cf) = 1 - a(cf) X cb. (9 = 0.76) (4) The fit procedure gives again a confidence region for b around 3. Therefore, b was set to 3 henceforth and the cloud form dependent attenuation coefficients a(cf) were reesti- mated. Figure 3a demonstrates that cubic functions approx- imate the means of global transmission for two individual cloud forms, high clouds and Cu clouds, quite well, if the attenuation coefficients are 0.40 and 0.88, respectively. The application of the fit algorithm to all cloud forms finally yielded the set of curves as depicted in Fig. 3b where several types of cirrus clouds have been summarized as high clouds. The attenuation coefficients, a, estimated from the fit formula are listed in Table 1. Any pair of estimated coefficients, a, differs statistically significantly at a multiple level of 5% with the exception of the pairs (Ac,Sc) and (Cu,Cb).
DISCUSSION At low cloud amounts (1 < N < 4) the attenuation is vir- tually independent from the cloud form, whereas at values N 2 7 a large difference (40-50%) between high clouds and Cu clouds can be observed (Fig. 3b). In the range 2 < N < 8 R(c) values exeeding 1 appear sporadically. They result from uncertainties caused by the use of a radiation transfer model for calculation of G(0) and from additional lateral reflexions from cloud surfaces on to the measurement site in cases when the sun's disk is not obscured.
Means of 15 min interval data obi tained from Garmisch. The error bars represent the standard error of means.
1.2 1 1 I I I I I I I
-.- 0 1 2 3 4 5 6 1 8
cloud amount N [oktas]
Figure 3. Influence of cloud cover and cloud form on global transmis- sions obtained from erythemally weighted irradiance measurements. (a) Cumulus and high clouds (sym- bols). The fitted cubic models are shown as smoothed lines. The error bars represent the standard error of means. (b) The 15 min interval data obtained from Garmisch (data points). The smoothed curves repre- sent the fitted model of EQ. 4 for each cloud form. hc, High clouds; Ac, al0tocumulus; Sc, stratocumulus; Cu, cumulus; Cb, cumulonimbus.
972 Stephan Thiel et a/.
Table 1. Cloud parameters*
- - High clouds 0.40 2 0.03 (59) 1 56 (6) 61 35
AdAs 0.69 ? 0.03 (55) 2 26 (31) 27 0.1 70 190 50
s c 0.75 2 0.02 (61) 2 24 (52) 257 0.14-0.19 155 400 150
c u 0.88 ? 0.05 (163) 3 27 (5) 25 t 0.3-1.0 750 1250 3000
Cb 1.06 2 0.11 (12) 3 - - 2.5 3500 4500
- 250 500
lo00 250 500 lo00 500 1500 2500 3000 3500 4500
- 8 15 41 13 42
109 28 140 234 150 175 225
- - - - 29 28 - Mean 0.72 2 0.02 (350)
*The attenuation coefficient, a, was estimated for each cloud form with the cubic model of Eq. 4. The number of cases observed is denoted by n, the standard error of the mean (d6) by SE. The global transmission T,, was obtained from measurements with RB meters at completely covered sky during two seasons at Garmisch. Ac/As, altocumuludaltostratus; Sc, stratocumulus; Cu, cumulus; Cb, cumulo- nimbus; S, significance: attenuation parameters with different numbers are statistically significantly different; T,,, UV global transmission of clouds in % for 8 oktas (this article); TKtOt, total global transmission of clouds in % (17); lwc, three typical values of average liquid water contents in g/m3 adopted from Stephens (30) and Mathijsen (32); lwp, liquid water path corresponding to Az in g/m2 (31); Az, three typical cloud thicknesses in nm (31); T, cloud optical thickness, corresponding to Az (31).
?Average of Sc and Cu.
Kasten and Czeplak (1 7) evaluated global transmissions from long-term records of total global irradiance over 10 years at Hamburg, Germany. They derived from those data a nonlinear function with R(c) = 1 - 0.75 X c3s4. The sim- ilarity to our function of Eq. 3 is remarkable as we have to take into account that total irradiance is vastly dominated by visible and shortwave infrared radiation (4W2800 nm) components. Columns 3 and 4 of Table 1 give the global transmission values for completely covered sky as derived from our erythemal UV data and from the aforementioned total global irradiance data.
In order to test the general validity of our fit formula, we tried to apply it to data obtained from the top of the Zug- spitze mountain at 2964 m, where high clouds or middle level clouds like Ac or As predominate. According to Eq. 1, using b = 3 we estimated the attenuation parameter a = 0.54 2 0.03 (198 cases), indicating a higher transmission on the Zugspitze mountain than at Garmisch (a = 0.72), which is supposed to be due to the thinner clouds at high altitudes (13). A reduction factor under totally overcast conditions of 0.61 for erythemally effective irradiance at Jungfraujoch (3576 m above sea level) found by Ambach and Blumthaler (26) is slightly higher than the global transmission (R = 0.46) obtained from the fit formula with c = 1 at Zugspitze mountain. This is probably due the higher altitude and the different normalization procedure.
Comparing our results with those of Kasten and Czeplak (17), no significant difference can be found for the averaged cloud attenuation of the erythemal irradiance and the total irradiance. This is in agreement with observations made by Frederick and Steele (27) and Bodecker and McKenzie (28) (for sun elevations greater than approximately 30"). Ambach and Blumthaler (26) obtained at Jungfraujoch a significantly higher total global reduction of 0.47 than Kasten and Cze- plak's formula suggests. This might be due to the cloud con-
dition at higher altitude. However, from our data it cannot be concluded that cloud transmission does not generally de- pend on wavelength. An example for wavelength-dependent cloud transmission was shown recently by Seclu-neyer et al. (29). The cloud transmission shows a slight, almost linear increase toward short wavelengths in the UVB range.
Shortwave radiation, considered here, is preferably atten- uated by Mie scattering at the water particles, i.e. ice crystals or droplets, within the cloud. It is, therefore, interesting to compare our attenuation parameter a with various physical cloud parameters. Columns 5.6 and 7 of Table 1 give values of liquid water content, liquid water path and cloud thickness that were adopted from literature (30-32). We observe that a increases with increasing liquid water content. One might, however, expect that the liquid water path above the mea- surement site would ultimately determine the effective atten- uation of radiation. The liquid water path depends both on the liquid water content and on the thickness of the cloud. As there are no reliable data available on the actual cloud thickness for our measurement periods, columns 6 and 7 present the calculated liquid water paths as a function of three typical cloud thicknesses for several cloud forms. Col- umn 8 gives the corresponding optical thicknesses T, which are closely related to the liquid water paths (30,31). The cloud types AcIAs and Sc occur on the average at a smaller thickness (usually less than 500 m) than Cu or Cb forms (usually 1000-2000 m)(33). Therefore, we estimate that the average T corresponding to these average cloud thicknesses is in the range between 15 and 40 for AcIAs and Sc and 150 or greater for Cu and Cb clouds. In the same order the at- tenuation parameter a increases from approximately 0.7 to 1, thus suggesting a correlation between a and T. In order to establish a physical model however, further investigations are required.
Despite its heuristical character the fit formula might be
Photochemistry and Photobiology, 1997, 65(6) 973
useful for estimating the erythemal UV exposure, at least for large cloud amounts. At partial coverage the situation be- comes much more complex and conclusions must be care- fully discussed because the RB meter data give no infor- mation on the balance between direct and diffuse radiation. In addition, integrating sensors yield only data on the mod- ulation of the amount of UV radiation but no information on how the spectral quality is affected.
This study demonstrates however, that within a certain geographical region the ecological and health impact of en- hanced UV radiation can be estimated more accurately if detailed data on cloud type, cloud frequency and cloud amount are available.
Acknowledgements-We thank Dr. H.-D. Payer for supporting the work and stimulating discussions. Cloud data and data of visibility and total ozone column were provided by the German Weather Ser- vice (DWD). We gratefully acknowledge support of the German Weather Service and the Fraunhofer Institut fur Atmosphiirische Umweltforschung in Garmisch (IFU) for putting the measurement sites at our disposal. This research was supported by the Bayrisches Staatsministerium fur Landesentwicklung und Umweltfragen, grant no. 6495-935-1 16903.
1 .
2.
3.
4.
5 .
6.
7.
8.
9.
10.
1 I .
12.
Environmental Effects of Ozone Depletion (1995) Royal Swed- ish Academy of Sciences, Special Issue of AMBIO 24, 137- 197. Bener, P. (1964) Investigation on the influence of clouds on ultraviolet sky radiation. Technical Note No. 3, Contract AF
Seckmeyer, G., B. Mayer, R. Erb and G. Bernhard (1994) UV-B in Germany higher in 1993 than in 1992. Geophys. Res. Letr.
Nack, M. L. and A. E. S. Green (1974) Influence of clouds, haze, and smog on the middle ultraviolet reaching the ground. Appl. Optics 13, 2405-2415. Frederick, J. E. and C. Erlick (1995) Trends and interannual variations in erythemal sunlight, 1978-1993. Photochem. Pho- tobiol. 62. 47-84, Lubin, D. and E. H. Jensen (1995) Effects of clouds and strat- ospheric ozone depletion on ultraviolet radiation trends. Nature 377, 710-713. Berger, D. S. (1976) The sunburning ultraviolet meter: design and performance. Photochem. Photobiol. 24, 587-593. DeLuisi, J. , J . Wendell and F. Kreiner (1992) An examination of the spectral response characteristics of seven Robertson-Ber- ger meters after long term field use. Photochem. Phorobiol. 56, 115-122. Kennedy, B. C. and W. E. Sharp (1992) A validation study of the Robertson-Berger meter. Photochem. Photobiol. 56, 133- 141. Paltridge, G. W. and I. J. Barton (1978) Erythema1 ultraviolet radiation distribution over Australia-The calculations, detailed results and input data including frequency analysis of observed Australian cloud cover. Division of Atmospheric Physics Tech- nical Paper 33, Commonwealth Scientific and Industrial Re- search Organisation, Australia. Josefsson, W. (1986) Solar ultraviolet radiation in Sweden. SMHI report 53, National Institute of Radiation Protection in Stockholm, Norkoping, Sweden. NCmeth, P., Z. T6th and Z. Nagy (1996) Effect of weather con-
61 (052)-6 18.
21, 577-580.
13.
14.
15.
16.
17.
18.
19.
20.
21.
22.
23.
24.
25.
26.
27.
28.
29.
30.
31.
32.
33.
ditions on UV-B radiation reaching the earth’s surface. J. Pho- tochem. Photobiol. B 32, 177-181. Blumthaler, M., W. Ambach, A. Cede and J. Staehelin (1995) Attenuation of erythemal effective irradiance by cloudiness at low and high altitude in the alpine region. Phorochem. Phoro- biol. 63, 193-196. McKinley, A. F. and B. J. Diffey (1987) A reference action spectrum for ultraviolet induced erythema in human skin. In Human Exposure to Ultraviolet Radiation: Risks and Regula- tions (Edited by W. F. Paschier and B. F. M. Bosnajakovic), pp. 83-86. Elsevier, Amsterdam, Netherlands. Cutchis, P. (1980) A formula for comparing annual damaging ultraviolet (DUV) radiation doses at tropical and mid-latitude sites. Federal Aviation Administration Report FAA-EE 80-2 1, U.S. Department of Transportation, Washington, DC. Haurwitz, B. (1948) Insolation in relation to cloud type. J. Me- teorol. 5 , 110-113. Kasten, F. and G. Czeplak (1980) Solar and terrestrial radiation dependent on the amount and type of cloud. Solar Energy 24,
Seckmeyer, G., S. Thiel, M. Blumthaler, P. Fabian, S . Gerber, A. Gugg-Helminger, D.-P. Hader, M. Huber, C. Kettner, U. Kohler, P. Kopke, H. Maier, J. Schafer, P. Suppan, E. Tamm and E. Thomalla (1994) Intercomparison of spectral-UV-radia- tion measurement systems. Appl. Optics 33, 7805-7812. Seckmeyer, G. and G. Bernhard (1993) Cosine error correction of spectral UV irradiance. SPIE Proc. 2049, 140-151. Green, A. E. S., K. R. Cross and L. A. Smith (1980) Improved analytic characterization of ultraviolet skylight. Phorochern. Phorobiol. 31, 5 9 4 5 . Schippnick, P. F. and A. E. S. Green (1982) Analytical char- acterisation of spectral actinic flux and spectral irradiance in the middle ultraviolet. Photochem. Phorobiol. 35, 89-10 1. Weihs, P. and A. R. Webb (1996) Comparison of Green and Lowtran radiation schemes with a discrete ordinate method UV model. Photochem. Photobiol. 64, 642-648. World Meteorological Organisation ( 1982) Commission for In- struments and Methods of Observation, Abridged Final Report of the Eight Session, Mexico City, 19.30 October 1981. WMO- Nr. 590, Secretariat of the WMO, Genf, 71-75. Iqbal, M. (1983) An Introduction to Solar Radiation, pp. 1-6. Academic Press Canada, Toronto. KvUseth, T. 0. (1988) Cautionary note about R2. Am. Statisti- cian 39, 279-285. Ambach, W. and M. Blumthaler (1994) Characteristics of solar UV irradiance. Meteorol. 2. 3, 21 1-220. Frederick, J. E. and D. Steele (1995) The transmission of sun- light through cloudy skies: an analysis based on standard me- teorological information. J. Appl. Meteorol. 34, 2755-276 1. Bodecker, G. E. and R. L. McKenzie (1996) An algorithm for infemng surface UV irradiance including cloud effects. J. Appl. Meteorol. 35, 1860-1877. Seckmeyer, G., A. Albold and R. Erb (1996) Transmittance of a cloud is wavelength-dependent in the UV range. Geophys. Res. Lett. 23. 2753-2755. Stephens, G. L. (1978) Radiation profiles in extended water clouds, part I: theory. J. Armos. Sci. 35, 21 11-2122. Mathijsen. J. (1995) Modelling of tropospheric ozone and clouds. Ph.D. thesis, University of Utrecht, Netherlands. Borovikov, A. M., I. I. Gaivoronski, E. G. Zak, V. V. Kostarev, I. P. Mazin, V. E. Minervin. A. Kh. Khzgian and S. M. Shmeter (eds.) (1963) Cloud Physics. Translated from the Russian, Israel Program for Scientific Translations, Jerusalem, Israel. Matveev, L. T. (1984) Cloud Dynamics. Translated from the Russian, D. Reidel Publishing Company, Dordrecht, Holland (Netherlands).
177-1 89.


![Inter-hour direct normal irradiance forecast with multiple ... · ahead solar irradiance forecast [11, 12] and long-term solar irradiance estimation [13]. However, for an inter-hour](https://img.pdfslide.net/doc/110x75/5f43655640b4404ee374a6b6/inter-hour-direct-normal-irradiance-forecast-with-multiple-ahead-solar-irradiance.jpg)