Embed Size (px)
Citation preview
[Type text]Teknik menjawab science sjkt kangkar tebrau
Pn Chandra 2010
SECTION B
NAME : __________________________________
YEAR 6 : __________________________________
[Type text]Teknik menjawab science sjkt kangkar tebrau
Pn Chandra 2010
SUGGESTED ANSWERING TECHNIQUES.
1. INSTRUCTIONS
1.1 Teachers should explain the suggested techniques on how to answer
questions to the pupils.
1.2 Ensure that pupils can identify the Master Keys which are the manipulated
variables or what to change (MV / wtc) and the responding variables or what
to observe (RV / wto). Clarify about the fixed variables or what to keep the
same (RV) too.
1.3 Pupils should be exposed to the method of identifying parameters and
patterns of (MV / wtc) and (RV / wto)
1.4 Enable pupils to write (MV / wtc) and (RV / wto) in the master key diagram
found in the questions.
1.5 Teachers can use the time frame suggested in the module table.
1.6 Discuss the answers and correct the mistakes. The result can be filled in the
assessment form.
2. INTRODUCTION
In answering science questions, pupils are normally confused and not clear about the
Science Process Skills terminology. To make it easier, we teachers, should come to
an agreement where the usage of the correct methods and techniques are essential.
The following suggestions could be helpful for several Science Process Skills.
2.1 Manipulate variable (MV) / What to change (wtc) :
Things which are being changed during the experiment.
Question : 1. Based on the investigation, state what to change.
Answering format : 1. (Parameter) + objects / materials / situations
Answer : 1. Amount of sunlight.
2.2 Respond variable (RV) / What to observe (wto) :
Things which are being observed, measured or recorded during and after the
experiment
Question : 1. State what to observe in this experiment.
Answering format : 1. (Parameter) + objects / materials / situations.
Answers : 1. Height of the plants.
2. Size of the rabbits.
[Type text]Teknik menjawab science sjkt kangkar tebrau
Pn Chandra 2010
2.3 Constant / Fix variable (FV) / What to keep the same (wts) :
Things which are being kept the same before, during and after the experiment.
Question : 1. State what is kept the same in this experiment.
Answering format : 1. (Parameter) + objects / materials / situations.
Answers : 1. Type of the plant. / Place of experiment. / Amount of
water.
2.4 Hypothesis / Relationship
Suggested statements that explain the relationship between the (MV / wtc) and
(RV / wto) which are not being verified by an experiment .
Questions : 1. What is the hypothesis of this experiment?
2. State one hypothesis based on this investigation?
Answering format : 1. As / If / When the (MV / wtc) increased / decreased, the
(RV / wto) increased / decreased.
2. The more / less the (MV / wtc), the more/ less the(R wto).
Answers : 1. As / If / When the amount of sunlight increases, the height
of the plant increases.
2. The more amount of food, the bigger the rabbit.
2.5 Aim:
Purpose of the investigation or things to find out.
Questions : 1. What is the aim / purpose of the investigation above?
2. What can you find out from this investigation
Answering format : 1. To investigate / find out the relationship between the (MV/
wtc) and (RV / wto).
2. To investigate / find out the effect of (MV / wtc)
on (RV / wto).
Answers : 1. To investigate / find out the relationship between the
amount of sunlight and height of the plants.
2. To investigate / find out the effect of the amount of sunlight
and the height of the plants.
[Type text]Teknik menjawab science sjkt kangkar tebrau
Pn Chandra 2010
2.6 Predict:
The ability to forecast about what will happen based on the given data or prior
knowledge.
Questions : 1. Predict the length of the string if a 5 kg load is used.
2. What will happen to the plant if it is covered with
a black plastic?
Answers : 1. The length of spring…
2. The plant will die.
3. *depends on the result of the investigation or from the
data given.
2.7 Trend
Questions : 1. State the trend / pattern of the height of the plant.
Answering format : 1. Increasing / Decreasing / Same
Answer : 1. *depends on the result of the investigation or from the
data given.
2.8 Conclusion
Questions : 1. Write down a conclusion for the investigation above.
2. What can you learn from the investigation?
Answering format : 1. As / If / When the (MV / wtc) increased / decreased,
the (RV / wto) increased / decreased.
2. The more / less the (MV / wtc) , the more / less the
(RV / wtc)
Answers : 1. As / If / When the amount of sunlight increases, the height
of the plant increases.
2. The more the amount of food, the bigger the rabbit.
3. *depends on the result of the investigation or from data
given.
[Type text]Teknik menjawab science sjkt kangkar tebrau
Pn Chandra 2010
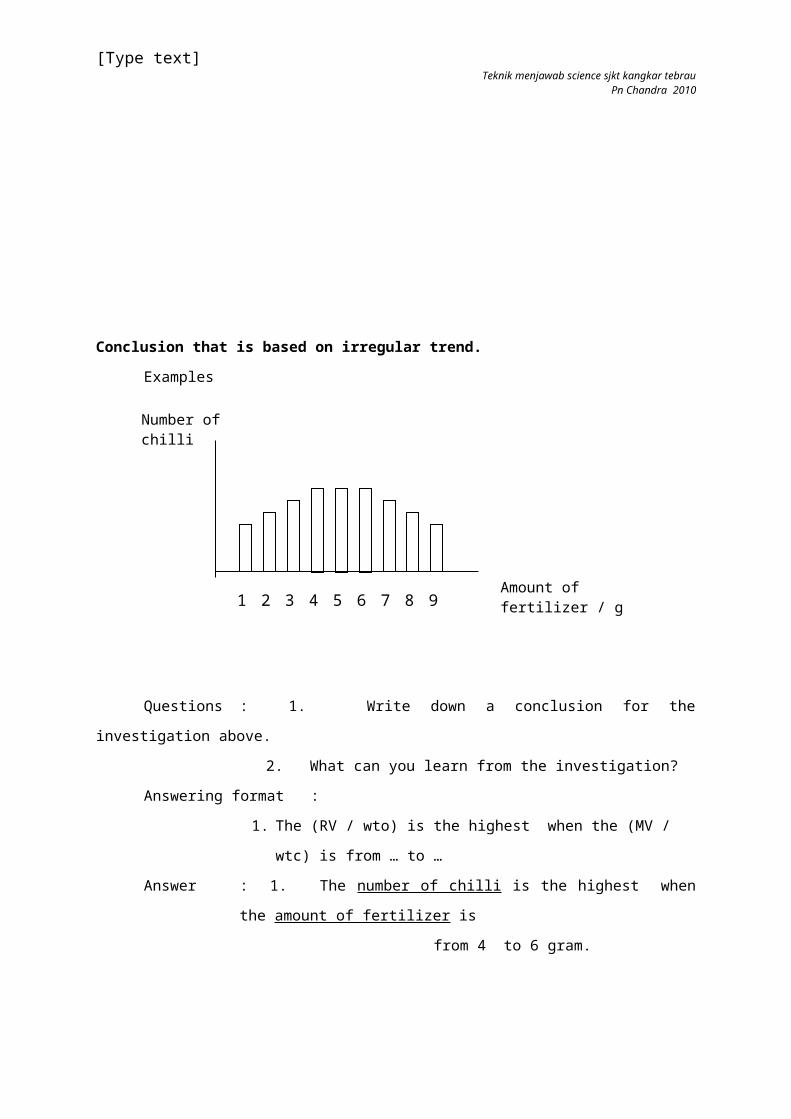
Conclusion that is based on irregular trend.
Examples
Questions : 1. Write down a conclusion for the investigation above.
2. What can you learn from the investigation?
Answering format :
1. The (RV / wto) is the highest when the (MV / wtc) is from … to
…
Answer : 1. The number of chilli is the highest when the amount of fertilizer
is
from 4 to 6 gram.
Number of chilli
1 2 3 4 5 6 7 8 9Amount of fertilizer / g
[Type text]Teknik menjawab science sjkt kangkar tebrau
Pn Chandra 2010
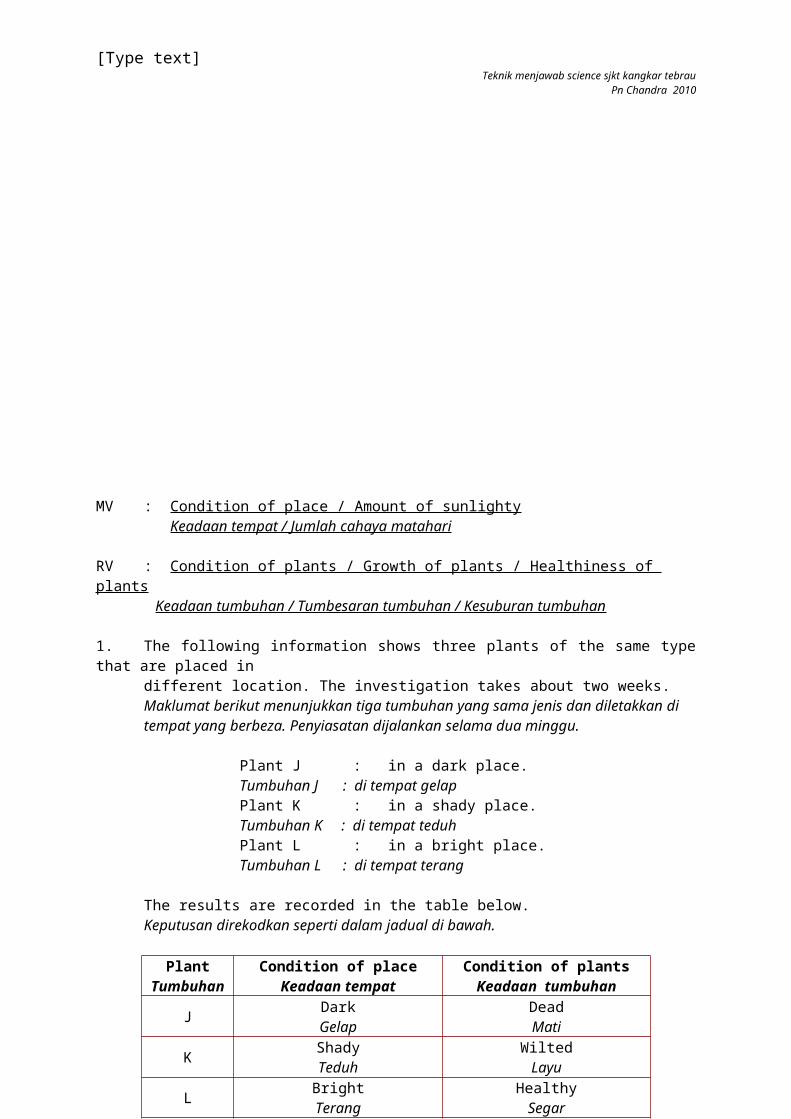
MV : Condition of place / Amount of sunlighty Keadaan tempat / Jumlah cahaya matahari
RV : Condition of plants / Growth of plants / Healthiness of plants Keadaan tumbuhan / Tumbesaran tumbuhan / Kesuburan tumbuhan
1. The following information shows three plants of the same type that are placed in different location. The investigation takes about two weeks.Maklumat berikut menunjukkan tiga tumbuhan yang sama jenis dan diletakkan di tempat yang berbeza. Penyiasatan dijalankan selama dua minggu.
Plant J : in a dark place.Tumbuhan J : di tempat gelapPlant K : in a shady place.Tumbuhan K : di tempat teduhPlant L : in a bright place.Tumbuhan L : di tempat terang
The results are recorded in the table below.Keputusan direkodkan seperti dalam jadual di bawah.
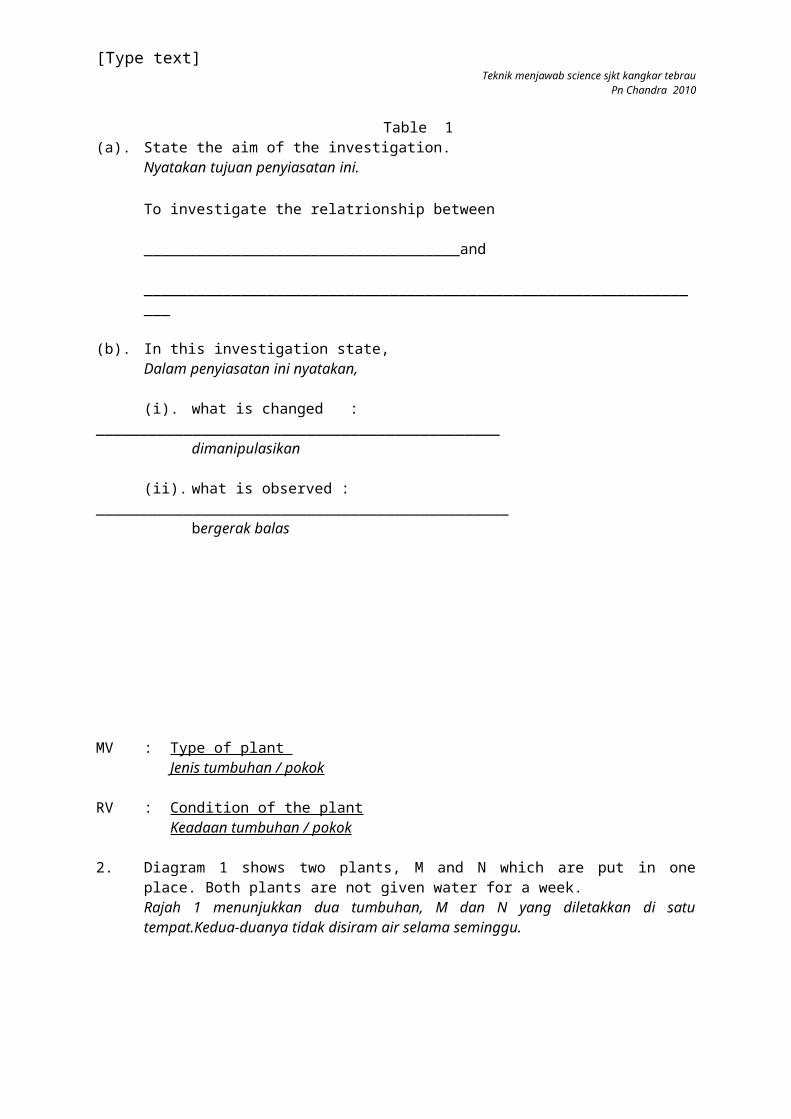
Table 1(a). State the aim of the investigation.
Nyatakan tujuan penyiasatan ini. To investigate the relatrionship between
____________________________________and
_________________________________________________________________
(b). In this investigation state,Dalam penyiasatan ini nyatakan,
(i). what is changed : ______________________________________________dimanipulasikan
(ii). what is observed : _______________________________________________bergerak balas
PlantTumbuhan
Condition of placeKeadaan tempat
Condition of plantsKeadaan tumbuhan
JDark
GelapDeadMati
KShadyTeduh
WiltedLayu
LBright
TerangHealthySegar
[Type text]Teknik menjawab science sjkt kangkar tebrau
Pn Chandra 2010
MV : Type of plant Jenis tumbuhan / pokok
RV : Condition of the plant Keadaan tumbuhan / pokok
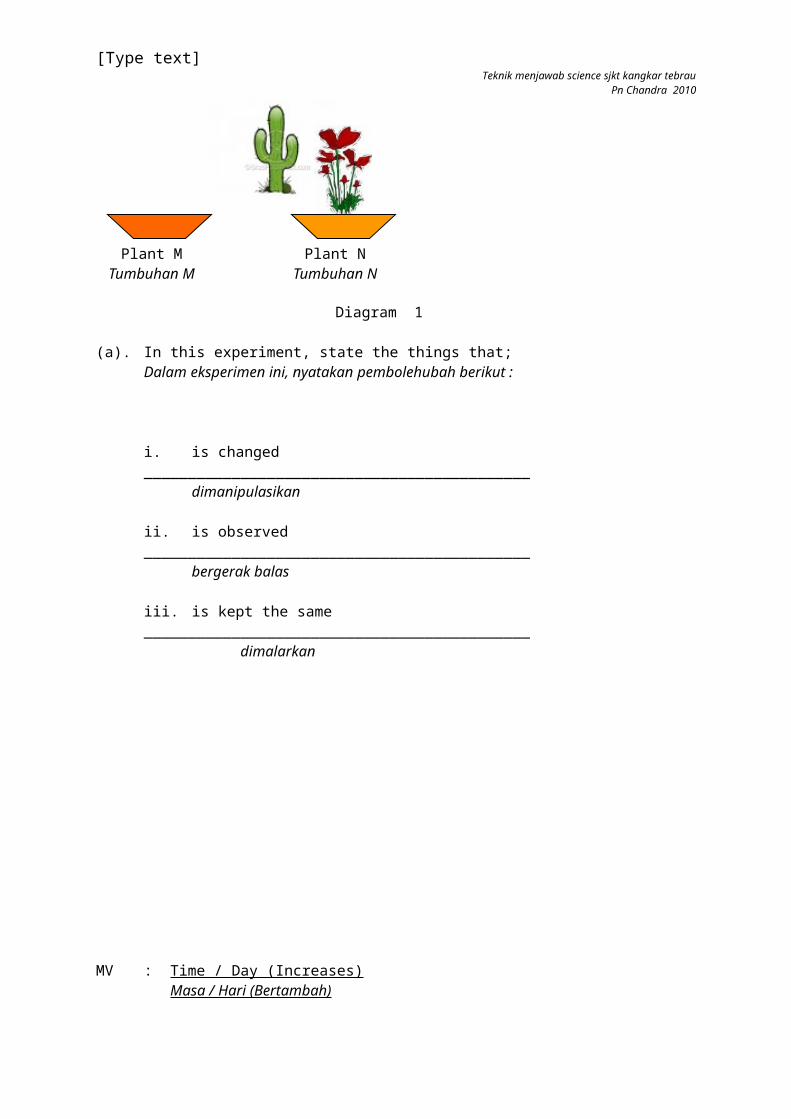
2. Diagram 1 shows two plants, M and N which are put in one place. Both plants are not given water for a week.Rajah 1 menunjukkan dua tumbuhan, M dan N yang diletakkan di satu tempat.Kedua-duanya tidak disiram air selama seminggu.
Diagram 1
(a). In this experiment, state the things that;Dalam eksperimen ini, nyatakan pembolehubah berikut :
i. is changed ____________________________________________
dimanipulasikan
ii. is observed ____________________________________________bergerak balas
iii. is kept the same ____________________________________________ dimalarkan
Plant MTumbuhan M
Plant NTumbuhan N
[Type text]Teknik menjawab science sjkt kangkar tebrau
Pn Chandra 2010
MV : Time / Day (Increases) Masa / Hari (Bertambah)
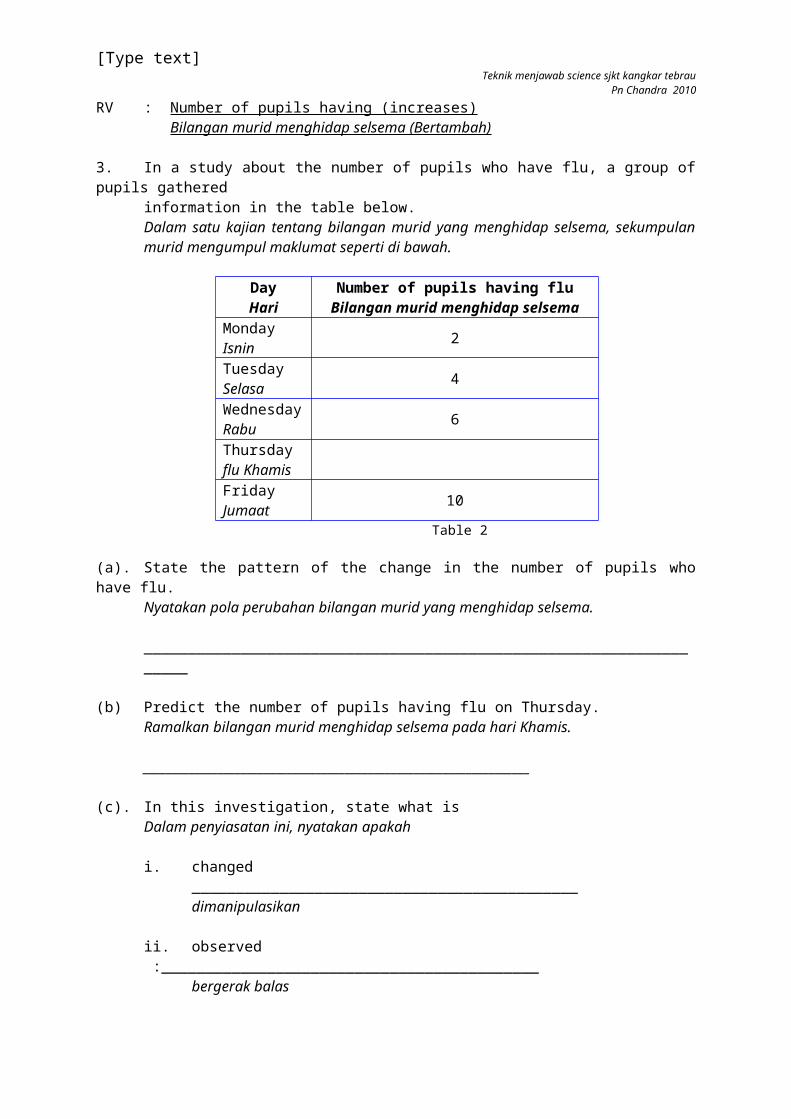
RV : Number of pupils having (increases) Bilangan murid menghidap selsema (Bertambah)
3. In a study about the number of pupils who have flu, a group of pupils gathered information in the table below.Dalam satu kajian tentang bilangan murid yang menghidap selsema, sekumpulan murid mengumpul maklumat seperti di bawah.
DayHari
Number of pupils having fluBilangan murid menghidap selsema
MondayIsnin
2
TuesdaySelasa
4
WednesdayRabu
6
Thursdayflu KhamisFridayJumaat
10
Table 2
(a). State the pattern of the change in the number of pupils who have flu.Nyatakan pola perubahan bilangan murid yang menghidap selsema.
___________________________________________________________________
(b) Predict the number of pupils having flu on Thursday.Ramalkan bilangan murid menghidap selsema pada hari Khamis.
___________________________________________________________________
(c). In this investigation, state what is Dalam penyiasatan ini, nyatakan apakah
i. changed ____________________________________________dimanipulasikan
ii. observed :___________________________________________bergerak balas
(d). What conclusion can be made from the study above?
Apakah kesimpulan yang boleh dibuat daripada kajian di atas?
If the ____________________ increases / decreases, the __________________
_____________________________increases / decreases
[Type text]Teknik menjawab science sjkt kangkar tebrau
Pn Chandra 2010
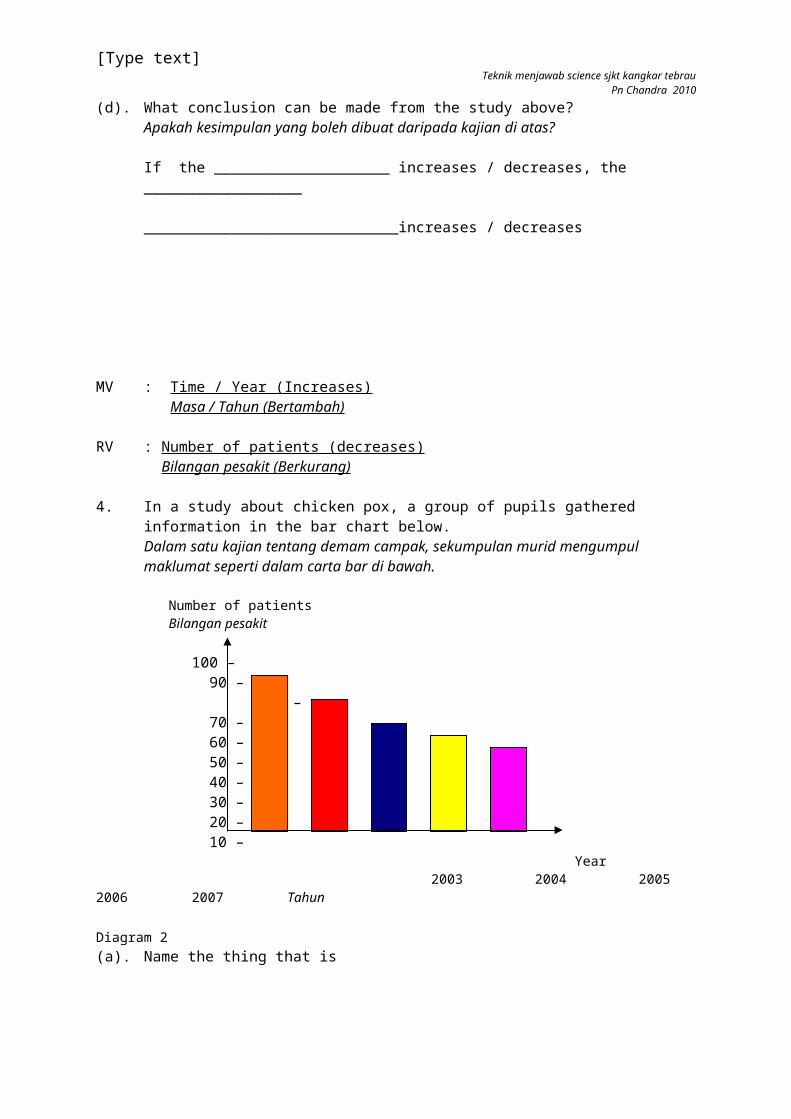
MV : Time / Year (Increases) Masa / Tahun (Bertambah)
RV : Number of patients (decreases) Bilangan pesakit (Berkurang)
4. In a study about chicken pox, a group of pupils gathered information in the bar chart below.Dalam satu kajian tentang demam campak, sekumpulan murid mengumpul maklumat seperti dalam carta bar di bawah.
Number of patients Bilangan pesakit
100 – 90 –
80 – 70 –
60 – 50 – 40 – 30 – 20 – 10 –
Year 2003 2004 2005 2006 2007 Tahun Diagram 2(a). Name the thing that is
i. changed : _________________________________________________dimanipulasikan
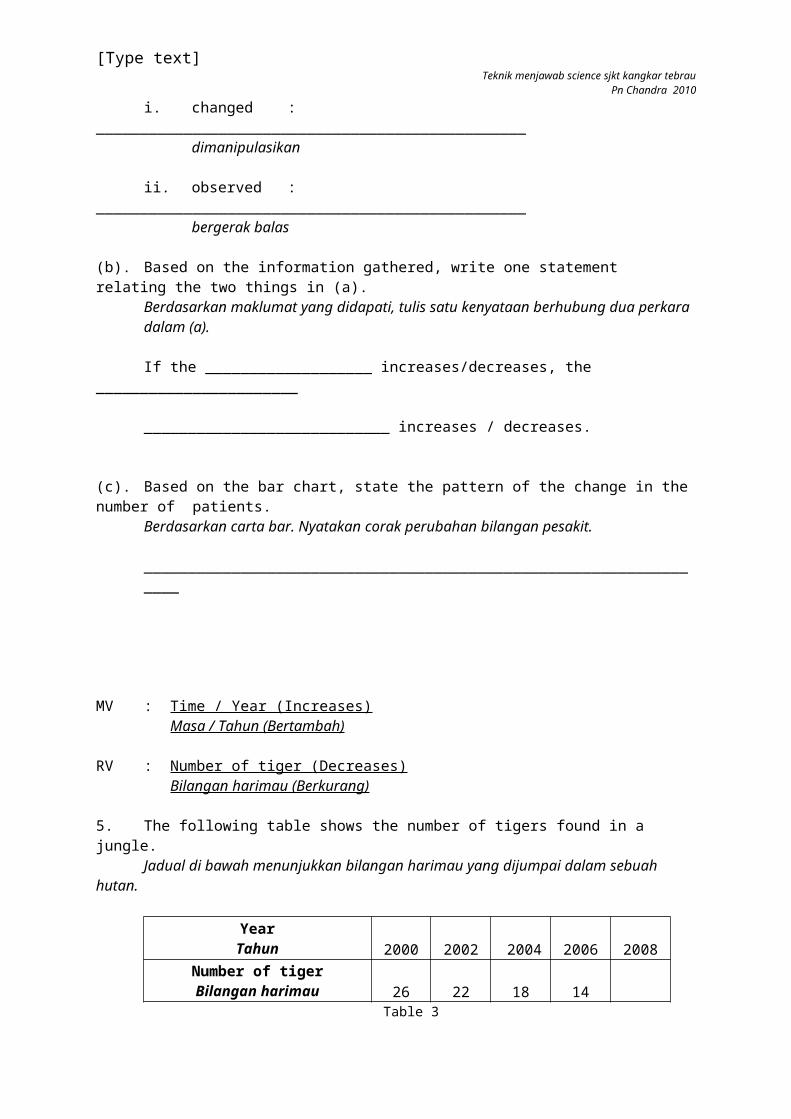
ii. observed : _________________________________________________ bergerak balas (b). Based on the information gathered, write one statement relating the two things in (a).
Berdasarkan maklumat yang didapati, tulis satu kenyataan berhubung dua perkara dalam (a).
If the ___________________ increases/decreases, the _______________________
____________________________ increases / decreases.
(c). Based on the bar chart, state the pattern of the change in the number of patients.Berdasarkan carta bar. Nyatakan corak perubahan bilangan pesakit.
__________________________________________________________________
[Type text]Teknik menjawab science sjkt kangkar tebrau
Pn Chandra 2010
MV : Time / Year (Increases) Masa / Tahun (Bertambah)
RV : Number of tiger (Decreases) Bilangan harimau (Berkurang)
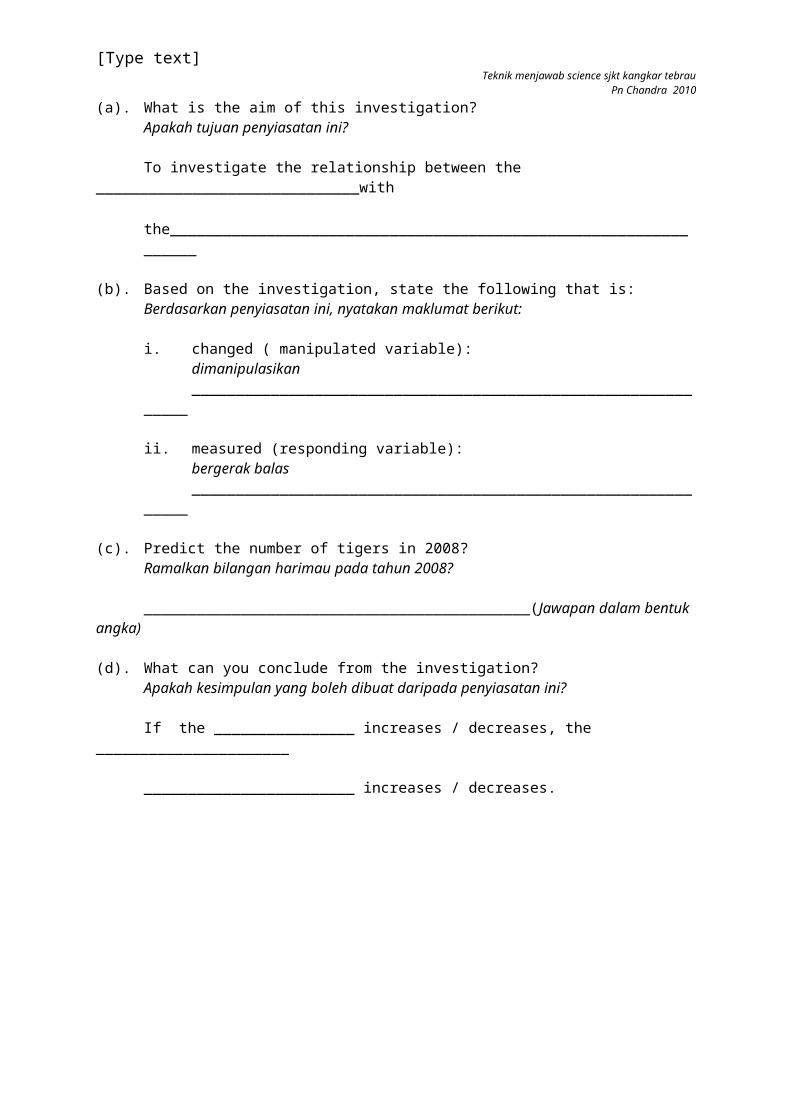
5. The following table shows the number of tigers found in a jungle.Jadual di bawah menunjukkan bilangan harimau yang dijumpai dalam sebuah hutan.
YearTahun 2000 2002 2004 2006 2008
Number of tigerBilangan harimau 26 22 18 14
Table 3(a). What is the aim of this investigation?
Apakah tujuan penyiasatan ini?
To investigate the relationship between the ______________________________with the_________________________________________________________________
(b). Based on the investigation, state the following that is:Berdasarkan penyiasatan ini, nyatakan maklumat berikut:
i. changed ( manipulated variable):dimanipulasikan______________________________________________________________
ii. measured (responding variable):bergerak balas______________________________________________________________
(c). Predict the number of tigers in 2008?
Ramalkan bilangan harimau pada tahun 2008?
____________________________________________(Jawapan dalam bentuk angka)
(d). What can you conclude from the investigation?Apakah kesimpulan yang boleh dibuat daripada penyiasatan ini?
If the ________________ increases / decreases, the ______________________
________________________ increases / decreases.
[Type text]Teknik menjawab science sjkt kangkar tebrau
Pn Chandra 2010
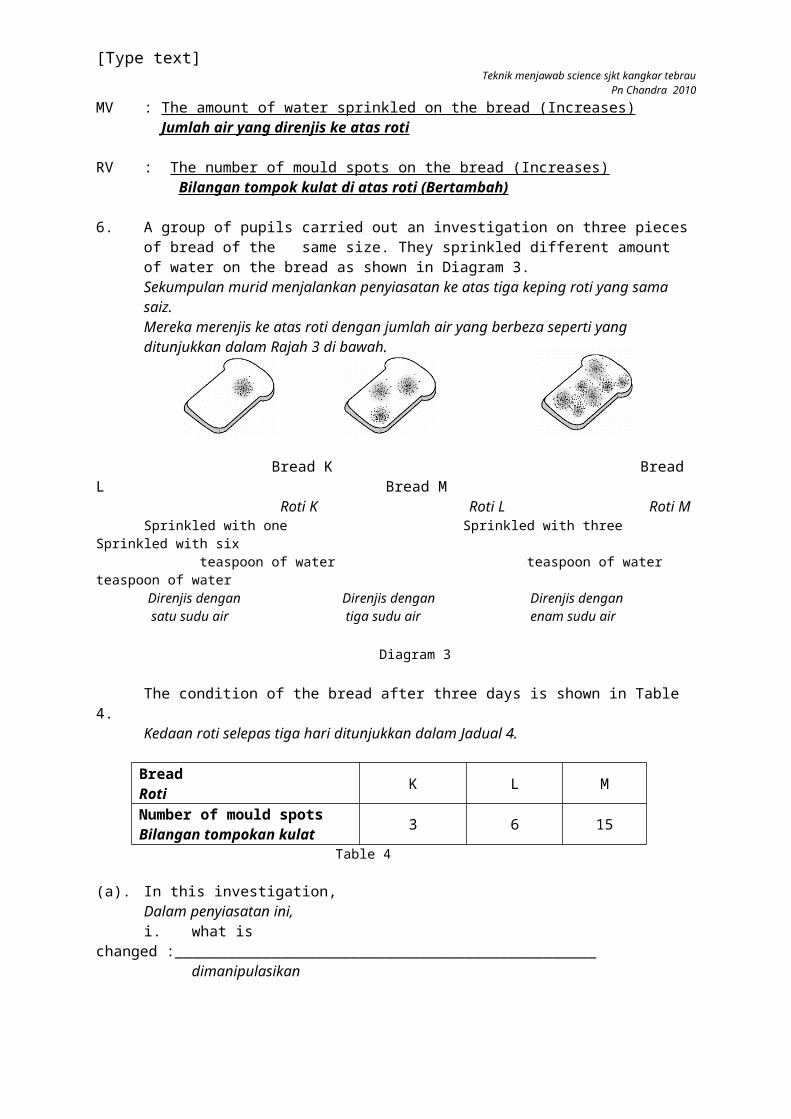
MV : The amount of water sprinkled on the bread (Increases) Jumlah air yang direnjis ke atas roti
RV : The number of mould spots on the bread (Increases) Bilangan tompok kulat di atas roti (Bertambah)
6. A group of pupils carried out an investigation on three pieces of bread of the same size. They sprinkled different amount of water on the bread as shown in Diagram 3.Sekumpulan murid menjalankan penyiasatan ke atas tiga keping roti yang sama saiz.Mereka merenjis ke atas roti dengan jumlah air yang berbeza seperti yang ditunjukkan dalam Rajah 3 di bawah.
Bread K Bread L Bread M Roti K Roti L Roti M
Sprinkled with one Sprinkled with three Sprinkled with six teaspoon of water teaspoon of water teaspoon of water Direnjis dengan Direnjis dengan Direnjis dengan satu sudu air tiga sudu air enam sudu air
Diagram 3
The condition of the bread after three days is shown in Table 4.Kedaan roti selepas tiga hari ditunjukkan dalam Jadual 4.
BreadRoti
K L M
Number of mould spotsBilangan tompokan kulat
3 6 15
Table 4
(a). In this investigation,Dalam penyiasatan ini,i. what is changed :________________________________________________
dimanipulasikan
ii. what is observed ________________________________________________bergerak balas
(b). What can you conclude from the investigation ?Apakah kesimpulan daripada penyiasatan ini ?
If the _____________________________________ increases / decreases, the
_____________________________________________ increases / decreases.
[Type text]Teknik menjawab science sjkt kangkar tebrau
Pn Chandra 2010
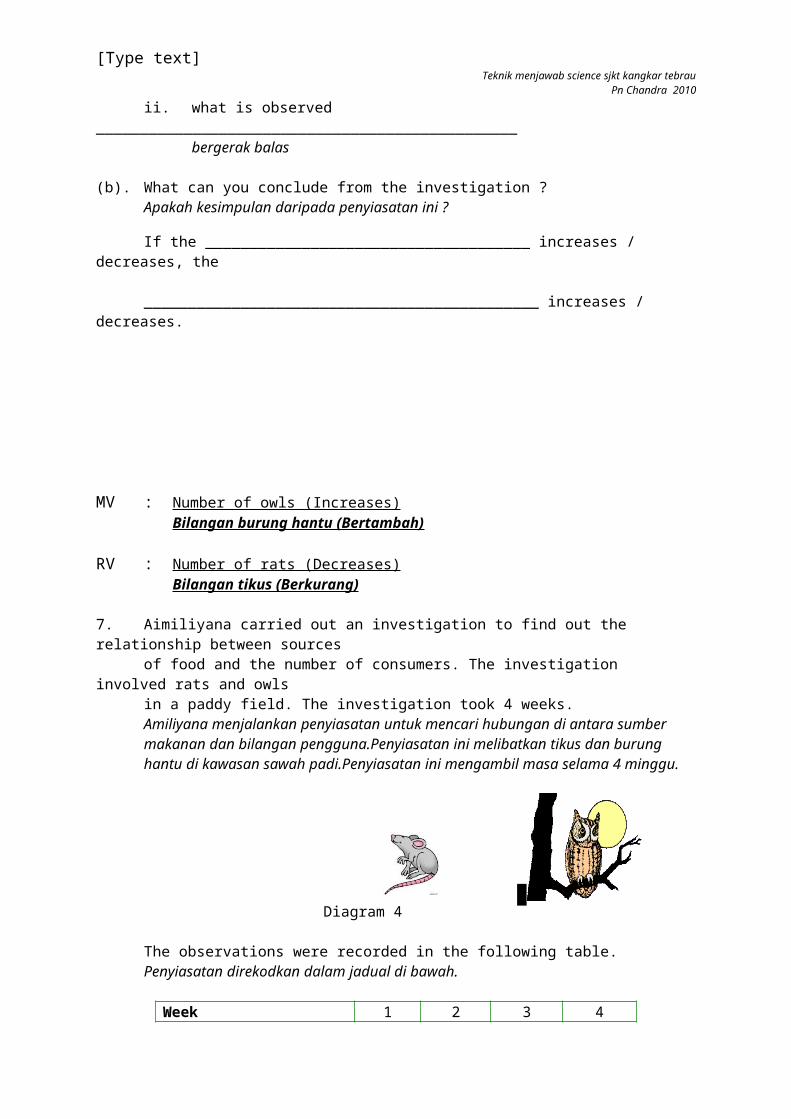
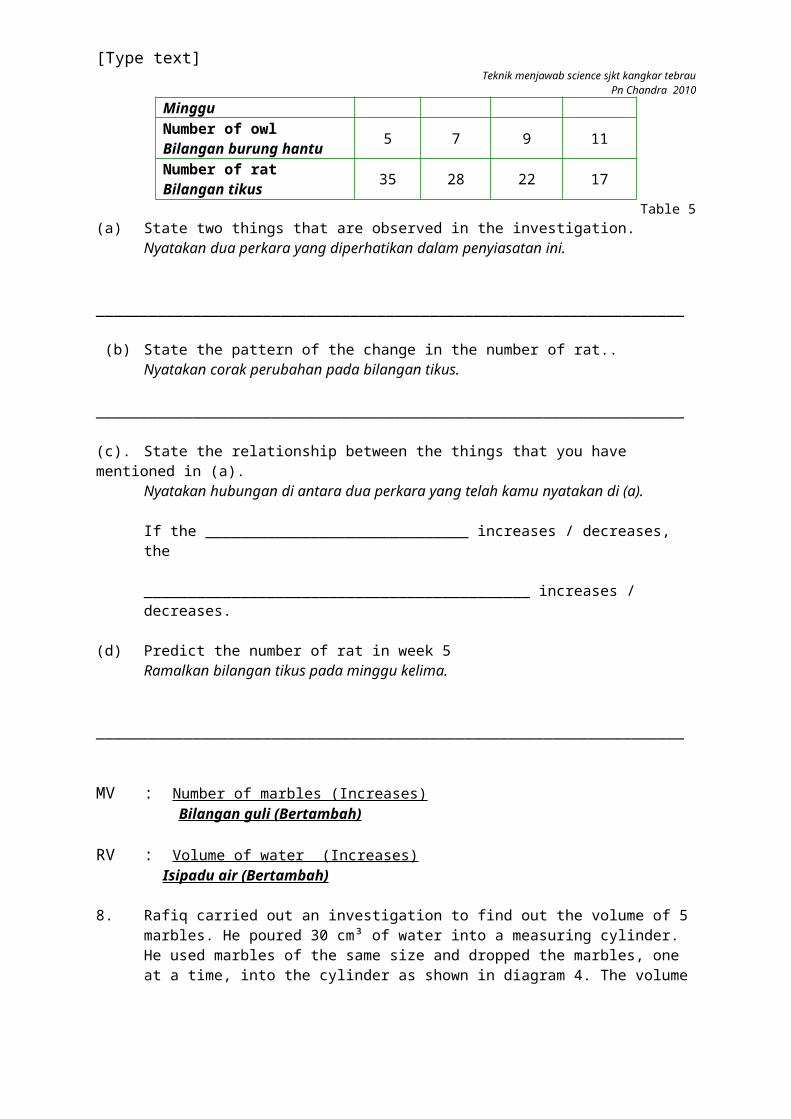
MV : Number of owls (Increases) Bilangan burung hantu (Bertambah)
RV : Number of rats (Decreases) Bilangan tikus (Berkurang)
7. Aimiliyana carried out an investigation to find out the relationship between sources of food and the number of consumers. The investigation involved rats and owls
in a paddy field. The investigation took 4 weeks.Amiliyana menjalankan penyiasatan untuk mencari hubungan di antara sumber makanan dan bilangan pengguna.Penyiasatan ini melibatkan tikus dan burung hantu di kawasan sawah padi.Penyiasatan ini mengambil masa selama 4 minggu.
Diagram 4
The observations were recorded in the following table.Penyiasatan direkodkan dalam jadual di bawah.
WeekMinggu
1 2 3 4
Number of owlBilangan burung hantu
5 7 9 11
Number of ratBilangan tikus 35 28 22 17
Table 5(a) State two things that are observed in the investigation.
Nyatakan dua perkara yang diperhatikan dalam penyiasatan ini.
___________________________________________________________________
(b) State the pattern of the change in the number of rat..Nyatakan corak perubahan pada bilangan tikus. ___________________________________________________________________
(c). State the relationship between the things that you have mentioned in (a).Nyatakan hubungan di antara dua perkara yang telah kamu nyatakan di (a).
If the ______________________________ increases / decreases, the
____________________________________________ increases / decreases.
(d) Predict the number of rat in week 5Ramalkan bilangan tikus pada minggu kelima.
___________________________________________________________________
[Type text]Teknik menjawab science sjkt kangkar tebrau
Pn Chandra 2010
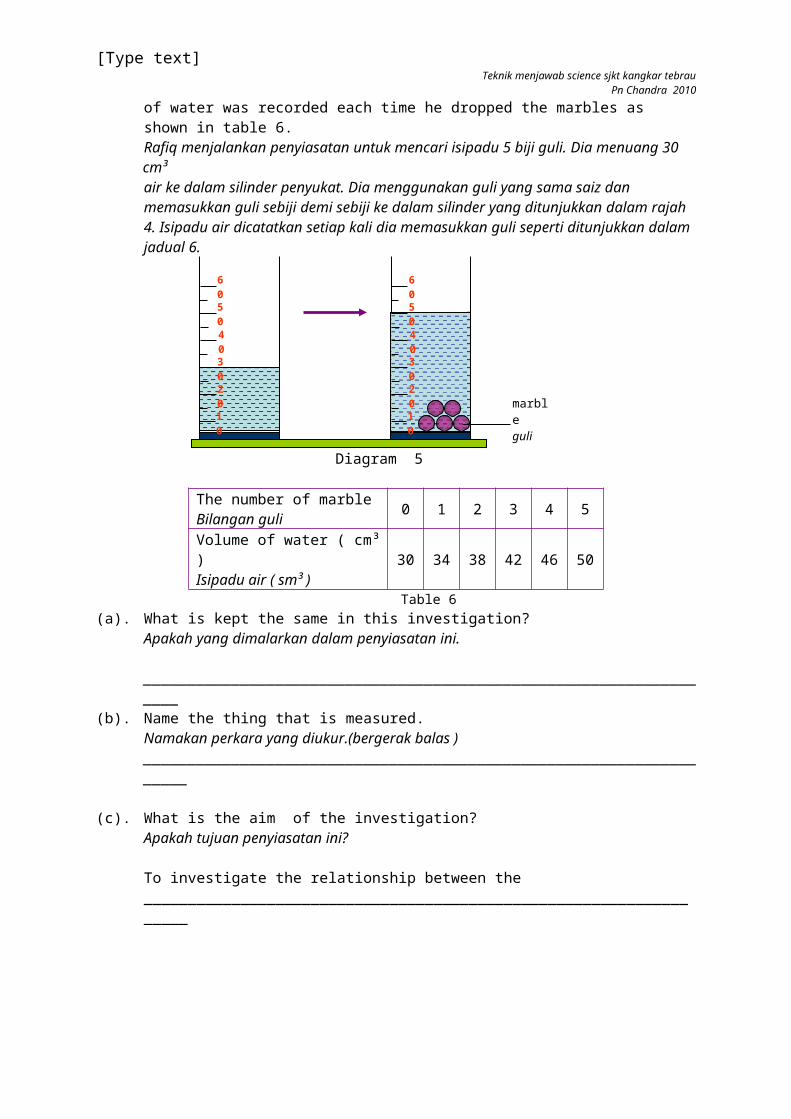
MV : Number of marbles (Increases) Bilangan guli (Bertambah)
RV : Volume of water (Increases) Isipadu air (Bertambah)
8. Rafiq carried out an investigation to find out the volume of 5 marbles. He poured 30 cm³ of water into a measuring cylinder. He used marbles of the same size and dropped the marbles, one at a time, into the cylinder as shown in diagram 4. The volume of water was recorded each time he dropped the marbles as shown in table 6.Rafiq menjalankan penyiasatan untuk mencari isipadu 5 biji guli. Dia menuang 30
cm³air ke dalam silinder penyukat. Dia menggunakan guli yang sama saiz dan memasukkan guli sebiji demi sebiji ke dalam silinder yang ditunjukkan dalam rajah 4. Isipadu air dicatatkan setiap kali dia memasukkan guli seperti ditunjukkan dalamjadual 6.
Diagram 5
The number of marbleBilangan guli
0 1 2 3 4 5
Volume of water ( cm³ )Isipadu air ( sm³ )
30 34 38 42 46 50
Table 6(a). What is kept the same in this investigation?
Apakah yang dimalarkan dalam penyiasatan ini.
___________________________________________________________________
(b). Name the thing that is measured.Namakan perkara yang diukur.(bergerak balas )____________________________________________________________________
(c). What is the aim of the investigation?Apakah tujuan penyiasatan ini?
To investigate the relationship between the ___________________________________________________________________
10
20
30
40
50
60
10
20
30
40
50
60
marbleguli
[Type text]Teknik menjawab science sjkt kangkar tebrau
Pn Chandra 2010
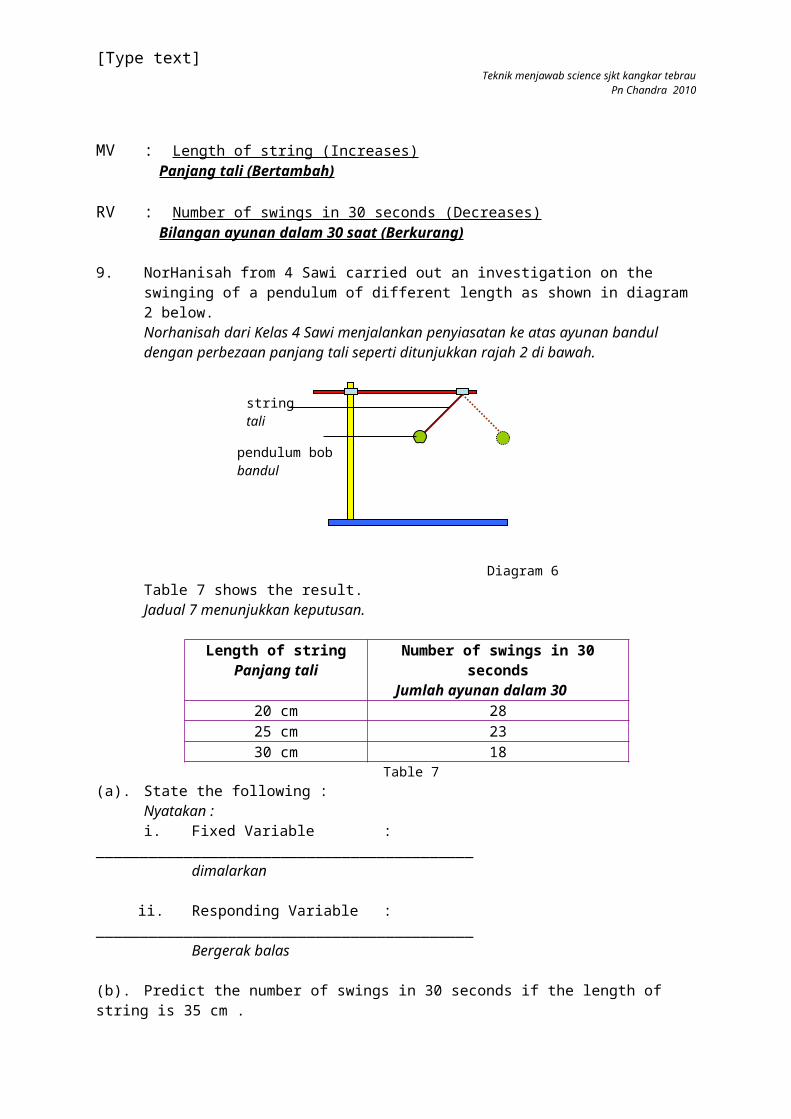
MV : Length of string (Increases) Panjang tali (Bertambah)
RV : Number of swings in 30 seconds (Decreases) Bilangan ayunan dalam 30 saat (Berkurang)
9. NorHanisah from 4 Sawi carried out an investigation on the swinging of a pendulum of different length as shown in diagram 2 below.Norhanisah dari Kelas 4 Sawi menjalankan penyiasatan ke atas ayunan bandul dengan perbezaan panjang tali seperti ditunjukkan rajah 2 di bawah.
Diagram 6Table 7 shows the result.Jadual 7 menunjukkan keputusan.
Length of stringPanjang tali
Number of swings in 30 secondsJumlah ayunan dalam 30 saat
20 cm 2825 cm 2330 cm 18
Table 7(a). State the following :
Nyatakan :i. Fixed Variable : ___________________________________________
dimalarkan
ii. Responding Variable : ___________________________________________Bergerak balas
(b). Predict the number of swings in 30 seconds if the length of string is 35 cm .
Ramalkan jumlah ayunan dalam 30 saat jika panjang talinya 35 sm.___________________________________________________________________
(c). State the hypothesis in this investigation.
Nyatakan hipotesis dalam penyiasatan ini.
If the ___________________________________________ increases / decreases, the
_______________________________________________ increases / decreases.
stringtali
pendulum bobbandul
[Type text]Teknik menjawab science sjkt kangkar tebrau
Pn Chandra 2010
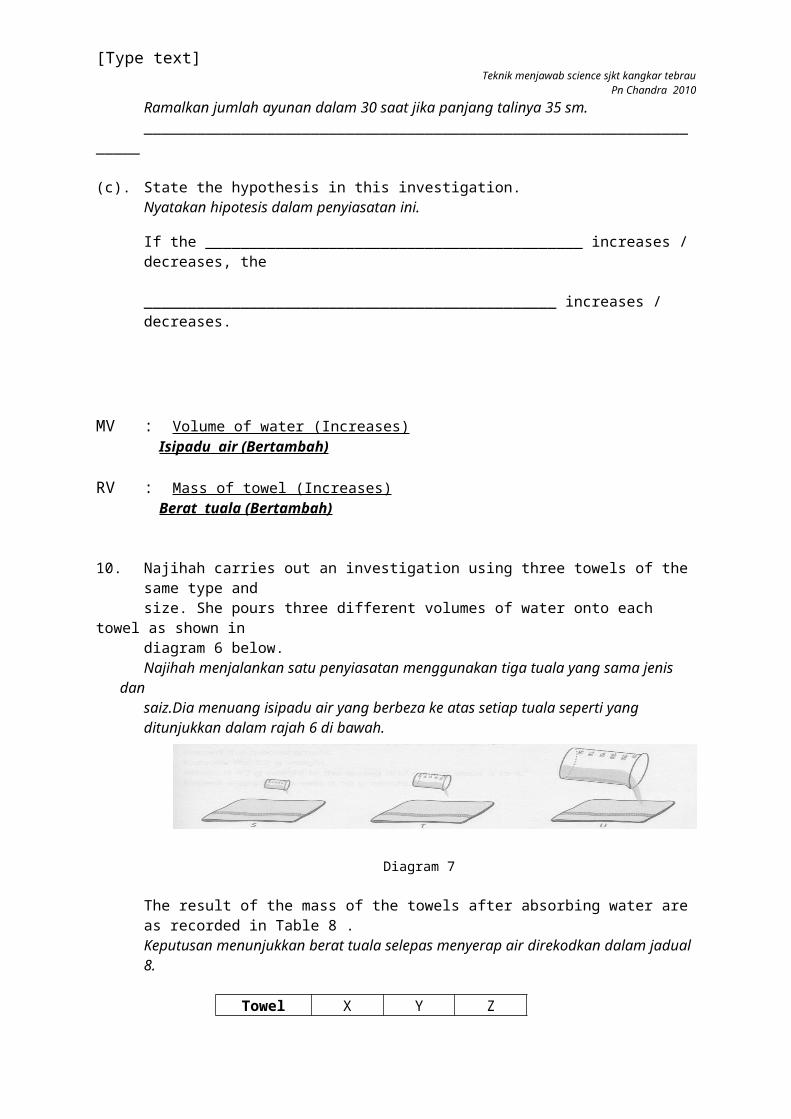
MV : Volume of water (Increases) Isipadu air (Bertambah)
RV : Mass of towel (Increases) Berat tuala (Bertambah)
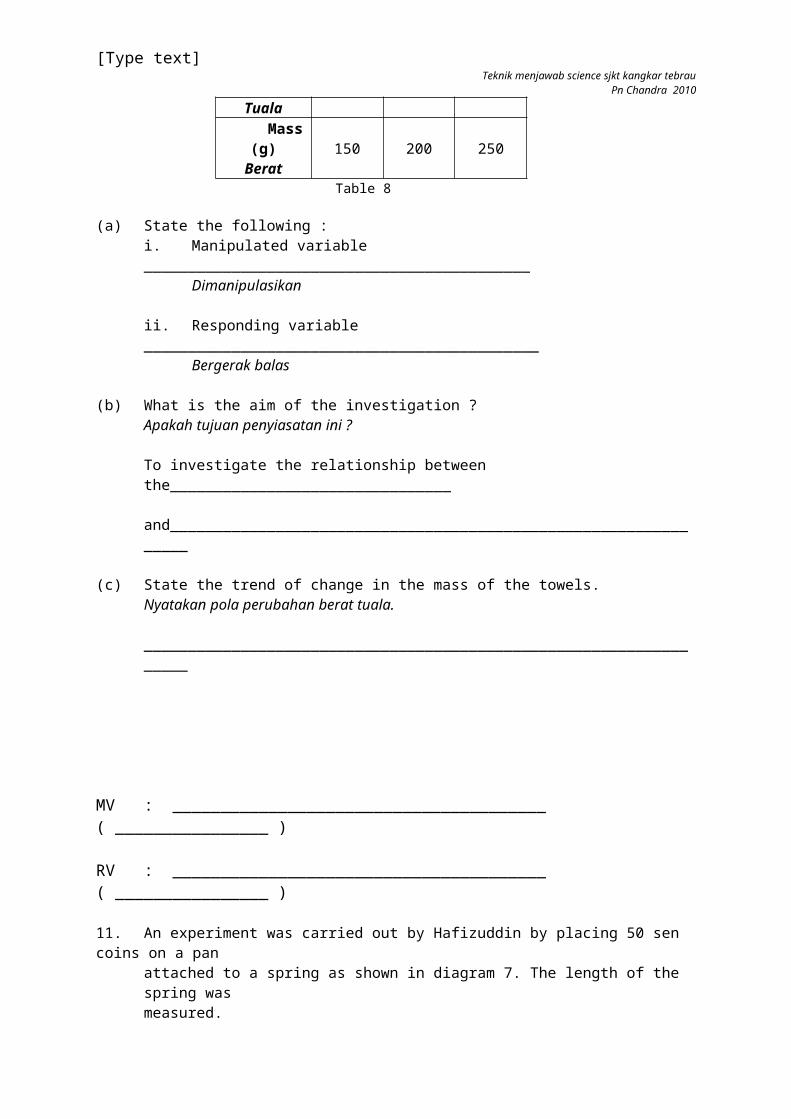
10. Najihah carries out an investigation using three towels of the same type and size. She pours three different volumes of water onto each towel as shown in diagram 6 below.Najihah menjalankan satu penyiasatan menggunakan tiga tuala yang sama jenis dan saiz.Dia menuang isipadu air yang berbeza ke atas setiap tuala seperti yang ditunjukkan dalam rajah 6 di bawah.
Diagram 7
The result of the mass of the towels after absorbing water are as recorded in Table 8 .Keputusan menunjukkan berat tuala selepas menyerap air direkodkan dalam jadual 8.
TowelTuala
X Y Z
Mass (g)Berat
150 200 250
Table 8
(a) State the following : i. Manipulated variable ____________________________________________
Dimanipulasikan
ii. Responding variable _____________________________________________ Bergerak balas
(b) What is the aim of the investigation ?Apakah tujuan penyiasatan ini ?
To investigate the relationship between the________________________________
and________________________________________________________________
(c) State the trend of change in the mass of the towels.Nyatakan pola perubahan berat tuala.
___________________________________________________________________
springspring
50 sen coinsyiling 50 sen
[Type text]Teknik menjawab science sjkt kangkar tebrau
Pn Chandra 2010
MV : _______________________________________ ( ________________ )
RV : _______________________________________ ( ________________ )
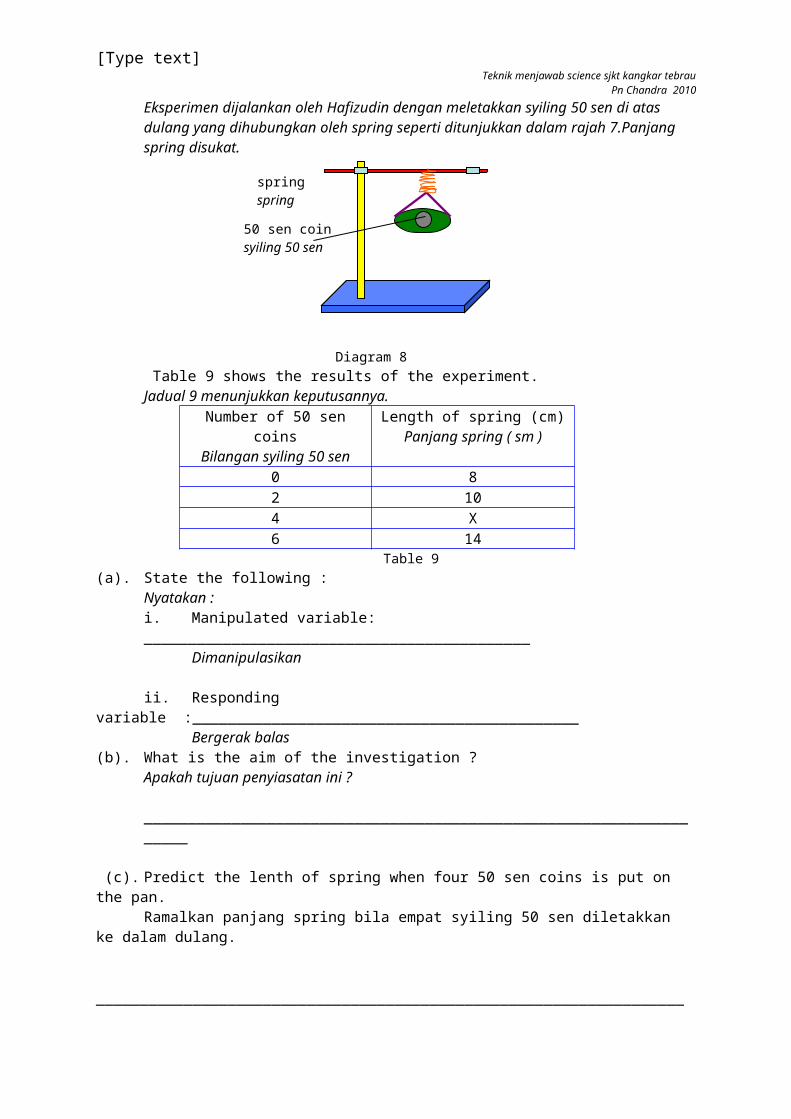
11. An experiment was carried out by Hafizuddin by placing 50 sen coins on a pan attached to a spring as shown in diagram 7. The length of the spring was measured.Eksperimen dijalankan oleh Hafizudin dengan meletakkan syiling 50 sen di atas dulang yang dihubungkan oleh spring seperti ditunjukkan dalam rajah 7.Panjang spring disukat.
Diagram 8 Table 9 shows the results of the experiment.Jadual 9 menunjukkan keputusannya.
Number of 50 sen coinsBilangan syiling 50 sen
Length of spring (cm)Panjang spring ( sm )
0 82 104 X6 14
Table 9(a). State the following :
Nyatakan :i. Manipulated variable: ____________________________________________
Dimanipulasikan
ii. Responding variable :____________________________________________ Bergerak balas
(b). What is the aim of the investigation ?Apakah tujuan penyiasatan ini ?
___________________________________________________________________
(c). Predict the lenth of spring when four 50 sen coins is put on the pan.Ramalkan panjang spring bila empat syiling 50 sen diletakkan ke dalam dulang.
___________________________________________________________________
(d). State the trend of change in the length of the spring.Nyatakan pola perubahan pemanjangan spring.
___________________________________________________________________
ThermometerTermometer
TowelTuala
X YDiagram 9
[Type text]Teknik menjawab science sjkt kangkar tebrau
Pn Chandra 2010
MV : _______________________________________ ( ________________ )
RV : _______________________________________ ( ________________ )
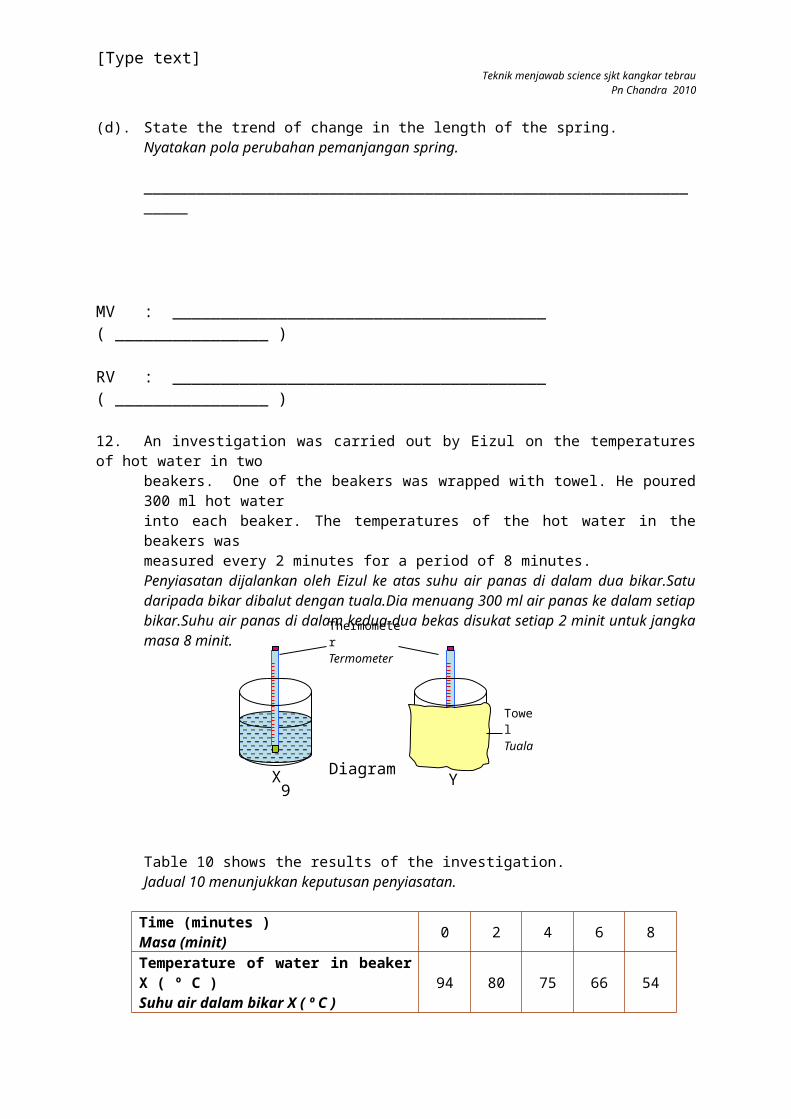
12. An investigation was carried out by Eizul on the temperatures of hot water in two beakers. One of the beakers was wrapped with towel. He poured 300 ml hot water into each beaker. The temperatures of the hot water in the beakers was measured every 2 minutes for a period of 8 minutes.Penyiasatan dijalankan oleh Eizul ke atas suhu air panas di dalam dua bikar.Satu daripada bikar dibalut dengan tuala.Dia menuang 300 ml air panas ke dalam setiap bikar.Suhu air panas di dalam kedua-dua bekas disukat setiap 2 minit untuk jangka masa 8 minit.
Table 10 shows the results of the investigation.Jadual 10 menunjukkan keputusan penyiasatan.
Time (minutes )Masa (minit)
0 2 4 6 8
Temperature of water in beaker X ( º C )Suhu air dalam bikar X ( º C )
94 80 75 66 54
Temperature of water in beaker Y ( º C )Suhu air dalam bikar Y ( º C )
94 90 86 82 78
Table 10
(a) State the following :Nyatakani. Fixed variable : ___________________________________________
Dimalarkan
ii. Manipulated variable : ___________________________________________ Dimanipulasikan
iii. Responding variable ____________________________________________ Bergerak balas
(b). State the hypothesis for this investigation.Nyatakan hipotesis untuk penyiasatan ini.
__________________________________________________________________
[Type text]Teknik menjawab science sjkt kangkar tebrau
Pn Chandra 2010
MV : ________________________________________________
RV : ________________________________________________
13. An investigation was carried out by Puan Hidayah to find out the ability of material to absorb water. Three types of materials were placed in trays A, B and C respectively as shown in diagram below. After 2 minutes , the materials were removed from the trays. The remaining water in each tray was poured into a measuring cylinder.Satu penyiasatan dijalankan oleh Puan Hidayah mencari keupayaan bahan untuk menyerap air.Tiga jenis bahan diletakkan dalam dulang masing-masing A,B dan C seperti yang ditunjukkan dalam rajah di bawah.Selepas 2 minit,bahan itu dikeluarkan daripada dulang.Baki air dalam setiap dulang dituang ke dalam silinder penyukat.
Diagram 10
(a). State the following :
Nyatakan
i. Manipulated variable ____________________________________________Dimanipulasikan
ii. Responding variable ____________________________________________Bergerak balsas
iii. Fixed variables ____________________________________________Dimalarkan
(b). What is the aim of the investigation ?Apakah tujuan penyiasatan ini ?
___________________________________________________________________
DiaperKain lampin
RagKain buruk
PaperKertas
[Type text]Teknik menjawab science sjkt kangkar tebrau
Pn Chandra 2010
MV : ________________________________________________
RV : ________________________________________________
14. Mohd Faiz from 4 Mawar conducted an investigation using the apparatus set up as shown in diagram 10 . Three objects are placed into the hot water at the same time. Mohd Faiz dari 4 Mawar menjalankan penyiasatan menggunakan peralatan yang disediakan seperti ditunjukkan dalam rajah 10.Tiga objek diletakkan ke dalam air panas pada waktu yang sama.
Diagram 11
He touches the objects from time to time and record the findings as below.Dia menyentuh objek dari masa ke semasa dan mencatat penemuannya seperti di bawah.
Type of objectsJenis objek
Metal rulerPembaris logam
Glass rodRod kaca
Plastic spoonSudu plastik
Conductivity of heat
Mengalirkan haba
Fastest to become hotPaling cepat panas
Faster to become hotCepat panas
Slowest to become hotLambat panas
Table 11
(a). State the following :Nyatakan
i. Fixed variable :____________________________________________Dimalarkan
ii. Manipulated variable ____________________________________________Dimanipulasikan
(b). What is the aim of the investigation ?Apakah tujuan penyiasatan ini ?
___________________________________________________________________
___________________________________________________________________
airpanas
airpanas
airpanas
pembaris logam
rod kaca
suduplastik
[Type text]Teknik menjawab science sjkt kangkar tebrau
Pn Chandra 2010
MV : _______________________________________ ( ________________ )
RV : _______________________________________ ( ________________ )
15. Table 11 shows the positions of four planets and the time taken to orbit the sun.Jadual 11 menunjukkan kedudukan empat planet dan masa yang diambil untuk mengelilingi matahari.
PlanetPlanet
Position from the sunKedudukan dari matahari
Time taken to orbit the sunMasa diambil untuk
mengelilingi matahariEarthBumi
ThirdKetiga
365 ¼ days365¼ hari
MarsMarikh
FourthKeempat
687 days687 hari
JupiterMusytari
FifthKelima
12 years12 tahun
NeptuneNeptun
EighthKelapan
165 years165 tahun
Table 12 (a). What is kept the same in this investigation.
Apakah yang dimalarkan dalam penyiasatan ini.
___________________________________________________________________
(b). What is the trend of change in time taken for the planets to orbit the sun ?
Apakah pola perubahan masa diambil bagi planet-planet mengelilingi matahari ?
___________________________________________________________________
(c) State the relationship between the distance of a planet from the sun and the time taken to orbit the sun.
Nyatakan hubungan di antara jarak planet dari matahari dan masa yang diambil untuk mengelilingi matahari.
___________________________________________________________________
___________________________________________________________________
[Type text]Teknik menjawab science sjkt kangkar tebrau
Pn Chandra 2010
MV : _______________________________________ ( ________________ )
RV : _______________________________________ ( ________________ )
16. The following Table 12 shows data gathered by a group of pupils from SK Kota Setia. Jadual 12 menunjukkan data yang didapati oleh sekumpulan murid daripada SK Kota Setia.
PlanetPlanet
Distance from the Sun (million km)
Jarak dari Matahari(juta km)
Time taken to make one complete orbit around the
Sun (year)Masa diambil untuk
membuat satu pusingan mengelilingi
Matahari(tahun)R 150 1S 780 12T 1430 30U 2870 84V 4500 165
Table 12
(a). What is the aim of the investigation ?Apakah tujuan penyiasatan ini ?
__________________________________________________________________
___________________________________________________________________
(b). What is the trend for the time taken to make one complete orbit around the Sun ?Apakah pola masa diambil untuk membuat satu pusingan mengelilingi Matahari ? ___________________________________________________________________
(c). State the relationship between the distance from the Sun and the time taken to make one complete orbit around the Sun.Nyatakan hubungan di antara jarak dari Matahari dengan masa diambil untuk membuat satu pusingan mengelilingi Matahari.
___________________________________________________________________
(d) Planet P takes 6 years to make one complete orbit around the Sun.Predict the position of planet P.Planet P mengambil masa 6 tahun untuk membuat satu pusingan mengelilingi Matahari.Ramalkan kedudukan planet P.
___________________________________________________________________
[Type text]Teknik menjawab science sjkt kangkar tebrau
Pn Chandra 2010
MV : _______________________________________ ( ________________ )
RV : _______________________________________ ( ________________ )
17. Diagram 11 shows the positions of three planets from the Sun.Rajah 11 menunjukkan kedudukan tiga planet dari Matahari.
Diagram 12
Table 13 shows the period for one complete orbit of the planets around the Sun.Jadual 13 menunjukkan tempoh masa planet untuk mengelilingi Matahari.
PlanetPlanet
Period for one complete orbit (years)Tempoh masa melengkapkan satu pusingan(tahun)
X 2Y 12Z 84
Table 13
(a). What is the aim of the investigation ?Nyatakan tujuan penyiasatan ini?
____________________________________________________________________
(b). What is the relationship between the position of the planet and the period for one
complete orbit of the planet round the Sun?Apakah hubungan di antara kedudukan planet dengan tempoh masa planet untuk melengkapkan satu pusingan?
___________________________________________________________________
(c). Planet S takes 76 years to make one complete orbit around the Sun. Predict the position of planet S.Planet S mengambil masa 76 tahun untuk membuat satu pusingan lengkap mengelilingi Matahari. Ramalkan kedudukan Planet S.
_____________________________________________________________________
MV : _______________________________________ ( ________________ )
SunMatahari
ZY
X
[Type text]Teknik menjawab science sjkt kangkar tebrau
Pn Chandra 2010
RV : _______________________________________ ( ________________ )
18. Table 14 shows the average surface temperature of each planet in the Solar System. Jadual 14 menunjukkan purata suhu permukaan setiap planet di dalam Sistem Solar.
PlanetPlanet
Average surface temperature of planet ( º C )Purata suhu permukaan planet ( °C )
MercuryUtarid
440
VenusZuhrah
430
EarthBumi
22
MarsMarikh
-23
JupiterMusytari
-150
SaturnZuhal
-180
UranusUranus
-210
NeptuneNeptun
-211
PlutoPluto
-230
Table 14
(a). What is the aim of the investigation ?Apakah tujuan penyiasatan ini?
__________________________________________________________________
(b). What is the trend of the average surface temperature of planets from Mercury to Pluto ?
Apakah pola purata suhu permukaan planet daripada Marikh ke Pluto?
____________________________________________________________________
(c). State the hypothesis of this investigation.Nyatakan hipotesis dari penyiasatan ini.
___________________________________________________________________