Embed Size (px)
Citation preview
Molecular Phylogenetics and Evolution 68 (2013) 119–134
Contents lists available at SciVerse ScienceDi rect
Molec ular Phylo genetics and Evolution
journal homepage: www.elsevier .com/ locate /ympev
Sequence-based molecular phylogenetics and phylogeography of the American box turtles (Terrapene spp.) with support from DNA barcoding
Bradley T. Martin a,⇑, Neil P. Bernstein b, Roger D. Birkhead c, Jim F. Koukl a, Steven M. Mussmann d,John S. Placyk Jr. a
a Department of Biology, The University of Texas at Tyler, Tyler, TX 75799, USA b Deptartment of Natural and Applied Sciences, Mount Mercy University, Cedar Rapids, IA 52402, USA c Alabama Science in Motion, Auburn University, Auburn, AL 36849, USA d Department of Biological Sciences, University of Arkansas, Fayetteville, AR 72701, USA
a r t i c l e i n f o a b s t r a c t
Article history:Received 31 December 2012 Accepted 8 March 2013 Available online 20 March 2013
Keywords:Box turtle DNA barcoding Molecular phylogenetics PhylogeographyTerrapeneEmydidae
1055-7903/$ - see front matter � 2013 Elsevier Inc. Ahttp://dx.doi.org/10.1016/j.ympev.2013.03.006
⇑ Corresponding author. Present address: DepartmeUniversity of Arkansas, Fayetteville, AR 72701, USA. F
E-mail addresses: [email protected], bMartin).
The classification of the American box turtles (Terrapene spp.) has remained enigmatic to systematis ts.Previous comp rehensive phylogenetic studies focused primarily on morphology. The goal of this study was to re-assess the classification of Terrapene spp. by obtaining DNA sequence data from a broad geo- graphic range and from all four recogni zed species and 11 subspecies within the genus. Tissue samples were obtained for all taxa except for Terrapene nelsoni klauberi . DNA was extracted, and the mitochondrial DNA (mtDNA) cytochrome b (Cytb) and nuclear DNA (nucDNA) glyceraldehyde-3-phosph ate-dehydrogenase (GAPD) genes were amplified via polymera se chain reaction and sequenced. In addition, the mtDNA gene commonly used for DNA barcoding (cytochrome oxidase c subunit I; COI) was amplified and sequenced tocalculate pairwise percent DNA sequence divergen ce compariso ns for each Terrapene taxon. The sequence data were analyzed using maximum likelihood and Bayesian phylogenetic inference, a molecular clock,AMOVAs, SAMOVAs, haplotype networks, and pairwise percent sequence divergence comparisons. Terra-pene carolina mexicana and T. c. yucatana formed a monophyletic clade with T. c. triunguis , and this clade was paraphyletic to the rest of T. carolina . Terrapene ornata ornata and T. o. luteola lacked distinction phy- logenetically, and Terrapene nelsoni was confirmed to be the sister taxon of T. ornata . Terrapene c. major , T.c. bauri , and Terrapene coahuila were not well resolved for some of the analyses. The DNA barcoding results indicated that all taxa were different species (>2% sequence divergence) except for T. c. triunguis – T. c. mexicana and T. o. ornata – T. o. luteola . The results suggest that T. c. triunguis should be elevated tospecies status (Terrapene mexicana ), and mexicana and yucatana should be included in this group as sub- species. In addition, T. o. ornat a and T. o. luteo la should not be considered separat e subspecies. The DNA barcoding data support these recommended taxonomic revisions. Because conservation efforts are typi- cally species-based, these results will be important for facilitating suc cessful conservation management strategies.
� 2013 Elsevier Inc. All rights reserved.
1. Introduction
The American box turtle genus, Terrapene (Chelonia, Emydidae),includes four primarily terrestrial New World species, the eastern (T. carolina ; Linnaeus, 1758 ), ornate (T. ornata ; Agassiz, 1857 ), spot- ted (T. nelsoni ; Stejneger, 1925 ), and Coahuilan (T. coahuila ;Schmidt and Owens, 1944 ) box turtles, characteri zed, in part, bytheir ability to tightly close their plastron via a single moveable hinge (plastral shell kinesis). With the exception of T. coahuila , each species is further divided into multiple subspecies including the
ll rights reserved.
nt of Biological Sciences, The ax: +1 903 723 [email protected] (B.T.
eastern (T. c. carolina ), three-toed (T. c. triunguis ), Mexican (T. c.mexicana), Yucatan (T. c. yucatana ), Gulf Coast (T. c. major ), Florida (T. c. bauri ), and the purported ly extinct giant (T. c. putnami ) box turtles for T. carolina ; the ornate (T. o. ornata ) and desert (T. o. lut- eola) box turtles for T. ornata ; and the northern spotted (T. n. klau- beri) and southern spotted (T. n. nelsoni ) box turtles for T. nelsoni .While their current classification is generally accepted based onmorphological data and geographi c distribution s, the use of molec- ular data in understand ing the evolutionary history of the group has been limited, as the systematic studies that have included Ter-rapene have (1) focused on higher level intergeneric classification,(2) failed to include all taxa within Terrapene (e.g., all species and subspecies ), or (3) been limited in sample sizes and/or geographic sampling (Bickham et al., 1996; Butler et al., 2011; Feldman and
120 B.T. Martin et al. / Molecular Phylogenetics and Evolution 68 (2013) 119–134
Parham, 2002; Herrmann and Rosen, 2009; Spinks and Shaffer,2009; Stephens and Wiens, 2003; Wiens et al., 2010 ). When Terra-pene has been the focus of more detailed molecular taxonomic scrutiny, issues inherent in the genus have been problematic. Fur- thermore, although the importance of using morphological data inphylogeneti c analyses has recently been emphasized (Losos et al.,2012), issues specific to Terrapene have also complicated the use of morphology for assessing their classification.
First, paraphyly within Terrapene carolina has made phyloge- netic inference of this species particularly problematic with Ste-phens and Wiens (2003) stating that T. carolina ‘‘might also consist of multiple species.’’ Second, a significant amount of inter- and intraspecific morphological variation along with the overlap ofcharacters has made phylogeneti c inference based on morphology,which is what the current classification is based on (e.g., Minx,1996), less than useful. Third, intergradation between sympatric taxa imposes significant difficulties in resolving specific and sub- specific relationship s (Butler et al., 2011; Carr, 1940, 1952; Conant and Collins, 1991; Milstead, 1969 ). Therefore, a more thorough molecular phylogenetic investiga tion is warranted to resolve these issues and to assess the validity of the current classification. The lack of such information is compounded by the problematic con- servation status of members of this genus.
Terrapene populations are declining throughout their range, inpart, due to habitat loss resulting from increasing urbanization,collection from the wild for the pet trade, and changes in predator pressures (Dodd, 2001 ). The 2011 Internationa l Union for Conser- vation of Nature (IUCN) Red List classifies T. carolina as Vulnerabl e,T. ornata as Near Threatened, T. coahuila as Endangered with a Very High Risk of Extinction, and T. nelsoni as Data Deficient (although it
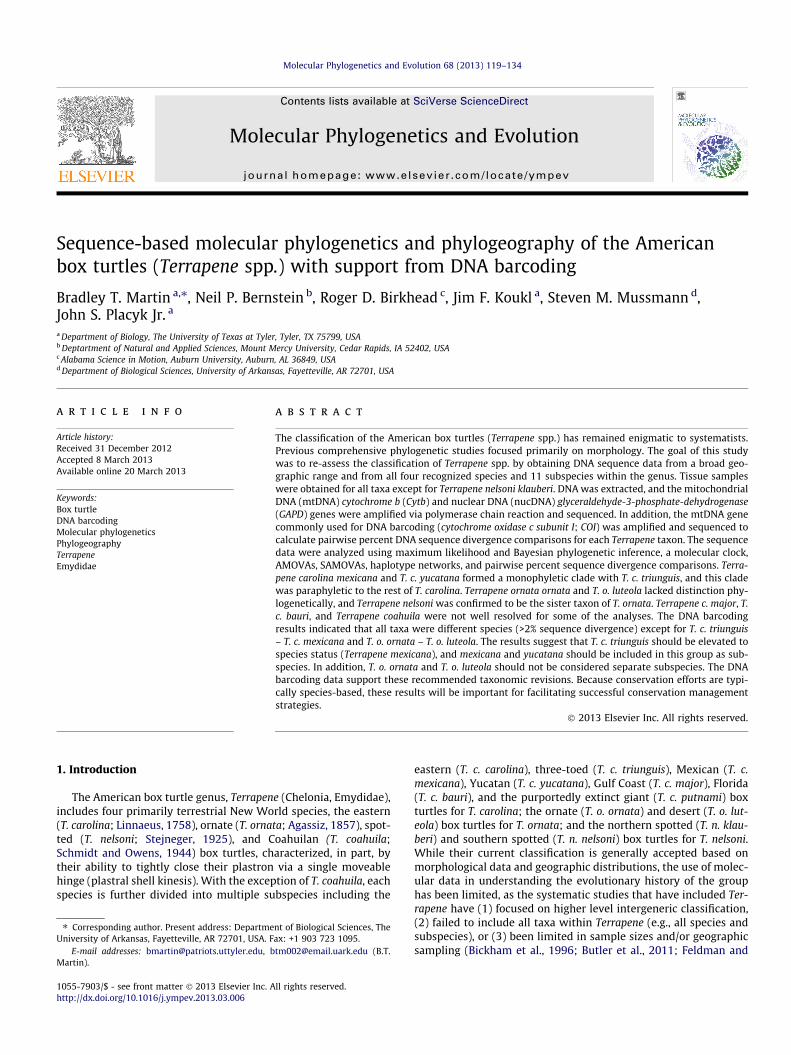
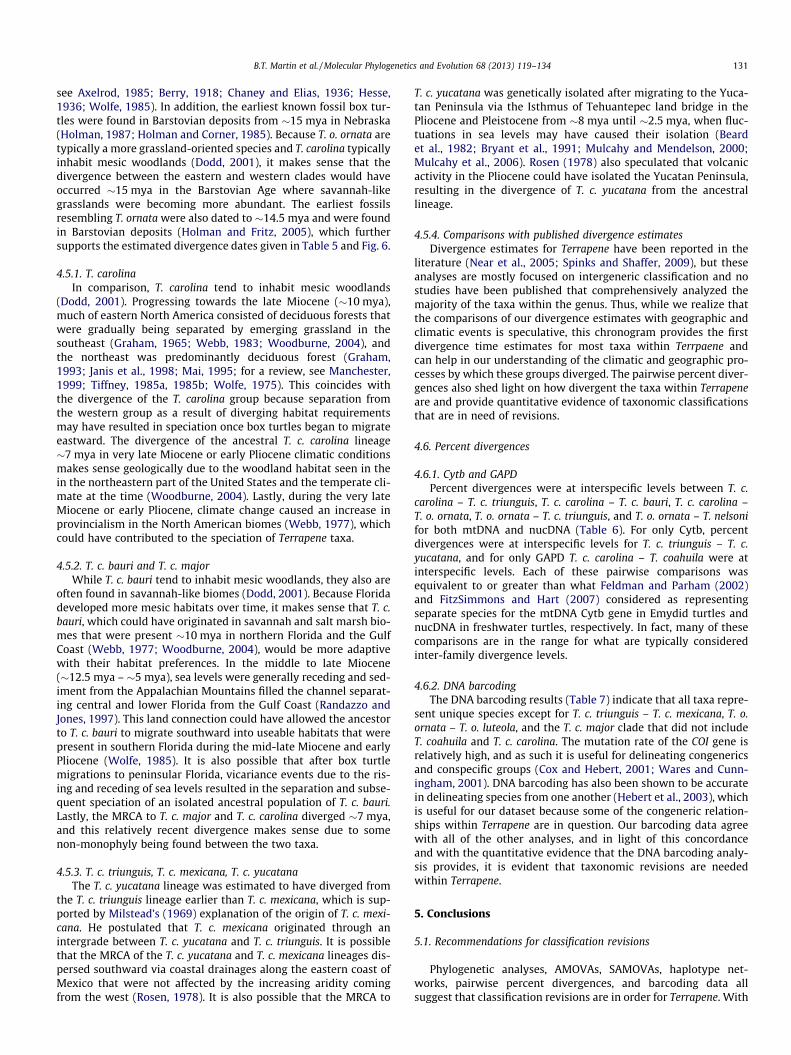
Fig. 1. Sampling localties for the mitochondrial DNA (mtDNA) cytochrome b gene and thehatched region in the central USA indicates a sympatric zone with more than one subspeindicates a potential intergradation zone as indicated by Carr (1952).
was listed as Threatened on the 2006 Red List). In the United States, the various subspecies of the endemic T. carolina and T.ornata are state listed as Species of Special Concern in New Hamp- shire, Connecticut, Michigan, Texas, and Massachusetts , Protected in Indiana and Kansas, Threatened in Iowa, and Endangered inMaine, Wisconsin, and Illinois. Thus, understanding Terrapene evo-lutionary history is particularly urgent, as conservation efforts are often species-based. Our research will be important to both those intereste d in the evolutionary history of the Terrapene, as well asthose that might be attempting to conserve them.
The goals of this research are to (1) resolve the evolutionary his- tory of the Terrapene genus by assessing their classification using molecula r phylogeneti c and genetic barcoding data and (2) assess the population structure within Terrapene to evaluate the phyloge- ography of the genus.
2. Methods
Tissue samples in the form of toenails, shell shavings and frag- ments, bone fragments, scutes, muscle tissue, feces, and blood were collected/obtaine d for all four extant species and all but one of the ten currently recognized subspecies (i.e., T. n. klauberi ;Appendix A). Geographic distribution s based on Dodd (2001) andmorphologi cal identification were used to identify collected speci- mens. At least three individuals of each subspecies were chosen from every US state within their range to obtain a sufficient sample size and to include wide geographic sampling (Fig. 1). In addition,at least three tissue samples were used in the data analyses for the Mexican species and subspecies (except for T. c. yucatana and T. n.
nuclear DNA (nucDNA) glyceraldehyde-3-phosphate dehydrogenase (GAPD) gene. The cies present as proposed by Dodd (2001), and the hatching in the Gulf Coast region
Table 1GenBank Access ion numbers used in this study for the cytochrome b (Cytb), glyceraldehyde-3-phosphate dehydrogen ase (GAPD), and cytochrome oxidase c subunit 1 (COI) genes.
Taxon GenBank ID Source(s)
Cytb GAPD COI
Terrapene carolina carolina AF258871 GQ896138 HQ329658 Feldman and Parham (2002), Wiens et al. (2010) and Reid et al. (2011)Terrapene carolina triunguis FJ770616 GQ896139 Spinks and Shaffer (2009) and Wiens et al., 2010 Terrapene coahuila – AF258872 GQ896140 HQ329659 Feldman and Parham (2002), Wiens et al. (2010) and Reid et al. (2011)Terrapene ornata ornata GQ896203 GQ896142 HQ329660 Wiens et al., 2010; Reid et al., 2011 Terrapene ornata luteola AF258874 N/A Feldman and Parham (2002)Terrapene nelsoni nelsoni AF258873 GQ896141 Feldman and Parham, 2002; Wiens et al., 2010 Clemmys guttata FJ770591 GQ896113 Spinks and Shaffer (2009) and Wiens et al., 2010 Glyptemys insculpta AF258876 Feldman and Parham, 2002 Glyptemys muhlenbergii AF258875 Feldman and Parham (2002)Emys orbicularis AF258868 Feldman and Parham, 2002 Emys marmorata AF258867 Feldman and Parham (2002)Emydoidea blandingii AF258869 Feldman and Parham (2002)
B.T. Martin et al. / Molecular Phylogenetics and Evolution 68 (2013) 119–134 121
nelsoni due to the very limited amount of tissue samples available for these taxa).
2.1. DNA extractions, PCR, and sequencing
Genomic DNA was extracted from tissue samples with the illus- tra™ tissue & cells genomicPr ep Mini Spin Kit (GE Healthcare). One mitochondr ial DNA (mtDNA) gene (cytochrome b; Cytb ) and one nuclear DNA (nucDNA) gene (glyceraldehyde-3 -phosphate dehydro- genase; GAPD) were then amplified and sequenced. For Cytb, the entire 1097 base pair (bp) gene along with part of the adjacent tRNA-threon ine (tRNA-thr) gene was amplified and sequenced using the forward primer CytbG and the reverse primer THR-8 (Engstromet al., 2007; Spinks et al., 2004 ). A 430-bp region of the GAPD gene,including intron 11 and partial coding region, was amplified and sequenced using the forward primer GAPDL890 and the reverse primer GAPDH950 (Dolman and Phillips, 2004; Friesen et al.,1997). Twenty- lL PCR reactions were used for both genes and con- sisted of 7.1 lL H2O, 2.0 lL TopTaq PCR buffer (Qiagen), 0.4 lLdNTPs, 2.0 lL Coral Load (Qiagen), 4.0 lL Q-solution, 1.0 lL each 2-lmol primer, and 2.4 lL DNA. A negative control was included with each PCR. The following parameters were used for the CytbDNA amplification: 35 cycles of 1 min denaturing at 94 �C, 1 min annealing at 51 �C, and 2 min DNA elongation at 72 �C. GAPD PCRparameters were as follows: initial denaturation for 5 min at94 �C followed by 35 cycles of 30 s denaturing at 94 �C, 1 min annealing at 63 �C, and 1 min 30 s extension at 72 �C. A final exten- sion for GAPD was performed for 5 min at 72 �C. Amplification ofthe PCR product was verified via gel electrophor esis and the ampli- fied DNA was purified with the E.Z.N.A. Cycle Pure Kit (OMEGA bio- tek). Purified DNA was concentrated to the level recommend ed byEurofins MWG Operon (20–40 ng/ lL) and shipped to EurofinsMWG Operon for sequencing reactions using BigDye � Terminatorv 3.1 Cycle Sequencing kits (Applied Biosystem s).
2.2. Sequence analysis and phylogeneti c inference
DNA was sequenced on an ABI 3730xl DNA sequencer at Euro- fins MWG Operon and manually proofread and edited using Sequencher 4.9 (Gene Codes Corporation ). Sequence alignments were conducted in Clustal X 2.0.11 (Thompson et al., 1997 ). Final editing was done using MacClade 4.08 (Maddison and Maddison,1989). When available, existing GenBank sequences were included in the analyses (Table 1). The nucDNA GAPD sequence alignmen tcontained IUPAC ambiguity characters designating heterozygous sites, and because some phylogeneti c inference software does not recognize ambiguity characters we used the program Haplotype Inference by Parsimony (HAPAR) to infer haplotypes from geno- typic data (Wang and Xu, 2003 ). HAPAR uses maximum parsimony
to resolve heterozygou s characters into each possible genotype and collapses identical genotypes to find the minimum number of hap- loid haplotypes. HAPAR analysis for the GAPD gene was used for all analyses except for the analyses of molecular variance (AMOVAs)and the spatial analyses of molecula r variance (SAMOVAs), which are able to read IUPAC ambiguity characters (Excoffier et al., 2005 ).
Tajima’s D and Fu and Li’s D� and F� tests for neutrality were conducte d for each gene using DnaSP v 5.10.01 (Librado and Rozas,2009) to confirm that natural selection did not significantly influ-ence the phylogenetic data and that the inferred phylogeny largely reflects the background rate of mutation (Fu and Li, 1993; Tajima,1989). Phylogenies were inferred via maximum likelihoo d (ML;Felsenstei n, 1981 ), and Bayesian inference (BI; Larget and Simon,1999; Rannala and Yang, 1996; Smouse and Li, 1989; Yang and Rannala, 1997 ) methods. PhyML 3.0 was used to generate ML trees (Guindon et al., 2010 ), and BEAST v1.6.2 was used to infer BI trees (Drummond and Rambaut, 2007 ). Non-parametr ic bootstrap re- sampling (Felsenstein, 1985 ) was employed to quantify the statis- tical support for ML phylogenies and the Markov chain Monte Car- lo (MCMC) method was used to infer confidence values for BI (Mau,1996; Mau and Newton, 1997; Mau et al., 1999; Rannala and Yang,1996; Yang and Rannala, 1997 ). One thousand non-parametric bootstrap replications were used to generate ML trees (Pattengaleet al., 2010 ). Bootstrap support values above 70% were considered well-sup ported (Hillis and Bull, 1993 ). The Cytb BI analysis was run for 3.0 � 106 MCMC generations using default temperatures and with sampling trees occurring every 100 generations, while the GAPD BI analysis was run for 3.0 � 107 MCMC generations and with sampling trees occurring every 1,000 generations. The aforemen- tioned 3.0 � 106 and 3.0 � 107 MCMC generations were chosen tomake effective sample sizes (ESS) >200 for each individual param- eter in the analysis, as determined by Tracer v1.5, a program rec- ommend ed by Drummond and Rambaut (2007) to analyze BEAST v1.6.2 output files. The likelihood scores were monitore d during each analysis until stabilization, and the samples obtained prior to stabilization (7500 for both Cytb and GAPD) were discarded asburn-in (Parham et al., 2006 ). Nodes having a Bayesian posterior probabili ty (BPP) P0.95 were considered well-supported (Huel-senbeck and Ronquist, 2001 ). For all analyses, jModelTe st 0.1 was used to determine substitution model parameters using the Akaike Informati on Criterion corrected for small sample size (AICc; Posa-da, 2008 ). ML and BI analyses were conducted for Cytb using the TPM2uf + I + G substitution model, with I = 0.4450, G = 0.6160,and the sample size = 1097. The rate matrix parameters were asfollows: AC = 3.2798, AG = 21.7809, AT = 3.2798, CG = 1.0000,CT = 21.7809, and GT = 1.0000. The base frequenc ies were set to0.3059 (A), 0.3131 (C), 0.1213 (G), and 0.2598 (T). GAPD ML and BI analyses were conducted using the TPM2uf + I substitut ion model, with I = 0.8480 and the sample size = 430. The GAPD rate
122 B.T. Martin et al. / Molecular Phylogenetics and Evolution 68 (2013) 119–134
matrix parameters were as follows: AC = 4.1405, AG = 8.7269,AT = 4.1405, CG = 1.0000, CT = 8.7269, and GT = 1.0000. The base frequencies were set to 0.2089 (A), 0.2012 (C), 0.3000 (G), and 0.2900 (T). Each phylogeny was rooted with a published GenBank sequence from Clemmys (Table 1), which is considered the sister genus to Terrapene (Bickham et al., 1996; Bramble, 1974; Feldman and Parham, 2002; Stephens and Wiens, 2003 ). The Clemmys Gen-Bank reference sequence for GAPD contained IUPAC ambiguity characters and was separated into two haplotypes after HAPAR analysis. Zero-length branches for all genes were collapsed into un- ique haplotypes using Collapse 1.2 to reduce clutter and computa- tion time.
2.2.1. Combined mtDNA and nucDNA phylogenetic analysis The Cytb and GAPD DNA sequence data were concatenated into
a single dataset to infer a combined mtDNA and nucDNA phylo- gram. The combined dataset contained 172 sequences condensed into 121 haplotypes. Prior to phylogeneti c analysis, an Incongru- ence Length Differenc e (ILD; Farris et al., 1994; Mickevich and Far- ris, 1981 ) test with 100 replicates was performed using PAUP �
v4.0b10 (Swofford, 2003 ) to assess whether the topologies of the two trees were congruent. Each gene was partitioned separately for the combined analysis, and the model paramete rs for each par- tition were kept the same as for the individual analyses.
2.3. Haplotype networks
Haplotype networks are useful for visualizing sequence varia- tion within species or among closely related congenerics because (1) there could potentially be a high number of mutational variants and (2) reversion to ancestral haplotypes is possible in recently di- verged taxa (Crandall, 1994; Posada and Crandall, 2001 ). Because these conditions could apply to some taxa within Terrapene, haplo- type networks may provide some insight into intraspeci fic and interspecific population structuring for this genus.
Using the 95% statistical parsimony procedure (Templeton,1998), TCS 1.13 (Templeton et al., 1992 ) was used to estimate agene genealogy. For clarity, reticulation loops were removed a pos- teriori based on coalescent theory (Crandall, 1994 ). Haplotype bub- bles were sized relative to the number of sequences within each haplotype. The haplotype bubbles connected by branches differed by one mutational step, and smaller bubbles were placed on the branches to represent missing intermedi ate steps.
2.4. AMOVA and SAMOVA analyses
Spatial Analysis of Molecular Variance (SAMOVA) was per- formed using SAMOVA 1.0 (Dupanloup et al., 2002 ) and Analysis of Molecular Variance (AMOVA; Excoffier et al., 1992 ) was con- ducted using ARLEQUIN v. 3.11 (Excoffier et al., 2005 ) to examine population structure s. U statistics, which are analogous to F-statis- tics (Wright, 1951 ), were calculated from these analyses to assess how much variation is explained by groupings of populations orclassification-based groupings. UCT values indicate the percent ofvariation explained among groups, USC values indicate the percent of variation explained among populations within groups, and UST
values indicate the percent of variation explained within popula- tions. AMOVA was used to assess the population structure ofmolecular variation, and SAMOVA was used to assess whether geo- graphically sympatric groups are maximal ly genetically isolated. Inother words, AMOVA and SAMOVA use the amount of variance ex- plained among groups to assess whether there is a well-definedpopulation structure. SAMOVA does not make assumptions about whether the populations are at Hardy–Weinberg equilibriu m and a priori groups are not assigned to the populations , whereas AMO- VA assigns populations into a priori groups. SAMOVAs can be less
biased than AMOVAs because SAMOVA s assign groups based ongeographi c data with a user-defined number of groups, whereas the user must assign a priori AMOVA groups. Each SAMOVA and AMOVA was conducted with 1,000 simulated annealing permuta -tions. For both Cytb and GAPD, a priori AMOVA groups were as- signed in several different fashions to compare phylogenetic hypothes es using population structuring. Furthermore, different AMOVA tests were run both a priori and a posteriori to seeing the phylogen etic trees.
2.4.1. A priori AMOVAs The a priori AMOVA analyses were conducted in three different
fashions. First, groups were apportioned into one eastern (T. caro- lina and T. coahuila ) and one western (T. ornata and T. nelsoni )group. Second, groups were assigned based on the morphological data of Minx (1996), which included four groups based on spe- cies-level classification (T. carolina , T. ornata , T. coahuila , and T. nel- soni). Third, each subspecies (or species for monotypic groups) was apportioned separately into ten unique groups as follows: T. coahu- ila, T. n. nelsoni , T. c. carolina , T. c. triunguis , T. c. major , T. c. bauri , T. c.yucatana, T. c. mexicana , T. o. ornata , and T. o. luteola .
2.4.2. A posteriori AMOVAs Several AMOVAs were performed based on the results of the
phylogen etic analyses. First, each subspecies was grouped sepa- rately except for T. o. ornata and T. o. luteola (totaling nine groups).Terrapene o. ornata and T. o. luteola were combined to assess whether population structuring was greater or lower after they were clumped together. Second, the re-assessment provided bythe mtDNA and nucDNA phylogenies (Figs. 2 and 3) was compare dwith the hypothesis of Minx (1996) to evaluate which hypothesis indicated a higher level of population structure . The a posteriori AMOVA based on the mtDNA and nucDNA phylogenies consisted of five total groups and were as follows: (1) T. c. carolina – T. c. ma- jor – T. c. bauri , (2) T. coahuila , (3) T. c. triunguis – T. c. mexicana – T.c. yucatana , (4) T. o. ornata – T. o. luteola , and (5) T. nelsoni . Third, T.coahuila was apportioned into a group along with T. c. carolina andT. c. major to evaluate whether a greater population structure would be observed by grouping T. coahuila with the T. c. carolina group. Fourth, T. c. bauri was combined with T. c. carolina – T. c. ma- jor to evaluate whether a greater amount of population structure would be observed by grouping T. c. bauri with the T. c. carolina group.
2.5. Cytb molecular clock analysis
A relaxed, uncorrela ted lognormal molecular clock was placed on the Cytb sequence data using the BEAST v1.6.2 software package to estimate divergence times (Drummond and Rambaut, 2007 ). Amolecula r clock was not inferred for GAPD due to a generally lower resolution of the ML and Bayesian phylograms. Clemmys guttata ,Glyptemy s muhlenbergii , G. insculpta , Emys orbicularis , and E. mar- morata were used to root the tree, as previous data indicated that these genera are most closely related to Terrapene within Emydi- nae (Bickham et al., 1996; Bramble, 1974; Feldman and Parham,2002; Stephens and Wiens, 2003 ). The molecula r clock analysis was conducted using the Yule Process speciation tree prior and aGTR + I + G substitution model with the parameters and tree priors equal to those for the previously mentioned Cytb ML and BI phylo- genetic analyses, as determined by jModelTest 0.1 (Posada, 2008 ).Fossil data and previously published divergence estimates were used to calibrate the molecular clock. The root was calibrated to29.4 million years ago (mya), with the standard deviation (SD) = 2.01, as the most recent common ancestor (MRCA) to Emy- dinae, and the MRCA to Glyptemys was calibrated to 17.0 mya, with the SD = 2.90 (Spinks and Shaffer, 2009 ). Based on fossil data, the
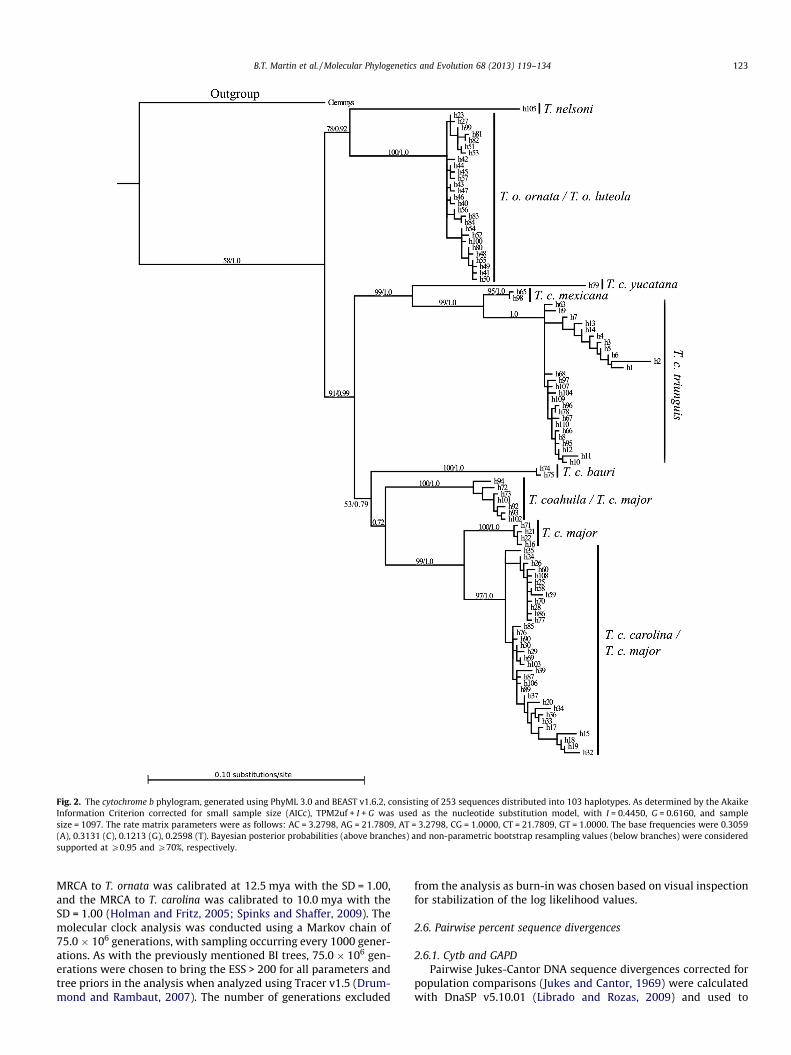
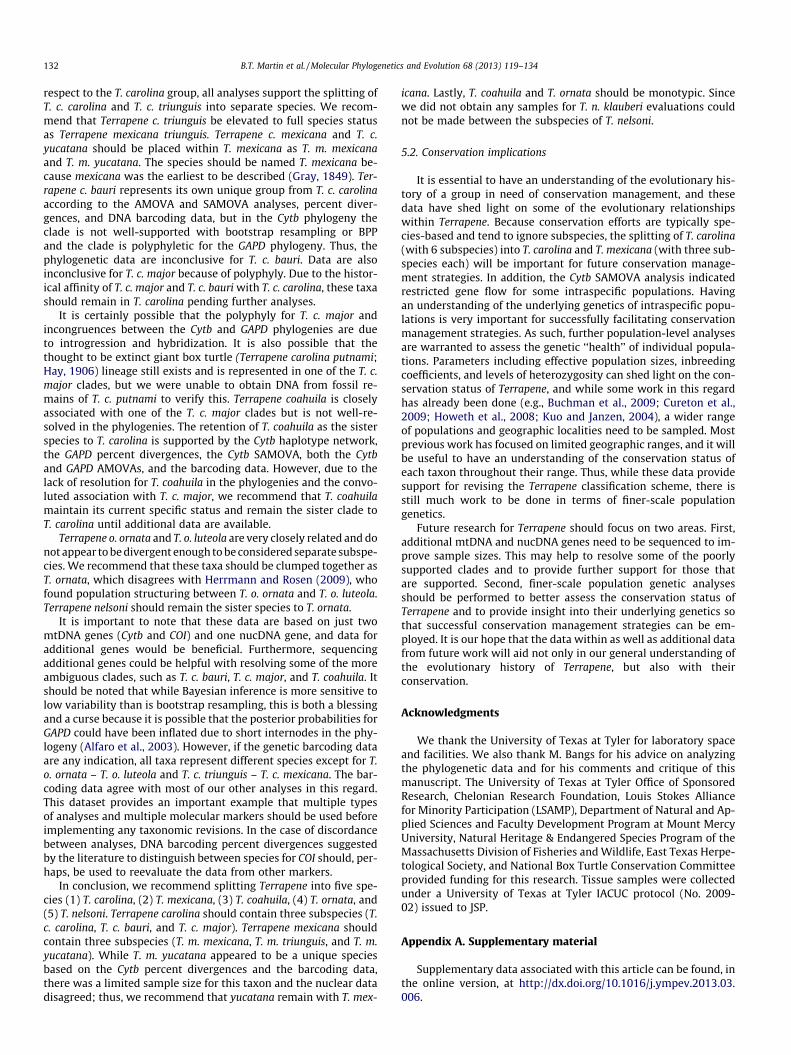
Fig. 2. The cytochrome b phylogram, generated using PhyML 3.0 and BEAST v1.6.2, consisting of 253 sequences distributed into 103 haplotypes. As determined by the Akaike Information Criterion corrected for small sample size (AICc), TPM2uf + I + G was used as the nucleotide substitution model, with I = 0.4450, G = 0.6160, and sample size = 1097. The rate matrix parameters were as follows: AC = 3.2798, AG = 21.7809, AT = 3.2798, CG = 1.0000, CT = 21.7809, GT = 1.0000. The base frequencies were 0.3059 (A), 0.3131 (C), 0.1213 (G), 0.2598 (T). Bayesian posterior probabilities (above branches) and non-parametric bootstrap resampling values (below branches) were considered supported at P0.95 and P70%, respectively.
B.T. Martin et al. / Molecular Phylogenetics and Evolution 68 (2013) 119–134 123
MRCA to T. ornata was calibrated at 12.5 mya with the SD = 1.00,and the MRCA to T. carolina was calibrated to 10.0 mya with the SD = 1.00 (Holman and Fritz, 2005; Spinks and Shaffer, 2009 ). The molecular clock analysis was conducted using a Markov chain of75.0 � 106 generations, with sampling occurring every 1000 gener- ations. As with the previously mentioned BI trees, 75.0 � 106 gen-erations were chosen to bring the ESS > 200 for all parameters and tree priors in the analysis when analyzed using Tracer v1.5 (Drum-mond and Rambaut, 2007 ). The number of generations excluded
from the analysis as burn-in was chosen based on visual inspection for stabilization of the log likelihood values.
2.6. Pairwise percent sequence divergences
2.6.1. Cytb and GAPD Pairwise Jukes-Cantor DNA sequence divergences corrected for
population comparisons (Jukes and Cantor, 1969 ) were calculated with DnaSP v5.10.01 (Librado and Rozas, 2009 ) and used to
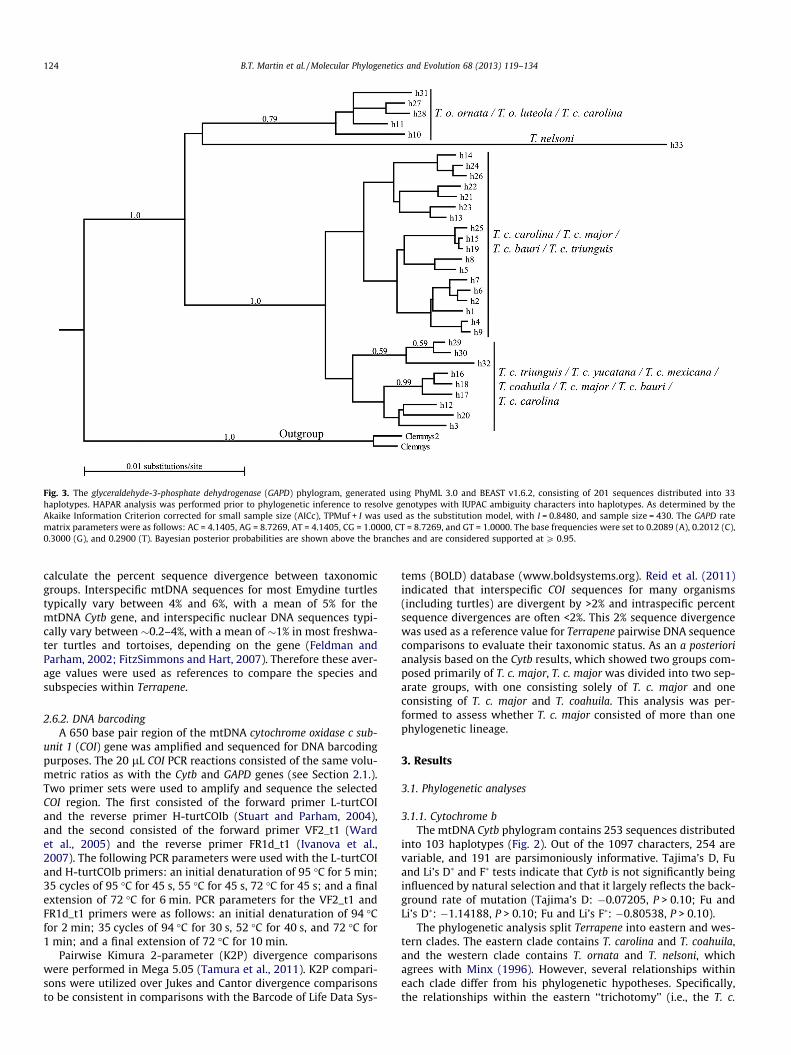
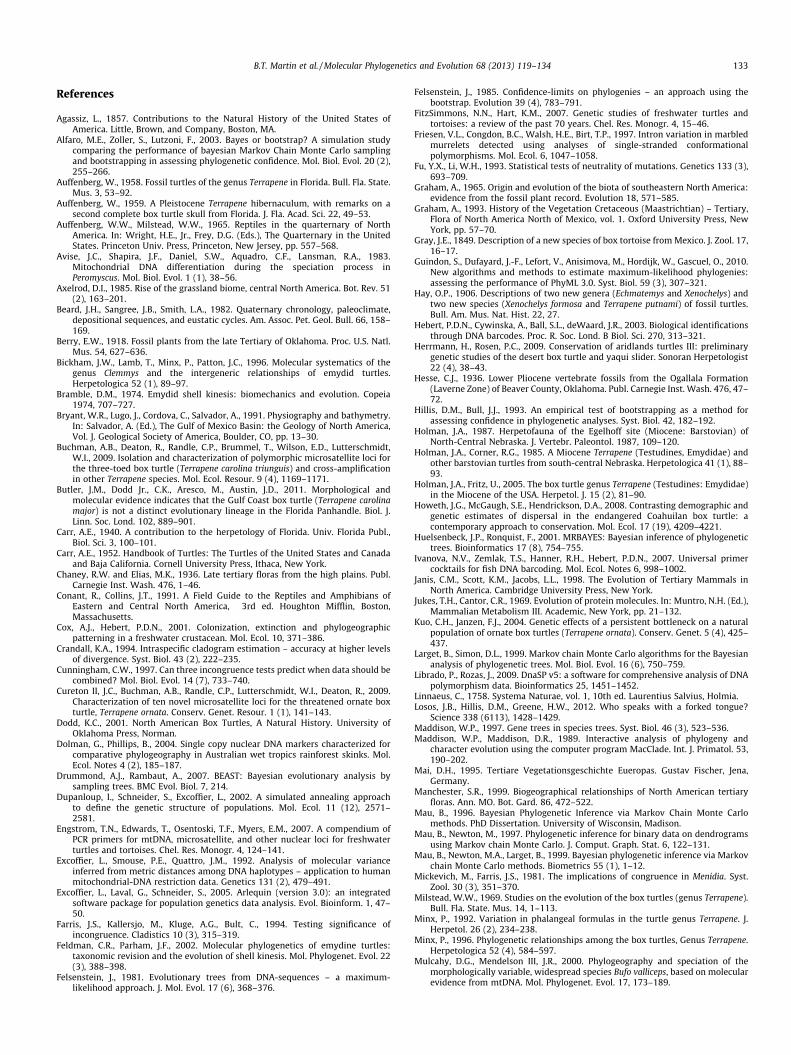
Fig. 3. The glyceraldehyde-3-phosphate dehydrogenase (GAPD) phylogram, generated using PhyML 3.0 and BEAST v1.6.2, consisting of 201 sequences distributed into 33haplotypes. HAPAR analysis was performed prior to phylogenetic inference to resolve genotypes with IUPAC ambiguity characters into haplotypes. As determined by the Akaike Information Criterion corrected for small sample size (AICc), TPMuf + I was used as the substitution model, with I = 0.8480, and sample size = 430. The GAPD rate matrix parameters were as follows: AC = 4.1405, AG = 8.7269, AT = 4.1405, CG = 1.0000, CT = 8.7269, and GT = 1.0000. The base frequencies were set to 0.2089 (A), 0.2012 (C),0.3000 (G), and 0.2900 (T). Bayesian posterior probabilities are shown above the branches and are considered supported at P 0.95.
124 B.T. Martin et al. / Molecular Phylogenetics and Evolution 68 (2013) 119–134
calculate the percent sequence divergence between taxonomic groups. Interspecific mtDNA sequences for most Emydine turtles typically vary between 4% and 6%, with a mean of 5% for the mtDNA Cytb gene, and interspecific nuclear DNA sequences typi- cally vary between �0.2–4%, with a mean of �1% in most freshwa- ter turtles and tortoises, depending on the gene (Feldman and Parham, 2002; FitzSimmons and Hart, 2007 ). Therefore these aver- age values were used as references to compare the species and subspecies within Terrapene.
2.6.2. DNA barcoding A 650 base pair region of the mtDNA cytochrome oxidase c sub-
unit 1 (COI) gene was amplified and sequenced for DNA barcodin gpurposes. The 20 lL COI PCR reactions consisted of the same volu- metric ratios as with the Cytb and GAPD genes (see Section 2.1.).Two primer sets were used to amplify and sequence the selected COI region. The first consisted of the forward primer L-turtCOI and the reverse primer H-turtCOIb (Stuart and Parham, 2004 ),and the second consisted of the forward primer VF2_t1 (Wardet al., 2005 ) and the reverse primer FR1d_t1 (Ivanova et al.,2007). The following PCR paramete rs were used with the L-turtCO Iand H-turtCOIb primers: an initial denaturation of 95 �C for 5 min;35 cycles of 95 �C for 45 s, 55 �C for 45 s, 72 �C for 45 s; and a finalextension of 72 �C for 6 min. PCR parameters for the VF2_t1 and FR1d_t1 primers were as follows: an initial denaturation of 94 �Cfor 2 min; 35 cycles of 94 �C for 30 s, 52 �C for 40 s, and 72 �C for 1 min; and a final extension of 72 �C for 10 min.
Pairwise Kimura 2-paramete r (K2P) divergence comparis ons were performed in Mega 5.05 (Tamura et al., 2011 ). K2P compari- sons were utilized over Jukes and Cantor divergence comparisons to be consistent in comparisons with the Barcode of Life Data Sys-
tems (BOLD) database (www.boldsystems.org). Reid et al. (2011)indicated that interspecific COI sequences for many organisms (including turtles) are divergent by >2% and intraspecific percent sequence divergences are often <2%. This 2% sequence divergence was used as a reference value for Terrapene pairwise DNA sequence comparis ons to evaluate their taxonomic status. As an a posteriori analysis based on the Cytb results, which showed two groups com- posed primarily of T. c. major , T. c. major was divided into two sep- arate groups, with one consisting solely of T. c. major and one consisting of T. c. major and T. coahuila . This analysis was per- formed to assess whether T. c. major consisted of more than one phylogen etic lineage.
3. Results
3.1. Phylogen etic analyses
3.1.1. Cytochrome bThe mtDNA Cytb phylogram contains 253 sequence s distribut ed
into 103 haplotypes (Fig. 2). Out of the 1097 characters, 254 are variable, and 191 are parsimon iously informative . Tajima’s D, Fuand Li’s D� and F� tests indicate that Cytb is not significantly being influenced by natural selection and that it largely reflects the back- ground rate of mutation (Tajima’s D: �0.07205, P > 0.10; Fu and Li’s D�: �1.14188, P > 0.10; Fu and Li’s F�: �0.80538, P > 0.10).
The phylogenetic analysis split Terrapene into eastern and wes- tern clades. The eastern clade contains T. carolina and T. coahuila ,and the western clade contains T. ornata and T. nelsoni , which agrees with Minx (1996). However, several relationshi ps within each clade differ from his phylogenetic hypotheses. Specifically,the relationship s within the eastern ‘‘trichotomy ’’ (i.e., the T. c.
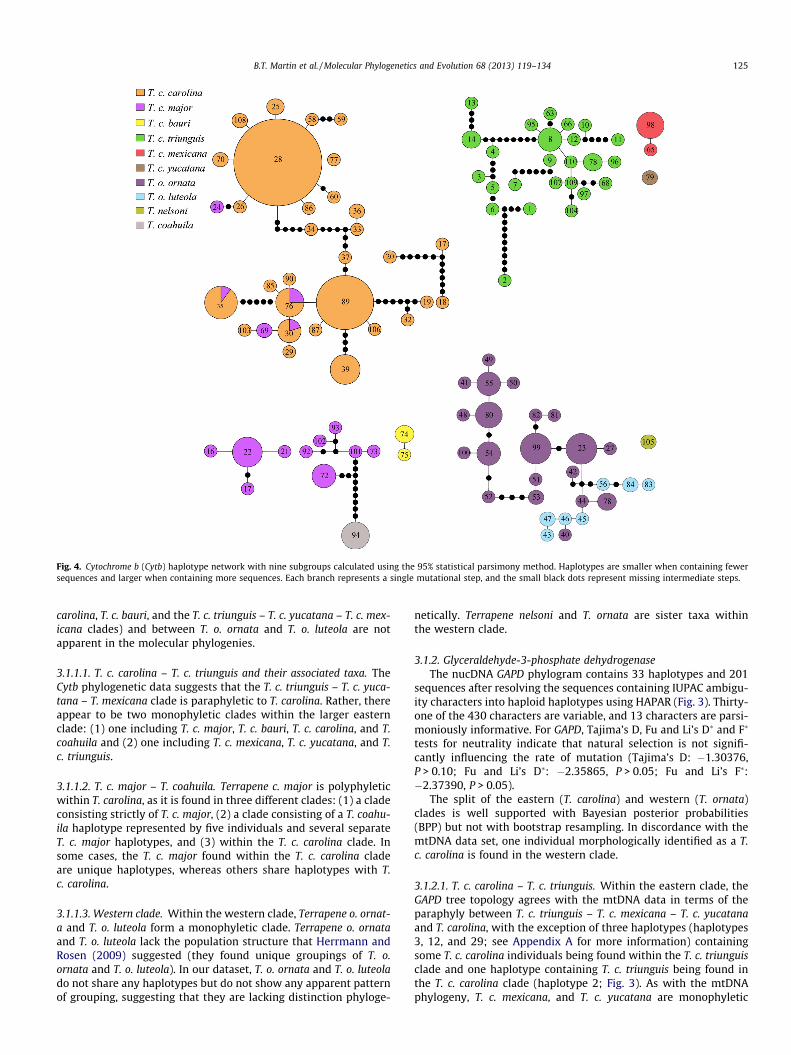
Fig. 4. Cytochrome b (Cytb) haplotype network with nine subgroups calculated using the 95% statistical parsimony method. Haplotypes are smaller when containing fewer sequences and larger when containing more sequences. Each branch represents a single mutational step, and the small black dots represent missing intermediate steps.
B.T. Martin et al. / Molecular Phylogenetics and Evolution 68 (2013) 119–134 125
carolina, T. c. bauri , and the T. c. triunguis – T. c. yucatana – T. c. mex- icana clades) and between T. o. ornata and T. o. luteola are not apparent in the molecular phylogenies.
3.1.1.1. T. c. carolina – T. c. triunguis and their associated taxa. TheCytb phylogeneti c data suggests that the T. c. triunguis – T. c. yuca- tana – T. mexicana clade is paraphyleti c to T. carolina . Rather, there appear to be two monophyletic clades within the larger eastern clade: (1) one including T. c. major , T. c. bauri , T. c. carolina , and T.coahuila and (2) one including T. c. mexicana , T. c. yucatana , and T.c. triunguis .
3.1.1.2. T. c. major – T. coahuila. Terrapene c. major is polyphyletic within T. carolina , as it is found in three different clades: (1) a clade consisting strictly of T. c. major , (2) a clade consisting of a T. coahu- ila haplotype represented by five individua ls and several separate T. c. major haplotypes, and (3) within the T. c. carolina clade. Insome cases, the T. c. major found within the T. c. carolina cladeare unique haplotypes, whereas others share haplotypes with T.c. carolina .
3.1.1.3. Western clade. Within the western clade, Terrapene o. ornat- a and T. o. luteola form a monophy letic clade. Terrapene o. ornata and T. o. luteola lack the population structure that Herrmann and Rosen (2009) suggested (they found unique groupings of T. o.ornata and T. o. luteola ). In our dataset, T. o. ornata and T. o. luteola do not share any haplotypes but do not show any apparent pattern of grouping, suggesting that they are lacking distinction phyloge-
netically. Terrapene nelsoni and T. ornata are sister taxa within the western clade.
3.1.2. Glyceraldehyde -3-phosphat e dehydrogenase The nucDNA GAPD phylogram contains 33 haplotypes and 201
sequence s after resolving the sequences containing IUPAC ambigu- ity characters into haploid haplotypes using HAPAR (Fig. 3). Thirty- one of the 430 characters are variable, and 13 characters are parsi- monious ly informative. For GAPD, Tajima’s D, Fu and Li’s D� and F�
tests for neutrality indicate that natural selection is not signifi-cantly influencing the rate of mutation (Tajima’s D: �1.30376,P > 0.10; Fu and Li’s D�: �2.35865, P > 0.05; Fu and Li’s F�:�2.37390, P > 0.05).
The split of the eastern (T. carolina ) and western (T. ornata )clades is well supported with Bayesian posterior probabilities (BPP) but not with bootstrap resampling. In discordance with the mtDNA data set, one individual morphologi cally identified as a T.c. carolina is found in the western clade.
3.1.2.1. T. c. carolina – T. c. triunguis. Within the eastern clade, the GAPD tree topology agrees with the mtDNA data in terms of the paraphyl y between T. c. triunguis – T. c. mexicana – T. c. yucatana and T. carolina , with the exception of three haplotypes (haplotypes3, 12, and 29; see Appendix A for more informat ion) containing some T. c. carolina individuals being found within the T. c. triunguis clade and one haplotype containing T. c. triunguis being found inthe T. c. carolina clade (haplotype 2; Fig. 3). As with the mtDNA phylogen y, T. c. mexicana , and T. c. yucatana are monophylet ic
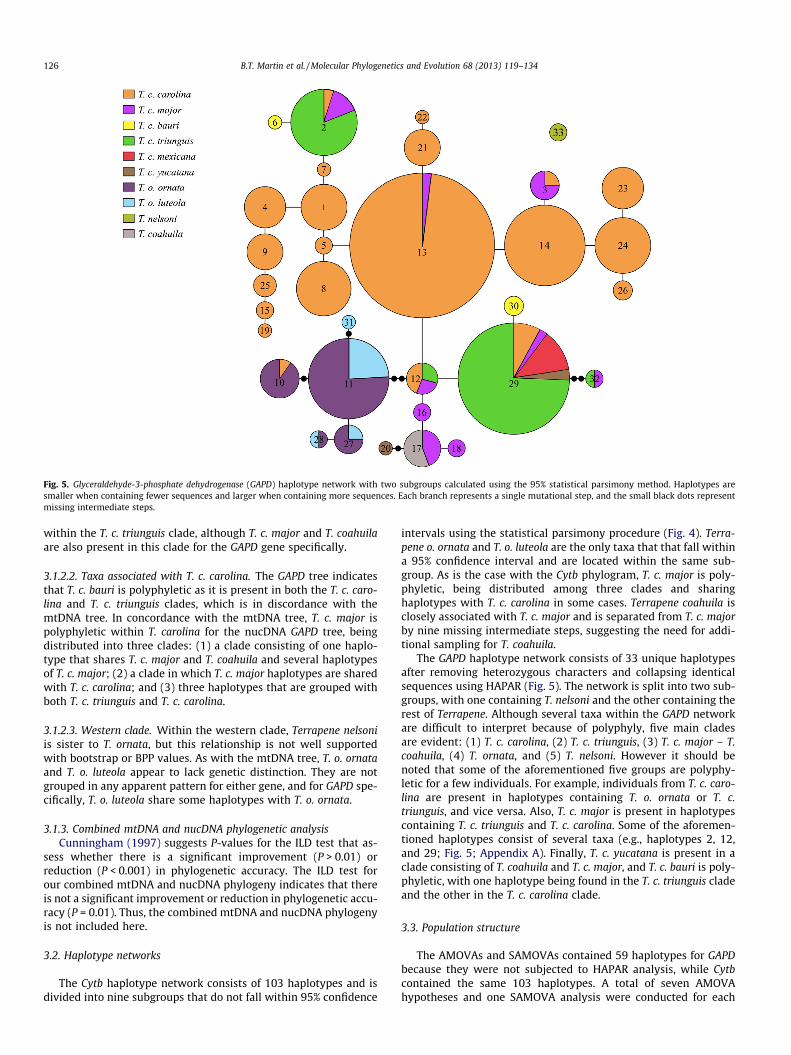
Fig. 5. Glyceraldehyde-3-phosphate dehydrogenase (GAPD) haplotype network with two subgroups calculated using the 95% statistical parsimony method. Haplotypes are smaller when containing fewer sequences and larger when containing more sequences. Each branch represents a single mutational step, and the small black dots represent missing intermediate steps.
126 B.T. Martin et al. / Molecular Phylogenetics and Evolution 68 (2013) 119–134
within the T. c. triunguis clade, although T. c. major and T. coahuila are also present in this clade for the GAPD gene specifically.
3.1.2.2. Taxa associate d with T. c. carolina. The GAPD tree indicates that T. c. bauri is polyphyletic as it is present in both the T. c. caro- lina and T. c. triunguis clades, which is in discordance with the mtDNA tree. In concordance with the mtDNA tree, T. c. major ispolyphyletic within T. carolina for the nucDNA GAPD tree, being distributed into three clades: (1) a clade consisting of one haplo- type that shares T. c. major and T. coahuila and several haplotypes of T. c. major ; (2) a clade in which T. c. major haplotypes are shared with T. c. carolina ; and (3) three haplotypes that are grouped with both T. c. triunguis and T. c. carolina .
3.1.2.3. Western clade. Within the western clade, Terrapene nelsoni is sister to T. ornata , but this relationshi p is not well supported with bootstrap or BPP values. As with the mtDNA tree, T. o. ornata and T. o. luteola appear to lack genetic distinction. They are not grouped in any apparent pattern for either gene, and for GAPD spe-cifically, T. o. luteola share some haplotypes with T. o. ornata .
3.1.3. Combined mtDNA and nucDNA phylogenetic analysis Cunningham (1997) suggests P-values for the ILD test that as-
sess whether there is a significant improvement (P > 0.01) orreduction (P < 0.001) in phylogeneti c accuracy. The ILD test for our combined mtDNA and nucDNA phylogen y indicates that there is not a significant improvem ent or reduction in phylogeneti c accu- racy (P = 0.01). Thus, the combined mtDNA and nucDNA phylogeny is not included here.
3.2. Haplotype networks
The Cytb haplotype network consists of 103 haplotypes and isdivided into nine subgroup s that do not fall within 95% confidence
intervals using the statistical parsimony procedure (Fig. 4). Terra-pene o. ornata and T. o. luteola are the only taxa that that fall within a 95% confidence interval and are located within the same sub- group. As is the case with the Cytb phylogram, T. c. major is poly- phyletic, being distributed among three clades and sharing haplotypes with T. c. carolina in some cases. Terrapene coahuila isclosely associated with T. c. major and is separated from T. c. major by nine missing intermediate steps, suggesting the need for addi- tional sampling for T. coahuila .
The GAPD haplotype network consists of 33 unique haplotypes after removing heterozygous characters and collapsing identical sequence s using HAPAR (Fig. 5). The network is split into two sub- groups, with one containing T. nelsoni and the other containing the rest of Terrapene. Although several taxa within the GAPD networkare difficult to interpret because of polyphyly, five main clades are evident: (1) T. c. carolina , (2) T. c. triunguis , (3) T. c. major – T.coahuila, (4) T. ornata , and (5) T. nelsoni . However it should benoted that some of the aforementione d five groups are polyphy- letic for a few individuals. For example, individua ls from T. c. caro- lina are present in haplotypes containing T. o. ornata or T. c.triunguis, and vice versa. Also, T. c. major is present in haplotypes containing T. c. triunguis and T. c. carolina . Some of the aforemen- tioned haplotypes consist of several taxa (e.g., haplotypes 2, 12,and 29; Fig. 5; Appendix A). Finally, T. c. yucatana is present in aclade consisting of T. coahuila and T. c. major , and T. c. bauri is poly- phyletic, with one haplotype being found in the T. c. triunguis cladeand the other in the T. c. carolina clade.
3.3. Population structure
The AMOVAs and SAMOVAs contained 59 haplotypes for GAPDbecause they were not subjected to HAPAR analysis, while Cytbcontaine d the same 103 haplotypes. A total of seven AMOVA hypothes es and one SAMOVA analysis were conducted for each
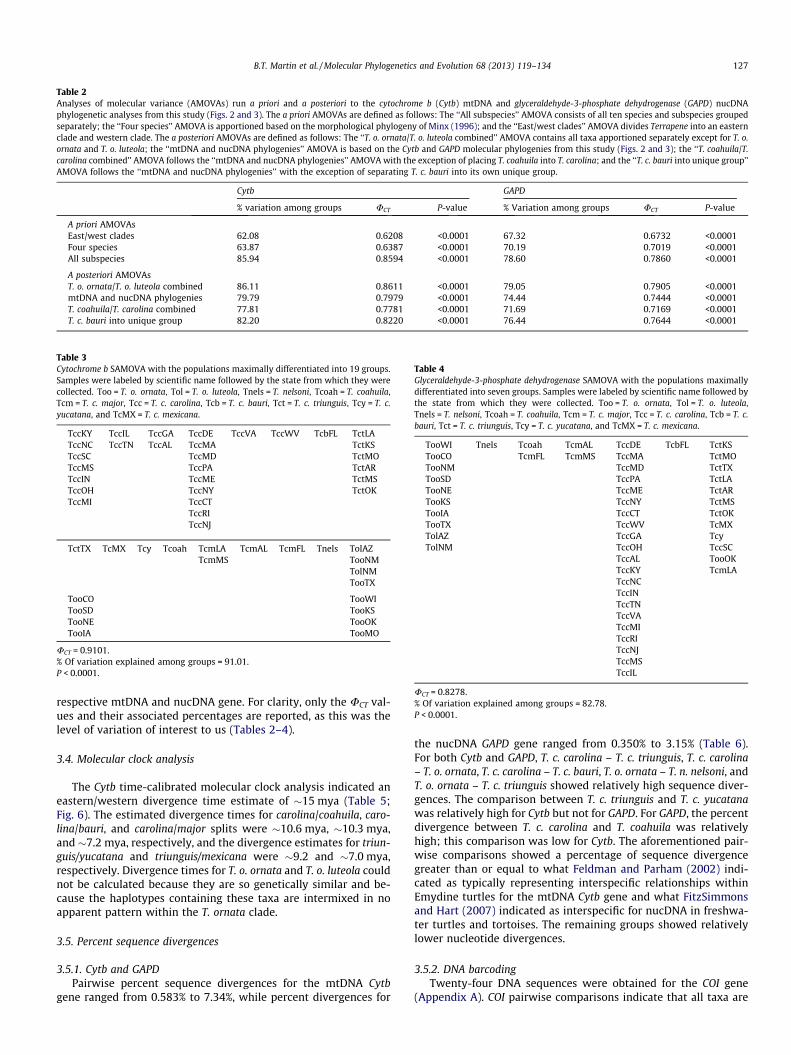
Table 2Analyses of molecular variance (AMOVAs) run a prio ri and a posteriori to the cytochrome b (Cytb) mtDNA and glyceraldehyde- 3-phosphate dehydrogenase (GAPD) nucDNA phylogenetic analyses from this study (Figs. 2 and 3). The a priori AMOVAs are defined as follows: The ‘‘All subspecies’’ AMOVA consists of all ten species and subspecies grouped separately; the ‘‘Four species’’ AMOVA is apportioned based on the morphological phylogeny of Minx (1996); and the ‘‘East/west clades’’ AMOVA divides Terrapene into an eastern clade and western clade. The a posteriori AMOVAs are defined as follows: The ‘‘T. o. ornata /T. o. luteola combined’’ AMOVA contains all taxa apportioned separately except for T. o.ornata and T. o. luteola ; the ‘‘mtDNA and nucDNA phylogenies’’ AMOVA is based on the Cytb and GAPD molecular phylogenies from this study (Figs. 2 and 3); the ‘‘T. coahuila /T.carolina combined’’ AMOVA follows the ‘‘mtDNA and nucDNA phylogenies’’ AMOVA with the exception of placing T. coahuila into T. carolina ; and the ‘‘T. c. bauri into unique group’’AMOVA follows the ‘‘mtDNA and nucDNA phylogenies’’ with the exception of separating T. c. bauri into its own unique group.
Cytb GAPD
% variation among groups UCT P-value % Variation among groups UCT P-value
A priori AMOVAs East/west clades 62.08 0.6208 <0.0001 67.32 0.6732 <0.0001 Four species 63.87 0.6387 <0.0001 70.19 0.7019 <0.0001 All subspecies 85.94 0.8594 <0.0001 78.60 0.7860 <0.0001
A posteriori AMOVAsT. o. ornata /T. o. luteola combined 86.11 0.8611 <0.0001 79.05 0.7905 <0.0001 mtDNA and nucDNA phylogenies 79.79 0.7979 <0.0001 74.44 0.7444 <0.0001 T. coahuila /T. carolina combined 77.81 0.7781 <0.0001 71.69 0.7169 <0.0001 T. c. bauri into unique group 82.20 0.8220 <0.0001 76.44 0.7644 <0.0001
Table 3Cytochrome b SAMOVA with the populations maximally differentiated into 19 groups.Samples were labeled by scient ific name followed by the state from whi ch they were collected. Too = T. o. ornata , Tol = T. o. luteola , Tnels = T. nelsoni , Tcoah = T. coahuila ,Tcm = T. c. major , Tcc = T. c. carolina , Tcb = T. c. bauri , Tct = T. c. triunguis , Tcy = T. c.yucatana , and TcMX = T. c. mexicana .
TccKY TccIL TccGA TccDE TccVA TccWV TcbFL TctLA TccNC TccTN TccAL TccMA TctKS TccSC TccMD TctMO TccMS TccPA TctAR TccIN TccME TctMS TccOH TccNY TctOK TccMI TccCT
TccRI TccNJ
TctTX TcMX Tcy Tcoah TcmLA TcmAL TcmFL Tnels TolAZ TcmMS TooNM
TolNM TooTX
TooCO TooWI TooSD TooKS TooNE TooOK TooIA TooMO
UCT = 0.9101.% Of variation explained among groups = 91.01.P < 0.0001.
Table 4Glyceraldehyde-3-phosphate dehydrogenase SAMOVA with the populations maximally differentiated into seven groups . Samples were labeled by scientific name followed bythe state from which they were collected. Too = T. o. ornata , Tol = T. o. luteola ,Tnels = T. nelsoni , Tcoah = T. coahuila , Tcm = T. c. major , Tcc = T. c. carolina , Tcb = T. c.bauri , Tct = T. c. triunguis , Tcy = T. c. yucat ana , and TcMX = T. c. mexica na.
TooWI Tnels Tcoah TcmAL TccDE TcbFL TctKS TooCO TcmFL TcmMS TccMA TctMO TooNM TccMD TctTX TooSD TccPA TctLA TooNE TccME TctAR TooKS TccNY TctMS TooIA TccCT TctOK TooTX TccWV TcMX TolAZ TccGA Tcy TolNM TccOH TccSC
TccAL TooOK TccKY TcmLA TccNC TccIN TccTN TccVA TccMI TccRI TccNJ TccMS TccIL
UCT = 0.8278.% Of variation explained among groups = 82.78.P < 0.0001.
B.T. Martin et al. / Molecular Phylogenetics and Evolution 68 (2013) 119–134 127
respective mtDNA and nucDNA gene. For clarity, only the UCT val-ues and their associated percentages are reported, as this was the level of variation of interest to us (Tables 2–4).
3.4. Molecular clock analysis
The Cytb time-calibra ted molecular clock analysis indicated aneastern/wester n divergence time estimate of �15 mya (Table 5;Fig. 6). The estimated divergence times for carolina/coahuila, caro-lina/bauri, and carolina/major splits were �10.6 mya, �10.3 mya,and �7.2 mya, respectively , and the divergence estimates for triun-guis/yucatana and triunguis/me xicana were �9.2 and �7.0 mya,respectively . Divergence times for T. o. ornata and T. o. luteola couldnot be calculated because they are so geneticall y similar and be- cause the haplotypes containing these taxa are intermixed in noapparent pattern within the T. ornata clade.
3.5. Percent sequence divergences
3.5.1. Cytb and GAPD Pairwise percent sequence divergences for the mtDNA Cytb
gene ranged from 0.583% to 7.34%, while percent divergen ces for
the nucDNA GAPD gene ranged from 0.350% to 3.15% (Table 6).For both Cytb and GAPD, T. c. carolina – T. c. triunguis , T. c. carolina – T. o. ornata , T. c. carolina – T. c. bauri , T. o. ornata – T. n. nelsoni , and T. o. ornata – T. c. triunguis showed relatively high sequence diver- gences. The comparison between T. c. triunguis and T. c. yucatana was relatively high for Cytb but not for GAPD. For GAPD, the percent divergen ce between T. c. carolina and T. coahuila was relatively high; this comparison was low for Cytb. The aforementione d pair- wise comparisons showed a percentage of sequence divergence greater than or equal to what Feldman and Parham (2002) indi-cated as typically representi ng interspecific relationships within Emydine turtles for the mtDNA Cytb gene and what FitzSimm ons and Hart (2007) indicated as interspecific for nucDNA in freshwa- ter turtles and tortoises. The remaining groups showed relatively lower nucleotid e divergences.
3.5.2. DNA barcoding Twenty-fou r DNA sequence s were obtained for the COI gene
(Appendix A). COI pairwise comparisons indicate that all taxa are
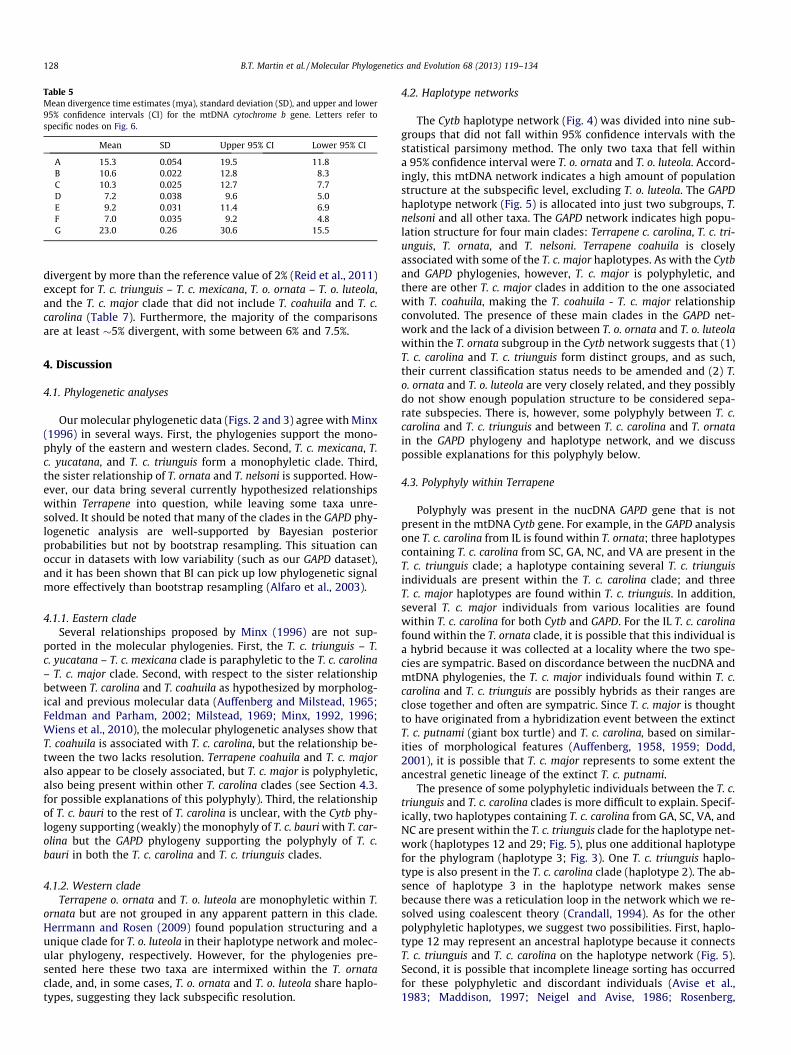
Table 5Mean divergence time estimates (mya), standard deviation (SD), and upper and lower 95% confidence intervals (CI) for the mtDNA cytochrome b gene. Let ters refer tospecific nodes on Fig. 6.
Mean SD Upper 95% CI Lower 95% CI
A 15.3 0.054 19.5 11.8 B 10.6 0.022 12.8 8.3 C 10.3 0.025 12.7 7.7 D 7.2 0.038 9.6 5.0 E 9.2 0.031 11.4 6.9 F 7.0 0.035 9.2 4.8 G 23.0 0.26 30.6 15.5
128 B.T. Martin et al. / Molecular Phylogenetics and Evolution 68 (2013) 119–134
divergent by more than the reference value of 2% (Reid et al., 2011 )except for T. c. triunguis – T. c. mexicana , T. o. ornata – T. o. luteola ,and the T. c. major clade that did not include T. coahuila and T. c.carolina (Table 7). Furthermore, the majority of the comparisons are at least �5% divergent, with some between 6% and 7.5%.
4. Discussion
4.1. Phylogenetic analyses
Our molecular phylogeneti c data (Figs. 2 and 3) agree with Minx(1996) in several ways. First, the phylogen ies support the mono- phyly of the eastern and western clades. Second, T. c. mexicana , T.c. yucatana , and T. c. triunguis form a monophyletic clade. Third,the sister relationship of T. ornata and T. nelsoni is supported. How- ever, our data bring several currently hypothesized relationship swithin Terrapene into question, while leaving some taxa unre- solved. It should be noted that many of the clades in the GAPD phy-logenetic analysis are well-sup ported by Bayesian posterior probabilitie s but not by bootstrap resampling. This situation can occur in datasets with low variabilit y (such as our GAPD dataset),and it has been shown that BI can pick up low phylogen etic signal more effectively than bootstrap resampling (Alfaro et al., 2003 ).
4.1.1. Eastern clade Several relationships proposed by Minx (1996) are not sup-
ported in the molecular phylogenies. First, the T. c. triunguis – T.c. yucatana – T. c. mexicana clade is paraphyleti c to the T. c. carolina – T. c. major clade. Second, with respect to the sister relationship between T. carolina and T. coahuila as hypothesize d by morpholog- ical and previous molecular data (Auffenbe rg and Milstead, 1965;Feldman and Parham, 2002; Milstead, 1969; Minx, 1992, 1996;Wiens et al., 2010 ), the molecular phylogenetic analyses show that T. coahuila is associate d with T. c. carolina , but the relationshi p be- tween the two lacks resolution. Terrapene coahuila and T. c. major also appear to be closely associated, but T. c. major is polyphyletic,also being present within other T. carolina clades (see Section 4.3.for possible explanation s of this polyphyly). Third, the relationship of T. c. bauri to the rest of T. carolina is unclear, with the Cytb phy-logeny supporting (weakly) the monophyly of T. c. bauri with T. car- olina but the GAPD phylogeny supporting the polyphyly of T. c.bauri in both the T. c. carolina and T. c. triunguis clades.
4.1.2. Western clade Terrapene o. ornata and T. o. luteola are monophylet ic within T.
ornata but are not grouped in any apparent pattern in this clade.Herrmann and Rosen (2009) found population structuring and aunique clade for T. o. luteola in their haplotype network and molec- ular phylogeny, respectively. However , for the phylogenies pre- sented here these two taxa are intermixed within the T. ornata clade, and, in some cases, T. o. ornata and T. o. luteola share haplo- types, suggesting they lack subspecific resolution.
4.2. Haplotyp e networks
The Cytb haplotype network (Fig. 4) was divided into nine sub- groups that did not fall within 95% confidence intervals with the statistical parsimon y method. The only two taxa that fell within a 95% confidence interval were T. o. ornata and T. o. luteola . Accord- ingly, this mtDNA network indicates a high amount of population structure at the subspecific level, excluding T. o. luteola . The GAPDhaplotype network (Fig. 5) is allocated into just two subgroups, T.nelsoni and all other taxa. The GAPD network indicates high popu- lation structure for four main clades: Terrapene c. carolina , T. c. tri- unguis, T. ornata , and T. nelsoni . Terrapene coahuila is closely associate d with some of the T. c. major haplotypes. As with the Cytband GAPD phylogenies, however, T. c. major is polyphyletic, and there are other T. c. major clades in addition to the one associate dwith T. coahuila , making the T. coahuila - T. c. major relationshipconvolut ed. The presence of these main clades in the GAPD net-work and the lack of a division between T. o. ornata and T. o. luteola within the T. ornata subgroup in the Cytb network suggests that (1)T. c. carolina and T. c. triunguis form distinct groups, and as such,their current classification status needs to be amended and (2) T.o. ornata and T. o. luteola are very closely related, and they possibly do not show enough population structure to be considered sepa- rate subspecies. There is, however, some polyphyly between T. c.carolina and T. c. triunguis and between T. c. carolina and T. ornata in the GAPD phylogeny and haplotype network, and we discuss possible explanations for this polyphyly below.
4.3. Polyphyly within Terrapene
Polyphyl y was present in the nucDNA GAPD gene that is not present in the mtDNA Cytb gene. For example, in the GAPD analysisone T. c. carolina from IL is found within T. ornata ; three haplotypes containing T. c. carolina from SC, GA, NC, and VA are present in the T. c. triunguis clade; a haplotype containing several T. c. triunguis individua ls are present within the T. c. carolina clade; and three T. c. major haplotypes are found within T. c. triunguis . In addition,several T. c. major individuals from various localities are found within T. c. carolina for both Cytb and GAPD. For the IL T. c. carolina found within the T. ornata clade, it is possible that this individual isa hybrid because it was collected at a locality where the two spe- cies are sympatric. Based on discordance between the nucDNA and mtDNA phylogenies, the T. c. major individuals found within T. c.carolina and T. c. triunguis are possibly hybrids as their ranges are close together and often are sympatric. Since T. c. major is thought to have originate d from a hybridiza tion event between the extinct T. c. putnami (giant box turtle) and T. c. carolina, based on similar- ities of morphological features (Auffenberg, 1958, 1959; Dodd,2001), it is possible that T. c. major represents to some extent the ancestral genetic lineage of the extinct T. c. putnami .
The presence of some polyphyleti c individuals between the T. c.triunguis and T. c. carolina clades is more difficult to explain. Specif- ically, two haplotypes containing T. c. carolina from GA, SC, VA, and NC are present within the T. c. triunguis clade for the haplotype net- work (haplotypes 12 and 29; Fig. 5), plus one additional haplotype for the phylogram (haplotype 3; Fig. 3). One T. c. triunguis haplo-type is also present in the T. c. carolina clade (haplotype 2). The ab- sence of haplotype 3 in the haplotype network makes sense because there was a reticulation loop in the network which we re- solved using coalescent theory (Crandall, 1994 ). As for the other polyphyleti c haplotypes, we suggest two possibilities. First, haplo- type 12 may represent an ancestral haplotype because it connects T. c. triunguis and T. c. carolina on the haplotype network (Fig. 5).Second, it is possible that incomplete lineage sorting has occurred for these polyphyletic and discordant individuals (Avise et al.,1983; Maddison, 1997; Neigel and Avise, 1986; Rosenberg,
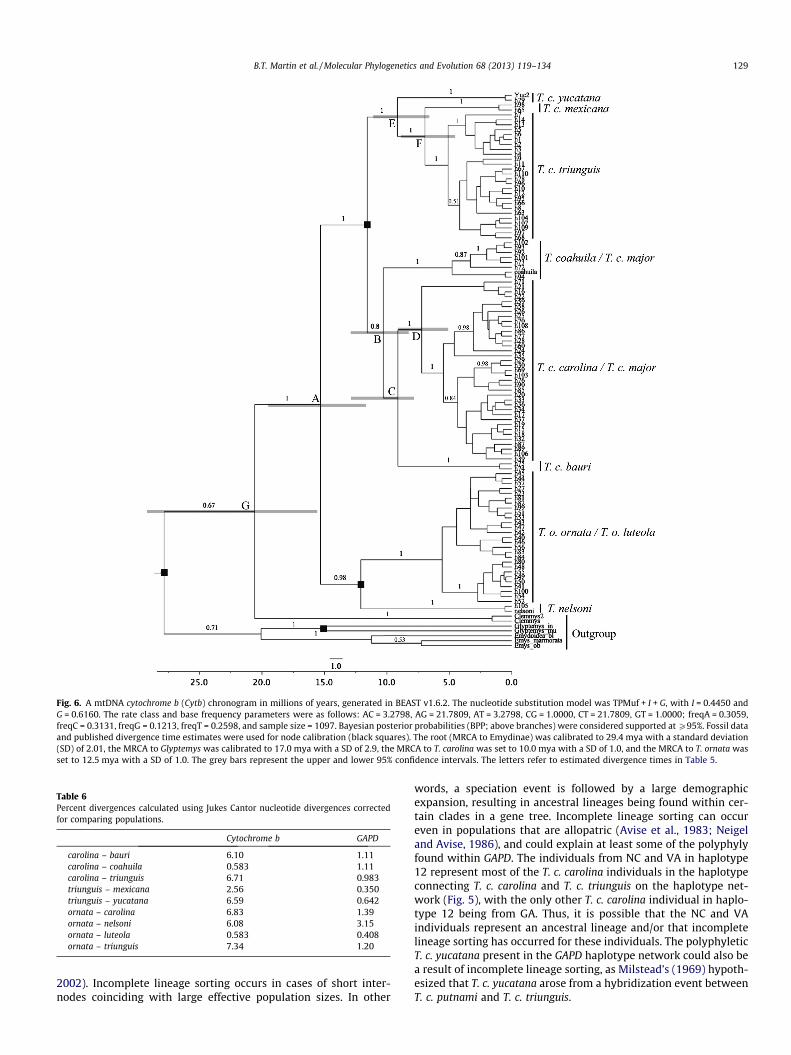
Fig. 6. A mtDNA cytochrome b (Cytb) chronogram in millions of years, generated in BEAST v1.6.2. The nucleotide substitution model was TPMuf + I + G, with I = 0.4450 and G = 0.6160. The rate class and base frequency parameters were as follows: AC = 3.2798, AG = 21.7809, AT = 3.2798, CG = 1.0000, CT = 21.7809, GT = 1.0000; freqA = 0.3059,freqC = 0.3131, freqG = 0.1213, freqT = 0.2598, and sample size = 1097. Bayesian posterior probabilities (BPP; above branches) were considered supported at P95%. Fossil data and published divergence time estimates were used for node calibration (black squares). The root (MRCA to Emydinae) was calibrated to 29.4 mya with a standard deviation (SD) of 2.01, the MRCA to Glyptemys was calibrated to 17.0 mya with a SD of 2.9, the MRCA to T. carolina was set to 10.0 mya with a SD of 1.0, and the MRCA to T. ornata was set to 12.5 mya with a SD of 1.0. The grey bars represent the upper and lower 95% confidence intervals. The letters refer to estimated divergence times in Table 5.
Table 6Percent divergences calculated using Jukes Cantor nucleotide divergences corrected for comparing populations.
Cytochrome b GAPD
carolina – bauri 6.10 1.11 carolina – coahuila 0.583 1.11 carolina – triunguis 6.71 0.983 triunguis – mexicana 2.56 0.350 triunguis – yucatana 6.59 0.642 ornata – carolina 6.83 1.39 ornata – nelsoni 6.08 3.15 ornata – luteola 0.583 0.408 ornata – triunguis 7.34 1.20
B.T. Martin et al. / Molecular Phylogenetics and Evolution 68 (2013) 119–134 129
2002). Incomplete lineage sorting occurs in cases of short inter- nodes coinciding with large effective population sizes. In other
words, a speciation event is followed by a large demograph icexpansion, resulting in ancestral lineages being found within cer- tain clades in a gene tree. Incomple te lineage sorting can occur even in populations that are allopatric (Avise et al., 1983; Neigel and Avise, 1986 ), and could explain at least some of the polyphyly found within GAPD. The individuals from NC and VA in haplotype 12 represent most of the T. c. carolina individuals in the haplotype connectin g T. c. carolina and T. c. triunguis on the haplotype net- work (Fig. 5), with the only other T. c. carolina individua l in haplo- type 12 being from GA. Thus, it is possible that the NC and VAindividua ls represent an ancestral lineage and/or that incomplete lineage sorting has occurred for these individuals. The polyphyletic T. c. yucatana present in the GAPD haplotype network could also bea result of incomplete lineage sorting, as Milstead’s (1969) hypoth-esized that T. c. yucatana arose from a hybridization event between T. c. putnami and T. c. triunguis .
Table 7Pairwise percent DNA sequence divergences for the cytochrome oxidase c subunit 1 (COI) gene. Percent divergences that indicate intraspecific relationships are denoted by �. Two clades, one consisting of solely T. c. major and the other consist ing of T. c. major and T. coahuila represent the two different T. c. major groups from Fig. 2.
triunguis coahuila luteola carolina bauri major-coah major mexicana nelsoni ornata yucatana triunguis –coahuila 5.66 –luteola 6.36 5.14 –carolina 6.17 4.97 5.14 –bauri 5.35 4.65 4.99 5.32 –major-coah 5.49 0.23 � 4.97 4.80 4.48 –major 6.08 4.97 5.06 0.78 � 5.49 4.80 –mexicana 1.40� 6.00 6.88 6.68 5.85 5.83 6.50 –nelsoni 6.57 6.00 5.00 6.00 5.53 6.17 5.92 7.08 –ornata 6.45 5.14 0.23 � 5.19 5.07 4.97 5.10 6.96 5.08 –yucatana 4.67 5.83 5.84 6.68 5.51 5.66 6.42 5.00 7.44 5.92 –
130 B.T. Martin et al. / Molecular Phylogenetics and Evolution 68 (2013) 119–134
It is possible that some of the polyphyly is a result of hybrids being present in an intergradation zone (Dodd, 2001 ). Butleret al. (2011) similarly identified several individuals from GA that molecularly resembled T. c. carolina but morphological ly resem- bled T. c. triunguis , giving an indication of hybridiza tion. The sam- pling localities of their GA samples are also near an intergradation zone of T. c. carolina , T. c. major , T. c. triunguis , and T. c. bauri in the Gulf Coast region (Fig. 1). Our SC samples are from the far south- west region of the state, and because of the close proximity ofsouthwest SC and GA, it is possible that this GA hybrid T. c. triun- guis - T. c. carolina population has spread to SC. This intergradation zone may also at least in part be responsible for the T. c. major andT. c. bauri polyphyly seen in our dataset. Lastly, the T. c. triunguis individuals in the T. c. carolina clade (haplotype 2; Figs. 3 and 5)consist of the some of the same individuals present in haplotype 29 within the T. c. triunguis clade, and the T. c. bauri haplotype inthe T. c. carolina clade also contains only one individual that is also present in the larger T. c. bauri haplotype within the T. c. triunguis clade. The HAPAR analysis split these individuals into two separate T. c. triunguis and T. c. bauri haplotypes, respectively , depending onthe resolution of the heterozygous characters. This could have re- sulted from of a low number of parsimoniously informative char- acters in the GAPD dataset. Despite polyphyly within some clades and some discordan ce between the mtDNA and nucDNA phyloge- nies, both phylogenies and haplotype networks are well resolved enough to interpret relationship s between T. c. carolina – T. c. triun- guis, T. ornata – T. nelsoni , and T. c. triunguis – T. c. mexicana – T. c.yucatana.
4.4. Assessing the population structure of Terrapene
4.4.1. Population structure based on AMOVA analyses The AMOVAs (Table 3) used to assess the separation or clump-
ing of T. o. ornata and T. o. luteola indicate a low amount of popu- lation structure for these taxa. This suggests that T. o. luteola and T.o. ornata be clumped into one group as T. ornata . For both Cytb andGAPD, the lowest amount of between-gr oup population structure isfound when assigning just two a priori groups consisting of the eastern and western clades, supporting that the east/west classifi-cation is not adequate for describing the population structure within Terrapene.
4.4.1.1. T. carolina population structure. The a priori AMOVA based on the presented mtDNA and nucDNA phylogenies indicates ahigher level of population structure than that of the morphological data of Minx (1996). Specifically, a higher amount of population structure is seen when assigning the T. c. triunguis – T. c. mexicana – T. c. yucatana clade into a unique group. This suggests that the current classification needs to be revised by elevating the triunguis– mexicana – yucatana clade to a separate species from T. carolina .
The apportionment of T. coahuila as a unique group is supported due to a lower amount of population structure seen when clump- ing T. coahuila into T. carolina , which supports the sustaining of T.coahuila as its own species. The population structure for T. c. bauri is higher when represented as a unique group suggesting that this group may be more divergen t from T. c. carolina than Minx (1996)hypothes ized. These results suggest that T. coahuila should remain a monotypic species and that T. c. bauri may need to be elevated tospecies status.
4.4.2. Population structure based on SAMOVA analyses The Cytb SAMOVA shows maximal genetic apportionment when
split into 19 groups (Table 4). However, the GAPD SAMOVA appor- tions Terrapene into seven groups (Table 5). For GAPD, several taxa share haplotypes in some cases, which reduces the number ofgroups. For example, a large haplotype consisting mostly of T. c. tri- unguis also contains a small number of sequence s from T. c. yucatana ,T. c. mexicana , T. c. major , and one T. c. carolina . This is the only hap- lotype in which T. c. mexicana is found and is one of only two haplo- types in which T. c. yucatana is found. The Cytb SAMOVA groups T.coahuila into its own unique group, but the GAPD SAMOVA combines T. coahuila with T. c. major from FL. The GAPD SAMOVA places T. c.major, T. c. bauri , T. c. triunguis – T. c. mexicana – T. c. yucatana , T. c. car- olina, and T. nelsoni , into unique groups, while T. o. luteola and T. o.ornata are allocated into the same group for both Cytb and GAPD.
The Cytb gene shows much more variation than GAPD. The in- creased number of unique groups seen for Cytb suggests that there is a barrier to gene flow within taxa. While this barrier may not have been present long enough to cause deep divergen ces for intraspeci fic relationshi ps with nucDNA, it is affecting faster evolv- ing genes.
These findings further support (1) separating T. c. triunguis – T. c.mexicana – T. c. yucatana from the rest of T. carolina and classifying them as a separate species, (2) that T. c. bauri may constitute its own species, (3) that T. coahuila is closely associate d with some,but not all, T. c. major haplotypes , suggesting multiple T. c. major lineages, and (4) that T. o. ornata and T. o. luteola should beclumped together as T. ornata (without subspecific designations)due to the apparent lack of population structure for these taxa.
4.5. Molecula r clock – possible explanations for the speciation ofTerrapene
Several historical geological and climatic events may explain the chronogram and estimate d divergence times (Table 5; Fig. 6).First, the divergence time for the split between the eastern and western groups occurred �15 mya. At this time in the middle -late Miocene (Barstovian Age), the climate in central North America (e.g., Kansas and Nebraska) was becoming warmer, and mesic areas were becoming interspersed with grasslands (for a review,
B.T. Martin et al. / Molecular Phylogenetics and Evolution 68 (2013) 119–134 131
see Axelrod, 1985; Berry, 1918; Chaney and Elias, 1936; Hesse,1936; Wolfe, 1985 ). In addition, the earliest known fossil box tur- tles were found in Barstovian deposits from �15 mya in Nebraska (Holman, 1987; Holman and Corner, 1985 ). Because T. o. ornata aretypically a more grassland-o riented species and T. carolina typicallyinhabit mesic woodlands (Dodd, 2001 ), it makes sense that the divergence between the eastern and western clades would have occurred �15 mya in the Barstovia n Age where savannah-like grasslands were becoming more abundant. The earliest fossils resembling T. ornata were also dated to �14.5 mya and were found in Barstovian deposits (Holman and Fritz, 2005 ), which further supports the estimate d divergence dates given in Table 5 and Fig. 6.
4.5.1. T. carolina In comparison, T. carolina tend to inhabit mesic woodlands
(Dodd, 2001 ). Progressing towards the late Miocene (�10 mya),much of eastern North America consisted of deciduou s forests that were gradually being separated by emerging grassland in the southeast (Graham, 1965; Webb, 1983; Woodburne , 2004 ), and the northeast was predominantly deciduous forest (Graham,1993; Janis et al., 1998; Mai, 1995 ; for a review, see Manchester ,1999; Tiffney, 1985a, 1985b; Wolfe, 1975 ). This coincides with the divergen ce of the T. carolina group because separation from the western group as a result of diverging habitat requirements may have resulted in speciation once box turtles began to migrate eastward. The divergen ce of the ancestral T. c. carolina lineage�7 mya in very late Miocene or early Pliocene climatic conditions makes sense geologically due to the woodland habitat seen in the in the northeastern part of the United States and the temperate cli- mate at the time (Woodbu rne, 2004 ). Lastly, during the very late Miocene or early Pliocene, climate change caused an increase inprovincialism in the North American biomes (Webb, 1977 ), which could have contributed to the speciation of Terrapene taxa.
4.5.2. T. c. bauri and T. c. major While T. c. bauri tend to inhabit mesic woodlands, they also are
often found in savannah-li ke biomes (Dodd, 2001 ). Because Florida developed more mesic habitats over time, it makes sense that T. c.bauri, which could have originated in savannah and salt marsh bio- mes that were present �10 mya in northern Florida and the Gulf Coast (Webb, 1977; Woodburne , 2004 ), would be more adaptive with their habitat preferences . In the middle to late Miocene (�12.5 mya – �5 mya), sea levels were generally receding and sed- iment from the Appalachi an Mountains filled the channel separat- ing central and lower Florida from the Gulf Coast (Randazzo and Jones, 1997 ). This land connection could have allowed the ancestor to T. c. bauri to migrate southwa rd into useable habitats that were present in southern Florida during the mid-late Miocene and early Pliocene (Wolfe, 1985 ). It is also possible that after box turtle migrations to peninsular Florida, vicariance events due to the ris- ing and receding of sea levels resulted in the separation and subse- quent speciation of an isolated ancestral population of T. c. bauri.Lastly, the MRCA to T. c. major and T. c. carolina diverged �7 mya,and this relatively recent divergence makes sense due to some non-monophy ly being found between the two taxa.
4.5.3. T. c. triunguis, T. c. mexicana , T. c. yucatana The T. c. yucatana lineage was estimated to have diverged from
the T. c. triunguis lineage earlier than T. c. mexicana , which is sup- ported by Milstead’s (1969) explanation of the origin of T. c. mexi- cana. He postulated that T. c. mexicana originated through anintergrade between T. c. yucatana and T. c. triunguis . It is possible that the MRCA of the T. c. yucatana and T. c. mexicana lineages dis- persed southward via coastal drainages along the eastern coast ofMexico that were not affected by the increasing aridity coming from the west (Rosen, 1978 ). It is also possible that the MRCA to
T. c. yucatana was genetically isolated after migrating to the Yuca- tan Peninsul a via the Isthmus of Tehuantep ec land bridge in the Pliocene and Pleistoce ne from �8 mya until �2.5 mya, when fluc-tuations in sea levels may have caused their isolation (Beardet al., 1982; Bryant et al., 1991; Mulcahy and Mendelso n, 2000;Mulcahy et al., 2006 ). Rosen (1978) also speculated that volcanic activity in the Pliocene could have isolated the Yucatan Peninsula,resulting in the divergen ce of T. c. yucatana from the ancestral lineage.
4.5.4. Comparisons with published divergence estimates Divergen ce estimates for Terrapene have been reported in the
literature (Near et al., 2005; Spinks and Shaffer, 2009 ), but these analyses are mostly focused on intergener ic classification and nostudies have been published that comprehensive ly analyzed the majority of the taxa within the genus. Thus, while we realize that the comparisons of our divergence estimate s with geographic and climatic events is speculative, this chronogram provides the firstdivergen ce time estimates for most taxa within Terrpaene andcan help in our understand ing of the climatic and geographic pro- cesses by which these groups diverged. The pairwise percent diver- gences also shed light on how divergent the taxa within Terrapeneare and provide quantitat ive evidence of taxonomic classificationsthat are in need of revisions.
4.6. Percent divergenc es
4.6.1. Cytb and GAPD Percent divergences were at interspeci fic levels between T. c.
carolina – T. c. triunguis , T. c. carolina – T. c. bauri , T. c. carolina –T. o. ornata , T. o. ornata – T. c. triunguis , and T. o. ornata – T. nelsoni for both mtDNA and nucDNA (Table 6). For only Cytb, percent divergen ces were at interspecific levels for T. c. triunguis – T. c.yucatana, and for only GAPD T. c. carolina – T. coahuila were atinterspeci fic levels. Each of these pairwise comparisons was equivalent to or greater than what Feldman and Parham (2002)and FitzSimmons and Hart (2007) considered as representing separate species for the mtDNA Cytb gene in Emydid turtles and nucDNA in freshwater turtles, respectively. In fact, many of these comparis ons are in the range for what are typically considered inter-fami ly divergence levels.
4.6.2. DNA barcoding The DNA barcoding results (Table 7) indicate that all taxa repre-
sent unique species except for T. c. triunguis – T. c. mexicana , T. o.ornata – T. o. luteola , and the T. c. major clade that did not include T. coahuila and T. c. carolina . The mutation rate of the COI gene isrelatively high, and as such it is useful for delineating congenerics and conspecific groups (Cox and Hebert, 2001; Wares and Cunn- ingham, 2001 ). DNA barcodin g has also been shown to be accurate in delineating species from one another (Hebert et al., 2003 ), which is useful for our dataset because some of the congeneric relation- ships within Terrapene are in question. Our barcoding data agree with all of the other analyses, and in light of this concordanc eand with the quantitative evidence that the DNA barcodin g analy- sis provides, it is evident that taxonomic revisions are needed within Terrapene.
5. Conclusion s
5.1. Recommen dations for classification revisions
Phylogenetic analyses, AMOVAs, SAMOVAs, haplotype net- works, pairwise percent divergences , and barcoding data all suggest that classification revisions are in order for Terrapene. With
132 B.T. Martin et al. / Molecular Phylogenetics and Evolution 68 (2013) 119–134
respect to the T. carolina group, all analyses support the splitting ofT. c. carolina and T. c. triunguis into separate species. We recom- mend that Terrapene c. triunguis be elevated to full species status as Terrapene mexicana triunguis. Terrapene c. mexicana and T. c.yucatana should be placed within T. mexicana as T. m. mexicana and T. m. yucatana . The species should be named T. mexicana be-cause mexicana was the earliest to be described (Gray, 1849 ). Ter-rapene c. bauri represents its own unique group from T. c. carolina according to the AMOVA and SAMOVA analyses, percent diver- gences, and DNA barcodin g data, but in the Cytb phylogeny the clade is not well-supported with bootstrap resampling or BPP and the clade is polyphyletic for the GAPD phylogeny. Thus, the phylogeneti c data are inconclus ive for T. c. bauri . Data are also inconclusive for T. c. major because of polyphyly . Due to the histor- ical affinity of T. c. major and T. c. bauri with T. c. carolina , these taxa should remain in T. carolina pending further analyses.
It is certainly possible that the polyphyly for T. c. major andincongruenc es between the Cytb and GAPD phylogenies are due to introgression and hybridizatio n. It is also possible that the thought to be extinct giant box turtle (Terrapene carolina putnami ;Hay, 1906 ) lineage still exists and is represented in one of the T. c.major clades, but we were unable to obtain DNA from fossil re- mains of T. c. putnami to verify this. Terrapene coahuila is closely associated with one of the T. c. major clades but is not well-re- solved in the phylogenies. The retention of T. coahuila as the sister species to T. carolina is supported by the Cytb haplotype network,the GAPD percent divergences, the Cytb SAMOVA , both the Cytband GAPD AMOVAs, and the barcoding data. However, due to the lack of resolution for T. coahuila in the phylogenies and the convo- luted association with T. c. major , we recommend that T. coahuila maintain its current specific status and remain the sister clade toT. carolina until additional data are available.
Terrapene o. ornata and T. o. luteola are very closely related and donot appear to be divergent enough to be considered separate subspe- cies. We recomme nd that these taxa should be clumped together asT. ornata , which disagrees with Herrmann and Rosen (2009), who found population structuring between T. o. ornata and T. o. luteola .Terrapene nelsoni should remain the sister species to T. ornata .
It is important to note that these data are based on just two mtDNA genes (Cytb and COI) and one nucDNA gene, and data for additional genes would be beneficial. Furthermor e, sequencing additional genes could be helpful with resolving some of the more ambiguous clades, such as T. c. bauri , T. c. major , and T. coahuila . Itshould be noted that while Bayesian inference is more sensitive tolow variability than is bootstrap resampling, this is both a blessing and a curse because it is possible that the posterior probabilitie s for GAPD could have been inflated due to short internodes in the phy- logeny (Alfaro et al., 2003 ). However, if the genetic barcodin g data are any indication, all taxa represent different species except for T.o. ornata – T. o. luteola and T. c. triunguis – T. c. mexicana . The bar- coding data agree with most of our other analyses in this regard.This dataset provides an important example that multiple types of analyses and multiple molecula r markers should be used before implementi ng any taxonomi c revisions. In the case of discordance between analyses, DNA barcoding percent divergences suggested by the literature to distinguish between species for COI should, per- haps, be used to reevaluate the data from other markers.
In conclusion, we recommend splitting Terrapene into five spe- cies (1) T. carolina , (2) T. mexicana , (3) T. coahuila , (4) T. ornata , and (5) T. nelsoni . Terrapene carolina should contain three subspecies (T.c. carolina , T. c. bauri , and T. c. major ). Terrapene mexicana shouldcontain three subspecies (T. m. mexicana , T. m. triunguis , and T. m.yucatana). While T. m. yucatana appeared to be a unique species based on the Cytb percent divergences and the barcodin g data,there was a limited sample size for this taxon and the nuclear data disagreed; thus, we recommend that yucatana remain with T. mex-
icana. Lastly, T. coahuila and T. ornata should be monotypic. Since we did not obtain any samples for T. n. klauberi evaluations could not be made between the subspecies of T. nelsoni .
5.2. Conserva tion implications
It is essential to have an understanding of the evolutionary his- tory of a group in need of conservation management, and these data have shed light on some of the evolutionary relationship swithin Terrapene. Because conservation efforts are typically spe- cies-based and tend to ignore subspecies, the splitting of T. carolina (with 6 subspecies ) into T. carolina and T. mexicana (with three sub- species each) will be important for future conservation manage- ment strategies. In addition, the Cytb SAMOVA analysis indicated restricted gene flow for some intraspecific populations. Having an understanding of the underlying genetics of intraspecific popu- lations is very important for successfully facilitating conservation managemen t strategies. As such, further population-level analyses are warranted to assess the genetic ‘‘health’’ of individua l popula- tions. Parameters including effective population sizes, inbreeding coefficients, and levels of heterozygos ity can shed light on the con- servation status of Terrapene, and while some work in this regard has already been done (e.g., Buchman et al., 2009; Cureton et al.,2009; Howeth et al., 2008; Kuo and Janzen, 2004 ), a wider range of populations and geographi c localities need to be sampled. Most previous work has focused on limited geographic ranges, and it will be useful to have an understanding of the conservati on status ofeach taxon throughout their range. Thus, while these data provide support for revising the Terrapene classification scheme, there isstill much work to be done in terms of finer-scale population genetics.
Future research for Terrapene should focus on two areas. First,additional mtDNA and nucDNA genes need to be sequence d to im- prove sample sizes. This may help to resolve some of the poorly supported clades and to provide further support for those that are supported . Second, finer-scale population genetic analyses should be performed to better assess the conservation status ofTerrapene and to provide insight into their underlying genetics sothat successful conservation managemen t strategie s can be em- ployed. It is our hope that the data within as well as additional data from future work will aid not only in our general understanding ofthe evolutionary history of Terrapene, but also with their conservati on.
Acknowled gments
We thank the University of Texas at Tyler for laborator y space and facilities. We also thank M. Bangs for his advice on analyzing the phylogenetic data and for his comments and critique of this manuscr ipt. The University of Texas at Tyler Office of Sponsored Research , Chelonian Research Foundation, Louis Stokes Alliance for Minority Participation (LSAMP), Department of Natural and Ap- plied Sciences and Faculty Development Program at Mount Mercy Universit y, Natural Heritage & Endange red Species Program of the Massachus etts Division of Fisheries and Wildlife, East Texas Herpe- tological Society, and National Box Turtle Conservation Committee provided funding for this research. Tissue samples were collected under a University of Texas at Tyler IACUC protocol (No. 2009- 02) issued to JSP.
Appendi x A. Supplementar y material
Supplement ary data associated with this article can be found, inthe online version, at http://dx.doi .org/10.1016/j.ympev.2013.03 .006.
B.T. Martin et al. / Molecular Phylogenetics and Evolution 68 (2013) 119–134 133
References
Agassiz, L., 1857. Contributions to the Natural History of the United States ofAmerica. Little, Brown, and Company, Boston, MA.
Alfaro, M.E., Zoller, S., Lutzoni, F., 2003. Bayes or bootstrap? A simulation study comparing the performance of bayesian Markov Chain Monte Carlo sampling and bootstrapping in assessing phylogenetic confidence. Mol. Biol. Evol. 20 (2),255–266.
Auffenberg, W., 1958. Fossil turtles of the genus Terrapene in Florida. Bull. Fla. State.Mus. 3, 53–92.
Auffenberg, W., 1959. A Pleistocene Terrapene hibernaculum, with remarks on asecond complete box turtle skull from Florida. J. Fla. Acad. Sci. 22, 49–53.
Auffenberg, W.W., Milstead, W.W., 1965. Reptiles in the quarternary of North America. In: Wright, H.E., Jr., Frey, D.G. (Eds.), The Quarternary in the United States. Princeton Univ. Press, Princeton, New Jersey, pp. 557–568.
Avise, J.C., Shapira, J.F., Daniel, S.W., Aquadro, C.F., Lansman, R.A., 1983.Mitochondrial DNA differentiation during the speciation process inPeromyscus. Mol. Biol. Evol. 1 (1), 38–56.
Axelrod, D.I., 1985. Rise of the grassland biome, central North America. Bot. Rev. 51(2), 163–201.
Beard, J.H., Sangree, J.B., Smith, L.A., 1982. Quaternary chronology, paleoclimate,depositional sequences, and eustatic cycles. Am. Assoc. Pet. Geol. Bull. 66, 158–169.
Berry, E.W., 1918. Fossil plants from the late Tertiary of Oklahoma. Proc. U.S. Natl.Mus. 54, 627–636.
Bickham, J.W., Lamb, T., Minx, P., Patton, J.C., 1996. Molecular systematics of the genus Clemmys and the intergeneric relationships of emydid turtles.Herpetologica 52 (1), 89–97.
Bramble, D.M., 1974. Emydid shell kinesis: biomechanics and evolution. Copeia 1974, 707–727.
Bryant, W.R., Lugo, J., Cordova, C., Salvador, A., 1991. Physiography and bathymetry.In: Salvador, A. (Ed.), The Gulf of Mexico Basin: the Geology of North America,Vol. J. Geological Society of America, Boulder, CO, pp. 13–30.
Buchman, A.B., Deaton, R., Randle, C.P., Brummel, T., Wilson, E.D., Lutterschmidt,W.I., 2009. Isolation and characterization of polymorphic microsatellite loci for the three-toed box turtle (Terrapene carolina triunguis ) and cross-amplificationin other Terrapene species. Mol. Ecol. Resour. 9 (4), 1169–1171.
Butler, J.M., Dodd Jr., C.K., Aresco, M., Austin, J.D., 2011. Morphological and molecular evidence indicates that the Gulf Coast box turtle (Terrapene carolina major) is not a distinct evolutionary lineage in the Florida Panhandle. Biol. J.Linn. Soc. Lond. 102, 889–901.
Carr, A.E., 1940. A contribution to the herpetology of Florida. Univ. Florida Publ.,Biol. Sci. 3, 100–101.
Carr, A.E., 1952. Handbook of Turtles: The Turtles of the United States and Canada and Baja California. Cornell University Press, Ithaca, New York.
Chaney, R.W. and Elias, M.K., 1936. Late tertiary floras from the high plains. Publ.Carnegie Inst. Wash. 476, 1–46.
Conant, R., Collins, J.T., 1991. A Field Guide to the Reptiles and Amphibians ofEastern and Central North America, 3rd ed. Houghton Mifflin, Boston,Massachusetts.
Cox, A.J., Hebert, P.D.N., 2001. Colonization, extinction and phylogeographic patterning in a freshwater crustacean. Mol. Ecol. 10, 371–386.
Crandall, K.A., 1994. Intraspecific cladogram estimation – accuracy at higher levels of divergence. Syst. Biol. 43 (2), 222–235.
Cunningham, C.W., 1997. Can three incongruence tests predict when data should becombined? Mol. Biol. Evol. 14 (7), 733–740.
Cureton II, J.C., Buchman, A.B., Randle, C.P., Lutterschmidt, W.I., Deaton, R., 2009.Characterization of ten novel microsatellite loci for the threatened ornate box turtle, Terrapene ornata . Conserv. Genet. Resour. 1 (1), 141–143.
Dodd, K.C., 2001. North American Box Turtles, A Natural History. University ofOklahoma Press, Norman.
Dolman, G., Phillips, B., 2004. Single copy nuclear DNA markers characterized for comparative phylogeography in Australian wet tropics rainforest skinks. Mol.Ecol. Notes 4 (2), 185–187.
Drummond, A.J., Rambaut, A., 2007. BEAST: Bayesian evolutionary analysis bysampling trees. BMC Evol. Biol. 7, 214.
Dupanloup, I., Schneider, S., Excoffier, L., 2002. A simulated annealing approach to define the genetic structure of populations. Mol. Ecol. 11 (12), 2571–2581.
Engstrom, T.N., Edwards, T., Osentoski, T.F., Myers, E.M., 2007. A compendium ofPCR primers for mtDNA, microsatellite, and other nuclear loci for freshwater turtles and tortoises. Chel. Res. Monogr. 4, 124–141.
Excoffier, L., Smouse, P.E., Quattro, J.M., 1992. Analysis of molecular variance inferred from metric distances among DNA haplotypes – application to human mitochondrial-DNA restriction data. Genetics 131 (2), 479–491.
Excoffier, L., Laval, G., Schneider, S., 2005. Arlequin (version 3.0): an integrated software package for population genetics data analysis. Evol. Bioinform. 1, 47–50.
Farris, J.S., Kallersjo, M., Kluge, A.G., Bult, C., 1994. Testing significance ofincongruence. Cladistics 10 (3), 315–319.
Feldman, C.R., Parham, J.F., 2002. Molecular phylogenetics of emydine turtles:taxonomic revision and the evolution of shell kinesis. Mol. Phylogenet. Evol. 22(3), 388–398.
Felsenstein, J., 1981. Evolutionary trees from DNA-sequences – a maximum- likelihood approach. J. Mol. Evol. 17 (6), 368–376.
Felsenstein, J., 1985. Confidence-limits on phylogenies – an approach using the bootstrap. Evolution 39 (4), 783–791.
FitzSimmons, N.N., Hart, K.M., 2007. Genetic studies of freshwater turtles and tortoises: a review of the past 70 years. Chel. Res. Monogr. 4, 15–46.
Friesen, V.L., Congdon, B.C., Walsh, H.E., Birt, T.P., 1997. Intron variation in marbled murrelets detected using analyses of single-stranded conformational polymorphisms. Mol. Ecol. 6, 1047–1058.
Fu, Y.X., Li, W.H., 1993. Statistical tests of neutrality of mutations. Genetics 133 (3),693–709.
Graham, A., 1965. Origin and evolution of the biota of southeastern North America:evidence from the fossil plant record. Evolution 18, 571–585.
Graham, A., 1993. History of the Vegetation Cretaceous (Maastrichtian) – Tertiary,Flora of North America North of Mexico, vol. 1. Oxford University Press, New York, pp. 57–70.
Gray, J.E., 1849. Description of a new species of box tortoise from Mexico. J. Zool. 17,16–17.
Guindon, S., Dufayard, J.-F., Lefort, V., Anisimova, M., Hordijk, W., Gascuel, O., 2010.New algorithms and methods to estimate maximum-likelihood phylogenies:assessing the performance of PhyML 3.0. Syst. Biol. 59 (3), 307–321.
Hay, O.P., 1906. Descriptions of two new genera (Echmatemys and Xenochelys) and two new species (Xenochelys formosa and Terrapene putnami ) of fossil turtles.Bull. Am. Mus. Nat. Hist. 22, 27.
Hebert, P.D.N., Cywinska, A., Ball, S.L., deWaard, J.R., 2003. Biological identificationsthrough DNA barcodes. Proc. R. Soc. Lond. B Biol. Sci. 270, 313–321.
Herrmann, H., Rosen, P.C., 2009. Conservation of aridlands turtles III: preliminary genetic studies of the desert box turtle and yaqui slider. Sonoran Herpetologist 22 (4), 38–43.
Hesse, C.J., 1936. Lower Pliocene vertebrate fossils from the Ogallala Formation (Laverne Zone) of Beaver County, Oklahoma. Publ. Carnegie Inst. Wash. 476, 47–72.
Hillis, D.M., Bull, J.J., 1993. An empirical test of bootstrapping as a method for assessing confidence in phylogenetic analyses. Syst. Biol. 42, 182–192.
Holman, J.A., 1987. Herpetofauna of the Egelhoff site (Miocene: Barstovian) ofNorth-Central Nebraska. J. Vertebr. Paleontol. 1987, 109–120.
Holman, J.A., Corner, R.G., 1985. A Miocene Terrapene (Testudines, Emydidae) and other barstovian turtles from south-central Nebraska. Herpetologica 41 (1), 88–93.
Holman, J.A., Fritz, U., 2005. The box turtle genus Terrapene (Testudines: Emydidae)in the Miocene of the USA. Herpetol. J. 15 (2), 81–90.
Howeth, J.G., McGaugh, S.E., Hendrickson, D.A., 2008. Contrasting demographic and genetic estimates of dispersal in the endangered Coahuilan box turtle: acontemporary approach to conservation. Mol. Ecol. 17 (19), 4209–4221.
Huelsenbeck, J.P., Ronquist, F., 2001. MRBAYES: Bayesian inference of phylogenetic trees. Bioinformatics 17 (8), 754–755.
Ivanova, N.V., Zemlak, T.S., Hanner, R.H., Hebert, P.D.N., 2007. Universal primer cocktails for fish DNA barcoding. Mol. Ecol. Notes 6, 998–1002.
Janis, C.M., Scott, K.M., Jacobs, L.L., 1998. The Evolution of Tertiary Mammals inNorth America. Cambridge University Press, New York.
Jukes, T.H., Cantor, C.R., 1969. Evolution of protein molecules. In: Muntro, N.H. (Ed.),Mammalian Metabolism III. Academic, New York, pp. 21–132.
Kuo, C.H., Janzen, F.J., 2004. Genetic effects of a persistent bottleneck on a natural population of ornate box turtles (Terrapene ornata ). Conserv. Genet. 5 (4), 425–437.
Larget, B., Simon, D.L., 1999. Markov chain Monte Carlo algorithms for the Bayesian analysis of phylogenetic trees. Mol. Biol. Evol. 16 (6), 750–759.
Librado, P., Rozas, J., 2009. DnaSP v5: a software for comprehensive analysis of DNA polymorphism data. Bioinformatics 25, 1451–1452.
Linnaeus, C., 1758. Systema Naturae, vol. 1, 10th ed. Laurentius Salvius, Holmia.Losos, J.B., Hillis, D.M., Greene, H.W., 2012. Who speaks with a forked tongue?
Science 338 (6113), 1428–1429.Maddison, W.P., 1997. Gene trees in species trees. Syst. Biol. 46 (3), 523–536.Maddison, W.P., Maddison, D.R., 1989. Interactive analysis of phylogeny and
character evolution using the computer program MacClade. Int. J. Primatol. 53,190–202.
Mai, D.H., 1995. Tertiare Vegetationsgeschichte Eueropas. Gustav Fischer, Jena,Germany.
Manchester, S.R., 1999. Biogeographical relationships of North American tertiary floras. Ann. MO. Bot. Gard. 86, 472–522.
Mau, B., 1996. Bayesian Phylogenetic Inference via Markov Chain Monte Carlo methods. PhD Dissertation. University of Wisconsin, Madison.
Mau, B., Newton, M., 1997. Phylogenetic inference for binary data on dendrograms using Markov chain Monte Carlo. J. Comput. Graph. Stat. 6, 122–131.
Mau, B., Newton, M.A., Larget, B., 1999. Bayesian phylogenetic inference via Markov chain Monte Carlo methods. Biometrics 55 (1), 1–12.
Mickevich, M., Farris, J.S., 1981. The implications of congruence in Menidia. Syst.Zool. 30 (3), 351–370.
Milstead, W.W., 1969. Studies on the evolution of the box turtles (genus Terrapene).Bull. Fla. State. Mus. 14, 1–113.
Minx, P., 1992. Variation in phalangeal formulas in the turtle genus Terrapene. J.Herpetol. 26 (2), 234–238.
Minx, P., 1996. Phylogenetic relationships among the box turtles, Genus Terrapene.Herpetologica 52 (4), 584–597.
Mulcahy, D.G., Mendelson III, J.R., 2000. Phylogeography and speciation of the morphologically variable, widespread species Bufo valliceps , based on molecular evidence from mtDNA. Mol. Phylogenet. Evol. 17, 173–189.
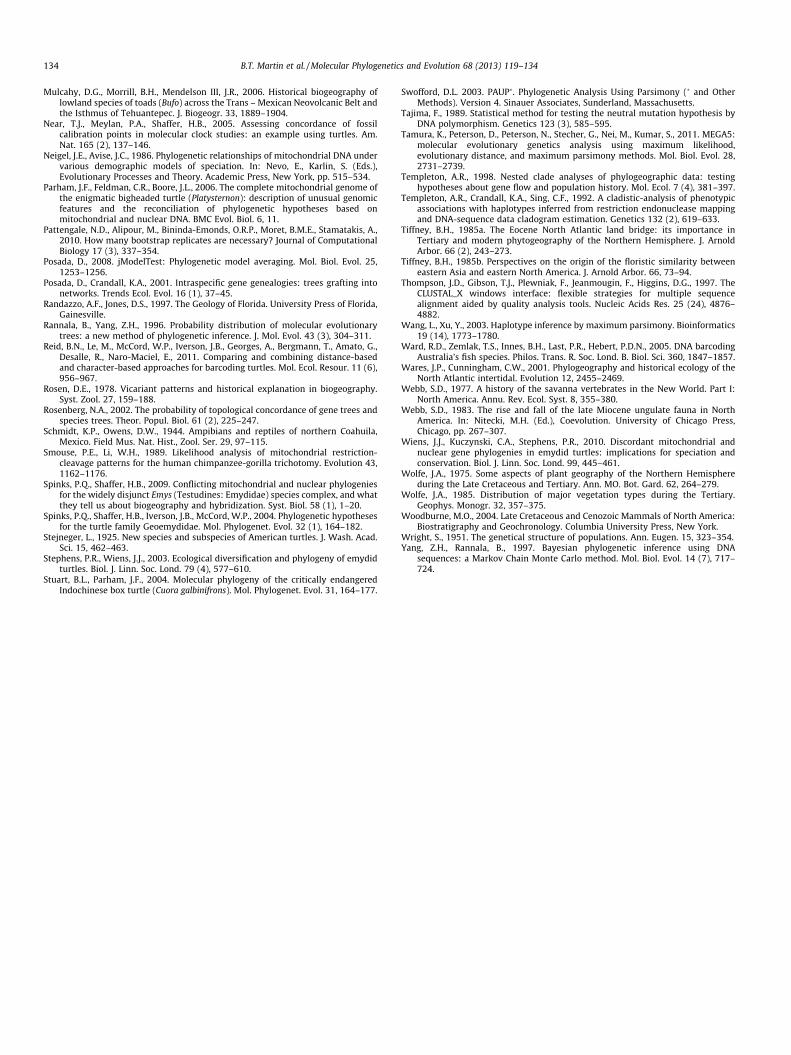
134 B.T. Martin et al. / Molecular Phylogenetics and Evolution 68 (2013) 119–134
Mulcahy, D.G., Morrill, B.H., Mendelson III, J.R., 2006. Historical biogeography oflowland species of toads (Bufo) across the Trans – Mexican Neovolcanic Belt and the Isthmus of Tehuantepec. J. Biogeogr. 33, 1889–1904.
Near, T.J., Meylan, P.A., Shaffer, H.B., 2005. Assessing concordance of fossil calibration points in molecular clock studies: an example using turtles. Am.Nat. 165 (2), 137–146.
Neigel, J.E., Avise, J.C., 1986. Phylogenetic relationships of mitochondrial DNA under various demographic models of speciation. In: Nevo, E., Karlin, S. (Eds.),Evolutionary Processes and Theory. Academic Press, New York, pp. 515–534.
Parham, J.F., Feldman, C.R., Boore, J.L., 2006. The complete mitochondrial genome ofthe enigmatic bigheaded turtle (Platysternon): description of unusual genomic features and the reconciliation of phylogenetic hypotheses based onmitochondrial and nuclear DNA. BMC Evol. Biol. 6, 11.
Pattengale, N.D., Alipour, M., Bininda-Emonds, O.R.P., Moret, B.M.E., Stamatakis, A.,2010. How many bootstrap replicates are necessary? Journal of Computational Biology 17 (3), 337–354.
Posada, D., 2008. jModelTest: Phylogenetic model averaging. Mol. Biol. Evol. 25,1253–1256.
Posada, D., Crandall, K.A., 2001. Intraspecific gene genealogies: trees grafting into networks. Trends Ecol. Evol. 16 (1), 37–45.
Randazzo, A.F., Jones, D.S., 1997. The Geology of Florida. University Press of Florida,Gainesville.
Rannala, B., Yang, Z.H., 1996. Probability distribution of molecular evolutionary trees: a new method of phylogenetic inference. J. Mol. Evol. 43 (3), 304–311.
Reid, B.N., Le, M., McCord, W.P., Iverson, J.B., Georges, A., Bergmann, T., Amato, G.,Desalle, R., Naro-Maciel, E., 2011. Comparing and combining distance-based and character-based approaches for barcoding turtles. Mol. Ecol. Resour. 11 (6),956–967.
Rosen, D.E., 1978. Vicariant patterns and historical explanation in biogeography.Syst. Zool. 27, 159–188.
Rosenberg, N.A., 2002. The probability of topological concordance of gene trees and species trees. Theor. Popul. Biol. 61 (2), 225–247.
Schmidt, K.P., Owens, D.W., 1944. Ampibians and reptiles of northern Coahuila,Mexico. Field Mus. Nat. Hist., Zool. Ser. 29, 97–115.
Smouse, P.E., Li, W.H., 1989. Likelihood analysis of mitochondrial restriction- cleavage patterns for the human chimpanzee-gorilla trichotomy. Evolution 43,1162–1176.
Spinks, P.Q., Shaffer, H.B., 2009. Conflicting mitochondrial and nuclear phylogenies for the widely disjunct Emys (Testudines: Emydidae) species complex, and what they tell us about biogeography and hybridization. Syst. Biol. 58 (1), 1–20.
Spinks, P.Q., Shaffer, H.B., Iverson, J.B., McCord, W.P., 2004. Phylogenetic hypotheses for the turtle family Geoemydidae. Mol. Phylogenet. Evol. 32 (1), 164–182.
Stejneger, L., 1925. New species and subspecies of American turtles. J. Wash. Acad.Sci. 15, 462–463.
Stephens, P.R., Wiens, J.J., 2003. Ecological diversification and phylogeny of emydid turtles. Biol. J. Linn. Soc. Lond. 79 (4), 577–610.
Stuart, B.L., Parham, J.F., 2004. Molecular phylogeny of the critically endangered Indochinese box turtle (Cuora galbinifrons ). Mol. Phylogenet. Evol. 31, 164–177.
Swofford, D.L. 2003. PAUP �. Phylogenetic Analysis Using Parsimony (� and Other Methods). Version 4. Sinauer Associates, Sunderland, Massachusetts.
Tajima, F., 1989. Statistical method for testing the neutral mutation hypothesis byDNA polymorphism. Genetics 123 (3), 585–595.
Tamura, K., Peterson, D., Peterson, N., Stecher, G., Nei, M., Kumar, S., 2011. MEGA5:molecular evolutionary genetics analysis using maximum likelihood,evolutionary distance, and maximum parsimony methods. Mol. Biol. Evol. 28,2731–2739.
Templeton, A.R., 1998. Nested clade analyses of phylogeographic data: testing hypotheses about gene flow and population history. Mol. Ecol. 7 (4), 381–397.
Templeton, A.R., Crandall, K.A., Sing, C.F., 1992. A cladistic-analysis of phenotypic associations with haplotypes inferred from restriction endonuclease mapping and DNA-sequence data cladogram estimation. Genetics 132 (2), 619–633.
Tiffney, B.H., 1985a. The Eocene North Atlantic land bridge: its importance inTertiary and modern phytogeography of the Northern Hemisphere. J. Arnold Arbor. 66 (2), 243–273.
Tiffney, B.H., 1985b. Perspectives on the origin of the floristic similarity between eastern Asia and eastern North America. J. Arnold Arbor. 66, 73–94.
Thompson, J.D., Gibson, T.J., Plewniak, F., Jeanmougin, F., Higgins, D.G., 1997. The CLUSTAL_X windows interface: flexible strategies for multiple sequence alignment aided by quality analysis tools. Nucleic Acids Res. 25 (24), 4876–4882.
Wang, L., Xu, Y., 2003. Haplotype inference by maximum parsimony. Bioinformatics 19 (14), 1773–1780.
Ward, R.D., Zemlak, T.S., Innes, B.H., Last, P.R., Hebert, P.D.N., 2005. DNA barcoding Australia’s fish species. Philos. Trans. R. Soc. Lond. B. Biol. Sci. 360, 1847–1857.
Wares, J.P., Cunningham, C.W., 2001. Phylogeography and historical ecology of the North Atlantic intertidal. Evolution 12, 2455–2469.
Webb, S.D., 1977. A history of the savanna vertebrates in the New World. Part I:North America. Annu. Rev. Ecol. Syst. 8, 355–380.
Webb, S.D., 1983. The rise and fall of the late Miocene ungulate fauna in North America. In: Nitecki, M.H. (Ed.), Coevolution. University of Chicago Press,Chicago, pp. 267–307.
Wiens, J.J., Kuczynski, C.A., Stephens, P.R., 2010. Discordant mitochondrial and nuclear gene phylogenies in emydid turtles: implications for speciation and conservation. Biol. J. Linn. Soc. Lond. 99, 445–461.
Wolfe, J.A., 1975. Some aspects of plant geography of the Northern Hemisphere during the Late Cretaceous and Tertiary. Ann. MO. Bot. Gard. 62, 264–279.
Wolfe, J.A., 1985. Distribution of major vegetation types during the Tertiary.Geophys. Monogr. 32, 357–375.
Woodburne, M.O., 2004. Late Cretaceous and Cenozoic Mammals of North America:Biostratigraphy and Geochronology. Columbia University Press, New York.
Wright, S., 1951. The genetical structure of populations. Ann. Eugen. 15, 323–354.Yang, Z.H., Rannala, B., 1997. Bayesian phylogenetic inference using DNA
sequences: a Markov Chain Monte Carlo method. Mol. Biol. Evol. 14 (7), 717–724.