Embed Size (px)
Citation preview

Working Paper Research
Monetary policy, asset prices and macroeconomic conditions : a panel-VAR study
by Katrin Assenmacher-Wesche and Stefan Gerlach
October 2008 No 149

NBB WORKING PAPER No. 149 - OCTOBER 2008
Editorial Director
Jan Smets, Member of the Board of Directors of the National Bank of Belgium
Editorial
On October 16-17, 2008 the National Bank of Belgium hosted a Conference on "Towards an
integrated macro-finance framework for monetary policy analysis".
Papers presented at this conference are made available to a broader audience in the NBB Working
Paper Series (www.nbb.be).
Statement of purpose:
The purpose of these working papers is to promote the circulation of research results (Research Series) and analyticalstudies (Documents Series) made within the National Bank of Belgium or presented by external economists in seminars,conferences and conventions organised by the Bank. The aim is therefore to provide a platform for discussion. The opinionsexpressed are strictly those of the authors and do not necessarily reflect the views of the National Bank of Belgium.
Orders
For orders and information on subscriptions and reductions: National Bank of Belgium,Documentation - Publications service, boulevard de Berlaimont 14, 1000 Brussels
Tel +32 2 221 20 33 - Fax +32 2 21 30 42
The Working Papers are available on the website of the Bank: http://www.nbb.be
© National Bank of Belgium, Brussels
All rights reserved.Reproduction for educational and non-commercial purposes is permitted provided that the source is acknowledged.
ISSN: 1375-680X (print)ISSN: 1784-2476 (online)
Monetary Policy, Asset Prices and Macroeconomic Conditions: A Panel-VAR Study
Katrin Assenmacher-Wesche∗ Research Department Swiss National Bank
Stefan Gerlach Institute for Monetary and Financial Stability
Goethe University, Frankfurt
Preliminary Draft 6 October 2008
Abstract
This paper studies the relationships between inflation, economic activity, credit, monetary policy, and residential property and equity prices in 17 OECD countries, using quarterly data for 1986-2006. Using a panel VAR, we find plausible and significant responses to a monetary policy shock. Shocks to asset prices have a positive, significant effect on GDP and credit after three to four quarters, whereas prices start to increase much later. We also consider the transmission of US shocks from the US to the other economies. While monetary policy shocks are transmitted internationally, other shocks are not, perhaps because of the form of coefficient restrictions used.
Keywords: asset prices, credit, monetary policy, panel VAR.
JEL Number: C23, E52
∗ This paper was prepared for the conference on ʺTowards an Integrated Macrofinance Framework for Monetary Policy Analysisʺ organised by the National Bank of Belgium, October 16 - 17, 2008 in Brussels. The views expressed are solely our own and are not necessarily shared by the SNB. Contact information: Katrin Assenmacher-Wesche (corresponding author): SNB, Börsenstrasse 15, Postfach 2800, CH-8022 Zürich, Switzerland, Tel +41 44 631 3824, email: [email protected]; Stefan Gerlach: IMFS, Goethe University, Grüneburgplatz 1 (Box H 12), 60629 Frankfurt/Main, Germany, email: [email protected].
1
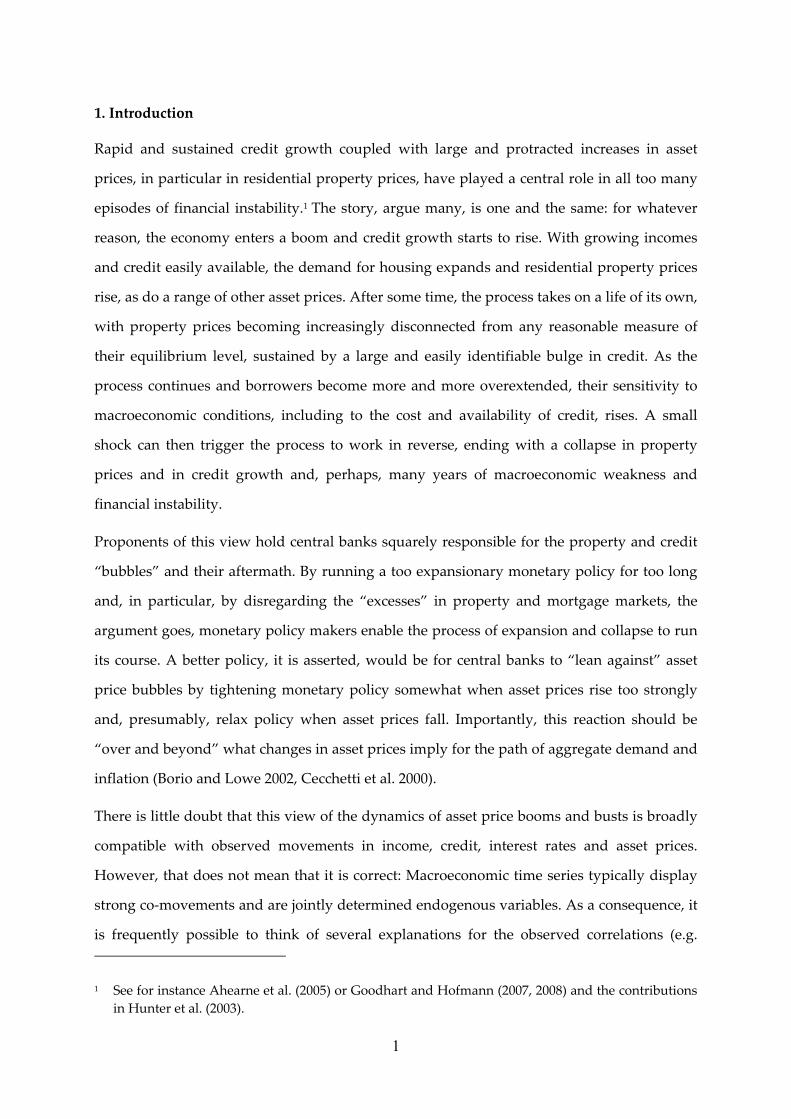
1. Introduction
Rapid and sustained credit growth coupled with large and protracted increases in asset
prices, in particular in residential property prices, have played a central role in all too many
episodes of financial instability.1 The story, argue many, is one and the same: for whatever
reason, the economy enters a boom and credit growth starts to rise. With growing incomes
and credit easily available, the demand for housing expands and residential property prices
rise, as do a range of other asset prices. After some time, the process takes on a life of its own,
with property prices becoming increasingly disconnected from any reasonable measure of
their equilibrium level, sustained by a large and easily identifiable bulge in credit. As the
process continues and borrowers become more and more overextended, their sensitivity to
macroeconomic conditions, including to the cost and availability of credit, rises. A small
shock can then trigger the process to work in reverse, ending with a collapse in property
prices and in credit growth and, perhaps, many years of macroeconomic weakness and
financial instability.
Proponents of this view hold central banks squarely responsible for the property and credit
“bubbles” and their aftermath. By running a too expansionary monetary policy for too long
and, in particular, by disregarding the “excesses” in property and mortgage markets, the
argument goes, monetary policy makers enable the process of expansion and collapse to run
its course. A better policy, it is asserted, would be for central banks to “lean against” asset
price bubbles by tightening monetary policy somewhat when asset prices rise too strongly
and, presumably, relax policy when asset prices fall. Importantly, this reaction should be
“over and beyond” what changes in asset prices imply for the path of aggregate demand and
inflation (Borio and Lowe 2002, Cecchetti et al. 2000).
There is little doubt that this view of the dynamics of asset price booms and busts is broadly
compatible with observed movements in income, credit, interest rates and asset prices.
However, that does not mean that it is correct: Macroeconomic time series typically display
strong co-movements and are jointly determined endogenous variables. As a consequence, it
is frequently possible to think of several explanations for the observed correlations (e.g.
1 See for instance Ahearne et al. (2005) or Goodhart and Hofmann (2007, 2008) and the contributions in Hunter et al. (2003).
2
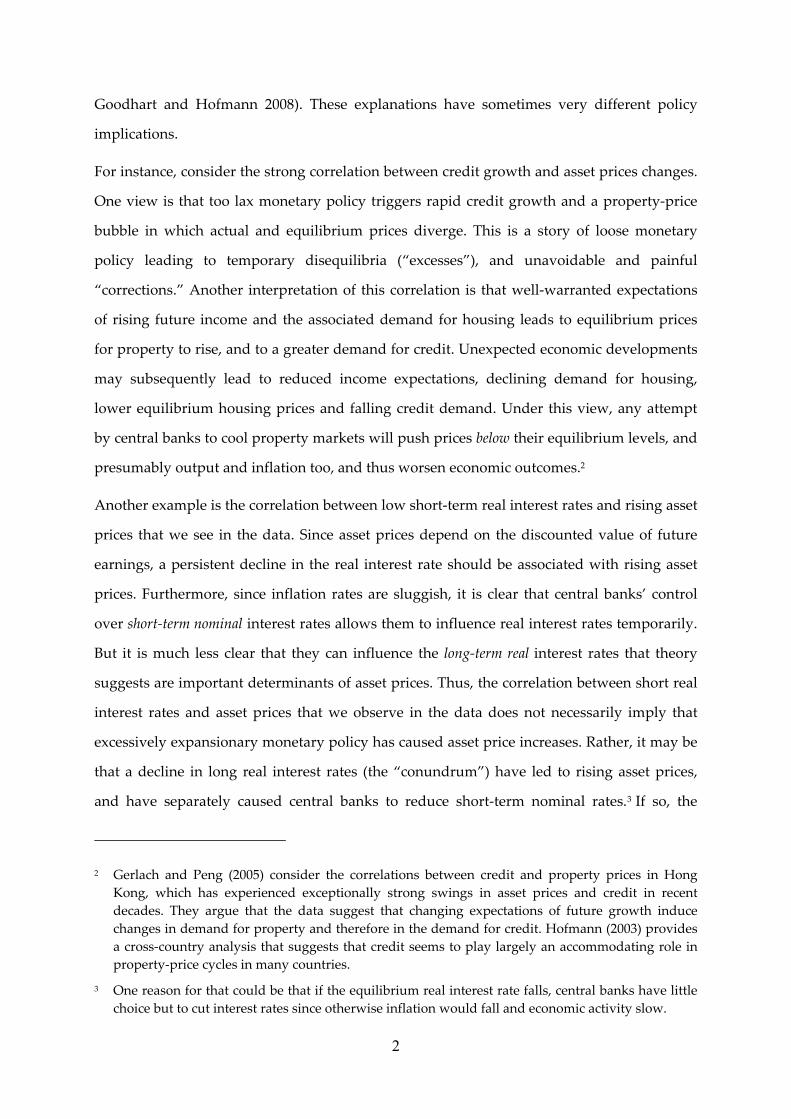
Goodhart and Hofmann 2008). These explanations have sometimes very different policy
implications.
For instance, consider the strong correlation between credit growth and asset prices changes.
One view is that too lax monetary policy triggers rapid credit growth and a property-price
bubble in which actual and equilibrium prices diverge. This is a story of loose monetary
policy leading to temporary disequilibria (“excesses”), and unavoidable and painful
“corrections.” Another interpretation of this correlation is that well-warranted expectations
of rising future income and the associated demand for housing leads to equilibrium prices
for property to rise, and to a greater demand for credit. Unexpected economic developments
may subsequently lead to reduced income expectations, declining demand for housing,
lower equilibrium housing prices and falling credit demand. Under this view, any attempt
by central banks to cool property markets will push prices below their equilibrium levels, and
presumably output and inflation too, and thus worsen economic outcomes.2
Another example is the correlation between low short-term real interest rates and rising asset
prices that we see in the data. Since asset prices depend on the discounted value of future
earnings, a persistent decline in the real interest rate should be associated with rising asset
prices. Furthermore, since inflation rates are sluggish, it is clear that central banks’ control
over short-term nominal interest rates allows them to influence real interest rates temporarily.
But it is much less clear that they can influence the long-term real interest rates that theory
suggests are important determinants of asset prices. Thus, the correlation between short real
interest rates and asset prices that we observe in the data does not necessarily imply that
excessively expansionary monetary policy has caused asset price increases. Rather, it may be
that a decline in long real interest rates (the “conundrum”) have led to rising asset prices,
and have separately caused central banks to reduce short-term nominal rates.3 If so, the
2 Gerlach and Peng (2005) consider the correlations between credit and property prices in Hong Kong, which has experienced exceptionally strong swings in asset prices and credit in recent decades. They argue that the data suggest that changing expectations of future growth induce changes in demand for property and therefore in the demand for credit. Hofmann (2003) provides a cross-country analysis that suggests that credit seems to play largely an accommodating role in property-price cycles in many countries.
3 One reason for that could be that if the equilibrium real interest rate falls, central banks have little choice but to cut interest rates since otherwise inflation would fall and economic activity slow.
3
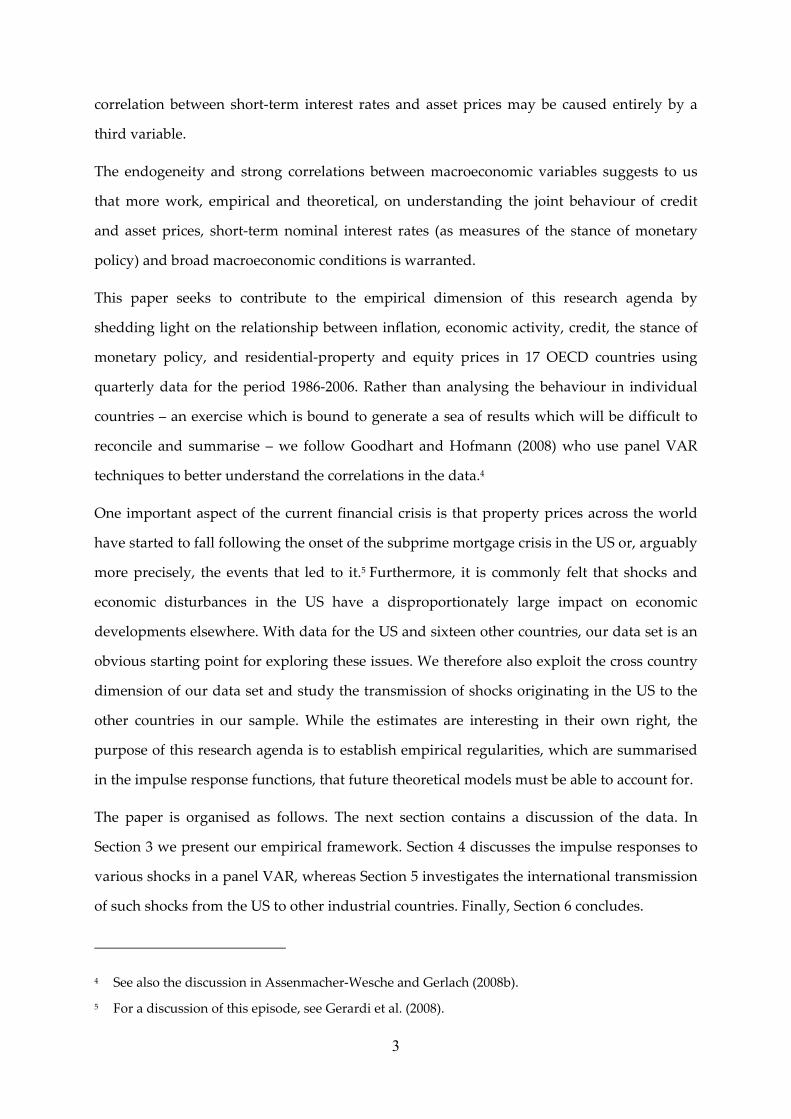
correlation between short-term interest rates and asset prices may be caused entirely by a
third variable.
The endogeneity and strong correlations between macroeconomic variables suggests to us
that more work, empirical and theoretical, on understanding the joint behaviour of credit
and asset prices, short-term nominal interest rates (as measures of the stance of monetary
policy) and broad macroeconomic conditions is warranted.
This paper seeks to contribute to the empirical dimension of this research agenda by
shedding light on the relationship between inflation, economic activity, credit, the stance of
monetary policy, and residential-property and equity prices in 17 OECD countries using
quarterly data for the period 1986-2006. Rather than analysing the behaviour in individual
countries – an exercise which is bound to generate a sea of results which will be difficult to
reconcile and summarise – we follow Goodhart and Hofmann (2008) who use panel VAR
techniques to better understand the correlations in the data.4
One important aspect of the current financial crisis is that property prices across the world
have started to fall following the onset of the subprime mortgage crisis in the US or, arguably
more precisely, the events that led to it.5 Furthermore, it is commonly felt that shocks and
economic disturbances in the US have a disproportionately large impact on economic
developments elsewhere. With data for the US and sixteen other countries, our data set is an
obvious starting point for exploring these issues. We therefore also exploit the cross country
dimension of our data set and study the transmission of shocks originating in the US to the
other countries in our sample. While the estimates are interesting in their own right, the
purpose of this research agenda is to establish empirical regularities, which are summarised
in the impulse response functions, that future theoretical models must be able to account for.
The paper is organised as follows. The next section contains a discussion of the data. In
Section 3 we present our empirical framework. Section 4 discusses the impulse responses to
various shocks in a panel VAR, whereas Section 5 investigates the international transmission
of such shocks from the US to other industrial countries. Finally, Section 6 concludes.
4 See also the discussion in Assenmacher-Wesche and Gerlach (2008b).
5 For a discussion of this episode, see Gerardi et al. (2008).
4
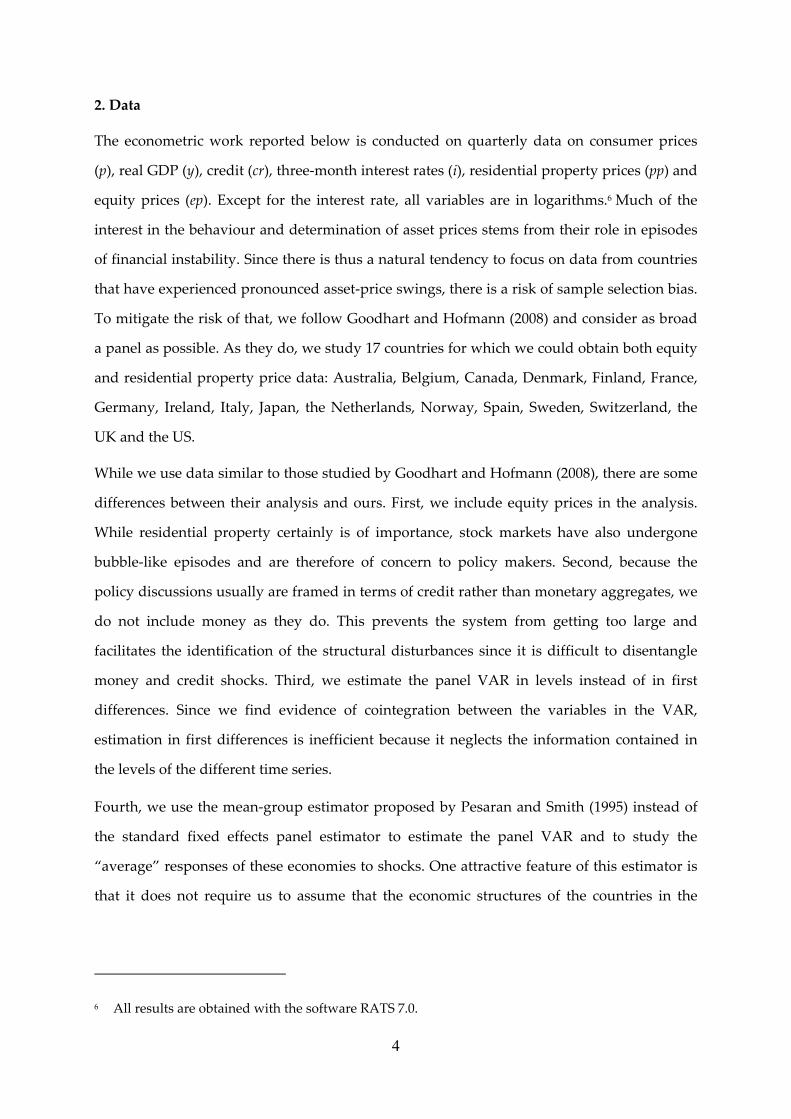
2. Data
The econometric work reported below is conducted on quarterly data on consumer prices
(p), real GDP (y), credit (cr), three-month interest rates (i), residential property prices (pp) and
equity prices (ep). Except for the interest rate, all variables are in logarithms.6 Much of the
interest in the behaviour and determination of asset prices stems from their role in episodes
of financial instability. Since there is thus a natural tendency to focus on data from countries
that have experienced pronounced asset-price swings, there is a risk of sample selection bias.
To mitigate the risk of that, we follow Goodhart and Hofmann (2008) and consider as broad
a panel as possible. As they do, we study 17 countries for which we could obtain both equity
and residential property price data: Australia, Belgium, Canada, Denmark, Finland, France,
Germany, Ireland, Italy, Japan, the Netherlands, Norway, Spain, Sweden, Switzerland, the
UK and the US.
While we use data similar to those studied by Goodhart and Hofmann (2008), there are some
differences between their analysis and ours. First, we include equity prices in the analysis.
While residential property certainly is of importance, stock markets have also undergone
bubble-like episodes and are therefore of concern to policy makers. Second, because the
policy discussions usually are framed in terms of credit rather than monetary aggregates, we
do not include money as they do. This prevents the system from getting too large and
facilitates the identification of the structural disturbances since it is difficult to disentangle
money and credit shocks. Third, we estimate the panel VAR in levels instead of in first
differences. Since we find evidence of cointegration between the variables in the VAR,
estimation in first differences is inefficient because it neglects the information contained in
the levels of the different time series.
Fourth, we use the mean-group estimator proposed by Pesaran and Smith (1995) instead of
the standard fixed effects panel estimator to estimate the panel VAR and to study the
“average” responses of these economies to shocks. One attractive feature of this estimator is
that it does not require us to assume that the economic structures of the countries in the
6 All results are obtained with the software RATS 7.0.

5
panel are the same.7 Such heterogeneity, if disregarded in estimation, will bias the estimates
underlying the VARs. In particular, it is likely to lead to implausible estimates of the
persistence of shocks.8
The sample starts in 1986 and ends in 2006. This choice of sample avoids the more turbulent
period with high and variable inflation that ended in the first half of the 1980. Furthermore,
many countries deregulated their mortgage markets during the first half of the 1980s which
suggests that that estimates relying on older data may not be representative. 9
Residential property prices are from the data base of the Bank for International Settlements
(BIS). Quarterly data over the whole sample period are available for Australia, Canada,
Switzerland, Denmark, Finland, France, the Netherlands, Sweden, the UK and the US. 10 For
Belgium we link an older series for small and medium-sized houses to the residential
property price series for all dwellings from 1988 on. For Spain we link the residential
property prices of existing dwellings with those of owner-occupied homes in 2005. For
Ireland and Norway we interpolate annual data with the Chow-Lin (1971) procedure, using
a rent index and an index of residential construction cost as reference series, and link the
resulting series to the BIS quarterly data that start in 1988 and 1991, respectively.11 The same
7 In previous work (Assenmacher-Wesche and Gerlach 2008b) we explored whether differences in financial structure could explain differences in the monetary transmission mechanism, using the present data, but found little evidence in support of that hypothesis. One reason for that may be that other factors, such as the wage-setting mechanism and the structure of the economy, play much more important roles in account for international differences in the transmission mechanism. Goodhart and Hofmann (2008) formally test, and reject, the hypothesis that the parameters in the PVAR they estimate are the same across countries.
8 This is clear from comparing the estimated impulse responses functions in Assenmacher-Wesche and Gerlach (2008a), which uses the fixed effect estimator, with those in Assenmacher-Wesche and Gerlach (2008b), which does not.
9 See Ahearne et al. (2005) and Girouard and Blöndal (2001),
10 For Australia, missing values for the first two quarters of 1986 were generated using the growth of residential construction cost.
11 Annual data for Norway are from Eitrheim and Erlandsen (2004).

6
interpolation procedure is applied to annual property price data for Germany and Italy.12 For
Japan the semi-annual series on residential land prices is interpolated.13
Before proceeding, we emphasise that the data on residential property prices are not
necessarily comparable across countries (see Arthur 2005 or Assenmacher-Wesche and
Gerlach 2008b). For our study we use whenever possible the broadest residential property
price index available to reduce the risk that regional developments contaminate the data.
Nevertheless, great care needs to be exercised when comparing property-price developments
across countries.
Turning to the sources of the other data, the CPI (all items), share price indices (all shares)
and the credit data are from the OECD Main Economic Indicators (MEI) data base. Real GDP
data were taken from the BIS data base and supplemented with data from the International
Financial Statistics (IFS) data base of the IMF.14 For Ireland annual GDP data before 1997
were interpolated with the Chow-Lin (1971) procedure using industrial production as the
reference series. We use a three-month interbank rate for Denmark, Switzerland, Spain,
Finland, France, Germany, Ireland, Italy, the Netherlands, Norway and the UK, a three-
month Treasury bill rate for Belgium, Sweden and the US, and a three-month commercial
paper rate for Australia, Canada and Japan.15 All interest rates are from the OECDʹs MEI. For
Finland and Denmark missing data for 1986 were replaced with data from the IFS (call
money rate). For the euro-area countries we use the three-month EURIBOR rate after 1998.
Except for interest rates and equity prices all data are seasonally adjusted.
12 Annual property price data for Italy are taken from Cannari et al. (2006).
13 In Japan, a market for old homes practically does not exist as houses are normally torn down after a few decades. As a consequence, land prices determine the value of housing, see the Economist (2008).
14 For the Netherlands the IFS data apparently contain an error in 1998. We therefore used real GDP from the MEI data base.
15 To eliminate a large spike during the ERM crisis we regressed the three-month interest rate for Ireland on a dummy, which is unity in 1992Q4 and zero elsewhere, and used the fitted value in the analysis.
7
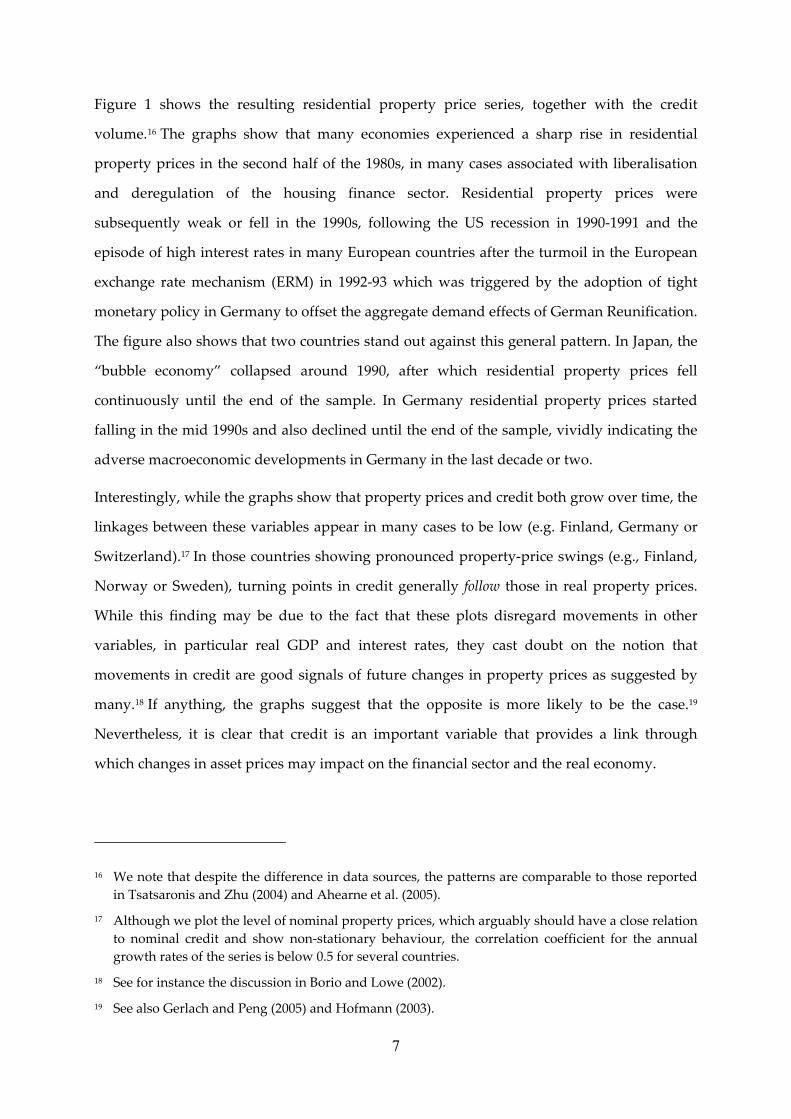
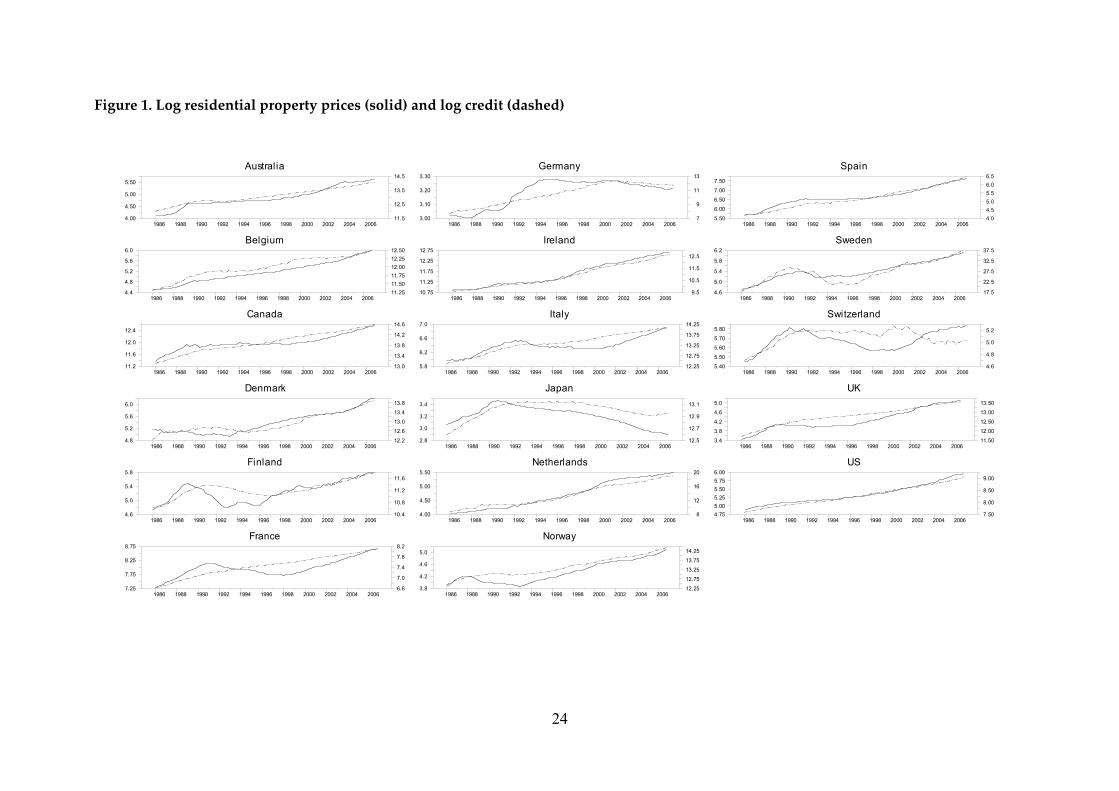
Figure 1 shows the resulting residential property price series, together with the credit
volume.16 The graphs show that many economies experienced a sharp rise in residential
property prices in the second half of the 1980s, in many cases associated with liberalisation
and deregulation of the housing finance sector. Residential property prices were
subsequently weak or fell in the 1990s, following the US recession in 1990-1991 and the
episode of high interest rates in many European countries after the turmoil in the European
exchange rate mechanism (ERM) in 1992-93 which was triggered by the adoption of tight
monetary policy in Germany to offset the aggregate demand effects of German Reunification.
The figure also shows that two countries stand out against this general pattern. In Japan, the
“bubble economy” collapsed around 1990, after which residential property prices fell
continuously until the end of the sample. In Germany residential property prices started
falling in the mid 1990s and also declined until the end of the sample, vividly indicating the
adverse macroeconomic developments in Germany in the last decade or two.
Interestingly, while the graphs show that property prices and credit both grow over time, the
linkages between these variables appear in many cases to be low (e.g. Finland, Germany or
Switzerland).17 In those countries showing pronounced property-price swings (e.g., Finland,
Norway or Sweden), turning points in credit generally follow those in real property prices.
While this finding may be due to the fact that these plots disregard movements in other
variables, in particular real GDP and interest rates, they cast doubt on the notion that
movements in credit are good signals of future changes in property prices as suggested by
many.18 If anything, the graphs suggest that the opposite is more likely to be the case.19
Nevertheless, it is clear that credit is an important variable that provides a link through
which changes in asset prices may impact on the financial sector and the real economy.
16 We note that despite the difference in data sources, the patterns are comparable to those reported in Tsatsaronis and Zhu (2004) and Ahearne et al. (2005).
17 Although we plot the level of nominal property prices, which arguably should have a close relation to nominal credit and show non-stationary behaviour, the correlation coefficient for the annual growth rates of the series is below 0.5 for several countries.
18 See for instance the discussion in Borio and Lowe (2002).
19 See also Gerlach and Peng (2005) and Hofmann (2003).
8
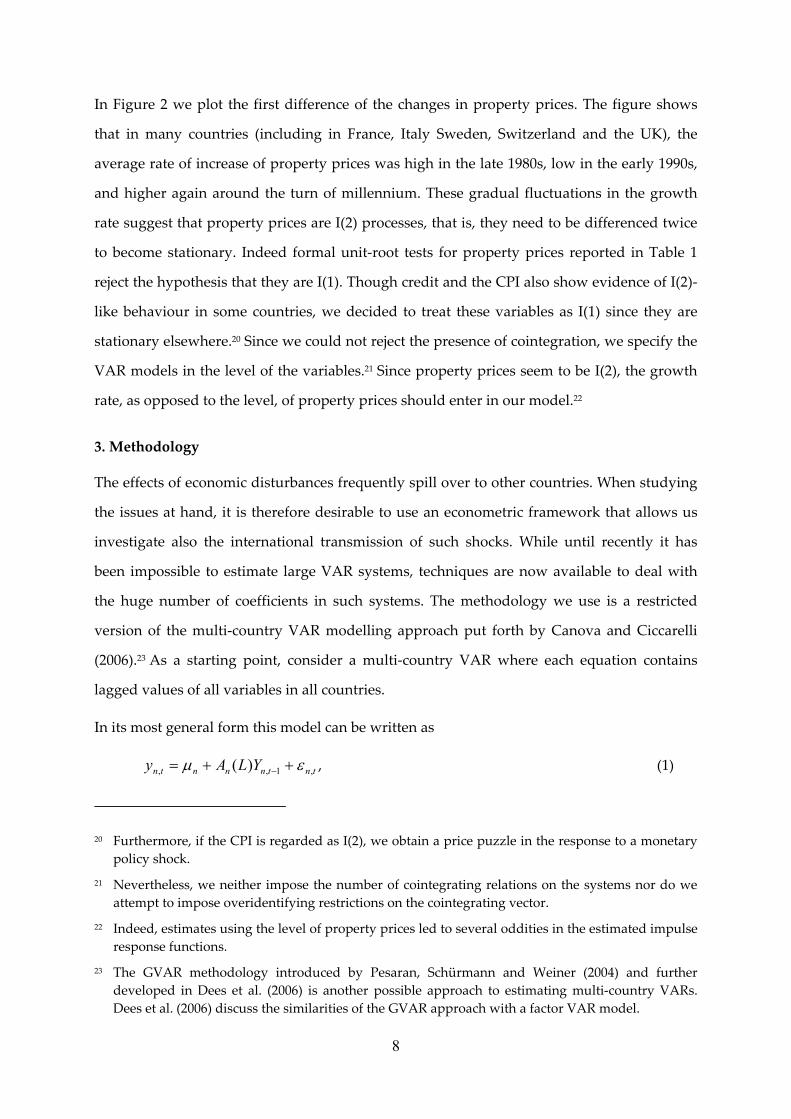
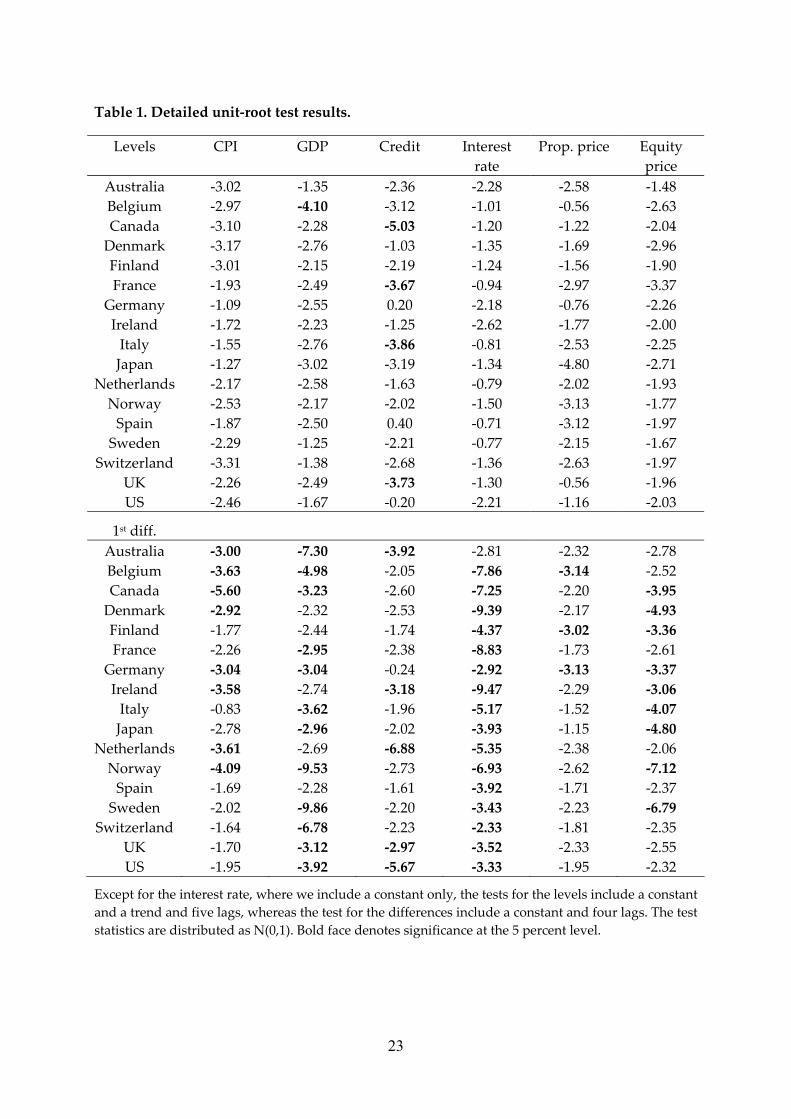
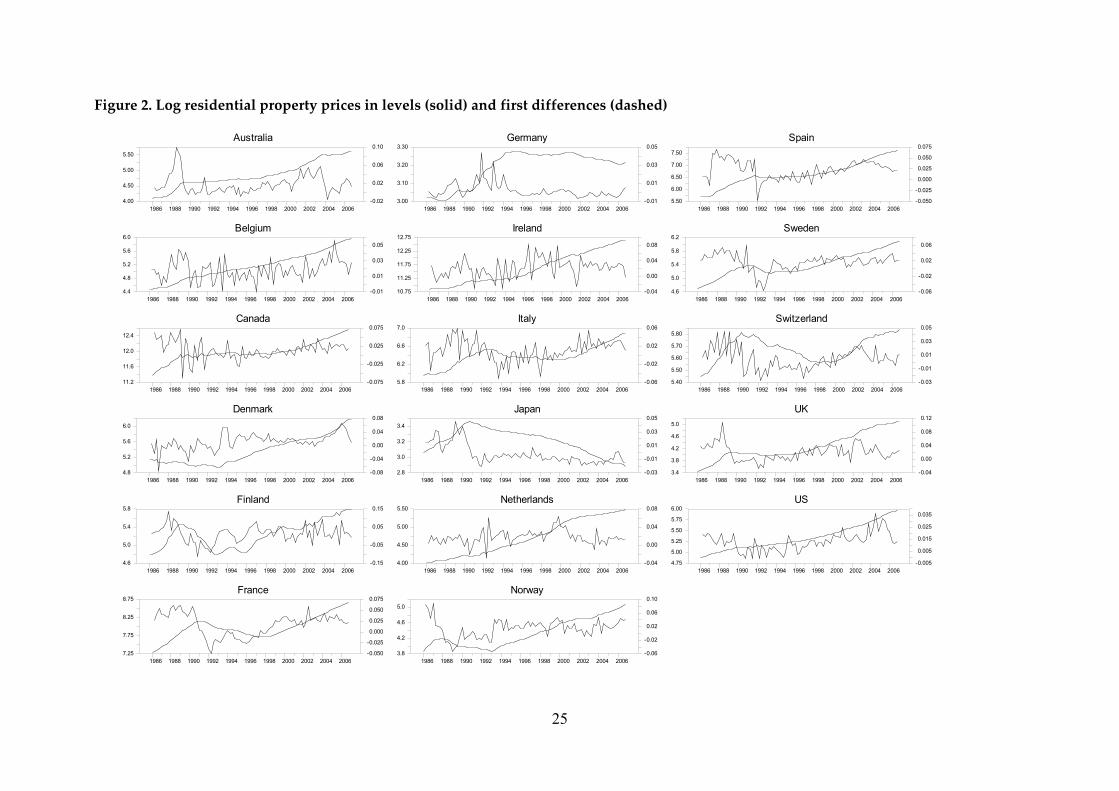
In Figure 2 we plot the first difference of the changes in property prices. The figure shows
that in many countries (including in France, Italy Sweden, Switzerland and the UK), the
average rate of increase of property prices was high in the late 1980s, low in the early 1990s,
and higher again around the turn of millennium. These gradual fluctuations in the growth
rate suggest that property prices are I(2) processes, that is, they need to be differenced twice
to become stationary. Indeed formal unit-root tests for property prices reported in Table 1
reject the hypothesis that they are I(1). Though credit and the CPI also show evidence of I(2)-
like behaviour in some countries, we decided to treat these variables as I(1) since they are
stationary elsewhere.20 Since we could not reject the presence of cointegration, we specify the
VAR models in the level of the variables.21 Since property prices seem to be I(2), the growth
rate, as opposed to the level, of property prices should enter in our model.22
3. Methodology
The effects of economic disturbances frequently spill over to other countries. When studying
the issues at hand, it is therefore desirable to use an econometric framework that allows us
investigate also the international transmission of such shocks. While until recently it has
been impossible to estimate large VAR systems, techniques are now available to deal with
the huge number of coefficients in such systems. The methodology we use is a restricted
version of the multi-country VAR modelling approach put forth by Canova and Ciccarelli
(2006).23 As a starting point, consider a multi-country VAR where each equation contains
lagged values of all variables in all countries.
In its most general form this model can be written as
tntnnntn YLAy ,1,, )( εµ ++= − , (1)
20 Furthermore, if the CPI is regarded as I(2), we obtain a price puzzle in the response to a monetary policy shock.
21 Nevertheless, we neither impose the number of cointegrating relations on the systems nor do we attempt to impose overidentifying restrictions on the cointegrating vector.
22 Indeed, estimates using the level of property prices led to several oddities in the estimated impulse response functions.
23 The GVAR methodology introduced by Pesaran, Schürmann and Weiner (2004) and further developed in Dees et al. (2006) is another possible approach to estimating multi-country VARs. Dees et al. (2006) discuss the similarities of the GVAR approach with a factor VAR model.
9
where tny , is a 1×k vector of variables of each of the N countries, n = 1, … N.
),,,( ,,2,1, tNtttn yyyY ′′′= K collects the data for all countries, µn is a country-specific intercept
and An(L) is a lag polynomial with the VAR coefficients. The disturbances, tn,ε , have zero
means and a country-specific variance, 2nσ . If the model were estimated without restrictions,
the matrices An would have N x kN coefficients, leading to a total of 7038 coefficients in a
VAR of order four with 17 countries and six variables. Of course, such a model is not
estimable without imposing restrictions on the coefficients.
In this paper, we take two approaches. First, we neglect the international linkages between
the countries, i.e. we restrict the coefficients on the foreign variables in tnY , to zero. This
corresponds to a conventional panel VAR setup, such as that used by Goodhart and
Hofmann (2008). Second, we consider international linkages by reparameterizing the VAR
following the suggestion by Canova and Ciccarelli (2006). While the dependent variables
remain unchanged, the movements in the regressors are summarized by different linear
combinations, which one can think of as “factors,” of the explanatory variables. These factors
capture the bulk of the variation in the data, but permit the model to be estimate with a
greatly reduced number of regressors. We next discuss our panel VAR estimation setup for
the domestic model, before we turn to the multi-country VAR.
3.1 Panel VARs
In contrast to Goodhart and Hofmann (2008) we do not use the standard fixed effect
estimator, which is well known to be biased in panels that include lagged endogenous
variables (Holtz-Eakin et al. 1988). This bias is particularly severe if the time dimension is
small but can be overcome by using GMM or instrumental-variables estimators. Since our
sample period is rather long, we are not overly concerned about this source of bias.
Unfortunately, even if the time dimension is large the standard fixed-effects estimator is
inconsistent in dynamic panels if the coefficients on the lagged endogenous variables differ
across countries. The reason for this inconsistency is that restricting the slope coefficients to
be the same across groups induces serial correlation in the residuals when the regressors are
autocorrelated. This serial correlation does not vanish when instrumental variable estimation
is applied (see Pesaran and Smith 1995). In the present case, where all equations have lagged
10
dependent variables and the regressors have close to unit roots, this problem can lead
estimated impulse response functions to display extreme persistence. We therefore follow
Pesaran and Smithʹs recommendation and estimate the PVAR using the mean group
estimator. This estimator provides a consistent estimate of the mean effects by averaging the
coefficients across countries.
The mean group estimator assumes that the coefficients in An(L) vary randomly across
countries and that the typical element pj,i,na in An(L) can be written as p
j,i,np
j,ip
j,i,n aa η+= ,
where n is the country index, p = 1, …, P, the lag order of the VAR and i, j = 1, … K the
number of variables in the VAR. We are interested in the means of the parameters, pj,ia from
N individual-country reduced-form VARs that can be written as tntnnntn yLAy ,,, )( εµ ++= ,
where, for reasons discussed in the next section, we have that
),,,,,( ,,,,,,, tntntntntntntn epppicrypy ∆= , µn is a constant, An(L) is a matrix polynomial in the lag
operator and tn,ε is a vector of normally, identically distributed disturbances. Since we use
quarterly data we include four lags both in the PVAR and the multi-country VAR.
3.2 International VARs
To investigate the international transmission, however, we estimate the influence of US
variables on the other economies in the panel, following Canova and Ciccarelli (2006). The
assumption underlying the multi-country model is that the coefficients can be factored as
∑=
+Ξ=F
fff u
1θδ ,
where each fθ is of lower dimension than the full coefficient matrix δ, and the fΞ maps the
right-hand-side variables of the VAR into these factors. Intuitively, one may think of the
linear combinations of the variables as a more parsimonious representation of the
information contained in the data. While in a standard VAR each variable is allowed to have
an independent effect on the dependent variable, here the coefficients are restricted to be the
same across certain dimensions of the data.24
24 The GVAR methodology of Pesaran, Schürmann and Weiner (2004) takes a slightly different approach by allowing unrestricted coefficients for the domestic variables and imposing trade
11
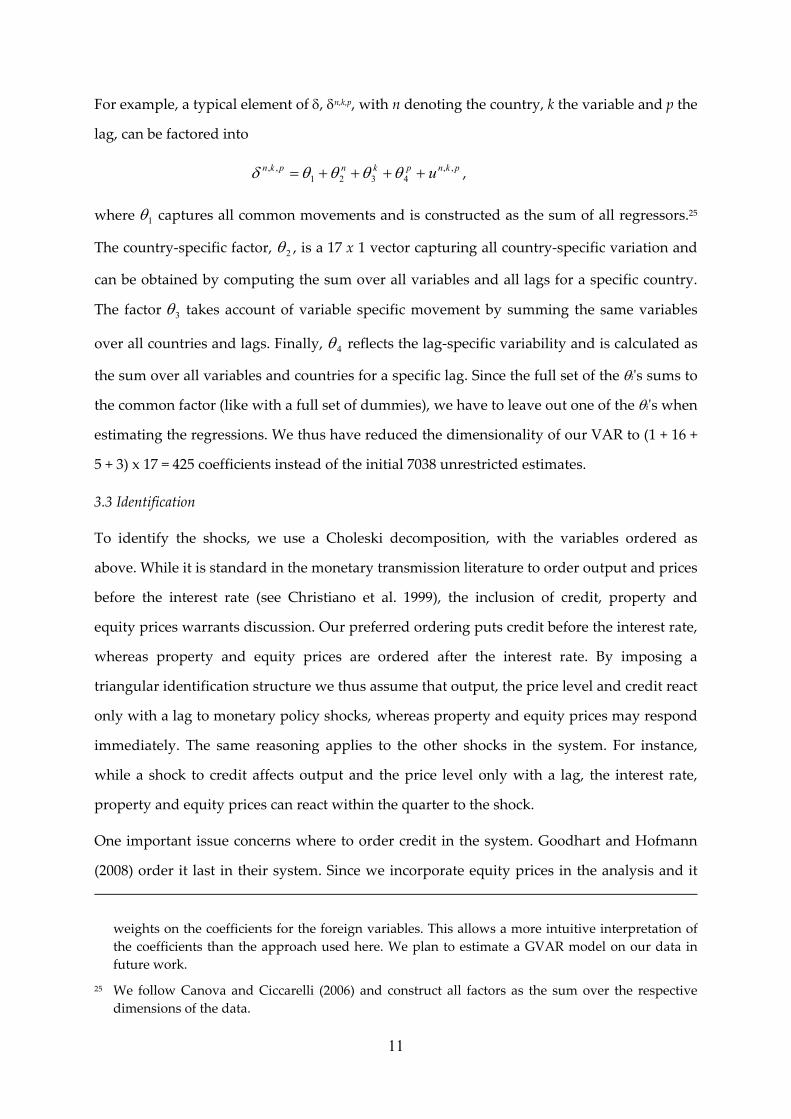
For example, a typical element of δ, δn,k,p, with n denoting the country, k the variable and p the
lag, can be factored into
pknpknpkn u ,,4321
,, ++++= θθθθδ ,
where 1θ captures all common movements and is constructed as the sum of all regressors.25
The country-specific factor, 2θ , is a 17 x 1 vector capturing all country-specific variation and
can be obtained by computing the sum over all variables and all lags for a specific country.
The factor 3θ takes account of variable specific movement by summing the same variables
over all countries and lags. Finally, 4θ reflects the lag-specific variability and is calculated as
the sum over all variables and countries for a specific lag. Since the full set of the θiʹs sums to
the common factor (like with a full set of dummies), we have to leave out one of the θiʹs when
estimating the regressions. We thus have reduced the dimensionality of our VAR to (1 + 16 +
5 + 3) x 17 = 425 coefficients instead of the initial 7038 unrestricted estimates.
3.3 Identification
To identify the shocks, we use a Choleski decomposition, with the variables ordered as
above. While it is standard in the monetary transmission literature to order output and prices
before the interest rate (see Christiano et al. 1999), the inclusion of credit, property and
equity prices warrants discussion. Our preferred ordering puts credit before the interest rate,
whereas property and equity prices are ordered after the interest rate. By imposing a
triangular identification structure we thus assume that output, the price level and credit react
only with a lag to monetary policy shocks, whereas property and equity prices may respond
immediately. The same reasoning applies to the other shocks in the system. For instance,
while a shock to credit affects output and the price level only with a lag, the interest rate,
property and equity prices can react within the quarter to the shock.
One important issue concerns where to order credit in the system. Goodhart and Hofmann
(2008) order it last in their system. Since we incorporate equity prices in the analysis and it
weights on the coefficients for the foreign variables. This allows a more intuitive interpretation of the coefficients than the approach used here. We plan to estimate a GVAR model on our data in future work.
25 We follow Canova and Ciccarelli (2006) and construct all factors as the sum over the respective dimensions of the data.

12
seems likely that they respond more quickly to changes in the interest rate than credit
aggregates, this does not seem appropriate in our case. Since it seems plausible that property
prices respond to credit shocks, it seems desirable to order credit before both property and
asset prices.
Finally, we have to decide whether to order credit before or after the interest rate. In the
present draft we order it before the interest rate, under the argument that credit aggregates
respond only gradually to changes in interest rates, but that underlying disturbances
correlated with movements in the stock of credit can impact on interest rates within the
quarter. In turn, this implies that the asset prices are ordered after the interest rate. We do
not think that this assumption should be controversial since although central banks react to
changes in asset prices (because they influence aggregate demand and inflation pressures),
barring exceptional circumstances one would not expect any reactions to be instantaneous
but rather to occur if asset prices rise or fall for some time. By contrast, asset prices react
immediately to changes in monetary policy.
Before proceeding, two issues warrant discussion. First, we emphasise that these restrictions
do not allow us to distinguish between aggregate supply and aggregate demand shock.
Consequently, we will only discuss the effects of shocks to credit, interest rates and to the
two asset prices below.
Second, while we attempt to give a structural interpretation to the shocks in our system,
identification in such a large system is hazardous and we recognise that more work on the
sensitivity of the results to the exact form of the identifying restrictions are needed. Indeed,
Goodhart and Hofmann (2008) are careful not to interpret their orthogonalised shocks as
structural. Though the same caveats apply to our analysis, we are willing to take somewhat
greater risks. One reason for this is that since we do not include money in the system, we
need not distinguish between money and credit shocks. Furthermore, using changes in,
rather than the level of, property prices yields more plausible reactions to interest rate shocks
which we feel more comfortable labelling monetary policy shocks.
4. Results
In this section we discuss the impulse-responses to monetary shocks, credit shocks, property-
price and equity price shocks in the panel VAR before turning to the international

13
transmission of these shocks in the next section. Figure 3 shows the bootstrapped impulse
responses to a monetary policy shock implied by the panel regression, together with
plus/minus two standard-error (i.e., 95%) confidence bands, obtained by bootstrapping (1000
draws).26 The impulse responses are typically significantly different from zero at the 95%
level because of the large amount of information that comes from using the panel approach.
After a monetary policy shock, the price level starts to fall, with the effect becoming
significant only after about two years.27 Furthermore, the results indicate that output falls for
about seven quarters before recovering slowly. Credit starts to fall after about three quarters
and reaches a trough about ten quarters after the shock. Residential property prices start to
fall gradually and reach a trough after about ten quarters. Note that we plot impulse-
responses for the level of property prices (i.e. accumulated impulse responses) to make
results comparable to the other variables, though property prices enter the system in first
differences. Since we assume that the level of property prices is non-stationary, they do not
return to initial level. However, the effect is insignificant after four years. By contrast, equity
prices, which are forward-looking variables, fall immediately following the increase in
interest rates and start rising only after about seven quarters, that it, when real GDP starts to
return to the initial level.
These findings warrant several comments. First, the reactions of prices and output to the
shocks are similar to those found in the literature based on single-country studies (see, e.g.
Christiano et al. (1999) for the US and the VAR studies in Angeloni et al. (2003) for the euro
area). Second, the responses of residential property prices, real GDP and credit show
approximately the same pattern, whereas the price level is lagging and equity prices move
more rapidly. Third, because we treat property prices as non-stationary, the width of the
confidence bands increases with the time horizon and is larger than those for the other
variables. Fourth, the point estimate shows that after about two years residential property
26 When bootstrapping our PVAR, we sample from all residuals, not only from the residuals for a specific country. In that way, we account for the uncertainty that comes from the dispersion of the individual-country estimates around the mean-group parameters.
27 It seems plausible that we underestimate the impact of monetary policy on prices since we do not include any predictors of future inflation in the VAR system.
14
prices and credit have fallen about three times as much as the level of real GDP, that is, by
1.8% rather than by 0.6%.
Of course, these estimates, in particular the three-to-one estimate, reflects the policy choices
made by central banks in the sample period, during which central banks did not seek to
stabilize asset prices. Thus, it is possible, as suggested by the Lucas critique, that they would
change if central banks actively sought to gear monetary policy to asset prices. With that
caveat in mind, we interpret the results as suggesting that while monetary policy could in
principle be used to offset swings in residential property prices that are seen as causing a
threat to financial stability, it risks inducing potentially large swings in real economic
activity. For instance, to offset a 15% rise in residential property prices, which is not an
unusually large increase by the standards of many recent property price booms, the central
bank might have to depress real GDP by 5%, an extraordinarily large amount.28 Moreover,
the impact of monetary policy shocks on equity prices is much faster and larger than the
peak effect on residential property prices, suggesting that monetary policy might not easily
be used to target both. Overall, the results in this section are likely to fuel the fears of those
that believe that gearing monetary policy to asset prices may generate pronounced swings in
economic activity and will stabilise some asset prices at the costs of inducing more instability
in others.
Figure 4 shows the impulse responses to a credit shock. In interpreting these it should be
kept in mind that it is not clear a priori if this is a credit supply or credit demand shock. The
estimates show that the shock raises the level of prices, with the peak effect being reached
after twelve quarters. The shock also stimulates output, with a peak effect after about five
quarters. The impact effect on interest rates is negative (suggesting that this is a credit supply
shock).29 Turning to the responses of asset prices, we note that after one quarter the shock is
28 See also Assenmacher-Wesche and Gerlach (2008a). Proponents of using monetary policy to mitigate swings in asset prices, such as Borio and Lowe (2002), do not seem concerned by the impact of such a policy on economic activity. By contrast, opponents, such as Kohn (2006), emphasise the effects on output and inflation. Interestingly, experimental evidence also shows that interest rate policy is not effective in dealing with asset price bubbles, see Becker et al. (2007).
29 Recall that the interest rate is a three month rate whereas most central bank steer the overnight rate. Though the short-term interest rate is mainly determined by monetary policy, credit supply
15
associated with an increase of property prices, which is not significant, and an increase in
nominal equity prices, which is.30
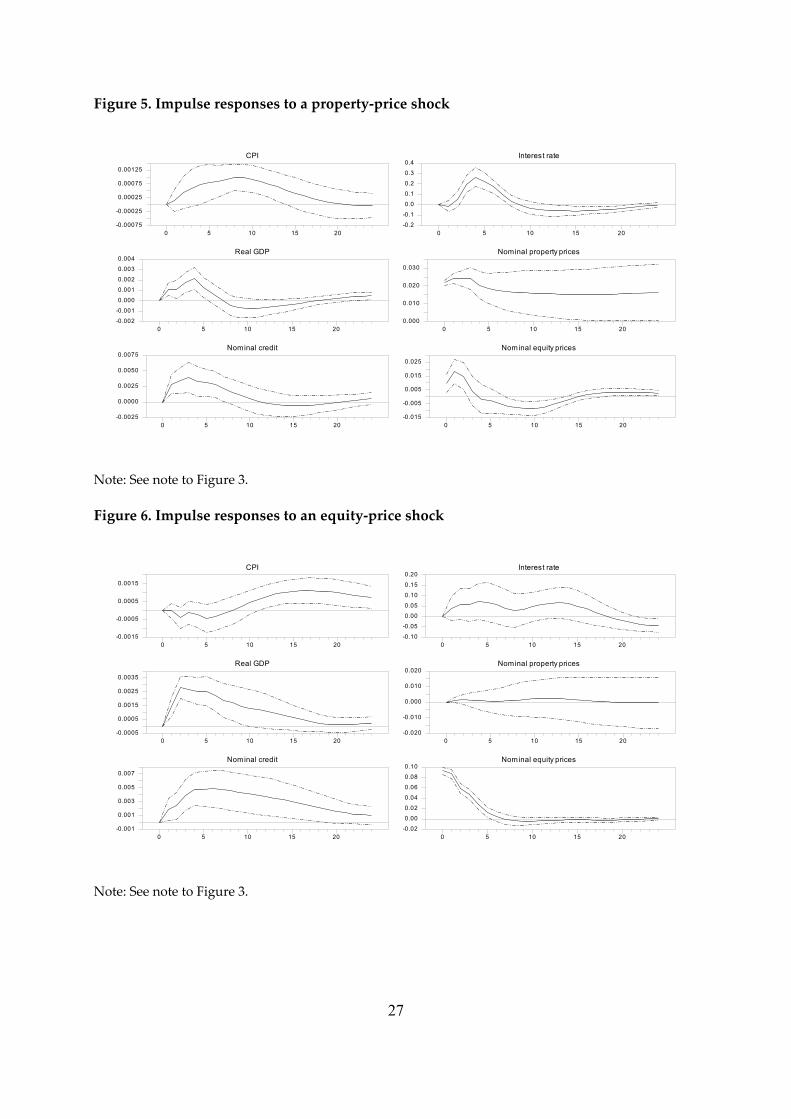
Next, we investigate the responses to a shock in the growth rate of property prices, which are
shown in Figure 5. In contrast to the other shocks, this is a permanent shock to the level of
property prices. Equity prices increase on impact. Interestingly, all other variables rise
significantly in response to the shock. Again we have the same timing pattern among the
variables. Equity prices peak after one quarter, real GDP, credit and the interest rate peak
after three to four quarters, whereas the CPI lags with a peak after ten quarters.
Finally, Figure 6 shows the impulse responses to a shock in equity prices. Not surprisingly,
the responses of the interest rate and property prices are small and insignificant. Real GDP
and credit growth both expand, suggesting that innovations in equity prices do contain
information about real growth in the near term. However, the effect is quantitatively small,
with an equity price shock of about 10% leading to an increase in GDP of 0.3% after two
quarters.
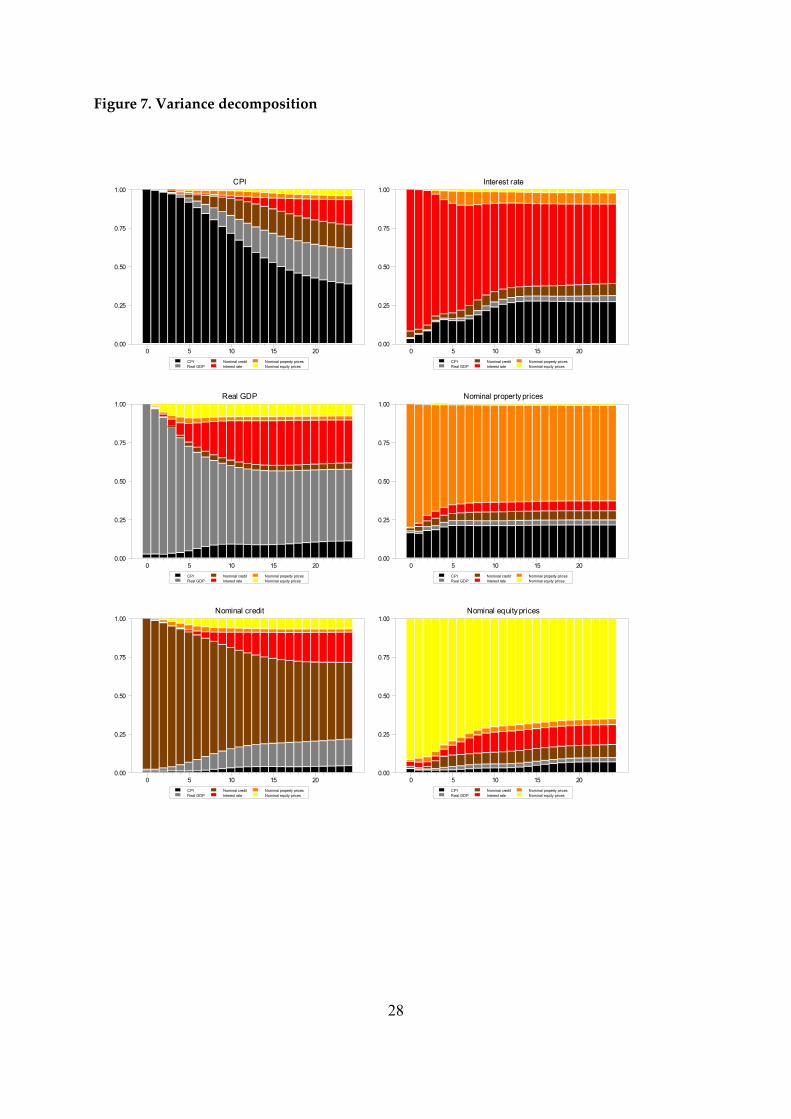
Figure 7 shows the variance decomposition of the variables in the system. Not surprisingly,
the variances of the variables are predominantly due to “own” shocks. At a horizon of 6
years, interest rate shocks account for about 20% of the variation in the CPI and credit, and
28% of the fluctuations in GDP but only for 6% and 13% of the variation in property prices
and equity prices. This again suggests that using monetary policy to stabilize asset prices
risks destabilizing GDP. While asset prices to account for fluctuations in the interest rate and
real credit, their contribution to variations in the CPI and GDP is quite limited.
Summing up, our system reproduces the usual findings for monetary policy shocks. In
addition, we find that shocks to asset prices have a positive, significant effect on GDP and
credit after three to four quarters, whereas the CPI starts to increase only after about two
years. The results for the credit shock are somewhat more difficult to interpret. One reason
shocks should widen the spread between central-bank rates and money market rates and thus imply a rise in the interest rate.
30 Note that since Goodhart and Hoffmann (2008) order credit last in their system, the impact reaction of property prices is constrained to be zero.
16
may be that the variables in our system to not allow us to separate demand and supply
effects properly.
5. International transmission of shocks
Having identified the shocks and studied the average response of macroeconomic variables
to them using the panel VAR, below we provide some evidence on how monetary policy,
credit, property price and equity price shocks in the US are spread to the other countries in
our panel. Using a multi-country VAR it becomes almost impossible to disentangle all
structural shocks in the system. What can be done, however, is to identify shocks for a single
country and then investigate the transmission to other economies. Since the US is the largest
economy and has been a recent source of shocks, it seems natural to focus on shocks
originating there.
To identify the shocks, we order the US first and then apply a Choleski decomposition to the
residuals. Under the assumption that the US variables are exogenous to the system, we thus
can identify structural shocks and study their transmission. We do not have to make any
assumptions regarding the ordering of the remaining variables in the system since
reordering them does not affect the results. We estimate the VAR with four lags. Since we are
interested in the average effects of US shocks on the other economies, we present averages
over the individual impulse responses.
Next we turn to the results. In interpreting them it should be noted that this exercise is quite
different from that conducted above. While we previously implicitly shocked all the
countries in the panel at the same time and studied how they responded on average, in this
case we shock one country, the US, and study how the others respond, on average. It is
therefore readily clear that we should not expect tightly estimated responses. Rather than
using plus/minus two standard-errors wide confidence bands as above, we therefore use
plus/minus one standard-error wide confidence bands in this part of the paper.
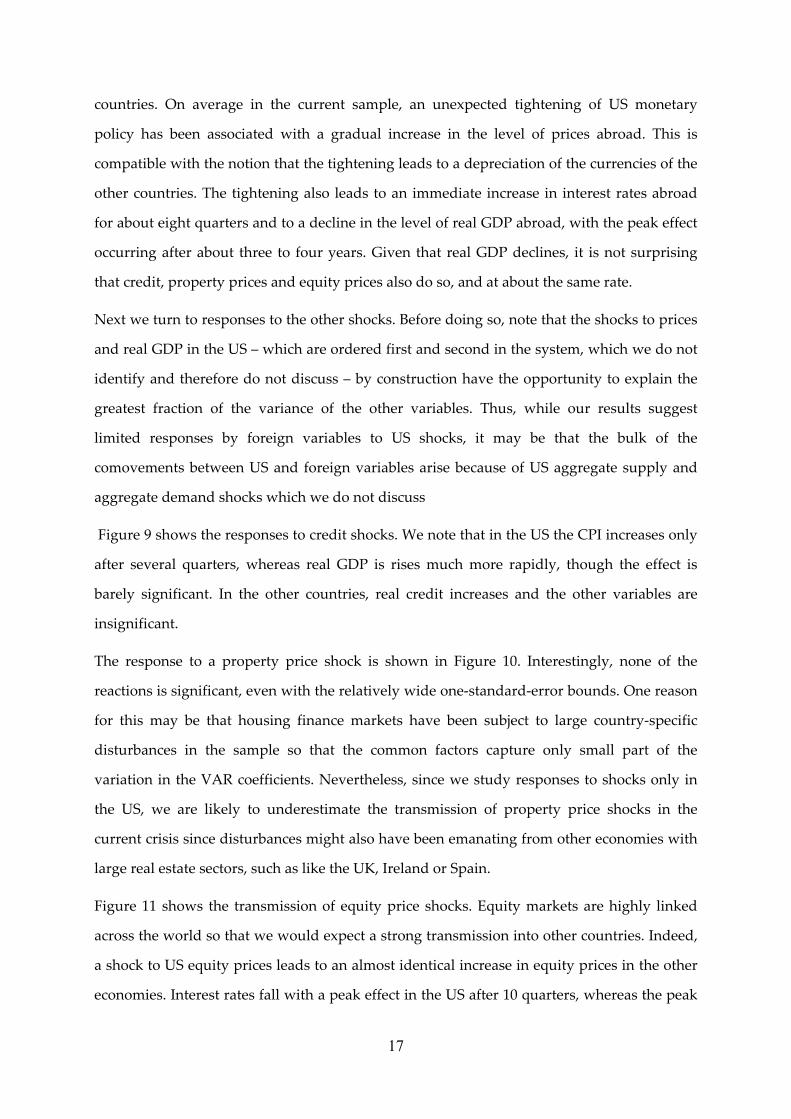
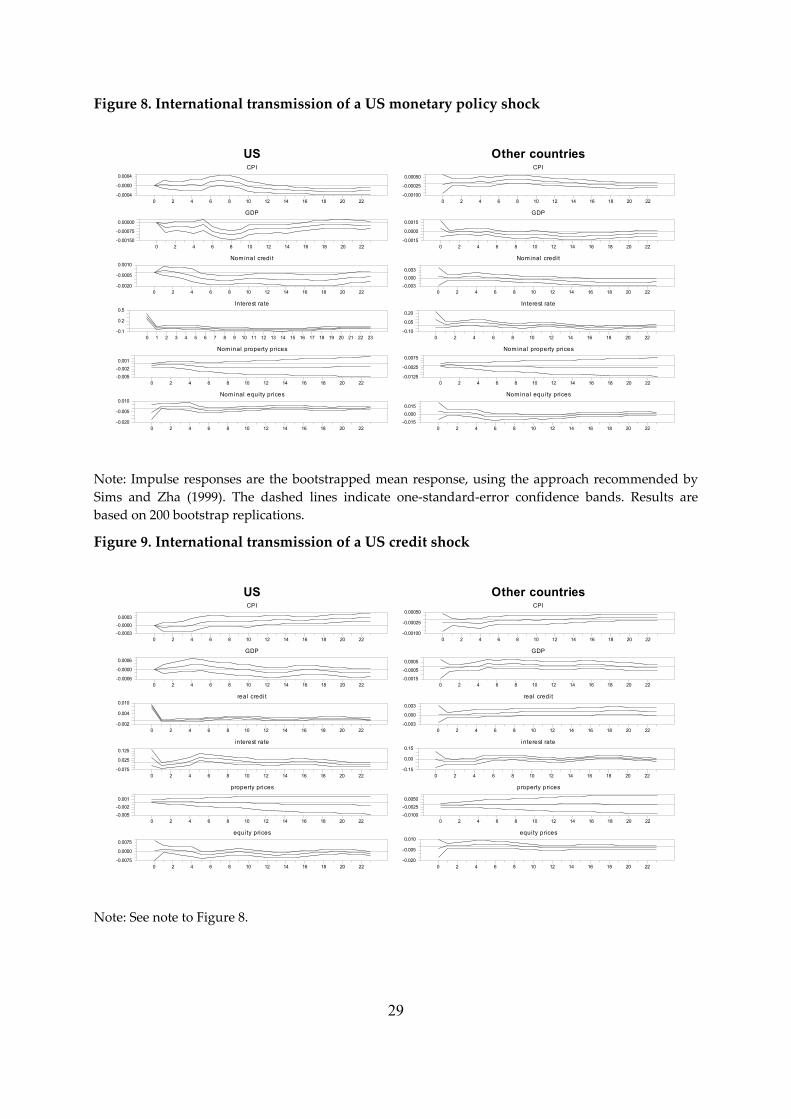
The responses to US monetary policy shocks are available in Figure 8. In the left-hand panel,
the reaction to a monetary policy shock in the US is shown. Though the dynamics are
somewhat different because the domestic variables are now regressed on the common
factors, the reactions in the US are similar to those presented in the previous section and we
therefore do not discuss them. The right-hand panel shows the average reaction in the other
17
countries. On average in the current sample, an unexpected tightening of US monetary
policy has been associated with a gradual increase in the level of prices abroad. This is
compatible with the notion that the tightening leads to a depreciation of the currencies of the
other countries. The tightening also leads to an immediate increase in interest rates abroad
for about eight quarters and to a decline in the level of real GDP abroad, with the peak effect
occurring after about three to four years. Given that real GDP declines, it is not surprising
that credit, property prices and equity prices also do so, and at about the same rate.
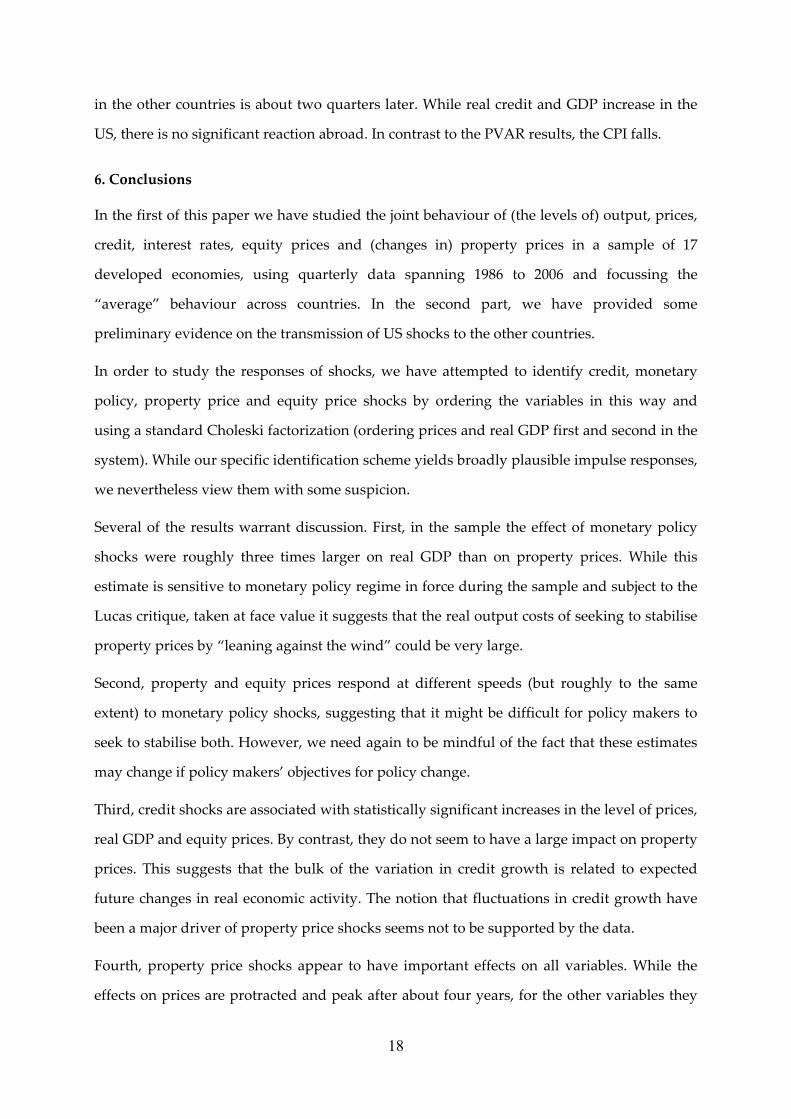
Next we turn to responses to the other shocks. Before doing so, note that the shocks to prices
and real GDP in the US – which are ordered first and second in the system, which we do not
identify and therefore do not discuss – by construction have the opportunity to explain the
greatest fraction of the variance of the other variables. Thus, while our results suggest
limited responses by foreign variables to US shocks, it may be that the bulk of the
comovements between US and foreign variables arise because of US aggregate supply and
aggregate demand shocks which we do not discuss
Figure 9 shows the responses to credit shocks. We note that in the US the CPI increases only
after several quarters, whereas real GDP is rises much more rapidly, though the effect is
barely significant. In the other countries, real credit increases and the other variables are
insignificant.
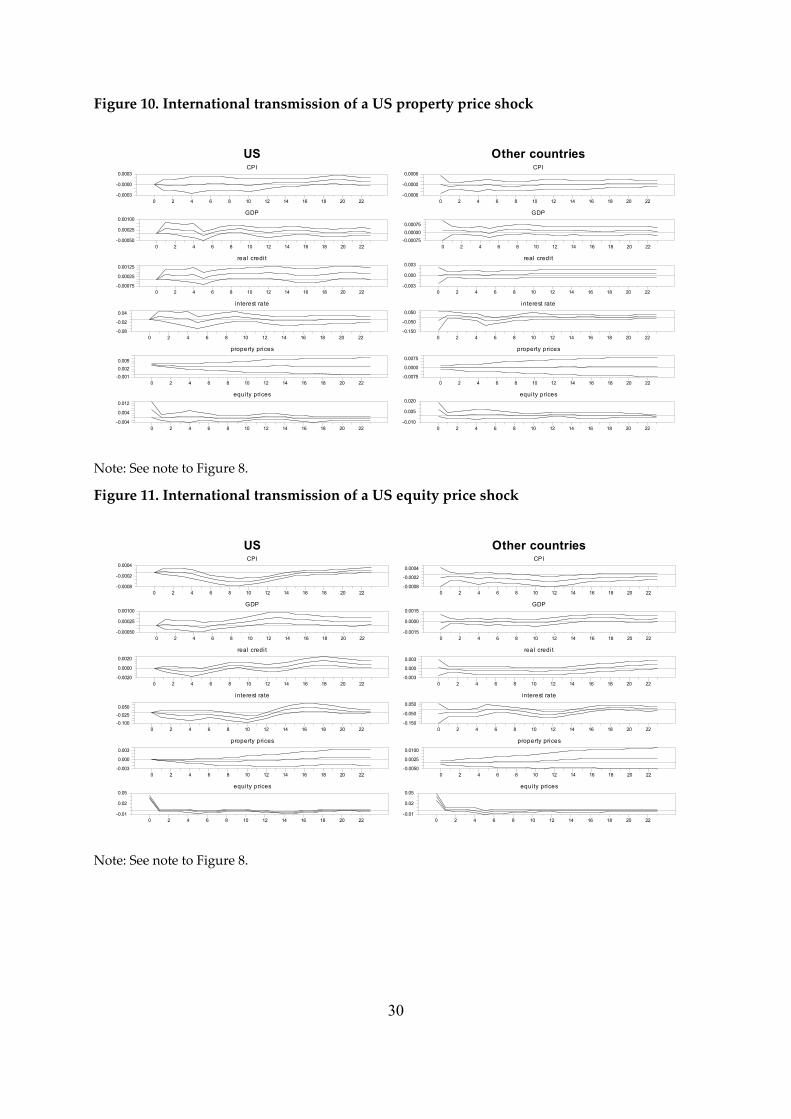
The response to a property price shock is shown in Figure 10. Interestingly, none of the
reactions is significant, even with the relatively wide one-standard-error bounds. One reason
for this may be that housing finance markets have been subject to large country-specific
disturbances in the sample so that the common factors capture only small part of the
variation in the VAR coefficients. Nevertheless, since we study responses to shocks only in
the US, we are likely to underestimate the transmission of property price shocks in the
current crisis since disturbances might also have been emanating from other economies with
large real estate sectors, such as like the UK, Ireland or Spain.
Figure 11 shows the transmission of equity price shocks. Equity markets are highly linked
across the world so that we would expect a strong transmission into other countries. Indeed,
a shock to US equity prices leads to an almost identical increase in equity prices in the other
economies. Interest rates fall with a peak effect in the US after 10 quarters, whereas the peak
18
in the other countries is about two quarters later. While real credit and GDP increase in the
US, there is no significant reaction abroad. In contrast to the PVAR results, the CPI falls.
6. Conclusions
In the first of this paper we have studied the joint behaviour of (the levels of) output, prices,
credit, interest rates, equity prices and (changes in) property prices in a sample of 17
developed economies, using quarterly data spanning 1986 to 2006 and focussing the
“average” behaviour across countries. In the second part, we have provided some
preliminary evidence on the transmission of US shocks to the other countries.
In order to study the responses of shocks, we have attempted to identify credit, monetary
policy, property price and equity price shocks by ordering the variables in this way and
using a standard Choleski factorization (ordering prices and real GDP first and second in the
system). While our specific identification scheme yields broadly plausible impulse responses,
we nevertheless view them with some suspicion.
Several of the results warrant discussion. First, in the sample the effect of monetary policy
shocks were roughly three times larger on real GDP than on property prices. While this
estimate is sensitive to monetary policy regime in force during the sample and subject to the
Lucas critique, taken at face value it suggests that the real output costs of seeking to stabilise
property prices by “leaning against the wind” could be very large.
Second, property and equity prices respond at different speeds (but roughly to the same
extent) to monetary policy shocks, suggesting that it might be difficult for policy makers to
seek to stabilise both. However, we need again to be mindful of the fact that these estimates
may change if policy makers’ objectives for policy change.
Third, credit shocks are associated with statistically significant increases in the level of prices,
real GDP and equity prices. By contrast, they do not seem to have a large impact on property
prices. This suggests that the bulk of the variation in credit growth is related to expected
future changes in real economic activity. The notion that fluctuations in credit growth have
been a major driver of property price shocks seems not to be supported by the data.
Fourth, property price shocks appear to have important effects on all variables. While the
effects on prices are protracted and peak after about four years, for the other variables they
19
are much more short-lived, lasting at most two years. Since property prices are treated as I(2)
variables in the analysis, such shocks have a permanent impact on property prices.
Fifth, equity price shocks seem only to impact on real GDP and credit. This finding is
compatible with the notion that equity prices are largely driven by the near-term prospects
of firms, which in turn drive the demand for credit.
Overall, these findings suggest that movements in credit are largely due to shifts in the
demand, which in turn depends critical on the level of real economic activity.
Turning to the part of the paper in which we study the transmission of US shocks, we note
that although US monetary policy shocks appears to elicit responses abroad, the other shocks
do not. This finding seems difficult to reconcile with the spread of the subprime mortgage
crises outside the US. It may be, however, that we underestimate this impact since our
estimates captures the average effect during the 1986 to 2006 period when asset price shocks
perhaps were not transmitted as strongly as after the end of the sample period. Whatever the
reason, this issue warrants more work.
20
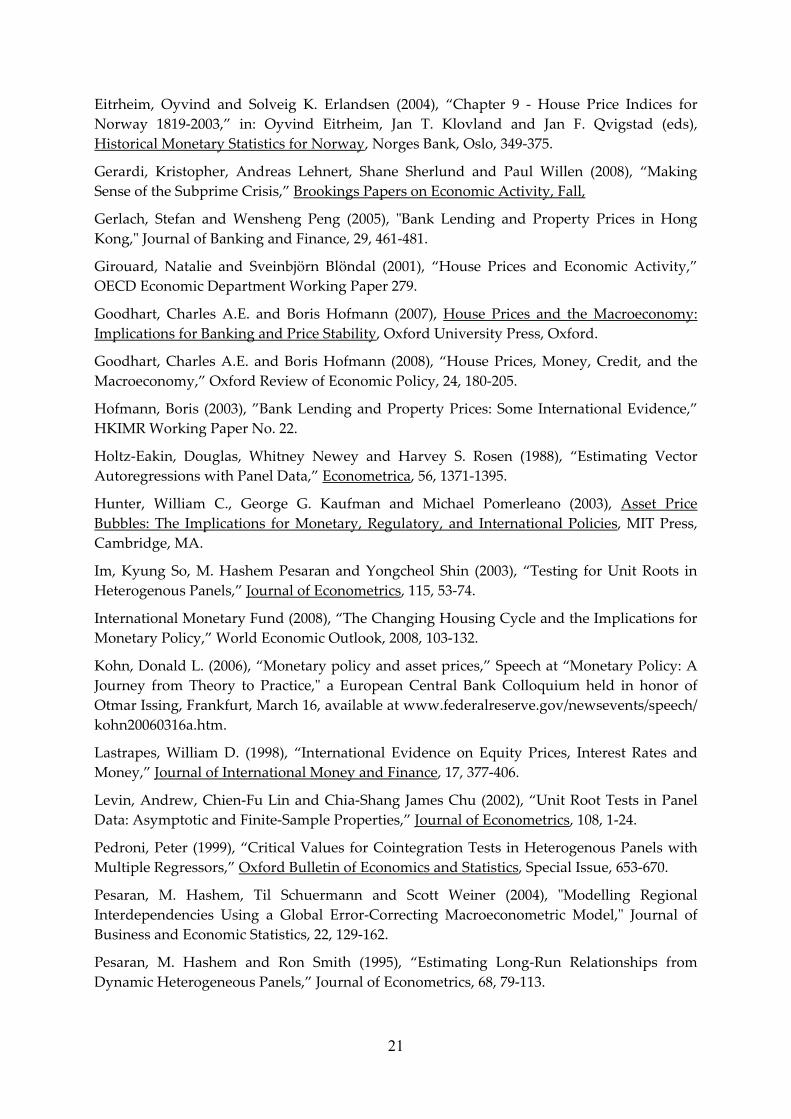
References
Ahearne, Alan G., John Ammer, Brian M. Doyle, Linda S. Kole and Robert F. Martin (2005), “House Prices and Monetary Policy: A Cross-Country Study,” Board of Governors of the Federal Reserve System, International Finance Discussion Papers No. 841.
Angeloni, Ignazio, Anil K. Kashyap and Benoit Mojon (2003), Monetary Policy Transmission in the Euro Area, Cambridge University Press, Cambridge.
Arthur, Steven V. (2005), ʺObtaining Real Estate Data: Criteria, Difficulties and Limitations,ʺ in: Bank for International Settlements (ed.), Real Estate Indicators and Financial Stability, Proceedings of a joint conference organised by the BIS and the IMF in Washington DC, 27-28 October 2003, BIS Papers No 21, Basel, 63-69.
Assenmacher-Wesche, Katrin and Stefan Gerlach (2008a), ʺCan Monetary Policy Really Be Used to Stabilize Asset Prices?,ʺ in: Andrew Felton and Carmen M. Reinhart (ed.), The First Global Financial Crisis of the 21st Century, Center for Economic Policy Research, London, 163-166.
Assenmacher-Wesche, Katrin and Stefan Gerlach (2008b), “Can Monetary Policy Be Used to Stabilise Asset Prices?,” Institute for Monetary and Financial Stability Working Paper No. 16, University of Frankfurt.
Becker, Ralf, Urs Fischbacher and Thorsten Hens (2007), “Soft Landing of a Stock Market Bubble: An Experimental Study,” National Centre of Competence in Research, NCCR Finrisk Working Paper No. 32.
Borio, Claudio and Philip Lowe (2002), “Asset Prices, Financial and Monetary Stability: Exploring the Nexus,” BIS Working Paper No 114.
Cannari, Luigi, Ivan Faiella, Roberto Sabbatini and Francesco Zollino (2006), “House Prices in Italy: The Statistics Used at the Bank of Italy,” Paper presented at the OECD-IMF Workshop on Real Estate Prices Indexes, Paris, 6-7 November 2006.
Canova, Fabio and Matteo Ciccarelli (2006), ʺEstimating Multi-Country VAR Models,ʺ European Central Bank Working Paper No. 603.
Cecchetti, Stephen G., Hans Genberg, John Lipsky and Sushil Wadhwani (2000), “Asset Prices and Central Bank Policy,” Geneva Report on the World Economy 2, CEPR and ICMB.
Chow, Gregory C. and An-loh Lin (1971), “Best Linear Unbiased Interpolation, Distribution, and Extrapolation of Time Series by Related Series,” Review of Economics and Statistics, 53, 372-375.
Christiano, Lawrence J., Martin Eichenbaum and Charles L. Evans (1999), “Monetary Policy Shocks: What Have We Learned and To What End?,” in: John B. Taylor and Michael Woodford (ed.), Handbook of Macroeconomics, Elsevier, Amsterdam, 65-148.
Dees, Stephane, Filippo di Mauro, M. Hashem Pesaran and L. Vanessa Smith (2006), ʺExploring the International Linkages of the Euro Area: A Global VAR Analysis,ʺ Journal of Applied Econometrics, 22, 1-38.
Economist (2008), ʺBuilding Wealth - Japanʹs Property Markets,ʺ January 3rd, 2008.
21
Eitrheim, Oyvind and Solveig K. Erlandsen (2004), “Chapter 9 - House Price Indices for Norway 1819-2003,” in: Oyvind Eitrheim, Jan T. Klovland and Jan F. Qvigstad (eds), Historical Monetary Statistics for Norway, Norges Bank, Oslo, 349-375.
Gerardi, Kristopher, Andreas Lehnert, Shane Sherlund and Paul Willen (2008), “Making Sense of the Subprime Crisis,” Brookings Papers on Economic Activity, Fall,
Gerlach, Stefan and Wensheng Peng (2005), ʺBank Lending and Property Prices in Hong Kong,ʺ Journal of Banking and Finance, 29, 461-481.
Girouard, Natalie and Sveinbjörn Blöndal (2001), “House Prices and Economic Activity,” OECD Economic Department Working Paper 279.
Goodhart, Charles A.E. and Boris Hofmann (2007), House Prices and the Macroeconomy: Implications for Banking and Price Stability, Oxford University Press, Oxford.
Goodhart, Charles A.E. and Boris Hofmann (2008), “House Prices, Money, Credit, and the Macroeconomy,” Oxford Review of Economic Policy, 24, 180-205.
Hofmann, Boris (2003), ”Bank Lending and Property Prices: Some International Evidence,” HKIMR Working Paper No. 22.
Holtz-Eakin, Douglas, Whitney Newey and Harvey S. Rosen (1988), “Estimating Vector Autoregressions with Panel Data,” Econometrica, 56, 1371-1395.
Hunter, William C., George G. Kaufman and Michael Pomerleano (2003), Asset Price Bubbles: The Implications for Monetary, Regulatory, and International Policies, MIT Press, Cambridge, MA.
Im, Kyung So, M. Hashem Pesaran and Yongcheol Shin (2003), “Testing for Unit Roots in Heterogenous Panels,” Journal of Econometrics, 115, 53-74.
International Monetary Fund (2008), “The Changing Housing Cycle and the Implications for Monetary Policy,” World Economic Outlook, 2008, 103-132.
Kohn, Donald L. (2006), “Monetary policy and asset prices,” Speech at “Monetary Policy: A Journey from Theory to Practice,ʺ a European Central Bank Colloquium held in honor of Otmar Issing, Frankfurt, March 16, available at www.federalreserve.gov/newsevents/speech/ kohn20060316a.htm.
Lastrapes, William D. (1998), “International Evidence on Equity Prices, Interest Rates and Money,” Journal of International Money and Finance, 17, 377-406.
Levin, Andrew, Chien-Fu Lin and Chia-Shang James Chu (2002), “Unit Root Tests in Panel Data: Asymptotic and Finite-Sample Properties,” Journal of Econometrics, 108, 1-24.
Pedroni, Peter (1999), “Critical Values for Cointegration Tests in Heterogenous Panels with Multiple Regressors,” Oxford Bulletin of Economics and Statistics, Special Issue, 653-670.
Pesaran, M. Hashem, Til Schuermann and Scott Weiner (2004), ʺModelling Regional Interdependencies Using a Global Error-Correcting Macroeconometric Model,ʺ Journal of Business and Economic Statistics, 22, 129-162.
Pesaran, M. Hashem and Ron Smith (1995), “Estimating Long-Run Relationships from Dynamic Heterogeneous Panels,” Journal of Econometrics, 68, 79-113.

22
Sims, Christopher A. and Tao A. Zha (1999), “Error Bands for Impulse Responses,” Econometrica, 67, 1113-1156.
Tsatsaronis, Kostas and Haibin Zhu (2004), “What Drives Housing Price Dynamics: Cross-Country Evidence,” BIS Quarterly Review, March 2004, 65-78.
23
Table 1. Detailed unit-root test results.
Levels CPI GDP Credit Interest rate
Prop. price Equity price
Australia -3.02 -1.35 -2.36 -2.28 -2.58 -1.48 Belgium -2.97 -4.10 -3.12 -1.01 -0.56 -2.63 Canada -3.10 -2.28 -5.03 -1.20 -1.22 -2.04
Denmark -3.17 -2.76 -1.03 -1.35 -1.69 -2.96 Finland -3.01 -2.15 -2.19 -1.24 -1.56 -1.90 France -1.93 -2.49 -3.67 -0.94 -2.97 -3.37
Germany -1.09 -2.55 0.20 -2.18 -0.76 -2.26 Ireland -1.72 -2.23 -1.25 -2.62 -1.77 -2.00
Italy -1.55 -2.76 -3.86 -0.81 -2.53 -2.25 Japan -1.27 -3.02 -3.19 -1.34 -4.80 -2.71
Netherlands -2.17 -2.58 -1.63 -0.79 -2.02 -1.93 Norway -2.53 -2.17 -2.02 -1.50 -3.13 -1.77
Spain -1.87 -2.50 0.40 -0.71 -3.12 -1.97 Sweden -2.29 -1.25 -2.21 -0.77 -2.15 -1.67
Switzerland -3.31 -1.38 -2.68 -1.36 -2.63 -1.97 UK -2.26 -2.49 -3.73 -1.30 -0.56 -1.96 US -2.46 -1.67 -0.20 -2.21 -1.16 -2.03
1st diff. Australia -3.00 -7.30 -3.92 -2.81 -2.32 -2.78 Belgium -3.63 -4.98 -2.05 -7.86 -3.14 -2.52 Canada -5.60 -3.23 -2.60 -7.25 -2.20 -3.95
Denmark -2.92 -2.32 -2.53 -9.39 -2.17 -4.93 Finland -1.77 -2.44 -1.74 -4.37 -3.02 -3.36 France -2.26 -2.95 -2.38 -8.83 -1.73 -2.61
Germany -3.04 -3.04 -0.24 -2.92 -3.13 -3.37 Ireland -3.58 -2.74 -3.18 -9.47 -2.29 -3.06
Italy -0.83 -3.62 -1.96 -5.17 -1.52 -4.07 Japan -2.78 -2.96 -2.02 -3.93 -1.15 -4.80
Netherlands -3.61 -2.69 -6.88 -5.35 -2.38 -2.06 Norway -4.09 -9.53 -2.73 -6.93 -2.62 -7.12
Spain -1.69 -2.28 -1.61 -3.92 -1.71 -2.37 Sweden -2.02 -9.86 -2.20 -3.43 -2.23 -6.79
Switzerland -1.64 -6.78 -2.23 -2.33 -1.81 -2.35 UK -1.70 -3.12 -2.97 -3.52 -2.33 -2.55 US -1.95 -3.92 -5.67 -3.33 -1.95 -2.32
Except for the interest rate, where we include a constant only, the tests for the levels include a constant and a trend and five lags, whereas the test for the differences include a constant and four lags. The test statistics are distributed as N(0,1). Bold face denotes significance at the 5 percent level.
24
Figure 1. Log residential property prices (solid) and log credit (dashed)
Australia
1986 1988 1990 1992 1994 1996 1998 2000 2002 2004 20064.00
4.50
5.00
5.50
11.5
12.5
13.5
14.5
Belgium
1986 1988 1990 1992 1994 1996 1998 2000 2002 2004 20064.4
4.8
5.2
5.6
6.0
11.2511.5011.7512.0012.2512.50
Canada
1986 1988 1990 1992 1994 1996 1998 2000 2002 2004 200611.2
11.6
12.0
12.4
13.0
13.4
13.8
14.2
14.6
Denmark
1986 1988 1990 1992 1994 1996 1998 2000 2002 2004 20064.8
5.2
5.6
6.0
12.2
12.6
13.0
13.4
13.8
Finland
1986 1988 1990 1992 1994 1996 1998 2000 2002 2004 20064.6
5.0
5.4
5.8
10.4
10.8
11.2
11.6
France
1986 1988 1990 1992 1994 1996 1998 2000 2002 2004 20067.25
7.75
8.25
8.75
6.6
7.0
7.4
7.8
8.2
Germany
1986 1988 1990 1992 1994 1996 1998 2000 2002 2004 20063.00
3.10
3.20
3.30
7
9
11
13
Ireland
1986 1988 1990 1992 1994 1996 1998 2000 2002 2004 200610.75
11.25
11.75
12.25
12.75
9.5
10.5
11.5
12.5
Italy
1986 1988 1990 1992 1994 1996 1998 2000 2002 2004 20065.8
6.2
6.6
7.0
12.25
12.75
13.25
13.75
14.25
Japan
1986 1988 1990 1992 1994 1996 1998 2000 2002 2004 20062.8
3.0
3.2
3.4
12.5
12.7
12.9
13.1
Netherlands
1986 1988 1990 1992 1994 1996 1998 2000 2002 2004 20064.00
4.50
5.00
5.50
8
12
16
20
Norway
1986 1988 1990 1992 1994 1996 1998 2000 2002 2004 20063.8
4.2
4.6
5.0
12.25
12.75
13.25
13.75
14.25
Spain
1986 1988 1990 1992 1994 1996 1998 2000 2002 2004 20065.50
6.00
6.50
7.00
7.50
4.04.55.05.56.06.5
Sweden
1986 1988 1990 1992 1994 1996 1998 2000 2002 2004 20064.6
5.0
5.4
5.8
6.2
17.5
22.5
27.5
32.5
37.5
Switzerland
1986 1988 1990 1992 1994 1996 1998 2000 2002 2004 20065.40
5.50
5.60
5.70
5.80
4.6
4.8
5.0
5.2
UK
1986 1988 1990 1992 1994 1996 1998 2000 2002 2004 20063.4
3.8
4.2
4.6
5.0
11.50
12.00
12.50
13.00
13.50
US
1986 1988 1990 1992 1994 1996 1998 2000 2002 2004 20064.755.005.255.505.756.00
7.50
8.00
8.50
9.00
25
Figure 2. Log residential property prices in levels (solid) and first differences (dashed)
Australia
1986 1988 1990 1992 1994 1996 1998 2000 2002 2004 20064.00
4.50
5.00
5.50
-0.02
0.02
0.06
0.10
Belgium
1986 1988 1990 1992 1994 1996 1998 2000 2002 2004 20064.4
4.8
5.2
5.6
6.0
-0.01
0.01
0.03
0.05
Canada
1986 1988 1990 1992 1994 1996 1998 2000 2002 2004 200611.2
11.6
12.0
12.4
-0.075
-0.025
0.025
0.075
Denmark
1986 1988 1990 1992 1994 1996 1998 2000 2002 2004 20064.8
5.2
5.6
6.0
-0.08
-0.04
0.00
0.04
0.08
Finland
1986 1988 1990 1992 1994 1996 1998 2000 2002 2004 20064.6
5.0
5.4
5.8
-0.15
-0.05
0.05
0.15
France
1986 1988 1990 1992 1994 1996 1998 2000 2002 2004 20067.25
7.75
8.25
8.75
-0.050
-0.025
0.000
0.025
0.050
0.075
Germany
1986 1988 1990 1992 1994 1996 1998 2000 2002 2004 20063.00
3.10
3.20
3.30
-0.01
0.01
0.03
0.05
Ireland
1986 1988 1990 1992 1994 1996 1998 2000 2002 2004 200610.75
11.25
11.75
12.25
12.75
-0.04
0.00
0.04
0.08
Italy
1986 1988 1990 1992 1994 1996 1998 2000 2002 2004 20065.8
6.2
6.6
7.0
-0.06
-0.02
0.02
0.06
Japan
1986 1988 1990 1992 1994 1996 1998 2000 2002 2004 20062.8
3.0
3.2
3.4
-0.03
-0.01
0.01
0.03
0.05
Netherlands
1986 1988 1990 1992 1994 1996 1998 2000 2002 2004 20064.00
4.50
5.00
5.50
-0.04
0.00
0.04
0.08
Norway
1986 1988 1990 1992 1994 1996 1998 2000 2002 2004 20063.8
4.2
4.6
5.0
-0.06
-0.02
0.02
0.06
0.10
Spain
1986 1988 1990 1992 1994 1996 1998 2000 2002 2004 20065.50
6.00
6.50
7.00
7.50
-0.050
-0.025
0.000
0.025
0.050
0.075
Sweden
1986 1988 1990 1992 1994 1996 1998 2000 2002 2004 20064.6
5.0
5.4
5.8
6.2
-0.06
-0.02
0.02
0.06
Switzerland
1986 1988 1990 1992 1994 1996 1998 2000 2002 2004 20065.40
5.50
5.60
5.70
5.80
-0.03
-0.01
0.01
0.03
0.05
UK
1986 1988 1990 1992 1994 1996 1998 2000 2002 2004 20063.4
3.8
4.2
4.6
5.0
-0.04
0.00
0.04
0.08
0.12
US
1986 1988 1990 1992 1994 1996 1998 2000 2002 2004 20064.75
5.00
5.25
5.50
5.75
6.00
-0.005
0.005
0.015
0.025
0.035
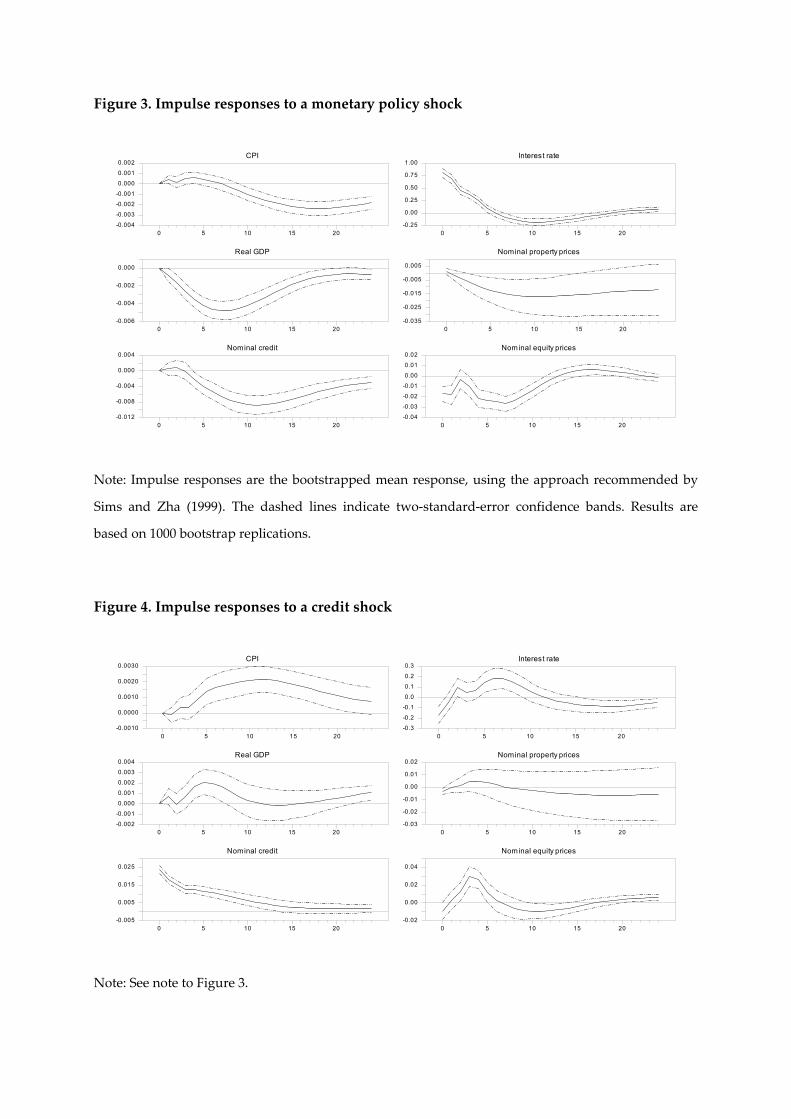
Figure 3. Impulse responses to a monetary policy shock
CPI
0 5 10 15 20-0.004
-0.003
-0.002
-0.001
0.000
0.001
0.002
Real GDP
0 5 10 15 20-0.006
-0.004
-0.002
0.000
Nominal credit
0 5 10 15 20-0.012
-0.008
-0.004
0.000
0.004
Interest rate
0 5 10 15 20-0.25
0.00
0.25
0.50
0.75
1.00
Nominal property prices
0 5 10 15 20-0.035
-0.025
-0.015
-0.005
0.005
Nominal equity prices
0 5 10 15 20-0.04
-0.03
-0.02
-0.01
0.00
0.01
0.02
Note: Impulse responses are the bootstrapped mean response, using the approach recommended by
Sims and Zha (1999). The dashed lines indicate two-standard-error confidence bands. Results are
based on 1000 bootstrap replications.
Figure 4. Impulse responses to a credit shock
CPI
0 5 10 15 20-0.0010
0.0000
0.0010
0.0020
0.0030
Real GDP
0 5 10 15 20-0.002
-0.001
0.000
0.001
0.002
0.003
0.004
Nominal credit
0 5 10 15 20-0.005
0.005
0.015
0.025
Interest rate
0 5 10 15 20-0.3
-0.2
-0.1
0.0
0.1
0.2
0.3
Nominal property prices
0 5 10 15 20-0.03
-0.02
-0.01
0.00
0.01
0.02
Nominal equity prices
0 5 10 15 20-0.02
0.00
0.02
0.04
Note: See note to Figure 3.
27
Figure 5. Impulse responses to a property-price shock
CPI
0 5 10 15 20-0.00075
-0.00025
0.00025
0.00075
0.00125
Real GDP
0 5 10 15 20-0.002
-0.001
0.000
0.001
0.002
0.003
0.004
Nominal credit
0 5 10 15 20-0.0025
0.0000
0.0025
0.0050
0.0075
Interest rate
0 5 10 15 20-0.2
-0.1
0.0
0.1
0.2
0.3
0.4
Nominal property prices
0 5 10 15 200.000
0.010
0.020
0.030
Nominal equity prices
0 5 10 15 20-0.015
-0.005
0.005
0.015
0.025
Note: See note to Figure 3.
Figure 6. Impulse responses to an equity-price shock
CPI
0 5 10 15 20-0.0015
-0.0005
0.0005
0.0015
Real GDP
0 5 10 15 20-0.0005
0.0005
0.0015
0.0025
0.0035
Nominal credit
0 5 10 15 20-0.001
0.001
0.003
0.005
0.007
Interest rate
0 5 10 15 20-0.10
-0.05
0.00
0.05
0.10
0.15
0.20
Nominal property prices
0 5 10 15 20-0.020
-0.010
0.000
0.010
0.020
Nominal equity prices
0 5 10 15 20-0.02
0.00
0.02
0.04
0.06
0.08
0.10
Note: See note to Figure 3.
28
Figure 7. Variance decomposition
CPI
CPIReal GDP
Nominal creditInterest rate
Nominal property pricesNominal equity prices
0 5 10 15 200.00
0.25
0.50
0.75
1.00
Real GDP
CPIReal GDP
Nominal creditInterest rate
Nominal property pricesNominal equity prices
0 5 10 15 200.00
0.25
0.50
0.75
1.00
Nominal credit
CPIReal GDP
Nominal creditInterest rate
Nominal property pricesNominal equity prices
0 5 10 15 200.00
0.25
0.50
0.75
1.00
Interest rate
CPIReal GDP
Nominal creditInterest rate
Nominal property pricesNominal equity prices
0 5 10 15 200.00
0.25
0.50
0.75
1.00
Nominal property prices
CPIReal GDP
Nominal creditInterest rate
Nominal property pricesNominal equity prices
0 5 10 15 200.00
0.25
0.50
0.75
1.00
Nominal equity prices
CPIReal GDP
Nominal creditInterest rate
Nominal property pricesNominal equity prices
0 5 10 15 200.00
0.25
0.50
0.75
1.00
29
Figure 8. International transmission of a US monetary policy shock
US Other countriesCPI
0 2 4 6 8 10 12 14 16 18 20 22-0.0004
-0.0000
0.0004
GDP
0 2 4 6 8 10 12 14 16 18 20 22-0.00150
-0.00075
0.00000
Nominal credi t
0 2 4 6 8 10 12 14 16 18 20 22-0.0020
-0.0005
0.0010
Interest rate
0 1 2 3 4 5 6 7 8 9 10 11 12 13 14 15 16 17 18 19 20 21 22 23-0.1
0.2
0.5
Nominal property prices
0 2 4 6 8 10 12 14 16 18 20 22-0.005-0.0020.001
Nominal equity prices
0 2 4 6 8 10 12 14 16 18 20 22-0.020
-0.005
0.010
CPI
0 2 4 6 8 10 12 14 16 18 20 22-0.00100
-0.00025
0.00050
GDP
0 2 4 6 8 10 12 14 16 18 20 22-0.0015
0.0000
0.0015
Nominal credit
0 2 4 6 8 10 12 14 16 18 20 22-0.0030.0000.003
Interest rate
0 2 4 6 8 10 12 14 16 18 20 22-0.10
0.05
0.20
Nominal property prices
0 2 4 6 8 10 12 14 16 18 20 22-0.0125
-0.0025
0.0075
Nominal equi ty prices
0 2 4 6 8 10 12 14 16 18 20 22-0.0150.0000.015
Note: Impulse responses are the bootstrapped mean response, using the approach recommended by Sims and Zha (1999). The dashed lines indicate one-standard-error confidence bands. Results are based on 200 bootstrap replications.
Figure 9. International transmission of a US credit shock
US Other countriesCPI
0 2 4 6 8 10 12 14 16 18 20 22-0.0003-0.00000.0003
GDP
0 2 4 6 8 10 12 14 16 18 20 22-0.0006
-0.0000
0.0006
real credi t
0 2 4 6 8 10 12 14 16 18 20 22-0.002
0.004
0.010
interest rate
0 2 4 6 8 10 12 14 16 18 20 22-0.075
0.025
0.125
property prices
0 2 4 6 8 10 12 14 16 18 20 22-0.005-0.0020.001
equi ty prices
0 2 4 6 8 10 12 14 16 18 20 22-0.0075
0.0000
0.0075
CPI
0 2 4 6 8 10 12 14 16 18 20 22-0.00100
-0.00025
0.00050
GDP
0 2 4 6 8 10 12 14 16 18 20 22-0.0015
-0.0005
0.0005
real credi t
0 2 4 6 8 10 12 14 16 18 20 22-0.003
0.000
0.003
interest rate
0 2 4 6 8 10 12 14 16 18 20 22-0.15
0.00
0.15
property prices
0 2 4 6 8 10 12 14 16 18 20 22-0.0100-0.00250.0050
equity prices
0 2 4 6 8 10 12 14 16 18 20 22-0.020
-0.005
0.010
Note: See note to Figure 8.
30
Figure 10. International transmission of a US property price shock
US Other countriesCPI
0 2 4 6 8 10 12 14 16 18 20 22-0.0003
-0.0000
0.0003
GDP
0 2 4 6 8 10 12 14 16 18 20 22-0.00050
0.00025
0.00100
real credi t
0 2 4 6 8 10 12 14 16 18 20 22-0.00075
0.00025
0.00125
interest rate
0 2 4 6 8 10 12 14 16 18 20 22-0.08
-0.02
0.04
property prices
0 2 4 6 8 10 12 14 16 18 20 22-0.0010.0020.005
equi ty prices
0 2 4 6 8 10 12 14 16 18 20 22-0.004
0.004
0.012
CPI
0 2 4 6 8 10 12 14 16 18 20 22-0.0006
-0.0000
0.0006
GDP
0 2 4 6 8 10 12 14 16 18 20 22-0.000750.000000.00075
real credi t
0 2 4 6 8 10 12 14 16 18 20 22-0.003
0.000
0.003
interest rate
0 2 4 6 8 10 12 14 16 18 20 22-0.150
-0.050
0.050
property prices
0 2 4 6 8 10 12 14 16 18 20 22-0.0075
0.0000
0.0075
equity prices
0 2 4 6 8 10 12 14 16 18 20 22-0.010
0.005
0.020
Note: See note to Figure 8.
Figure 11. International transmission of a US equity price shock
US Other countriesCPI
0 2 4 6 8 10 12 14 16 18 20 22-0.0008
-0.0002
0.0004
GDP
0 2 4 6 8 10 12 14 16 18 20 22-0.00050
0.00025
0.00100
real credi t
0 2 4 6 8 10 12 14 16 18 20 22-0.0020
0.0000
0.0020
interest rate
0 2 4 6 8 10 12 14 16 18 20 22-0.100-0.0250.050
property prices
0 2 4 6 8 10 12 14 16 18 20 22-0.003
0.000
0.003
equity prices
0 2 4 6 8 10 12 14 16 18 20 22-0.01
0.02
0.05
CPI
0 2 4 6 8 10 12 14 16 18 20 22-0.0008
-0.0002
0.0004
GDP
0 2 4 6 8 10 12 14 16 18 20 22-0.0015
0.0000
0.0015
real credi t
0 2 4 6 8 10 12 14 16 18 20 22-0.003
0.000
0.003
interest rate
0 2 4 6 8 10 12 14 16 18 20 22-0.150
-0.050
0.050
property prices
0 2 4 6 8 10 12 14 16 18 20 22-0.0050
0.0025
0.0100
equi ty prices
0 2 4 6 8 10 12 14 16 18 20 22-0.01
0.02
0.05
Note: See note to Figure 8.

NBB WORKING PAPER No. 149 - OCTOBER 2008 31
NATIONAL BANK OF BELGIUM - WORKING PAPERS SERIES
1. "Model-based inflation forecasts and monetary policy rules" by M. Dombrecht and R. Wouters, ResearchSeries, February 2000.
2. "The use of robust estimators as measures of core inflation" by L. Aucremanne, Research Series,February 2000.
3. "Performances économiques des Etats-Unis dans les années nonante" by A. Nyssens, P. Butzen,P. Bisciari, Document Series, March 2000.
4. "A model with explicit expectations for Belgium" by P. Jeanfils, Research Series, March 2000.5. "Growth in an open economy: some recent developments" by S. Turnovsky, Research Series, May 2000.6. "Knowledge, technology and economic growth: an OECD perspective" by I. Visco, A. Bassanini,
S. Scarpetta, Research Series, May 2000.7. "Fiscal policy and growth in the context of European integration" by P. Masson, Research Series, May
2000.8. "Economic growth and the labour market: Europe's challenge" by C. Wyplosz, Research Series, May
2000.9. "The role of the exchange rate in economic growth: a euro-zone perspective" by R. MacDonald,
Research Series, May 2000.10. "Monetary union and economic growth" by J. Vickers, Research Series, May 2000.11. "Politique monétaire et prix des actifs: le cas des Etats-Unis" by Q. Wibaut, Document Series, August
2000.12. "The Belgian industrial confidence indicator: leading indicator of economic activity in the euro area?" by
J.-J. Vanhaelen, L. Dresse, J. De Mulder, Document Series, November 2000.13. "Le financement des entreprises par capital-risque" by C. Rigo, Document Series, February 2001.14. "La nouvelle économie" by P. Bisciari, Document Series, March 2001.15. "De kostprijs van bankkredieten" by A. Bruggeman and R. Wouters, Document Series, April 2001.16. "A guided tour of the world of rational expectations models and optimal policies" by Ph. Jeanfils,
Research Series, May 2001.17. "Attractive Prices and Euro - Rounding effects on inflation" by L. Aucremanne and D. Cornille,
Documents Series, November 2001.18. "The interest rate and credit channels in Belgium: an investigation with micro-level firm data" by
P. Butzen, C. Fuss and Ph. Vermeulen, Research series, December 2001.19. "Openness, imperfect exchange rate pass-through and monetary policy" by F. Smets and R. Wouters,
Research series, March 2002.20. "Inflation, relative prices and nominal rigidities" by L. Aucremanne, G. Brys, M. Hubert, P. J. Rousseeuw
and A. Struyf, Research series, April 2002.21. "Lifting the burden: fundamental tax reform and economic growth" by D. Jorgenson, Research series,
May 2002.22. "What do we know about investment under uncertainty?" by L. Trigeorgis, Research series, May 2002.23. "Investment, uncertainty and irreversibility: evidence from Belgian accounting data" by D. Cassimon,
P.-J. Engelen, H. Meersman, M. Van Wouwe, Research series, May 2002.24. "The impact of uncertainty on investment plans" by P. Butzen, C. Fuss, Ph. Vermeulen, Research series,
May 2002.25. "Investment, protection, ownership, and the cost of capital" by Ch. P. Himmelberg, R. G. Hubbard,
I. Love, Research series, May 2002.26. "Finance, uncertainty and investment: assessing the gains and losses of a generalised non-linear
structural approach using Belgian panel data", by M. Gérard, F. Verschueren, Research series,May 2002.
27. "Capital structure, firm liquidity and growth" by R. Anderson, Research series, May 2002.28. "Structural modelling of investment and financial constraints: where do we stand?" by J.- B. Chatelain,
Research series, May 2002.29. "Financing and investment interdependencies in unquoted Belgian companies: the role of venture
capital" by S. Manigart, K. Baeyens, I. Verschueren, Research series, May 2002.30. "Development path and capital structure of Belgian biotechnology firms" by V. Bastin, A. Corhay,
G. Hübner, P.-A. Michel, Research series, May 2002.31. "Governance as a source of managerial discipline" by J. Franks, Research series, May 2002.

NBB WORKING PAPER No. 149 - OCTOBER 200832
32. "Financing constraints, fixed capital and R&D investment decisions of Belgian firms" by M. Cincera,Research series, May 2002.
33. "Investment, R&D and liquidity constraints: a corporate governance approach to the Belgian evidence"by P. Van Cayseele, Research series, May 2002.
34. "On the Origins of the Franco-German EMU Controversies" by I. Maes, Research series, July 2002.35. "An estimated dynamic stochastic general equilibrium model of the Euro Area", by F. Smets and
R. Wouters, Research series, October 2002.36. "The labour market and fiscal impact of labour tax reductions: The case of reduction of employers' social
security contributions under a wage norm regime with automatic price indexing of wages", byK. Burggraeve and Ph. Du Caju, Research series, March 2003.
37. "Scope of asymmetries in the Euro Area", by S. Ide and Ph. Moës, Document series, March 2003.38. "De autonijverheid in België: Het belang van het toeleveringsnetwerk rond de assemblage van
personenauto's", by F. Coppens and G. van Gastel, Document series, June 2003.39. "La consommation privée en Belgique", by B. Eugène, Ph. Jeanfils and B. Robert, Document series,
June 2003.40. "The process of European monetary integration: a comparison of the Belgian and Italian approaches", by
I. Maes and L. Quaglia, Research series, August 2003.41. "Stock market valuation in the United States", by P. Bisciari, A. Durré and A. Nyssens, Document series,
November 2003.42. "Modeling the Term Structure of Interest Rates: Where Do We Stand?, by K. Maes, Research series,
February 2004.43. "Interbank Exposures: An Empirical Examination of System Risk in the Belgian Banking System", by
H. Degryse and G. Nguyen, Research series, March 2004.44. "How Frequently do Prices change? Evidence Based on the Micro Data Underlying the Belgian CPI", by
L. Aucremanne and E. Dhyne, Research series, April 2004.45. "Firms' investment decisions in response to demand and price uncertainty", by C. Fuss and
Ph. Vermeulen, Research series, April 2004.46. "SMEs and Bank Lending Relationships: the Impact of Mergers", by H. Degryse, N. Masschelein and
J. Mitchell, Research series, May 2004.47. "The Determinants of Pass-Through of Market Conditions to Bank Retail Interest Rates in Belgium", by
F. De Graeve, O. De Jonghe and R. Vander Vennet, Research series, May 2004.48. "Sectoral vs. country diversification benefits and downside risk", by M. Emiris, Research series,
May 2004.49. "How does liquidity react to stress periods in a limit order market?", by H. Beltran, A. Durré and P. Giot,
Research series, May 2004.50. "Financial consolidation and liquidity: prudential regulation and/or competition policy?", by
P. Van Cayseele, Research series, May 2004.51. "Basel II and Operational Risk: Implications for risk measurement and management in the financial
sector", by A. Chapelle, Y. Crama, G. Hübner and J.-P. Peters, Research series, May 2004.52. "The Efficiency and Stability of Banks and Markets", by F. Allen, Research series, May 2004.53. "Does Financial Liberalization Spur Growth?" by G. Bekaert, C.R. Harvey and C. Lundblad, Research
series, May 2004.54. "Regulating Financial Conglomerates", by X. Freixas, G. Lóránth, A.D. Morrison and H.S. Shin, Research
series, May 2004.55. "Liquidity and Financial Market Stability", by M. O'Hara, Research series, May 2004.56. "Economisch belang van de Vlaamse zeehavens: verslag 2002", by F. Lagneaux, Document series,
June 2004.57. "Determinants of Euro Term Structure of Credit Spreads", by A. Van Landschoot, Research series,
July 2004.58. "Macroeconomic and Monetary Policy-Making at the European Commission, from the Rome Treaties to
the Hague Summit", by I. Maes, Research series, July 2004.59. "Liberalisation of Network Industries: Is Electricity an Exception to the Rule?", by F. Coppens and
D. Vivet, Document series, September 2004.60. "Forecasting with a Bayesian DSGE model: an application to the euro area", by F. Smets and
R. Wouters, Research series, September 2004.61. "Comparing shocks and frictions in US and Euro Area Business Cycle: a Bayesian DSGE approach", by
F. Smets and R. Wouters, Research series, October 2004.
NBB WORKING PAPER No. 149 - OCTOBER 2008 33
62. "Voting on Pensions: A Survey", by G. de Walque, Research series, October 2004.63. "Asymmetric Growth and Inflation Developments in the Acceding Countries: A New Assessment", by
S. Ide and P. Moës, Research series, October 2004.64. "Importance économique du Port Autonome de Liège: rapport 2002", by F. Lagneaux, Document series,
November 2004.65. "Price-setting behaviour in Belgium: what can be learned from an ad hoc survey", by L. Aucremanne and
M. Druant, Research series, March 2005.66. "Time-dependent versus State-dependent Pricing: A Panel Data Approach to the Determinants of
Belgian Consumer Price Changes", by L. Aucremanne and E. Dhyne, Research series, April 2005.67. "Indirect effects – A formal definition and degrees of dependency as an alternative to technical
coefficients", by F. Coppens, Research series, May 2005.68. "Noname – A new quarterly model for Belgium", by Ph. Jeanfils and K. Burggraeve, Research series,
May 2005.69. "Economic importance of the Flemish maritime ports: report 2003", F. Lagneaux, Document series, May
2005.70. "Measuring inflation persistence: a structural time series approach", M. Dossche and G. Everaert,
Research series, June 2005.71. "Financial intermediation theory and implications for the sources of value in structured finance markets",
J. Mitchell, Document series, July 2005.72. "Liquidity risk in securities settlement", J. Devriese and J. Mitchell, Research series, July 2005.73. "An international analysis of earnings, stock prices and bond yields", A. Durré and P. Giot, Research
series, September 2005.74. "Price setting in the euro area: Some stylized facts from Individual Consumer Price Data", E. Dhyne,
L. J. Álvarez, H. Le Bihan, G. Veronese, D. Dias, J. Hoffmann, N. Jonker, P. Lünnemann, F. Rumler andJ. Vilmunen, Research series, September 2005.
75. "Importance économique du Port Autonome de Liège: rapport 2003", by F. Lagneaux, Document series,October 2005.
76. "The pricing behaviour of firms in the euro area: new survey evidence, by S. Fabiani, M. Druant,I. Hernando, C. Kwapil, B. Landau, C. Loupias, F. Martins, T. Mathä, R. Sabbatini, H. Stahl andA. Stokman, Research series, November 2005.
77. "Income uncertainty and aggregate consumption, by L. Pozzi, Research series, November 2005.78. "Crédits aux particuliers - Analyse des données de la Centrale des Crédits aux Particuliers", by
H. De Doncker, Document series, January 2006.79. "Is there a difference between solicited and unsolicited bank ratings and, if so, why?" by P. Van Roy,
Research series, February 2006.80. "A generalised dynamic factor model for the Belgian economy - Useful business cycle indicators and
GDP growth forecasts", by Ch. Van Nieuwenhuyze, Research series, February 2006.81. "Réduction linéaire de cotisations patronales à la sécurité sociale et financement alternatif" by
Ph. Jeanfils, L. Van Meensel, Ph. Du Caju, Y. Saks, K. Buysse and K. Van Cauter, Document series,March 2006.
82. "The patterns and determinants of price setting in the Belgian industry" by D. Cornille and M. Dossche,Research series, May 2006.
83. "A multi-factor model for the valuation and risk management of demand deposits" by H. Dewachter,M. Lyrio and K. Maes, Research series, May 2006.
84. "The single European electricity market: A long road to convergence", by F. Coppens and D. Vivet,Document series, May 2006.
85. "Firm-specific production factors in a DSGE model with Taylor price setting", by G. de Walque, F. Smetsand R. Wouters, Research series, June 2006.
86. "Economic importance of the Belgian ports: Flemish maritime ports and Liège port complex - report2004", by F. Lagneaux, Document series, June 2006.
87. "The response of firms' investment and financing to adverse cash flow shocks: the role of bankrelationships", by C. Fuss and Ph. Vermeulen, Research series, July 2006.
88. "The term structure of interest rates in a DSGE model", by M. Emiris, Research series, July 2006.89. "The production function approach to the Belgian output gap, Estimation of a Multivariate Structural Time
Series Model", by Ph. Moës, Research series, September 2006.90. "Industry Wage Differentials, Unobserved Ability, and Rent-Sharing: Evidence from Matched Worker-
Firm Data, 1995-2002", by R. Plasman, F. Rycx and I. Tojerow, Research series, October 2006.

NBB WORKING PAPER No. 149 - OCTOBER 200834
91. "The dynamics of trade and competition", by N. Chen, J. Imbs and A. Scott, Research series, October2006.
92. "A New Keynesian Model with Unemployment", by O. Blanchard and J. Gali, Research series, October2006.
93. "Price and Wage Setting in an Integrating Europe: Firm Level Evidence", by F. Abraham, J. Konings andS. Vanormelingen, Research series, October 2006.
94. "Simulation, estimation and welfare implications of monetary policies in a 3-country NOEM model", byJ. Plasmans, T. Michalak and J. Fornero, Research series, October 2006.
95. "Inflation persistence and price-setting behaviour in the euro area: a summary of the Inflation PersistenceNetwork evidence ", by F. Altissimo, M. Ehrmann and F. Smets, Research series, October 2006.
96. "How Wages Change: Micro Evidence from the International Wage Flexibility Project", by W.T. Dickens,L. Goette, E.L. Groshen, S. Holden, J. Messina, M.E. Schweitzer, J. Turunen and M. Ward, Researchseries, October 2006.
97. "Nominal wage rigidities in a new Keynesian model with frictional unemployment", by V. Bodart,G. de Walque, O. Pierrard, H.R. Sneessens and R. Wouters, Research series, October 2006.
98. "Dynamics on monetary policy in a fair wage model of the business cycle", by D. De la Croix,G. de Walque and R. Wouters, Research series, October 2006.
99. "The kinked demand curve and price rigidity: evidence from scanner data", by M. Dossche, F. Heylenand D. Van den Poel, Research series, October 2006.
100. "Lumpy price adjustments: a microeconometric analysis", by E. Dhyne, C. Fuss, H. Peseran andP. Sevestre, Research series, October 2006.
101. "Reasons for wage rigidity in Germany", by W. Franz and F. Pfeiffer, Research series, October 2006.102. "Fiscal sustainability indicators and policy design in the face of ageing", by G. Langenus, Research
series, October 2006.103. "Macroeconomic fluctuations and firm entry: theory and evidence", by V. Lewis, Research series,
October 2006.104. "Exploring the CDS-Bond Basis" by J. De Wit, Research series, November 2006.105. "Sector Concentration in Loan Portfolios and Economic Capital", by K. Düllmann and N. Masschelein,
Research series, November 2006.106. "R&D in the Belgian Pharmaceutical Sector", by H. De Doncker, Document series, December 2006.107. "Importance et évolution des investissements directs en Belgique", by Ch. Piette, Document series,
January 2007.108. "Investment-Specific Technology Shocks and Labor Market Frictions", by R. De Bock, Research series,
February 2007.109. "Shocks and frictions in US Business cycles: a Bayesian DSGE Approach", by F. Smets and R. Wouters,
Research series, February 2007.110. "Economic impact of port activity: a disaggregate analysis. The case of Antwerp", by F. Coppens,
F. Lagneaux, H. Meersman, N. Sellekaerts, E. Van de Voorde, G. van Gastel, Th. Vanelslander,A. Verhetsel, Document series, February 2007.
111. "Price setting in the euro area: some stylised facts from individual producer price data", byPh. Vermeulen, D. Dias, M. Dossche, E. Gautier, I. Hernando, R. Sabbatini, H. Stahl, Research series,March 2007.
112. "Assessing the Gap between Observed and Perceived Inflation in the Euro Area: Is the Credibility of theHICP at Stake?", by L. Aucremanne, M. Collin, Th. Stragier, Research series, April 2007.
113. "The spread of Keynesian economics: a comparison of the Belgian and Italian experiences", by I. Maes,Research series, April 2007.
114. "Imports and Exports at the Level of the Firm: Evidence from Belgium", by M. Muûls and M. Pisu,Research series, May 2007.
115. "Economic importance of the Belgian ports: Flemish maritime ports and Liège port complex - report2005", by F. Lagneaux, Document series, May 2007.
116. "Temporal Distribution of Price Changes: Staggering in the Large and Synchronization in the Small", byE. Dhyne and J. Konieczny, Research series, June 2007.
117. "Can excess liquidity signal an asset price boom?", by A. Bruggeman, Research series, August 2007.118. "The performance of credit rating systems in the assessment of collateral used in Eurosystem monetary
policy operations", by F. Coppens, F. González and G. Winkler, Research series, September 2007.119. "The determinants of stock and bond return comovements", by L. Baele, G. Bekaert and K. Inghelbrecht,
Research series, October 2007.
NBB WORKING PAPER No. 149 - OCTOBER 2008 35
120. "Monitoring pro-cyclicality under the capital requirements directive: preliminary concepts for developing aframework", by N. Masschelein, Document series, October 2007.
121. "Dynamic order submission strategies with competition between a dealer market and a crossingnetwork", by H. Degryse, M. Van Achter and G. Wuyts, Research series, November 2007.
122. "The gas chain: influence of its specificities on the liberalisation process", by C. Swartenbroekx,Document series, November 2007.
123. "Failure prediction models: performance, disagreements, and internal rating systems", by J. Mitchell andP. Van Roy, Research series, December 2007.
124. "Downward wage rigidity for different workers and firms: an evaluation for Belgium using the IWFPprocedure", by Ph. Du Caju, C. Fuss and L. Wintr, Research series, December 2007.
125. "Economic importance of Belgian transport logistics", by F. Lagneaux, Document series, January 2008.126. "Some evidence on late bidding in eBay auctions", by L. Wintr, Research series, January 2008.127. "How do firms adjust their wage bill in Belgium? A decomposition along the intensive and extensive
margins", by C. Fuss, Research series, January 2008.128. "Exports and productivity – comparable evidence for 14 countries", by The International Study Group on
Exports and Productivity, Research series, February 2008.129. "Estimation of monetary policy preferences in a forward-looking model: a Bayesian approach", by
P. Ilbas, Research series, March 2008.130. "Job creation, job destruction and firms' international trade involvement", by M. Pisu, Research series,
March 2008.131. "Do survey indicators let us see the business cycle? A frequency decomposition", by L. Dresse and
Ch. Van Nieuwenhuyze, Research series, March 2008.132. "Searching for additional sources of inflation persistence: the micro-price panel data approach", by
R. Raciborski, Research series, April 2008.133. "Short-term forecasting of GDP using large monthly datasets - A pseudo real-time forecast evaluation
exercise", by K. Barhoumi, S. Benk, R. Cristadoro, A. Den Reijer, A. Jakaitiene, P. Jelonek, A. Rua,G. Rünstler, K. Ruth and Ch. Van Nieuwenhuyze, Research series, June 2008.
134. "Economic importance of the Belgian ports: Flemish maritime ports, Liège port complex and the port ofBrussels - report 2006" by S. Vennix, Document series, June 2008.
135. "Imperfect exchange rate pass-through: the role of distribution services and variable demand elasticity",by Ph. Jeanfils, Research series, August 2008.
136. "Multivariate structural time series models with dual cycles: Implications for measurement of output gapand potential growth", by Ph. Moës, Research series, August 2008.
137. "Agency problems in structured finance - a case study of European CLOs", by J. Keller, Documentseries, August 2008.
138. "The efficiency frontier as a method for gauging the performance of public expenditure: a Belgian casestudy", by B. Eugène, Research series, September 2008.
139. "Exporters and credit constraints. A firm-level approach", by M. Muûls, Research series, September2008.
140. "Export destinations and learning-by-exporting: Evidence from Belgium", by M. Pisu, Research series,September 2008.
141. "Monetary aggregates and liquidity in a neo-Wicksellian framework", by M. Canzoneri, R. Cumby,B. Diba and D. López-Salido, Research series, October 2008.
142 "Liquidity, inflation and asset prices in a time-varying framework for the euro area, by Ch. Baumeister,E. Durinck and G. Peersman, Research series, October 2008.
143. "The bond premium in a DSGE model with long-run real and nominal risks", by Glenn D. Rudebusch andEric T. Swanson, Research series, October 2008.
144. "Imperfect information, macroeconomic dynamics and the yield curve: an encompassing macro-financemodel", by H. Dewachter, Research series, October 2008.
145. "Housing market spillovers: evidence from an estimated DSGE model", by M. Iacoviello and S. Neri,Research series, October 2008.
146. "Credit frictions and optimal monetary policy", by V. Cúrdia and M. Woodford, Research series,October 2008.
147. "Central Bank misperceptions and the role of money in interest rate rules", by G. Beck and V. Wieland,Research series, October 2008.
148. "Financial (in)stability, supervision and liquidity injections: a dynamic general equilibrium approach", byG. de Walque, O. Pierrard and A. Rouabah, Research series, October 2008.

NBB WORKING PAPER No. 149 - OCTOBER 200836
149. "Monetary policy, asset prices and macroeconomic conditions: a panel-VAR study", byK. Assenmacher-Wesche and S. Gerlach, Research series, October 2008.