Embed Size (px)
Citation preview
Monetary Policy Spillovers & Leaning Against the Wind
Karl Habermeier International Monetary Fund
Presentation at the Federal Reserve Bank of New York
2015 Central Banking Seminar
October 6, 2015
Agenda
Spillovers from Divergent Monetary Policies
Monetary Policy and Financial Stability
IMF staff papers
Spillover Report
July 2015
www.imf.org/external/np/pp/eng/2015/082815a.pdf
See also:
Carolina Buitron and Esteban Vesperoni, Spillover Implications of Differences in Monetary Conditions in the United States and the Euro Area, IMF, July 2015
Julian Chow, Florence Jaumotte, et al., Spillovers from Dollar Appreciation, IMF July 2015
Easy monetary policies in systemic advanced economies (U.S., U.K., euro area, Japan) are …
… good for them—they will raise output toward potential and inflation toward target.
… good for other countries—an improvement in growth prospects in major advanced economies generates positive spillovers for emerging markets (and for other advanced economies), partly as their exports pick up. A recovery in major advanced economies also boosts confidence and capital flows increase.
Spillovers generally positive …
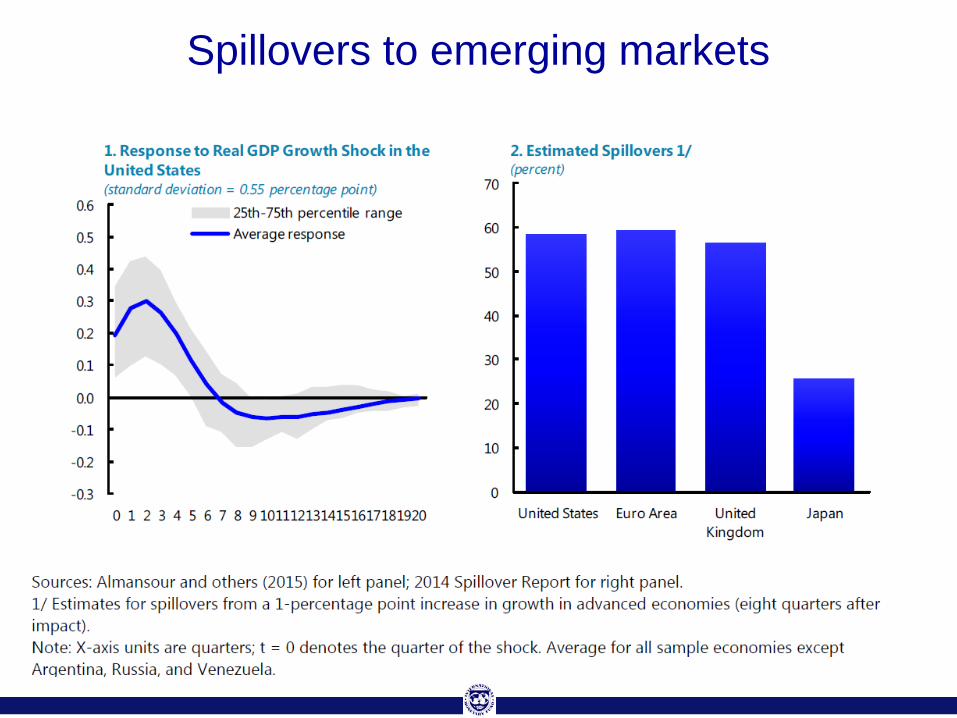
Spillovers to emerging markets
Volatility to be expected—Interest rate normalization in the U.S. can create volatility in markets. Clear communication with an eye to market expectations is a must.
Spillovers from dollar appreciation • Source of past crises—In the past, episodes of U.S. dollar appreciation have
often been associated with crises in emerging markets. • Improved resilience—Emerging markets have over the past two decades
become less dependent than in the past on debt denominated in foreign currencies, have a larger FX reserves buffer of foreign exchange reserves, and many have moved to more flexible exchange rates.
• Corporate debt a concern—build-up of foreign-denominated corporate debt in emerging markets. Risks are moderate but bear watching.
… but also some risks
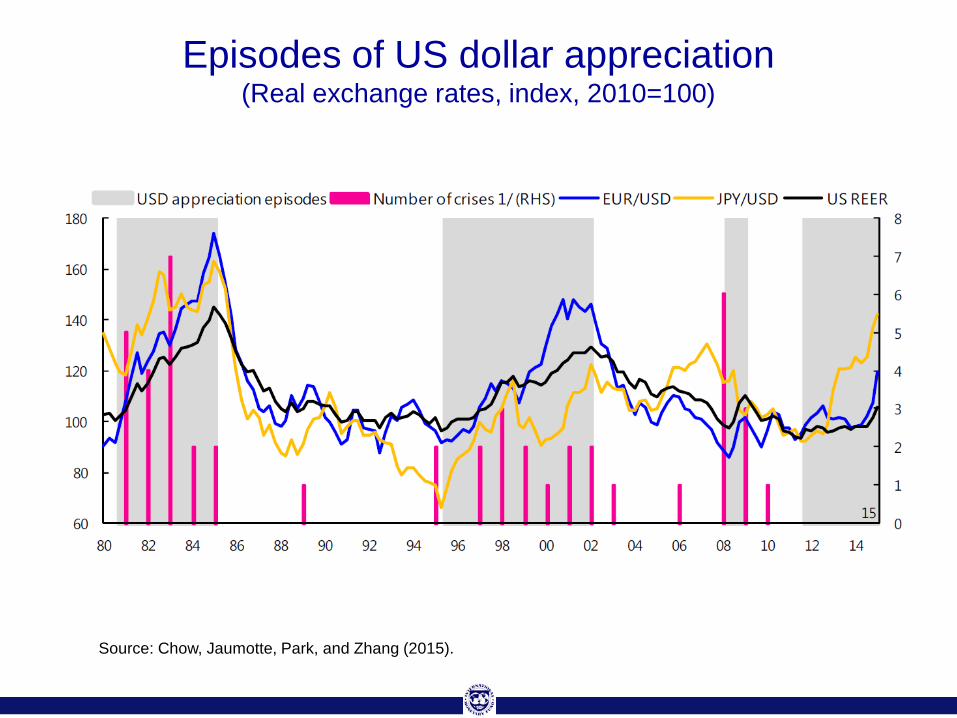
Episodes of US dollar appreciation (Real exchange rates, index, 2010=100)
Source: Chow, Jaumotte, Park, and Zhang (2015).

Corporate debt in percent of GDP
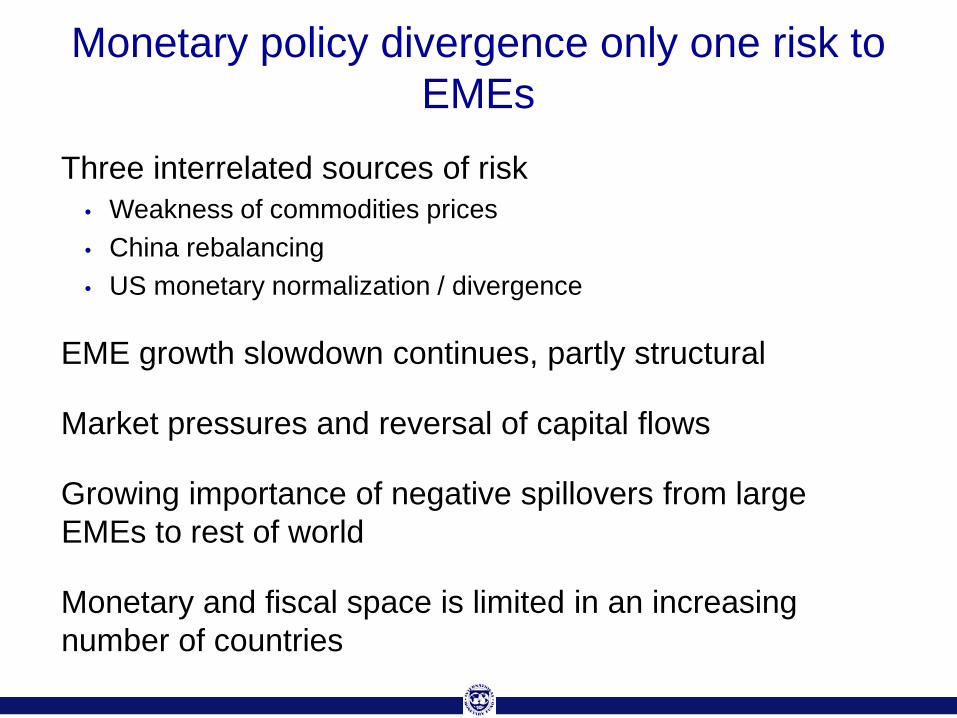
Three interrelated sources of risk • Weakness of commodities prices • China rebalancing • US monetary normalization / divergence
EME growth slowdown continues, partly structural
Market pressures and reversal of capital flows
Growing importance of negative spillovers from large EMEs to rest of world
Monetary and fiscal space is limited in an increasing number of countries
Monetary policy divergence only one risk to EMEs
Agenda
Spillovers from Divergent Monetary Policies
Monetary Policy and Financial Stability
IMF staff paper
Monetary Policy and Financial Stability
August 2015
www.imf.org/external/np/pp/eng/2015/082815a.pdf
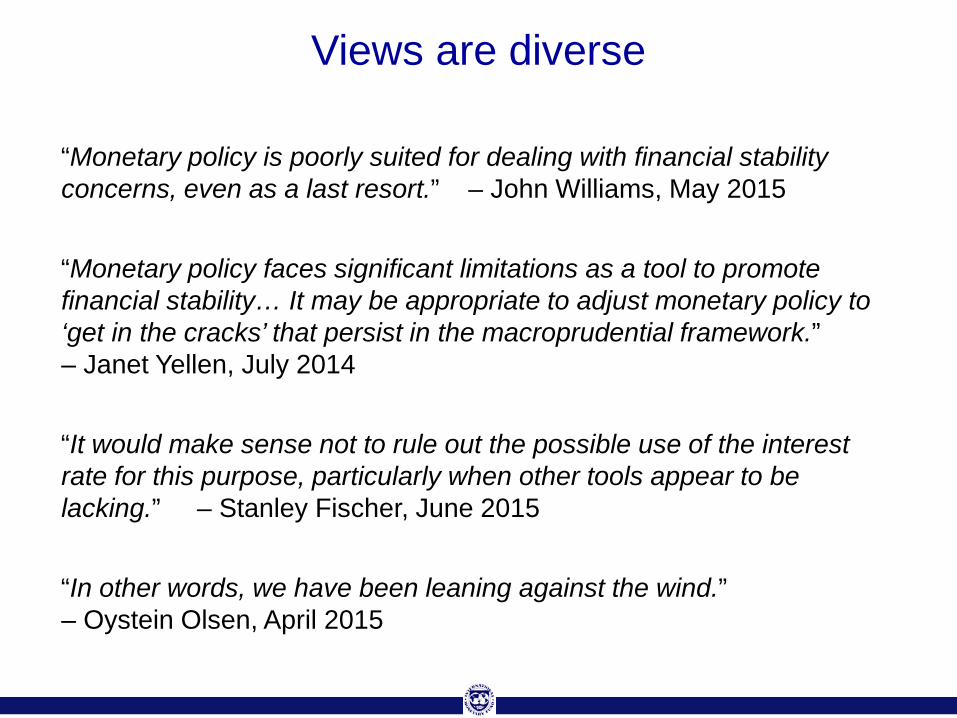
“Monetary policy is poorly suited for dealing with financial stability concerns, even as a last resort.” – John Williams, May 2015
“Monetary policy faces significant limitations as a tool to promote financial stability… It may be appropriate to adjust monetary policy to ‘get in the cracks’ that persist in the macroprudential framework.” – Janet Yellen, July 2014
“It would make sense not to rule out the possible use of the interest rate for this purpose, particularly when other tools appear to be lacking.” – Stanley Fischer, June 2015
“In other words, we have been leaning against the wind.” – Oystein Olsen, April 2015
Views are diverse
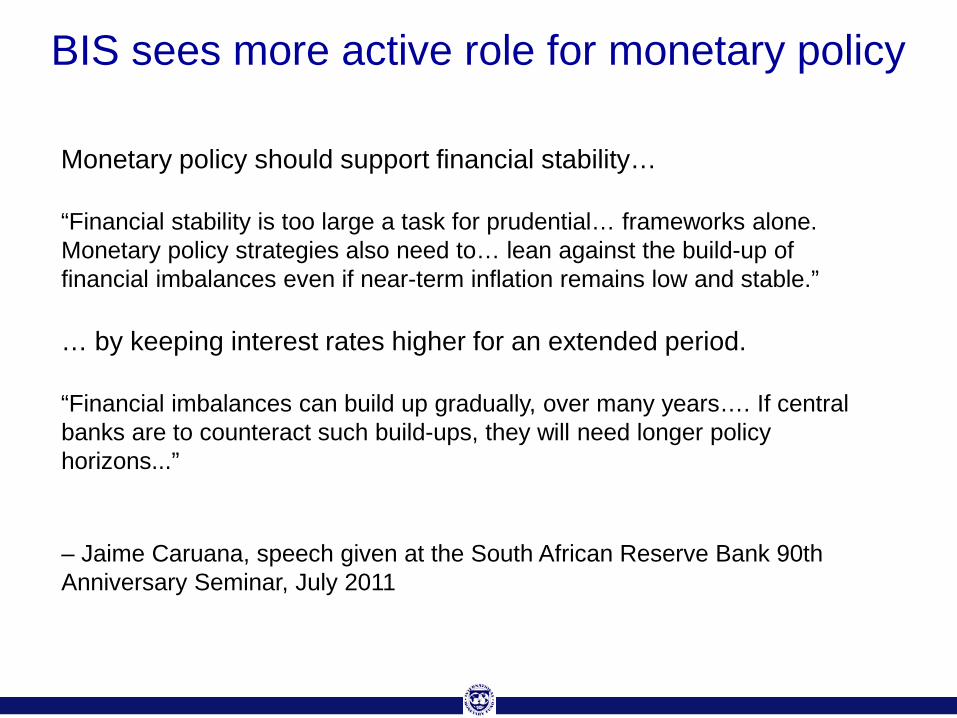
Monetary policy should support financial stability…
“Financial stability is too large a task for prudential… frameworks alone. Monetary policy strategies also need to… lean against the build-up of financial imbalances even if near-term inflation remains low and stable.”
… by keeping interest rates higher for an extended period.
“Financial imbalances can build up gradually, over many years…. If central banks are to counteract such build-ups, they will need longer policy horizons...”
– Jaime Caruana, speech given at the South African Reserve Bank 90th Anniversary Seminar, July 2011
BIS sees more active role for monetary policy
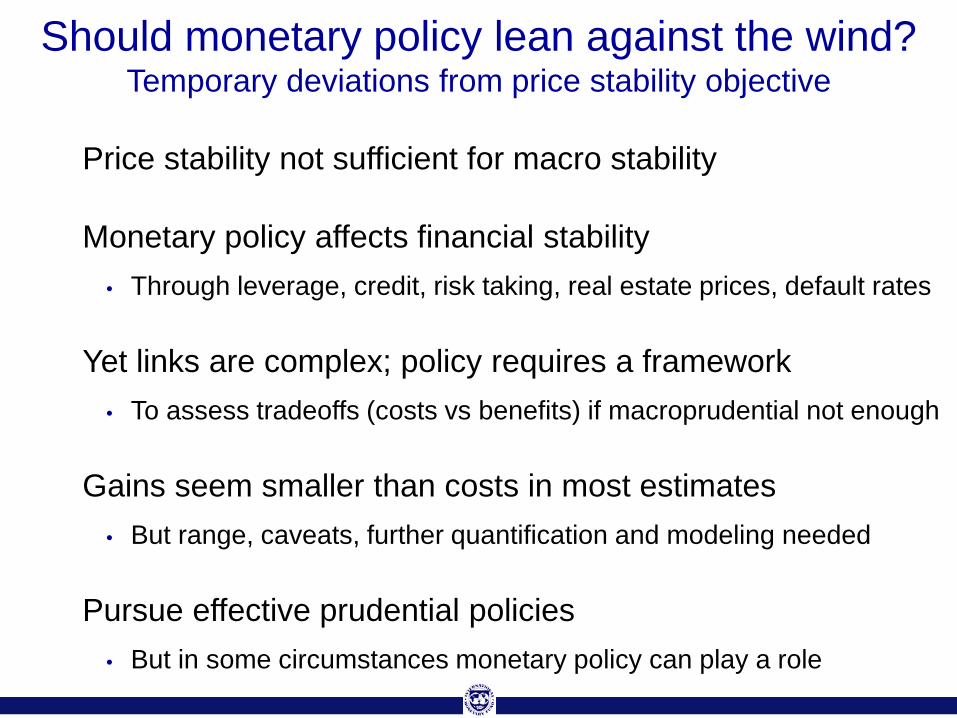
Price stability not sufficient for macro stability
Monetary policy affects financial stability • Through leverage, credit, risk taking, real estate prices, default rates
Yet links are complex; policy requires a framework • To assess tradeoffs (costs vs benefits) if macroprudential not enough
Gains seem smaller than costs in most estimates • But range, caveats, further quantification and modeling needed
Pursue effective prudential policies • But in some circumstances monetary policy can play a role
Should monetary policy lean against the wind? Temporary deviations from price stability objective
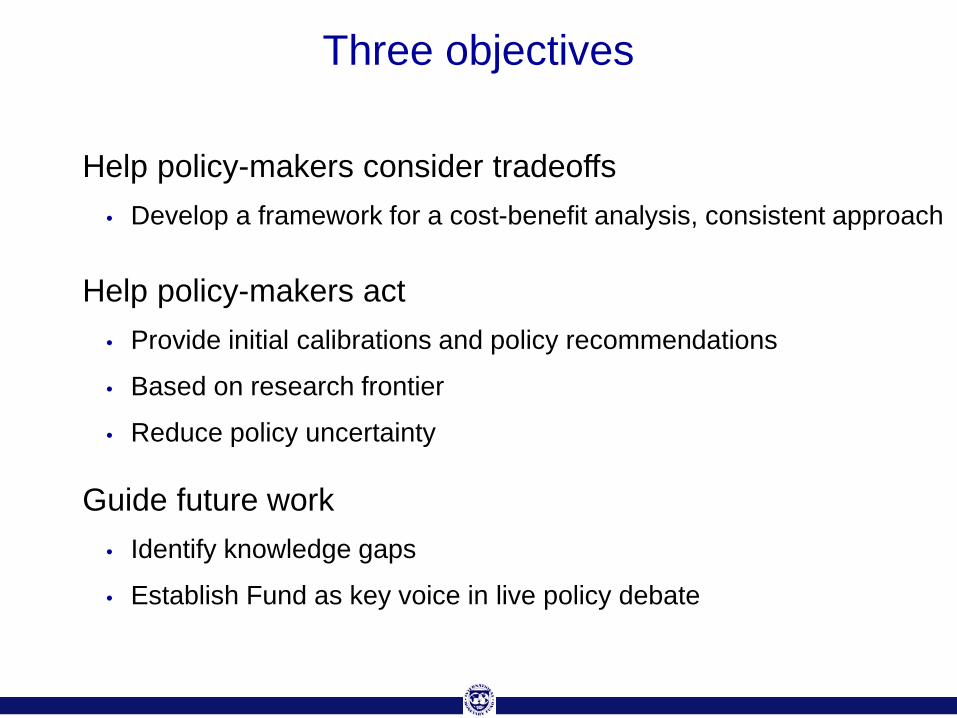
Three objectives
Help policy-makers consider tradeoffs • Develop a framework for a cost-benefit analysis, consistent approach
Help policy-makers act • Provide initial calibrations and policy recommendations
• Based on research frontier
• Reduce policy uncertainty
Guide future work • Identify knowledge gaps
• Establish Fund as key voice in live policy debate
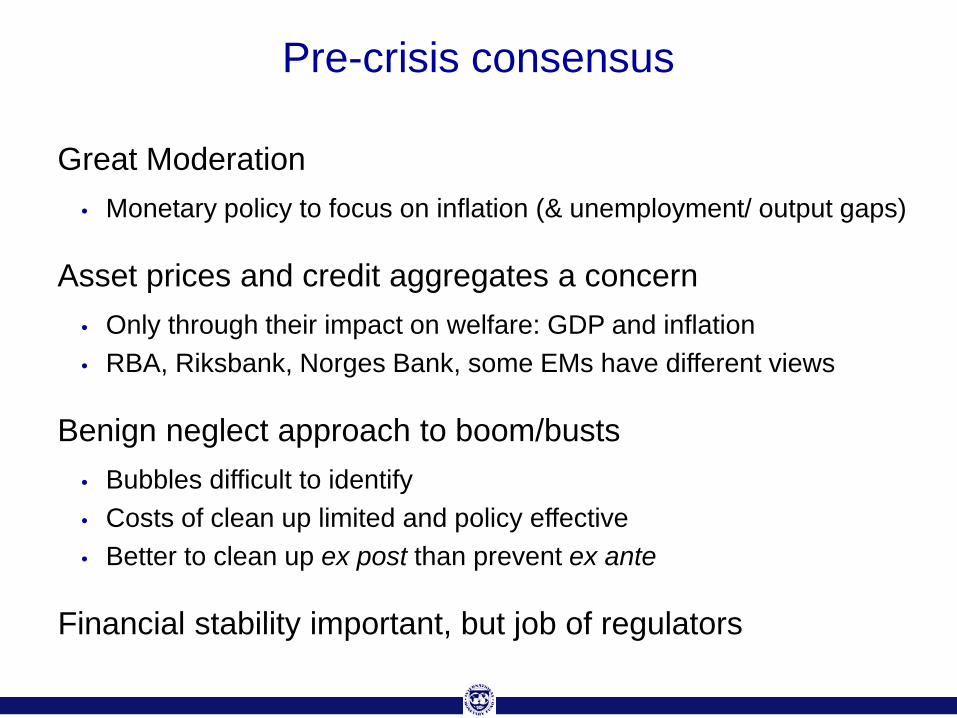
Great Moderation • Monetary policy to focus on inflation (& unemployment/ output gaps)
Asset prices and credit aggregates a concern • Only through their impact on welfare: GDP and inflation • RBA, Riksbank, Norges Bank, some EMs have different views
Benign neglect approach to boom/busts • Bubbles difficult to identify • Costs of clean up limited and policy effective • Better to clean up ex post than prevent ex ante
Financial stability important, but job of regulators
Pre-crisis consensus
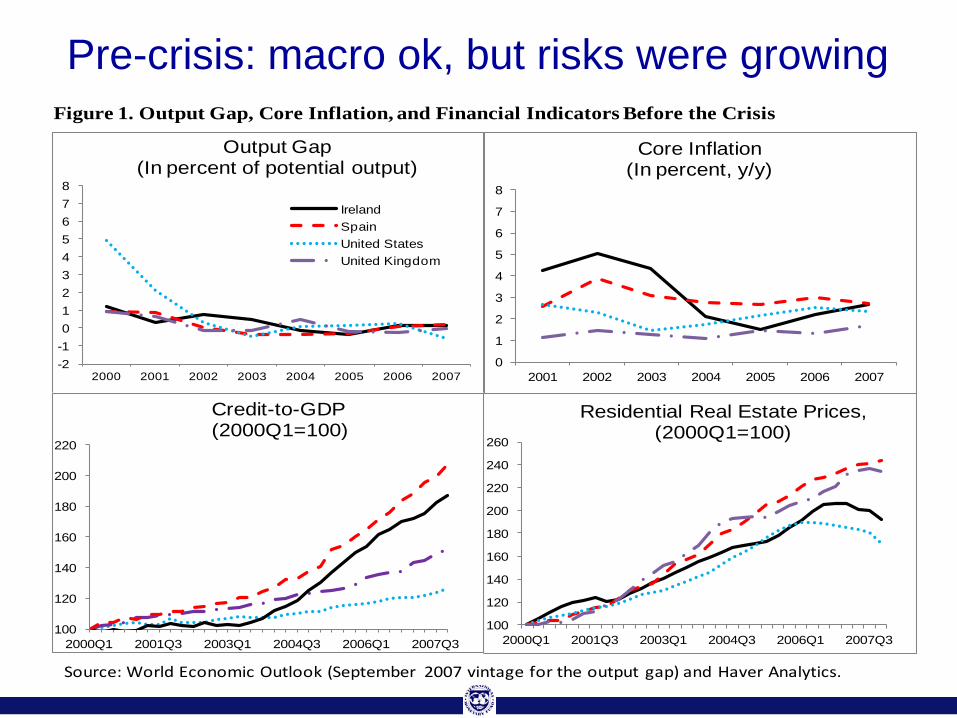
Pre-crisis: macro ok, but risks were growing
-2-1012345678
2000 2001 2002 2003 2004 2005 2006 2007
Output Gap(In percent of potential output)
IrelandSpainUnited StatesUnited Kingdom
100
120
140
160
180
200
220
240
260
2000Q1 2001Q3 2003Q1 2004Q3 2006Q1 2007Q3
Residential Real Estate Prices, (2000Q1=100)
100
120
140
160
180
200
220
2000Q1 2001Q3 2003Q1 2004Q3 2006Q1 2007Q3
Credit-to-GDP (2000Q1=100)
0
1
2
3
4
5
6
7
8
2001 2002 2003 2004 2005 2006 2007
Core Inflation(In percent, y/y)
Source: World Economic Outlook (September 2007 vintage for the output gap) and Haver Analytics.
Figure 1. Output Gap, Core Inflation, and Financial Indicators Before the Crisis
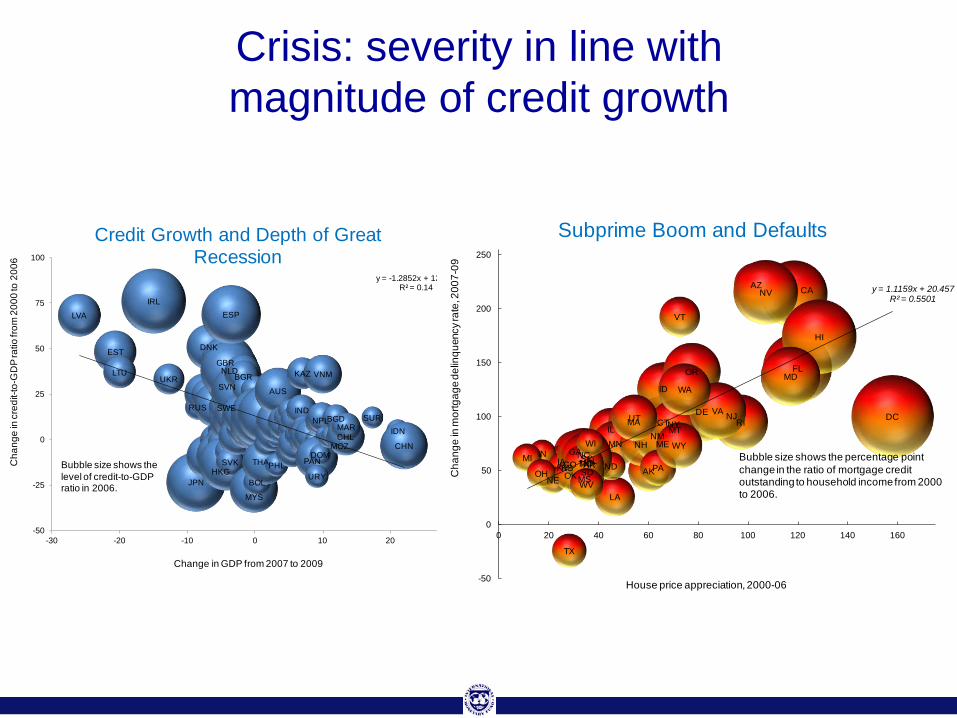
LVA
EST
LTU
IRL
UKR
JPN
RUS
DNK
HKG
SWE
SVN
GBRNLD
SVK
ESP
BGR
MYS
BOL
THAPHL
AUS
IND
KAZ
PAN
URY
DOM
NPL
VNM
BGD
MOZCHLMAR
SURIDN
CHN
y = -1.2852x + 12.969R² = 0.14
-50
-25
0
25
50
75
100
-30 -20 -10 0 10 20 30
Cha
nge
in c
redi
t-to-
GD
P ra
tio fr
om 2
000
to 2
006
Change in GDP from 2007 to 2009
Credit Growth and Depth of Great Recession
Bubble size shows the level of credit-to-GDP ratio in 2006.
AKALAR
AZ CA
CO
CT DCDE
FL
GA
HI
IA
ID
IL
INKSKY
LA
MA
MD
MEMI
MN
MO
MS
MT
NCND
NE
NH
NJ
NM
NV
NY
OH OK
OR
PA
RI
SCSDTN
TX
UTVA
VT
WA
WI
WV
WY
y = 1.1159x + 20.457R² = 0.5501
-50
0
50
100
150
200
250
0 20 40 60 80 100 120 140 160
Cha
nge
in m
ortg
age
delin
quen
cy ra
te, 2
007-
09
House price appreciation, 2000-06
Subprime Boom and Defaults
Bubble size shows the percentage point change in the ratio of mortgage credit outstanding to household income from 2000 to 2006.
Crisis: severity in line with magnitude of credit growth
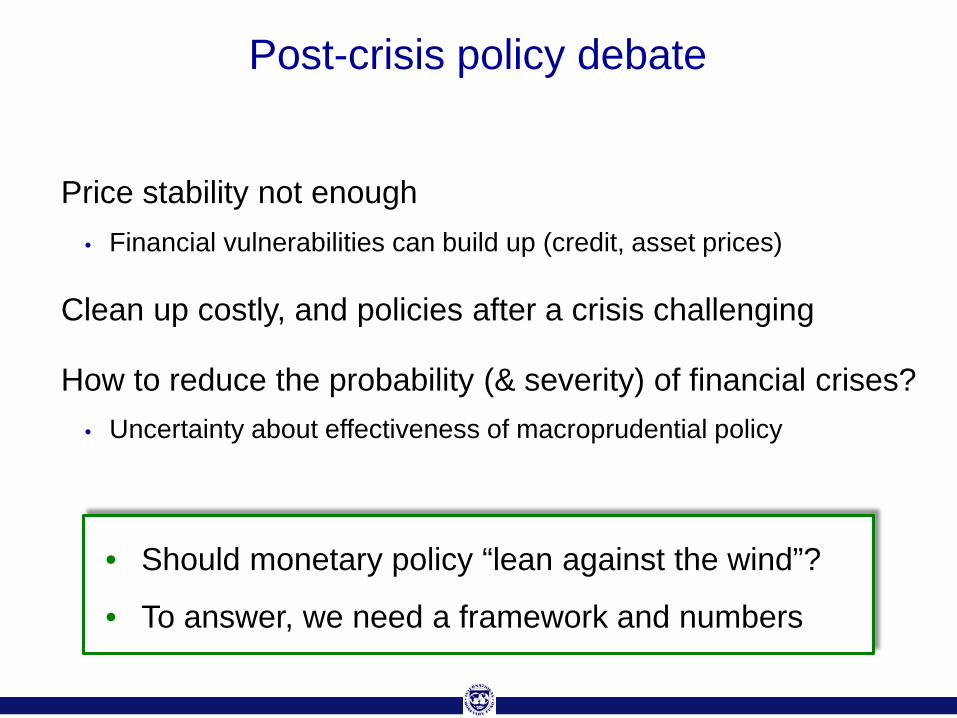
Post-crisis policy debate
Price stability not enough • Financial vulnerabilities can build up (credit, asset prices)
Clean up costly, and policies after a crisis challenging
How to reduce the probability (& severity) of financial crises? • Uncertainty about effectiveness of macroprudential policy
• Should monetary policy “lean against the wind”?
• To answer, we need a framework and numbers
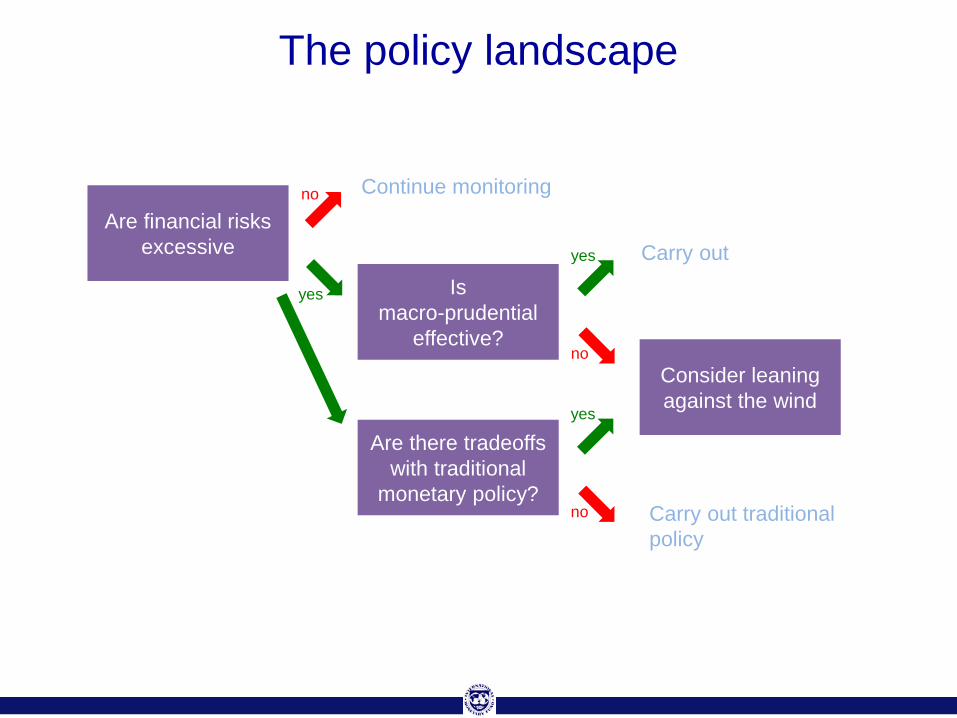
The policy landscape
Are financial risks excessive
Is macro-prudential
effective?
Are there tradeoffs with traditional
monetary policy?
yes
no
no
yes
Consider leaning against the wind
no
yes
Continue monitoring
Carry out
Carry out traditional policy
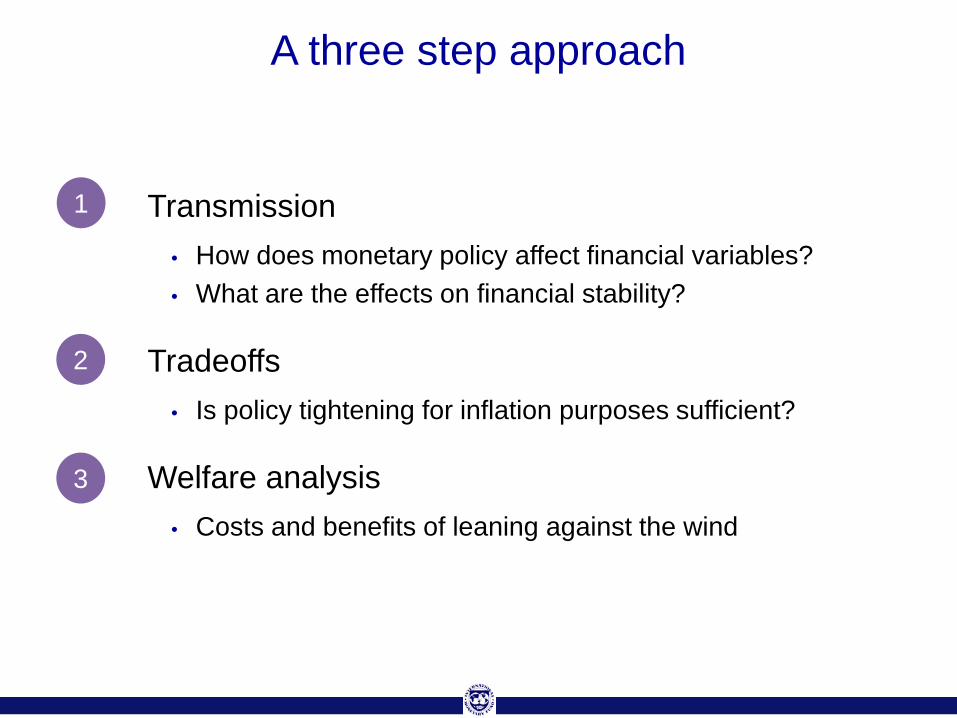
A three step approach
Transmission • How does monetary policy affect financial variables? • What are the effects on financial stability?
Tradeoffs • Is policy tightening for inflation purposes sufficient?
Welfare analysis • Costs and benefits of leaning against the wind
1
3
2
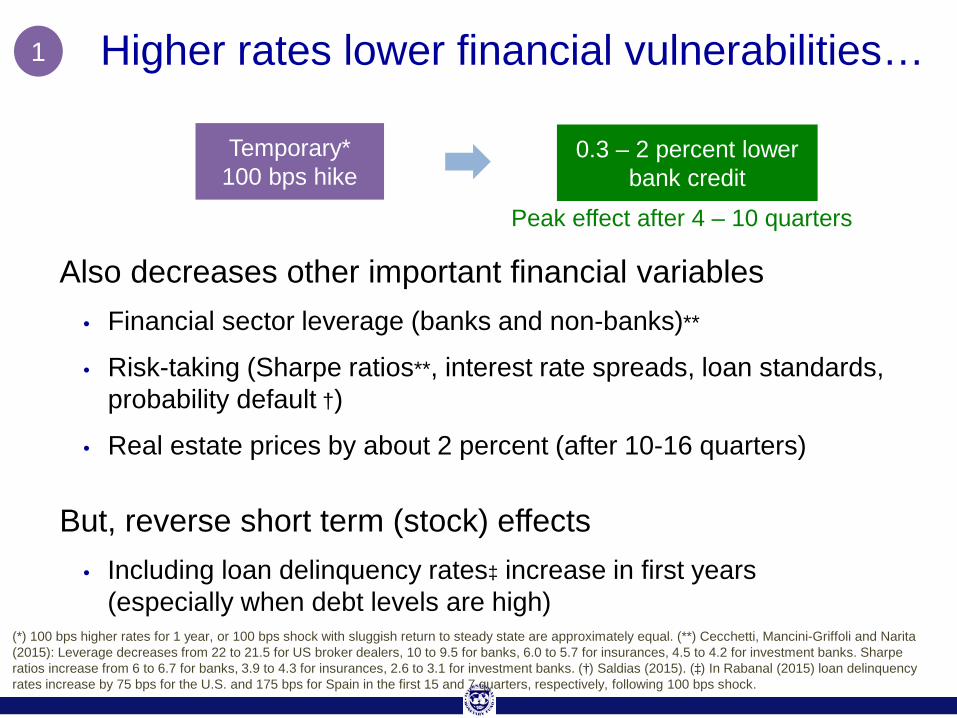
Also decreases other important financial variables • Financial sector leverage (banks and non-banks)**
• Risk-taking (Sharpe ratios**, interest rate spreads, loan standards, probability default †)
• Real estate prices by about 2 percent (after 10-16 quarters)
But, reverse short term (stock) effects • Including loan delinquency rates‡ increase in first years
(especially when debt levels are high)
Higher rates lower financial vulnerabilities… 1
0.3 – 2 percent lower bank credit
Temporary* 100 bps hike
Peak effect after 4 – 10 quarters
(*) 100 bps higher rates for 1 year, or 100 bps shock with sluggish return to steady state are approximately equal. (**) Cecchetti, Mancini-Griffoli and Narita (2015): Leverage decreases from 22 to 21.5 for US broker dealers, 10 to 9.5 for banks, 6.0 to 5.7 for insurances, 4.5 to 4.2 for investment banks. Sharpe ratios increase from 6 to 6.7 for banks, 3.9 to 4.3 for insurances, 2.6 to 3.1 for investment banks. (†) Saldias (2015). (‡) In Rabanal (2015) loan delinquency rates increase by 75 bps for the U.S. and 175 bps for Spain in the first 15 and 7 quarters, respectively, following 100 bps shock.
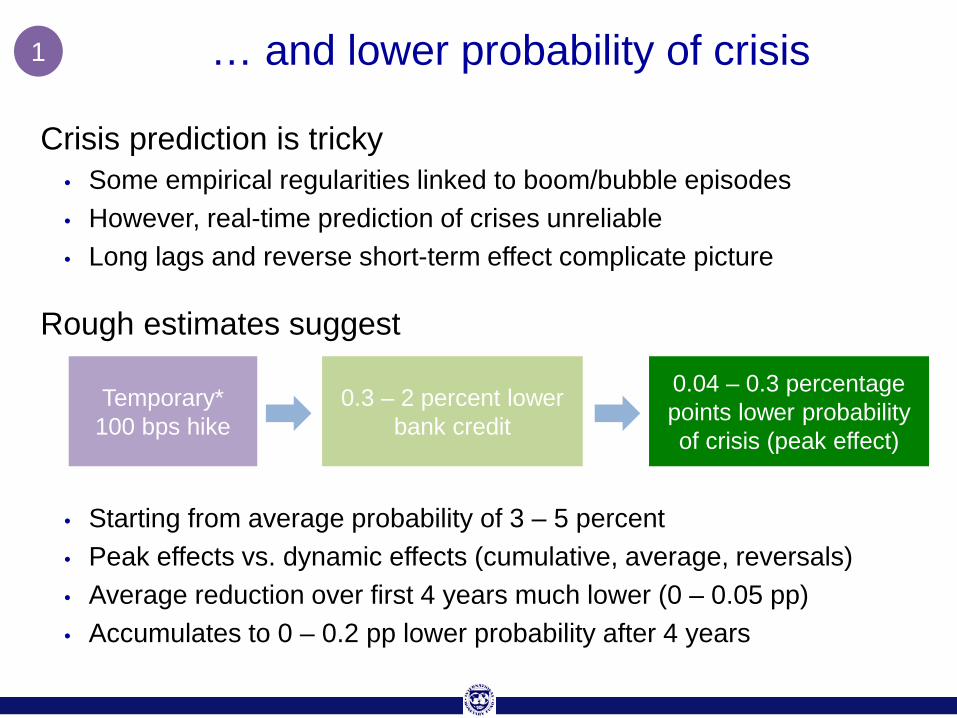
… and lower probability of crisis 1
Crisis prediction is tricky • Some empirical regularities linked to boom/bubble episodes • However, real-time prediction of crises unreliable • Long lags and reverse short-term effect complicate picture
Rough estimates suggest
• Starting from average probability of 3 – 5 percent • Peak effects vs. dynamic effects (cumulative, average, reversals) • Average reduction over first 4 years much lower (0 – 0.05 pp) • Accumulates to 0 – 0.2 pp lower probability after 4 years
0.3 – 2 percent lower bank credit
Temporary* 100 bps hike
0.04 – 0.3 percentage points lower probability of crisis (peak effect)
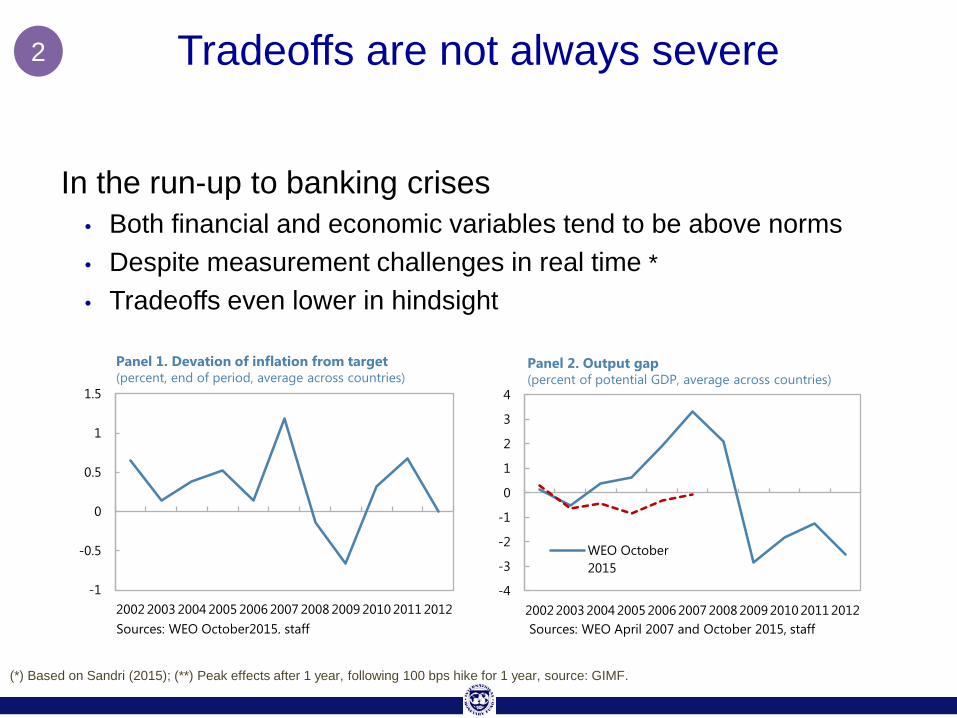
Tradeoffs are not always severe
In the run-up to banking crises • Both financial and economic variables tend to be above norms • Despite measurement challenges in real time * • Tradeoffs even lower in hindsight
2
(*) Based on Sandri (2015); (**) Peak effects after 1 year, following 100 bps hike for 1 year, source: GIMF.
-4
-3
-2
-1
0
1
2
3
4
2002 2003 2004 2005 2006 2007 2008 2009 2010 2011 2012
WEO October2015
Panel 2. Output gap (percent of potential GDP, average across countries)
Sources: WEO April 2007 and October 2015, staff
-1
-0.5
0
0.5
1
1.5
2002 2003 2004 2005 2006 2007 2008 2009 2010 2011 2012
Panel 1. Devation of inflation from target (percent, end of period, average across countries)
Sources: WEO October2015, staff

Systemic leaning against the wind • May lower the buildup of vulnerabilities
Some support for leaning against the wind in DSGE models • But models remain stylized
• Effects are small and state dependent (policy mistakes possible)
• Effects of (rudimentary) macroprudential policy much larger
Welfare is best addressed with full models 3
See, for instance, Laseen, Pescatori and Turunen (2015); Quint and Rabanal (2014); Unsal (2014); Leduc and Natal (2015).
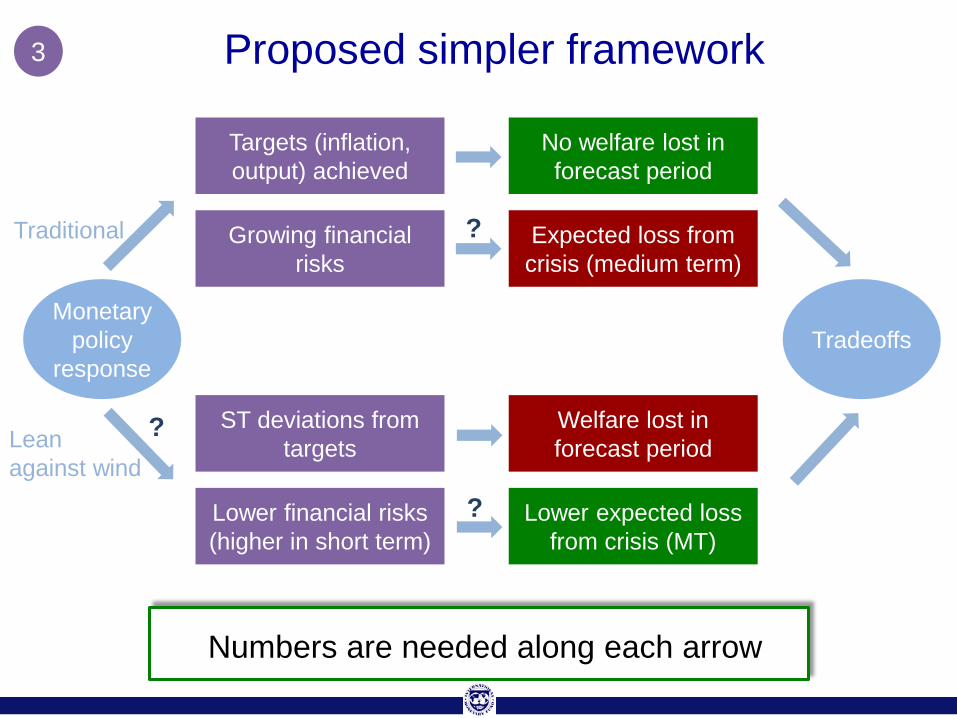
No welfare lost in forecast period
Proposed simpler framework
Targets (inflation, output) achieved
Growing financial risks
Expected loss from crisis (medium term)
Welfare lost in forecast period
ST deviations from targets
Lower financial risks (higher in short term)
Lower expected loss from crisis (MT)
Monetary policy
response Tradeoffs
Numbers are needed along each arrow
Traditional
Lean against wind
?
3
?
?
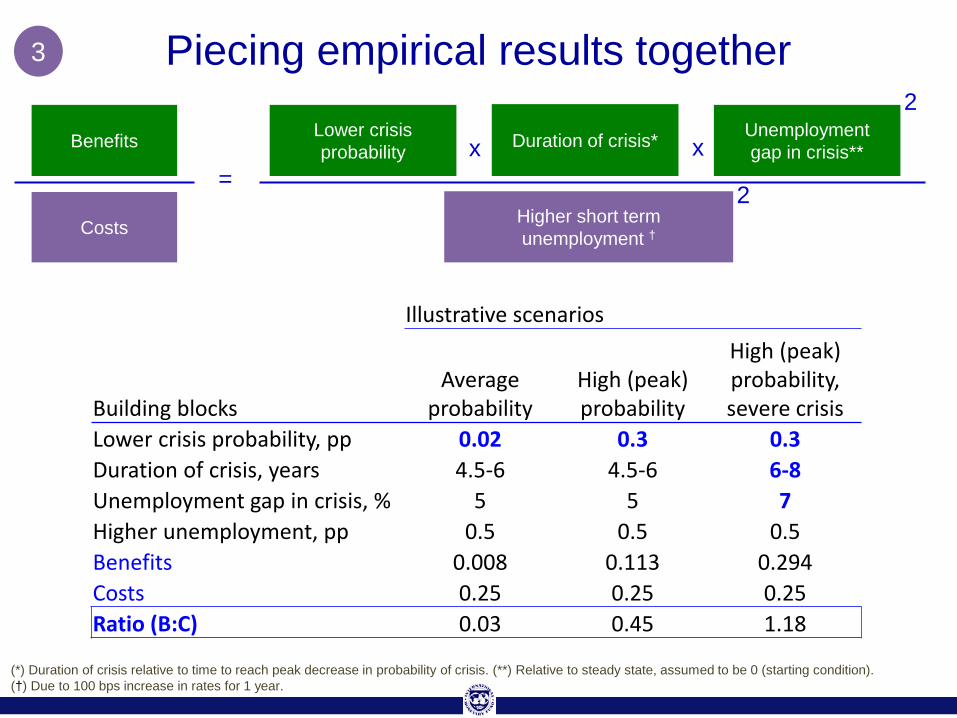
Piecing empirical results together
Costs
Benefits
=
Lower crisis probability Duration of crisis* Unemployment
gap in crisis**
Higher short term unemployment †
x x
(*) Duration of crisis relative to time to reach peak decrease in probability of crisis. (**) Relative to steady state, assumed to be 0 (starting condition). (†) Due to 100 bps increase in rates for 1 year.
Illustrative scenarios
Building blocks Average
probability High (peak) probability
High (peak) probability, severe crisis
Lower crisis probability, pp 0.02 0.3 0.3 Duration of crisis, years 4.5-6 4.5-6 6-8 Unemployment gap in crisis, % 5 5 7 Higher unemployment, pp 0.5 0.5 0.5 Benefits 0.008 0.113 0.294 Costs 0.25 0.25 0.25 Ratio (B:C) 0.03 0.45 1.18
2
2
3
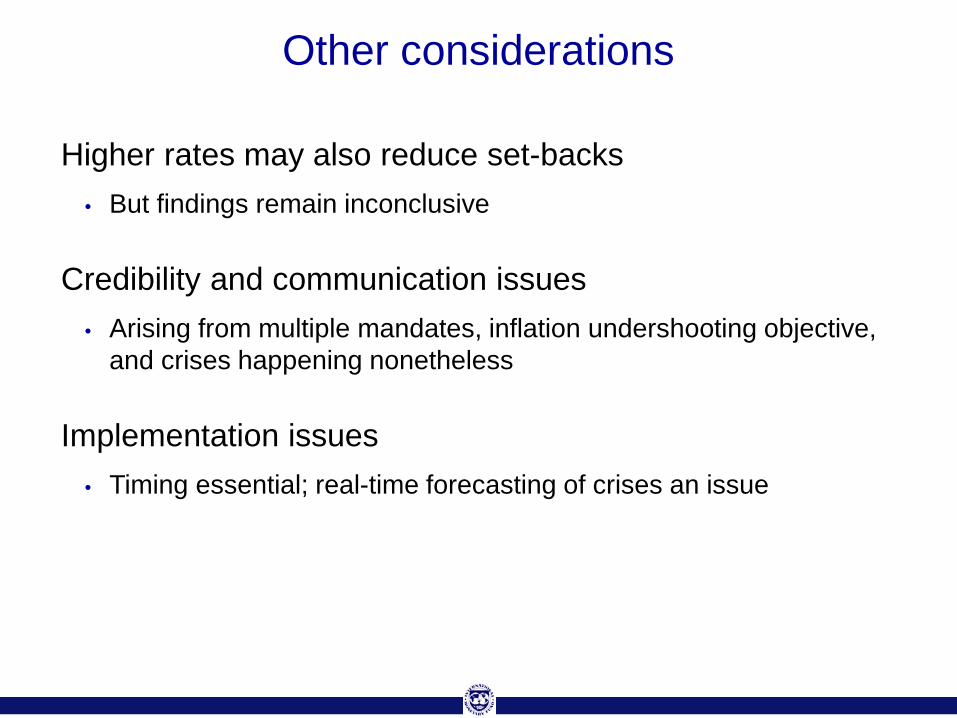
Higher rates may also reduce set-backs • But findings remain inconclusive
Credibility and communication issues • Arising from multiple mandates, inflation undershooting objective,
and crises happening nonetheless
Implementation issues • Timing essential; real-time forecasting of crises an issue
Other considerations
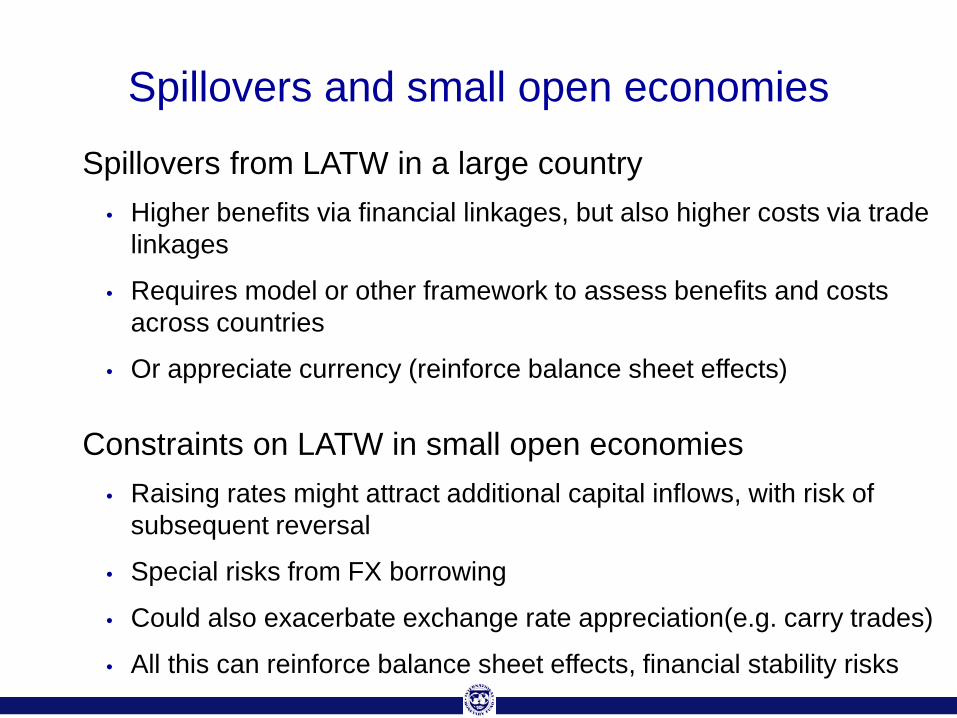
Spillovers and small open economies
Spillovers from LATW in a large country • Higher benefits via financial linkages, but also higher costs via trade
linkages
• Requires model or other framework to assess benefits and costs across countries
• Or appreciate currency (reinforce balance sheet effects)
Constraints on LATW in small open economies • Raising rates might attract additional capital inflows, with risk of
subsequent reversal
• Special risks from FX borrowing
• Could also exacerbate exchange rate appreciation(e.g. carry trades)
• All this can reinforce balance sheet effects, financial stability risks
Should monetary policy lean against the wind?
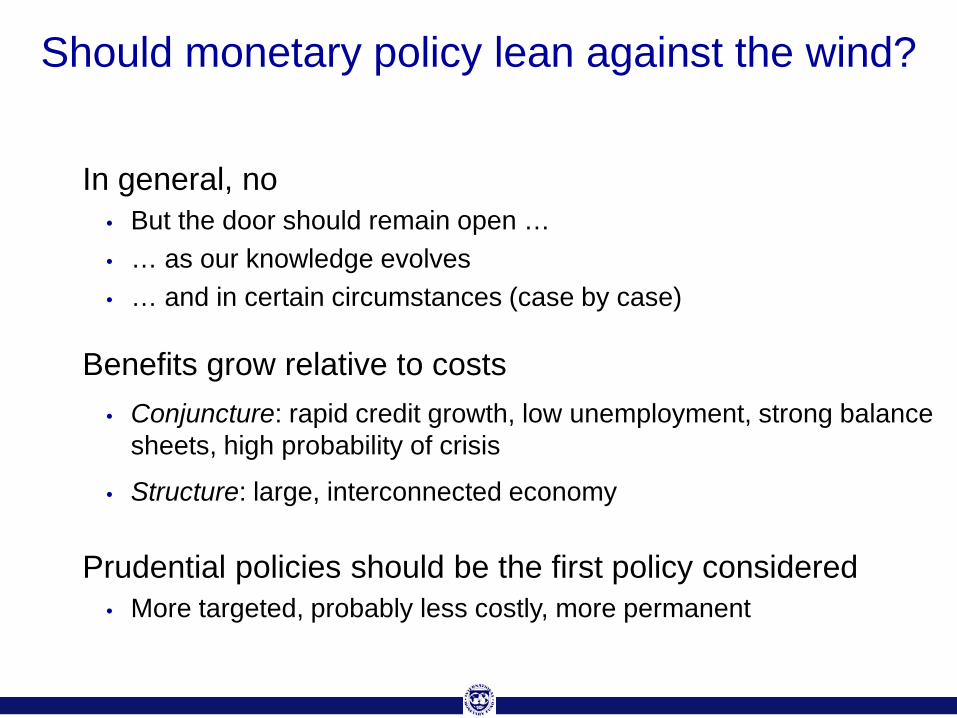
In general, no • But the door should remain open … • … as our knowledge evolves • … and in certain circumstances (case by case)
Benefits grow relative to costs • Conjuncture: rapid credit growth, low unemployment, strong balance
sheets, high probability of crisis
• Structure: large, interconnected economy
Prudential policies should be the first policy considered • More targeted, probably less costly, more permanent