Embed Size (px)
Citation preview
1
Money and Mental Wellbeing: A Longitudinal Study of Medium-Sized Lottery Wins
Forthcoming in the Journal of Health Economics
July 26, 2006
Jonathan Gardner and Andrew J. Oswald
Watson Wyatt Worldwide and University of Warwick, UK
Abstract
One of the famous questions in social science is whether money makes people happy. We offer new evidence by using longitudinal data on a random sample of Britons who receive medium-sized lottery wins of between £1000 and £120,000 (that is, up to approximately U.S. $200,000). When compared to two control groups -- one with no wins and the other with small wins -- these individuals go on eventually to exhibit significantly better psychological health. Two years after a lottery win, the average measured improvement in mental wellbeing is 1.4 GHQ points. JEL codes: D1, I3 Keywords: Psychological health; Happiness; GHQ; Income. Corresponding author: [email protected]. Addresses: Gardner: Watson Wyatt Worldwide, Watson House, London Road, Reigate, Surrey RH2 9PQ, UK. Oswald: Department of Economics, University of Warwick, Coventry CV4 7AL, UK. Telephone: 02476 523510
2
Money and Mental Wellbeing: A Longitudinal Study of Medium-Sized Lottery Wins
Jonathan Gardner Andrew J Oswald
1. Introduction
A large social-science literature now exists on the determinants of
happiness and mental health. As might be expected, this topic has attracted
the attention of medical statisticians, psychologists, economists, and other
investigators. However, one of the most fundamental research questions
remains imperfectly understood. For the average person, do greater material
riches bring about significantly greater mental wellbeing?
For discussions of this question, see, for example, Easterlin (1974),
Martin (1995), and Diener and Biswas-Diener (2002). Many surveys of the
field such as Myers (1992), Diener et al (1999), Argyle (2001), Nettle (2005a),
and Layard (2005) conclude that the connection between money and
happiness is slight or non-existent. A variant on this view is the interesting
proposition, put forward by Marmot (2004) and others, that people’s status
and autonomy are what matter, and it is these, rather than wealth or income
per se, that truly affect human beings. New work by Kahneman et al (2006)
raises further question-marks over the influence of income.
In cross-sections, we now know that, even after correcting for many
potentially confounding influences, there is a statistically well-determined link
between income and reported wellbeing. There is also some evidence from
panels. A large modern literature across many nations includes Blanchflower
and Oswald (2004), Di Tella et al (2001, 2003), Easterlin (2003), Frey and
Stutzer (2002), Graham (2005), Luttmer (2005), Winkelmann and
3
Winkelmann (1996), Oswald (1997, 2005), Shields and Wheatley Price
(2005), and Van Praag and Ferrer-I-Carbonell (2004). More recently,
attention has been paid to the idea that happiness may habituate to
influences like greater income. Hedonic adaptation is discussed in modern
research by, for example, Rayo and Becker (2004), Clark (1999), Clark et al
(2004), Lucas et al (2003, 2004), Di Tella et al (2005), Gilbert et al (1998),
Riis et al (2005), Frederick and Loewenstein (1999), Kahneman and Sugden
(2005), Oswald and Powdthavee (2005), Smith et al (2005), Stutzer (2004),
Ubel et al (2005), Wilson and Gilbert (2005), and Wu (2001).
The existing evidence on the link between income and mental
wellbeing remains open to criticism. Perhaps the most effective way to object
to the income-wellbeing correlation found in recent econometric work is to
argue that it is not causal. This is the idea -- see for example the cogent
arguments in Nettle 2005b -- that income movements and wellbeing
movements may merely be linked because of omitted variables (such as
seniority in the workplace). Such an objection is important. It is also difficult
to deal with decisively, because it is not possible to run giant experiments
where, in the name of science, different amounts of government-funded
research cash are randomly allocated to treatment and control groups.
Somehow, naturally occurring equivalent conditions must be studied.
This paper attempts to do so. It uses data on lottery winners to create
a setting as close as possible to the idealized laboratory experiment. In a
sense, we follow in a different way the same interests and testing strategy as
Sacerdote (1997), Imbens et al (2001), Holtz-Eakin et al (1993), Lindahl
(2005), and Walker (1998). The paper can be thought of as a longitudinal
4
equivalent to the oft-quoted cross-sectional work of Brickman et al (1978) on
a small sample of lottery winners. It differs from Ettner (1996), for instance,
by not using instrumental variables for income. Conceptually, our analysis
has elements in common with the work of Meer et al (2003) who use
inheritances to try to measure the effect of money on physical health and
Frijters et al (2004, 2005) who draw upon the natural experiment of German
reunification to assess the effects of income upon life-satisfaction and
satisfaction with health.
We assume a reported wellbeing function:
r = h(u(y, z, m, t)) + e (1)
where r is a measure of psychological health or self-reported wellbeing; u(….)
is to be thought of as the person’s true wellbeing or utility; h(.) is a non-
differentiable function relating actual to reported wellbeing; y is income or
wealth, to include lottery winnings; z is a set of demographic characteristics;
m is a set of personal characteristics such as marital status; t is the time
period; and e an error term. It is assumed that u(….) is a function that is
observable only to the individual. This general approach has links to the
experienced-utility idea discussed in, for instance, Kahneman et al (1997).
2. Data
The data used in this study come from consecutive waves of the British
Household Panel Survey (BHPS). BHPS is a nationally representative
sample of more than 5,000 British households, containing over 10,000 adult
individuals, conducted between September and Christmas of each year from
1991 (see Taylor et al, 2002). Respondents are interviewed in successive
waves; households who move to a new residence are interviewed at their new
5
location; if an individual splits off from the original household, all adult
members of their new household are also interviewed. Children are
interviewed once aged 16. The sample has remained broadly representative
of the British population since its inception.
The BHPS contains a standard mental wellbeing measure, a General
Health Questionnaire (GHQ) score. This is used internationally by medical
researchers and others as an indicator of psychological strain or stress.
Recent applications of GHQ include Cardozo et al (2000), Boheim and
Ermisch (2001), Propper et al (2005), Clark and Oswald (1994, 2002),
Ermisch and Francesconi (2000), Gardner and Oswald (2004, 2006),
Martikainen et al (2003), McKenzie et al (2004), O’Reilly and Stevenson
(2003), Pevalin and Ermisch (2004), Robinson et al (2004), Shields and
Wheatley Price (2005), and Weinberg and Creed (2000). A GHQ score is one
of the most commonly adopted questionnaire-based methods of measuring
psychological health. It amalgamates answers to the following list of twelve
questions:
Have you recently:
1. Been able to concentrate on whatever you are doing?
2. Lost much sleep over worry?
3. Felt that you are playing a useful part in things?
4. Felt capable of making decisions about things?
5. Felt constantly under strain?
6. Felt you could not overcome your difficulties?
7. Been able to enjoy your normal day-to-day activities?
8. Been able to face up to your problems?
6
9. Been feeling unhappy and depressed?
10. Been losing confidence in yourself?
11. Been thinking of yourself as a worthless person?
12. Been feeling reasonably happy all things considered?
Here we use the sum of the responses to these so-called GHQ-12
questions. As a measure of mental strain, the paper takes the simple
summation, coded so that people answer with respect to usual and the
response with the lowest wellbeing value scores 3 and that with the highest
wellbeing value scores 0. This approach has been used many times before
and is sometimes called a 36-point Likert scale. In general, medical opinion is
that healthy individuals will score typically around 10-13 on the test. Numbers
near 36 are rare and indicate depression in a clinical sense.
Although most windfalls are small, many people in the BHPS data have
a financial windfall of some kind. The data set records either a win on a
lottery or a win on the soccer pools. As half the British population play the
national lottery, this form of winning windfalls swamps all other forms, and for
simplicity we refer later merely to ‘lottery winners’.
We measure people’s GHQ score and their lottery winnings in each
year between 1996 and 2003. To adjust for inflation, all financial amounts are
deflated by the consumer price index and converted into 1998 pounds. At the
time of writing, one pound sterling £1 is approximately $1.75 United States
dollars.
To allow for lags, the wellbeing data are taken from 1998 to 2001.
Hence, we observe whether an individual has won on the lottery within this
three-year period, but use the longer time frame of mental stress scores (from
7
1996 to 2001) to capture changes in well-being from two-years before the win
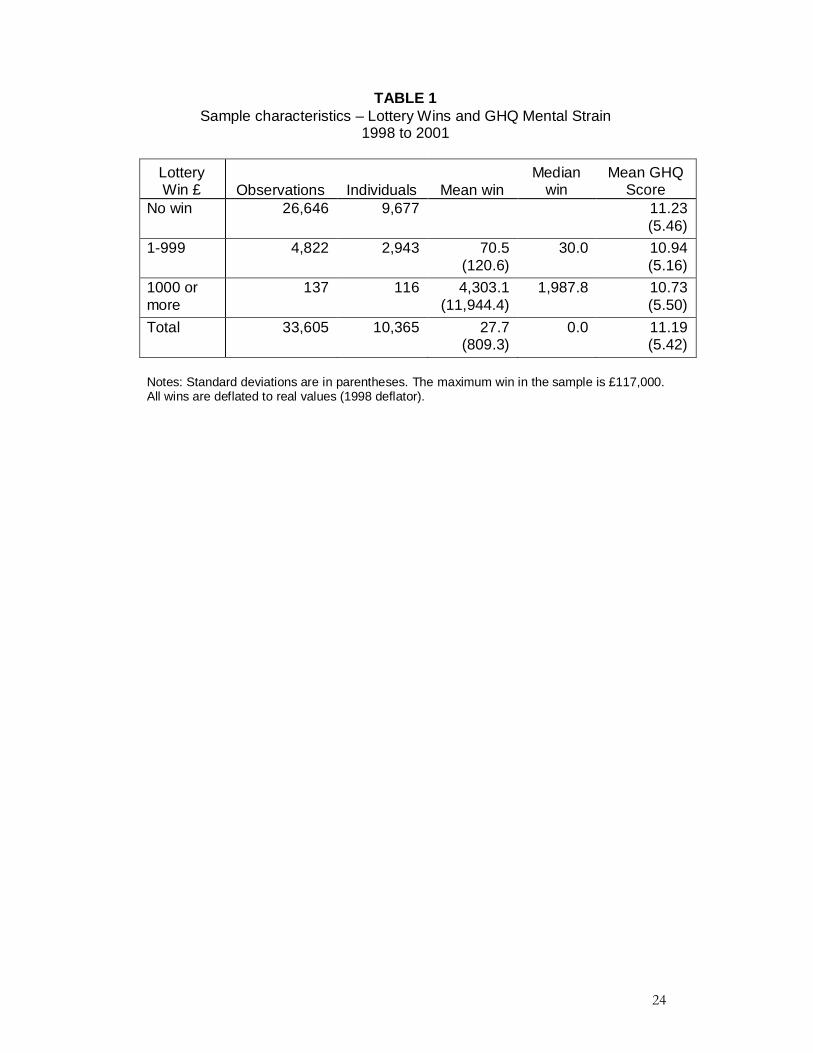
to two-years after. Table 1 reports means and standard deviations. Of the
33,605 person-years in the data, there are more than 26,000 observations
with no observed win. Small prizes of between one pound and 999 pounds
are common: there are 4,822 observations. Bigger wins, of over £1000, are
uncommon. There are 137. It is these on which the paper particularly
focuses. The other categories within Table 1 make a natural comparison:
they provide control groups of individuals who get no win and only small wins.
The latter category is particularly important, because, as in Imbens et al
(2001), it is not possible within our data set to know the number of times each
person plays the lottery. Hence we need to find a way to allow for a different
psychological makeup between people who never gamble and those who do.
Like Imbens et al, therefore, we assume the most persuasive control group is
the set of people in the data who report small wins.
Table 1 reveals that the mean win among those getting more than zero
but less than £999 is £70.5. The median is just £30. Among the group
receiving a windfall in excess of £1000, the mean win is approximately £4300,
and the median is just below £2000.
The mean value of GHQ mental stress, on its zero to 36 scale, is 11.19
in the entire data set. It is lower, at 10.73, among the medium-size winners.
This levels comparison, however, is perhaps not a natural one to
emphasise. To allow person fixed-effects to be differenced out, it is more
compelling to look at the changes -- the so-called deltas -- in individuals’ GHQ
scores. In this way, the issue becomes: does the GHQ mental strain score of
8
a particular person tend to fall after winning a prize in the lottery? It is the
deltas that contain the main information and on which we focus.
3. Results
The empirical approach begins by looking at movements in GHQ
scores before and after a lottery win. Later, regression equations are
estimated. Pragmatically, with 137 observations on what we describe as
medium-sized lottery wins, it is probably not sensible to put a large amount of
structure on the statistical testing. It is known, moreover, that there is some
natural fluctuation in GHQ scores (Hauck and Rice, 2004). While it would be
desirable to have more than 137 significant lottery wins, that is intrinsically
difficult in longitudinal random samples of a population.
What we attempt to look for, therefore, are persuasive simple patterns
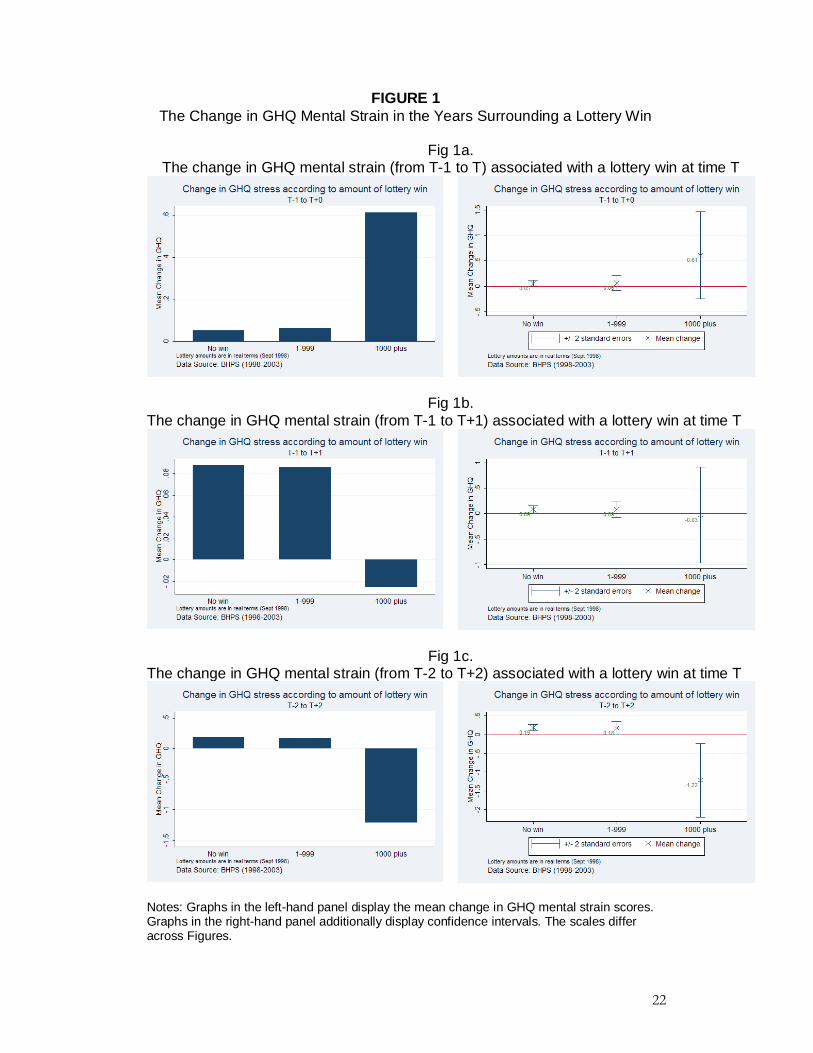
in the data. Figure 1 is divided into three sections. In Figure 1a, the changes
in GHQ are plotted for the year before, and of, the lottery win. It can be seen
that, on average, mental stress actually increases in the year of winning (the
data are collected after a reported win, and most people saying they have
won will have done so very recently). The rise in strain is about 0.5 GHQ
points more than for the two control groups, who, as can be seen in the first
two bars of Figure 1a, are similar to one another. This implies that, in these
data, there is no immediate burst of psychological wellbeing from a lottery
win. If anything, the reverse is true, although the standard errors on the
£1000+ column in Figure 1a are large. As far as we know, this finding is a
new one.
The second section, Figure 1b, charts the change in mental stress
between T-1 and T+1. These are the years immediately before and
9
immediately after the one in which the lottery prize is won. Again,
encouragingly for the statistical investigator, the columns make clear that
individuals who get no win are almost indistinguishable in their responses
from those with a small win, which is consistent with common sense.
Interestingly, people in the £1000+ category do appear, in Figure 1b, to
exhibit a rise in psychological wellbeing (that is, a fall in their GHQ mental
stress score). However, the size of this decline is tiny, and, as illustrated, the
standard-error bars are wide.
Figure 1c depicts the key finding of the paper. It compares wellbeing 2
years before the lottery win to 2 years afterwards. For those with no win,
mental strain rises slightly, by 0.19 GHQ points. This increase -- it might be
viewed as the background rise in stress in Great Britain -- is statistically
significantly greater than zero. For those with a small win, GHQ goes up
almost an identical amount, namely, by 0.18 points. Such a finding seems to
make sense: winning a tiny amount does not alter a person’s life.
However, the average change in mental stress is different among
those in Figure 1c who, at time T=0, get a windfall of £1000 or more. For
them, GHQ drops fairly markedly between T-2 and T+2. It does so by -1.22
points. As shown, the standard errors allow the null of zero to be rejected at
the 5% level, so the change is statistically significantly different from that for
the two comparison groups of individuals. To this 1.22, the figure of 0.18 or
0.19 should be added. People who get a medium-sized win therefore
eventually enjoy an improvement in mental health, relative to others, of
approximately 1.4 GHQ points. If we separate the sample into men and
10
women, a similar result is found for each of the sexes (not reported), although
men show a larger improvement.
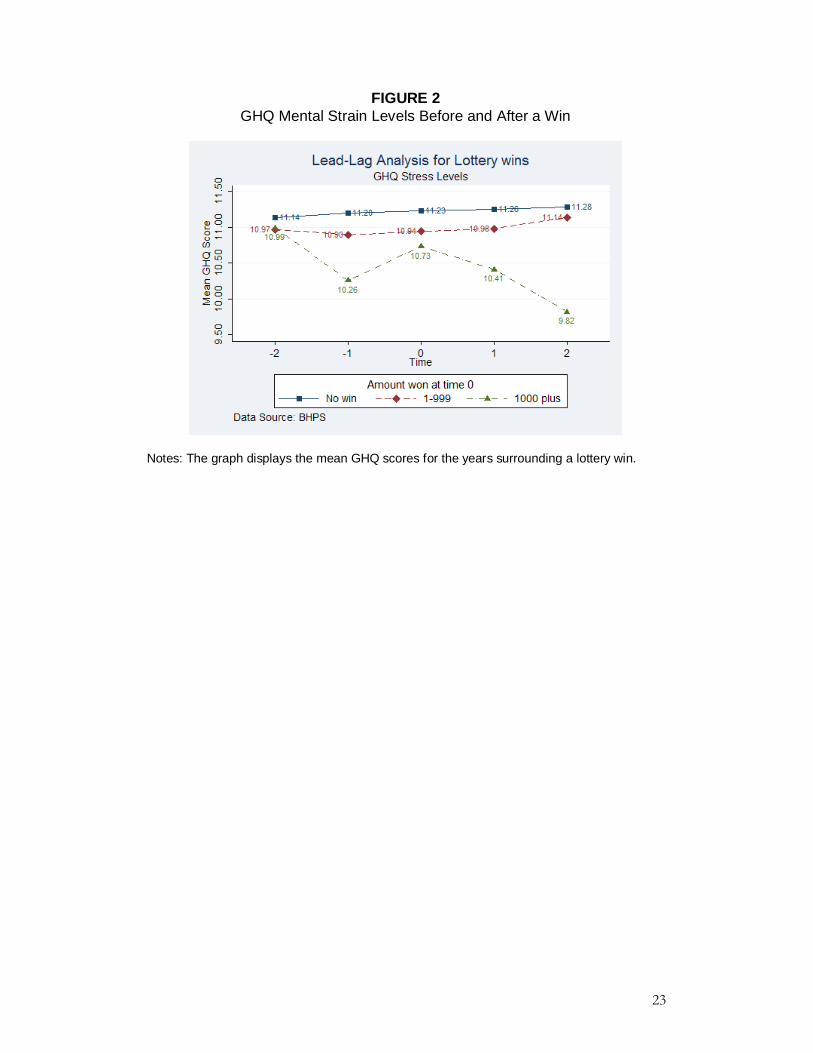
A further way to depict the main finding is illustrated in Figure 2. The
figure presents the average levels (as opposed to changes) of GHQ stress
scores in the years surrounding a lottery win. Here the GHQ levels of the
three groups of individuals diverge, by the time that period T+2 is reached,
very noticeably. (These results in Figure 2 are for the unbalanced panel,
where an individual may be present in one period but not the next. When we
instead restrict attention to the balanced sample -- where each period we
observe the same set of individuals -- results are substantially the same.)
Again this appears consistent with a causal link between windfalls and
wellbeing. Although it might be expected that the size of the medium-size win
would be correlated with the size of the alteration in wellbeing within the sub-
sample of 137 people themselves, it proved impossible, probably because of
the small sample size relative to the noise in GHQ scores, to find a
statistically significant relationship.
In sum, these data suggest that winning the lottery is associated with
improved mental wellbeing. Intriguingly, the effect apparently takes some
time to show through. The observed delay is surprising. One feasible
interpretation of the phenomenon is that winning (even medium-sized prizes
like these) can have a disruptive effect in time T. A second possibility, and a
less attractive one for the ideas in the paper, is that the phenomenon of
winning itself eventually makes people cheerier, by increasing their sense of
optimism. Nevertheless, a potentially more plausible explanation is that
11
spending the money is what matters and initially a windfall is saved. Clearly
much remains to be understood.
4. Robustness Checks
Is it possible that this pattern is an artefact or fluke of the data set and
therefore not one of cause-and-effect? In principle, it is. Figure 2, for
instance, reveals some inherent volatility, and the drop in GHQ in T-1 among
the winners is a potential concern.
As a check, various inquiries were done.
First, an examination of Figure 2 shows that the GHQ levels of all three
groups are similar in the initial year, T-2. This fact seems reassuring. It
suggests that the nature of the people under study -- non-winners, small
winners, large winners -- is not profoundly different.
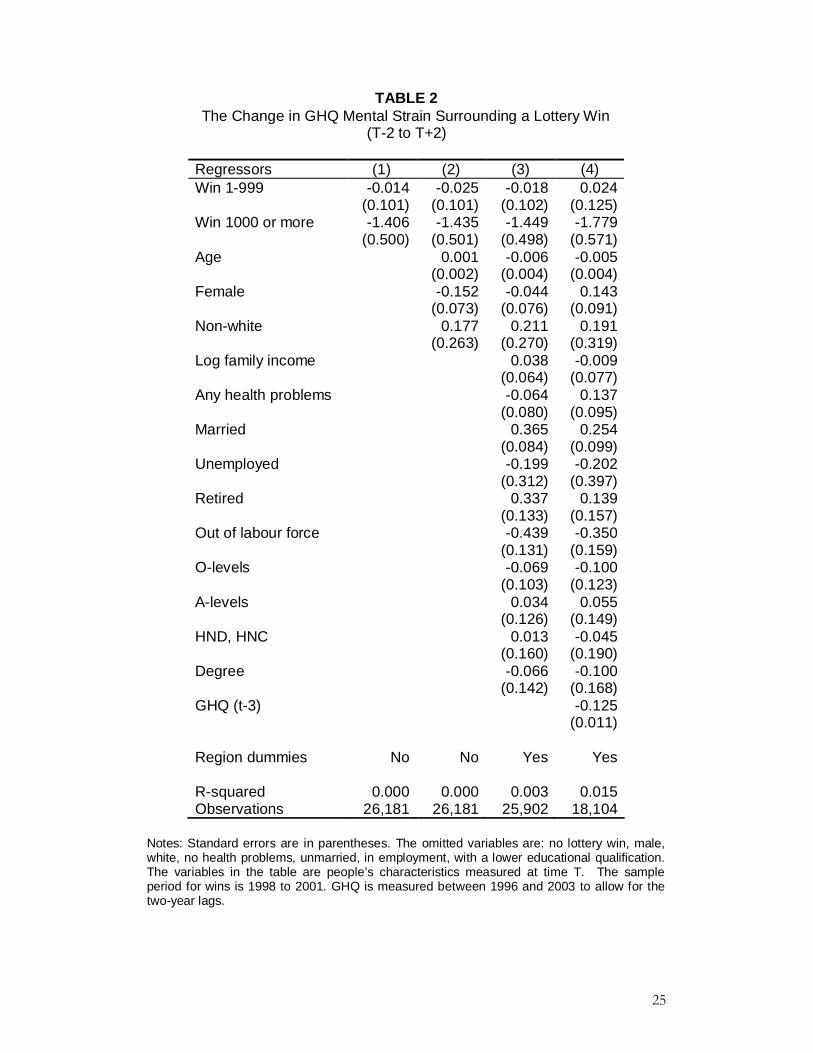
Second, some regression-equation checks are given. Table 2 lays out
a number of Delta GHQ equations. These equations take as the dependent
variable the measured change in the GHQ stress level over the period T-2 to
T+2. Column 1 of the table thus re-does the previous chart in a more formal
way. Column 2 of Table 2 includes controls for age, gender, and race. The
female dummy is negative and statistically significantly different from zero.
The others, however, are not. Importantly, the coefficient on the Win £1000+
dummy variable is left unchanged by the addition of these demographic
controls, which suggests that the pattern in the paper is not simply because of
elementary omitted characteristics. The low R-squared values are a
noticeable reminder of the noise in GHQ values.
Column 3 extends the list of independent variables: it incorporates
income, health, marital status, job status, education level, and region
12
dummies. Once again, the effect of winning the lottery is unaltered. The
coefficient is now -1.449 with a well-determined t-statistic.
Finally, Column 4 of Table 2 includes an extra variable for the person’s
mental stress score in T-3. This controls for potential habituation or mean-
reversion in wellbeing levels; when individuals initially have high wellbeing
(low GHQ stress scores) we might expect them, either substantively or for
reasons of measurement error, to report a decline in wellbeing (increase in
strain) towards some baseline, and vice versa. In column 4 of Table 2, the
estimated improvement in mental wellbeing after a medium-size lottery win is
slightly larger at approximately 1.8 GHQ points. If people who initially show
greater mental strain are more likely to gamble on the lottery, then mean-
reversion could conceivably account for the increase in wellbeing that we
observe for lottery winners. However, whilst we do see some evidence of
mean-reversion in GHQ mental strain scores, it apparently contributes little to
an explanation of the estimated windfall effect. Here in column 4 of Table 2
there is a slight alteration in the size of the coefficient on Win £1000+, but the
standard error remains around one third of the coefficient estimate. These
explorations suggest that the correlation between winning and change-in-
GHQ is robust.
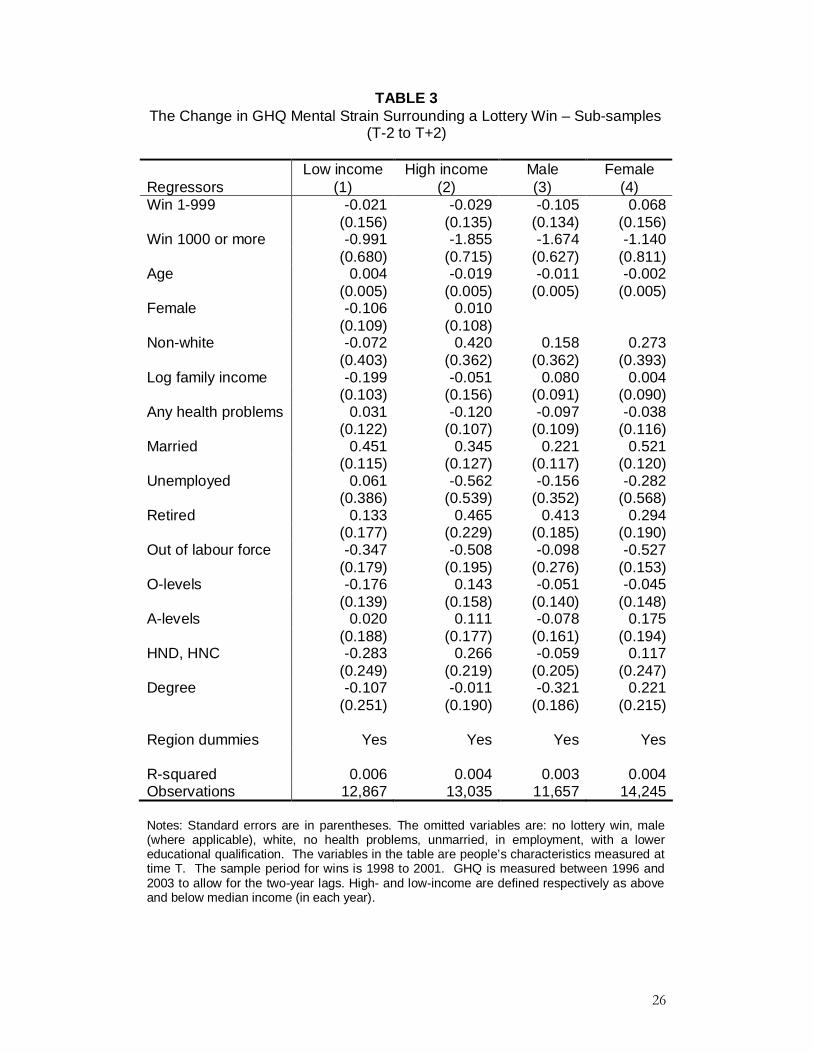
Third, are low-income individuals perhaps more affected by a lottery
prize, and are there any important gender differences in response to a win?
Table 3 takes up these issues. It estimates four delta-GHQ equations. The
first split of the sample is into two income categories. Interestingly, and
perhaps surprisingly, the drop in GHQ is more marked, and statistically better
determined, in the high-income households. In Table 3 the coefficients on
13
Win £1000+ are at first, in columns 1 and 2, respectively -0.991 and -1.855.
However, it not possible to reject the null of equality of these two numbers.
Columns 3 and 4 divide individuals into men and women. In this case, the
key coefficients are -1.674 and -1.140. Only the first of these, for the male
sub-sample, is significantly different from zero. Nevertheless, the finding
seems of value. If the paper’s observation of a fall in GHQ after a win were
the chance result of a small data set, we would not expect to see it in
separate sub-samples for males and females. Perhaps the appropriate
message from Table 3 -- when it is borne in mind that the numbers of
medium-size lottery winners do not allow detailed disaggregation -- is that the
size of the Win £1000+ effect appears to be reasonably robust across sub-
samples.
Fourth, data on the life satisfaction levels of individuals were examined,
and the above calculations were re-done. The life-satisfaction question was
not asked in the survey in the 2001, so as a result we were missing around a
quarter of our sample of lottery wins. Most of the paper’s patterns, however,
carried through (for instance, those winning £1000+ had the largest rise in life
satisfaction), although the satisfaction data were too noisy, given the effective
sample size, to permit particularly well-defined results.
Lastly, because the data set does not provide a measure of how often
people play the lottery, there remains one possibility that should be
considered. It is that, for some unobservable reason, individuals who gain
psychologically after we observe them winning a medium-sized lottery prize
both play the lottery far more than those who gain only small wins (and thus
win more money) and would for some unknown independent reason have
14
improved mentally without the windfall of cash. In other words, there remains
the potential that the correlation we observe is not truly causal.
Like most arguments that rest on assumed unobservabilities, this is a
difficult possibility to avoid beyond doubt. Nevertheless, on the balance of the
evidence, it is arguably unpersuasive and a causal interpretation seems the
more appropriate one. Entering within a delta-GHQ regression equation a
range of observable controls (which might be expected to be correlated with
unobservables) leaves -- see Tables 2 and 3 -- the paper’s key coefficient
almost unchanged. Moreover, medium-size lottery winners begin with the
same T-2 mental-health scores as other people in the data set, and thus do
not appear to be fundamentally different from small-winners in some subtle
psychological way.
5. Conclusions
A famous research question in social science is whether increases in
income make people happier (and if so by how much). The key difficulty in
testing is a practical one. It is how to find a quasi-experimental setting where
some individuals are randomly assigned substantial sums of money while
others in a control group are not.
The paper tackles this by studying longitudinal data on a statistically
representative sample of Britons who receive medium-sized lottery wins. In
our data, these are wins of between £1,000 and approximately £120,000 in
1998 pounds sterling. We have 137 winners of this type. The effective
sample is therefore fairly small, so it is sensible to be cautious in
interpretation.
15
When compared to two control groups -- one with no wins and the
other with small wins -- the paper demonstrates that these medium-size
winners go on to have significantly better psychological health. After two
years, their mental wellbeing compared to before the lottery win has improved
by approximately 1.4 GHQ points on a 36-point scale, with a standard error of
approximately 0.5. The standard deviation of the GHQ scores in the whole
sample is approximately 5, but that is probably not a useful way to think about
the within-person variation over time. To provide a better feel for the size of
the units, in Clark and Oswald (2002) and Gardner and Oswald (2006) it is
argued that the worst thing observable in standard data sets is -- perhaps as
might be expected -- the impact effect of being widowed. That rare and
traumatic event is associated with a worsening in people’s mental wellbeing
of, on average, approximately 5 GHQ points. Such a calculation suggests
that 1.4 points, the estimated consequence of a medium-sized lottery win for
mental health, is economically significant and not merely statistically
significant.
Checks on separate sub-samples of men and women, and high-
income and low-income people, provide in each case broadly supportive
evidence for the existence of a positive effect of windfalls upon mental
wellbeing. Such corroboration, even on necessarily small sub-samples,
seems encouraging. The explanation for the time delay in the wellbeing effect
is unclear. It may be that actual spending is what matters and windfalls are
initially saved, but this can be only a conjecture.
The paper’s main result -- that a windfall is followed eventually by a
significant improvement in mental health -- contrasts with standard
16
interpretations of the work of Brickman et al (1978). An advantage of the
present study is that we follow the same individuals through time and do not
have to rely on cross-section comparisons. Our paper is unable to examine
adaptation to money over a long period. That possibility remains an important
one to be explored by future research.

17
Acknowledgements
We thank the editor and referees, and also Andrew Clark, Dan Gilbert, Carol Graham, Alois Stutzer and Ian Walker. The Economic and Social Research Council (ESRC) provided research support. The usual disclaimer applies. In particular, the views in this paper are not those of Watson Wyatt. The British Household Panel Survey data were made available through the UK Data Archive. The data were originally collected by the ESRC Research Centre on Micro-social Change at the University of Essex, now incorporated within the Institute for Social and Economic Research. Both the original collectors of the data and the Archive bear no responsibility for the analysis presented here. This paper replaces the earlier calculations of Gardner and Oswald (2001). It used also data on inheritances and produced broadly similar findings. Because inheritances conflate a windfall with death of a family member, we decided to omit the inheritance calculations.
18
References Argyle M. The psychology of happiness. Routledge: London, Second edition;
2001. Blanchflower DG, Oswald AJ. Wellbeing over time in Britain and the USA.
Journal of Public Economics 2004; 88; 1359-1386. Böheim R, Ermisch J. Partnership dissolution in the UK - the role of economic
circumstances. Oxford Bulletin of Economics and Statistics 2001; 63; 197-208.
Brickman P, Coates D, Janoff-Bulman R. Lottery winners and accident victims – is happiness relative? Journal of Personality and Social Psychology 1978; 36; 917-927.
Cardozo BL, Vergara A, Agani R, Gotway CA. Mental health, social functioning, and attitudes of Kosovar Albanians following the war in Kosovo. Journal of the American Medical Association 2000; 284; 569-577.
Clark AE. Are wages habit-forming? Evidence from micro data. Journal of Economic Behavior and Organization 1999; 39; 179-200.
Clark AE, Diener E, Georgellis Y, Lucas RE. Lags and leads in life satisfaction: A test of the baseline hypothesis. DELTA Paris: working paper; 2004.
Clark AE, Oswald AJ. Unhappiness and unemployment. Economic Journal 1994; 104; 648-659.
Clark AE, Oswald AJ. A simple statistical method for measuring how life events affect happiness. International Journal of Epidemiology 2002; 31; 1139-1144.
Diener E, Suh EM, Lucas RE, Smith HL. Subjective wellbeing: Three decades of progress. Psychological Bulletin 1999; 125(2); 276-302.
Diener E, Biswas-Diener R. Will money increase subjective wellbeing? Social Indicators Research 2002; 57; 119-169.
Di Tella R, MacCulloch RJ, Oswald AJ. Preferences over inflation and unemployment: Evidence from surveys of happiness. American Economic Review 2001; 91; 335-341.
Di Tella R, MacCulloch RJ, Oswald AJ. The macroeconomics of happiness. Review of Economics and Statistics 2003; 85; 809-827.
Di Tella R, Haisken J, Macculloch RJ. Happiness adaptation to income and to status in an individual panel, working paper, Harvard Business School; 2005.
Easterlin RA. Does economic growth improve the human lot? Some empirical evidence. In: David PA, Reder MW (Eds.), Nations and households in economic growth: Essays in honor of Moses Abramowitz. Academic Press: New York; 1974. p. 89-125.
Easterlin RA. Explaining happiness. Proceedings of the National Academy of Sciences 2003; 100; 11176-11183.
Ermisch J, Francesconi M. Cohabitation in Great Britain: Not for long, but here to stay. Journal of the Royal Statistical Society (Series A) 2000; 163; 153-171.
Ettner SL. New evidence on the relationship between income and health. Journal of Health Economics 1996; 15; 67-85.
19
Frederick S, Loewenstein G. Hedonic adaptation. In: E. Diener, N. Schwarz and D. Kahneman (Eds.) Hedonic psychology: Scientific approaches to enjoyment, suffering, and wellbeing. Russell Sage Foundation: New York; 1999; p. 302-329.
Frey BS, Stutzer A. Happiness and economics. Princeton University Press: Princeton; 2002.
Frijters P, Haisken-DeNew JP, Shields MA. Money does matter! Evidence from increasing real income and life satisfaction in East Germany following reunification. American Economic Review 2004; 94; 730-740.
Frijters P, Haisken-DeNew JP, Shields MA. The causal effect of income on health: Evidence from German reunification. Journal of Health Economics 2005; 24; 997-1017.
Gardner J, Oswald A. Does money buy happiness? A longitudinal study using data on windfalls. University of Warwick: working paper; 2001.
Gardner J, Oswald, A. How is mortality affected by money, marriage and stress? Journal of Health Economics 2004; 23; 1181-1207.
Gardner J, Oswald AJ. Do divorcing couples become happier by breaking up? Journal of the Royal Statistical Society (Series A) 2006; 169; 319-336.
Gilbert D T, Pinel EC, Wilson TD, Blumberg SJ, Wheatley T. Immune neglect: A source of durability bias in affective forecasting. Journal of Personality and Social Psychology 1998; 75; 617-638.
Graham C. Insights on development from the economics of happiness. World Bank Research Observer 2005; 20; 201-231.
Hauck K, Rice N. A longitudinal analysis of mental health mobility in Britain. Health Economics 2004; 13; 981-1001.
Holtz-Eakin D, Joulfaian D, Rosen H. The Carnegie conjecture: Some empirical evidence. Quarterly Journal of Economics 1993; 108; 413-435.
Imbens GW, Rubin DB, Sacerdote BI. Estimating the effect of unearned income on labor earnings, savings, and consumption: Evidence from a survey of lottery players. American Economic Review 2001; 91; 778-794.
Kahneman D, Wakker PP, Sarin R. Back to Bentham? Explorations of experienced utility. Quarterly Journal of Economics 1997; 112; 375-406.
Kahneman D, Sugden R. Experienced utility as a standard of policy evaluation. Environmental and Resource Economics 2005; 32; 161-181.
Kahneman D, Krueger AB, Schkade D, Schwarz N, Stone AA. Would you be happier if you were richer? A focusing illusion. Science 2006; 312; 1908-1910.
Layard R. Happiness: Lessons from a new science. Allen Lane: London; 2005
Lindahl M. Estimating the effect of income on health and mortality using lottery prizes as an exogenous source of variation in income. Journal of Human Resources 2005; 40; 144-168.
Lucas RE, Clark A E, Georgellis Y, Diener E. Re-examining adaptation and the setpoint model of happiness: Reactions to changes in marital status. Journal of Personality and Social Psychology 2003; 84; 527-539.
Lucas RE, Clark AE, Georgellis Y, Diener E. Unemployment alters the set point for life satisfaction. Psychological Science 2004; 15 (1); 8-13.
Luttmer E. Neighbors as negatives: Relative earnings and wellbeing. Quarterly Journal of Economics 2005; 120; 963-1003.
Marmot M. Status syndrome. London: Bloomsbury; 2004.
20
Martikainen P, Adda J, Ferrie JE, Smith GD, Marmot M. Effects of income and wealth on GHQ depression and poor self rate health in white collar women and men in the Whitehall II study. Journal of Epidemiology and Community Health 2003; 57; 718-723.
Martin A. Can money buy happiness? Science 1995; 268; 1113-1114. McKenzie DP, Ikin JF, McFarlane AC, Creamer M, Forbes, AB, Kelsall HL,
Glass DC, Ittak P, Sim MR. Psychological health of Australian veterans of the 1991 Gulf War: An assessment using the SF-12, GHQ-12 and PCL-S. Psychological Medicine 2004; 34; 1419-1430.
Meer J, Miller DL, Rosen HS. Exploring the health-wealth nexus. Journal of Health Economics 2003; 22; 713-730.
Myers DM. The pursuit of happiness. Morrow: New York; 1992. Nettle D. Happiness: The science behind your smile. Oxford University Press:
Oxford; 2005a. Nettle D. Social gradients in subjective wellbeing: Is it money or person
control that matters? Department of Psychology, Brain and Behaviour, University of Newcastle: working paper; 2005b.
O’Reilly D, Stevenson M. Mental health in Northern Ireland: Have the Troubles made it worse? Journal of Epidemiology and Community Health 2003; 57; 488-492.
Oswald AJ. Happiness and economic performance. Economic Journal 1997; 107; 1815-1831.
Oswald AJ. On the common claim that happiness equations demonstrate diminishing marginal utility of income. IZA Discussion paper 1781, and University of Warwick working paper; 2005.
Oswald AJ, Powdthavee N. Does happiness adapt? A longitudinal study of disability with implications for economists and judges, University of Warwick: working paper; 2005.
Pevalin DJ, Ermisch J. Cohabiting unions, repartnering and mental health. Psychological Medicine 2004; 34(8); 1553-1559.
Propper C, Jones K, Bolster A, Burgess S, Johnston R, Sarker R. Local neighbourhood and mental health: Evidence from the UK. Social Science and Medicine 2005; 61; 2065-2083.
Rayo L, Becker G. Evolutionary efficiency and happiness. University of Chicago: working paper; 2004.
Riis J, Loewenstein G, Baron J, Jepson C. Ignorance of hedonic adaptation to hemodialysis: A study using ecological momentary assessment. Journal of Experimental Psychology: General 2005; 134 (1); 3-9.
Robinson KL, McBeth J, MacFarlane GJ. Psychological distress and premature mortality in the general population: A prospective study. Annals of Epidemiology 2004; 14; 467-472.
Sacerdote B. The lottery winner survey, crime and social interactions, and why is there more crime in cities? Harvard University: PhD thesis; 1997.
Shields MA, Wheatley Price S. Exploring the economic and social determinants of psychological wellbeing and perceived social support in England. Journal of the Royal Statistical Society (Series A) 2005; 168; 513-537.
Smith DM, Langa KM, Kabeto MU, Ubel PA. Health, wealth and happiness. Psychological Science 2005; 16; 663-666.
21
Stutzer A. The role of income aspirations in individual happiness. Journal of Economic Behavior and Organization 2004; 54; 89-109.
Taylor M F, Brice J, Buck N, Prentice-Lane E. British Household Panel Survey User Manual. University of Essex: Colchester; 2002.
Ubel PA, Loewenstein G, Jepson C. Disability and sunshine: Can hedonic predictions be improved by drawing attention to focusing illusions or emotional adaptation? Journal of Experimental Psychology: Appl 2005; 11; 111-123.
Van Praag B, Ferrer-I-Carbonell A. Happiness quantified: A satisfaction calculus approach. Oxford University Press: Oxford; 2004.
Walker I. Lotteries: Determinants of ticket sales and optimal payout rate. Economic Policy 1998; 27; 358-399.
Weinberg A, Creed F. Stress and psychiatric disorder in healthcare professionals and hospital staff. Lancet 2000; 355; 533-537.
Wilson TD, Gilbert DT. A model of affective adaptation. University of Virginia: working paper; 2005.
Winkelmann L, Winkelmann R. Why are the unemployed so unhappy? Economica 1996; 65; 1-15.
Wu S. Adapting to heart conditions: A test of the hedonic treadmill. Journal of Health Economics 2001; 20; 495-508.
22
FIGURE 1 The Change in GHQ Mental Strain in the Years Surrounding a Lottery Win
Fig 1a.
The change in GHQ mental strain (from T-1 to T) associated with a lottery win at time T
Fig 1b. The change in GHQ mental strain (from T-1 to T+1) associated with a lottery win at time T
Fig 1c. The change in GHQ mental strain (from T-2 to T+2) associated with a lottery win at time T
Notes: Graphs in the left-hand panel display the mean change in GHQ mental strain scores. Graphs in the right-hand panel additionally display confidence intervals. The scales differ across Figures.
23
FIGURE 2 GHQ Mental Strain Levels Before and After a Win
Notes: The graph displays the mean GHQ scores for the years surrounding a lottery win.
24
TABLE 1 Sample characteristics – Lottery Wins and GHQ Mental Strain
1998 to 2001
Lottery Win £ Observations Individuals Mean win
Median win
Mean GHQ Score
No win 26,646
9,677 11.23 (5.46)
1-999 4,822
2,943 70.5 (120.6)
30.0 10.94 (5.16)
1000 or more
137
116 4,303.1 (11,944.4)
1,987.8 10.73 (5.50)
Total 33,605 10,365 27.7 (809.3)
0.0 11.19 (5.42)
Notes: Standard deviations are in parentheses. The maximum win in the sample is £117,000. All wins are deflated to real values (1998 deflator).
25
TABLE 2 The Change in GHQ Mental Strain Surrounding a Lottery Win
(T-2 to T+2)
Regressors (1) (2) (3) (4) Win 1-999 -0.014 -0.025 -0.018 0.024 (0.101) (0.101) (0.102) (0.125) Win 1000 or more -1.406 -1.435 -1.449 -1.779 (0.500) (0.501) (0.498) (0.571) Age 0.001 -0.006 -0.005 (0.002) (0.004) (0.004) Female -0.152 -0.044 0.143 (0.073) (0.076) (0.091) Non-white 0.177 0.211 0.191 (0.263) (0.270) (0.319) Log family income 0.038 -0.009 (0.064) (0.077) Any health problems -0.064 0.137 (0.080) (0.095) Married 0.365 0.254 (0.084) (0.099) Unemployed -0.199 -0.202 (0.312) (0.397) Retired 0.337 0.139 (0.133) (0.157) Out of labour force -0.439 -0.350 (0.131) (0.159) O-levels -0.069 -0.100 (0.103) (0.123) A-levels 0.034 0.055 (0.126) (0.149) HND, HNC 0.013 -0.045 (0.160) (0.190) Degree -0.066 -0.100 (0.142) (0.168) GHQ (t-3) -0.125 (0.011) Region dummies No No Yes Yes R-squared 0.000 0.000 0.003 0.015 Observations 26,181 26,181 25,902 18,104
Notes: Standard errors are in parentheses. The omitted variables are: no lottery win, male, white, no health problems, unmarried, in employment, with a lower educational qualification. The variables in the table are people’s characteristics measured at time T. The sample period for wins is 1998 to 2001. GHQ is measured between 1996 and 2003 to allow for the two-year lags.
26
TABLE 3 The Change in GHQ Mental Strain Surrounding a Lottery Win – Sub-samples
(T-2 to T+2) Low income High income Male Female Regressors (1) (2) (3) (4) Win 1-999 -0.021 -0.029 -0.105 0.068 (0.156) (0.135) (0.134) (0.156) Win 1000 or more -0.991 -1.855 -1.674 -1.140 (0.680) (0.715) (0.627) (0.811) Age 0.004 -0.019 -0.011 -0.002 (0.005) (0.005) (0.005) (0.005) Female -0.106 0.010 (0.109) (0.108) Non-white -0.072 0.420 0.158 0.273 (0.403) (0.362) (0.362) (0.393) Log family income -0.199 -0.051 0.080 0.004 (0.103) (0.156) (0.091) (0.090) Any health problems 0.031 -0.120 -0.097 -0.038 (0.122) (0.107) (0.109) (0.116) Married 0.451 0.345 0.221 0.521 (0.115) (0.127) (0.117) (0.120) Unemployed 0.061 -0.562 -0.156 -0.282 (0.386) (0.539) (0.352) (0.568) Retired 0.133 0.465 0.413 0.294 (0.177) (0.229) (0.185) (0.190) Out of labour force -0.347 -0.508 -0.098 -0.527 (0.179) (0.195) (0.276) (0.153) O-levels -0.176 0.143 -0.051 -0.045 (0.139) (0.158) (0.140) (0.148) A-levels 0.020 0.111 -0.078 0.175 (0.188) (0.177) (0.161) (0.194) HND, HNC -0.283 0.266 -0.059 0.117 (0.249) (0.219) (0.205) (0.247) Degree -0.107 -0.011 -0.321 0.221 (0.251) (0.190) (0.186) (0.215) Region dummies Yes Yes Yes Yes R-squared 0.006 0.004 0.003 0.004 Observations 12,867 13,035 11,657 14,245 Notes: Standard errors are in parentheses. The omitted variables are: no lottery win, male (where applicable), white, no health problems, unmarried, in employment, with a lower educational qualification. The variables in the table are people’s characteristics measured at time T. The sample period for wins is 1998 to 2001. GHQ is measured between 1996 and 2003 to allow for the two-year lags. High- and low-income are defined respectively as above and below median income (in each year).