Embed Size (px)
Citation preview
Mongolia: Power Sector Development and South Gobi Development Draft Report September 2008 Submitted to the World Bank by: Economic Consulting Associates
Economic Consulting Associates Limited
41 Lonsdale Road, London NW6 6RA, UK tel: +44 20 7604 4545, fax: +44 20 7604 4547 email: [email protected]
D:\ECA\A1FILES\Projects\279 - Mongolia Infrastructure\Docs\Draft Report\Mongolia S Gobi~Draft Report~v3.doc 29/10/08
Contents
Mongolia: Power Sector Development and South Gobi Development, Draft Report
i
Contents
Contents i
Abbreviations and Acronyms iv
Executive Summary vi
1 Introduction 1
2 The Mongolian power sector 2
2.1 Central Energy System 2
2.2 South Gobi region 5
3 Demand forecasts 6
3.1 CES electricity demand 6
3.2 South Gobi electricity demand 8
3.3 CES heat demand 10
3.4 Summary of demand forecasts 11
4 Generation expansion options 14
4.1 Thermal power plant #5 14
4.2 Tavan Tolgoi thermal power plant 15
4.3 Oyu Tolgoi thermal power plant 16
4.4 Shivee Ovoo thermal power plant 16
4.5 Baganuur IGCC 17
4.6 Newcom wind farm 18
4.7 Egiin hydro power plant 19
4.8 Orkhon hydro power plant 20
4.9 Tuul Songino pumped storage plant 20
4.10 Increased Russian imports 20
4.11 Summary of generation expansion options 21
Economic Consulting Associates, October 2008
D:\ECA\A1FILES\Projects\279 - Mongolia Infrastructure\Docs\Draft Report\Mongolia S Gobi~Draft Report~v3.doc 29/10/08
Contents
Mongolia: Power Sector Development and South Gobi Development, Draft Report Economic Consulting Associates, October 2008
ii
5 Least-cost analysis 23
5.1 Scenarios 23
5.2 Common assumptions 23
5.2.1 Committed generation projects 23
5.2.2 Retirements 24
5.2.3 Reserve margin and capacity investment 25
5.2.4 Costs of existing and committed plants 25
5.2.5 CES – South Gobi interconnection 26
5.3 Candidate plant costs 26
5.3.1 TPP#5 26
5.3.2 Tavan Tolgoi TPP 27
5.3.3 Oyu Tolgoi TPP 28
5.4 Dispatch 29
5.5 Alternative expansion plans 32
5.6 Least-cost analysis 35
5.7 Delay risks and costs 37
5.8 Other factors 38
5.9 Recommended least-cost expansion plan 39
6 Investment needs and tariff impacts 40
6.1 Investment needs 40
6.2 Tariff impacts 41
A1 List of meetings 43
Tables and Figures
Tables Table 1 CES basic statistics 3
Contents
Mongolia: Power Sector Development and South Gobi Development, Draft Report Economic Consulting Associates, October 2008
iii
Table 2 CES existing power plants 4
Table 3 Electricity demand growth forecasts for CES 6
Table 4 NDC demand forecast for South Gobi 8
Table 5 Forecast electricity demand from major South Gobi customers 9
Table 6 Heat demand growth forecasts for Ulaanbaatar 11
Table 7 Demand (net supply) forecasts 13
Table 8 Summary of generation expansion options 22
Table 9 Costs of existing and committed plants 25
Table 11 Candidate power plants 31
Table 12 Present value of generation costs (coal price of US$20/t) 35
Table 13 Present value of generation costs (coal price of US$0/t) 36
Table 12 Present value of generation costs with delays (coal price of US$20/t) 38
Figures Figure 1 CES electricity tariffs, 2000-2007 7
Figure 2 Peak demand forecast, 2007-20 12
Figure 3 Generation expansion plan - Scenario 1 (TPP#5 and Tavan Tolgoi TPP) 32
Figure 4 Generation expansion plan - Scenario 2 (Tavan Tolgoi TPP) 33
Figure 5 Generation expansion plan - Scenario 3 (Oyu Tolgoi TPP) 34
Figure 6 Investment requirements 40
Figure 8 Projected average tariffs 42
Abbreviations and Acronyms
Mongolia: Power Sector Development and South Gobi Development, Draft Report Economic Consulting Associates, October 2008
iv
Abbreviations and Acronyms BOT Build-Operate-Transfer
BT Build-Transfer
BSEDN Baganuur and South-Eastern Regional Electricity Distribution Network Company
CES Central Energy System
CHP Combined Heat and Power
CRETG Central Regional Electricity Transmission Grid Company
CTL Coal to Liquids
DDHN Darkhan District Heating Network Company
DSEDN Darkhan-Selenge Electricity Distribution Network Company
EBEDN Erdenet-Bulgan Electricity Distribution Network Company
ECA Economic Consulting Associates
EPRC Economic Policy Reform and Competitiveness Project (USAID-funded)
ERA Energy Regulatory Authority
Gcal Gigacalories (1 million kcal)
GWh Gigawatt hours (1 million kWh)
HOB Heat Only Boiler
HP High Pressure
HPP Hydro Power Plant
IGCC Integrated Gasification Combined Cycle
LP Low Pressure
MIP Municipal Infrastructure Project (World Bank-funded)
MIPS Mongolian Integrated Power System
MME Ministry of Mines and Energy
MOFE Ministry of Fuel and Energy (now MME)
Mt Million tonnes
Mtpa Million tonnes per annum
MWh Megawatt hours (1 thousand kWh)
NDC National Dispatching Center Company
PPA Power Purchase Agreement
PSP Pumped Storage Project
RMB Chinese Renminbi (Yuan)
Tg Mongolian Togrig
tpd Tonnes per day
TPP Thermal Power Plant
Abbreviations and Acronyms
Mongolia: Power Sector Development and South Gobi Development, Draft Report Economic Consulting Associates, October 2008
v
UBDHDN Ulaanbaatar District Heating Distribution Network Company
UBEDN Ulaaanbaatar Electricity Distribution Network Company
US$ United States Dollar
The following exchange rates have been used in this report:
US$ 1 = Tg 1,150
US$ 1 = RMB 6.85
Executive Summary
Mongolia: Power Sector Development and South Gobi Development, Draft Report Economic Consulting Associates, October 2008
vi
Executive Summary
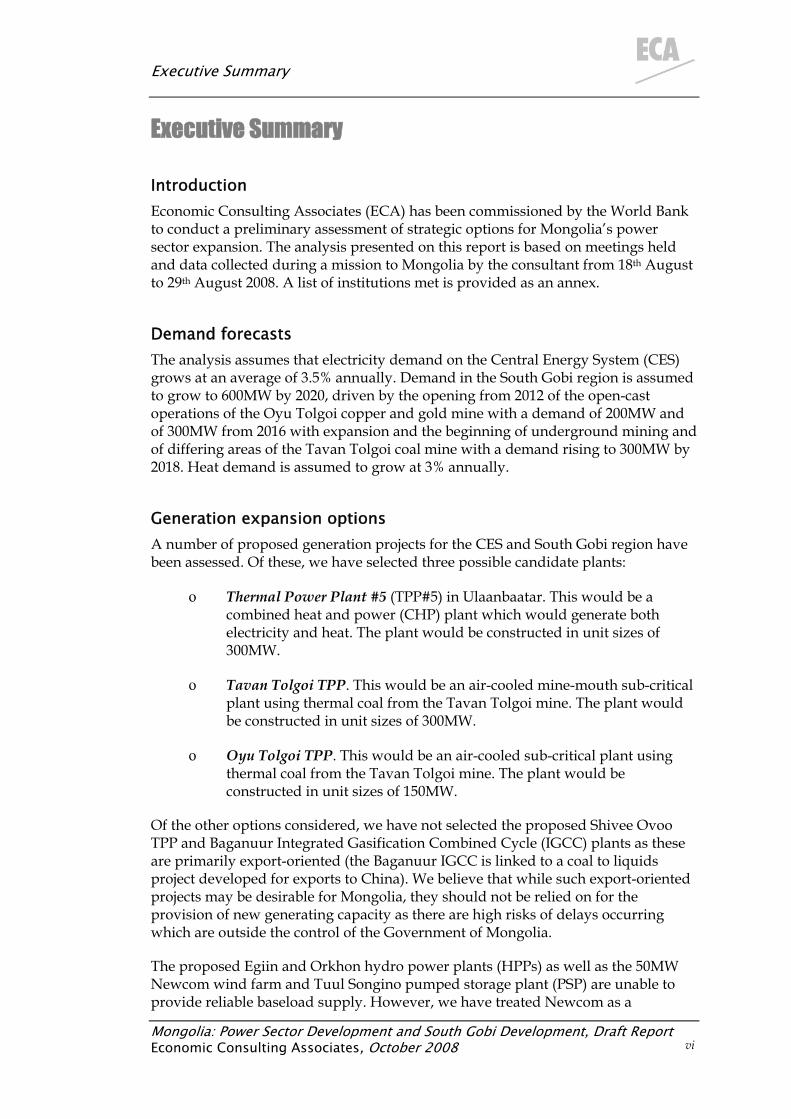
Introduction Economic Consulting Associates (ECA) has been commissioned by the World Bank to conduct a preliminary assessment of strategic options for Mongolia’s power sector expansion. The analysis presented on this report is based on meetings held and data collected during a mission to Mongolia by the consultant from 18th August to 29th August 2008. A list of institutions met is provided as an annex.
Demand forecasts The analysis assumes that electricity demand on the Central Energy System (CES) grows at an average of 3.5% annually. Demand in the South Gobi region is assumed to grow to 600MW by 2020, driven by the opening from 2012 of the open-cast operations of the Oyu Tolgoi copper and gold mine with a demand of 200MW and of 300MW from 2016 with expansion and the beginning of underground mining and of differing areas of the Tavan Tolgoi coal mine with a demand rising to 300MW by 2018. Heat demand is assumed to grow at 3% annually.
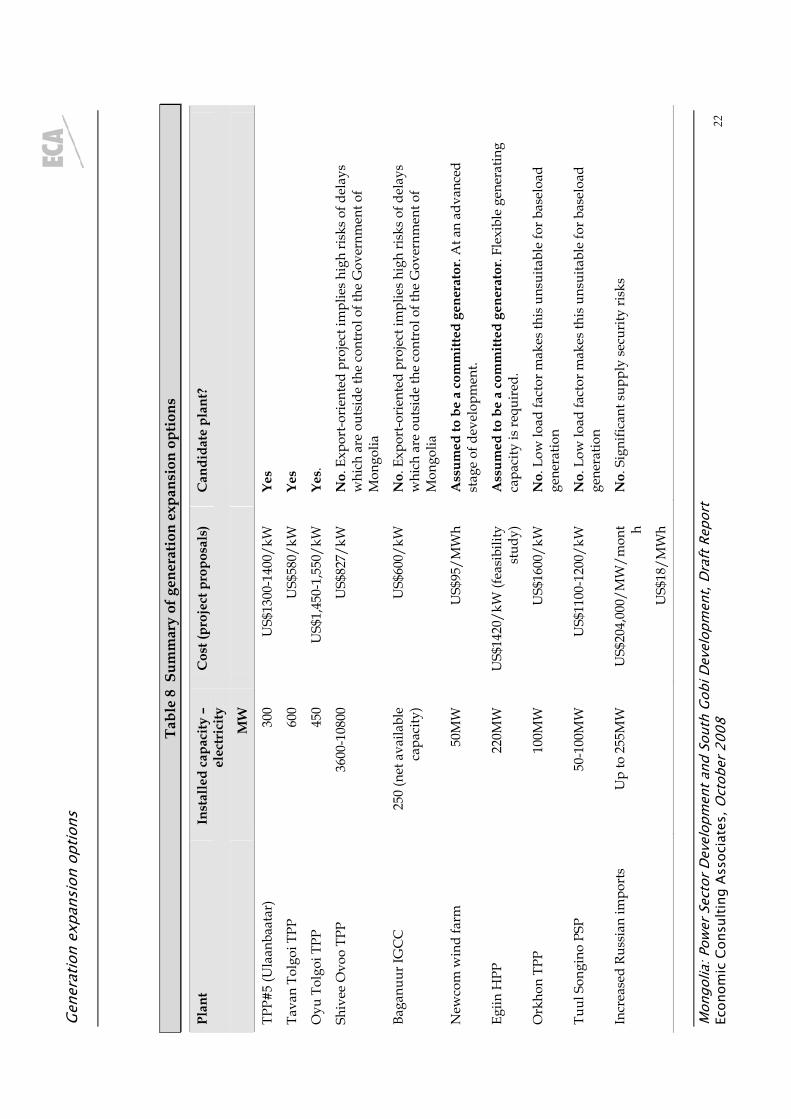
Generation expansion options A number of proposed generation projects for the CES and South Gobi region have been assessed. Of these, we have selected three possible candidate plants:
ο Thermal Power Plant #5 (TPP#5) in Ulaanbaatar. This would be a combined heat and power (CHP) plant which would generate both electricity and heat. The plant would be constructed in unit sizes of 300MW.
ο Tavan Tolgoi TPP. This would be an air-cooled mine-mouth sub-critical plant using thermal coal from the Tavan Tolgoi mine. The plant would be constructed in unit sizes of 300MW.
ο Oyu Tolgoi TPP. This would be an air-cooled sub-critical plant using thermal coal from the Tavan Tolgoi mine. The plant would be constructed in unit sizes of 150MW.
Of the other options considered, we have not selected the proposed Shivee Ovoo TPP and Baganuur Integrated Gasification Combined Cycle (IGCC) plants as these are primarily export-oriented (the Baganuur IGCC is linked to a coal to liquids project developed for exports to China). We believe that while such export-oriented projects may be desirable for Mongolia, they should not be relied on for the provision of new generating capacity as there are high risks of delays occurring which are outside the control of the Government of Mongolia.
The proposed Egiin and Orkhon hydro power plants (HPPs) as well as the 50MW Newcom wind farm and Tuul Songino pumped storage plant (PSP) are unable to provide reliable baseload supply. However, we have treated Newcom as a
Executive Summary
Mongolia: Power Sector Development and South Gobi Development, Draft Report Economic Consulting Associates, October 2008
vii
committed project given its advanced nature and thus included it in the project generation expansion plan. Given the need of the CES for flexible capacity, we have included the 220MW Egiin HPP as a committed project.
The option of increased imports from Russia has been considered but rejected as a long-term supply option on the grounds of the risks to future security of supply.
Least-cost analysis We have compared the present value of generation costs (at a 10% discount rate) for the CES and South Gobi region under three scenarios:
ο Scenario 1: the simultaneous development from 2012 of TPP#5 in Ulaanbaatar and Tavan Tolgoi TPP. Under this scenario, Oyu Tolgoi TPP is not developed.
ο Scenario 2: the development of Tavan Tolgoi TPP from 2012 followed by that of TPP#5. Under this scenario, Oyu Tolgoi TPP is not developed.
ο Scenario 3: the development of Oyu Tolgoi TPP from 2012 followed by that of TPP#5 and then Tavan Tolgoi TPP.
Our comparisons take account of the potential for transfers of energy between the CES and South Gobi region over the planned inter-connector running from Ulaanbaatar to Mandalgovi and Tavan Tolgoi. A reliable interconnector capacity of 150MW has been assumed.
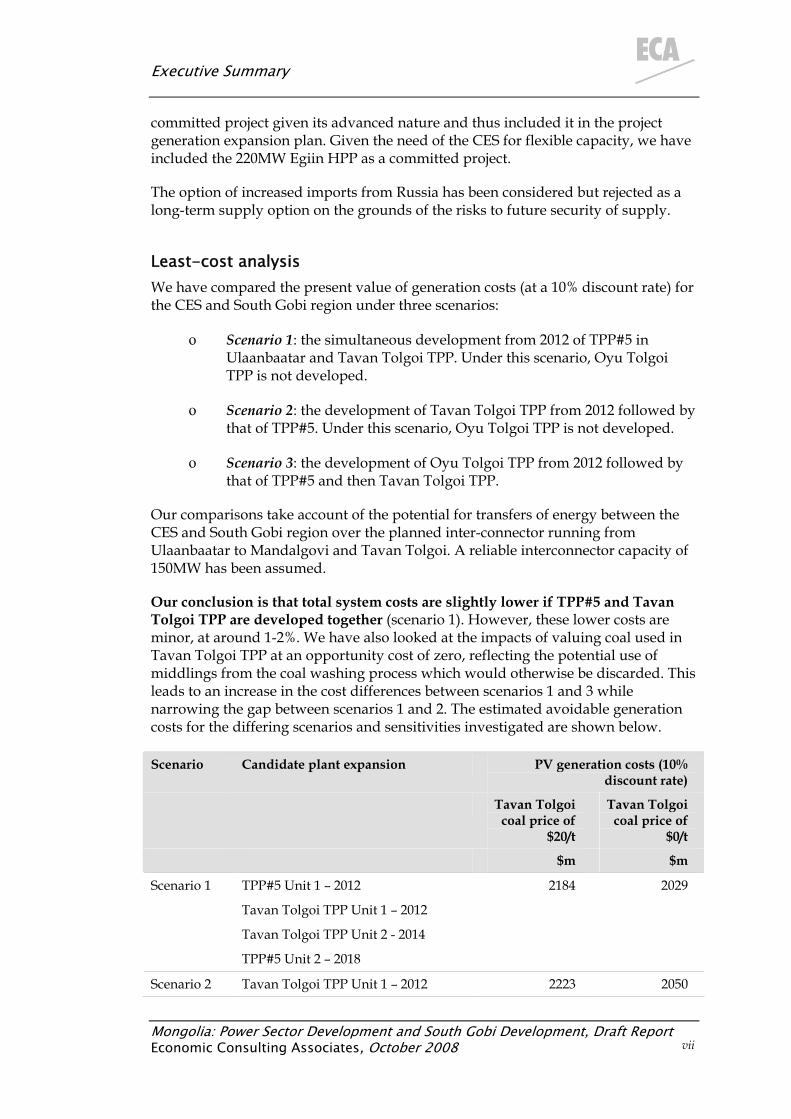
Our conclusion is that total system costs are slightly lower if TPP#5 and Tavan Tolgoi TPP are developed together (scenario 1). However, these lower costs are minor, at around 1-2%. We have also looked at the impacts of valuing coal used in Tavan Tolgoi TPP at an opportunity cost of zero, reflecting the potential use of middlings from the coal washing process which would otherwise be discarded. This leads to an increase in the cost differences between scenarios 1 and 3 while narrowing the gap between scenarios 1 and 2. The estimated avoidable generation costs for the differing scenarios and sensitivities investigated are shown below.
Scenario Candidate plant expansion PV generation costs (10% discount rate)
Tavan Tolgoi coal price of
$20/t
Tavan Tolgoi coal price of
$0/t
$m $m
Scenario 1 TPP#5 Unit 1 – 2012
Tavan Tolgoi TPP Unit 1 – 2012
Tavan Tolgoi TPP Unit 2 - 2014
TPP#5 Unit 2 – 2018
2184 2029
Scenario 2 Tavan Tolgoi TPP Unit 1 – 2012 2223 2050
Executive Summary
Mongolia: Power Sector Development and South Gobi Development, Draft Report Economic Consulting Associates, October 2008
viii
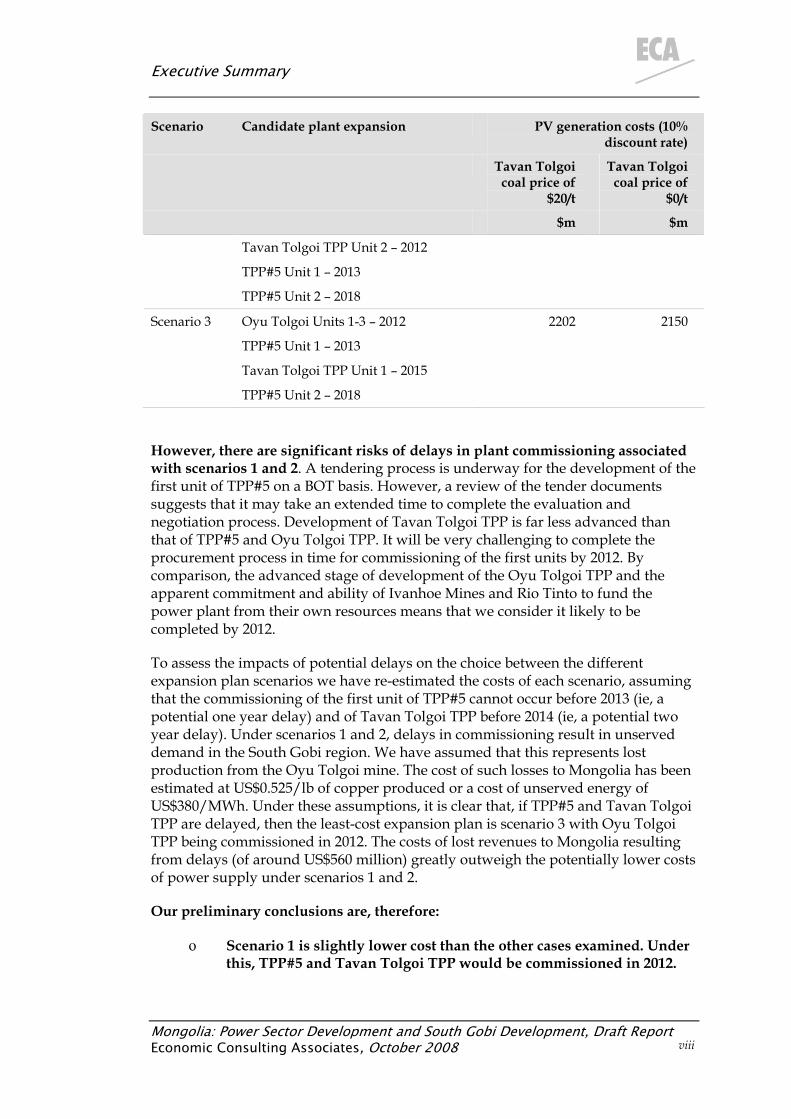
Scenario Candidate plant expansion PV generation costs (10% discount rate)
Tavan Tolgoi coal price of
$20/t
Tavan Tolgoi coal price of
$0/t
$m $m
Tavan Tolgoi TPP Unit 2 – 2012
TPP#5 Unit 1 – 2013
TPP#5 Unit 2 – 2018
Scenario 3 Oyu Tolgoi Units 1-3 – 2012
TPP#5 Unit 1 – 2013
Tavan Tolgoi TPP Unit 1 – 2015
TPP#5 Unit 2 – 2018
2202 2150
However, there are significant risks of delays in plant commissioning associated with scenarios 1 and 2. A tendering process is underway for the development of the first unit of TPP#5 on a BOT basis. However, a review of the tender documents suggests that it may take an extended time to complete the evaluation and negotiation process. Development of Tavan Tolgoi TPP is far less advanced than that of TPP#5 and Oyu Tolgoi TPP. It will be very challenging to complete the procurement process in time for commissioning of the first units by 2012. By comparison, the advanced stage of development of the Oyu Tolgoi TPP and the apparent commitment and ability of Ivanhoe Mines and Rio Tinto to fund the power plant from their own resources means that we consider it likely to be completed by 2012.
To assess the impacts of potential delays on the choice between the different expansion plan scenarios we have re-estimated the costs of each scenario, assuming that the commissioning of the first unit of TPP#5 cannot occur before 2013 (ie, a potential one year delay) and of Tavan Tolgoi TPP before 2014 (ie, a potential two year delay). Under scenarios 1 and 2, delays in commissioning result in unserved demand in the South Gobi region. We have assumed that this represents lost production from the Oyu Tolgoi mine. The cost of such losses to Mongolia has been estimated at US$0.525/lb of copper produced or a cost of unserved energy of US$380/MWh. Under these assumptions, it is clear that, if TPP#5 and Tavan Tolgoi TPP are delayed, then the least-cost expansion plan is scenario 3 with Oyu Tolgoi TPP being commissioned in 2012. The costs of lost revenues to Mongolia resulting from delays (of around US$560 million) greatly outweigh the potentially lower costs of power supply under scenarios 1 and 2.
Our preliminary conclusions are, therefore:
ο Scenario 1 is slightly lower cost than the other cases examined. Under this, TPP#5 and Tavan Tolgoi TPP would be commissioned in 2012.
Executive Summary
Mongolia: Power Sector Development and South Gobi Development, Draft Report Economic Consulting Associates, October 2008
ix
However, if the commissioning of either TPP#5 or Tavan Tolgoi TPP is delayed beyond 2012, then it would be lower-cost (allowing for the costs of unserved energy) to adopt scenario 3, with Oyu Tolgoi TPP being commissioned in 2012 followed by TPP#5 and then Tavan Tolgoi TPP.
The speed with which TPP#5 and Tavan Tolgoi TPP can be developed is, therefore, critical to the expansion plan to be adopted.
Investment needs and financing Under Scenario 1, Approximately US$550million annually is required in investment between 2009 and 2011, reflecting the scale of capacity additions in 2012 and 2013 as well as the completion of the CES to South Gobi interconnector. From 2012 to 2017, annual investments of around US$180 million are required. Under Scenario 3, investment between 2009 and 2011 is slightly lower at US$500 million annually and between 2012 and 2017 higher at US$240 million annually—reflecting the later entry of some power plants in the latter scenario.These investment costs will be financed over a number of years. The CES to South Gobi region interconnector is being tendered on a Build-Transfer (BT) basis. TPP#5 is being tendered on a BOT basis and we expect that Tavan Tolgoi TPP would be developed on a similar basis. Oyu Tolgoi TPP is assumed to be financed by the mine owners and does not have a direct investment cost for customers, although there may be a need for the public system to purchase a part of its output to meet electricity demand.
Large increases from current tariff levels would be required—of around 30%. It should be noted that these projections are likely to understate the necessary increases, as they do not take account of transmission investments other than the interconnector to the South Gobi region, do not include any distribution investments and assume current regulated tariffs are fully cost-reflective.
Under Scenario 1, financial close for TPP#5 and Tavan Tolgoi TPP will need to be achieved by early-2009, assuming a three-year build time in each case. This is a short time given our expectations of the challenges that will be faced in selecting a preferred bidder and negotiating the contractual package for TPP#5 and the limited state of development of Tavan Tolgoi TPP.
Introduction
Mongolia: Power Sector Development and South Gobi Development, Draft Report Economic Consulting Associates, October 2008 1
1 Introduction Economic Consulting Associates (ECA) has been commissioned by the World Bank to conduct a preliminary assessment of strategic options for Mongolia’s power sector expansion.
The analysis presented on this report is based on meetings held and data collected during a mission to Mongolia by the consultant from 18th August to 29th August 2008. A list of institutions met is provided as an annex. We would like to thank all those who made time available to meet with us.
This report is structured as follows:
ο Section 2 provides an overview of the Mongolian power sector.
ο Section 3 provides electricity and heat demand forecasts, which are subsequently used in the least-cost expansion analysis.
ο Section 4 describes the various generation expansion options currently proposed and selects the most viable candidate plants based on an assessment of their relative risks.
ο Section 5 assesses two alternative scenarios for the future development of the power sector and provides a simple least-cost analysis of these.
The Mongolian power sector
Mongolia: Power Sector Development and South Gobi Development, Draft Report Economic Consulting Associates, October 2008 2
2 The Mongolian power sector This section provides an overview of the Mongolian power sector. The analysis presented in this report considers the least-cost supply options for the Central Energy System (CES) and South Gobi region and the description below accordingly focuses on these two areas.
2.1 Central Energy System
The Mongolian energy sector consists of three regional interconnected systems, the Central, Western and Eastern systems, as well as a number of isolated grids. Of these three, the CES is by far the largest representing 91% of installed electricity generating capacity and 96% of electricity supplied. The CES supplies electricity to the capital and largest urban centre, Ulaanbaatar, as well as the major industrial complexes at Erdenet, Baganuur and Darkhan. In Ulaanbaatar, Erdenet and Darkhan the CES also serves district heating networks and provides steam for industry. Electricity and heat is supplied by five combined heat and power (CHP) plants. There are also limited electricity imports from Russia. In the longer-term, the CES will be interconnected with the Western and Eastern Energy Systems under the Mongolian Integrated Power System (MIPS) programme.
The erstwhile Energy Authority was restructured in 2001 into independent generation, transmission and distribution companies, comprising the following:
ο Five generation companies, arranged around Thermal Power Plants (TPPs) #3, #4 and #5 in Ulaanbaatar, Darkhan TPP and Erdenet TPP.
ο Central Regional Electricity Transmission Grid Company (CRETG).
ο National Dispatching Center Company (NDC).
ο Ulaanbaatar Electricity Distribution Network Company (UBEDN).
ο Darkhan-Selenge Electricity Distribution Network Company (DSEDN).
ο Erdenet-Bulgan Electricity Distribution Network Company (EBEDN).
ο Baganuur and South-Eastern Regional Electricity Distribution Network Company (BSEEDN).
ο Ulaanbaatar District Heating Network Company (UBDHN).
ο Darkhan District Heating Network Company (DDHN)1.
CRETG operates a zero-balance account mechanism which functions as a ‘virtual’ single buyer. All sales by generators and purchase by distribution companies take
1 Heat distribution in Erdenet is undertaken by Erdenet TPP. Heat supply in Baganuur is undertaken by a separate company using heat-only boilers.
The Mongolian power sector
Mongolia: Power Sector Development and South Gobi Development, Draft Report Economic Consulting Associates, October 2008 3
place through this account. All money collected from customers by distribution companies is paid into this account and is then redistributed between energy sector enterprises according to pre-determined formulae, approved by the Energy Regulatory Authority (ERA). The risk of non-collection is, therefore, shared between generators and distribution companies. Revenue collections have greatly improved in recent years, rising from 76.5% in 2001 to 100% in 2007.
At present, generation, transmission, bulk supply, distribution and retail tariffs are all determined by ERA on a cost-of service basis. There are plans to introduce a competitive market in which generators would supply distribution companies under bilateral contracts with imbalances settled through a spot market mechanism.
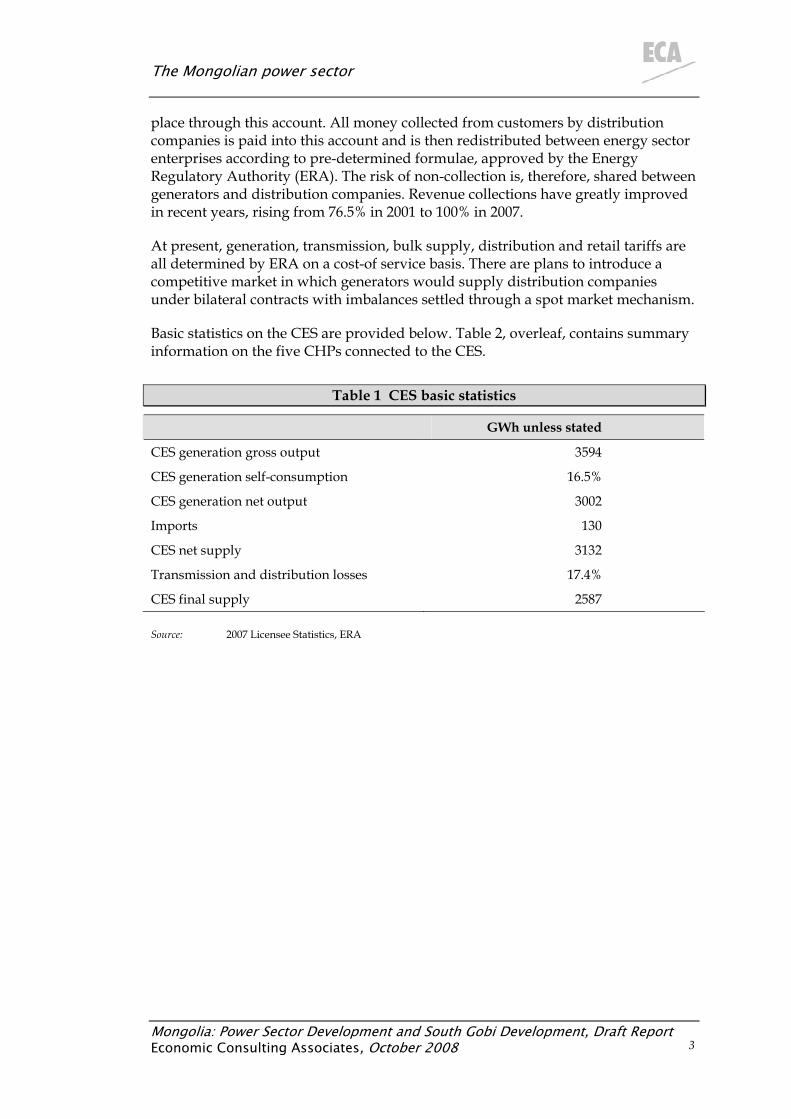
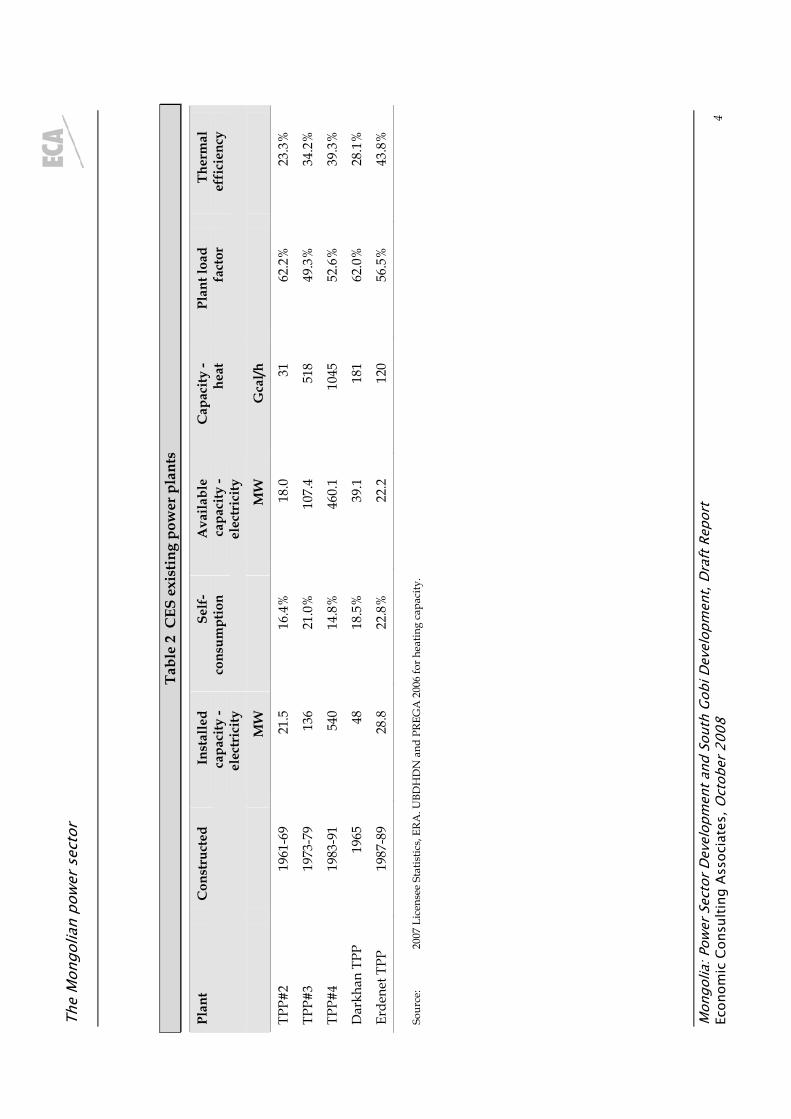
Basic statistics on the CES are provided below. Table 2, overleaf, contains summary information on the five CHPs connected to the CES.
Table 1 CES basic statistics
GWh unless stated
CES generation gross output 3594
CES generation self-consumption 16.5%
CES generation net output 3002
Imports 130
CES net supply 3132
Transmission and distribution losses 17.4%
CES final supply 2587
Source: 2007 Licensee Statistics, ERA
The
Mon
golia
n po
wer
sec
tor
Mon
golia
: Pow
er S
ecto
r Dev
elop
men
t and
Sou
th G
obi D
evel
opm
ent,
Draf
t Rep
ort
Econ
omic
Con
sulti
ng A
ssoc
iate
s, O
ctob
er 2
008
4
Tabl
e 2
CES
exi
stin
g po
wer
pla
nts
Plan
t C
onst
ruct
ed
Inst
alle
d ca
paci
ty -
elec
tric
ity
Self
-co
nsum
ptio
n A
vaila
ble
capa
city
- el
ectr
icity
Cap
acity
- he
at
Plan
t loa
d fa
ctor
Th
erm
al
effi
cien
cy
MW
MW
G
cal/h
TPP#
2 19
61-6
9 21
.5
16.4
%
18.0
31
62
.2%
23
.3%
TPP#
3 19
73-7
9 13
6 21
.0%
10
7.4
518
49.3
%
34.2
%
540
14.8
%
52.6
%
39.3
%
TPP
1965
39
.1
28.1
%
120
56.5
%
43.8
%
TPP#
4 19
83-9
1 46
0.1
1045
Dar
khan
48
18
.5%
18
1 62
.0%
Erde
net T
PP
1987
-89
28.8
22
.8%
22
.2
Sour
ce:
2007
Lic
ense
e St
atis
tics,
ERA
. UBD
HD
N a
nd P
REG
A 2
006
for h
eatin
g ca
paci
ty.
The Mongolian power sector
Mongolia: Power Sector Development and South Gobi Development, Draft Report Economic Consulting Associates, October 2008 5
2.2 South Gobi region
The South Gobi region is currently isolated from the CES. Demand in the region is expected to grow rapidly as a result of the various mining developments, notably the Oyu Tolgoi gold and copper mine being developed by Ivanhoe Mines, the Naryin Suhait and Ovoot Tolgoi coal mines and, of most significance for this report, the Tavan Tolgoi coal mine.
The estimated coal reserves in the Tavan Tolgoi deposit total 6.4 billion tonnes, comprising around 1.8 billion tonnes of coking coal and 4.6 billion tonnes of thermal coal2. The thermal coal reserves lie above the coking coal reserves and must, therefore, be removed to enable exploitation of the latter. There are limited current exports of around 2 Mtpa (total Mongolian exports are currently around 5 Mtpa). Ambitious plans exist for expansion. The 1995 master plan for the coal industry, prepared under JICA funding, envisaged annual production of 1.2 Mt of coking coal for export and 9.8 Mt of thermal coal. The latter would largely be used by a mine-mouth TPP with the generated electricity being exported. More recent plans suggest annual production of up to 80 Mt3.
Plans are well-developed for the interconnection of the South Gobi region to the CES. The Government recently concluded a bidding round for the construction of a 220kV double-circuit transmission line linking Mandalgobi, which is already connected to the CES, and Oyu Tolgoi. The line is due for completion in 2009. A second phase will link the Mandalgobi to Ulaanbaatar, strengthening the interconnection with the CES, and also extend the line to Tavan Tolgoi. This is expected to be constructed by 2012, when major mining operations are due to commence.
2 The heating value of the thermal coals is 5,100 to 5,500 kcal/kg (as received). Under the Japanese classification system, the lower end of this range falls into the sub-bituminous category. In some cases, the thermal coal is, therefore, described as sub-bituminous or lignite. (Study on Comprehensive Coal Development and Utilisation in Mongolia: Master Plan Final Report, Institute of Energy Economics Japan (November 1995). Report prepared for JICA). 3 Analysis of North-East Asia Energy Market: Coal Industry, Korea Energy Economics Institute (2007).
Demand forecasts
Mongolia: Power Sector Development and South Gobi Development, Draft Report Economic Consulting Associates, October 2008 6
3 Demand forecasts This section sets out our forecasts of electricity demand on the CES and in the South Gobi region. The demand forecasts for each are discussed separately.
3.1 CES electricity demand
We have reviewed three different demand forecasts for the CES:
ο The demand forecasts contained in the most recent energy sector master plan for Mongolia, prepared in 2000-02 by Electrowatt-Ekono4.
ο A supply and demand forecast prepared by NDC in 2006.
ο The demand forecast contained in the 2006 report on the strategic development of the energy sector, prepared by ECA5.
We understand that no more recent demand forecasts have been prepared.
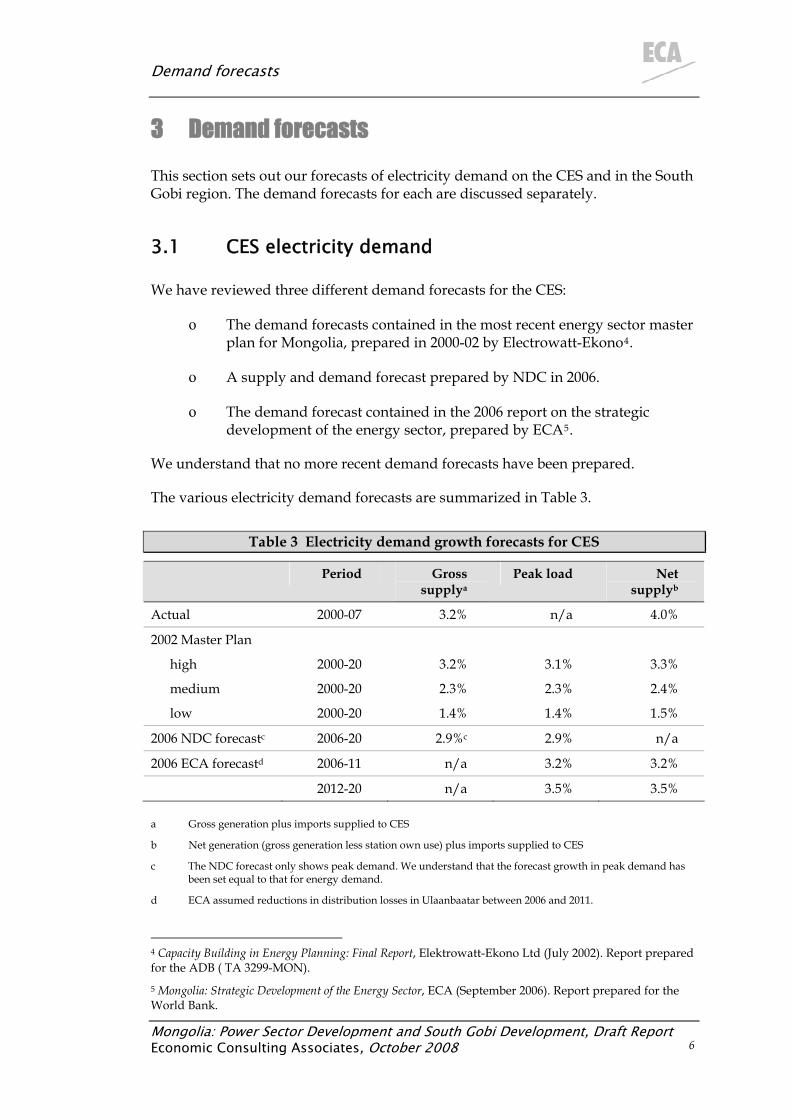
The various electricity demand forecasts are summarized in Table 3.
Table 3 Electricity demand growth forecasts for CES
Period Gross supplya
Peak load Net supplyb
Actual 2000-07 3.2% n/a 4.0%
2002 Master Plan
high 2000-20 3.2% 3.1% 3.3%
medium 2000-20 2.3% 2.3% 2.4%
low 2000-20 1.4% 1.4% 1.5%
2006 NDC forecastc 2006-20 2.9%c 2.9% n/a
2006 ECA forecastd 2006-11 n/a 3.2% 3.2%
2012-20 n/a 3.5% 3.5%
a Gross generation plus imports supplied to CES
b Net generation (gross generation less station own use) plus imports supplied to CES
c The NDC forecast only shows peak demand. We understand that the forecast growth in peak demand has been set equal to that for energy demand.
d ECA assumed reductions in distribution losses in Ulaanbaatar between 2006 and 2011.
4 Capacity Building in Energy Planning: Final Report, Elektrowatt-Ekono Ltd (July 2002). Report prepared for the ADB ( TA 3299-MON). 5 Mongolia: Strategic Development of the Energy Sector, ECA (September 2006). Report prepared for the World Bank.
Demand forecasts
As can be seen, net supply to the CES has grown more rapidly than in any of the demand forecasts and faster than gross supply. This latter result is due to the reduction in self-consumption by power stations, which has fallen from a CES average of 22% in 2000 to 16.5% in 2007.
Rapid economic growth is expected in Mongolia over the next few years. The IMF’s October 2008 World Economic Outlook forecasts annual real per capita GDP growth from 7.5% to 8.5% over the period 2007 to 2009, declining thereafter before rising to over 10% annually in 2011 and 2012 as new mining developments commence operation. For 2013, per capita GDP growth is forecast to fall to under 4%.
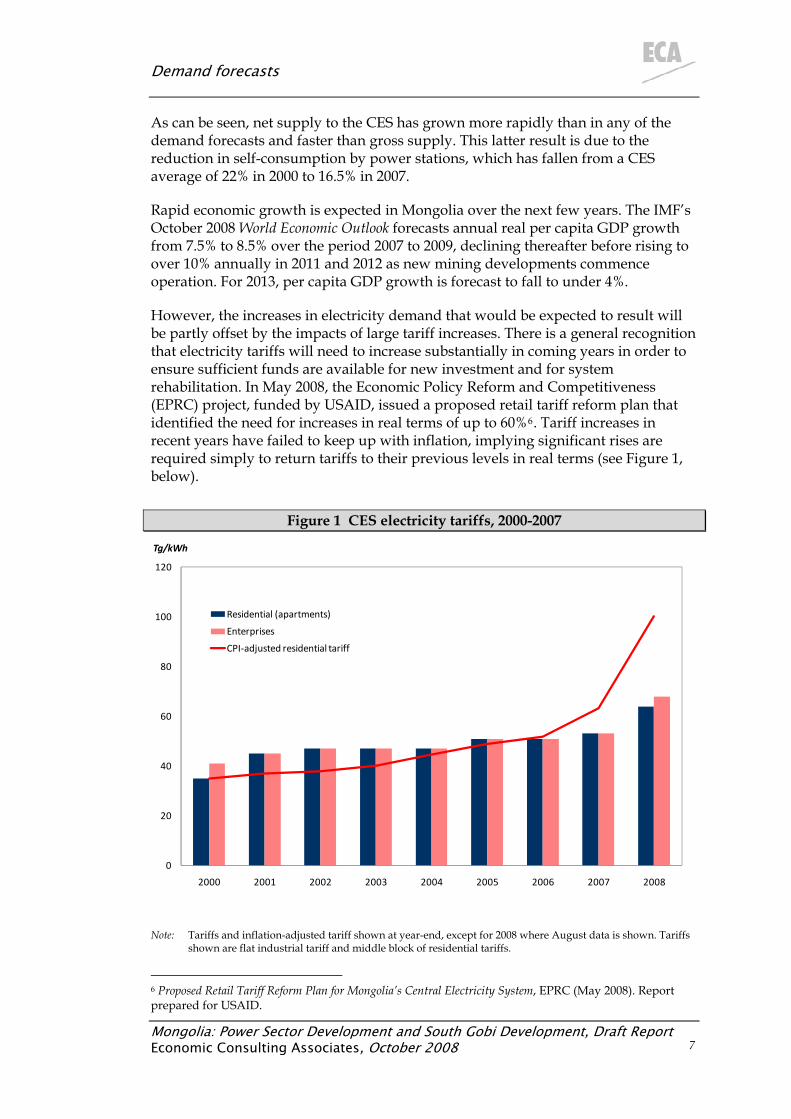
However, the increases in electricity demand that would be expected to result will be partly offset by the impacts of large tariff increases. There is a general recognition that electricity tariffs will need to increase substantially in coming years in order to ensure sufficient funds are available for new investment and for system rehabilitation. In May 2008, the Economic Policy Reform and Competitiveness (EPRC) project, funded by USAID, issued a proposed retail tariff reform plan that identified the need for increases in real terms of up to 60%6. Tariff increases in recent years have failed to keep up with inflation, implying significant rises are required simply to return tariffs to their previous levels in real terms (see Figure 1, below).
Figure 1 CES electricity tariffs, 2000-2007
0
20
40
60
80
100
120
2000 2001 2002 2003 2004 2005 2006 2007 2008
Tg/kWh
Residential (apartments)
Enterprises
CPI-adjusted residential tariff
Note: Tariffs and inflation-adjusted tariff shown at year-end, except for 2008 where August data is shown. Tariffs shown are flat industrial tariff and middle block of residential tariffs.
6 Proposed Retail Tariff Reform Plan for Mongolia’s Central Electricity System, EPRC (May 2008). Report prepared for USAID.
Mongolia: Power Sector Development and South Gobi Development, Draft Report 7 Economic Consulting Associates, October 2008
Demand forecasts
Mongolia: Power Sector Development and South Gobi Development, Draft Report Economic Consulting Associates, October 2008 8
Source: 2007 Licensee Statistics, ERA and Bank of Mongolia.
Part of the demand growth can also be expected to be met by reducing the current high level of distribution losses, rather than through increased generation output. While there have been substantial reductions in losses, these are still 23% in Ulaanbaatar—well above international standards.
In projecting future CES electricity demand, it is also important to avoid double-counting. Much of the economic growth from new mining developments will be concentrated in the South Gobi region resulting in increased electricity demand in this region, rather than on the CES as a whole.
Taking account of these various factors, we therefore adopt a conservative forecast for growth in net supply for the CES of 3.5% annually. This is slightly below the historic average, reflecting the expected impacts of reductions in distribution losses and increasing tariffs. We assume that the 2007 system load factor and power plant self-consumption rates remain unchanged over the forecast period.
3.2 South Gobi electricity demand
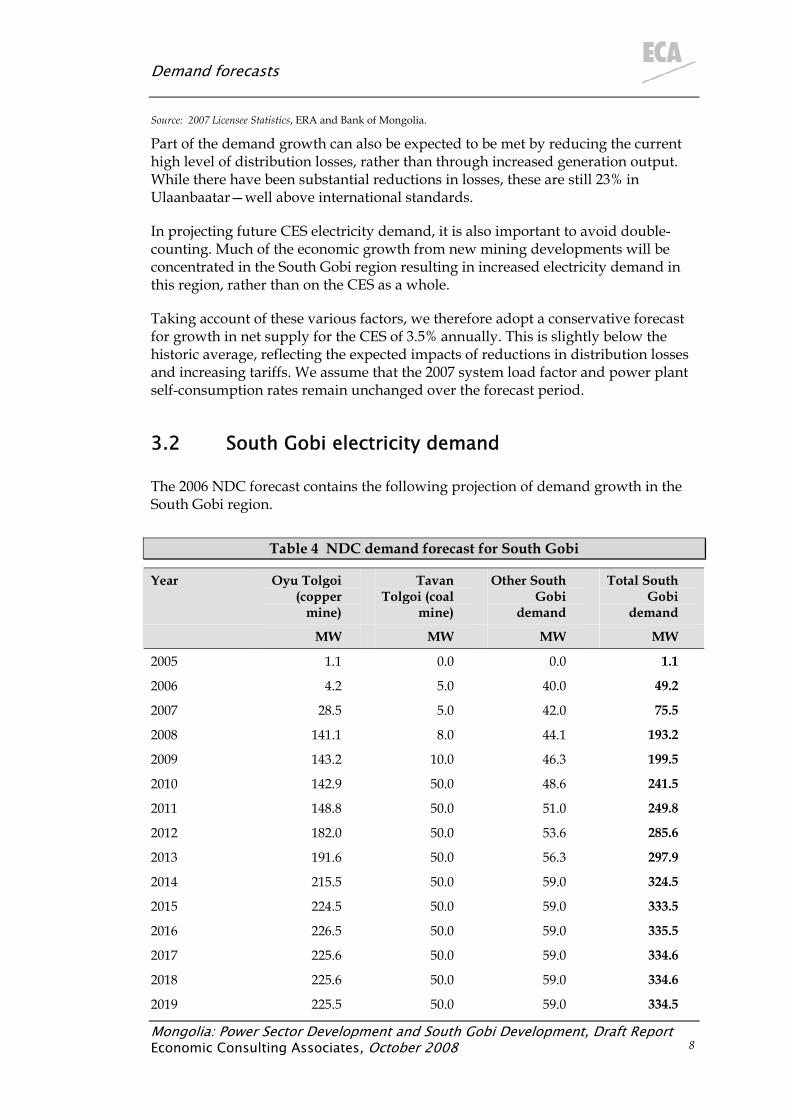
The 2006 NDC forecast contains the following projection of demand growth in the South Gobi region.
Table 4 NDC demand forecast for South Gobi
Year Oyu Tolgoi (copper
mine)
Tavan Tolgoi (coal
mine)
Other South Gobi
demand
Total South Gobi
demand
MW MW MW MW
2005 1.1 0.0 0.0 1.1
2006 4.2 5.0 40.0 49.2
2007 28.5 5.0 42.0 75.5
2008 141.1 8.0 44.1 193.2
2009 143.2 10.0 46.3 199.5
2010 142.9 50.0 48.6 241.5
2011 148.8 50.0 51.0 249.8
2012 182.0 50.0 53.6 285.6
2013 191.6 50.0 56.3 297.9
2014 215.5 50.0 59.0 324.5
2015 224.5 50.0 59.0 333.5
2016 226.5 50.0 59.0 335.5
2017 225.6 50.0 59.0 334.6
2018 225.6 50.0 59.0 334.6
2019 225.5 50.0 59.0 334.5
Demand forecasts
Mongolia: Power Sector Development and South Gobi Development, Draft Report Economic Consulting Associates, October 2008 9
Year Oyu Tolgoi (copper
mine)
Tavan Tolgoi (coal
mine)
Other South Gobi
demand
Total South Gobi
demand
MW MW MW MW
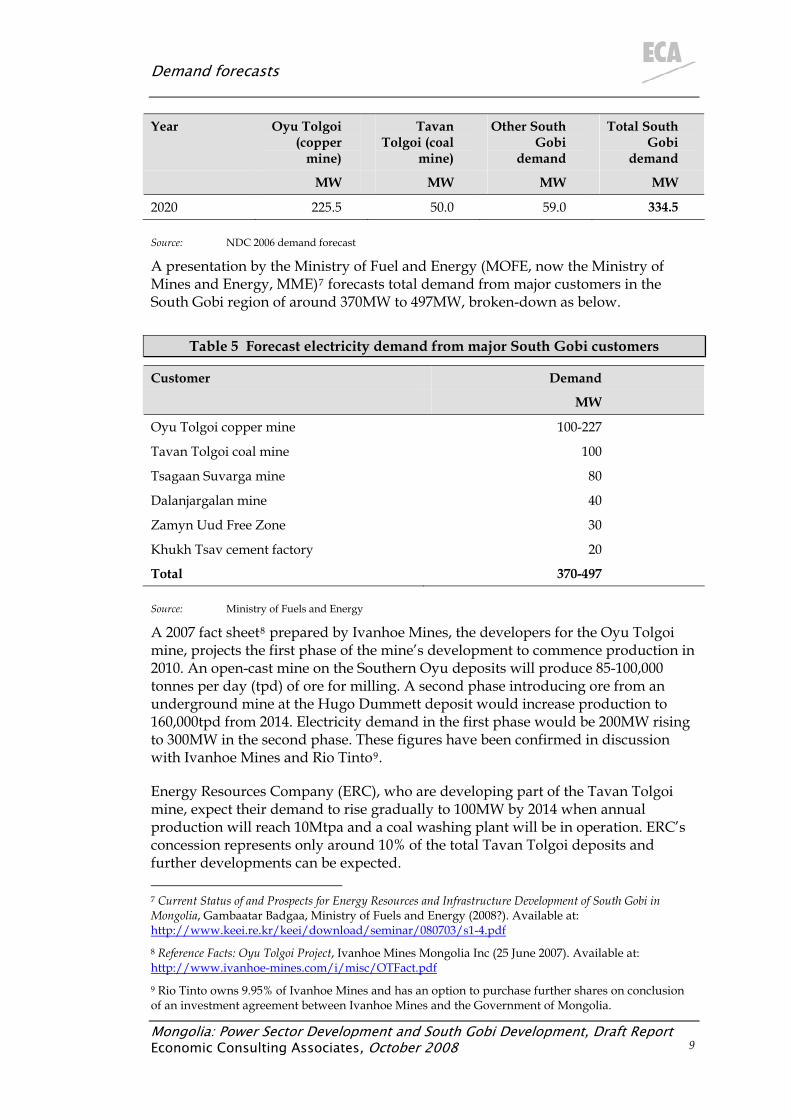
2020 225.5 50.0 59.0 334.5
Source: NDC 2006 demand forecast
A presentation by the Ministry of Fuel and Energy (MOFE, now the Ministry of Mines and Energy, MME)7 forecasts total demand from major customers in the South Gobi region of around 370MW to 497MW, broken-down as below.
Table 5 Forecast electricity demand from major South Gobi customers
Customer Demand
MW
Oyu Tolgoi copper mine 100-227
Tavan Tolgoi coal mine 100
Tsagaan Suvarga mine 80
Dalanjargalan mine 40
Zamyn Uud Free Zone 30
Khukh Tsav cement factory 20
Total 370-497
Source: Ministry of Fuels and Energy
A 2007 fact sheet8 prepared by Ivanhoe Mines, the developers for the Oyu Tolgoi mine, projects the first phase of the mine’s development to commence production in 2010. An open-cast mine on the Southern Oyu deposits will produce 85-100,000 tonnes per day (tpd) of ore for milling. A second phase introducing ore from an underground mine at the Hugo Dummett deposit would increase production to 160,000tpd from 2014. Electricity demand in the first phase would be 200MW rising to 300MW in the second phase. These figures have been confirmed in discussion with Ivanhoe Mines and Rio Tinto9.
Energy Resources Company (ERC), who are developing part of the Tavan Tolgoi mine, expect their demand to rise gradually to 100MW by 2014 when annual production will reach 10Mtpa and a coal washing plant will be in operation. ERC’s concession represents only around 10% of the total Tavan Tolgoi deposits and further developments can be expected. 7 Current Status of and Prospects for Energy Resources and Infrastructure Development of South Gobi in Mongolia, Gambaatar Badgaa, Ministry of Fuels and Energy (2008?). Available at: http://www.keei.re.kr/keei/download/seminar/080703/s1-4.pdf 8 Reference Facts: Oyu Tolgoi Project, Ivanhoe Mines Mongolia Inc (25 June 2007). Available at: http://www.ivanhoe-mines.com/i/misc/OTFact.pdf9 Rio Tinto owns 9.95% of Ivanhoe Mines and has an option to purchase further shares on conclusion of an investment agreement between Ivanhoe Mines and the Government of Mongolia.
Demand forecasts
Mongolia: Power Sector Development and South Gobi Development, Draft Report Economic Consulting Associates, October 2008 10
Our own demand projections assume that:
ο The first phase of the Oyu Tolgoi mine will commence production in 2012, given the delays in signing the investment agreement between Ivanhoe Mines and the Government of Mongolia, with the second phase following in 2016.
ο Production by ERC will commence in 2010 and ramp up to full projected levels by 2014.
ο Production from other areas in the Tavan Tolgoi deposits will begin in 2012 and increase gradually to 20Mtpa by 2018.
Under these projections, demand in the South Gobi region will reach 288MW in 2012 and 600MW by 2018. To convert these projections into energy demand, we have used an assumed load factor of 85%.
Development of these mines will require the establishment of one or more new townships in the region. However, the demand from these can be expected to be small and subsumed into the above forecasts. For example, a township of 35,000 inhabitants would represent a demand of around 5MW.
3.3 CES heat demand
As well as electricity, the CES also supplies district heating services in Ulaanbaatar, Darkhan and Erdenet. Expansions to the CES must be able to meet both electricity and heat demand growth.
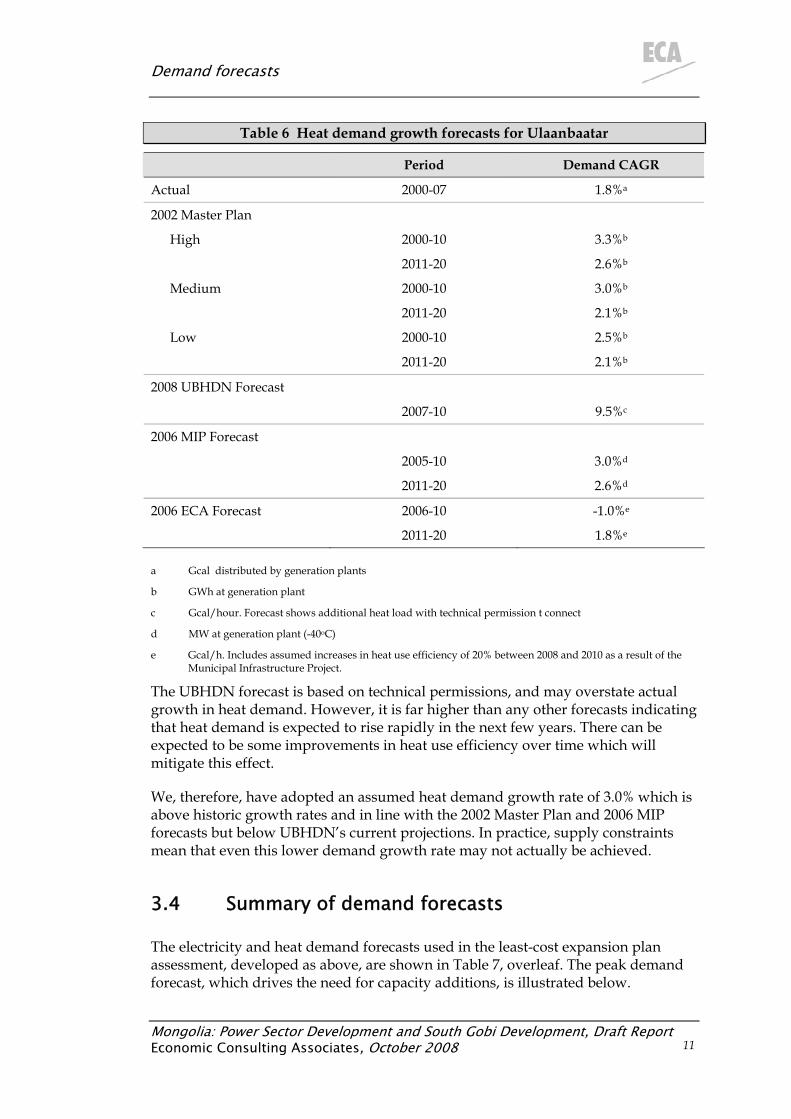
The 2002 master plan forecast prepared forecasts of the growth in heat demand for Ulaanbaatar under high, medium and low scenarios. In the absence of more detailed information, the same assumed growth rates were applied to project heat demand on the Darkhan and Erdenet networks. To identify capacity requirements, a constant 15% heat loss, 40% load factor for heat supplied as ‘water’ and 17.5% for heat supplied as ‘steam’ were assumed. Other heat demand forecasts for Ulaanbaatar are available from UBHDN, from an April 2006 technical assessment prepared by consultants to the World Bank as part of the preparation of the Heating Component of the Municipal Infrastructure Project (MIP) and from the 2006 ECA report on energy sector strategy.
The four forecasts are shown below, along with the actual evolution of heat demand since 2000.
Demand forecasts
Mongolia: Power Sector Development and South Gobi Development, Draft Report Economic Consulting Associates, October 2008 11
Table 6 Heat demand growth forecasts for Ulaanbaatar
Period Demand CAGR
Actual 2000-07 1.8%a
2002 Master Plan
High 2000-10 3.3%b
2011-20 2.6%b
Medium 2000-10 3.0%b
2011-20 2.1%b
Low 2000-10 2.5%b
2011-20 2.1%b
2008 UBHDN Forecast
2007-10 9.5%c
2006 MIP Forecast
2005-10 3.0%d
2011-20 2.6%d
2006 ECA Forecast 2006-10 -1.0%e
2011-20 1.8%e
a Gcal distributed by generation plants
b GWh at generation plant
c Gcal/hour. Forecast shows additional heat load with technical permission t connect
d MW at generation plant (-40oC)
e Gcal/h. Includes assumed increases in heat use efficiency of 20% between 2008 and 2010 as a result of the Municipal Infrastructure Project.
The UBHDN forecast is based on technical permissions, and may overstate actual growth in heat demand. However, it is far higher than any other forecasts indicating that heat demand is expected to rise rapidly in the next few years. There can be expected to be some improvements in heat use efficiency over time which will mitigate this effect.
We, therefore, have adopted an assumed heat demand growth rate of 3.0% which is above historic growth rates and in line with the 2002 Master Plan and 2006 MIP forecasts but below UBHDN’s current projections. In practice, supply constraints mean that even this lower demand growth rate may not actually be achieved.
3.4 Summary of demand forecasts
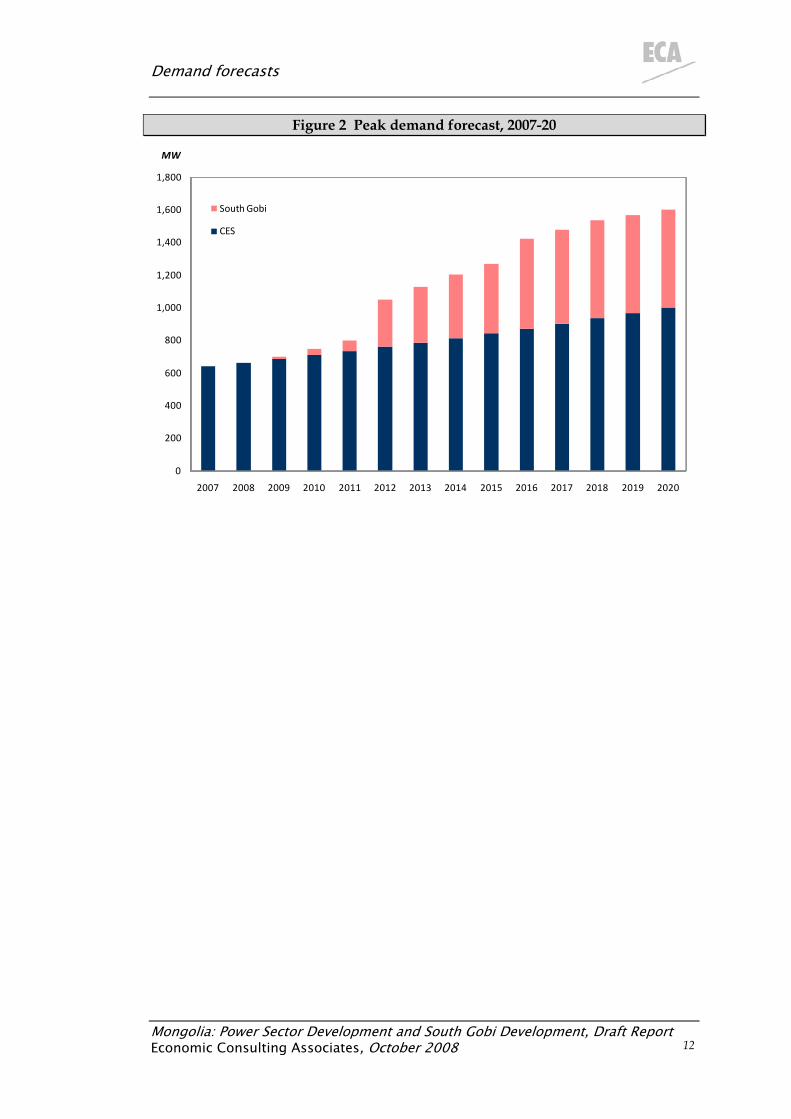
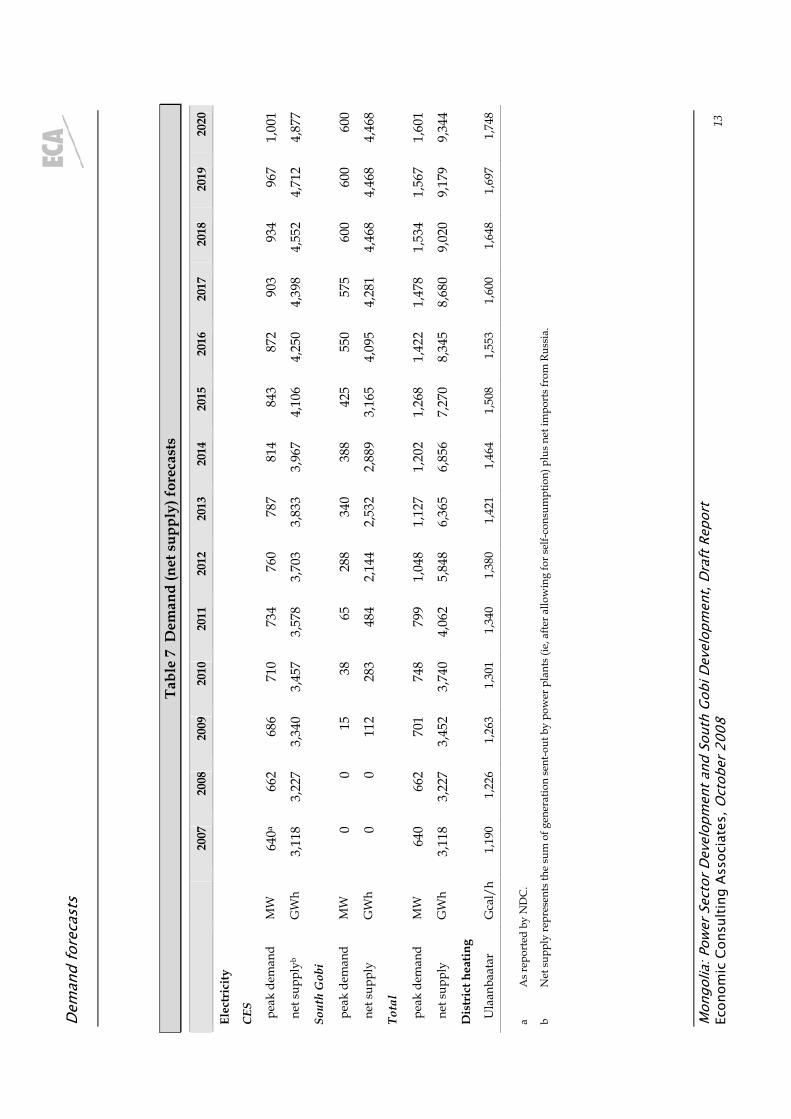
The electricity and heat demand forecasts used in the least-cost expansion plan assessment, developed as above, are shown in Table 7, overleaf. The peak demand forecast, which drives the need for capacity additions, is illustrated below.
Demand forecasts
Mongolia: Power Sector Development and South Gobi Development, Draft Report Economic Consulting Associates, October 2008 12
Figure 2 Peak demand forecast, 2007-20
0
200
2007 2008 2009 2010 2011 2012 2013 2014 2015
400
600
800
1,000
1,200
1,400
1,600
1,800
2016 2017 2018 2019 2020
MW
CES
South Gobi
Dem
and
fore
cast
s M
ongo
lia: P
ower
Sec
tor D
evel
opm
ent a
nd S
outh
Gob
i Dev
elop
men
t, Dr
aft R
epor
t Ec
onom
ic C
onsu
lting
Ass
ocia
tes,
Oct
ober
200
8
13
Tabl
e 7
Dem
and
(net
sup
ply)
fore
cast
s
2007
20
08
2009
2010
2011
20
1220
13
2014
2015
20
1620
1720
18
2019
2020
Elec
tric
ity
CES
787
814
3,11
8 3,
227
3,83
3 3,
967
0 0
340
600
0 0
2,53
2 4,
468
640
662
3,11
8 3,
227
6,36
5 6,
856
1,34
0 1,
380
1,64
8 1,
697
pea
k de
man
d M
W
640a
662
686
710
734
760
843
872
903
934
967
1,00
1
net
sup
plyb
GW
h 3,
340
3,45
73,
578
3,70
34,
106
4,25
04,
398
4,55
24,
712
4,87
7
Sout
h G
obi
pea
k de
man
d M
W
1538
6528
838
842
555
057
560
060
0
net
sup
ply
GW
h 11
228
348
42,
144
2,88
93,
165
4,09
54,
281
4,46
84,
468
Tota
l
pea
k de
man
d M
W
701
748
799
1,04
81,
127
1,20
21,
268
1,42
21,
478
1,53
41,
567
1,60
1
net
sup
ply
GW
h 3,
452
3,74
04,
062
5,84
87,
270
8,34
58,
680
9,02
09,
179
9,34
4
Dis
tric
t hea
ting
Ula
anba
atar
G
cal/
h 1,
190
1,22
6 1,
263
1,30
11,
421
1,46
41,
508
1,55
31,
600
1,74
8
a A
s rep
orte
d by
ND
C.
b N
et su
pply
repr
esen
ts th
e su
m o
f gen
erat
ion
sent
-out
by
pow
er p
lant
s (ie
, afte
r allo
win
g fo
r sel
f-con
sum
ptio
n) p
lus n
et im
port
s fro
m R
ussi
a.
Generation expansion options
Mongolia: Power Sector Development and South Gobi Development, Draft Report Economic Consulting Associates, October 2008 14
4 Generation expansion options This section summarises the main generation expansion options currently under development or proposed in Mongolia. A brief description of each option is provided along with our assessment of whether it should be considered as a candidate plant in the least-cost investment plan. A comparison of the various options is provided at the end of the section.
In assessing which options should be considered as candidate plants, we have focused on the ability of each to contribute to Mongolia’s security of supply looking at:
ο Whether the plant will provide the firm baseload capacity required to meet forecast demand growth in the South Gobi region, in particular.
ο Whether development of the plant is contingent on export revenues. Where this is the case, Mongolia may find itself reliant on projects that are unable to proceed as rapidly as required due to difficulties in obtaining the necessary export contracts—a matter outside the control of the Government of Mongolia10.
ο Whether there are other risks to the timely completion of the plant.
This does not mean that Mongolia should not develop export-oriented power projects—clearly it should. But the greater risks of delay associated with these projects given the need for export revenues to make them viable need to be recognised.
We have treated those plants which we assess as being at an advanced stage of development as being committed investments (ie, these will be made in any case).
This initial assessment does not consider issues of cost in detail, although available cost estimates on individual projects are reported. A more detailed assessment of the costs of candidate plants is provided in the following section.
4.1 Thermal power plant #5
Thermal power plant #5 (TPP#5) would be a new CHP located at Ulaanbaatar fuelled by lignite (most probably from the Baganuur mine). The plant has been proposed for some time. It forms part of the least-cost investment programme prepared by Elektrowatt-Ekono in 2001-02, which provided for the commissioning of 240MWe at TPP#5 between 2012 and 2018. It was also included as part of the least-cost investment programme in the energy sector strategy prepared by ECA in 2006, which provided for the commissioning of 320MWe between 2016 and 2020.
10 The exception to this is the development of a mine-mouth plant at Tavan Tolgoi—which is itself reliant on exports from mines in the South Gobi region to proceed. However, as the purpose of this report is to consider options for meeting demand growth in the South Gobi region, it is appropriate to take the related mining projects as given.
Generation expansion options
Mongolia: Power Sector Development and South Gobi Development, Draft Report Economic Consulting Associates, October 2008 15
While these two studies projected that TPP#5 would only commission after other generating investments, the Government of Mongolia has identified TPP#5 as an urgent investment requirement due to the need to meet heat demand growth in Ulaanbaatar. In July 2008, the Mongolian Government has issued a request for proposals for TPP#5. Bids are due by October 2008 and the expected commissioning date is 2013.
The request for proposals specifies a 300MWe CHP with a heating capacity of 700Gcal/hour. Earlier proposals appear to have been for a somewhat larger plant, with an electricity generation capacity of 400-500MWe and a heating capacity of 800-1,000Gcal/hour. For this size plant, the estimated investment cost was approximately US$650 million (around US$1,300-1,400/kW).
From a review of the bidding documents, it is apparent that bidders are invited to make their own proposals on financing arrangements and contractual terms—although there is a general presumption that the now power plant will be developed on a BOT basis. It is also the responsibility of bidders to prepare feasibility studies and environmental assessments. Given this, we believe it is reasonable to assume that any decision on a preferred bidder and negotiation on contracts will take an extended period due to the likely divergences between the proposals received and the difficulties in comparing them and to the need for further detailed design work.
We have therefore assumed that TPP#5 can be considered as a candidate plant for the investment plan, but should not be considered as already committed, despite the issuing of a request for proposals. The possible delays in implementing TPP#5 provide potential for other investment options to be developed. There must also be some risk that it will prove necessary to retender TPP#5 in order to obtain a more consistent set of bids that can be readily compared for evaluation purposes.
4.2 Tavan Tolgoi thermal power plant
A mine-mouth plant at Tavan Tolgoi is proposed for development to meet electricity demand in the South Gobi region as well as, potentially, supply electricity to the CES. The plant would be fuelled by lignite removed to allow access to the coking coal deposits in Tavan Tolgoi.
Basic data on current proposals for this plant are available from the 2008 presentation by MOFE11. These are for a 600MW plant with annual output of 4,144GWh (a plant load factor of 79%). Self-consumption by the plant is given as 8%. The investment cost would be US$350 million or US$580/kW.
A major constraint on the development of such a plant is water resources. While recent discoveries of underground water reserves have been made there is still uncertainty as to whether sufficient water is available for a new power plant. If not,
11 Current Status of and Prospects for Energy Resources and Infrastructure Development of South Gobi in Mongolia, Gambaatar Badgaa, Ministry of Fuels and Energy (2008?).
Generation expansion options
Mongolia: Power Sector Development and South Gobi Development, Draft Report Economic Consulting Associates, October 2008 16
then it will be necessary for any power plant to use air-cooling which is both more costly and increases the self-consumption of power plants.
The Tavan Tolgoi thermal power plant (TPP) is considered to be a candidate plant for the investment plan.
4.3 Oyu Tolgoi thermal power plant
The developers of the Oyu Tolgoi mine have reached an advanced stage of preparation for construction of a coal power plant, including selecting suppliers and obtaining most of the required permits. This is a response to concerns that reliable electricity supplies will not be available within the timeframe required for exploitation of the mine to begin and have therefore chosen to supply their own needs.
The plant would have 3 x 150MW air-cooled12 coal-fired units, supplied from China. The estimated cost of the plant is US$650-750 million (or approximately US$1,500/kW)13. Expected completion time would be 30 months after an order was placed14—which would occur once the investment agreement for the Oyu Tolgoi mine is approved.
4.4 Shivee Ovoo thermal power plant
A Memorandum of Understanding for the Shivee Ovoo TPP was signed between Mongolia and China in 2005. A pre-feasibility study is almost complete and a feasibility study is expected to be commissioned shortly.
Current proposals are for the initial development of a 3,600MW (6 x 600MW) mine-mouth coal power plant complex for electricity export to China. Over time, it is envisaged that total installed capacity of the complex would rise to 10,800MW. A 500kV DC transmission line to China, of 1,300km in length, would be constructed. A 200kV DC connection to the CES would also be built.
Some basic data on the plant is available from a 2008 presentation by the State Secretary for MOFE15. This provides the following information:
12 The mine’s developers now consider that extensive water resources are available for the mine. However, the original design for the power plant provided for air-cooled units and a decision has been made to retain these in order not to delay construction. 13 These figures were provided in discussion with the Oyu Tolgoi mine developers. They represent a major increase on the initial estimates of US$380 million (US$845/kW) contained in Ivanhoe Mines’ 2007 fact sheet. 14 This assumes no delays are incurred due to an existing backlog of orders at the selected supplier. The developers understand that these will be cleared soon. 15 Energy Development in the South Gobi Region, Tserenpurev T (2008?). Available at http://siteresources.worldbank.org/MONGOLIAEXTN/Resources/4-1_MOFE_SOUTH_GOBI_eng.pdf
Generation expansion options
Mongolia: Power Sector Development and South Gobi Development, Draft Report Economic Consulting Associates, October 2008 17
ο The complex is expected to operate for 5,500 hours annually with self-consumption of 7.6%, implying annual sent-out output of 18,295GWh.
ο Of the installed capacity, 300MW would be made available to meet mining demand in the South Gobi region.
ο The total investment cost is estimated at US$2,976 million or US$827/kW.
ο Annual coal consumption is 13.6 million tonnes. The heating value of Shivee Ovoo coal is estimated at 3,150 kcal/kg, which implies a plant thermal efficiency of approximately 40%.
ο Commercial operation would commence in 2010 (assuming a 2008 start date for construction work) with the complex being completed by 2015.
As of August 2008, the on-grid power tariff for generators in Inner Mongolia was around RMB240/MWh (US$35/MWh). We would expect that the Shivee Ovoo plant would need to achieve similar tariffs to be attractive to purchasers in China16. Based on the provided data, we estimate this tariff would allow the Shivee Ovoo project to support a coal price of up to US$18/t compared to the current regulated price of Tg11,400/t (US$10/t). Using the current coal price, a generation cost of US$30/MWh would appear to be achievable. We caution that the this calculation does not take account of the costs and losses associated with transmission of electricity from Shivee Ovoo to markets in China.
While this initial assessment implies that the Shivee Ovoo project is attractive economically, its progress is dependent on the ability of the project developers to obtain long-term PPAs with purchasers in China. We have, therefore, excluded it as a candidate plant given the uncertainties this entails.
4.5 Baganuur IGCC
Two proposals have been advanced for the development of a coal to liquids (CTL) plant at Baganuur—one by a Korean developer and the other by a joint venture including Petrovis, the major Mongolian oil supplier, with Siemens as a technology partner. The second of these is considered below.
The proposed CTL plant would produce around 2 Mtpa of diesel and gasoline. Of this, approximately 800,000 tpa would be used to meet Mongolian demand17 with
16 The on-grid tariff for Datang Power’s Inner Mongolia generation company was RMB259.9/MWh in July 2008. A further tariff increase in August 2008 is assumed to have added RMB20/MWh to this, in line with the increases reported by Huaneng Power. These tariffs include VAT at 17% which has been deducted in the calculations. An exchange rate of RMB 6.85: 1 US$ has been applied. For comparison, in June 2008, Urandaline Investments estimated the costs of a new 600MW ultrasupercritical coal-fired generator in Shanxi province as approximately RMB400/MWh (US$60/MWh) before VAT. The assumed coal cost is around RMB200/MWh of electricity or around US$90/t for coal (assuming a heating value of 6,000 kcal/kg and plant thermal efficiency of 43%). Using the same heating value as Shivee Ovoo coal would imply a coal price of around US$45/t. 17 Total final consumption of motor gasoline and diesel in 2006 was 584,000t (IEA Energy Balances).
Generation expansion options
Mongolia: Power Sector Development and South Gobi Development, Draft Report Economic Consulting Associates, October 2008 18
the reminder being exported to China under long-term contracts with major Chinese oil retailers. The CTL plant would include a 650MW integrated gasification combined cycle (IGCC) power plant, which would be fuelled by the synthetic gas (syngas) produced as part of the CTL process. Around 400MW of the plant’s capacity will be required for the CTL process with the remaining 250MW being available for sale to the CES. The project’s sponsors consider that expansion of the IGCC plant to provide additional capacity to the CES would be technically and economically feasible. A feasibility study for the CTL plant is expected to be undertaken during 2009 and the project’s sponsors are targeting 2014 for commissioning.
Estimated costs of the CTL plant as a whole would be around US$3.5 billion. The IGCC plant would cost around US$390 million or US$600/kW. The project sponsors project refined product prices at US$35/bbl.
As a comparison, a 2007 study for the US Department of Energy18 estimated the total capital costs for a 2.5 Mtpa CTL plant as US$3.65 billion or US$4.53 billion including costs. The CTL project analysed included a 652MW IGCC power plant of which 528MW would be required to meet internal loads and 124MW would be available for external sales. The estimated costs of the IGCC plant were around US$500 million or US$760/kW. The plant would be viable at crude oil prices exceeding US$43/bbl.
The above suggests that the estimated costs for the Baganuur CTL project may be somewhat low, but not excessively so. At current crude oil prices, it would still be economically viable. However, we believe it may take significant time to develop given the lack of commercial experience with the technology19, making financing harder to obtain, and the difficulties likely to be experienced in finding off-takers willing to sign long-term contracts for diesel and gasoline output from the CTL plant. Given these risks of delay, and that the Baganuur CTL project as a whole is export-oriented with the further risks this entails, we do not believe it should be considered as a candidate plant for the least-cost analysis.
4.6 Newcom wind farm
The Newcom wind farm project is being developed at Saalkhit uul, located 70km southeast of Ulaanbaatar. Its installed capacity is 50MW and expected annual output is around 116GWh.
A power purchase agreement (PPA) was signed by CRETG in May 2007. However, negotiations on the agreement are still ongoing as some provisions relating to
18 Baseline Technical and Economic Assessment of a Commercial Scale Fischer-Tropsch Liquids Facility. Final Report for NETL / DOE by RDS (April 2007). 19 China had previously announced ambitious plans for the development of up to 20 CTL projects. However, recent newspaper reports suggest that all, except for up to three projects being developed by the Shenhua Group, have been cancelled due to concerns over their environmental impacts and the diversion of coal supplies from electricity generation (IEA World Energy Outlook 2007 and China Daily).
Generation expansion options
Mongolia: Power Sector Development and South Gobi Development, Draft Report Economic Consulting Associates, October 2008 19
scheduling and dispatch are not acceptable to the project’s investors. Once a final PPA has been agreed, construction is expected to take around one year.
We understand that Newcom has been offered a tariff at the top end of the range permitted under the 2007 Renewable Energy Law, of US$95/MWh.
In our analysis, we have assumed, given its advanced status, that the Newcom wind farm is a committed project, commissioning in 2010. However, given the unpredictable nature of its output and its daily and seasonal fluctuations, we have also assumed that Newcom should not be considered as baseload capacity and, therefore, does not displace the need for new investment in such capacity. For similar reasons, we do not consider further wind capacity as a candidate option for meeting demand growth20.
4.7 Egiin hydro power plant
The Egiin hydro power plant (HPP) has a planned capacity of 220MW and projected annual output of 484GWh. A ground-breaking ceremony was held for the plant in 2006, following agreement on a US$300 million credit from China Exim Bank to be used to finance the project. At the time, estimated investment costs for the plant were US$312 million or US$1,420/kW. However, bids received from potential EPC contractors ranged from US$400 million upwards. Budgetary constraints meant that the Mongolian Government was unable to fund the difference and the project is currently suspended. It is not clear if and when it may restart.
Operationally, the Egiin HPP would be an important addition to the CES, providing flexible capacity to enable load-following by the system and to respond to unexpected outages as well as being able to manage the increased volatility and unpredictability of output associated with the expected growth of wind generation. However, it does not represent a new source of baseload generation. The projected plant load factor is only 25%, consistent with its expected use as a peaking plant. As such, we exclude it as a candidate plant in our least-cost analysis.
We do note, however, the general desirability of the addition of Egiin HPP or an alternative HPP to the system in order to increase operational flexibility. For this reason, we treat it as a committed generator in our least-cost analysis. Development is well advanced and, once financing becomes available, it appears likely to proceed.
20 With a sufficiently geographically diversified mix of wind generators, these can be expected to provide a base level of capacity (it is extremely unlikely that wind speeds will drop substantially in all locations simultaneously). However, the value of the associated ‘capacity credit’ is generally considered to be low. Studies in the USA have estimated it at 20-30% (ie, 1,000MW of wind capacity would give an effective firm capacity of around 200-300MW).
Generation expansion options
Mongolia: Power Sector Development and South Gobi Development, Draft Report Economic Consulting Associates, October 2008 20
4.8 Orkhon hydro power plant
Orkhon HPP is an alternative to Egiin HPP. The plant would have an installed capacity of 100MW with annual projected output of 219GWh. The estimated investment cost, based on a 2000 study, would be US$160 million or US$1,600/kW.
As with Egiin HPP, the addition of Orkhon HPP to the system would provide a valuable means of increasing operational flexibility. However, it would not provide a means to provide new baseload capacity and, therefore, we exclude it as a candidate plant.
4.9 Tuul Songino pumped storage plant
As part of the development of the Tuul Songino water supply and wastewater treatment complex in Ulaanbaatar, the construction of a 50-100MW pumped storage plant (PSP) using treated wastewater has been proposed. A construction licence has already been issued although no PPA has yet been signed. We understand that a price differential of 5:1 is required between daytime (sales) and night-time (pumping) tariffs for the project to be viable. Total costs were estimated at US$55-60 million in 2005.
A PSP would supplement HPPs in increasing operational flexibility in the CES. However, even more so than HPPs, it cannot be considered a means of providing baseload capacity and, therefore, is excluded as a candidate plant in our analysis.
4.10 Increased Russian imports
In addition to new generation projects located in Mongolia, increased Russian imports offer a further means to meet demand growth. Currently, Mongolia has a contract for the import of up to 120MW of electricity at a cost of US$204,000/MW/month of contracted capacity and US$18/MWh of energy imported. For 2007, imports totalled 130 GWh, giving an average price (capacity and energy) of US$38.4/MWh before duties and taxes21.
The capacity of the interconnector with Russia is 255MW, so significant potential exists to increase current import levels even before considering the construction of a second interconnector. However, we understand that there is concern within Mongolia over the security of supply risks resulting from a dependence on Russian imports to meet demand growth. We agree that supply security risks attach to increased Russian imports. In particular, it is unclear whether Russia would be willing to supply larger volumes at the same tariff as Russian electricity prices increase in response to growing domestic demand and investment requirements. There are also operational difficulties in relying on Russian imports given the requirements for nomination of import volumes two days in advance and the
21 The 2007 Licensee Statistics published by the Energy Regulatory Authority (ERA) give an average price of US$31.6/MWh. This may include the revenues earned from exports to Russia.
Generation expansion options
Mongolia: Power Sector Development and South Gobi Development, Draft Report Economic Consulting Associates, October 2008 21
penalties for deviations from nominated quantities or imports in excess of contracted capacity.
We do not, therefore, consider increased Russian imports as a candidate option to meet demand growth in Mongolia on a sustained basis. However, imports can provide a valuable means of meeting demand growth on a short-term basis and of obtaining system reserves.
4.11 Summary of generation expansion options
A summary of the various generation expansion options considered is provided in Table 8, overleaf.
Gene
ratio
n ex
pans
ion
optio
ns
Mon
golia
: Pow
er S
ecto
r Dev
elop
men
t and
Sou
th G
obi D
evel
opm
ent,
Draf
t Rep
ort
Econ
omic
Con
sulti
ng A
ssoc
iate
s, O
ctob
er 2
008
22
Tabl
e 8
Sum
mar
y of
gen
erat
ion
expa
nsio
n op
tions
Plan
t In
stal
led
capa
city
–
elec
tric
ity
Cos
t (pr
ojec
t pro
posa
ls)
Can
dida
te p
lant
?
M
W
TPP#
5 (U
laan
baat
ar)
300
US$
1300
-140
0/kW
Ye
s
Tava
n To
lgoi
TPP
60
0 U
S$58
0/kW
Ye
s
Oyu
Tol
goi T
PP
450
US$
1,45
0-1,
550/
kW
Yes.
Shiv
ee O
voo
TPP
3600
-108
00
US$
827/
kW
No.
Exp
ort-o
rien
ted
proj
ect i
mpl
ies
high
risk
s of
del
ays
whi
ch a
re o
utsi
de th
e co
ntro
l of t
he G
over
nmen
t of
Mon
golia
Baga
nuur
IGC
C
250
(net
ava
ilabl
e ca
paci
ty)
US$
600/
kW
No.
Exp
ort-o
rien
ted
proj
ect i
mpl
ies
high
risk
s of
del
ays
whi
ch a
re o
utsi
de th
e co
ntro
l of t
he G
over
nmen
t of
Mon
golia
New
com
win
d fa
rm
50M
W
US$
95/M
Wh
Ass
umed
to b
e a
com
mitt
ed g
ener
ator
. At a
n ad
vanc
ed
stag
e of
dev
elop
men
t.
Egiin
HPP
22
0MW
U
S$14
20/k
W (f
easi
bilit
y st
udy)
A
ssum
ed to
be
a co
mm
itted
gen
erat
or. F
lexi
ble
gene
ratin
g ca
paci
ty is
requ
ired
.
Ork
hon
TPP
100M
W
US$
1600
/kW
N
o. L
ow lo
ad fa
ctor
mak
es th
is u
nsui
tabl
e fo
r bas
eloa
d ge
nera
tion
Tuul
Son
gino
PSP
50
-100
MW
U
S$11
00-1
200/
kW
No.
Low
load
fact
or m
akes
this
uns
uita
ble
for b
asel
oad
gene
ratio
n
Incr
ease
d Ru
ssia
n im
port
s U
p to
255
MW
U
S$20
4,00
0/M
W/m
ont h
US$
18/M
Wh
No.
Sig
nific
ant s
uppl
y se
curi
ty ri
sks
Least-cost analysis
Mongolia: Power Sector Development and South Gobi Development, Draft Report Economic Consulting Associates, October 2008 23
5 Least-cost analysis This section contains the results of our least-cost analysis of three alternative expansion scenarios for electricity supply for the CES and South Gobi region.
5.1 Scenarios
We have defined three alternative scenarios for the development of new baseload generating capacity in Mongolia:
ο Scenario 1: the simultaneous development from 2012 of TPP#5 in Ulaanbaatar and Tavan Tolgoi TPP. Under this scenario, Oyu Tolgoi TPP is not developed.
ο Scenario 2: the development of Tavan Tolgoi TPP from 2012 followed by that of TPP#5. Under this scenario, Oyu Tolgoi TPP is not developed.
ο Scenario 3: the development of Oyu Tolgoi TPP from 2012 followed by that of TPP#5 and then Tavan Tolgoi TPP.
Under each scenario, we assume that later additions are made as needed to maintain a target reserve margin of 20% in both the CES and the South Gobi region, after allowing for the potential for energy flows between the two regions. Later additions take the form of further units of either TPP#5 or Tavan Tolgoi TPP—it is assumed that no further investments would be made in Oyu Tolgoi TPP.
We assume that, other than the candidate plants, other committed generation projects and retirements of existing generation capacity are the same across all scenarios.
Our demand forecasts used in the analysis have previously been described in Section 3. The following sub-sections describe our assumptions on committed generation projects and retirements as well as other parameters. We then discuss the costs of the two candidate plants before comparing these to identify the least-cost expansion option. The section concludes by discussing other factors that should be taken into consideration in selecting the optimal generation expansion plan.
5.2 Common assumptions
5.2.1 Committed generation projects
As described in the preceding section, we assume that the Newcom wind farm is a committed project, entering service in 2010. Given the clear need for more flexible generating capacity to be added to the system, we also assume that Egiin HPP is a committed project and enters service in 2014. Egiin HPP is selected above other potential providers of flexible generating capacity as being the most advanced in
Least-cost analysis
Mongolia: Power Sector Development and South Gobi Development, Draft Report Economic Consulting Associates, October 2008 24
development. The Oyu Tolgoi TPP is also assumed to be committed, with construction starting in mid-2009 and commissioning in 201222.
5.2.2 Retirements
The 2002 master plan assumed that TPP#2 would be retired in 2005, TPP#3 in two stages in 2008 and 2011 and Darkhan TPP in 2013, as each plant reaches the end of its operating life.
The 2006 NDC forecast notes that it is not possible for these plants to retire prior to 2009, given the lack of new capacity under development, and expects retirement of TPP#2 to be postponed to 2012, of TPP#3 to 2016 and of Darkhan TPP indefinitely.
In the April 2006 technical assessment of the district heating networks of Ulaanbaatar and Darkhan, the following information on remaining lives is provided:
ο TPP#2: Refurbishment in 1995-98 of the boilers increased their life by 100,000 hours (30 years at 2005 operating levels). Two older boilers were replaced by new ones in 2001.
ο TPP#3: Two low pressure (LP) boilers were replaced ‘recently’. Four high pressure (HP) boilers were rehabilitated in 1996-2000.
ο TPP#4: A life extension of 15 years on four boilers was carried out in 1997-2000 and a further life extension on the remaining four boilers and three turbines was recently completed.
ο Darkhan TPP: The operational life of four boilers and one turbine was extended by 20 years using KfW financing in 1993-97.
It is not realistic to expect the existing plants to continue to operate indefinitely without substantial rehabilitation. However, it is also not realistic to expect existing capacity to be withdrawn where no replacement is available.
As the most recent forecast of retirement dates is that provided by NDC, we have applied this for TPP#2 and TPP#3, with the proviso that neither should retire until replacement capacity in the form of either TPP#5 or Tavan Tolgoi TPP is commissioned. It should be noted that this assumes that no further rehabilitation investment is required to achieve these lifetimes. This may be an optimistic assessment. The 2002 master plan assumes much earlier retirement dates.
We have assumed that Darkhan TPP will remain in operation throughout the period of the analysis as shown in the NDC forecast. In meetings held as part of the preparation of this report, there was no suggested that Darkhan TPP would be replaced in the near-future. However, we note that both the 2002 master plan and the 2006 technical assessment suggest a retirement data around 2013. It may be that this plant was not fully considered in the NDC assessment.
22 Demand from the Oyu Tolgoi mine is assumed to be supplied from existing generators over the interconnector with the CES during the period up to 2012.
Least-cost analysis
Mongolia: Power Sector Development and South Gobi Development, Draft Report Economic Consulting Associates, October 2008 25
This gives the following schedule of plant retirements:
ο TPP#2 – retired 2013 (assumed commissioning date of replacement capacity in the form of either TPP#5 or Tavan Tolgoi TPP.
ο TPP#3 – retired in 2016.
5.2.3 Reserve margin and capacity investment
Our least-cost analysis identifies a need for new generating capacity to be added where reserve margins fall below a minimum level. We have set the target reserve margin at 20%. For the purposes of calculating this margin, we ignore the Newcom wind farm as being non-firm output and imports as being subject to annual renegotiations and, therefore, also being non-firm. New candidate generators can only be added in minimum unit sizes.
Imports are assumed to be a minimum of 120MW contracted capacity and a maximum of 255MW in each year, with the actual value being determined by the reserve margin after all Mongolian-located capacity is taken into account and the need for imported energy supplies.
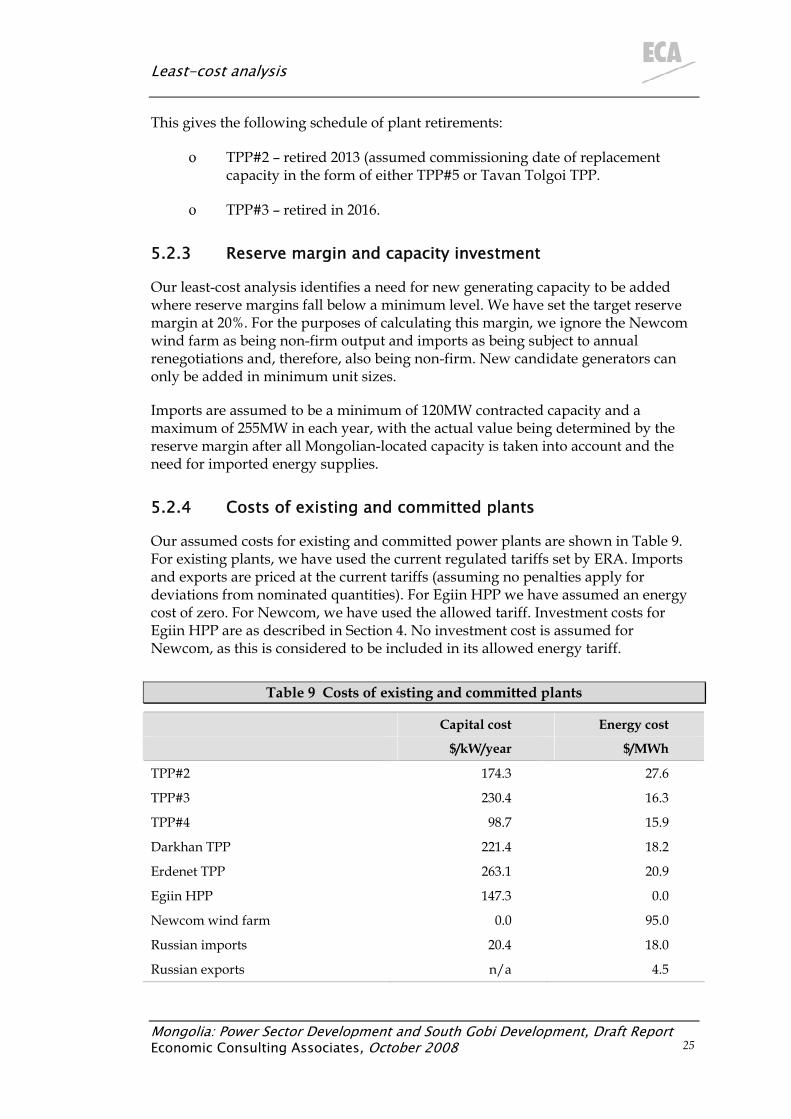
5.2.4 Costs of existing and committed plants
Our assumed costs for existing and committed power plants are shown in Table 9. For existing plants, we have used the current regulated tariffs set by ERA. Imports and exports are priced at the current tariffs (assuming no penalties apply for deviations from nominated quantities). For Egiin HPP we have assumed an energy cost of zero. For Newcom, we have used the allowed tariff. Investment costs for Egiin HPP are as described in Section 4. No investment cost is assumed for Newcom, as this is considered to be included in its allowed energy tariff.
Table 9 Costs of existing and committed plants
Capital cost Energy cost
$/kW/year $/MWh
TPP#2 174.3 27.6
TPP#3 230.4 16.3
TPP#4 98.7 15.9
Darkhan TPP 221.4 18.2
Erdenet TPP 263.1 20.9
Egiin HPP 147.3 0.0
Newcom wind farm 0.0 95.0
Russian imports 20.4 18.0
Russian exports n/a 4.5
Least-cost analysis
Mongolia: Power Sector Development and South Gobi Development, Draft Report Economic Consulting Associates, October 2008 26
5.2.5 CES – South Gobi interconnection
Under all scenarios it is assumed that a new interconnector between the South Gobi region and the CES will be required in order to allow for power transfers between the regions and to provide a source of reserve supplies. A tendering round for the construction of a 275km double-circuit 220kV transmission line from Mandalgobi to the region on a Build-Transfer basis has recently been completed. A second phase from Mandalgobi to Ulaanbaatar is planned for 2012, giving a total line length of 642km. It is assumed that the reliable transfer capacity of this line is 150MW. Associated transmission losses are taken into account in comparing the overall costs of the scenarios23. Based on ECA’s 2006 analysis, the costs of this interconnector are estimated at around US$207 million in total, including lines and substations24.
5.3 Candidate plant costs
5.3.1 TPP#5
Investment costs
The assumed costs of TPP#5 are derived from those previously applied in the 2006 ECA strategy study, which in turn were derived from the 2002 Master Plan study. Since the completion of that study, capital costs of power plants have risen very substantially worldwide as a result of increasing costs of steel and other materials and rising supplier margins as demand exceeds supply for major equipment items. We have, therefore, updated these estimates by calculating a revised international cost based on our assumed cost of Tavan Tolgoi TPP and then adjusting this for the assumed use of Chinese technologies. A 2008 ESMAP report25 notes that the costs of Chinese coal-fired generators are approximately half to two-thirds those of international supplies, although these lower costs may not be fully available to other countries importing from China. We have made the assumption that Chinese technologies are available at two-thirds of the price of international technologies. A small reduction in the assumed thermal efficiency of TPP#5 has been applied relative to international levels to reflect the use of Chinese technology.
23 Transmission losses are not additive but rise with the square of the current. Transmitting higher quantities of power at a given voltage, therefore, results in higher proportional losses. Transmitting 150MW along a 220kV double circuit over 640km using 375mm2 aluminium conductors would result in losses of around 7%. 24 These cost estimates may be high. The 2004 tariff study undertaken by Synex assumed a cost of US$101,000/km for a double circuit 220kV line using 400mm2 conductors. This would imply a cost for the interconnector line of around US$65 million. The estimated cost of a substation with 125MW capacity is US$6.4 million or around US$38 million for an assumed total of six substations on the interconnector. This would make total interconnector costs around US$105 million. (Design of Electricity Prices for Generation, Transmission and Distribution for Mongolia: Final Report, Synex (21 December 2004). Report prepared for the World Bank and Energy Regulatory Authority.) 25 Study of Equipment Prices in the Power Sector, ESMAP (August 2008). Available at: http://esmap.org/filez/pubs/724200833229_power_prices.pdf
Least-cost analysis
Mongolia: Power Sector Development and South Gobi Development, Draft Report Economic Consulting Associates, October 2008 27
Fuel costs
We assume TPP#5 is supplied from the Baganuur mine and that the cost of supply will remain constant at current levels throughout the period of the analysis26.
5.3.2 Tavan Tolgoi TPP
Investment costs
The Tavan Tolgoi TPP is assumed to use sub-critical technology, with a minimum unit size of 300MW. Given the likely water shortages in the area, the use of air cooling is assumed which implies a small increase in capital costs and a reduction of around three percentage points in the plant’s thermal efficiency.
The reported cost of US$580/kW contained in MOFE’s 2008 presentation (see Section ) looks unrealistically low. As a comparison, the IEA reports the costs of similar units as ranging from US$1,066-1,215/kW at 2003 prices27. Since then, construction costs have risen by around 50%, implying current costs of around US$1,500-1,800. This is consistent with ESMAP’s 2008 report, which gives a market price for a new 300MW sub-critical coal plant in India of US$1,690/kW28.
Based on this, we have assumed a current international cost for a new coal-fired generator of the type envisaged for Tavan Tolgoi of US$1,700/kW and of US$1,110/kW for a new generator using Chinese technologies (on the basis that these are two-thirds of the cost of international technologies). The assumed thermal efficiency is 33% based on recent reported Chinese efficiencies, adjusted for the use of air cooling.
Fuel costs
Thermal coal for use in the Tavan Tolgoi TPP is priced at its estimated cost of production. The 1995 coal industry master plan study undertaken by IEEJ estimated the total capital costs of developing the Tavan Tolgoi mine to an annual production level of 11 Mtpa at US$1.23 billion (including infrastructure costs). Assuming a 10% discount rate and 20-year project life, this is equivalent to a levelised capital cost of around US$13/t at 1995 prices. Inflating by the US Producer Price Index, this would be equivalent to a current levelised capital cost of US$19/t. To this we add operating costs, arbitrarily estimated at US$1/t, to give a total cost of US$/20. This is somewhat above the estimated cost of production provided to us in discussions, of around US$10-12/t. The difference may reflect new estimates or may be a result of mining costs having increased by less than producer prices.
26 We understand that MME is planning to introduce a market-linked pricing system for coal production for electricity generation. We have not represented this as the details of the proposals are not known to us. The assumption that coal prices are based on production costs is also consistent with that applied for the Tavan Tolgoi TPP. 27 Projected Costs of Generating Electricity: 2005 Update, IEA (2005). 28 This includes a particulate removal system, but excludes FGD and selective catalytic reduction.
Least-cost analysis
Mongolia: Power Sector Development and South Gobi Development, Draft Report Economic Consulting Associates, October 2008 28
Alternatively, if the thermal coal could be exported then the opportunity cost of consuming it in the Tavan Tolgoi TPP is its market price in China less transport costs. As of late-September 2008, Shanxi coal with a heating content of 5,000 kcal/kg was priced at RMB800/t (US$115/t) for export from Qinhuangdao port in China29. Assuming transport and port handling costs totalling US$30-35/t, this would imply a market value for thermal coal from Tavan Tolgoi of around US$80/t.
It is also possible that the opportunity cost of coal for Tavan Tolgoi TPP could be as low as zero, if it uses the middlings resulting from the coal-washing process. Middlings form part of the coal discarded during the washing. This coal will be poorer quality than the washed coal, with higher ash and sulphur content. It is also very variable in its quality. These factors mean that it is generally only suitable for use in power generation at the washing site, or for disposal30. The downside is that the poor and variable quality of the coal and its more abrasive nature implies the use of higher cost technologies for burning it—such as fluidised bed combustion. It is common in practice to blend middlings with higher quality coal, which would raise the opportunity cost somewhat above zero.
The 1995 master plan shows the proportion of middlings at around 9% of total production. This implies around 0.9Mtpa of middlings would be available from an annual production of 10Mtpa31, enough to fuel a 200-250MW baseload coal power plant. Increased mine production if combined with coal washing would increase the quantity of middlings.
As a sensitivity, we have looked at the impacts of valuing coal from Tavan Tolgoi at an opportunity cost of zero.
Heat-only boiler costs
If Tavan Tolgoi TPP is developed then, in later years, there may be a need to install additional HOBs in Ulaanbaatar to meet growing heat demand. The costs of these boilers need to be taken into account when comparing the candidate plants. For this purpose, the HOB costs used in the 2006 ECA strategy study have been applied. This gives a cost of US$5.4/Gcal/hour for these boilers.
5.3.3 Oyu Tolgoi TPP
Investment costs
We have used the investment costs provided to us by Ivanhoe Mines, of around US$1,500/kW for an air-cooled, sub-critical generator using Chinese technology.
29 http://steelguru.com/news/index/2008/09/30/NjQ4OTk%3D/Coal_stocks_at_Chinese_ports_rise_further_and_prices_dip.html30 Disposal takes the form of large dumps. These are at risk of spontaneous combustion if not carefully constructed. 31 Projected annual production is 8.8Mtpa of thermal coal and 2.2Mtpa of coal for washing. Following washing, around 1.3Mtpa of coking quality coal would be available for export and 0.9Mtpa of middlings would be discarded.
Least-cost analysis
Mongolia: Power Sector Development and South Gobi Development, Draft Report Economic Consulting Associates, October 2008 29
This is somewhat higher than the estimated cost for Tavan Tolgoi TPP—which is consistent with the use of smaller units. Our assumed thermal efficiency is 32%, after adjusting for the use of air cooling.
Fuel costs
We have assumed coal for the Oyu Tolgoi TPP would be supplied from Tavan Tolgoi. There is a wide range for the possible cost of these coal supplies, depending on its assumed alternative use. We have used a cost of US$20/t, consistent with our estimated cost of production from Tavan Tolgoi.
The costs of the various plants using Chinese technologies are shown in Table 10, overleaf.
5.4 Dispatch
Dispatch arrangements will help determine which of the candidate plants is least-cost. In principle, current dispatch is based on minimising system costs. In practice, the constraints imposed by the need to meet heat demand and the inflexible nature of the older TPPs in particular mean that this is not always possible. The general approach at present appears to be to dispatch all generators other than TPP#4 at constant levels of output and to adjust the output of the more flexible TPP#4 to balance supply and demand. Where this adjustment is insufficient, imports are used for balancing.
Our assumptions on dispatch are as follows:
ο TPP#2, TPP#3, Darkhan TPP and Erdenent TPP are operated at current load factors of 80-85% during winter to meet heat demand and 40% or less during summer. These levels of output remain unchanged—the plants are assumed to have effectively no capacity to adjust output.
ο Newcom is considered to be a must-take generator and dispatched at full expected output. Egiin HPP is also dispatched at full expected output given its zero energy cost.
ο TPP#5 (when introduced) and TPP#4 are dispatched to meet heat demand, with a corresponding minimum level of electricity output.
ο Oyu Tolgoi TPP is dispatched to meet demand from the Oyu Tolgoi mine (assuming it is primarily dedicated to this use).
ο No minimum output is assumed for Tavan Tolgoi TPP.
ο Where the sum of these minimum outputs is insufficient to meet electricity demand, output is increased from those generators considered to have flexibility. Increases are from minimum output levels, determined as above, up to the level of output consistent with a
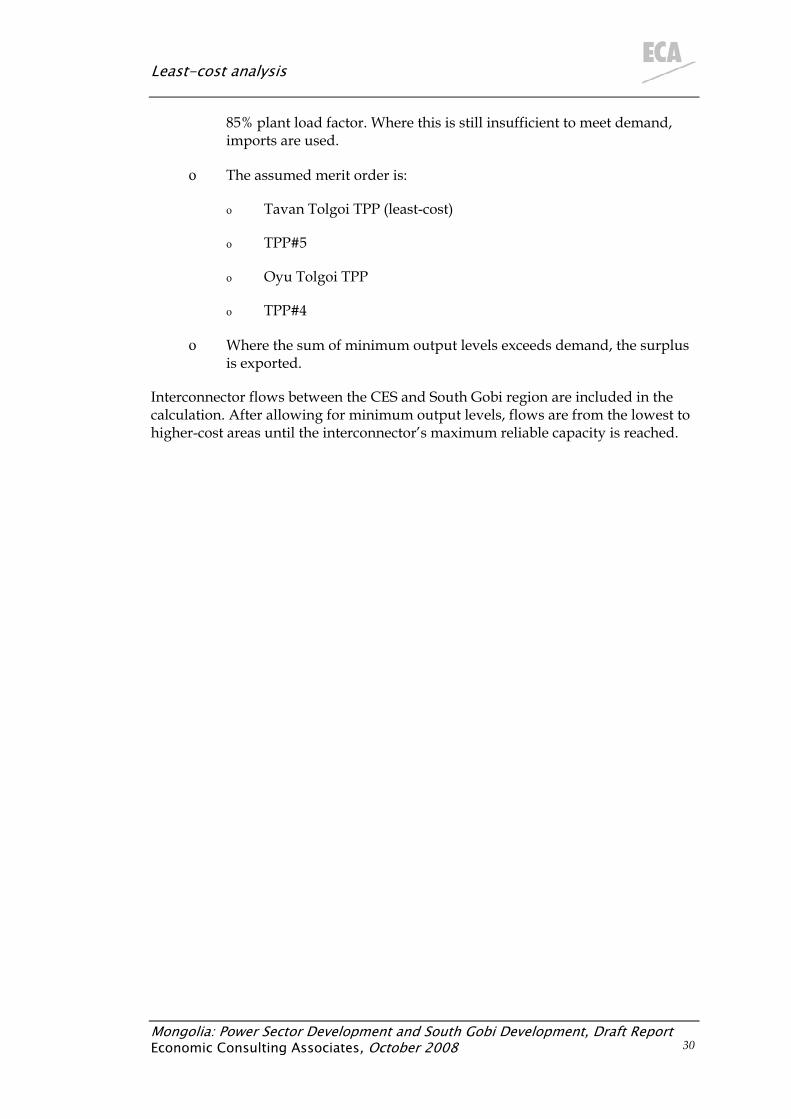
Least-cost analysis
Mongolia: Power Sector Development and South Gobi Development, Draft Report Economic Consulting Associates, October 2008 30
85% plant load factor. Where this is still insufficient to meet demand, imports are used.
ο The assumed merit order is:
ο Tavan Tolgoi TPP (least-cost)
ο TPP#5
ο Oyu Tolgoi TPP
ο TPP#4
ο Where the sum of minimum output levels exceeds demand, the surplus is exported.
Interconnector flows between the CES and South Gobi region are included in the calculation. After allowing for minimum output levels, flows are from the lowest to higher-cost areas until the interconnector’s maximum reliable capacity is reached.
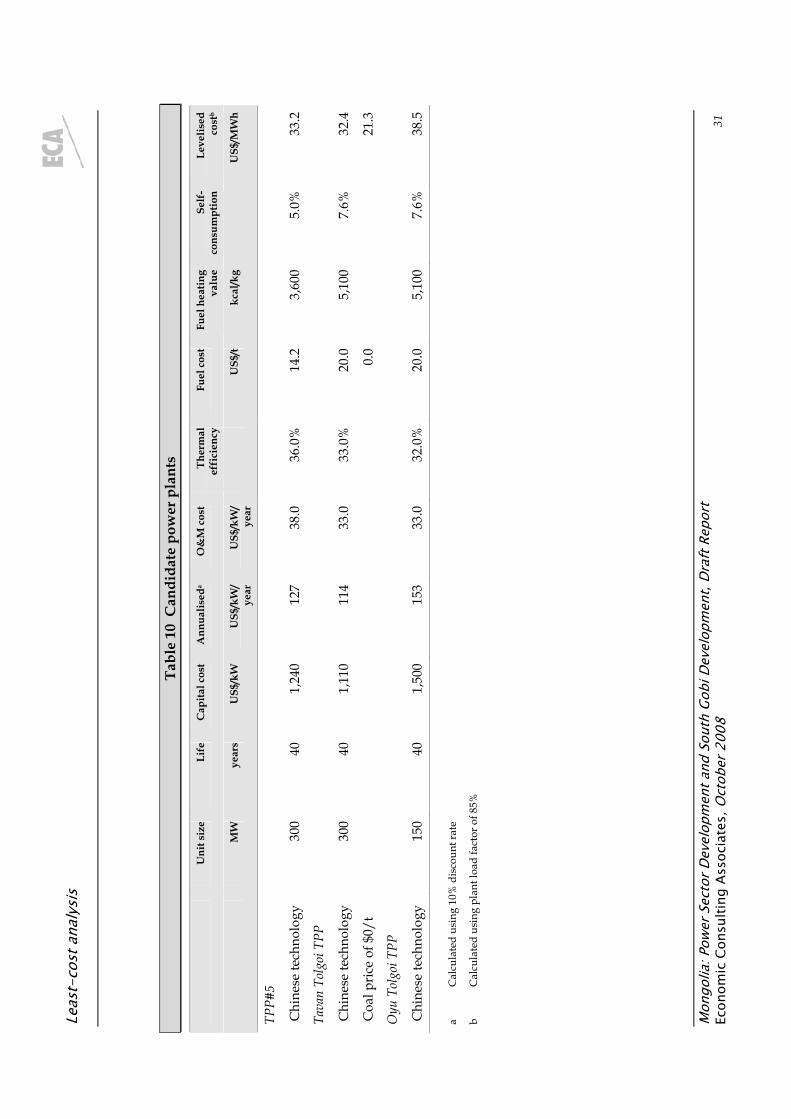
Leas
t-co
st a
naly
sis
Mon
golia
: Pow
er S
ecto
r Dev
elop
men
t and
Sou
th G
obi D
evel
opm
ent,
Draf
t Rep
ort
Econ
omic
Con
sulti
ng A
ssoc
iate
s, O
ctob
er 2
008
31
Tabl
e 10
Can
dida
te p
ower
pla
nts
U
nit s
ize
Life
C
apita
l cos
t A
nnua
lised
aO
&M
cos
t Th
erm
al
effi
cien
cy
Fuel
cos
t Fu
el h
eatin
g va
lue
Self
-co
nsum
ptio
n Le
velis
ed
cost
b
M
W
year
s U
S$/k
W
US$
/kW
/ ye
ar
US$
/kW
/ ye
ar
U
S$/t
kcal
/kg
U
S$/M
Wh
TPP#
5
Chi
nese
tech
nolo
gy
300
401,
240
127
38.0
36.0
%14
.23,
600
5.0%
33.2
Tava
n To
lgoi
TPP
Chi
nese
tech
nolo
gy
300
401,
110
114
33.0
33.0
%20
.05,
100
7.6%
32.4
Coa
l pri
ce o
f $0/
t
0.0
21.3
Oyu
Tol
goi T
PP
Chi
nese
tech
nolo
gy
150
401,
500
153
33.0
32.0
%20
.05,
100
7.6%
38.5
a C
alcu
late
d us
ing
10%
dis
coun
t rat
e
b C
alcu
late
d us
ing
plan
t loa
d fa
ctor
of 8
5%
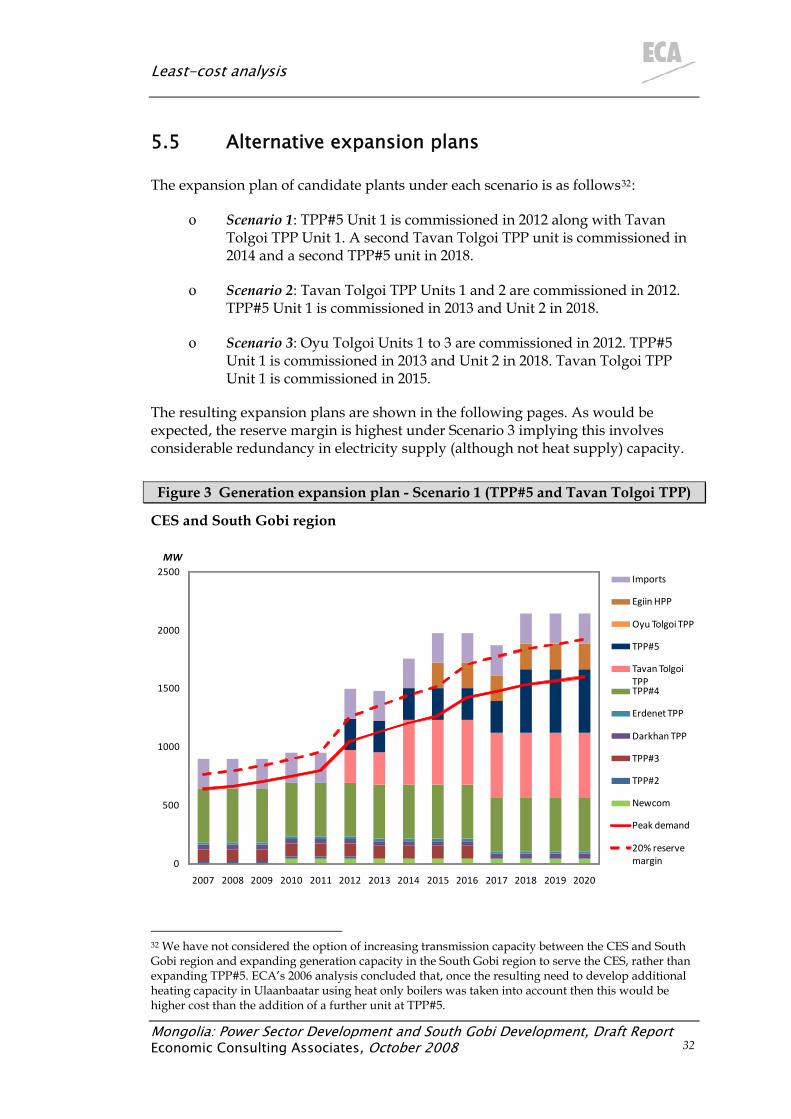
Least-cost analysis
5.5 Alternative expansion plans
The expansion plan of candidate plants under each scenario is as follows : 32
ο Scenario 1: TPP#5 Unit 1 is commissioned in 2012 along with Tavan Tolgoi TPP Unit 1. A second Tavan Tolgoi TPP unit is commissioned in 2014 and a second TPP#5 unit in 2018.
ο Scenario 2: Tavan Tolgoi TPP Units 1 and 2 are commissioned in 2012. TPP#5 Unit 1 is commissioned in 2013 and Unit 2 in 2018.
ο Scenario 3: Oyu Tolgoi Units 1 to 3 are commissioned in 2012. TPP#5 Unit 1 is commissioned in 2013 and Unit 2 in 2018. Tavan Tolgoi TPP Unit 1 is commissioned in 2015.
The resulting expansion plans are shown in the following pages. As would be expected, the reserve margin is highest under Scenario 3 implying this involves considerable redundancy in electricity supply (although not heat supply) capacity.
Figure 3 Generation expansion plan - Scenario 1 (TPP#5 and Tavan Tolgoi TPP)
CES and South Gobi region
0
500
1000
1500
2000
2500
2007 2008 2009 2010 2011 2012 2013 2014 2015 2016 2017 2018 2019 2020
MW
Imports
Egiin HPP
Oyu Tolgoi TPP
TPP#5
Tavan Tolgoi TPPTPP#4
Erdenet TPP
Darkhan TPP
TPP#3
TPP#2
Newcom
Peak demand
20% reserve margin
32 We have not considered the option of increasing transmission capacity between the CES and South Gobi region and expanding generation capacity in the South Gobi region to serve the CES, rather than expanding TPP#5. ECA’s 2006 analysis concluded that, once the resulting need to develop additional heating capacity in Ulaanbaatar using heat only boilers was taken into account then this would be higher cost than the addition of a further unit at TPP#5.
Mongolia: Power Sector Development and South Gobi Development, Draft Report 32 Economic Consulting Associates, October 2008
Least-cost analysis
CES alone
0
500
1000
1500
2000
2500
2007 2008 2009 2010 2011 2012 2013 2014 2015 2016 2017 2018 2019 2020
MW
Interconnector
Imports
Egiin HPP
TPP#5
TPP#4
Erdenet TPP
Darkhan TPP
TPP#3
Interconnector flows are shown where the CES is partly supplied from the South Gobi region. This does not occur in all years. Demand includes predicted transfers from the CES to the South Gobi region over the interconnector.
Figure 4 Generation expansion plan - Scenario 2 (Tavan Tolgoi TPP)
CES and South Gobi region
0
500
1000
1500
2000
2500
2007 2008 2009 2010 2011 2012 2013 2014 2015 2016 2017 2018 2019 2020
MW
Imports
Egiin HPP
Oyu Tolgoi TPP
TPP#5
Tavan Tolgoi TPPTPP#4
Erdenet TPP
Darkhan TPP
TPP#3
TPP#2
Newcom
Peak demand
20% reserve margin
Mongolia: Power Sector Development and South Gobi Development, Draft Report 33 Economic Consulting Associates, October 2008
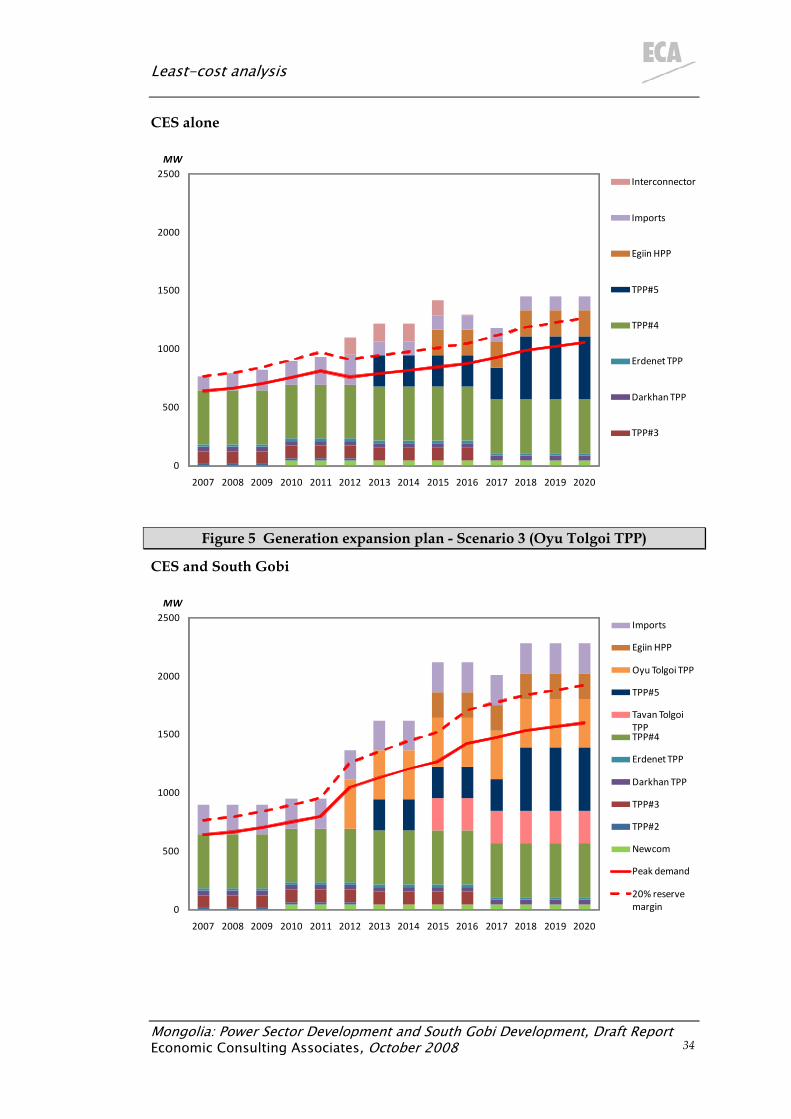
Least-cost analysis
CES alone
0
500
1000
1500
2000
2500
2007 2008 2009 2010 2011 2012 2013 2014 2015 2016 2017 2018 2019 2020
MW
Interconnector
Imports
Egiin HPP
TPP#5
TPP#4
Erdenet TPP
Darkhan TPP
TPP#3
Figure 5 Generation expansion plan - Scenario 3 (Oyu Tolgoi TPP)
CES and South Gobi
0
500
1000
1500
2000
2500
2007 2008 2009 2010 2011 2012 2013 2014 2015 2016 2017 2018 2019 2020
MW
Imports
Egiin HPP
Oyu Tolgoi TPP
TPP#5
Tavan Tolgoi TPPTPP#4
Erdenet TPP
Darkhan TPP
TPP#3
TPP#2
Newcom
Peak demand
20% reserve margin
Mongolia: Power Sector Development and South Gobi Development, Draft Report 34 Economic Consulting Associates, October 2008
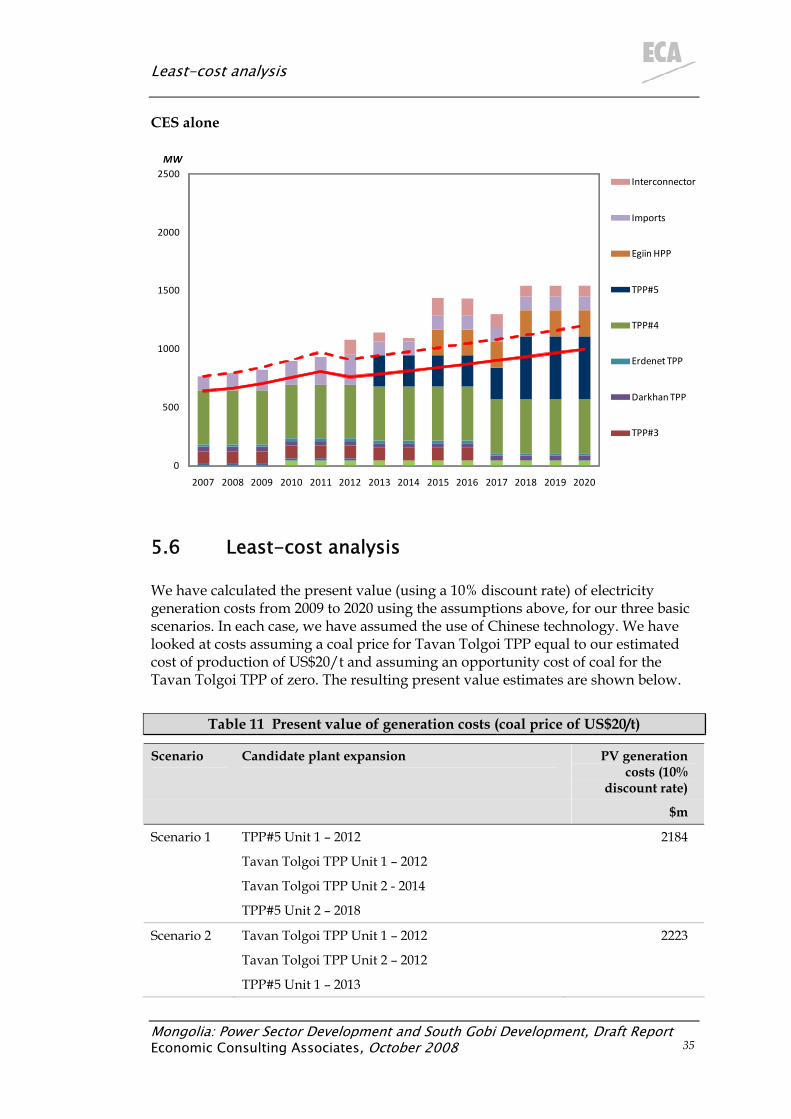
Least-cost analysis
CES alone
0
500
1000
1500
2000
2500
2007 2008 2009 2010 2011 2012 2013 2014 2015 2016 2017 2018 2019 2020
MW
Interconnector
Imports
Egiin HPP
TPP#5
TPP#4
Erdenet TPP
Darkhan TPP
TPP#3
5.6 Least-cost analysis
We have calculated the present value (using a 10% discount rate) of electricity generation costs from 2009 to 2020 using the assumptions above, for our three basic scenarios. In each case, we have assumed the use of Chinese technology. We have looked at costs assuming a coal price for Tavan Tolgoi TPP equal to our estimated cost of production of US$20/t and assuming an opportunity cost of coal for the Tavan Tolgoi TPP of zero. The resulting present value estimates are shown below.
Table 11 Present value of generation costs (coal price of US$20/t)
Scenario Candidate plant expansion PV generation costs (10%
discount rate)
$m
2184 Scenario 1 TPP#5 Unit 1 – 2012
Tavan Tolgoi TPP Unit 1 – 2012
Tavan Tolgoi TPP Unit 2 - 2014
TPP#5 Unit 2 – 2018
Scenario 2 Tavan Tolgoi TPP Unit 1 – 2012 2223
Tavan Tolgoi TPP Unit 2 – 2012
TPP#5 Unit 1 – 2013
Mongolia: Power Sector Development and South Gobi Development, Draft Report 35 Economic Consulting Associates, October 2008
Least-cost analysis
Mongolia: Power Sector Development and South Gobi Development, Draft Report Economic Consulting Associates, October 2008 36
Scenario Candidate plant expansion PV generation costs (10%
discount rate)
$m
TPP#5 Unit 2 – 2018
Scenario 3 Oyu Tolgoi Units 1-3 – 2012
TPP#5 Unit 1 – 2013
Tavan Tolgoi TPP Unit 1 – 2015
TPP#5 Unit 2 – 2018
2202
Table 12 Present value of generation costs (coal price of US$0/t)
Scenario Candidate plant expansion PV generation costs (10%
discount rate)
$m
Scenario 1 TPP#5 Unit 1 – 2012
Tavan Tolgoi TPP Unit 1 – 2012
Tavan Tolgoi TPP Unit 2 - 2014
TPP#5 Unit 2 – 2018
2029
Scenario 2 Tavan Tolgoi TPP Unit 1 – 2012
Tavan Tolgoi TPP Unit 2 – 2012
TPP#5 Unit 1 – 2013
TPP#5 Unit 2 – 2018
2050
Scenario 3 Oyu Tolgoi Units 1-3 – 2012
TPP#5 Unit 1 – 2013
Tavan Tolgoi TPP Unit 1 – 2015
TPP#5 Unit 2 – 2018
2150
As can be seen, the least-cost option with an assumed Tavan Tolgoi coal price of US$20/t is to develop TPP#5 and Tavan Tolgoi together. This offers savings with a present value of around US$39 million relative to scenario 2 and US$18 million relative to scenario 3. Put another way, generation costs are around 2% higher under scenario 2 than under scenario 1 and around 1% higher under scenario 3. However, the differences are small and minor changes in the underlying assumptions could easily change the rank ordering.
If, instead, a coal cost of zero is assumed, then scenario 1 and 2 are both significantly lower cost then scenario 3, with scenario 1 remaining slightly lower cost than scenario 1, although again the differences are insignificant. This may understate the performance of scenario 1 relative to scenario 2, as our calculation makes no
Least-cost analysis
Mongolia: Power Sector Development and South Gobi Development, Draft Report Economic Consulting Associates, October 2008 37
allowance for the costs of coal that may be blended with middlings, nor for any reduction in performance or increase in plant costs that may result from the use of middlings.
The somewhat surprising result that adopting a coal cost of zero for Tavan Tolgoi TPP does not lead to scenario 2 being cheaper than alternative expansion plans despite the earlier introduction of Tavan Tolgoi TPP units is due to the relatively low load factors achieved by Tavan Tolgoi TPP in its first years. These low load factors are a result of the need to dispatch more expensive CHPs to meet heating demand in winter in preference to Tavan Tolgoi TPP. This reduces the opportunities for Tavan Tolgoi TPP to be used to meet electricity demand on the CES.
5.7 Delay risks and costs
There are very significant differences between the candidate plants in respect of the risk of delays in commissioning:
ο TPP#5: A tendering process is underway for the development of the first unit of this plant on a BOT basis. However, a review of the tender documents suggests that it may take an extended time to complete the evaluation and negotiation process due to the use of model documents designed for a turnkey rather than BOT contract and an invitation to bidders to propose their own financing and contractual arrangements. This can be expected to result in very different bids being received making comparison difficult as well as a need for lengthy negotiations with the preferred bidder.
ο Tavan Tolgoi TPP: Development of this plant is far less advanced than that of TPP#5 and Oyu Tolgoi TPP. It will be very challenging to complete the procurement process in time for commissioning of the first units by 2012 when they would be needed to meet demand under scenarios 1 and 2.
ο Oyu Tolgoi TPP: The advanced stage of development and the apparent commitment and ability of Ivanhoe Mines and Rio Tinto to fund the power plant from their own resources means that we consider it likely to be completed by 2012.
To assess the impacts of potential delays on the choice between the different expansion plan scenarios we have re-estimated the costs of each scenario, assuming that the commissioning of the first unit of TPP#5 cannot occur before 2013 (ie, a potential one year delay) and of Tavan Tolgoi TPP before 2014 (ie, a potential two year delay). No delay in the earliest commissioning date of Oyu Tolgoi TPP has been assumed.
Under scenarios 1 and 2, delays in commissioning result in unserved demand in the South Gobi region. We have assumed that this represents lost production from the Oyu Tolgoi mine. The costs of such losses to Mongolia has been estimated at US$0.525/lb of copper produced, comprised of an assumed copper price of
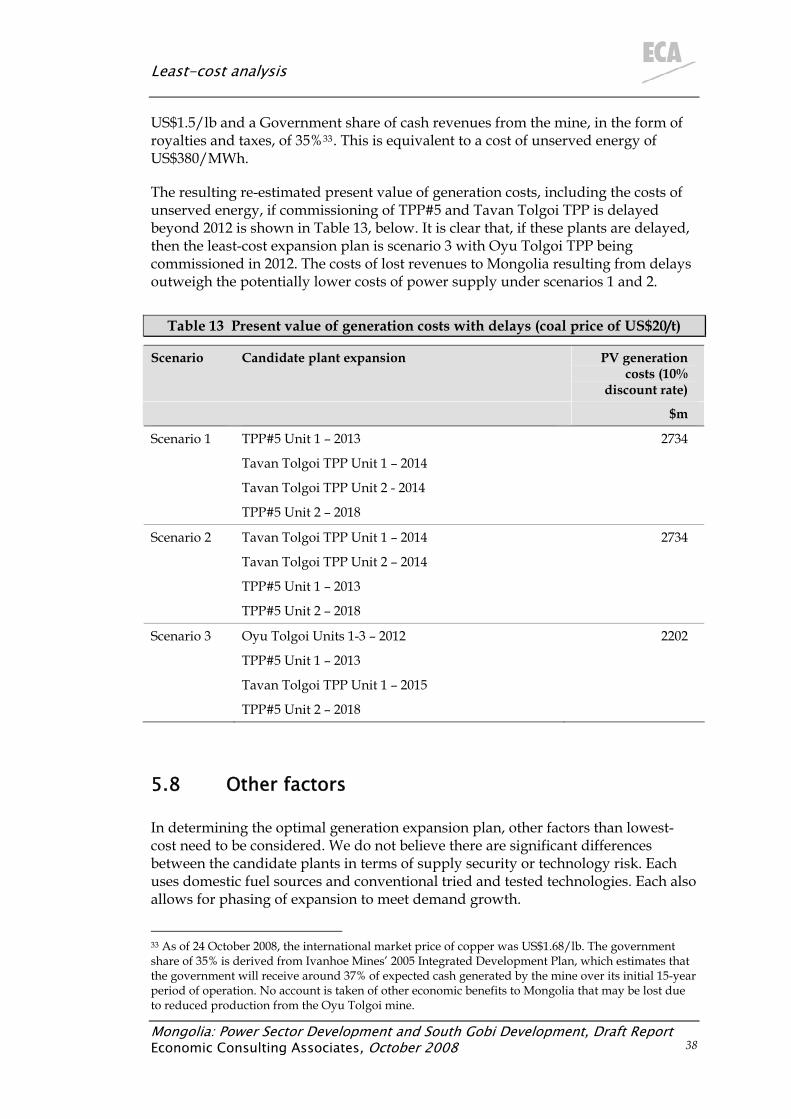
Least-cost analysis
Mongolia: Power Sector Development and South Gobi Development, Draft Report Economic Consulting Associates, October 2008 38
US$1.5/lb and a Government share of cash revenues from the mine, in the form of royalties and taxes, of 35%33. This is equivalent to a cost of unserved energy of US$380/MWh.
The resulting re-estimated present value of generation costs, including the costs of unserved energy, if commissioning of TPP#5 and Tavan Tolgoi TPP is delayed beyond 2012 is shown in Table 13, below. It is clear that, if these plants are delayed, then the least-cost expansion plan is scenario 3 with Oyu Tolgoi TPP being commissioned in 2012. The costs of lost revenues to Mongolia resulting from delays outweigh the potentially lower costs of power supply under scenarios 1 and 2.
Table 13 Present value of generation costs with delays (coal price of US$20/t)
Scenario Candidate plant expansion PV generation costs (10%
discount rate)
$m
Scenario 1 TPP#5 Unit 1 – 2013
Tavan Tolgoi TPP Unit 1 – 2014
Tavan Tolgoi TPP Unit 2 - 2014
TPP#5 Unit 2 – 2018
2734
Scenario 2 Tavan Tolgoi TPP Unit 1 – 2014
Tavan Tolgoi TPP Unit 2 – 2014
TPP#5 Unit 1 – 2013
TPP#5 Unit 2 – 2018
2734
Scenario 3 Oyu Tolgoi Units 1-3 – 2012
TPP#5 Unit 1 – 2013
Tavan Tolgoi TPP Unit 1 – 2015
TPP#5 Unit 2 – 2018
2202
5.8 Other factors
In determining the optimal generation expansion plan, other factors than lowest-cost need to be considered. We do not believe there are significant differences between the candidate plants in terms of supply security or technology risk. Each uses domestic fuel sources and conventional tried and tested technologies. Each also allows for phasing of expansion to meet demand growth.
33 As of 24 October 2008, the international market price of copper was US$1.68/lb. The government share of 35% is derived from Ivanhoe Mines’ 2005 Integrated Development Plan, which estimates that the government will receive around 37% of expected cash generated by the mine over its initial 15-year period of operation. No account is taken of other economic benefits to Mongolia that may be lost due to reduced production from the Oyu Tolgoi mine.
Least-cost analysis
Mongolia: Power Sector Development and South Gobi Development, Draft Report Economic Consulting Associates, October 2008 39
A benefit of developing increased generation quantities in the South Gobi region is that this would avoid increases in air pollution in Ulaanbaatar which would be associated with the development of TPP#5. However, the development of TPP#5 is only delayed by one year and so these benefits are insignificant.
Earlier development of the Tavan Tolgoi TPP may facilitate its concurrent development for export purposes, using the middlings and thermal coal produced from the mine.
Overall, these other factors seem to marginally favour the earlier development of Tavan Tolgoi TPP over TPP#5 (ie, scenario 2).
5.9 Preliminary conclusions
We estimate that the least-cost expansion plan is that represented by scenario 1, with commissioning of both TPP#5 and Tavan Tolgoi TPP in 2012 and no development of Oyu Tolgoi TPP. However, there are risks to Mongolia under this scenario. If delays in commissioning of these two plants occur, the costs to Mongolia in terms of lost revenues from mining production greatly outweigh the savings in terms of reduced power generation costs relative to scenario 3, involving the early commissioning of Oyu Tolgoi TPP which seems to be the plant least likely to be affected by delays.
Our preliminary conclusions are, therefore:
ο Scenario 1 is slightly lower cost than the other cases examined. Under this, TPP#5 and Tavan Tolgoi TPP would be commissioned in 2012.
ο However, if the commissioning of either TPP#5 or Tavan Tolgoi TPP is delayed beyond 2012, then it would be lower-cost (allowing for the costs of unserved energy) to adopt scenario 3, with Oyu Tolgoi TPP being commissioned in 2012 followed by TPP#5 and then Tavan Tolgoi TPP.
The speed with which TPP#5 and Tavan Tolgoi TPP can be developed is, therefore, critical to the expansion plan to be adopted. Under Scenario 1, financial close for TPP#5 and Tavan Tolgoi TPP will need to be achieved by early-2009, assuming a three-year build time in each case. This is a short time given our expectations of the challenges that will be faced in selecting a preferred bidder and negotiating the contractual package for TPP#5 and the limited state of development of Tavan Tolgoi TPP.
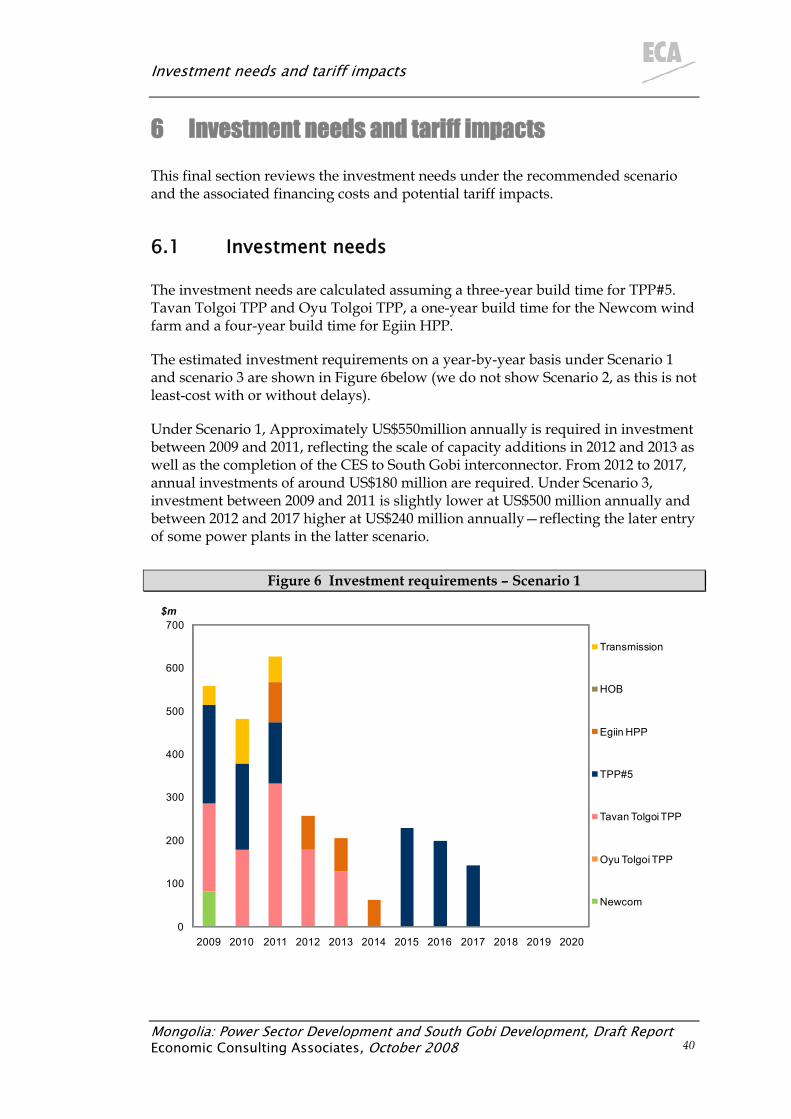
Investment needs and tariff impacts
6 Investment needs and tariff impacts This final section reviews the investment needs under the recommended scenario and the associated financing costs and potential tariff impacts.
6.1 Investment needs
The investment needs are calculated assuming a three-year build time for TPP#5. Tavan Tolgoi TPP and Oyu Tolgoi TPP, a one-year build time for the Newcom wind farm and a four-year build time for Egiin HPP.
The estimated investment requirements on a year-by-year basis under Scenario 1 and scenario 3 are shown in Figure 6below (we do not show Scenario 2, as this is not least-cost with or without delays).
Under Scenario 1, Approximately US$550million annually is required in investment between 2009 and 2011, reflecting the scale of capacity additions in 2012 and 2013 as well as the completion of the CES to South Gobi interconnector. From 2012 to 2017, annual investments of around US$180 million are required. Under Scenario 3, investment between 2009 and 2011 is slightly lower at US$500 million annually and between 2012 and 2017 higher at US$240 million annually—reflecting the later entry of some power plants in the latter scenario.
Figure 6 Investment requirements – Scenario 1
0
100
200
300
400
500
600
700
2009 2010 2011 2012 2013 2014 2015 2016 2017 2018 2019 2020
$m
Transmission
HOB
Egiin HPP
TPP#5
Tavan Tolgoi TPP
Oyu Tolgoi TPP
Newcom
Mongolia: Power Sector Development and South Gobi Development, Draft Report 40 Economic Consulting Associates, October 2008
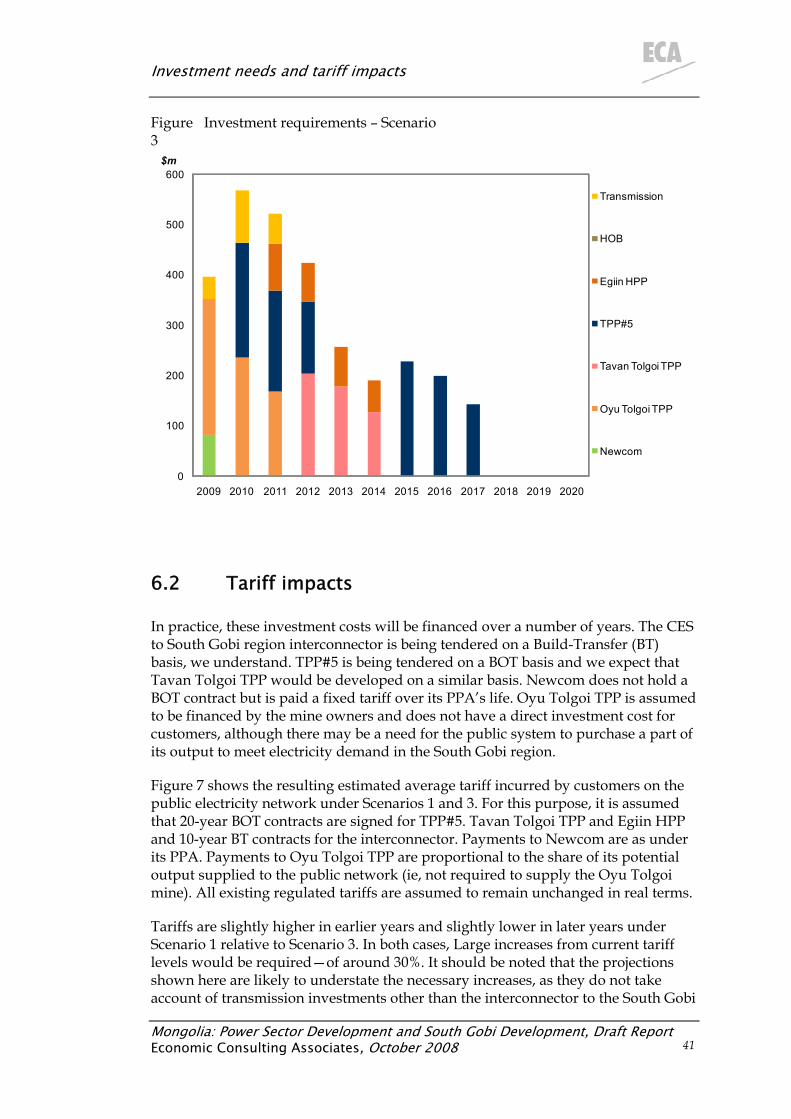
Investment needs and tariff impacts
Figure Investment requirements – Scenario 3
0
100
200
300
400
500
600
2009 2010 2011 2012 2013 2014 2015 2016 2017 2018 2019 2020
$m
Transmission
HOB
Egiin HPP
TPP#5
Tavan Tolgoi TPP
Oyu Tolgoi TPP
Newcom
6.2 Tariff impacts
In practice, these investment costs will be financed over a number of years. The CES to South Gobi region interconnector is being tendered on a Build-Transfer (BT) basis, we understand. TPP#5 is being tendered on a BOT basis and we expect that Tavan Tolgoi TPP would be developed on a similar basis. Newcom does not hold a BOT contract but is paid a fixed tariff over its PPA’s life. Oyu Tolgoi TPP is assumed to be financed by the mine owners and does not have a direct investment cost for customers, although there may be a need for the public system to purchase a part of its output to meet electricity demand in the South Gobi region.
Figure 7 shows the resulting estimated average tariff incurred by customers on the public electricity network under Scenarios 1 and 3. For this purpose, it is assumed that 20-year BOT contracts are signed for TPP#5. Tavan Tolgoi TPP and Egiin HPP and 10-year BT contracts for the interconnector. Payments to Newcom are as under its PPA. Payments to Oyu Tolgoi TPP are proportional to the share of its potential output supplied to the public network (ie, not required to supply the Oyu Tolgoi mine). All existing regulated tariffs are assumed to remain unchanged in real terms.
Tariffs are slightly higher in earlier years and slightly lower in later years under Scenario 1 relative to Scenario 3. In both cases, Large increases from current tariff levels would be required—of around 30%. It should be noted that the projections shown here are likely to understate the necessary increases, as they do not take account of transmission investments other than the interconnector to the South Gobi
Mongolia: Power Sector Development and South Gobi Development, Draft Report 41 Economic Consulting Associates, October 2008
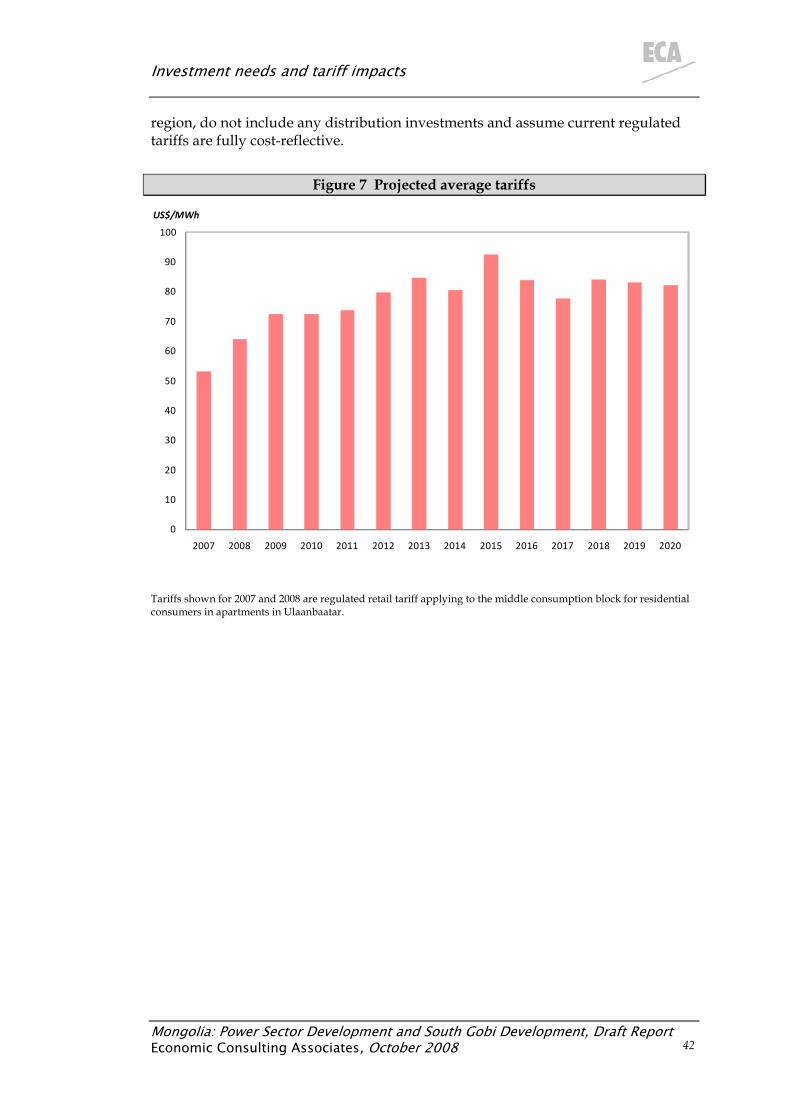
Investment needs and tariff impacts
region, do not include any distribution investments and assume current regulated tariffs are fully cost-reflective.
Figure 7 Projected average tariffs
0
10
20
30
40
50
60
70
80
90
100
2007 2008 2009 2010 2011 2012 2013 2014 2015 2016 2017 2018 2019 2020
US$/MWh
Tariffs shown for 2007 and 2008 are regulated retail tariff applying to the middle consumption block for residential consumers in apartments in Ulaanbaatar.
Mongolia: Power Sector Development and South Gobi Development, Draft Report 42 Economic Consulting Associates, October 2008
Annex: List of meetings
Mongolia: Power Sector Development and South Gobi Development, Draft Report Economic Consulting Associates, October 2008 43
A1 List of meetings ο World Bank
ο Ministry of Fuel and Energy (Energy Planning and Co-ordination Department / Fuel Policy and Regulation Department)
ο Energy Regulatory Authority (Prices and Tariffs Department / Licensing Department)
ο National Dispatching Center JSC
ο Central Regional Electricity Transmission Grid JSC
ο Ulaanbaatar District Heating Distribution Network JSC
ο EPRC Project team
ο Energy Research and Development Center
ο National Renewable Energy Center
ο Ivanhoe Resources
ο Energy Resources Company
ο MonEnergy Development Corporation / Petrovis /Siemens
ο Tuul Songino Water Resource Complex JSC