Embed Size (px)
Citation preview
Monitoring and Diagnosing Oracle RAC Performance with Oracle Enterprise Manager Kai Yu, Orlando GallegosDell Oracle Solutions Engineering
About Author
• Kai YuSenior System Engineer, Dell Oracle Solutions Engineering Lab– 15 years Oracle DBA and Solutions Engineering– Specialized in Oracle RAC, Oracle EBS and OVM– Oracle Technology articles author and frequent presenter– IOUG Oracle RAC SIG President (2009-2010)– IOUG Collaborate 10//11 Boot Camps Owner
Global Marketing
• Orlando GallegosDell Oracle Solutions Engineering Lab– 5 years Oracle DBA and Solutions Engineering– Specialized in system, networking and storage migrations
2
Agenda
• Performance Management: Challenges and Solutions• Database Performance Monitoring and Diagnosis Tools• RAC Database Monitoring and Diagnosis with Enterprise
Manager • Examples of RAC Performance Monitoring & Diagnosis • QA
Global Marketing
QA
Performance Management: Challenges and Solutions• Performance Management Challenges
– Complexity of Applications and the Workloads – Complexity of RAC Architecture
Servers, OS, network, storage, Oracle RAC/Database– High Requirements and Expectations of Database Performance– Performance Management for 24 x 7 Operation
C t h th f bl i l ti
Global Marketing
Catch the performance problem in real timeDiagnose the performance problem afterwardsManage a large number of production databases
• Performance Management : from ART to Engineering– Common Performance Problems Symptoms
Slow response timeLow database throughput bottlenecks
Performance Management: Challenges and Solutions
– Performance Management Work FlowNon-stop monitoring and statistics collectingIdentifying the bottlenecks and issue alertsDiagnosing the root cause of the bottlenecksComing up the tuning recommendationsCombine proactive and reactive approaches
Global Marketing
p pp
– Performance Monitoring and Statistics CollectingReal time monitoringHistorical performance playbackAutomatic monitoring and performance alertsPerformance Statistics Gatheringsystem, sessions, SQL execution, Wait events, DB timeStore the statistics for performance analysis and diagnosis
RAC Performance Management: Challenges and Methods
– Diagnosis of Performance IssuesAnalyze the collected statistics Identify the root cause of performance issuesRecommend the correction method and quantify the benefitsNotification of diagnosis results through automatic alertsAutomatic performance diagnosis: Proactive approach Manual performance diagnosis: Reactive approach
Global Marketing
• Performance Management Tools– Oracle Database Enterprise Edition
Generate cumulative performance data in dynamic viewsVarious Performance features
– Oracle Diagnostics PackBuilt into the core database engine and Enterprise ManagerA complete database performance management solutionCluster aware: specific features designed for RACIncluding AWR, ADDM and ASH
RAC Performance Management Tools
– Oracle Database Tuning packSQL Tuning advisor, SQL access Advisor
– Automatic Workload Repository(AWR)AWR collects database statistics thought AWR snapshotsAWR reports and AWR compare Period reportFoundation of all self tuning and managementRAC Aware: Instance and Database level
Global Marketing
– Active Session History ASH samples the state of all active session every secondHelp diagnose the short lived performance problem
– Automatic Database Diagnostic Monitor (ADDM)Examine and analyze statistics data captured by AWRDiagnosis through ADDM findings
Root cause analysis, Correction recommendationsImpact and benefits analysis
RAC Performance Management Tools
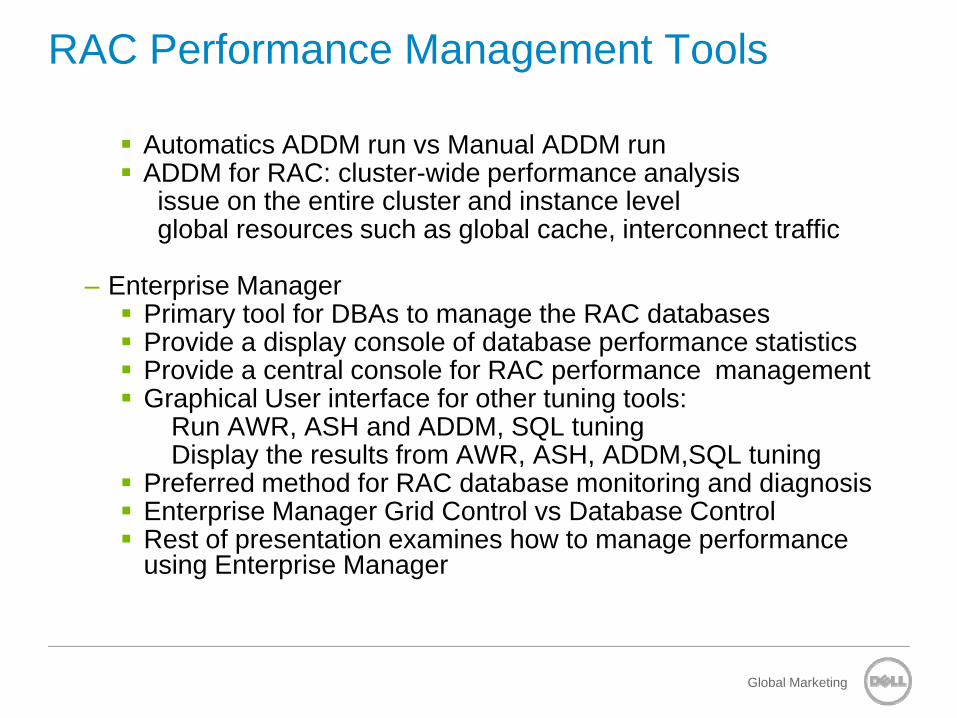
Automatics ADDM run vs Manual ADDM runADDM for RAC: cluster-wide performance analysisissue on the entire cluster and instance levelglobal resources such as global cache, interconnect traffic
– Enterprise Manager Primary tool for DBAs to manage the RAC databasesProvide a display console of database performance statistics
Global Marketing
Provide a central console for RAC performance managementGraphical User interface for other tuning tools:
Run AWR, ASH and ADDM, SQL tuningDisplay the results from AWR, ASH, ADDM,SQL tuning
Preferred method for RAC database monitoring and diagnosisEnterprise Manager Grid Control vs Database Control Rest of presentation examines how to manage performance using Enterprise Manager
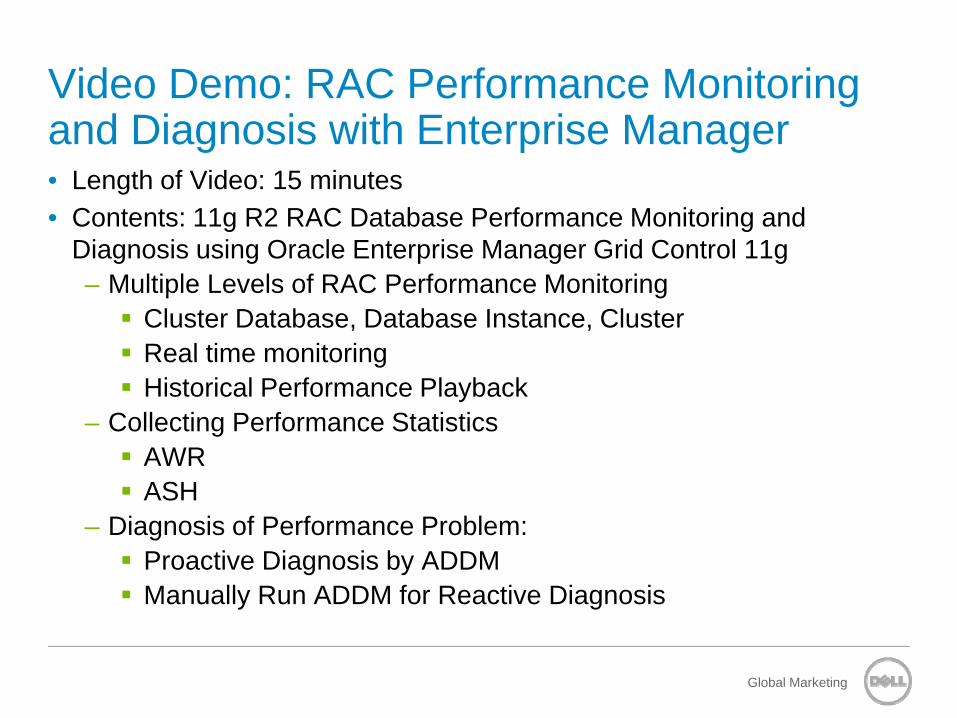
Video Demo: RAC Performance Monitoring and Diagnosis with Enterprise Manager• Length of Video: 15 minutes • Contents: 11g R2 RAC Database Performance Monitoring and
Diagnosis using Oracle Enterprise Manager Grid Control 11g – Multiple Levels of RAC Performance Monitoring
Cluster Database, Database Instance, ClusterReal time monitoring
Global Marketing
Real time monitoringHistorical Performance Playback
– Collecting Performance StatisticsAWRASH
– Diagnosis of Performance Problem:Proactive Diagnosis by ADDMManually Run ADDM for Reactive Diagnosis
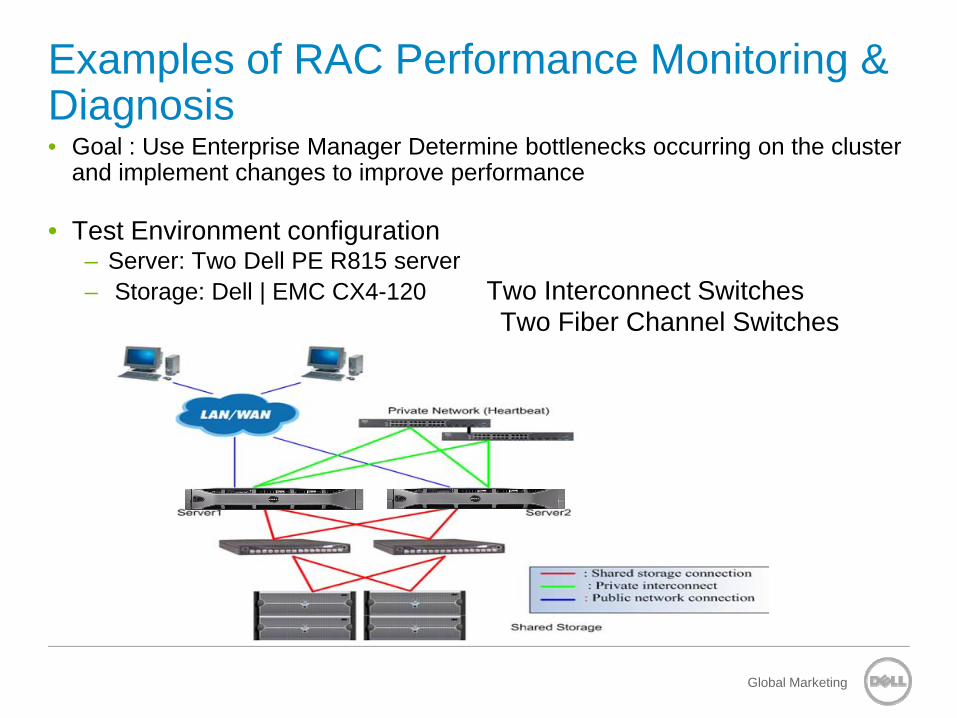
Examples of RAC Performance Monitoring & Diagnosis • Goal : Use Enterprise Manager Determine bottlenecks occurring on the cluster
and implement changes to improve performance
• Test Environment configuration– Server: Two Dell PE R815 server – Storage: Dell | EMC CX4-120 Two Interconnect Switches
Two Fiber Channel Switches
Global Marketing
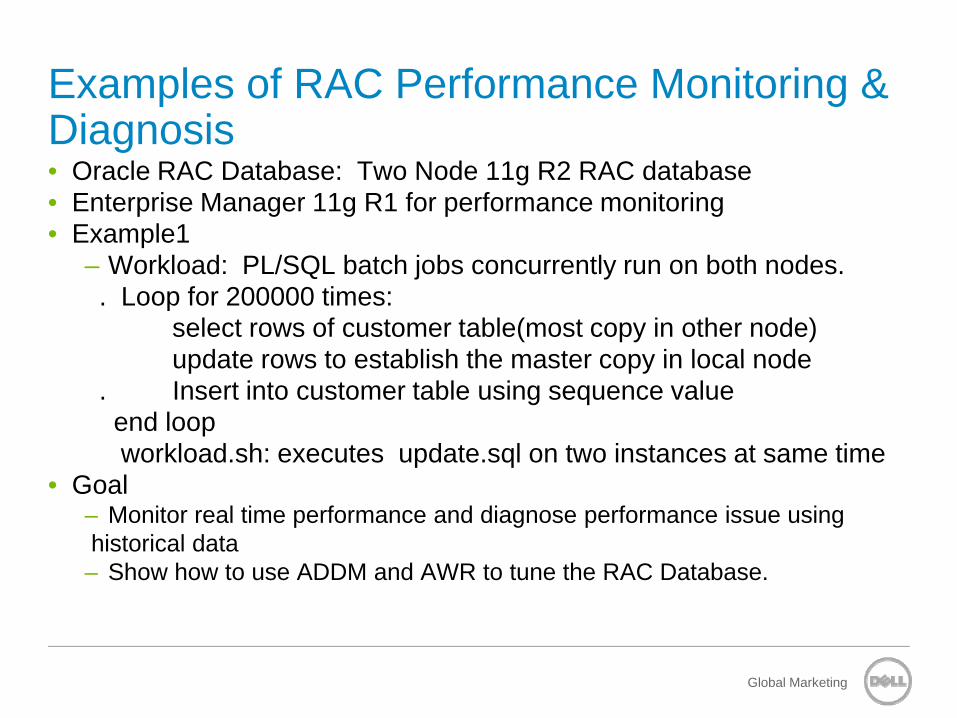
Examples of RAC Performance Monitoring & Diagnosis • Oracle RAC Database: Two Node 11g R2 RAC database• Enterprise Manager 11g R1 for performance monitoring• Example1
– Workload: PL/SQL batch jobs concurrently run on both nodes. . Loop for 200000 times:
select rows of customer table(most copy in other node)update rows to establish the master copy in local node
Global Marketing
update rows to establish the master copy in local node. Insert into customer table using sequence valueend loopworkload.sh: executes update.sql on two instances at same time
• Goal– Monitor real time performance and diagnose performance issue using historical data – Show how to use ADDM and AWR to tune the RAC Database.
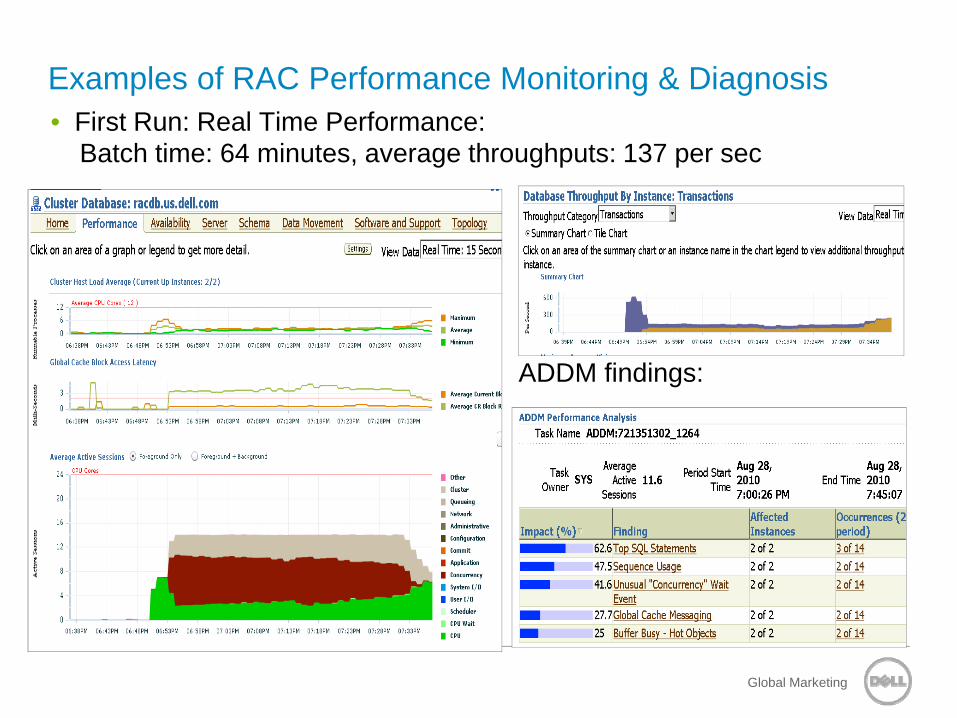
Examples of RAC Performance Monitoring & Diagnosis • First Run: Real Time Performance:
Batch time: 64 minutes, average throughputs: 137 per sec
Global Marketing
ADDM findings:
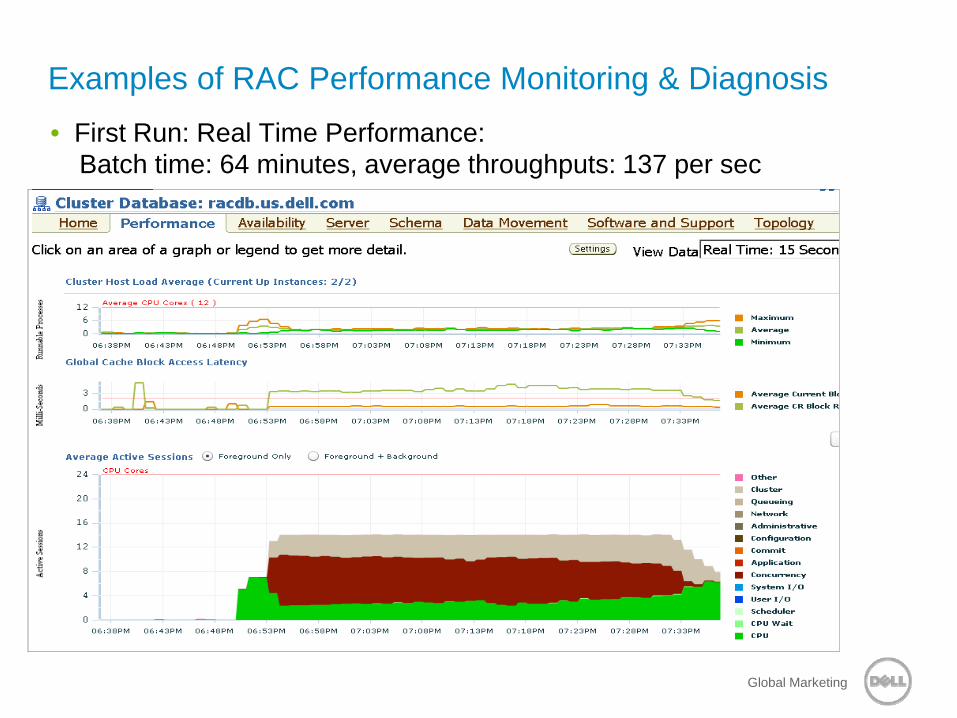
Examples of RAC Performance Monitoring & Diagnosis • First Run: Real Time Performance:
Batch time: 64 minutes, average throughputs: 137 per sec
Global Marketing
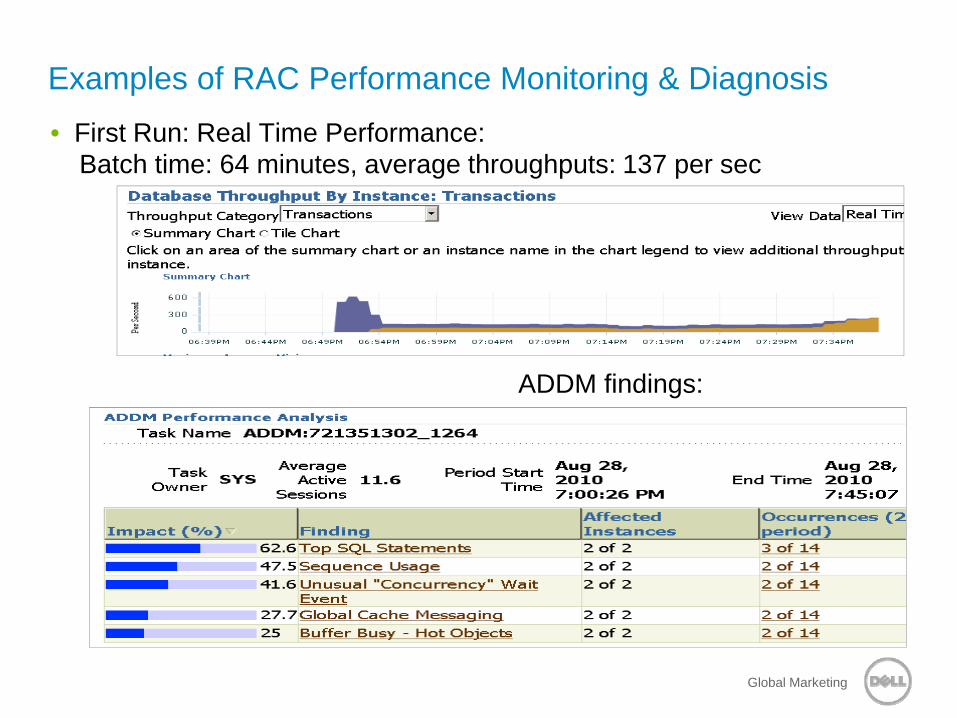
Examples of RAC Performance Monitoring & Diagnosis • First Run: Real Time Performance:
Batch time: 64 minutes, average throughputs: 137 per sec
Global Marketing
ADDM findings:
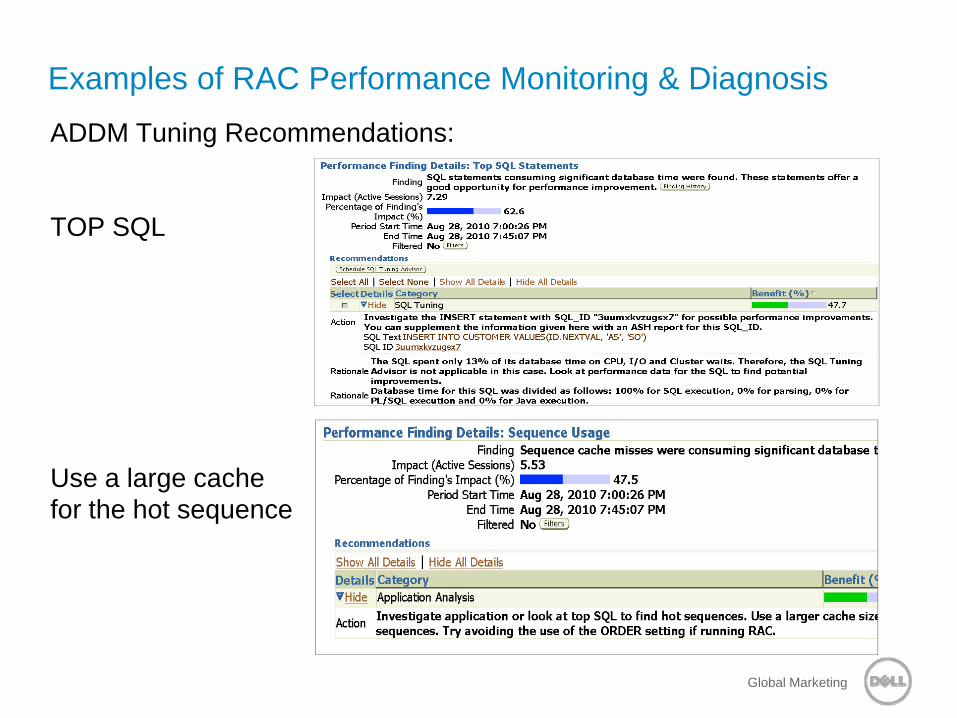
Examples of RAC Performance Monitoring & Diagnosis ADDM Tuning Recommendations:
TOP SQL
Global Marketing
Use a large cache for the hot sequence
Examples of RAC Performance Monitoring & Diagnosis
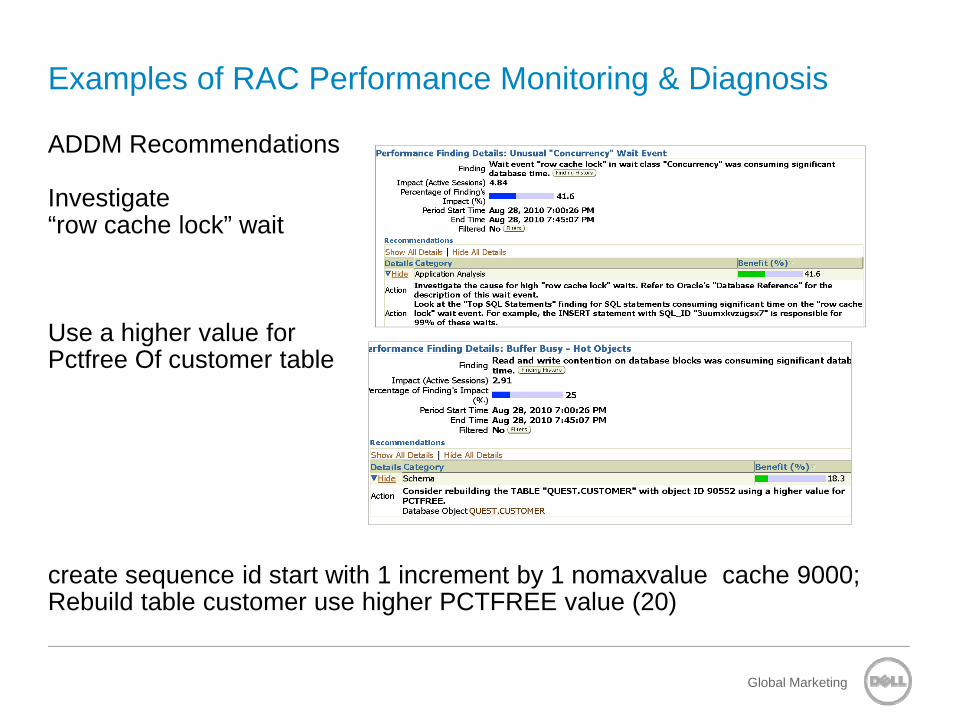
ADDM Recommendations
Investigate “row cache lock” wait
Use a higher value for Pctfree Of customer table
Global Marketing
Pctfree Of customer table
create sequence id start with 1 increment by 1 nomaxvalue cache 9000; Rebuild table customer use higher PCTFREE value (20)
Examples of RAC Performance Monitoring & Diagnosis
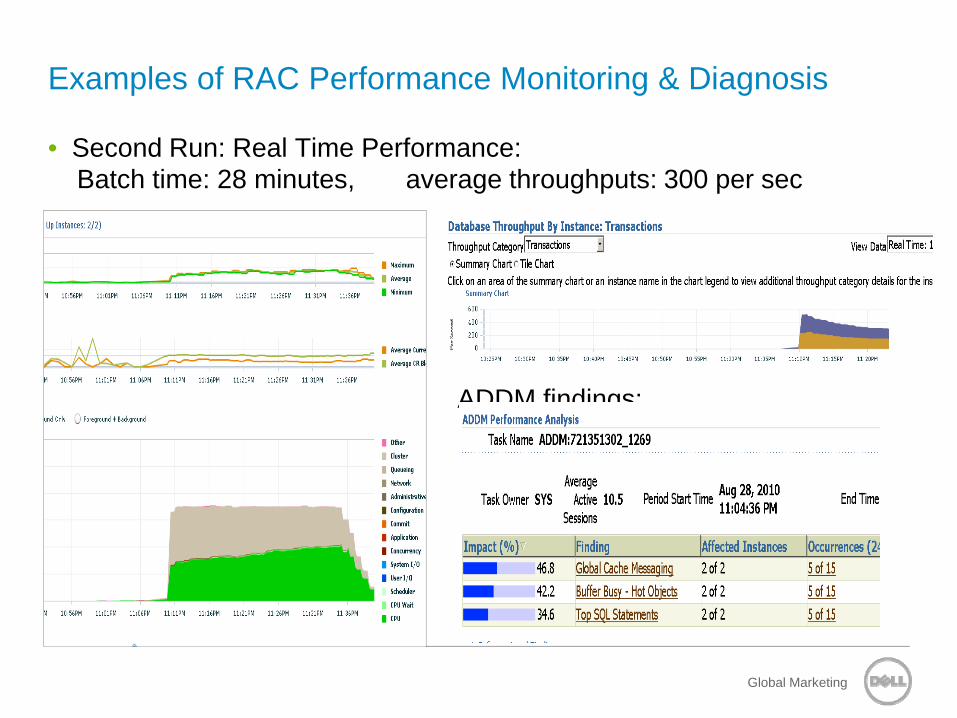
• Second Run: Real Time Performance: Batch time: 28 minutes, average throughputs: 300 per sec
Global Marketing
ADDM findings:
Examples of RAC Performance Monitoring & Diagnosis
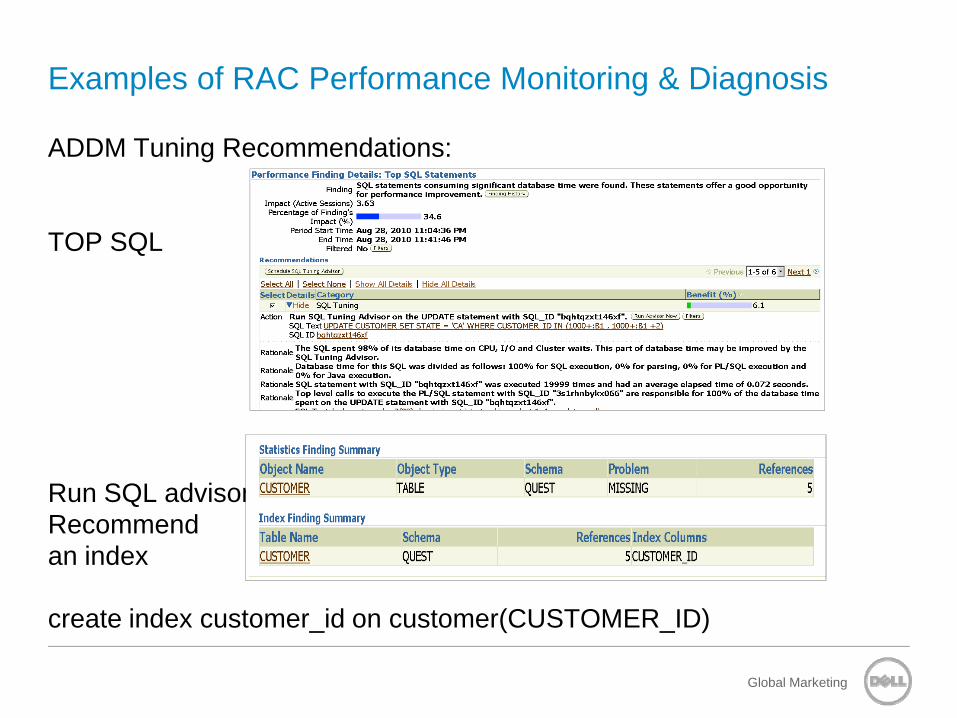
ADDM Tuning Recommendations:
TOP SQL
Global Marketing
Run SQL advisorRecommendan index
create index customer_id on customer(CUSTOMER_ID)
Examples of RAC Performance Monitoring & Diagnosis
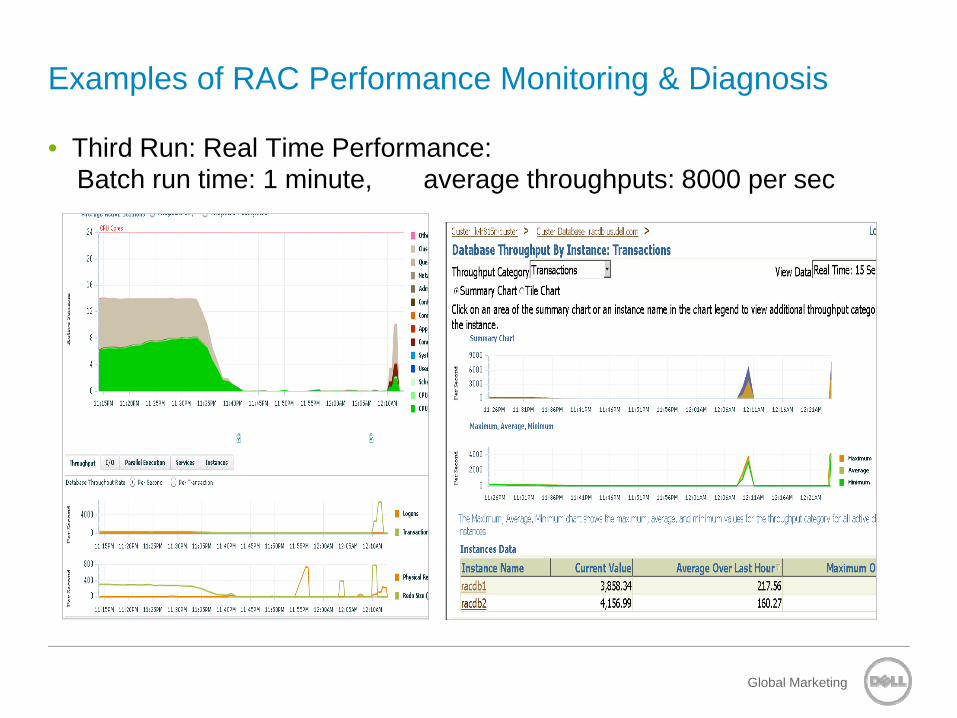
• Third Run: Real Time Performance: Batch run time: 1 minute, average throughputs: 8000 per sec
Global Marketing
Examples of RAC Performance Monitoring & Diagnosis
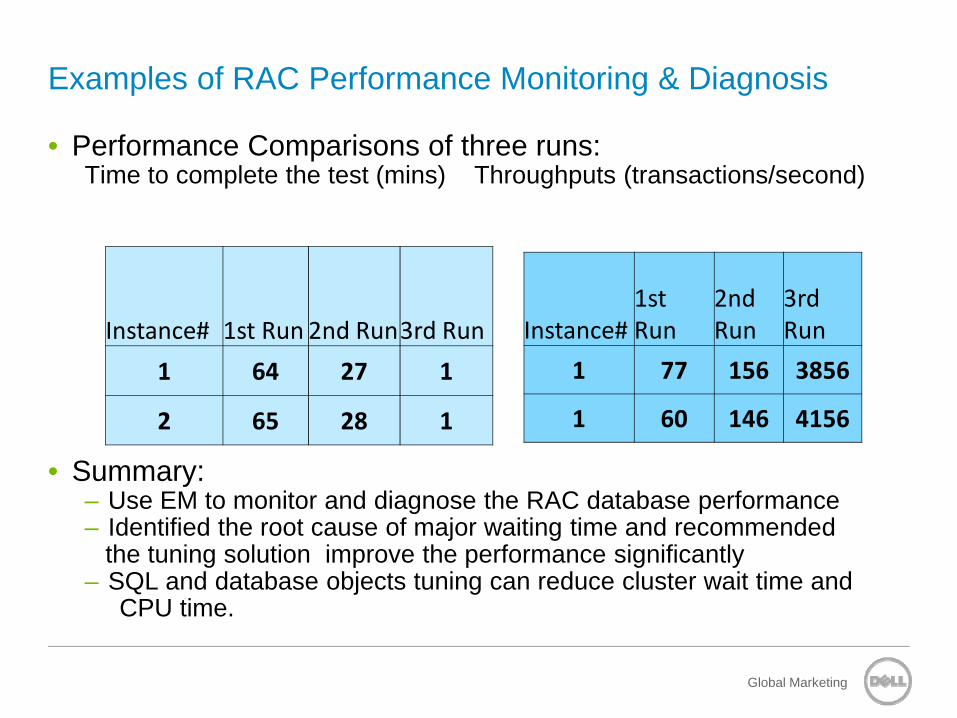
• Performance Comparisons of three runs:Time to complete the test (mins) Throughputs (transactions/second)
Instance#
Instance# 1st Run 2nd Run3rd Run Instance#1st Run
2nd Run
3rd Run
Global Marketing
• Summary:– Use EM to monitor and diagnose the RAC database performance– Identified the root cause of major waiting time and recommended
the tuning solution improve the performance significantly– SQL and database objects tuning can reduce cluster wait time and
CPU time.
1 64 27 1
2 65 28 1
1 77 156 3856
1 60 146 4156
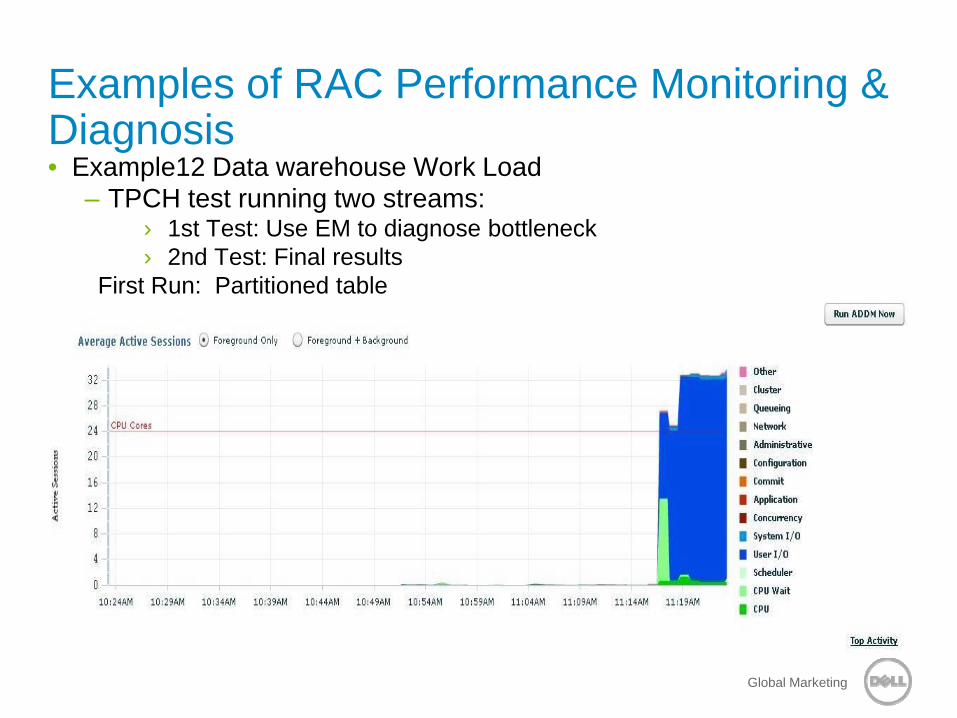
Examples of RAC Performance Monitoring & Diagnosis • Example12 Data warehouse Work Load
– TPCH test running two streams:› 1st Test: Use EM to diagnose bottleneck› 2nd Test: Final results
First Run: Partitioned table
Global Marketing
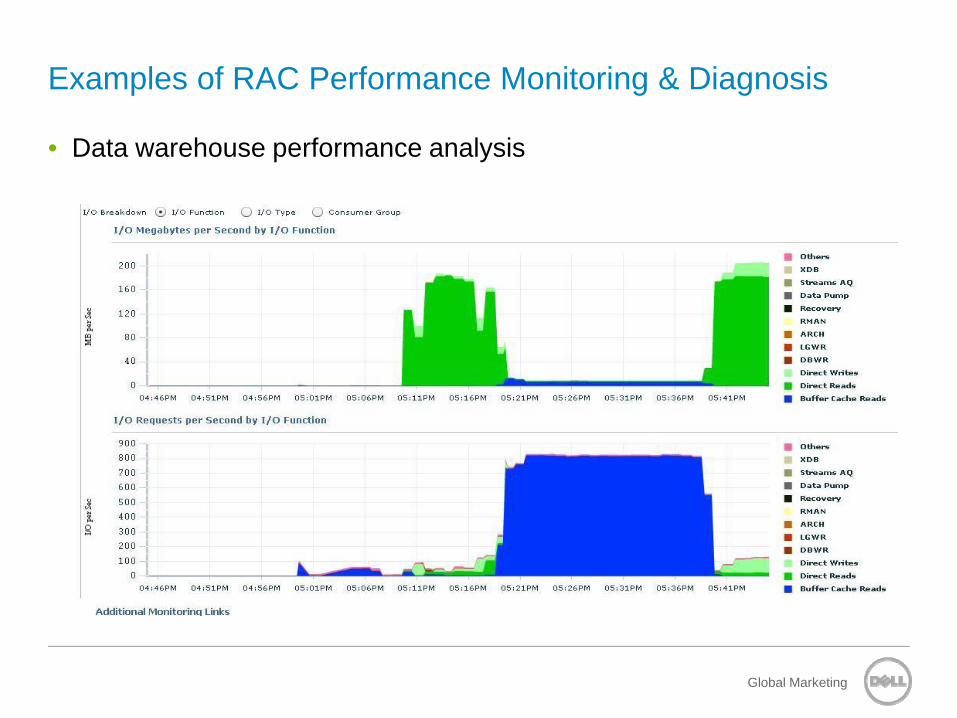
Examples of RAC Performance Monitoring & Diagnosis
• Data warehouse performance analysis
Global Marketing
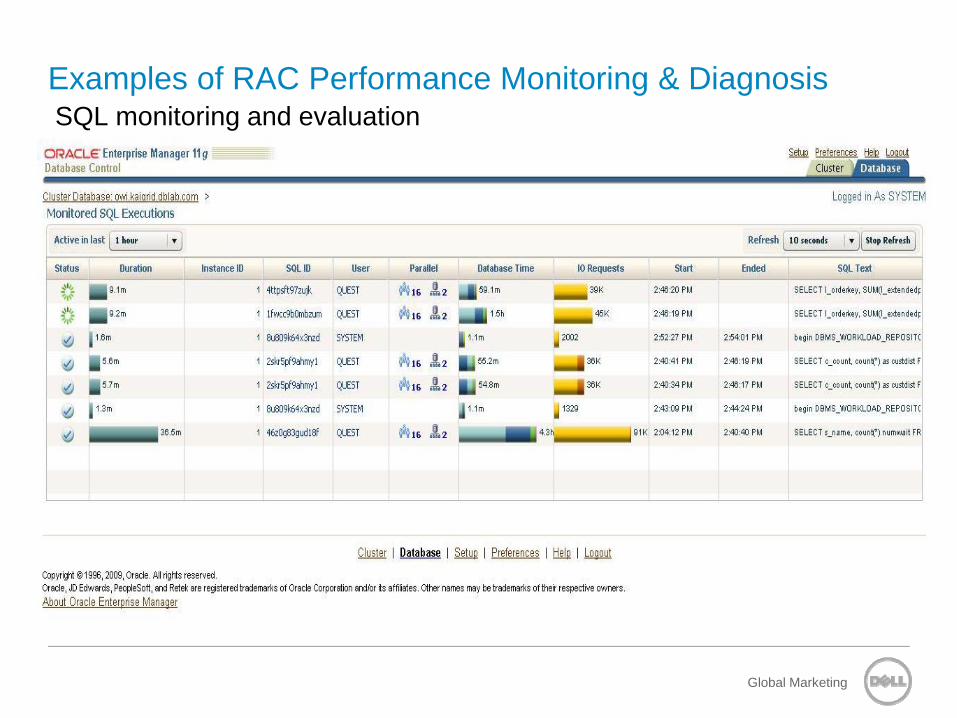
Examples of RAC Performance Monitoring & Diagnosis SQL monitoring and evaluation
Global Marketing
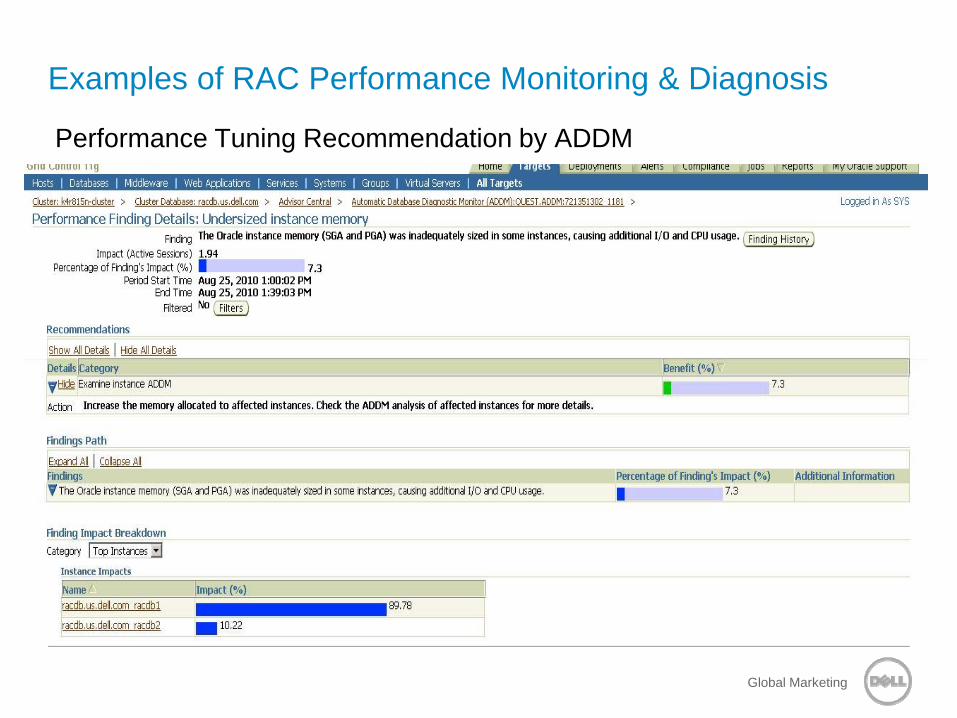
Examples of RAC Performance Monitoring & Diagnosis
Performance Tuning Recommendation by ADDM
Global Marketing
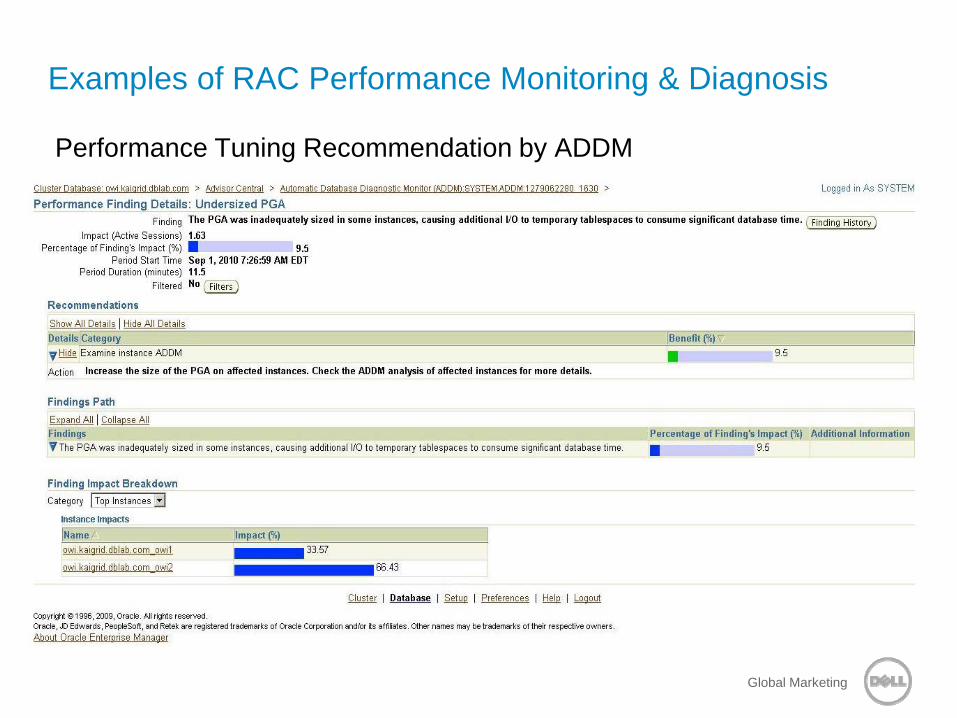
Examples of RAC Performance Monitoring & Diagnosis
Performance Tuning Recommendation by ADDM
Global Marketing
Examples of RAC Performance Monitoring & Diagnosis
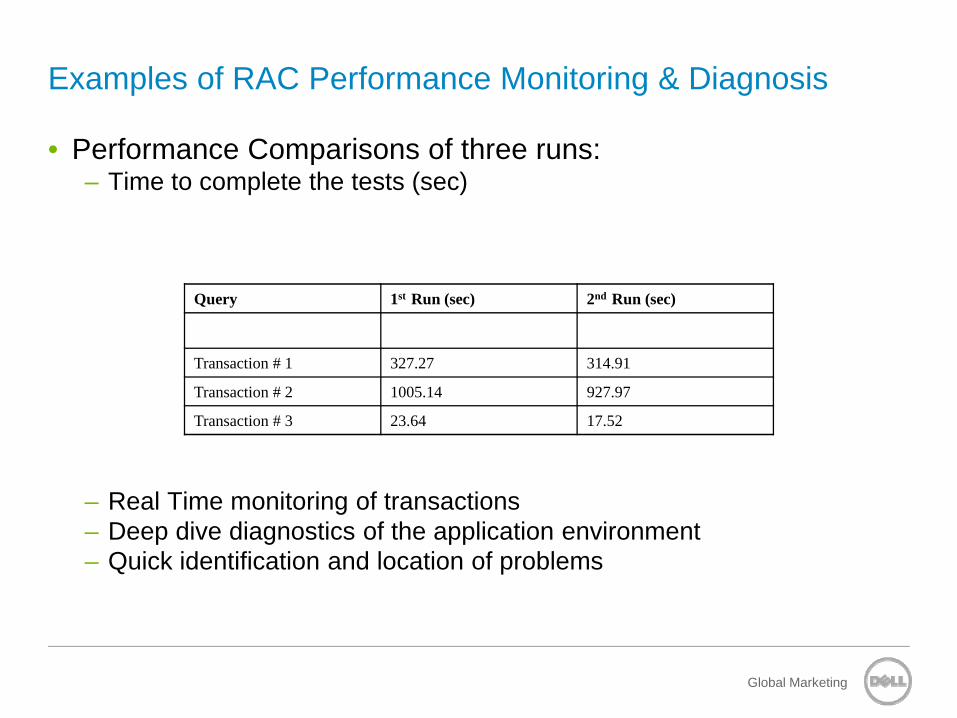
• Performance Comparisons of three runs:– Time to complete the tests (sec)Instance#
Query 1st Run (sec) 2nd Run (sec)
T ti # 1 327 27 314 91
Global Marketing
– Real Time monitoring of transactions– Deep dive diagnostics of the application environment– Quick identification and location of problems
Transaction # 1 327.27 314.91
Transaction # 2 1005.14 927.97
Transaction # 3 23.64 17.52

To learn more about how Dell can help you drive an Efficient Enterprise visit:
• Dell’s onsite TSR for a free quote
• Michael Dell’s keynote on Wednesday at 8 a m
Global Marketing27 Confidential
on Wednesday at 8 a.m.
• One of Dell’s 20 conference sessions
• www.dell.com/oracle