Embed Size (px)
Citation preview
at SciVerse ScienceDirect
Journal of Environmental Radioactivity 111 (2012) 33e37
Contents lists available
Journal of Environmental Radioactivity
journal homepage: www.elsevier .com/locate/ jenvrad
Monitoring of aerosols in Tsukuba after Fukushima Nuclear Power Plantincident in 2011
Yutaka Kanai*
Geological Survey of Japan, National Institute of Advanced Industrial Science and Technology (AIST), 1-1-1 Higashi, Tsukuba, Ibaraki 305-8567, Japan
a r t i c l e i n f o
Article history:Received 18 July 2011Received in revised form12 October 2011Accepted 14 October 2011Available online 8 November 2011
Keywords:Artificial nuclidesAerosolTsukuba137Cs134CsSedimentology
* Tel.: þ81 29 861 3865; fax: þ81 29 861 3643.E-mail address: [email protected].
0265-931X/$ e see front matter � 2011 Elsevier Ltd.doi:10.1016/j.jenvrad.2011.10.011
a b s t r a c t
Artificial radionuclides were released into the atmosphere by the Fukushima Dai-ichi Nuclear PowerPlant incident after a strong earthquake on 11 March 2011. Aerosol monitoring at the Geological Survey ofJapan, Tsukuba, was started 20 d after the incident. Radionuclides such as 99Mo/99mTc, 132Te/132I,129mTe/129Te, 131I, 137Cs, 136Cs, 134Cs, 140Ba/140La, 110mAg, and 95Nb were observed and, with the exceptionof 137Cs and 134Cs, these radionuclides decreased to below the limit of detection in the middle of June.The activity ratio of atmospheric 134Cs/137Cs in aerosols decreased over time almost following physicaldecays. Therefore, the 134Cs/137Cs activity ratio in the averaged air mass in this study could be regarded ashomogeneous although those of several reactors in the Nuclear Power Plant were not ascertained. Afurther research on the released 137Cs and 134Cs would be necessary for the sedimentology of lakesediment.
� 2011 Elsevier Ltd. All rights reserved.
1. Introduction
On 11 March 2011, a strong earthquake occurred in easternJapan and the subsequent large-scale tsunami damaged theFukushima Dai-ichi Nuclear Power Plant (FDNPP), resulting inventing operation, suppression pool damage, and hydrogenexplosion. Thus, large amounts of radioactive nuclides werereleased from the reactor containers into the environment. Themain nuclides exhausted were 131I, 137Cs, and 134Cs (IAEA, 2011;TEPCO, 2011). The amounts of 131I and 137Cs were estimated to beabout 1.6�1017 Bq and 1.5�1016 Bq, respectively (Kantei, 2011).
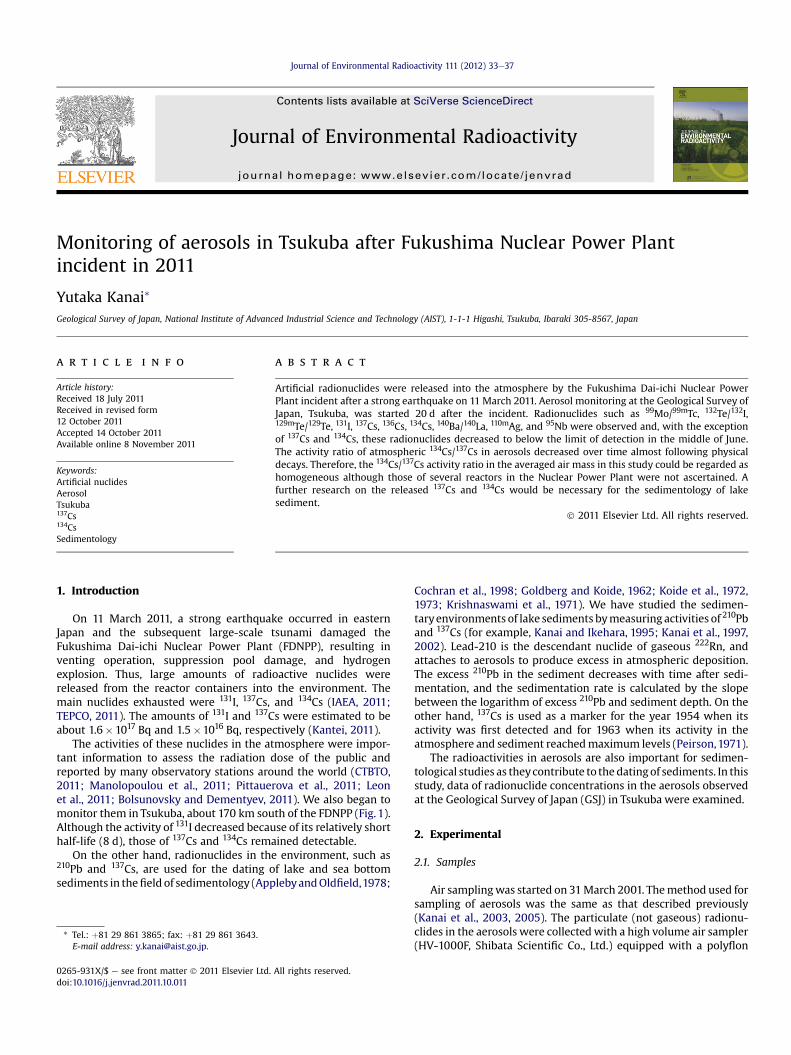
The activities of these nuclides in the atmosphere were impor-tant information to assess the radiation dose of the public andreported by many observatory stations around the world (CTBTO,2011; Manolopoulou et al., 2011; Pittauerova et al., 2011; Leonet al., 2011; Bolsunovsky and Dementyev, 2011). We also began tomonitor them in Tsukuba, about 170 km south of the FDNPP (Fig. 1).Although the activity of 131I decreased because of its relatively shorthalf-life (8 d), those of 137Cs and 134Cs remained detectable.
On the other hand, radionuclides in the environment, such as210Pb and 137Cs, are used for the dating of lake and sea bottomsediments in thefield of sedimentology (ApplebyandOldfield,1978;
All rights reserved.
Cochran et al., 1998; Goldberg and Koide, 1962; Koide et al., 1972,1973; Krishnaswami et al., 1971). We have studied the sedimen-taryenvironments of lake sediments bymeasuring activities of 210Pband 137Cs (for example, Kanai and Ikehara, 1995; Kanai et al., 1997,2002). Lead-210 is the descendant nuclide of gaseous 222Rn, andattaches to aerosols to produce excess in atmospheric deposition.The excess 210Pb in the sediment decreases with time after sedi-mentation, and the sedimentation rate is calculated by the slopebetween the logarithm of excess 210Pb and sediment depth. On theother hand, 137Cs is used as a marker for the year 1954 when itsactivity was first detected and for 1963 when its activity in theatmosphere and sediment reachedmaximum levels (Peirson,1971).
The radioactivities in aerosols are also important for sedimen-tological studies as theycontribute to the datingof sediments. In thisstudy, data of radionuclide concentrations in the aerosols observedat the Geological Survey of Japan (GSJ) in Tsukuba were examined.
2. Experimental
2.1. Samples
Air samplingwas started on 31March 2001. Themethod used forsampling of aerosols was the same as that described previously(Kanai et al., 2003, 2005). The particulate (not gaseous) radionu-clides in the aerosols were collectedwith a high volume air sampler(HV-1000F, Shibata Scientific Co., Ltd.) equipped with a polyflon
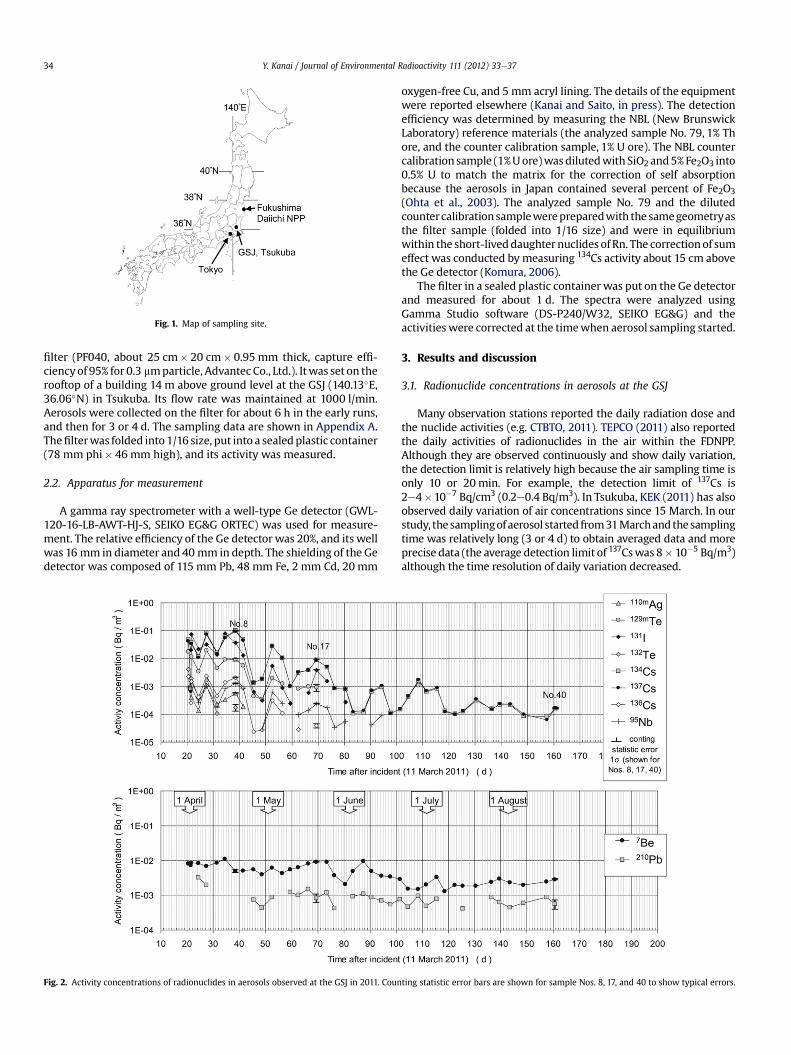
Fig. 1. Map of sampling site.
Y. Kanai / Journal of Environmental Radioactivity 111 (2012) 33e3734
filter (PF040, about 25 cm� 20 cm� 0.95 mm thick, capture effi-ciencyof 95% for 0.3 mmparticle, Advantec Co., Ltd.). Itwas set on therooftop of a building 14 m above ground level at the GSJ (140.13�E,36.06�N) in Tsukuba. Its flow rate was maintained at 1000 l/min.Aerosols were collected on the filter for about 6 h in the early runs,and then for 3 or 4 d. The sampling data are shown in Appendix A.Thefilterwas folded into 1/16 size, put into a sealedplastic container(78 mm phi� 46 mm high), and its activity was measured.
2.2. Apparatus for measurement
A gamma ray spectrometer with a well-type Ge detector (GWL-120-16-LB-AWT-HJ-S, SEIKO EG&G ORTEC) was used for measure-ment. The relative efficiency of the Ge detector was 20%, and its wellwas 16 mm in diameter and 40 mm in depth. The shielding of the Gedetector was composed of 115 mm Pb, 48 mm Fe, 2 mm Cd, 20 mm
Fig. 2. Activity concentrations of radionuclides in aerosols observed at the GSJ in 2011. Coun
oxygen-free Cu, and 5 mm acryl lining. The details of the equipmentwere reported elsewhere (Kanai and Saito, in press). The detectionefficiency was determined by measuring the NBL (New BrunswickLaboratory) reference materials (the analyzed sample No. 79, 1% Thore, and the counter calibration sample, 1% U ore). The NBL countercalibration sample (1%Uore)wasdilutedwith SiO2 and5%Fe2O3 into0.5% U to match the matrix for the correction of self absorptionbecause the aerosols in Japan contained several percent of Fe2O3(Ohta et al., 2003). The analyzed sample No. 79 and the dilutedcountercalibrationsamplewerepreparedwith the samegeometryasthe filter sample (folded into 1/16 size) and were in equilibriumwithin the short-liveddaughter nuclides of Rn. The correctionof sumeffect was conducted by measuring 134Cs activity about 15 cm abovethe Ge detector (Komura, 2006).
The filter in a sealed plastic container was put on the Ge detectorand measured for about 1 d. The spectra were analyzed usingGamma Studio software (DS-P240/W32, SEIKO EG&G) and theactivities were corrected at the timewhen aerosol sampling started.
3. Results and discussion
3.1. Radionuclide concentrations in aerosols at the GSJ
Many observation stations reported the daily radiation dose andthe nuclide activities (e.g. CTBTO, 2011). TEPCO (2011) also reportedthe daily activities of radionuclides in the air within the FDNPP.Although they are observed continuously and show daily variation,the detection limit is relatively high because the air sampling time isonly 10 or 20min. For example, the detection limit of 137Cs is2e4�10�7 Bq/cm3 (0.2e0.4 Bq/m3). In Tsukuba, KEK (2011) has alsoobserved daily variation of air concentrations since 15 March. In ourstudy, the samplingof aerosol started from31Marchandthesamplingtime was relatively long (3 or 4 d) to obtain averaged data and moreprecise data (the average detection limit of 137Cswas 8� 10�5 Bq/m3)although the time resolution of daily variation decreased.
ting statistic error bars are shown for sample Nos. 8, 17, and 40 to show typical errors.
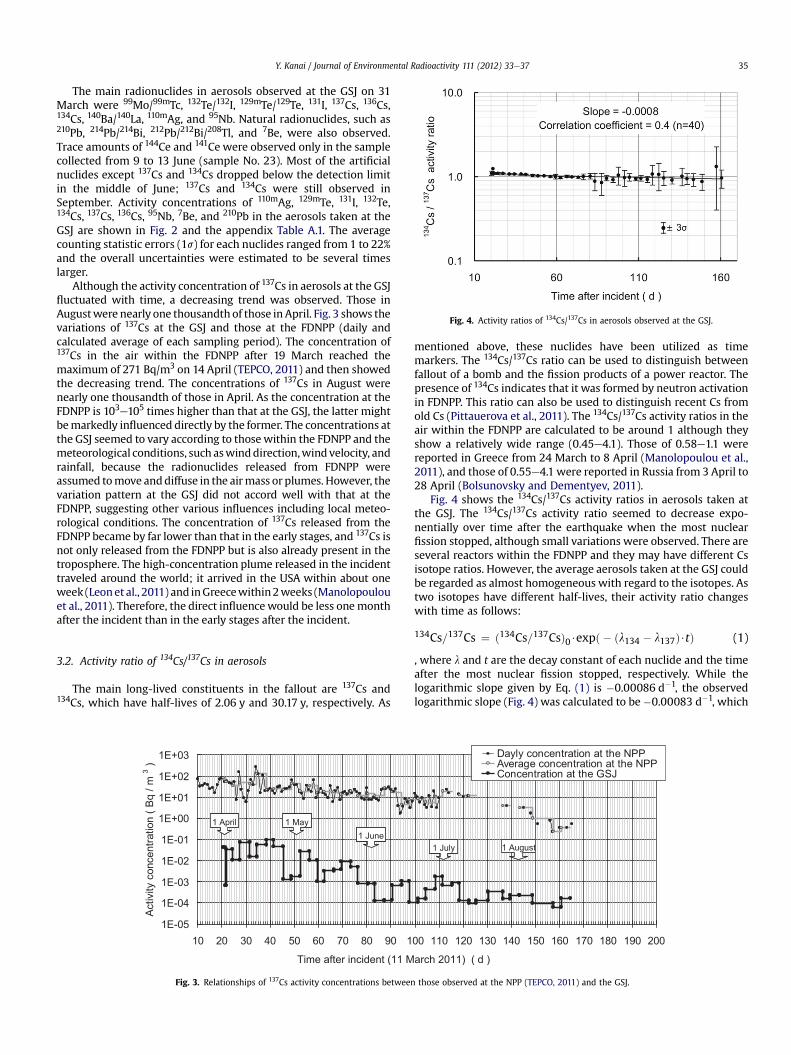
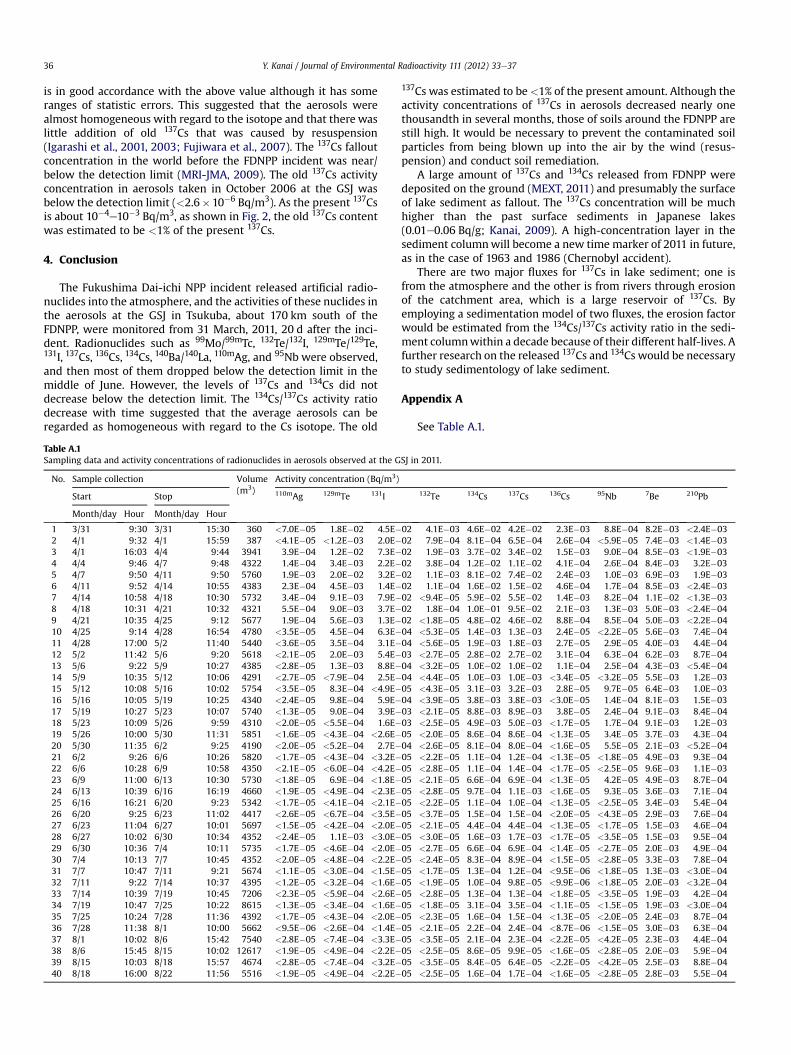
Fig. 4. Activity ratios of 134Cs/137Cs in aerosols observed at the GSJ.
Y. Kanai / Journal of Environmental Radioactivity 111 (2012) 33e37 35
The main radionuclides in aerosols observed at the GSJ on 31March were 99Mo/99mTc, 132Te/132I, 129mTe/129Te, 131I, 137Cs, 136Cs,134Cs, 140Ba/140La, 110mAg, and 95Nb. Natural radionuclides, such as210Pb, 214Pb/214Bi, 212Pb/212Bi/208Tl, and 7Be, were also observed.Trace amounts of 144Ce and 141Ce were observed only in the samplecollected from 9 to 13 June (sample No. 23). Most of the artificialnuclides except 137Cs and 134Cs dropped below the detection limitin the middle of June; 137Cs and 134Cs were still observed inSeptember. Activity concentrations of 110mAg, 129mTe, 131I, 132Te,134Cs, 137Cs, 136Cs, 95Nb, 7Be, and 210Pb in the aerosols taken at theGSJ are shown in Fig. 2 and the appendix Table A.1. The averagecounting statistic errors (1s) for each nuclides ranged from 1 to 22%and the overall uncertainties were estimated to be several timeslarger.
Although the activity concentration of 137Cs in aerosols at the GSJfluctuated with time, a decreasing trend was observed. Those inAugustwere nearly one thousandth of those inApril. Fig. 3 shows thevariations of 137Cs at the GSJ and those at the FDNPP (daily andcalculated average of each sampling period). The concentration of137Cs in the air within the FDNPP after 19 March reached themaximum of 271 Bq/m3 on 14 April (TEPCO, 2011) and then showedthe decreasing trend. The concentrations of 137Cs in August werenearly one thousandth of those in April. As the concentration at theFDNPP is 103e105 times higher than that at the GSJ, the latter mightbemarkedly influenced directly by the former. The concentrations atthe GSJ seemed to vary according to those within the FDNPP and themeteorological conditions, such aswinddirection,wind velocity, andrainfall, because the radionuclides released from FDNPP wereassumed tomove anddiffuse in the airmass or plumes. However, thevariation pattern at the GSJ did not accord well with that at theFDNPP, suggesting other various influences including local meteo-rological conditions. The concentration of 137Cs released from theFDNPP became by far lower than that in the early stages, and 137Cs isnot only released from the FDNPP but is also already present in thetroposphere. The high-concentration plume released in the incidenttraveled around the world; it arrived in the USA within about oneweek (Leonet al., 2011) and inGreecewithin2weeks (Manolopoulouet al., 2011). Therefore, the direct influencewould be less onemonthafter the incident than in the early stages after the incident.
3.2. Activity ratio of 134Cs/137Cs in aerosols
The main long-lived constituents in the fallout are 137Cs and134Cs, which have half-lives of 2.06 y and 30.17 y, respectively. As
Fig. 3. Relationships of 137Cs activity concentrations between
mentioned above, these nuclides have been utilized as timemarkers. The 134Cs/137Cs ratio can be used to distinguish betweenfallout of a bomb and the fission products of a power reactor. Thepresence of 134Cs indicates that it was formed by neutron activationin FDNPP. This ratio can also be used to distinguish recent Cs fromold Cs (Pittauerova et al., 2011). The 134Cs/137Cs activity ratios in theair within the FDNPP are calculated to be around 1 although theyshow a relatively wide range (0.45e4.1). Those of 0.58e1.1 werereported in Greece from 24 March to 8 April (Manolopoulou et al.,2011), and those of 0.55e4.1 were reported in Russia from 3 April to28 April (Bolsunovsky and Dementyev, 2011).
Fig. 4 shows the 134Cs/137Cs activity ratios in aerosols taken atthe GSJ. The 134Cs/137Cs activity ratio seemed to decrease expo-nentially over time after the earthquake when the most nuclearfission stopped, although small variations were observed. There areseveral reactors within the FDNPP and they may have different Csisotope ratios. However, the average aerosols taken at the GSJ couldbe regarded as almost homogeneous with regard to the isotopes. Astwo isotopes have different half-lives, their activity ratio changeswith time as follows:
134Cs=137Cs ¼ ð134Cs=137CsÞ0$expð � ðl134 � l137Þ$tÞ (1)
, where l and t are the decay constant of each nuclide and the timeafter the most nuclear fission stopped, respectively. While thelogarithmic slope given by Eq. (1) is �0.00086 d�1, the observedlogarithmic slope (Fig. 4) was calculated to be�0.00083 d�1, which
those observed at the NPP (TEPCO, 2011) and the GSJ.
Y. Kanai / Journal of Environmental Radioactivity 111 (2012) 33e3736
is in good accordance with the above value although it has someranges of statistic errors. This suggested that the aerosols werealmost homogeneous with regard to the isotope and that there waslittle addition of old 137Cs that was caused by resuspension(Igarashi et al., 2001, 2003; Fujiwara et al., 2007). The 137Cs falloutconcentration in the world before the FDNPP incident was near/below the detection limit (MRI-JMA, 2009). The old 137Cs activityconcentration in aerosols taken in October 2006 at the GSJ wasbelow the detection limit (<2.6�10�6 Bq/m3). As the present 137Csis about 10�4e10�3 Bq/m3, as shown in Fig. 2, the old 137Cs contentwas estimated to be <1% of the present 137Cs.
4. Conclusion
The Fukushima Dai-ichi NPP incident released artificial radio-nuclides into the atmosphere, and the activities of these nuclides inthe aerosols at the GSJ in Tsukuba, about 170 km south of theFDNPP, were monitored from 31 March, 2011, 20 d after the inci-dent. Radionuclides such as 99Mo/99mTc, 132Te/132I, 129mTe/129Te,131I, 137Cs, 136Cs, 134Cs, 140Ba/140La, 110mAg, and 95Nb were observed,and then most of them dropped below the detection limit in themiddle of June. However, the levels of 137Cs and 134Cs did notdecrease below the detection limit. The 134Cs/137Cs activity ratiodecrease with time suggested that the average aerosols can beregarded as homogeneous with regard to the Cs isotope. The old
Table A.1Sampling data and activity concentrations of radionuclides in aerosols observed at the G
No. Sample collection Volume(m3)
Activity concentration (Bq/m3)
Start Stop 110mAg 129mTe 131I
Month/day Hour Month/day Hour
1 3/31 9:30 3/31 15:30 360 <7.0E�05 1.8E�02 4.5E�2 4/1 9:32 4/1 15:59 387 <4.1E�05 <1.2E�03 2.0E�3 4/1 16:03 4/4 9:44 3941 3.9E�04 1.2E�02 7.3E�4 4/4 9:46 4/7 9:48 4322 1.4E�04 3.4E�03 2.2E�5 4/7 9:50 4/11 9:50 5760 1.9E�03 2.0E�02 3.2E�6 4/11 9:52 4/14 10:55 4383 2.3E�04 4.5E�03 1.4E�7 4/14 10:58 4/18 10:30 5732 3.4E�04 9.1E�03 7.9E�8 4/18 10:31 4/21 10:32 4321 5.5E�04 9.0E�03 3.7E�9 4/21 10:35 4/25 9:12 5677 1.9E�04 5.6E�03 1.3E�10 4/25 9:14 4/28 16:54 4780 <3.5E�05 4.5E�04 6.3E�11 4/28 17:00 5/2 11:40 5440 <3.6E�05 3.5E�04 3.1E�12 5/2 11:42 5/6 9:20 5618 <2.1E�05 2.0E�03 5.4E�13 5/6 9:22 5/9 10:27 4385 <2.8E�05 1.3E�03 8.8E�14 5/9 10:35 5/12 10:06 4291 <2.7E�05 <7.9E�04 2.5E�15 5/12 10:08 5/16 10:02 5754 <3.5E�05 8.3E�04 <4.9E�16 5/16 10:05 5/19 10:25 4340 <2.4E�05 9.8E�04 5.9E�17 5/19 10:27 5/23 10:07 5740 <1.3E�05 9.0E�04 3.9E�18 5/23 10:09 5/26 9:59 4310 <2.0E�05 <5.5E�04 1.6E�19 5/26 10:00 5/30 11:31 5851 <1.6E�05 <4.3E�04 <2.6E�20 5/30 11:35 6/2 9:25 4190 <2.0E�05 <5.2E�04 2.7E�21 6/2 9:26 6/6 10:26 5820 <1.7E�05 <4.3E�04 <3.2E�22 6/6 10:28 6/9 10:58 4350 <2.1E�05 <6.0E�04 <4.2E�23 6/9 11:00 6/13 10:30 5730 <1.8E�05 6.9E�04 <1.8E�24 6/13 10:39 6/16 16:19 4660 <1.9E�05 <4.9E�04 <2.3E�25 6/16 16:21 6/20 9:23 5342 <1.7E�05 <4.1E�04 <2.1E�26 6/20 9:25 6/23 11:02 4417 <2.6E�05 <6.7E�04 <3.5E�27 6/23 11:04 6/27 10:01 5697 <1.5E�05 <4.2E�04 <2.0E�28 6/27 10:02 6/30 10:34 4352 <2.4E�05 1.1E�03 <3.0E�29 6/30 10:36 7/4 10:11 5735 <1.7E�05 <4.6E�04 <2.0E�30 7/4 10:13 7/7 10:45 4352 <2.0E�05 <4.8E�04 <2.2E�31 7/7 10:47 7/11 9:21 5674 <1.1E�05 <3.0E�04 <1.5E�32 7/11 9:22 7/14 10:37 4395 <1.2E�05 <3.2E�04 <1.6E�33 7/14 10:39 7/19 10:45 7206 <2.3E�05 <5.9E�04 <2.6E�34 7/19 10:47 7/25 10:22 8615 <1.3E�05 <3.4E�04 <1.6E�35 7/25 10:24 7/28 11:36 4392 <1.7E�05 <4.3E�04 <2.0E�36 7/28 11:38 8/1 10:00 5662 <9.5E�06 <2.6E�04 <1.4E�37 8/1 10:02 8/6 15:42 7540 <2.8E�05 <7.4E�04 <3.3E�38 8/6 15:45 8/15 10:02 12617 <1.9E�05 <4.9E�04 <2.2E�39 8/15 10:03 8/18 15:57 4674 <2.8E�05 <7.4E�04 <3.2E�40 8/18 16:00 8/22 11:56 5516 <1.9E�05 <4.9E�04 <2.2E�
137Cs was estimated to be<1% of the present amount. Although theactivity concentrations of 137Cs in aerosols decreased nearly onethousandth in several months, those of soils around the FDNPP arestill high. It would be necessary to prevent the contaminated soilparticles from being blown up into the air by the wind (resus-pension) and conduct soil remediation.
A large amount of 137Cs and 134Cs released from FDNPP weredeposited on the ground (MEXT, 2011) and presumably the surfaceof lake sediment as fallout. The 137Cs concentration will be muchhigher than the past surface sediments in Japanese lakes(0.01e0.06 Bq/g; Kanai, 2009). A high-concentration layer in thesediment columnwill become a new time marker of 2011 in future,as in the case of 1963 and 1986 (Chernobyl accident).
There are two major fluxes for 137Cs in lake sediment; one isfrom the atmosphere and the other is from rivers through erosionof the catchment area, which is a large reservoir of 137Cs. Byemploying a sedimentation model of two fluxes, the erosion factorwould be estimated from the 134Cs/137Cs activity ratio in the sedi-ment columnwithin a decade because of their different half-lives. Afurther research on the released 137Cs and 134Cs would be necessaryto study sedimentology of lake sediment.
Appendix A
See Table A.1.
SJ in 2011.
132Te 134Cs 137Cs 136Cs 95Nb 7Be 210Pb
02 4.1E�03 4.6E�02 4.2E�02 2.3E�03 8.8E�04 8.2E�03 <2.4E�0302 7.9E�04 8.1E�04 6.5E�04 2.6E�04 <5.9E�05 7.4E�03 <1.4E�0302 1.9E�03 3.7E�02 3.4E�02 1.5E�03 9.0E�04 8.5E�03 <1.9E�0302 3.8E�04 1.2E�02 1.1E�02 4.1E�04 2.6E�04 8.4E�03 3.2E�0302 1.1E�03 8.1E�02 7.4E�02 2.4E�03 1.0E�03 6.9E�03 1.9E�0302 1.1E�04 1.6E�02 1.5E�02 4.6E�04 1.7E�04 8.5E�03 <2.4E�0302 <9.4E�05 5.9E�02 5.5E�02 1.4E�03 8.2E�04 1.1E�02 <1.3E�0302 1.8E�04 1.0E�01 9.5E�02 2.1E�03 1.3E�03 5.0E�03 <2.4E�0402 <1.8E�05 4.8E�02 4.6E�02 8.8E�04 8.5E�04 5.0E�03 <2.2E�0404 <5.3E�05 1.4E�03 1.3E�03 2.4E�05 <2.2E�05 5.6E�03 7.4E�0404 <5.6E�05 1.9E�03 1.8E�03 2.7E�05 2.9E�05 4.0E�03 4.4E�0403 <2.7E�05 2.8E�02 2.7E�02 3.1E�04 6.3E�04 6.2E�03 8.7E�0404 <3.2E�05 1.0E�02 1.0E�02 1.1E�04 2.5E�04 4.3E�03 <5.4E�0404 <4.4E�05 1.0E�03 1.0E�03 <3.4E�05 <3.2E�05 5.5E�03 1.2E�0305 <4.3E�05 3.1E�03 3.2E�03 2.8E�05 9.7E�05 6.4E�03 1.0E�0304 <3.9E�05 3.8E�03 3.8E�03 <3.0E�05 1.4E�04 8.1E�03 1.5E�0303 <2.1E�05 8.8E�03 8.9E�03 3.8E�05 2.4E�04 9.1E�03 8.4E�0403 <2.5E�05 4.9E�03 5.0E�03 <1.7E�05 1.7E�04 9.1E�03 1.2E�0305 <2.0E�05 8.6E�04 8.6E�04 <1.3E�05 3.4E�05 3.7E�03 4.3E�0404 <2.6E�05 8.1E�04 8.0E�04 <1.6E�05 5.5E�05 2.1E�03 <5.2E�0405 <2.2E�05 1.1E�04 1.2E�04 <1.3E�05 <1.8E�05 4.9E�03 9.3E�0405 <2.8E�05 1.1E�04 1.4E�04 <1.7E�05 <2.5E�05 9.6E�03 1.1E�0305 <2.1E�05 6.6E�04 6.9E�04 <1.3E�05 4.2E�05 4.9E�03 8.7E�0405 <2.8E�05 9.7E�04 1.1E�03 <1.6E�05 9.3E�05 3.6E�03 7.1E�0405 <2.2E�05 1.1E�04 1.0E�04 <1.3E�05 <2.5E�05 3.4E�03 5.4E�0405 <3.7E�05 1.5E�04 1.5E�04 <2.0E�05 <4.3E�05 2.9E�03 7.6E�0405 <2.1E�05 4.4E�04 4.4E�04 <1.3E�05 <1.7E�05 1.5E�03 4.6E�0405 <3.0E�05 1.6E�03 1.7E�03 <1.7E�05 <3.5E�05 1.5E�03 9.5E�0405 <2.7E�05 6.6E�04 6.9E�04 <1.4E�05 <2.7E�05 2.0E�03 4.9E�0405 <2.4E�05 8.3E�04 8.9E�04 <1.5E�05 <2.8E�05 3.3E�03 7.8E�0405 <1.7E�05 1.3E�04 1.2E�04 <9.5E�06 <1.8E�05 1.3E�03 <3.0E�0405 <1.9E�05 1.0E�04 9.8E�05 <9.9E�06 <1.8E�05 2.0E�03 <3.2E�0405 <2.8E�05 1.3E�04 1.3E�04 <1.8E�05 <3.5E�05 1.9E�03 4.2E�0405 <1.8E�05 3.1E�04 3.5E�04 <1.1E�05 <1.5E�05 1.9E�03 <3.0E�0405 <2.3E�05 1.6E�04 1.5E�04 <1.3E�05 <2.0E�05 2.4E�03 8.7E�0405 <2.1E�05 2.2E�04 2.4E�04 <8.7E�06 <1.5E�05 3.0E�03 6.3E�0405 <3.5E�05 2.1E�04 2.3E�04 <2.2E�05 <4.2E�05 2.3E�03 4.4E�0405 <2.5E�05 8.6E�05 9.9E�05 <1.6E�05 <2.8E�05 2.0E�03 5.9E�0405 <3.5E�05 8.4E�05 6.4E�05 <2.2E�05 <4.2E�05 2.5E�03 8.8E�0405 <2.5E�05 1.6E�04 1.7E�04 <1.6E�05 <2.8E�05 2.8E�03 5.5E�04
Y. Kanai / Journal of Environmental Radioactivity 111 (2012) 33e37 37
References
Appleby, P.G., Oldfield, F., 1978. The calculation of lead-210 dates assuminga constant rate of supply of unsupported 210Pb to the sediment. Catena 5, le8.
Bolsunovsky, A., Dementyev, D., 2011. Evidence of the radioactive fallout in thecenter of Asia (Russia) following the Fukushima Nuclear Accident. J. Environ.Radioact. 102, 1062e1064.
Cochran, J.K., Frignani, M., Salamanca, M., Bellucci, L.G., Guerzoni, S., 1998. Lead-210as a tracer of atmospheric input of heavy metals in the northern Venice Lagoon.Mar. Chem. 62, 15e29.
CTBTO, 2011. http://www.ctbto.org/press-centre/highlights/2011/fukushima-related-measurements-by-the-ctbto/fukushima-related-measurements-by-the-ctbto-page-1/ (accessed 12.09.11).
Fujiwara, H., Fukuyama, T., Shirato, Y., Okuro, T., Taniyama, I., Zhang, T.-H., 2007.Deposition of atmospheric 137Cs in Japan associated with the Asian dust eventof March 2002. Sci. Total Environ. 384, 306e315.
Goldberg, E.D., Koide, M., 1962. Geochronological studies of deep-sea sediments bythe ionium/thorium method. Geochim. Cosmochim. Acta 26, 417e445.
IAEA, 2011. http://www.iaea.org/newscenter/focus/fukushima/ (accessed 12.09.11).Igarashi, Y., Aoyama, M., Hirose, K., Miyao, T., Yabuki, S., 2001. Is it possible to use
90Sr and 137CS as tracers for the Aeolian dust transport? Water, Air, Soil Pollut.130, 349e351.
Igarashi, Y., Aoyama, M., Hirose, K., Miyao, T., Nemoto, K., Tomita, M., Fujikawa, T.,2003. Resuspension: decadal monitoring time series of the anthropogenicradioactivity deposition in Japan. J. Radiat. Res. 44, 319e328.
Kanai, Y., 2009. Fluxes and inventories of 210Pb and 137Cs in lake sediments fromEast Asia and their relationships to sedimentary environment. J. Sedim. Soc. Jpn.68, 91e103.
Kanai, Y., Saito, Y. Characterization of environmental gamma-ray measurementsystem with a well-type Ge detector and the contamination in backgroundspectra by nuclear power plant accident e a case study in the Geological Surveyof Japan. Bull. Geol. Surv. Jpn. 62 (in Japanese with English abstract), in press.
Kanai, Y., Ikehara, K., 1995. Sedimentation rates of offshore deposits in the Sea ofJapan off Niigata Prefecture, using 210Pb and 137Cs radioactivity measurements.Bull. Geol. Sur. Jpn. 46, 269e282 (in Japanese with English abstract).
Kanai, Y., Inouchi, Y., Katayama, H., Saito, Y., 1997. Radioactivity measurements inbottom sediments from Lake Suwa, Nagano Prefecture, using a new low back-ground system to estimate sedimentation rates. Bull. Geol. Sur. Jpn. 48,277e295 (in Japanese with English abstract).
Kanai, Y., Yamamuro, M., Inouchi, Y., Tokuoka, T., 2002. Sedimentation rate andenvironment of Lake Nakaumi, Shimane and Tottori Prefectures. Chikyukagaku(Geochemistry) 36, 161e178 (in Japanese with English abstract).
Kanai, Y., Ohta, A., Kamioka, H., Terashima, S., Imai, N., Matsuhisa, Y., Kanai, M.,Shimizu, H., Takahashi, Y., Kai, K., Xu, B., Hayashi, M., Zhang, R., 2003. Variationof concentrations and physicochemical properties of aeolian dust obtained ineast China and Japan from 2001 to 2002. Bull. Geol. Sur. Jpn. 54, 251e267.
Kanai, Y., Ohta, A., Kamioka, H., Terashima, S., Imai, N., Kanai, M., Shimizu, H.,Takahashi, Y., Kai, K., Hayashi, M., Zhang, R., Sheng, L., 2005. Characterization ofaeolian dust in east China and Japan from 2001 to 2003. J. Meteorol. Soc. Jpn.83A, 73e106.
Kantei, 2011. http://www.kantei.go.jp/jp/topics/2011/pdf/06-kankyo.pdf (in Japa-nese, accessed 12.09.11).
KEK, 2011. http://www.kek.jp/quake/radmonitor/ (in Japanese, accessed 12.09.11).Koide, M., Soutar, A., Goldberg, E.D., 1972. Marine geochronology with 210Pb. Earth
Planet. Sci. Lett. 14, 442e446.Koide, M., Bruland, K., Goldberg, E.D., 1973. Th-228/Th-232 and 210Pb geochronol-
ogies in marine and lake sediments. Geochim. Cosmochim. Acta 37, 1171e1187.Komura, K., 2006. Present status and prospects of ultralow level radioactivity
measurements (8) Summary of ultralow level radioactivity measurementsseries. Radioisotopes 55, 691e697 (in Japanese).
Krishnaswami, S., Lal, D., Martin, J.M., Mrybeck, M., 1971. Geochronology of lakesediments. Earth Planet. Sci. Lett. 11, 407e414.
Leon, J.D., Jaffe, D.A., Kasper, J., Knecht, A., Miller, M.L., Robertson, R.G.H.,Schubert, A.G., 2011. Arrival time and magnitude of airborne fission productsfrom the Fukushima, Japan, reactor incident as measured in Seattle, WA, USA.J. Environ. Radioact. 102, 1032e1038.
Manolopoulou, M., Vagena, E., Stoulos, S., Ioannidou, A., Papastefanou, C., 2011.Radioiodine and radiocesium in Thessaloniki, Northern Greece due toFukushima nuclear accident. J. Environ. Radioact. 102, 796e797.
MEXT, 2011. http://radioactivity.mext.go.jp/ja/distribution_map_around_FukushimaNPP/0002/11555_0830.pdf (in Japanese, accessed 12.09.11).
MRI-JMA, 2009. Artificial Radionuclides in the Environment 2009. ISSN 1348-9739,Dec. 2009. http://www.mri-jma.go.jp/Dep/ge/2009Artifi_Radio_report/index.html (in Japanese, accessed 12.09.11).
Ohta, A., Terashima, S., Kanai, Y., Kamioka, H., Imai, N., Matsuhisa, Y., Shimizu, H.,Takahashi, Y., Kai, K., Hayashi, M., Zhang, R., 2003. Grain-size distribution andchemical composition of water-insoluble components in aeolian dust collectedin Japan in spring 2002. Bull. Geol. Sur. Jpn. 54, 303e322.
Peirson, D.H., 1971. Worldwide deposition of long-lived fission products fromnuclear explosions. Nature 234, 79e80.
Pittauerova, D., Hettwig, B., Fisher, H.W., 2011. Fukushima fallout in NorthwestGerman environmental media. J. Environ. Radioact. 102, 877e880.
TEPCO, 2011. http://www.tepco.co.jp/cc/press/index-j.html (in Japanese, accessed12.09.11).