Embed Size (px)
DESCRIPTION
Monitoring Progress Toward Achieving Contraceptive Security:. CS Index 2003–2009 Dana Aronovich, Marie Tien, Nadia Olson John Snow, Inc. APHA Conference, Denver, CO November, 2010. Learning Objectives. Describe how the CS Index is compiled to help measure progress towards CS - PowerPoint PPT Presentation
Citation preview

Monitoring Progress Toward Achieving Contraceptive Security:
APHA Conference, Denver, CONovember, 2010
CS Index 2003–2009
Dana Aronovich, Marie Tien, Nadia OlsonJohn Snow, Inc.
Learning Objectives
• Describe how the CS Index is compiled to help measure progress towards CS
• Describe the changes/trends that have occurred between the 2003 and 2009 CS Index at the national, regional, and global levels?
• Demonstrate how can data from the CS Index can be used to identify priority areas for support and to inform program planning
• Explain how data from the CS Index can be used to advocate for improved resource allocation by country governments and global donors.
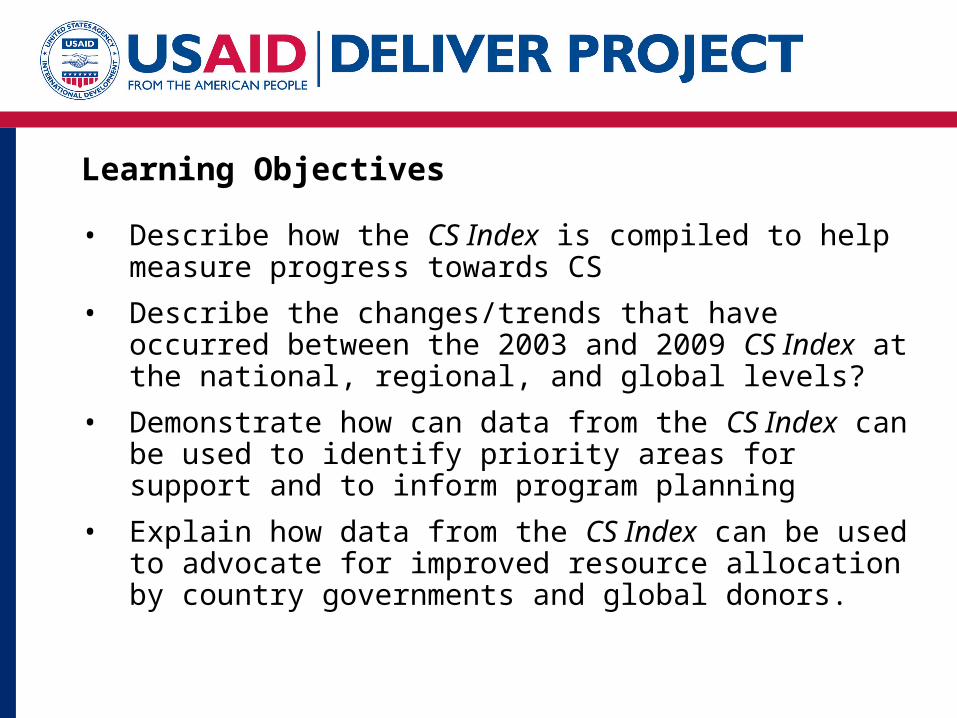
A critical component of FP programs:
Contraceptive security exists
when every person is able to
choose, obtain and use
quality contraceptives and condomswhenever she/he needs them.
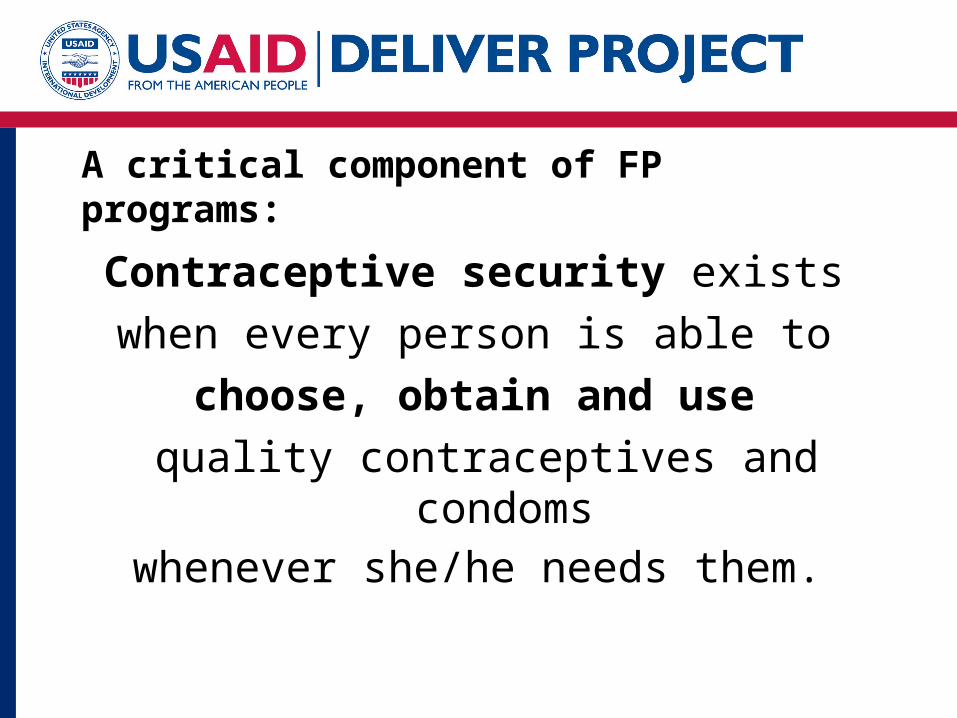
Reproductive Health Commodity Security Framework
Contraceptive Security Index
• Tool to raise awareness, support advocacy, focus priorities, monitor progress for CS
• Promotes a multisectoral approach to CS at the national, regional, and global levels
• Indicators cover a range of inputs and outputs, and programmatic and macro-level areas
• Over 60 countries from 5 regions
• 3 editions of the Index: 2003, 2006, 2009 – analysis of CS over an extended period of time
Methodology
• Minimize data collection costs and maximize data reliability, validity, and replicability by using only secondary data from regularly updated reliable sources
• Updated approximately every 3 years
• 5 components, 17 indicators– Supply chain (logistics)
– Financing
– Health and social environment
– Access
– Utilization
• Aggregate scores for each component and an overall score
Summary of Findings
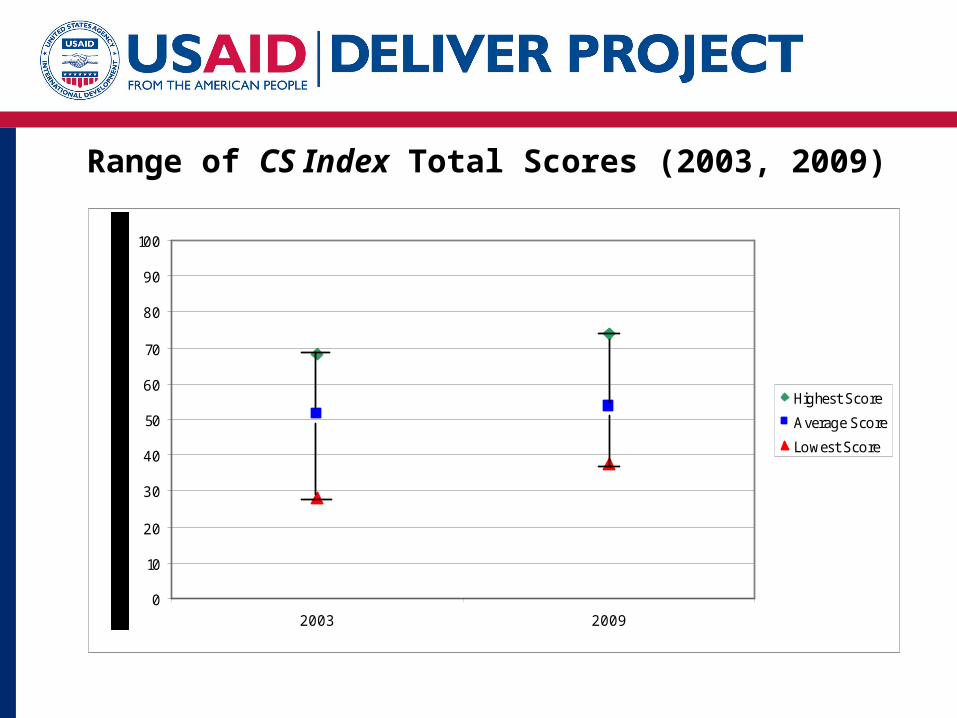
Range of CS Index Total Scores (2003, 2009)
0
10
20
30
40
50
60
70
80
90
100
2003 2009
Highest Score
Average Score
Lowest Score
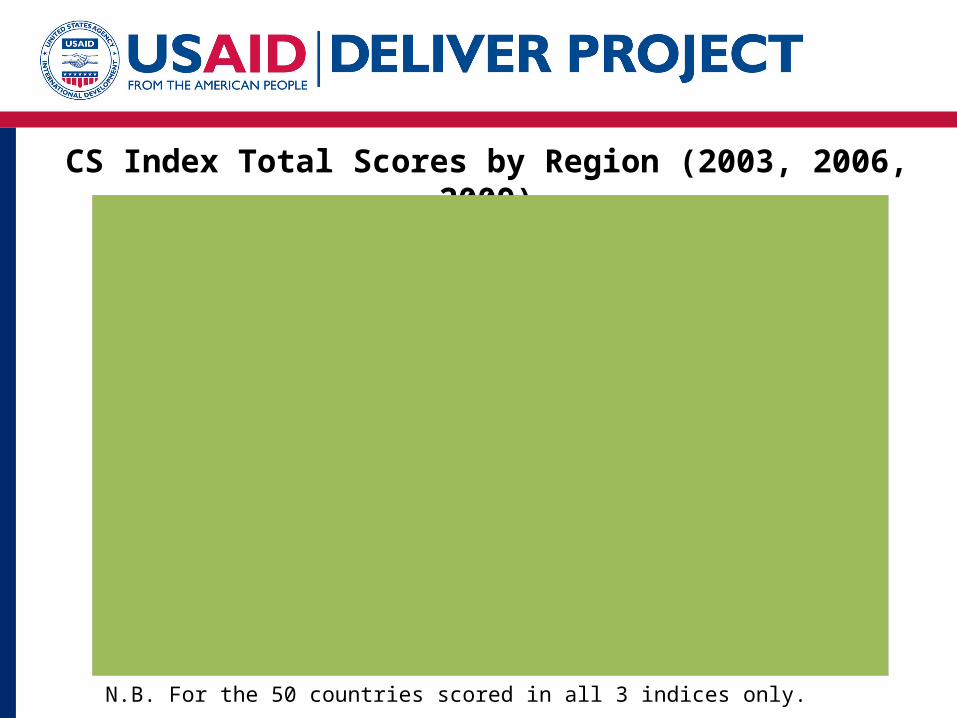
CS Index Total Scores by Region (2003, 2006, 2009)
0
10
20
30
40
50
60
70
80
90
100
Asia & the Pacific(n=7)
Eastern Europe &Central Asia (n=3)
Latin America & theCaribbean (n=13)
Middle East & NorthAfrica (n=4)
sub-Saharan Africa(n=23)
Overall Average (n=50)
2003
2006
2009
N.B. For the 50 countries scored in all 3 indices only.
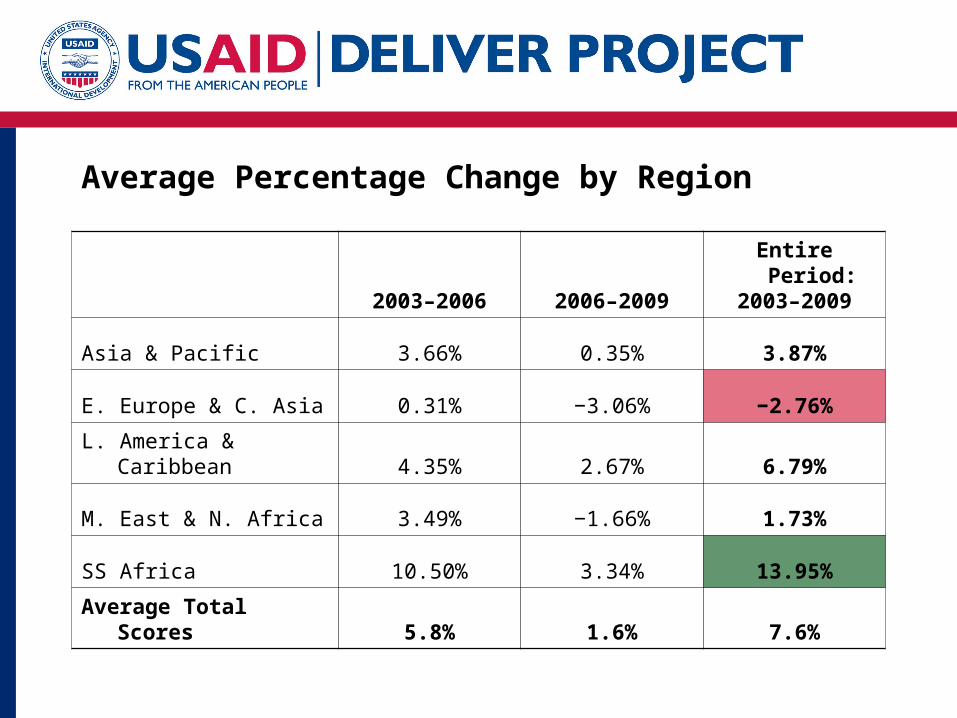
Average Percentage Change by Region
2003–2006 2006–2009
Entire Period:
2003–2009
Asia & Pacific 3.66% 0.35% 3.87%
E. Europe & C. Asia 0.31% −3.06% −2.76%
L. America & Caribbean 4.35% 2.67% 6.79%
M. East & N. Africa 3.49% −1.66% 1.73%
SS Africa 10.50% 3.34% 13.95%
Average Total Scores 5.8% 1.6% 7.6%
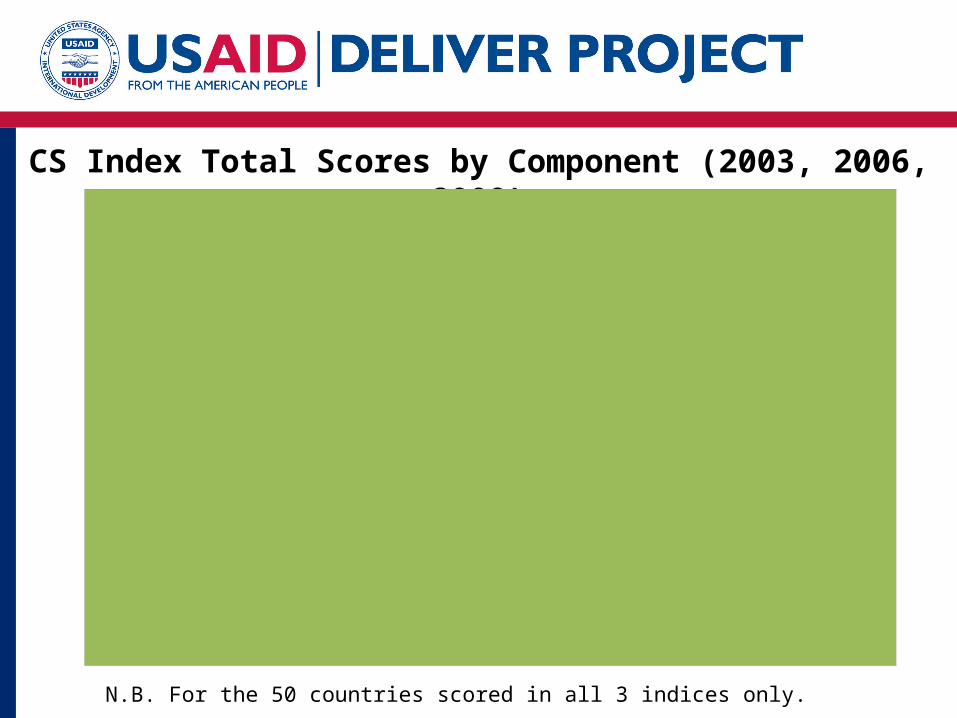
CS Index Total Scores by Component (2003, 2006, 2009)
N.B. For the 50 countries scored in all 3 indices only.
0
2
4
6
8
10
12
14
16
18
20
Supply Chain Finance Health & SocialEnvironment
Access Utilization
2003
2006
2009
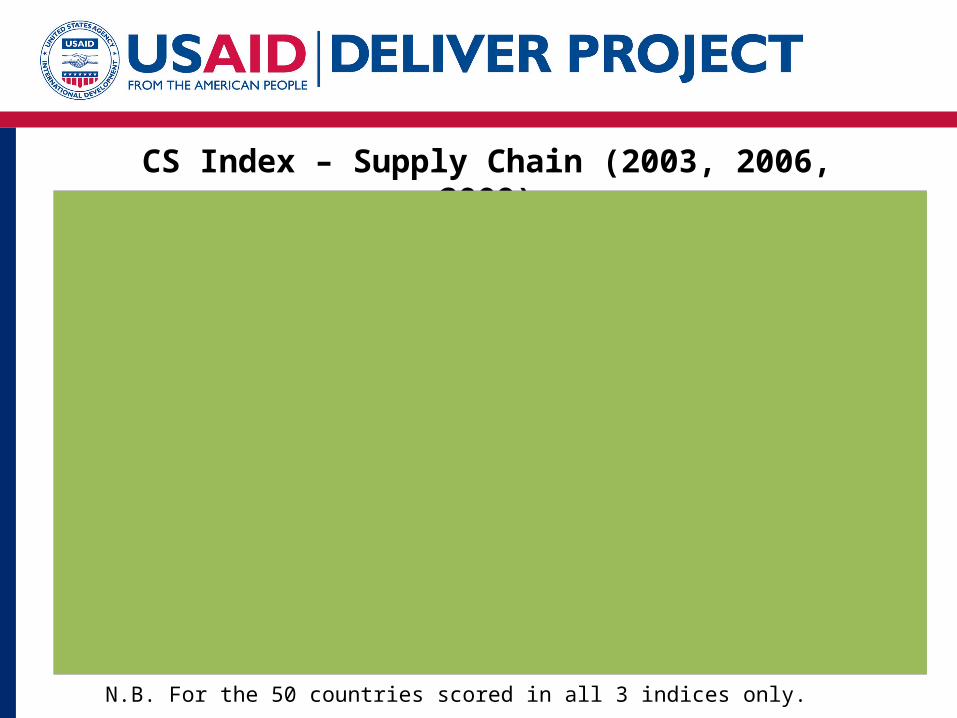
CS Index – Supply Chain (2003, 2006, 2009)
Supply Chain
0
2
4
6
8
10
12
14
16
18
20
Sub-Saharan Africa(n=23)
Asia & the Pacific(n=7)
Eastern Europe &Central Asia (n=3)
Latin America &the Caribbean
(n=13)
Middle East &North Africa (n=4)
All countries (n=50)
2003
2006
2009
N.B. For the 50 countries scored in all 3 indices only.
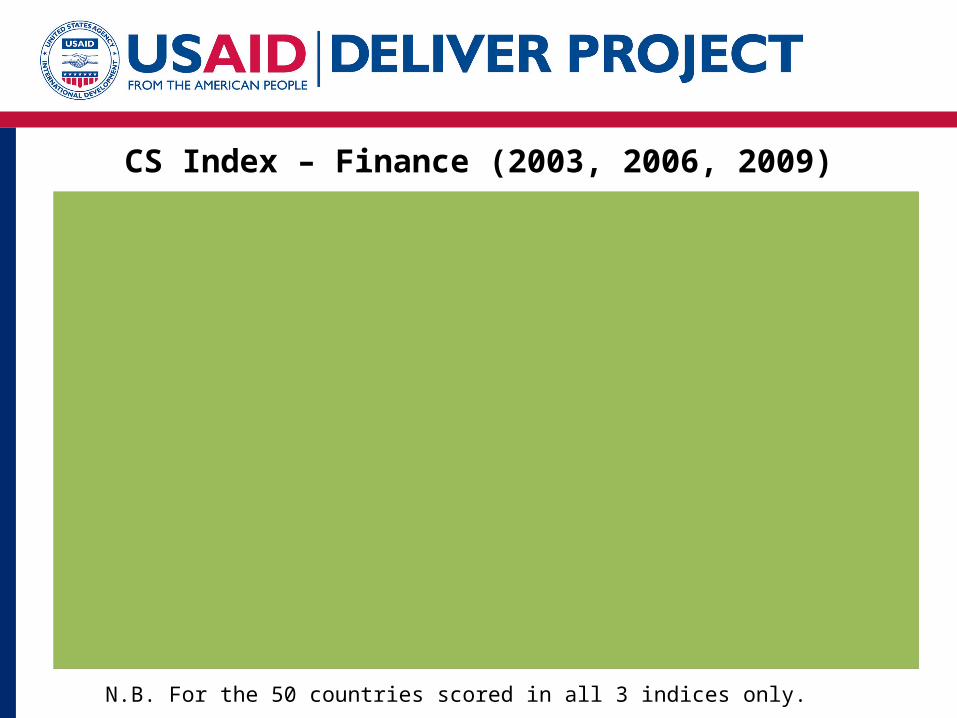
CS Index – Finance (2003, 2006, 2009)
Finance
0
2
4
6
8
10
12
14
16
18
20
Sub-Saharan Africa(n=23)
Asia & the Pacific(n=7)
Eastern Europe &Central Asia (n=3)
Latin America & theCaribbean (n=13)
Middle East &North Africa (n=4)
All countries (n=50)
2003
2006
2009
N.B. For the 50 countries scored in all 3 indices only.
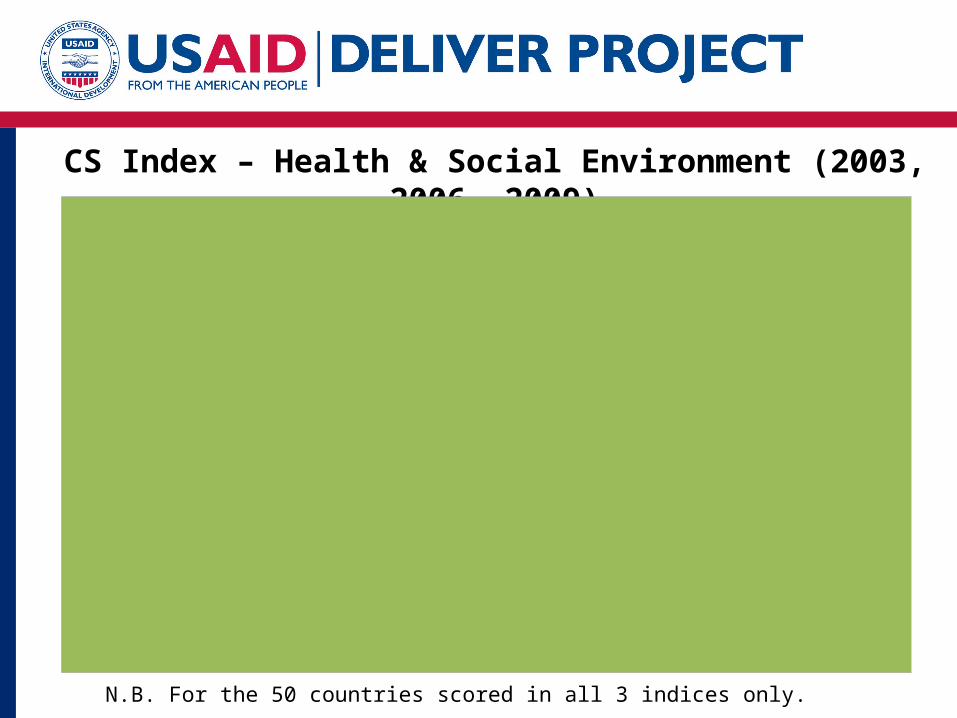
CS Index – Health & Social Environment (2003, 2006, 2009)
Health & Social Environment
0
2
4
6
8
10
12
14
16
18
20
Sub-Saharan Africa(n=23)
Asia & the Pacific(n=7)
Eastern Europe &Central Asia (n=3)
Latin America & theCaribbean (n=13)
Middle East &North Africa (n=4)
All countries (n=50)
2003
2006
2009
N.B. For the 50 countries scored in all 3 indices only.
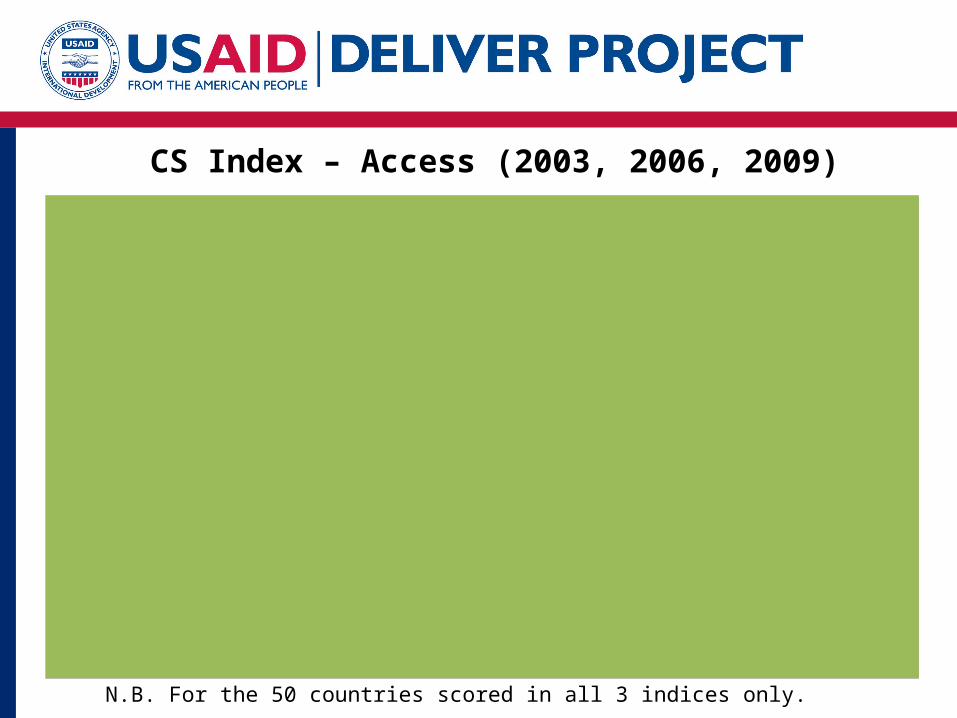
CS Index – Access (2003, 2006, 2009)
Access
0
2
4
6
8
10
12
14
16
18
20
Sub-Saharan Africa(n=23)
Asia & the Pacific(n=7)
Eastern Europe &Central Asia (n=3)
Latin America & theCaribbean (n=13)
Middle East &North Africa (n=4)
All countries (n=50)
2003
2006
2009
N.B. For the 50 countries scored in all 3 indices only.
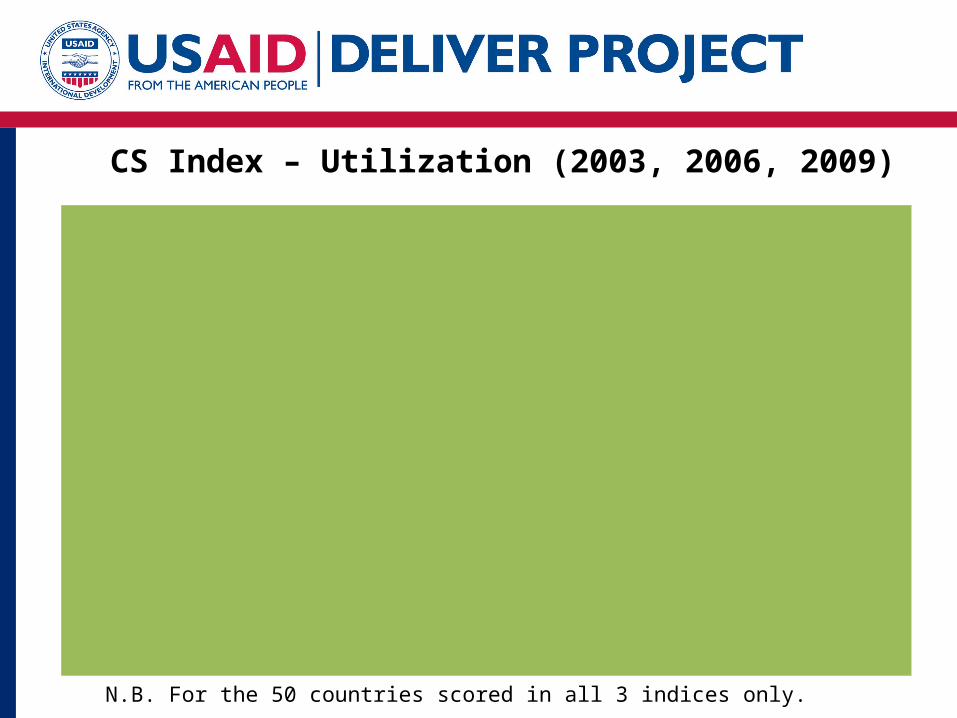
CS Index – Utilization (2003, 2006, 2009)
Utilization
0
2
4
6
8
10
12
14
16
18
20
Sub-Saharan Africa(n=23)
Asia & the Pacific(n=7)
Eastern Europe &Central Asia (n=3)
Latin America & theCaribbean (n=13)
Middle East &North Africa (n=4)
All countries (n=50)
2003
2006
2009
N.B. For the 50 countries scored in all 3 indices only.
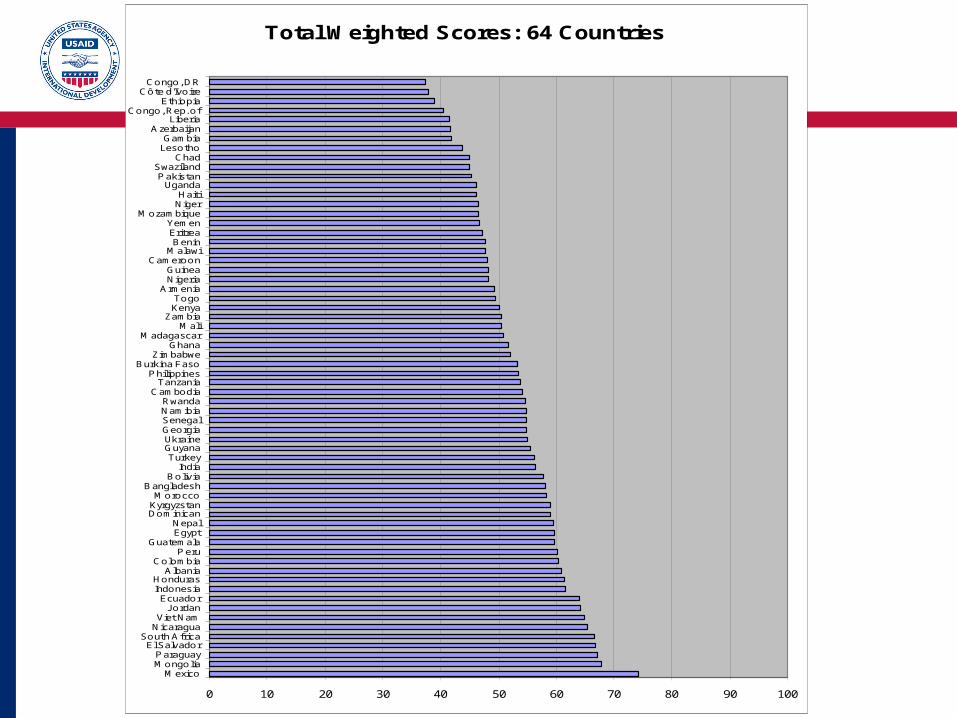
Total Weighted Scores: 64 Countries
0 10 20 30 40 50 60 70 80 90 100
MexicoMongoliaP araguay
El SalvadorSouth Africa
NicaraguaViet Nam
J ordanEcuador
IndonesiaHonduras
AlbaniaColombia
P eruGuatemala
EgyptNepal
DominicanKyrgyzstanMorocco
BangladeshBolivia
IndiaTurkey
GuyanaUkraineGeorgiaSenegalNamibiaRwanda
CambodiaTanzania
P hilippinesBurkina Faso
ZimbabweGhana
MadagascarMali
ZambiaKenyaTogo
ArmeniaNigeriaGuinea
CameroonMalawiBenin
EritreaYemen
MozambiqueNigerHaiti
UgandaP akistan
SwazilandChad
LesothoGambia
AzerbaijanLiberia
Congo, Rep. ofEthiopia
Côte d'IvoireCongo, DR
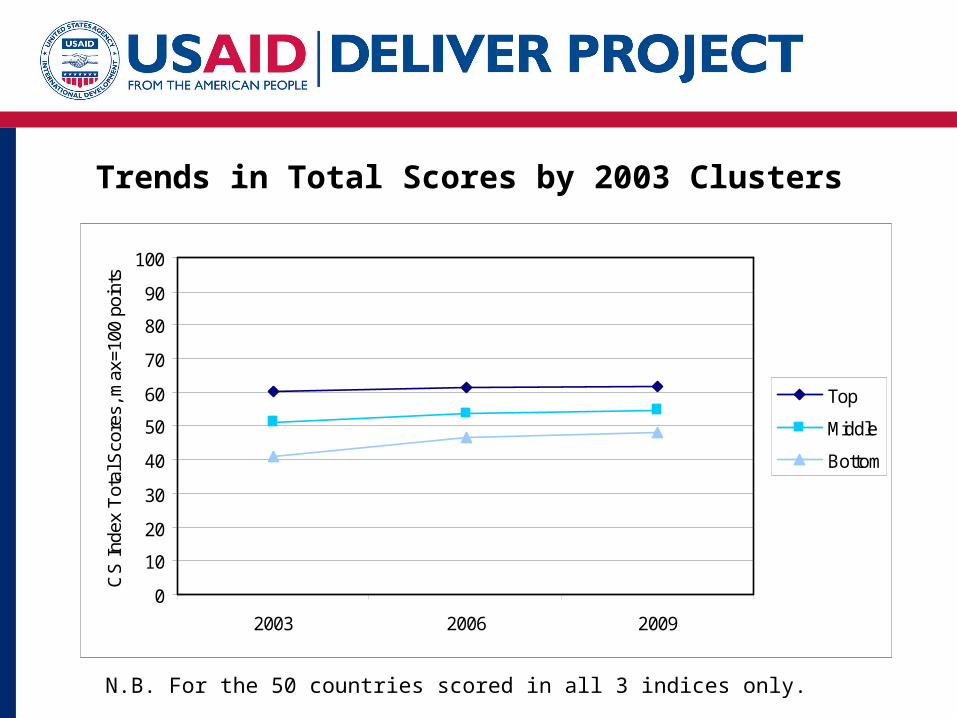
Trends in Total Scores by 2003 Clusters
0
10
20
30
40
50
60
70
80
90
100
2003 2006 2009
CS
Inde
x T
otal
Sco
res,
max
=100
poi
nts
Top
Middle
Bottom
N.B. For the 50 countries scored in all 3 indices only.
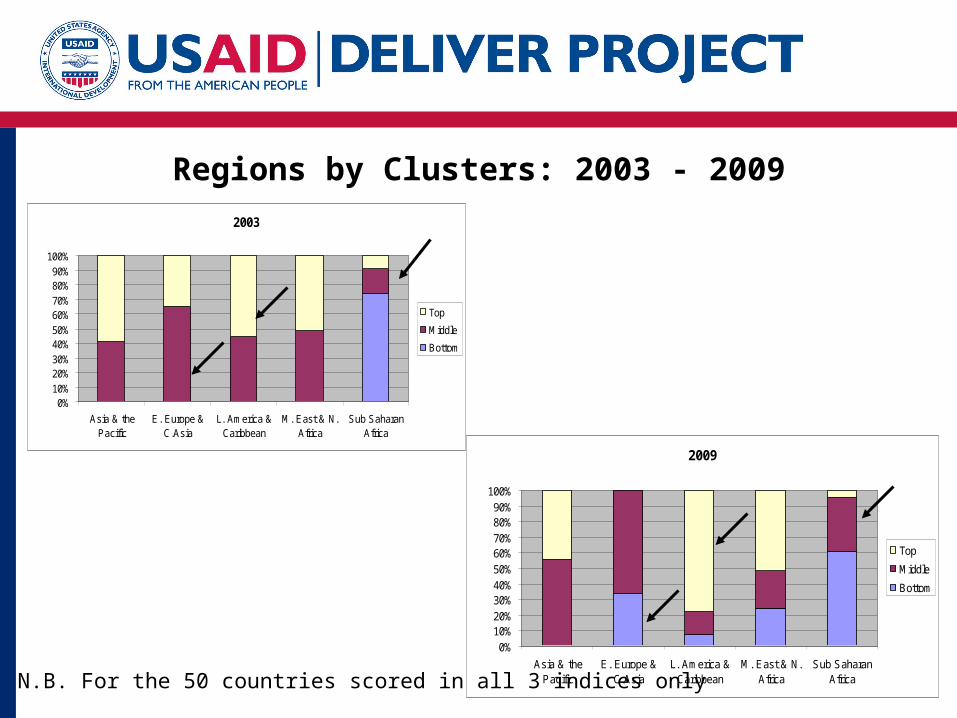
Regions by Clusters: 2003 - 2009
2003
0%10%20%30%40%50%60%70%80%90%
100%
Asia & thePacific
E. Europe &C.Asia
L. America &Caribbean
M. East & N.Africa
Sub SaharanAfrica
Top
Middle
Bottom
2009
0%10%20%30%40%50%60%70%80%90%
100%
Asia & thePacific
E. Europe &C.Asia
L. America &Caribbean
M. East & N.Africa
Sub SaharanAfrica
Top
Middle
Bottom
N.B. For the 50 countries scored in all 3 indices only
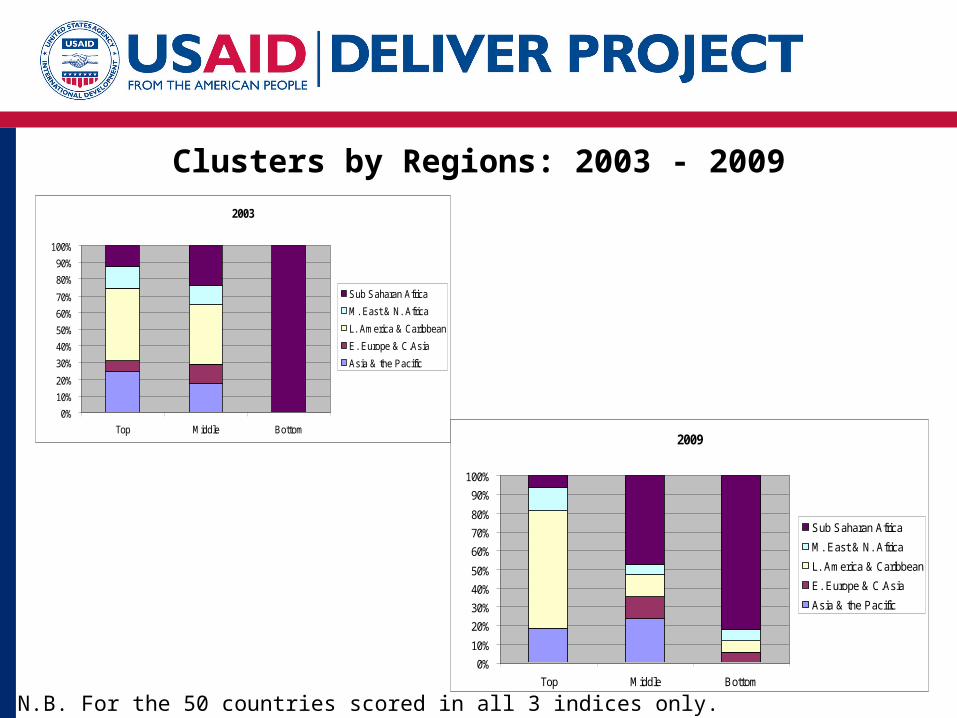
Clusters by Regions: 2003 - 20092003
0%
10%
20%
30%
40%
50%
60%
70%
80%
90%
100%
Top Middle Bottom
Sub Saharan Africa
M. East & N. Africa
L. America & Caribbean
E. Europe & C.Asia
Asia & the Pacific
2009
0%
10%
20%
30%
40%
50%
60%
70%
80%
90%
100%
Top Middle Bottom
Sub Saharan Africa
M. East & N. Africa
L. America & Caribbean
E. Europe & C.Asia
Asia & the Pacific
N.B. For the 50 countries scored in all 3 indices only.
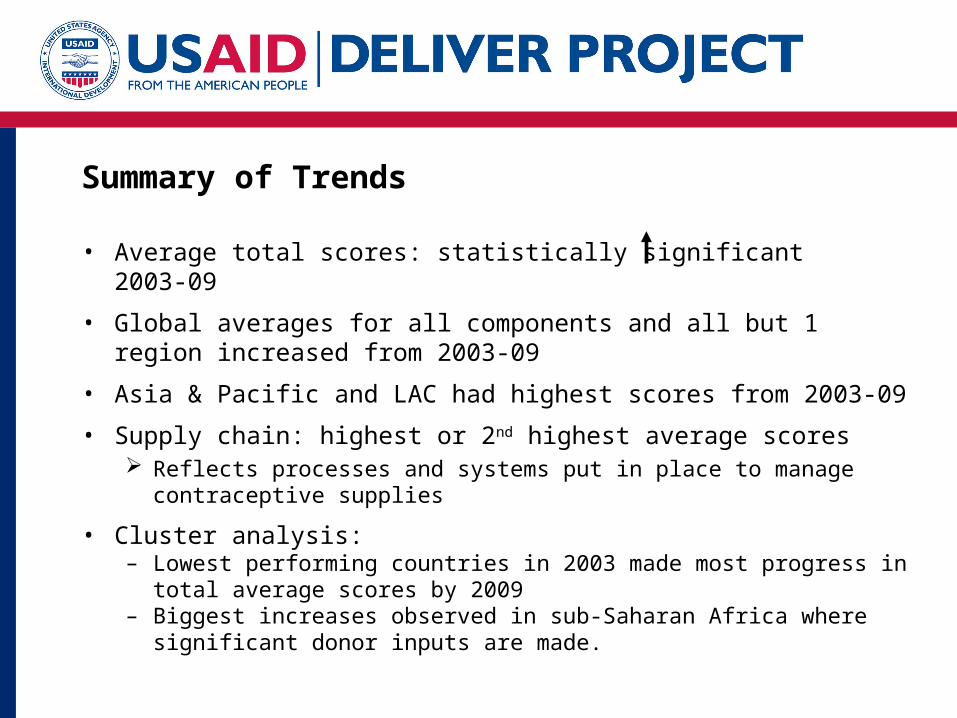
Summary of Trends
• Average total scores: statistically significant 2003-09
• Global averages for all components and all but 1 region increased from 2003-09
• Asia & Pacific and LAC had highest scores from 2003-09
• Supply chain: highest or 2nd highest average scores Reflects processes and systems put in place to manage contraceptive
supplies
• Cluster analysis: – Lowest performing countries in 2003 made most progress in total
average scores by 2009– Biggest increases observed in sub-Saharan Africa where significant
donor inputs are made.
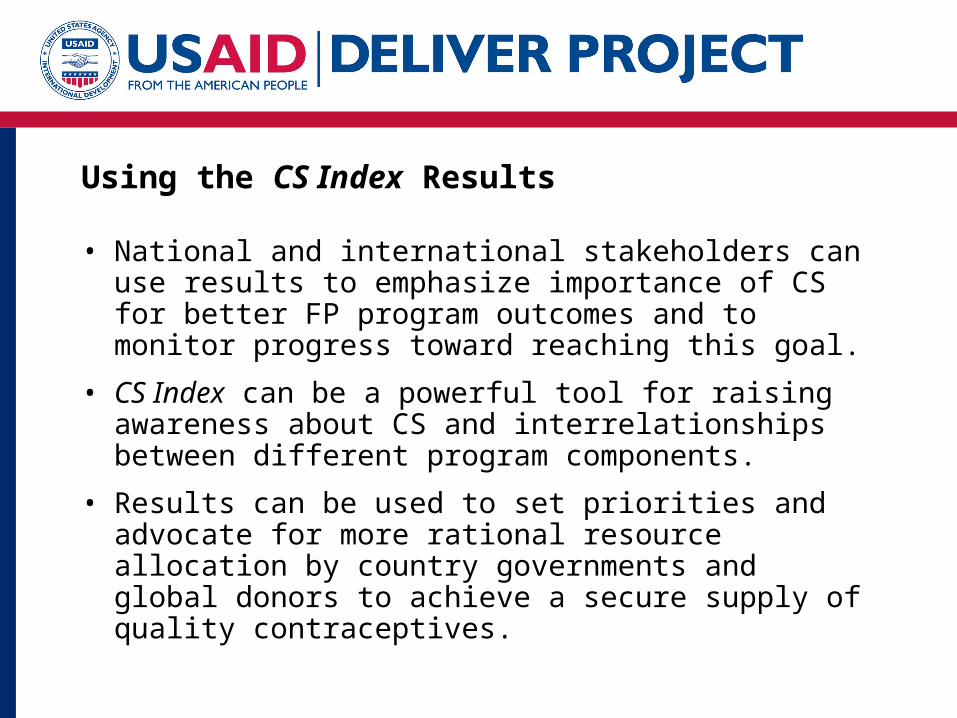
Using the CS Index Results
• National and international stakeholders can use results to emphasize importance of CS for better FP program outcomes and to monitor progress toward reaching this goal.
• CS Index can be a powerful tool for raising awareness about CS and interrelationships between different program components.
• Results can be used to set priorities and advocate for more rational resource allocation by country governments and global donors to achieve a secure supply of quality contraceptives.
CS Index 2003, 2006, and 2009
CS Index Technical Manual
and
Trends in Contraceptive Security: 2003-2009
are available online at:
deliver.jsi.com