Embed Size (px)
Citation preview
1
MONITORING REPORT
NARDINI BAGASSE COGENERATION PROJECT (NBCP)
Monitoring Period:
From 10 July, 2001 to 30 November, 2006
Version 6 May12th, 2009
Prepared by:
Econergy Brasil Ltda. Av. Angélica, 2530, cj 111.
01228-200, São Paulo, SP, Brazil. Ph.: +55 11 3555 5700 Fax: +55 11 3555 5735
2
1. Introduction
This document reports the Emission Reductions (ERs) generated by Nardini Bagasse
Cogeneration Project (hereinafter NBCP).
This project activity consists of increasing the efficiency in the bagasse (a renewable fuel
source, residue from sugarcane processing) cogeneration facility at Nardini Agroindustrial
Ltda., a Brazilian sugar mill. With the implementation of this project, the mill is able to sell
electricity to the national grid, avoiding the dispatch of same amount of energy produced by
fossil-fuelled thermal plants to that grid. By that, the initiative avoids CO2 emissions and
contributes to the regional and national sustainable development.
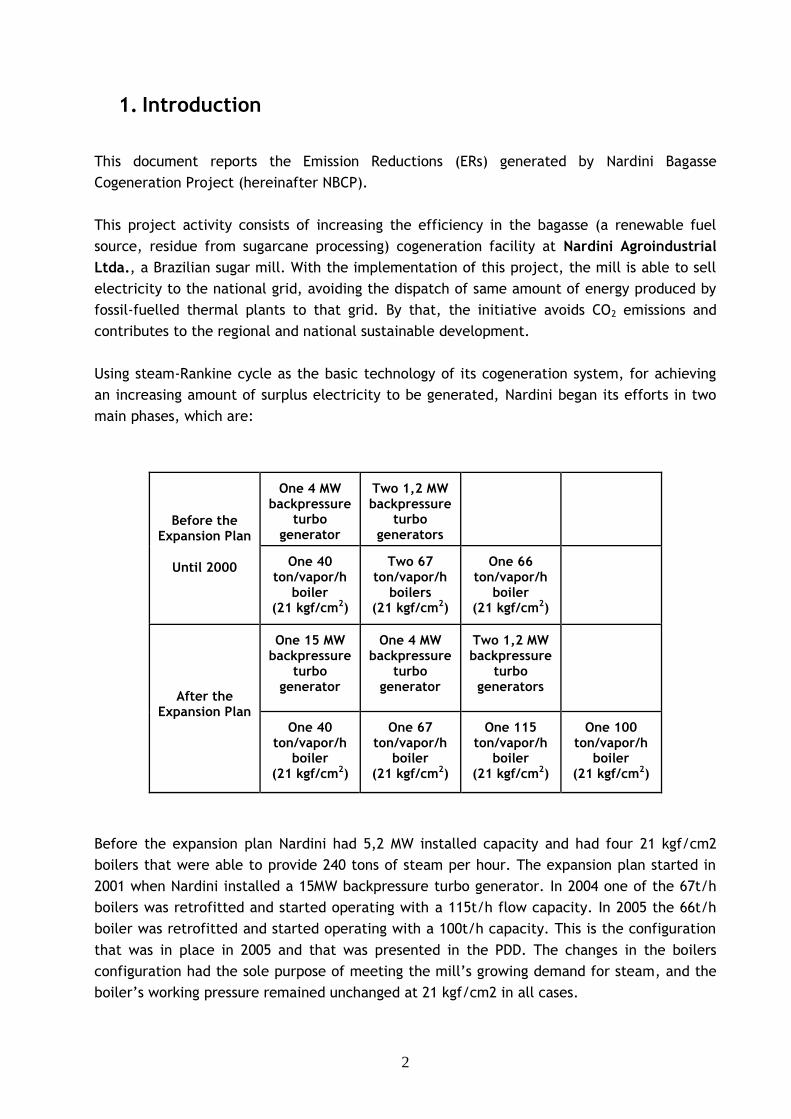
Using steam-Rankine cycle as the basic technology of its cogeneration system, for achieving
an increasing amount of surplus electricity to be generated, Nardini began its efforts in two
main phases, which are:
Before the Expansion Plan
Until 2000
One 4 MW backpressure
turbo generator
Two 1,2 MW backpressure
turbo generators
One 40 ton/vapor/h
boiler (21 kgf/cm2)
Two 67 ton/vapor/h
boilers (21 kgf/cm2)
One 66 ton/vapor/h
boiler (21 kgf/cm2)
After the Expansion Plan
One 15 MW backpressure
turbo generator
One 4 MW backpressure
turbo generator
Two 1,2 MW backpressure
turbo generators
One 40 ton/vapor/h
boiler (21 kgf/cm2)
One 67 ton/vapor/h
boiler (21 kgf/cm2)
One 115 ton/vapor/h
boiler (21 kgf/cm2)
One 100 ton/vapor/h
boiler (21 kgf/cm2)
Before the expansion plan Nardini had 5,2 MW installed capacity and had four 21 kgf/cm2
boilers that were able to provide 240 tons of steam per hour. The expansion plan started in
2001 when Nardini installed a 15MW backpressure turbo generator. In 2004 one of the 67t/h
boilers was retrofitted and started operating with a 115t/h flow capacity. In 2005 the 66t/h
boiler was retrofitted and started operating with a 100t/h capacity. This is the configuration
that was in place in 2005 and that was presented in the PDD. The changes in the boilers
configuration had the sole purpose of meeting the mill’s growing demand for steam, and the
boiler’s working pressure remained unchanged at 21 kgf/cm2 in all cases.
3
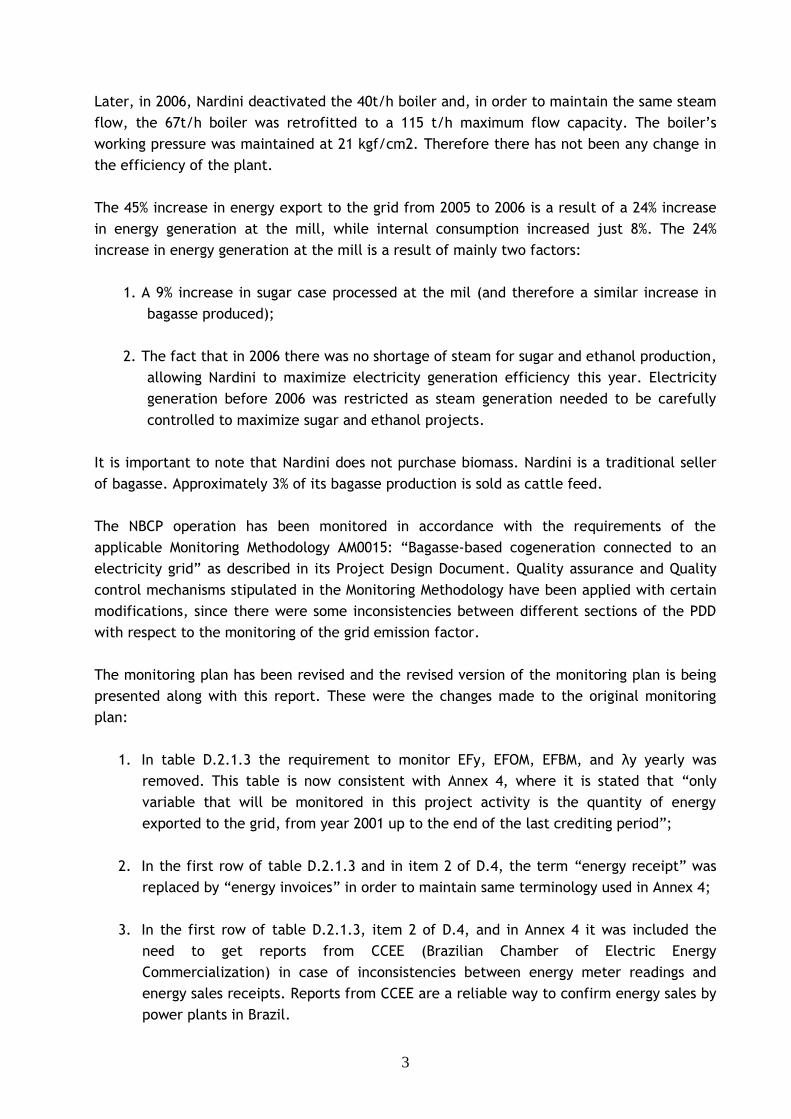
Later, in 2006, Nardini deactivated the 40t/h boiler and, in order to maintain the same steam
flow, the 67t/h boiler was retrofitted to a 115 t/h maximum flow capacity. The boiler’s
working pressure was maintained at 21 kgf/cm2. Therefore there has not been any change in
the efficiency of the plant.
The 45% increase in energy export to the grid from 2005 to 2006 is a result of a 24% increase
in energy generation at the mill, while internal consumption increased just 8%. The 24%
increase in energy generation at the mill is a result of mainly two factors:
1. A 9% increase in sugar case processed at the mil (and therefore a similar increase in
bagasse produced);
2. The fact that in 2006 there was no shortage of steam for sugar and ethanol production,
allowing Nardini to maximize electricity generation efficiency this year. Electricity
generation before 2006 was restricted as steam generation needed to be carefully
controlled to maximize sugar and ethanol projects.
It is important to note that Nardini does not purchase biomass. Nardini is a traditional seller
of bagasse. Approximately 3% of its bagasse production is sold as cattle feed.
The NBCP operation has been monitored in accordance with the requirements of the
applicable Monitoring Methodology AM0015: “Bagasse-based cogeneration connected to an
electricity grid” as described in its Project Design Document. Quality assurance and Quality
control mechanisms stipulated in the Monitoring Methodology have been applied with certain
modifications, since there were some inconsistencies between different sections of the PDD
with respect to the monitoring of the grid emission factor.
The monitoring plan has been revised and the revised version of the monitoring plan is being
presented along with this report. These were the changes made to the original monitoring
plan:
1. In table D.2.1.3 the requirement to monitor EFy, EFOM, EFBM, and λy yearly was
removed. This table is now consistent with Annex 4, where it is stated that “only
variable that will be monitored in this project activity is the quantity of energy
exported to the grid, from year 2001 up to the end of the last crediting period”;
2. In the first row of table D.2.1.3 and in item 2 of D.4, the term “energy receipt” was
replaced by “energy invoices” in order to maintain same terminology used in Annex 4;
3. In the first row of table D.2.1.3, item 2 of D.4, and in Annex 4 it was included the
need to get reports from CCEE (Brazilian Chamber of Electric Energy
Commercialization) in case of inconsistencies between energy meter readings and
energy sales receipts. Reports from CCEE are a reliable way to confirm energy sales by
power plants in Brazil.
4
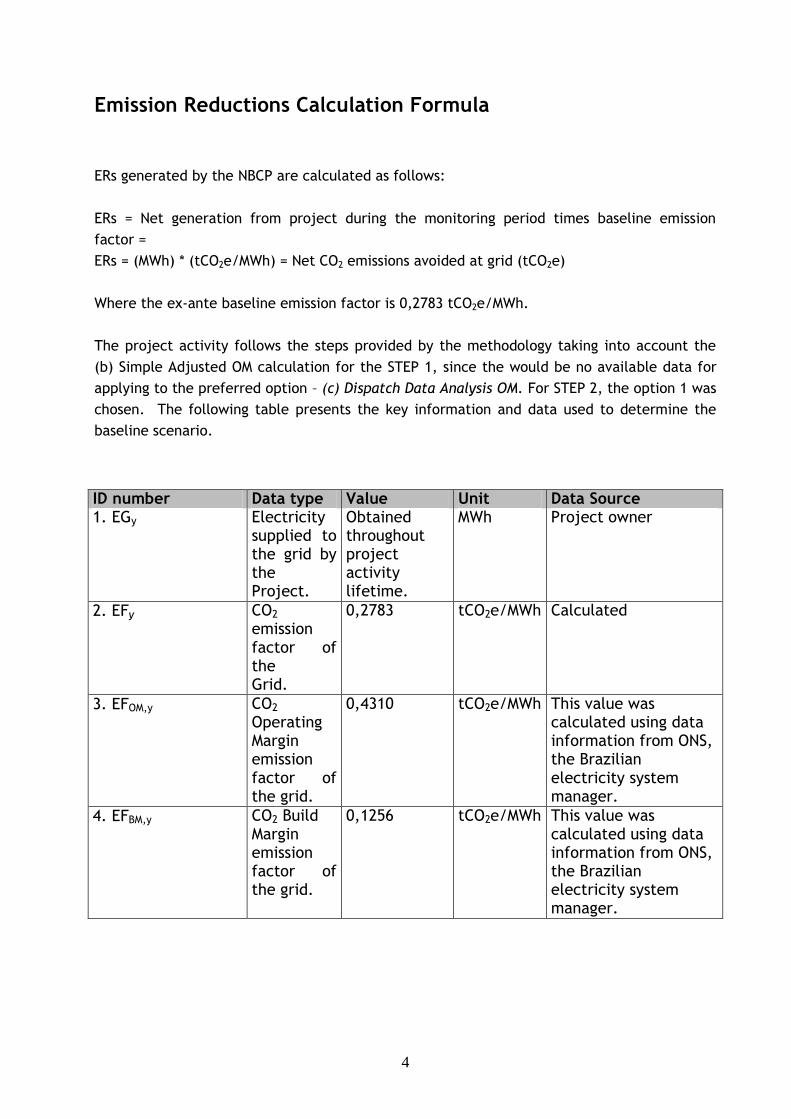
Emission Reductions Calculation Formula
ERs generated by the NBCP are calculated as follows:
ERs = Net generation from project during the monitoring period times baseline emission
factor =
ERs = (MWh) * (tCO2e/MWh) = Net CO2 emissions avoided at grid (tCO2e)
Where the ex-ante baseline emission factor is 0,2783 tCO2e/MWh.
The project activity follows the steps provided by the methodology taking into account the
(b) Simple Adjusted OM calculation for the STEP 1, since the would be no available data for
applying to the preferred option – (c) Dispatch Data Analysis OM. For STEP 2, the option 1 was
chosen. The following table presents the key information and data used to determine the
baseline scenario.
ID number Data type Value Unit Data Source 1. EGy Electricity
supplied to the grid by the Project.
Obtained throughout project activity lifetime.
MWh Project owner
2. EFy CO2 emission factor of the Grid.
0,2783 tCO2e/MWh Calculated
3. EFOM,y CO2 Operating Margin emission factor of the grid.
0,4310 tCO2e/MWh This value was calculated using data information from ONS, the Brazilian electricity system manager.
4. EFBM,y CO2 Build Margin emission factor of the grid.
0,1256 tCO2e/MWh This value was calculated using data information from ONS, the Brazilian electricity system manager.
5
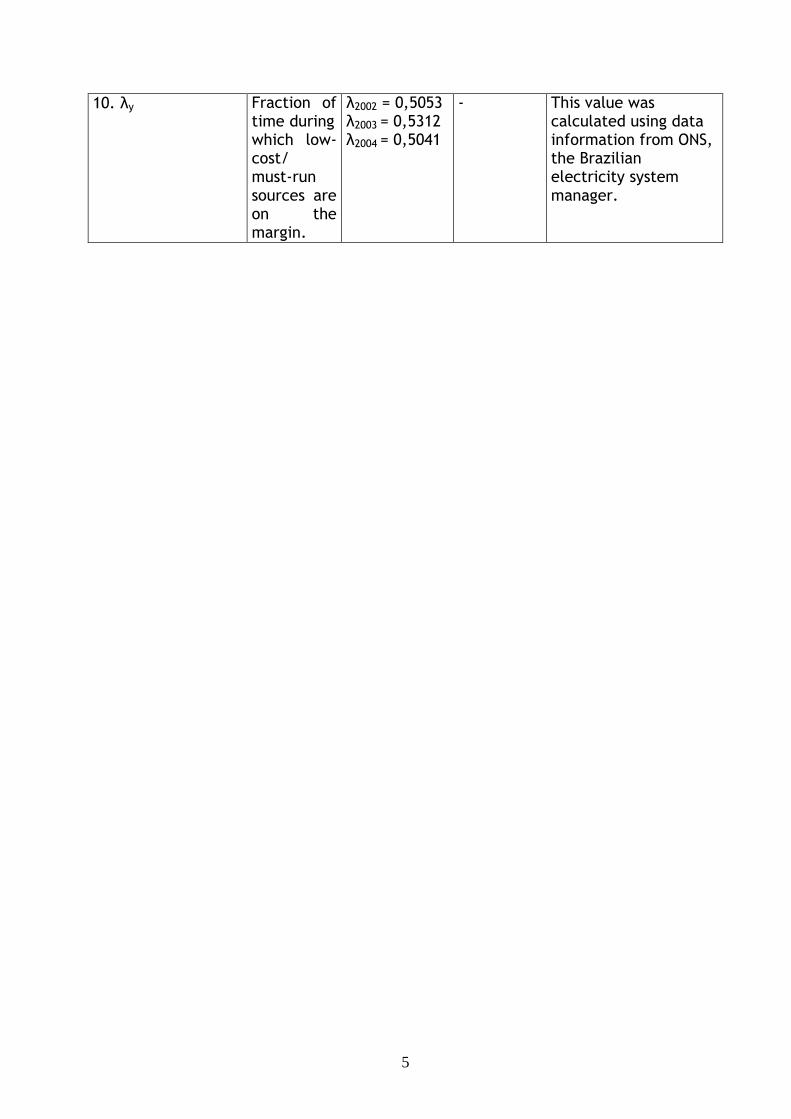
10. λy Fraction of time during which low-cost/ must-run sources are on the margin.
λ2002 = 0,5053 λ2003 = 0,5312 λ2004 = 0,5041
- This value was calculated using data information from ONS, the Brazilian electricity system manager.
6
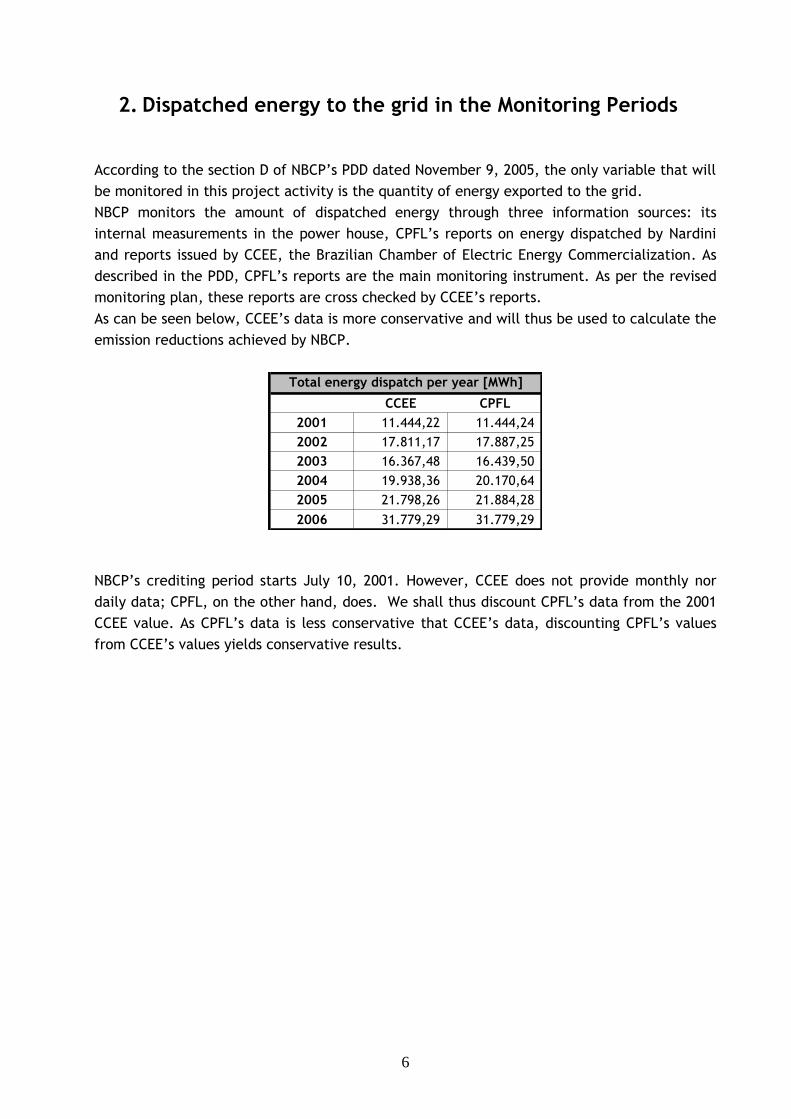
2. Dispatched energy to the grid in the Monitoring Periods
According to the section D of NBCP’s PDD dated November 9, 2005, the only variable that will
be monitored in this project activity is the quantity of energy exported to the grid.
NBCP monitors the amount of dispatched energy through three information sources: its
internal measurements in the power house, CPFL’s reports on energy dispatched by Nardini
and reports issued by CCEE, the Brazilian Chamber of Electric Energy Commercialization. As
described in the PDD, CPFL’s reports are the main monitoring instrument. As per the revised
monitoring plan, these reports are cross checked by CCEE’s reports.
As can be seen below, CCEE’s data is more conservative and will thus be used to calculate the
emission reductions achieved by NBCP.
CCEE CPFL
2001 11.444,22 11.444,24
2002 17.811,17 17.887,25
2003 16.367,48 16.439,50
2004 19.938,36 20.170,64
2005 21.798,26 21.884,28
2006 31.779,29 31.779,29
Total energy dispatch per year [MWh]
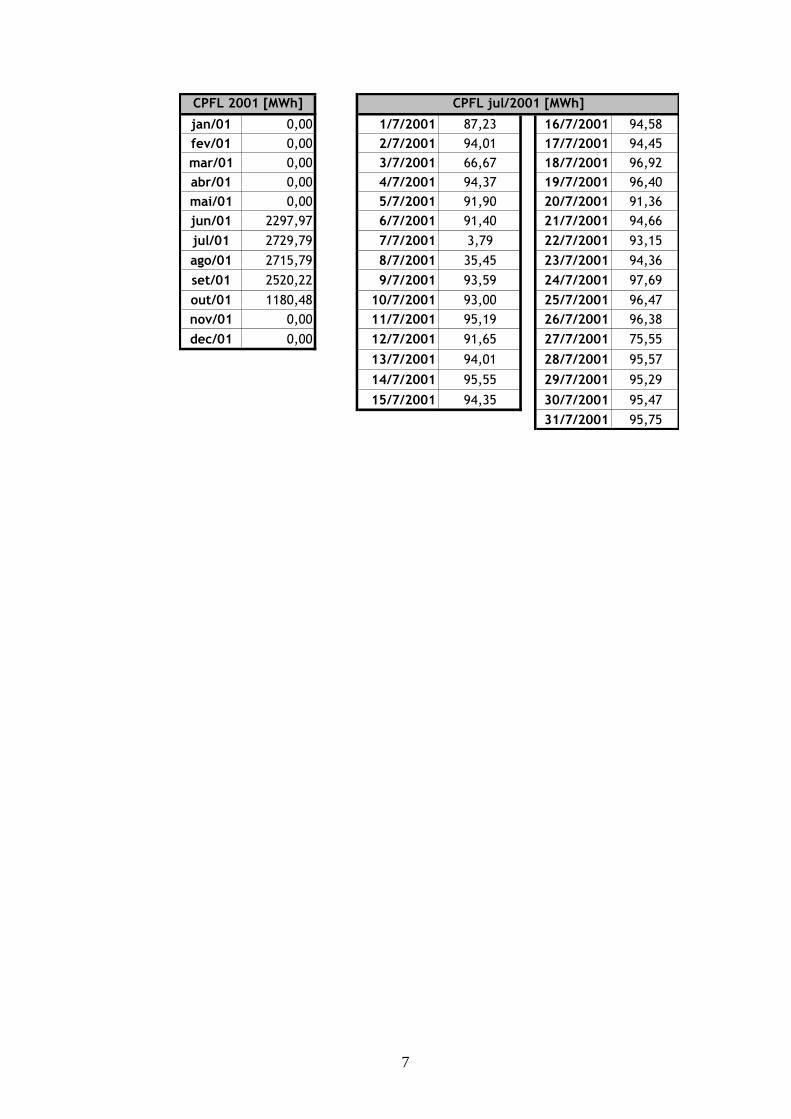
NBCP’s crediting period starts July 10, 2001. However, CCEE does not provide monthly nor
daily data; CPFL, on the other hand, does. We shall thus discount CPFL’s data from the 2001
CCEE value. As CPFL’s data is less conservative that CCEE’s data, discounting CPFL’s values
from CCEE’s values yields conservative results.
7
jan/01 0,00 1/7/2001 87,23 16/7/2001 94,58
fev/01 0,00 2/7/2001 94,01 17/7/2001 94,45
mar/01 0,00 3/7/2001 66,67 18/7/2001 96,92
abr/01 0,00 4/7/2001 94,37 19/7/2001 96,40
mai/01 0,00 5/7/2001 91,90 20/7/2001 91,36
jun/01 2297,97 6/7/2001 91,40 21/7/2001 94,66
jul/01 2729,79 7/7/2001 3,79 22/7/2001 93,15
ago/01 2715,79 8/7/2001 35,45 23/7/2001 94,36
set/01 2520,22 9/7/2001 93,59 24/7/2001 97,69
out/01 1180,48 10/7/2001 93,00 25/7/2001 96,47
nov/01 0,00 11/7/2001 95,19 26/7/2001 96,38
dec/01 0,00 12/7/2001 91,65 27/7/2001 75,55
13/7/2001 94,01 28/7/2001 95,57
14/7/2001 95,55 29/7/2001 95,29
15/7/2001 94,35 30/7/2001 95,47
31/7/2001 95,75
CPFL jul/2001 [MWh]CPFL 2001 [MWh]
8
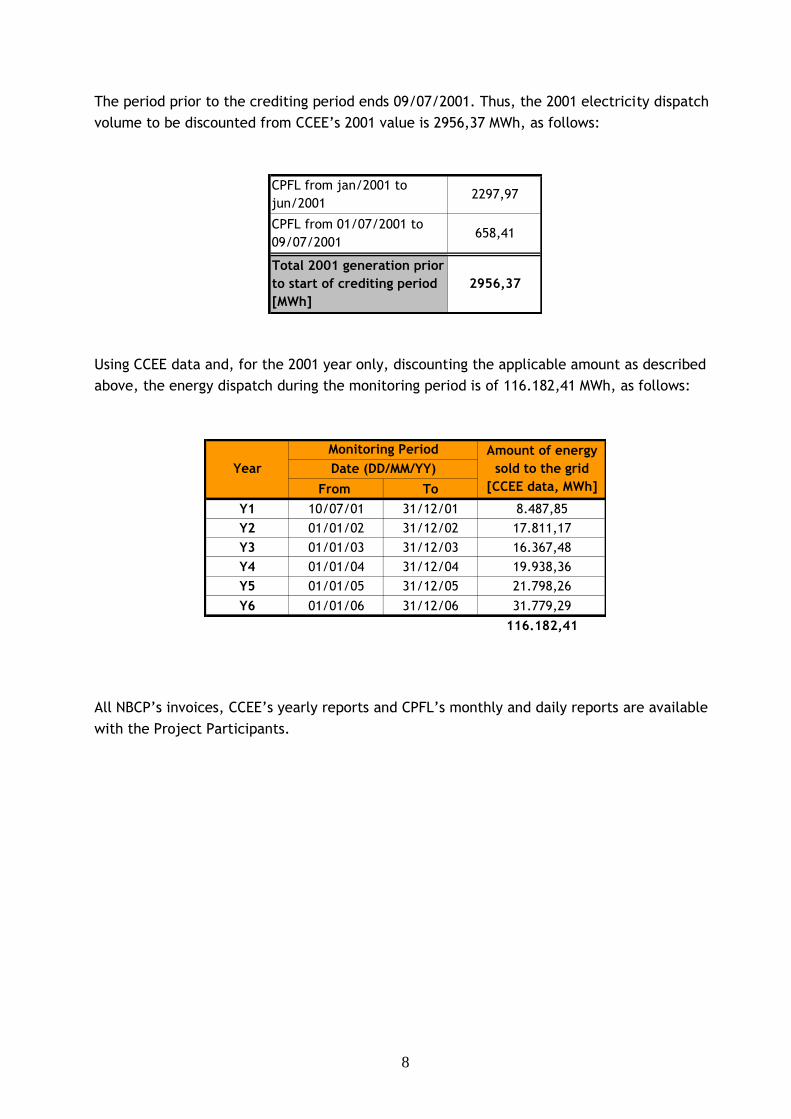
The period prior to the crediting period ends 09/07/2001. Thus, the 2001 electricity dispatch
volume to be discounted from CCEE’s 2001 value is 2956,37 MWh, as follows:
CPFL from jan/2001 to
jun/20012297,97
Total 2001 generation prior
to start of crediting period
[MWh]
658,41
2956,37
CPFL from 01/07/2001 to
09/07/2001
Using CCEE data and, for the 2001 year only, discounting the applicable amount as described
above, the energy dispatch during the monitoring period is of 116.182,41 MWh, as follows:
From To
Y1 10/07/01 31/12/01 8.487,85
Y2 01/01/02 31/12/02 17.811,17
Y3 01/01/03 31/12/03 16.367,48
Y4 01/01/04 31/12/04 19.938,36
Y5 01/01/05 31/12/05 21.798,26
Y6 01/01/06 31/12/06 31.779,29
116.182,41
Date (DD/MM/YY)
Amount of energy
sold to the grid
[CCEE data, MWh]
Year
Monitoring Period
All NBCP’s invoices, CCEE’s yearly reports and CPFL’s monthly and daily reports are available
with the Project Participants.
9
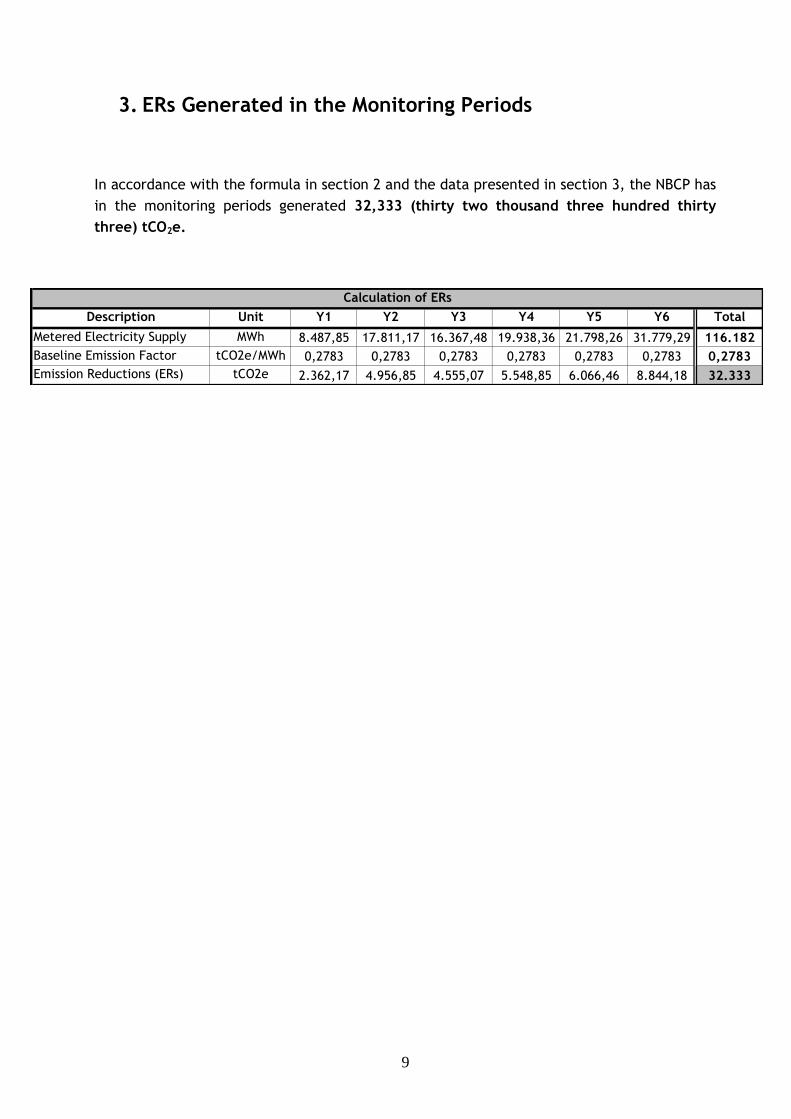
3. ERs Generated in the Monitoring Periods
In accordance with the formula in section 2 and the data presented in section 3, the NBCP has
in the monitoring periods generated 32,333 (thirty two thousand three hundred thirty
three) tCO2e.
Description Unit Y1 Y2 Y3 Y4 Y5 Y6 Total
Metered Electricity Supply MWh 8.487,85 17.811,17 16.367,48 19.938,36 21.798,26 31.779,29 116.182
Baseline Emission Factor tCO2e/MWh 0,2783 0,2783 0,2783 0,2783 0,2783 0,2783 0,2783
Emission Reductions (ERs) tCO2e 2.362,17 4.956,85 4.555,07 5.548,85 6.066,46 8.844,18 32.333
Calculation of ERs