Embed Size (px)
Citation preview
wat e r r e s e a r c h 4 4 ( 2 0 1 0 ) 5 1 2 9e5 1 4 9
Avai lab le a t www.sc iencedi rec t .com
journa l homepage : www.e lsev ie r . com/ loca te /wat res
Review
Monitoring techniques for odour abatement assessment
Raul Munoz a,b, Eric C. Sivret b,*, Gavin Parcsi b, R. Lebrero a, Xinguang Wang b,I.H. (Mel) Suffet c, Richard M. Stuetz b
aDepartment of Chemical Engineering and Environmental Technology, Valladolid University, Paseo del Prado de la Magdalena, s/n, 47011,
Valladolid, SpainbUNSW Water Research Centre. School of Civil and Environmental Engineering, The University of New South Wales, Sydney, NSW, 2052,
AustraliacEnvironmental Science and Engineering Program, School of Public Health, UCLA, CA 90095-1772, USA
a r t i c l e i n f o
Article history:
Received 1 February 2010
Received in revised form
17 May 2010
Accepted 5 June 2010
Available online 17 June 2010
Keywords:
Odours
Odour measurement
Sensory analysis
Olfactometry
GC-MS
Electronic nose
Odour abatement
* Corresponding author. Tel.: þ61 2 9385 521E-mail addresses: [email protected] (R.
[email protected] (X. Wang), msuffet@ucl0043-1354/$ e see front matter ª 2010 Elsevdoi:10.1016/j.watres.2010.06.013
a b s t r a c t
Odorous emissions from sewers and wastewater treatment plants are a complex mixture
of volatile chemicals that can cause annoyance to local populations, resulting in
complaints to wastewater operators. Due to the variability in hedonic tone and chemical
character of odorous emissions, no analytical technique can be applied universally for
the assessment of odour abatement performance. Recent developments in analytical
methodologies, specifically gas chromatography, odour assessment approaches (odour
wheels, the odour profile method and dynamic olfactometry), and more recently
combined gas chromatography-sensory analysis, have contributed to improvements in
our ability to assesses odorous emissions in terms of odorant concentration and
composition. This review collates existing knowledge with the aim of providing new
insight into the effectiveness of sensorial and characterisation approaches to improve
our understanding of the fate of odorous emissions during odour abatement. While
research in non-specific sensor array (e-nose) technology has resulted in progress in the
field of continuous odour monitoring, more successful long term case-studies are still
needed to overcome the early overoptimistic performance expectations. Knowledge gaps
still remain with regards to the decomposition of thermally unstable volatile compounds
(especially sulfur compounds), the inability to predict synergistic, antagonistic, or addi-
tive interactions among odorants in combined chemical/sensorial analysis techniques,
and the long term stability of chemical sensors due to sensor drift, aging, temperature/
relative humidity effects, and temporal variations. Future odour abatement monitoring
will require the identification of key odorants to facilitate improved process selection,
design and management.
ª 2010 Elsevier Ltd. All rights reserved.
4; fax: þ 61 2 9313 8624.Munoz), [email protected] (E.C. Sivret), [email protected] (G. Parcsi), xinguang.a.edu (I.H.(Mel) Suffet), [email protected] (R.M. Stuetz).ier Ltd. All rights reserved.
wat e r r e s e a r c h 4 4 ( 2 0 1 0 ) 5 1 2 9e5 1 4 95130
Contents
1. Introduction . . . . . . . . . . . . . . . . . . . . . . . . . . . . . . . . . . . . . . . . . . . . . . . . . . . . . . . . . . . . . . . . . . . . . . . . . . . . . . . . . . . . . . . . . . . . . . 51302. Analytical techniques . . . . . . . . . . . . . . . . . . . . . . . . . . . . . . . . . . . . . . . . . . . . . . . . . . . . . . . . . . . . . . . . . . . . . . . . . . . . . . . . . . . . . . 5131
2.1. Gas chromatography . . . . . . . . . . . . . . . . . . . . . . . . . . . . . . . . . . . . . . . . . . . . . . . . . . . . . . . . . . . . . . . . . . . . . . . . . . . . . . . . . 51312.1.1. Sample pre-concentration . . . . . . . . . . . . . . . . . . . . . . . . . . . . . . . . . . . . . . . . . . . . . . . . . . . . . . . . . . . . . . . . . . . . . 51322.1.2. Gas chromatography analysis limitations . . . . . . . . . . . . . . . . . . . . . . . . . . . . . . . . . . . . . . . . . . . . . . . . . . . . . . . 5134
2.2. Specific gas sensors . . . . . . . . . . . . . . . . . . . . . . . . . . . . . . . . . . . . . . . . . . . . . . . . . . . . . . . . . . . . . . . . . . . . . . . . . . . . . . . . . . 51342.3. Non-specific gas sensors . . . . . . . . . . . . . . . . . . . . . . . . . . . . . . . . . . . . . . . . . . . . . . . . . . . . . . . . . . . . . . . . . . . . . . . . . . . . . 5135
2.3.1. Non-specific gas monitoring limitations . . . . . . . . . . . . . . . . . . . . . . . . . . . . . . . . . . . . . . . . . . . . . . . . . . . . . . . . 51373. Sensorial analysis . . . . . . . . . . . . . . . . . . . . . . . . . . . . . . . . . . . . . . . . . . . . . . . . . . . . . . . . . . . . . . . . . . . . . . . . . . . . . . . . . . . . . . . . . 5138
3.1. Quantitative sensorial analysis (total odour) . . . . . . . . . . . . . . . . . . . . . . . . . . . . . . . . . . . . . . . . . . . . . . . . . . . . . . . . . . . 51383.1.1. Improved standardization of dynamic olfactometry . . . . . . . . . . . . . . . . . . . . . . . . . . . . . . . . . . . . . . . . . . . . . 51393.1.2. Dynamic olfactometry limitations . . . . . . . . . . . . . . . . . . . . . . . . . . . . . . . . . . . . . . . . . . . . . . . . . . . . . . . . . . . . . 5139
3.2. Qualitative sensorial analysis (odour profile method) . . . . . . . . . . . . . . . . . . . . . . . . . . . . . . . . . . . . . . . . . . . . . . . . . . . 51403.2.1. Odour profile method . . . . . . . . . . . . . . . . . . . . . . . . . . . . . . . . . . . . . . . . . . . . . . . . . . . . . . . . . . . . . . . . . . . . . . . . . 51413.2.2. Qualitative field analysis of odorants . . . . . . . . . . . . . . . . . . . . . . . . . . . . . . . . . . . . . . . . . . . . . . . . . . . . . . . . . . 5141
4. Combined sensorial-analytical techniques . . . . . . . . . . . . . . . . . . . . . . . . . . . . . . . . . . . . . . . . . . . . . . . . . . . . . . . . . . . . . . . . . . . 51414.1. Limitation of combined gas chromatography-olfactometry analysis . . . . . . . . . . . . . . . . . . . . . . . . . . . . . . . . . . . . . . 5142
5. Applications of odour abatement process monitoring . . . . . . . . . . . . . . . . . . . . . . . . . . . . . . . . . . . . . . . . . . . . . . . . . . . . . . . . . 51425.1. Odour monitoring for full and pilot-scale processes . . . . . . . . . . . . . . . . . . . . . . . . . . . . . . . . . . . . . . . . . . . . . . . . . . . . 51435.2. Odour monitoring for laboratory-scale processes . . . . . . . . . . . . . . . . . . . . . . . . . . . . . . . . . . . . . . . . . . . . . . . . . . . . . . . 5143
6. Conclusions . . . . . . . . . . . . . . . . . . . . . . . . . . . . . . . . . . . . . . . . . . . . . . . . . . . . . . . . . . . . . . . . . . . . . . . . . . . . . . . . . . . . . . . . . . . . . . . 5146Acknowledgments . . . . . . . . . . . . . . . . . . . . . . . . . . . . . . . . . . . . . . . . . . . . . . . . . . . . . . . . . . . . . . . . . . . . . . . . . . . . . . . . . . . . . . . . . 5146References . . . . . . . . . . . . . . . . . . . . . . . . . . . . . . . . . . . . . . . . . . . . . . . . . . . . . . . . . . . . . . . . . . . . . . . . . . . . . . . . . . . . . . . . . . . . . . . . 5146
1. Introduction
Odorous emissions are complexmixtures of volatile chemicals
discharged to sewers and volatile by-products derived from
biochemical reactions occurring under anaerobic conditions
both in sewer networks and wastewater treatment plants
(WWTPs) (Vincent, 2001; Zarra et al., 2008). These emissions
(Table 1) are mainly composed of volatile organic and inor-
ganic sulfur compounds such as hydrogen sulfide (H2S),
methyl mercaptan (CH3SH), dimethyl sulfide (CH3)2S and
dimethyl disulfide (CH3)2S2, organic and inorganic nitrogen
derivates such as ammonia (NH3), amines, indole and volatile
organic compounds such as aromatic, aliphatic and chlori-
nated hydrocarbons, fatty acids, aldehydes, terpenes and
ketones (VanLangenhove et al., 1985; Zarra et al., 2008), but can
also include awide rangeof industrial chemicals dependingon
the types of industrial discharge to sewer catchments. Similar
compounds are also formed during the anaerobic decompo-
sition of urban and agricultural solid waste and residual acti-
vated sludge (Bruno et al., 2007; Srivastava et al., 2004). Despite
being present at trace level concentrations, most volatile
compounds are malodorous and have very low odour thresh-
olds, potentially resulting in odour impacts on nearby pop-
ulations (Sucker et al., 2008). In addition to the potential for
nuisance odours, volatile compound emissions from WWTPs
can also have health impacts due to their toxic nature, and can
also cause corrosion of pipes and process equipment (Capelli
et al., 2008a; Kilburn and Warshaw, 1995; Nielsen and
Jonsson, 2002).
In odour management, the accurate characterisation of
odorous emissions constitutes the cornerstone for policy
makers, environmental regulatory agencies, environmental
managers, and annoyed receptors. Hence, odours must be
quantitatively translated in order to be objectively legislated
(establishment ofmaximumtolerable odour concentrations or
emissions) and monitored (minimisation of nuisance in the
vicinity of the WWTPs) (Frechen, 2001). In addition, a detailed
characterisation in terms of composition and odorant
concentration is necessary for environmental engineers and
researchers to optimise design and management of odour
abatement systems as well as improve our understanding of
the mechanisms of odour formation and degradation (Cheng
et al., 2007; Turkmen et al., 2004).
Unlike other wastewater parameters such as dissolved
organic carbon (DOC) or inorganic nitrogen’s (i.e. NH4þ), odours
have both a sensorial and a chemical component,whichmakes
odorous emission characterisation a challenging task (Van
Harreveld, 2003). Sensorial odour perception involves the
combination of physiological reception by the olfactory system
and psychological interpretation (Gostelow et al., 2001). The
subjective nature of the human olfactory response represents
the first handicaps to achieve the above mentioned goal (Bliss
et al., 1996; Stuetz et al., 2001). In addition, the large number
of chemical compounds present in odorous emissions,
together with their relatively low concentrations (typically in
the ppbv and pptv levels) severely challenge the detection
limits and separation capacities of the most advanced instru-
mental techniques (Dewulf and Van Langenhove, 1999; Dewulf
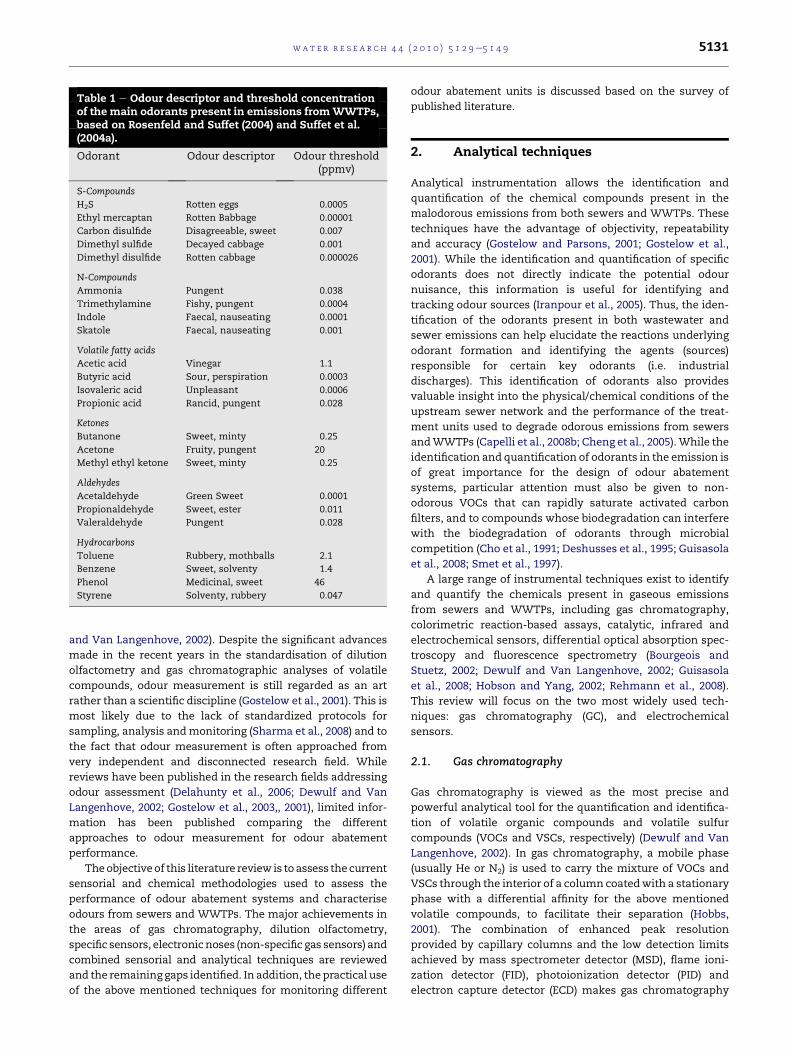
Table 1 e Odour descriptor and threshold concentrationof the main odorants present in emissions fromWWTPs,based on Rosenfeld and Suffet (2004) and Suffet et al.(2004a).
Odorant Odour descriptor Odour threshold(ppmv)
S-Compounds
H2S Rotten eggs 0.0005
Ethyl mercaptan Rotten Babbage 0.00001
Carbon disulfide Disagreeable, sweet 0.007
Dimethyl sulfide Decayed cabbage 0.001
Dimethyl disulfide Rotten cabbage 0.000026
N-Compounds
Ammonia Pungent 0.038
Trimethylamine Fishy, pungent 0.0004
Indole Faecal, nauseating 0.0001
Skatole Faecal, nauseating 0.001
Volatile fatty acids
Acetic acid Vinegar 1.1
Butyric acid Sour, perspiration 0.0003
Isovaleric acid Unpleasant 0.0006
Propionic acid Rancid, pungent 0.028
Ketones
Butanone Sweet, minty 0.25
Acetone Fruity, pungent 20
Methyl ethyl ketone Sweet, minty 0.25
Aldehydes
Acetaldehyde Green Sweet 0.0001
Propionaldehyde Sweet, ester 0.011
Valeraldehyde Pungent 0.028
Hydrocarbons
Toluene Rubbery, mothballs 2.1
Benzene Sweet, solventy 1.4
Phenol Medicinal, sweet 46
Styrene Solventy, rubbery 0.047
wat e r r e s e a r c h 4 4 ( 2 0 1 0 ) 5 1 2 9e5 1 4 9 5131
and Van Langenhove, 2002). Despite the significant advances
made in the recent years in the standardisation of dilution
olfactometry and gas chromatographic analyses of volatile
compounds, odour measurement is still regarded as an art
rather than a scientific discipline (Gostelow et al., 2001). This is
most likely due to the lack of standardized protocols for
sampling, analysis andmonitoring (Sharma et al., 2008) and to
the fact that odour measurement is often approached from
very independent and disconnected research field. While
reviews have been published in the research fields addressing
odour assessment (Delahunty et al., 2006; Dewulf and Van
Langenhove, 2002; Gostelow et al., 2003,, 2001), limited infor-
mation has been published comparing the different
approaches to odour measurement for odour abatement
performance.
Theobjectiveof this literature review is toassess thecurrent
sensorial and chemical methodologies used to assess the
performance of odour abatement systems and characterise
odours from sewers and WWTPs. The major achievements in
the areas of gas chromatography, dilution olfactometry,
specific sensors, electronicnoses (non-specific gas sensors) and
combined sensorial and analytical techniques are reviewed
and the remaining gaps identified. In addition, thepractical use
of the above mentioned techniques for monitoring different
odour abatement units is discussed based on the survey of
published literature.
2. Analytical techniques
Analytical instrumentation allows the identification and
quantification of the chemical compounds present in the
malodorous emissions from both sewers and WWTPs. These
techniques have the advantage of objectivity, repeatability
and accuracy (Gostelow and Parsons, 2001; Gostelow et al.,
2001). While the identification and quantification of specific
odorants does not directly indicate the potential odour
nuisance, this information is useful for identifying and
tracking odour sources (Iranpour et al., 2005). Thus, the iden-
tification of the odorants present in both wastewater and
sewer emissions can help elucidate the reactions underlying
odorant formation and identifying the agents (sources)
responsible for certain key odorants (i.e. industrial
discharges). This identification of odorants also provides
valuable insight into the physical/chemical conditions of the
upstream sewer network and the performance of the treat-
ment units used to degrade odorous emissions from sewers
andWWTPs (Capelli et al., 2008b; Cheng et al., 2005).While the
identification and quantification of odorants in the emission is
of great importance for the design of odour abatement
systems, particular attention must also be given to non-
odorous VOCs that can rapidly saturate activated carbon
filters, and to compounds whose biodegradation can interfere
with the biodegradation of odorants through microbial
competition (Cho et al., 1991; Deshusses et al., 1995; Guisasola
et al., 2008; Smet et al., 1997).
A large range of instrumental techniques exist to identify
and quantify the chemicals present in gaseous emissions
from sewers and WWTPs, including gas chromatography,
colorimetric reaction-based assays, catalytic, infrared and
electrochemical sensors, differential optical absorption spec-
troscopy and fluorescence spectrometry (Bourgeois and
Stuetz, 2002; Dewulf and Van Langenhove, 2002; Guisasola
et al., 2008; Hobson and Yang, 2002; Rehmann et al., 2008).
This review will focus on the two most widely used tech-
niques: gas chromatography (GC), and electrochemical
sensors.
2.1. Gas chromatography
Gas chromatography is viewed as the most precise and
powerful analytical tool for the quantification and identifica-
tion of volatile organic compounds and volatile sulfur
compounds (VOCs and VSCs, respectively) (Dewulf and Van
Langenhove, 2002). In gas chromatography, a mobile phase
(usually He or N2) is used to carry the mixture of VOCs and
VSCs through the interior of a column coatedwith a stationary
phase with a differential affinity for the above mentioned
volatile compounds, to facilitate their separation (Hobbs,
2001). The combination of enhanced peak resolution
provided by capillary columns and the low detection limits
achieved by mass spectrometer detector (MSD), flame ioni-
zation detector (FID), photoionization detector (PID) and
electron capture detector (ECD) makes gas chromatography
wat e r r e s e a r c h 4 4 ( 2 0 1 0 ) 5 1 2 9e5 1 4 95132
an ideal technique for the measurement of complex mixtures
of chemicals at trace levels concentrations (Eiceman et al.,
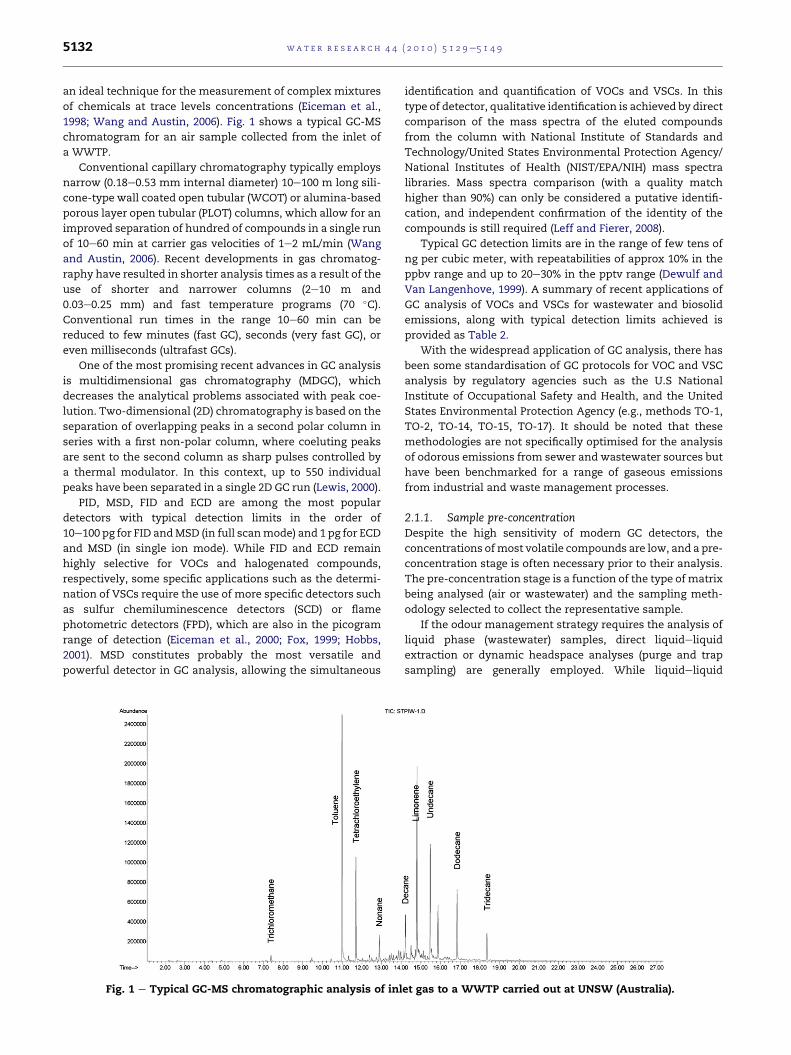
1998; Wang and Austin, 2006). Fig. 1 shows a typical GC-MS
chromatogram for an air sample collected from the inlet of
a WWTP.
Conventional capillary chromatography typically employs
narrow (0.18e0.53 mm internal diameter) 10e100 m long sili-
cone-type wall coated open tubular (WCOT) or alumina-based
porous layer open tubular (PLOT) columns, which allow for an
improved separation of hundred of compounds in a single run
of 10e60 min at carrier gas velocities of 1e2 mL/min (Wang
and Austin, 2006). Recent developments in gas chromatog-
raphy have resulted in shorter analysis times as a result of the
use of shorter and narrower columns (2e10 m and
0.03e0.25 mm) and fast temperature programs (70 �C).Conventional run times in the range 10e60 min can be
reduced to few minutes (fast GC), seconds (very fast GC), or
even milliseconds (ultrafast GCs).
One of the most promising recent advances in GC analysis
is multidimensional gas chromatography (MDGC), which
decreases the analytical problems associated with peak coe-
lution. Two-dimensional (2D) chromatography is based on the
separation of overlapping peaks in a second polar column in
series with a first non-polar column, where coeluting peaks
are sent to the second column as sharp pulses controlled by
a thermal modulator. In this context, up to 550 individual
peaks have been separated in a single 2D GC run (Lewis, 2000).
PID, MSD, FID and ECD are among the most popular
detectors with typical detection limits in the order of
10e100 pg for FID andMSD (in full scanmode) and 1 pg for ECD
and MSD (in single ion mode). While FID and ECD remain
highly selective for VOCs and halogenated compounds,
respectively, some specific applications such as the determi-
nation of VSCs require the use of more specific detectors such
as sulfur chemiluminescence detectors (SCD) or flame
photometric detectors (FPD), which are also in the picogram
range of detection (Eiceman et al., 2000; Fox, 1999; Hobbs,
2001). MSD constitutes probably the most versatile and
powerful detector in GC analysis, allowing the simultaneous
Fig. 1 e Typical GC-MS chromatographic analysis of inl
identification and quantification of VOCs and VSCs. In this
type of detector, qualitative identification is achieved by direct
comparison of the mass spectra of the eluted compounds
from the column with National Institute of Standards and
Technology/United States Environmental Protection Agency/
National Institutes of Health (NIST/EPA/NIH) mass spectra
libraries. Mass spectra comparison (with a quality match
higher than 90%) can only be considered a putative identifi-
cation, and independent confirmation of the identity of the
compounds is still required (Leff and Fierer, 2008).
Typical GC detection limits are in the range of few tens of
ng per cubic meter, with repeatabilities of approx 10% in the
ppbv range and up to 20e30% in the pptv range (Dewulf and
Van Langenhove, 1999). A summary of recent applications of
GC analysis of VOCs and VSCs for wastewater and biosolid
emissions, along with typical detection limits achieved is
provided as Table 2.
With the widespread application of GC analysis, there has
been some standardisation of GC protocols for VOC and VSC
analysis by regulatory agencies such as the U.S National
Institute of Occupational Safety and Health, and the United
States Environmental Protection Agency (e.g., methods TO-1,
TO-2, TO-14, TO-15, TO-17). It should be noted that these
methodologies are not specifically optimised for the analysis
of odorous emissions from sewer and wastewater sources but
have been benchmarked for a range of gaseous emissions
from industrial and waste management processes.
2.1.1. Sample pre-concentrationDespite the high sensitivity of modern GC detectors, the
concentrations ofmost volatile compounds are low, and a pre-
concentration stage is often necessary prior to their analysis.
The pre-concentration stage is a function of the type of matrix
being analysed (air or wastewater) and the sampling meth-
odology selected to collect the representative sample.
If the odour management strategy requires the analysis of
liquid phase (wastewater) samples, direct liquideliquid
extraction or dynamic headspace analyses (purge and trap
sampling) are generally employed. While liquideliquid
et gas to a WWTP carried out at UNSW (Australia).
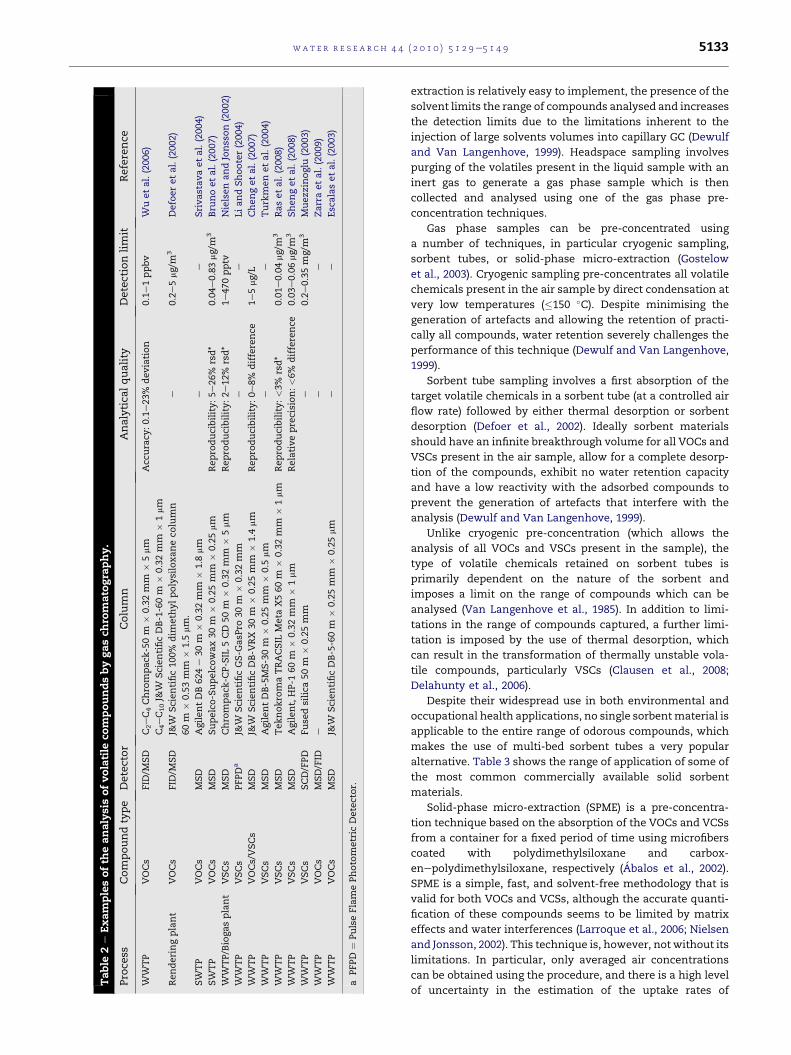
Table
2e
Exam
plesofth
eanalysisofvolatile
com
poundsbygasch
rom
atogra
phy.
Pro
cess
Compoundtype
Detector
Column
Analytica
lquality
Detectionlimit
Reference
WW
TP
VOCs
FID
/MSD
C2eC4Chro
mpack
-50m
�0.32mm
�5mm
C4eC10J&
WScientificDB-1-60m
�0.32mm
�1mm
Acc
uracy
:0.1e23%
deviation
0.1e1ppbv
Wuetal.(2006)
Renderingplant
VOCs
FID
/MSD
J&W
Scientific100%
dim
eth
ylpolysiloxaneco
lumn
60m
�0.53mm
�1.5
mm.
e0.2e5mg/m
3Defoeretal.(2002)
SW
TP
VOCs
MSD
AgilentDB624e
30m
�0.32mm
�1.8
mm
ee
Srivastavaetal.(2004)
SW
TP
VOCs
MSD
Supelco-Supelcowax30m
�0.25mm
�0.25mm
Repro
ducibility:5e26%
rsd*
0.04e0.83mg/m
3Bru
noetal.(2007)
WW
TP/Biogasplant
VSCs
MSD
Chro
mpack
-CP-SIL
5CD
50m
�0.32mm
�5mm
Repro
ducibility:2e12%
rsd*
1e470pptv
NielsenandJonsson(2002)
WW
TP
VSCs
PFPD
aJ&
WScientificGS-G
asP
ro30m
�0.32mm
ee
LiandShooter(2004)
WW
TP
VOCs/VSCs
MSD
J&W
ScientificDB-V
RX
30m
�0.25mm
�1.4
mm
Repro
ducibility:0e8%
difference
1e5mg/L
Chengetal.(2007)
WW
TP
VSCs
MSD
AgilentDB-5MS-30m
�0.25mm
�0.5
mm
ee
Turk
menetal.(2004)
WW
TP
VSCs
MSD
Teknokro
maTRACSIL
Meta
X560m
�0.32mm
�1mm
Repro
ducibility:<3%
rsd*
0.01e0.04mg/m
3Rasetal.(2008)
WW
TP
VSCs
MSD
Agilent,HP-1
60m
�0.32mm
�1mm
Relativeprecision:<6%
difference
0.03e0.06mg/m
3Shengetal.(2008)
WW
TP
VSCs
SCD/FPD
Fuse
dsilica
50m
�0.25mm
e0.2e0.35mg/m
3Muezz
inoglu
(2003)
WW
TP
VOCs
MSD/FID
ee
eZarraetal.(2009)
WW
TP
VOCs
MSD
J&W
ScientificDB-5-60m
�0.25mm
�0.25mm
ee
Esc
alasetal.(2003)
aPFPD
¼PulseFlamePhotometric
Detector.
wat e r r e s e a r c h 4 4 ( 2 0 1 0 ) 5 1 2 9e5 1 4 9 5133
extraction is relatively easy to implement, the presence of the
solvent limits the range of compounds analysed and increases
the detection limits due to the limitations inherent to the
injection of large solvents volumes into capillary GC (Dewulf
and Van Langenhove, 1999). Headspace sampling involves
purging of the volatiles present in the liquid sample with an
inert gas to generate a gas phase sample which is then
collected and analysed using one of the gas phase pre-
concentration techniques.
Gas phase samples can be pre-concentrated using
a number of techniques, in particular cryogenic sampling,
sorbent tubes, or solid-phase micro-extraction (Gostelow
et al., 2003). Cryogenic sampling pre-concentrates all volatile
chemicals present in the air sample by direct condensation at
very low temperatures (�150 �C). Despite minimising the
generation of artefacts and allowing the retention of practi-
cally all compounds, water retention severely challenges the
performance of this technique (Dewulf and Van Langenhove,
1999).
Sorbent tube sampling involves a first absorption of the
target volatile chemicals in a sorbent tube (at a controlled air
flow rate) followed by either thermal desorption or sorbent
desorption (Defoer et al., 2002). Ideally sorbent materials
should have an infinite breakthrough volume for all VOCs and
VSCs present in the air sample, allow for a complete desorp-
tion of the compounds, exhibit no water retention capacity
and have a low reactivity with the adsorbed compounds to
prevent the generation of artefacts that interfere with the
analysis (Dewulf and Van Langenhove, 1999).
Unlike cryogenic pre-concentration (which allows the
analysis of all VOCs and VSCs present in the sample), the
type of volatile chemicals retained on sorbent tubes is
primarily dependent on the nature of the sorbent and
imposes a limit on the range of compounds which can be
analysed (Van Langenhove et al., 1985). In addition to limi-
tations in the range of compounds captured, a further limi-
tation is imposed by the use of thermal desorption, which
can result in the transformation of thermally unstable vola-
tile compounds, particularly VSCs (Clausen et al., 2008;
Delahunty et al., 2006).
Despite their widespread use in both environmental and
occupational health applications, no single sorbentmaterial is
applicable to the entire range of odorous compounds, which
makes the use of multi-bed sorbent tubes a very popular
alternative. Table 3 shows the range of application of some of
the most common commercially available solid sorbent
materials.
Solid-phase micro-extraction (SPME) is a pre-concentra-
tion technique based on the absorption of the VOCs and VCSs
from a container for a fixed period of time using microfibers
coated with polydimethylsiloxane and carbox-
enepolydimethylsiloxane, respectively (Abalos et al., 2002).
SPME is a simple, fast, and solvent-free methodology that is
valid for both VOCs and VCSs, although the accurate quanti-
fication of these compounds seems to be limited by matrix
effects and water interferences (Larroque et al., 2006; Nielsen
and Jonsson, 2002). This technique is, however, not without its
limitations. In particular, only averaged air concentrations
can be obtained using the procedure, and there is a high level
of uncertainty in the estimation of the uptake rates of
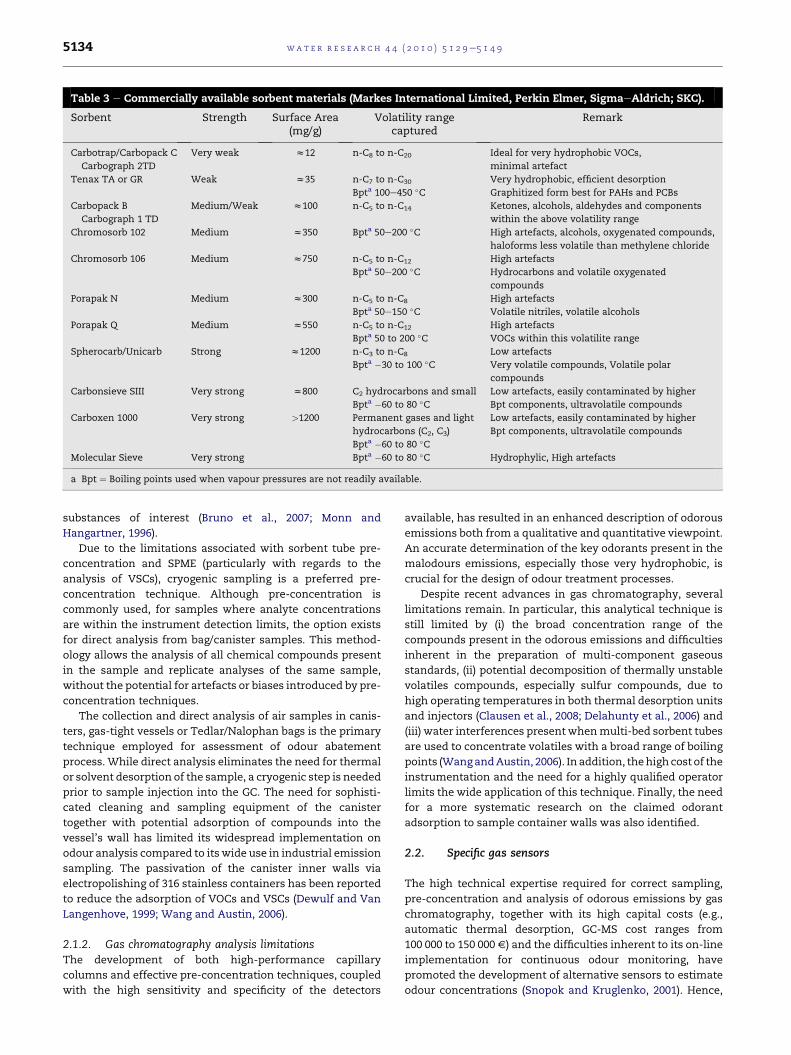
Table 3 e Commercially available sorbent materials (Markes International Limited, Perkin Elmer, SigmaeAldrich; SKC).
Sorbent Strength Surface Area(mg/g)
Volatility rangecaptured
Remark
Carbotrap/Carbopack C
Carbograph 2TD
Very weak z12 n-C8 to n-C20 Ideal for very hydrophobic VOCs,
minimal artefact
Tenax TA or GR Weak z35 n-C7 to n-C30
Bpta 100e450 �CVery hydrophobic, efficient desorption
Graphitized form best for PAHs and PCBs
Carbopack B
Carbograph 1 TD
Medium/Weak z100 n-C5 to n-C14 Ketones, alcohols, aldehydes and components
within the above volatility range
Chromosorb 102 Medium z350 Bpta 50e200 �C High artefacts, alcohols, oxygenated compounds,
haloforms less volatile than methylene chloride
Chromosorb 106 Medium z750 n-C5 to n-C12
Bpta 50e200 �CHigh artefacts
Hydrocarbons and volatile oxygenated
compounds
Porapak N Medium z300 n-C5 to n-C8
Bpta 50e150 �CHigh artefacts
Volatile nitriles, volatile alcohols
Porapak Q Medium z550 n-C5 to n-C12
Bpta 50 to 200 �CHigh artefacts
VOCs within this volatilite range
Spherocarb/Unicarb Strong z1200 n-C3 to n-C8
Bpta �30 to 100 �CLow artefacts
Very volatile compounds, Volatile polar
compounds
Carbonsieve SIII Very strong z800 C2 hydrocarbons and small
Bpta �60 to 80 �CLow artefacts, easily contaminated by higher
Bpt components, ultravolatile compounds
Carboxen 1000 Very strong >1200 Permanent gases and light
hydrocarbons (C2, C3)
Bpta �60 to 80 �C
Low artefacts, easily contaminated by higher
Bpt components, ultravolatile compounds
Molecular Sieve Very strong Bpta �60 to 80 �C Hydrophylic, High artefacts
a Bpt ¼ Boiling points used when vapour pressures are not readily available.
wat e r r e s e a r c h 4 4 ( 2 0 1 0 ) 5 1 2 9e5 1 4 95134
substances of interest (Bruno et al., 2007; Monn and
Hangartner, 1996).
Due to the limitations associated with sorbent tube pre-
concentration and SPME (particularly with regards to the
analysis of VSCs), cryogenic sampling is a preferred pre-
concentration technique. Although pre-concentration is
commonly used, for samples where analyte concentrations
are within the instrument detection limits, the option exists
for direct analysis from bag/canister samples. This method-
ology allows the analysis of all chemical compounds present
in the sample and replicate analyses of the same sample,
without the potential for artefacts or biases introduced by pre-
concentration techniques.
The collection and direct analysis of air samples in canis-
ters, gas-tight vessels or Tedlar/Nalophan bags is the primary
technique employed for assessment of odour abatement
process.While direct analysis eliminates the need for thermal
or solvent desorption of the sample, a cryogenic step is needed
prior to sample injection into the GC. The need for sophisti-
cated cleaning and sampling equipment of the canister
together with potential adsorption of compounds into the
vessel’s wall has limited its widespread implementation on
odour analysis compared to itswide use in industrial emission
sampling. The passivation of the canister inner walls via
electropolishing of 316 stainless containers has been reported
to reduce the adsorption of VOCs and VSCs (Dewulf and Van
Langenhove, 1999; Wang and Austin, 2006).
2.1.2. Gas chromatography analysis limitationsThe development of both high-performance capillary
columns and effective pre-concentration techniques, coupled
with the high sensitivity and specificity of the detectors
available, has resulted in an enhanced description of odorous
emissions both from a qualitative and quantitative viewpoint.
An accurate determination of the key odorants present in the
malodours emissions, especially those very hydrophobic, is
crucial for the design of odour treatment processes.
Despite recent advances in gas chromatography, several
limitations remain. In particular, this analytical technique is
still limited by (i) the broad concentration range of the
compounds present in the odorous emissions and difficulties
inherent in the preparation of multi-component gaseous
standards, (ii) potential decomposition of thermally unstable
volatiles compounds, especially sulfur compounds, due to
high operating temperatures in both thermal desorption units
and injectors (Clausen et al., 2008; Delahunty et al., 2006) and
(iii) water interferences presentwhenmulti-bed sorbent tubes
are used to concentrate volatiles with a broad range of boiling
points (WangandAustin, 2006). In addition, thehighcost of the
instrumentation and the need for a highly qualified operator
limits the wide application of this technique. Finally, the need
for a more systematic research on the claimed odorant
adsorption to sample container walls was also identified.
2.2. Specific gas sensors
The high technical expertise required for correct sampling,
pre-concentration and analysis of odorous emissions by gas
chromatography, together with its high capital costs (e.g.,
automatic thermal desorption, GC-MS cost ranges from
100 000 to 150 000 V) and the difficulties inherent to its on-line
implementation for continuous odour monitoring, have
promoted the development of alternative sensors to estimate
odour concentrations (Snopok and Kruglenko, 2001). Hence,
wat e r r e s e a r c h 4 4 ( 2 0 1 0 ) 5 1 2 9e5 1 4 9 5135
specific gas sensors targeting key odorants such as H2S, and
arrays of non-specific sensors capable to qualitatively and
quantitatively characterise odorous emissions are now
commercially available (Capelli et al., 2008a; Gabriel and
Deshusses, 2003; Haas et al., 2008; Sohn et al., 2008; Stuetz
and Nicolas, 2001).
Specific gas sensors comprise a broad variety of chemical,
electrochemical, catalytic, and optical detectors with high
sensitivity and selectivity for some target odorants (such asH2S
monitors). These sensors can be usually configured to simul-
taneously record several gases and are available as portable
and stationary instruments. They present low response times
(10e120 s), low detection limits (down to ppb levels), low cost
(500e12 000 V) and an easy on-site implementation, and
provide a direct reading of the concentration of the target
odorants. Their easy operation and relative high accuracy
(errors< 10%)have triggered awidespreaduse in industrial and
environmental applications. However, specific sensors only
provide a partial characterisation of odorous emissions since
H2S does not always represent the major odorants and cannot
account for the entire odour nuisance. In addition, since most
of the sensors are based on odorant adsorption, they are
susceptible to interferences from reduced sulfur compounds,
humidity, etc. (Gostelow and Parsons, 2001).
It must also be stressed that most of the technical infor-
mation for these specific detectors is only available from the
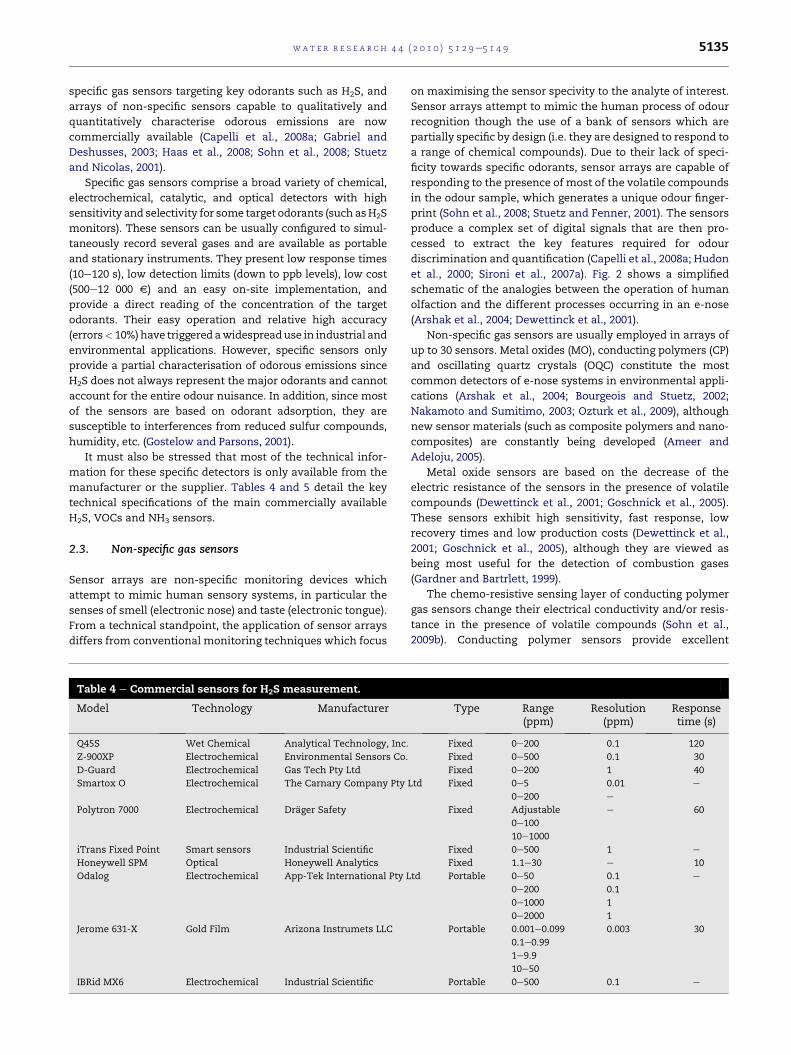
manufacturer or the supplier. Tables 4 and 5 detail the key
technical specifications of the main commercially available
H2S, VOCs and NH3 sensors.
2.3. Non-specific gas sensors
Sensor arrays are non-specific monitoring devices which
attempt to mimic human sensory systems, in particular the
senses of smell (electronic nose) and taste (electronic tongue).
From a technical standpoint, the application of sensor arrays
differs from conventional monitoring techniques which focus
Table 4 e Commercial sensors for H2S measurement.
Model Technology Manufacturer
Q45S Wet Chemical Analytical Technology, Inc.
Z-900XP Electrochemical Environmental Sensors Co.
D-Guard Electrochemical Gas Tech Pty Ltd
Smartox O Electrochemical The Carnary Company Pty
Polytron 7000 Electrochemical Drager Safety
iTrans Fixed Point Smart sensors Industrial Scientific
Honeywell SPM Optical Honeywell Analytics
Odalog Electrochemical App-Tek International Pty L
Jerome 631-X Gold Film Arizona Instrumets LLC
IBRid MX6 Electrochemical Industrial Scientific
on maximising the sensor specivity to the analyte of interest.
Sensor arrays attempt to mimic the human process of odour
recognition though the use of a bank of sensors which are
partially specific by design (i.e. they are designed to respond to
a range of chemical compounds). Due to their lack of speci-
ficity towards specific odorants, sensor arrays are capable of
responding to the presence of most of the volatile compounds
in the odour sample, which generates a unique odour finger-
print (Sohn et al., 2008; Stuetz and Fenner, 2001). The sensors
produce a complex set of digital signals that are then pro-
cessed to extract the key features required for odour
discrimination and quantification (Capelli et al., 2008a; Hudon
et al., 2000; Sironi et al., 2007a). Fig. 2 shows a simplified
schematic of the analogies between the operation of human
olfaction and the different processes occurring in an e-nose
(Arshak et al., 2004; Dewettinck et al., 2001).
Non-specific gas sensors are usually employed in arrays of
up to 30 sensors. Metal oxides (MO), conducting polymers (CP)
and oscillating quartz crystals (OQC) constitute the most
common detectors of e-nose systems in environmental appli-
cations (Arshak et al., 2004; Bourgeois and Stuetz, 2002;
Nakamoto and Sumitimo, 2003; Ozturk et al., 2009), although
new sensor materials (such as composite polymers and nano-
composites) are constantly being developed (Ameer and
Adeloju, 2005).
Metal oxide sensors are based on the decrease of the
electric resistance of the sensors in the presence of volatile
compounds (Dewettinck et al., 2001; Goschnick et al., 2005).
These sensors exhibit high sensitivity, fast response, low
recovery times and low production costs (Dewettinck et al.,
2001; Goschnick et al., 2005), although they are viewed as
being most useful for the detection of combustion gases
(Gardner and Bartrlett, 1999).
The chemo-resistive sensing layer of conducting polymer
gas sensors change their electrical conductivity and/or resis-
tance in the presence of volatile compounds (Sohn et al.,
2009b). Conducting polymer sensors provide excellent
Type Range(ppm)
Resolution(ppm)
Responsetime (s)
Fixed 0e200 0.1 120
Fixed 0e500 0.1 30
Fixed 0e200 1 40
Ltd Fixed 0e5
0e200
0.01
e
e
Fixed Adjustable
0e100
10e1000
e 60
Fixed 0e500 1 e
Fixed 1.1e30 e 10
td Portable 0e50
0e200
0e1000
0e2000
0.1
0.1
1
1
e
Portable 0.001e0.099
0.1e0.99
1e9.9
10e50
0.003 30
Portable 0e500 0.1 e
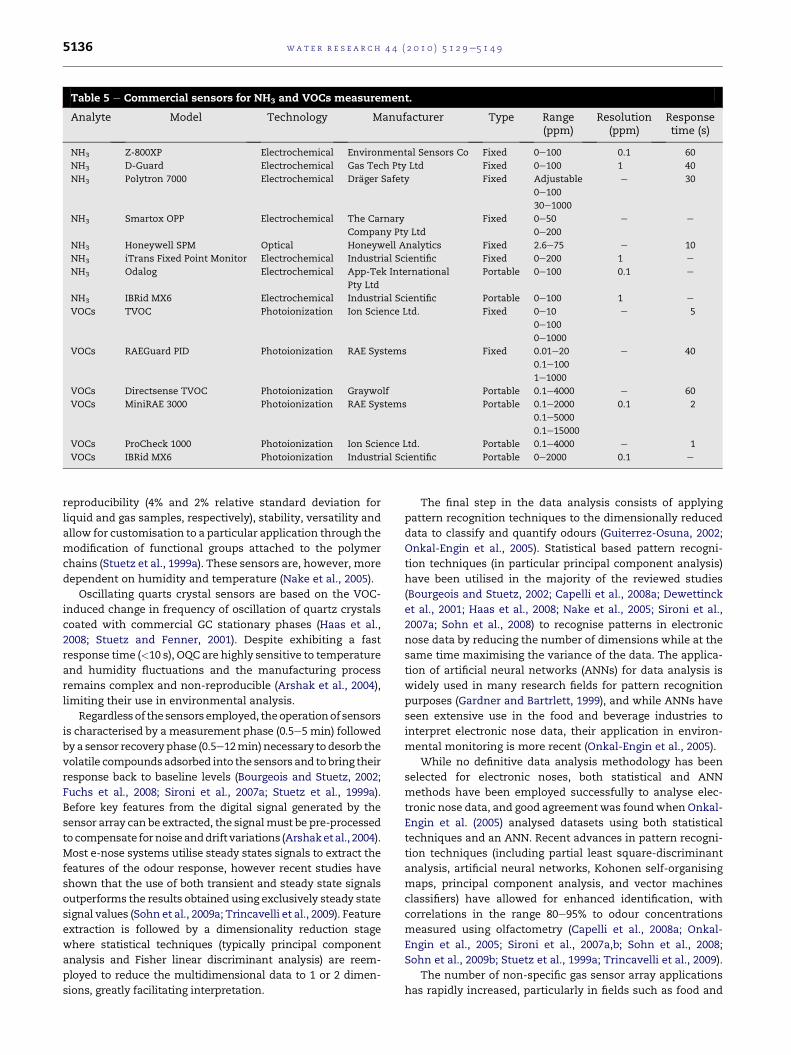
Table 5 e Commercial sensors for NH3 and VOCs measurement.
Analyte Model Technology Manufacturer Type Range(ppm)
Resolution(ppm)
Responsetime (s)
NH3 Z-800XP Electrochemical Environmental Sensors Co Fixed 0e100 0.1 60
NH3 D-Guard Electrochemical Gas Tech Pty Ltd Fixed 0e100 1 40
NH3 Polytron 7000 Electrochemical Drager Safety Fixed Adjustable
0e100
30e1000
e 30
NH3 Smartox OPP Electrochemical The Carnary
Company Pty Ltd
Fixed 0e50
0e200
e e
NH3 Honeywell SPM Optical Honeywell Analytics Fixed 2.6e75 e 10
NH3 iTrans Fixed Point Monitor Electrochemical Industrial Scientific Fixed 0e200 1 e
NH3 Odalog Electrochemical App-Tek International
Pty Ltd
Portable 0e100 0.1 e
NH3 IBRid MX6 Electrochemical Industrial Scientific Portable 0e100 1 e
VOCs TVOC Photoionization Ion Science Ltd. Fixed 0e10
0e100
0e1000
e 5
VOCs RAEGuard PID Photoionization RAE Systems Fixed 0.01e20
0.1e100
1e1000
e 40
VOCs Directsense TVOC Photoionization Graywolf Portable 0.1e4000 e 60
VOCs MiniRAE 3000 Photoionization RAE Systems Portable 0.1e2000
0.1e5000
0.1e15000
0.1 2
VOCs ProCheck 1000 Photoionization Ion Science Ltd. Portable 0.1e4000 e 1
VOCs IBRid MX6 Photoionization Industrial Scientific Portable 0e2000 0.1 e
wat e r r e s e a r c h 4 4 ( 2 0 1 0 ) 5 1 2 9e5 1 4 95136
reproducibility (4% and 2% relative standard deviation for
liquid and gas samples, respectively), stability, versatility and
allow for customisation to a particular application through the
modification of functional groups attached to the polymer
chains (Stuetz et al., 1999a). These sensors are, however, more
dependent on humidity and temperature (Nake et al., 2005).
Oscillating quarts crystal sensors are based on the VOC-
induced change in frequency of oscillation of quartz crystals
coated with commercial GC stationary phases (Haas et al.,
2008; Stuetz and Fenner, 2001). Despite exhibiting a fast
response time (<10 s), OQC are highly sensitive to temperature
and humidity fluctuations and the manufacturing process
remains complex and non-reproducible (Arshak et al., 2004),
limiting their use in environmental analysis.
Regardlessof the sensors employed, theoperationof sensors
is characterised by a measurement phase (0.5e5 min) followed
by a sensor recovery phase (0.5e12min) necessary to desorb the
volatile compoundsadsorbed into the sensors and tobring their
response back to baseline levels (Bourgeois and Stuetz, 2002;
Fuchs et al., 2008; Sironi et al., 2007a; Stuetz et al., 1999a).
Before key features from the digital signal generated by the
sensor array can be extracted, the signalmust be pre-processed
to compensate fornoise anddrift variations (Arshaketal., 2004).
Most e-nose systems utilise steady states signals to extract the
features of the odour response, however recent studies have
shown that the use of both transient and steady state signals
outperforms the results obtained using exclusively steady state
signal values (Sohn et al., 2009a; Trincavelli et al., 2009). Feature
extraction is followed by a dimensionality reduction stage
where statistical techniques (typically principal component
analysis and Fisher linear discriminant analysis) are reem-
ployed to reduce the multidimensional data to 1 or 2 dimen-
sions, greatly facilitating interpretation.
The final step in the data analysis consists of applying
pattern recognition techniques to the dimensionally reduced
data to classify and quantify odours (Guiterrez-Osuna, 2002;
Onkal-Engin et al., 2005). Statistical based pattern recogni-
tion techniques (in particular principal component analysis)
have been utilised in the majority of the reviewed studies
(Bourgeois and Stuetz, 2002; Capelli et al., 2008a; Dewettinck
et al., 2001; Haas et al., 2008; Nake et al., 2005; Sironi et al.,
2007a; Sohn et al., 2008) to recognise patterns in electronic
nose data by reducing the number of dimensions while at the
same time maximising the variance of the data. The applica-
tion of artificial neural networks (ANNs) for data analysis is
widely used in many research fields for pattern recognition
purposes (Gardner and Bartrlett, 1999), and while ANNs have
seen extensive use in the food and beverage industries to
interpret electronic nose data, their application in environ-
mental monitoring is more recent (Onkal-Engin et al., 2005).
While no definitive data analysis methodology has been
selected for electronic noses, both statistical and ANN
methods have been employed successfully to analyse elec-
tronic nose data, and good agreement was foundwhen Onkal-
Engin et al. (2005) analysed datasets using both statistical
techniques and an ANN. Recent advances in pattern recogni-
tion techniques (including partial least square-discriminant
analysis, artificial neural networks, Kohonen self-organising
maps, principal component analysis, and vector machines
classifiers) have allowed for enhanced identification, with
correlations in the range 80e95% to odour concentrations
measured using olfactometry (Capelli et al., 2008a; Onkal-
Engin et al., 2005; Sironi et al., 2007a,b; Sohn et al., 2008;
Sohn et al., 2009b; Stuetz et al., 1999a; Trincavelli et al., 2009).
The number of non-specific gas sensor array applications
has rapidly increased, particularly in fields such as food and
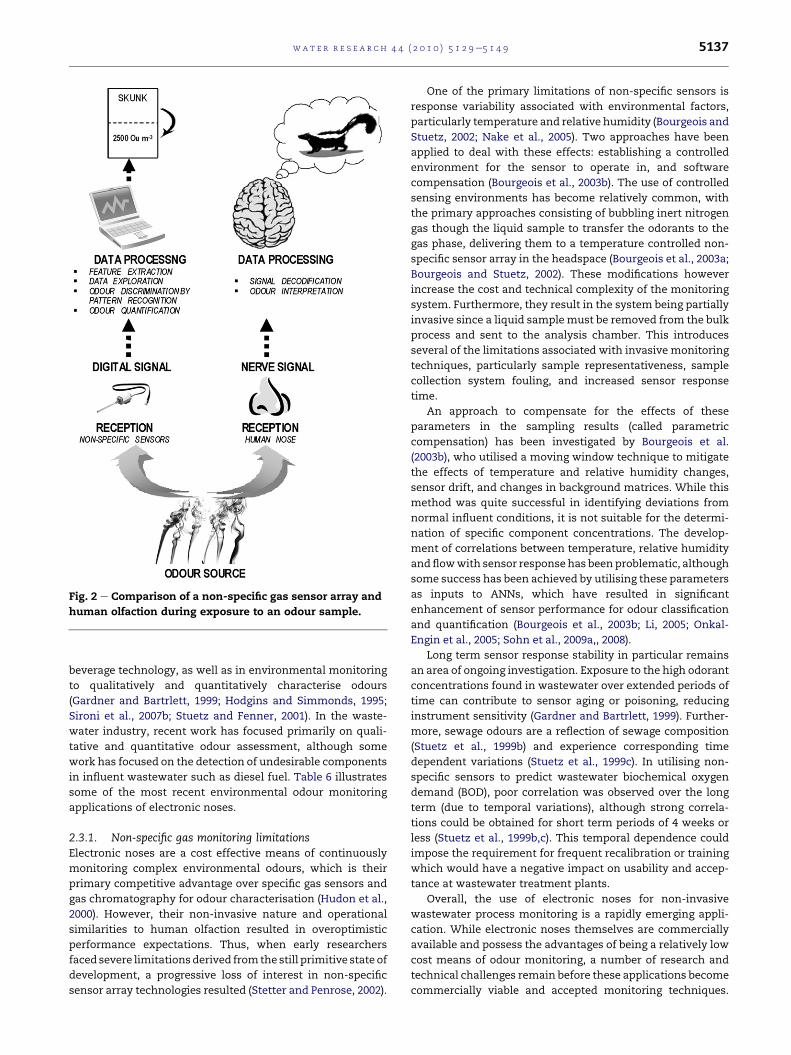
Fig. 2 e Comparison of a non-specific gas sensor array and
human olfaction during exposure to an odour sample.
wat e r r e s e a r c h 4 4 ( 2 0 1 0 ) 5 1 2 9e5 1 4 9 5137
beverage technology, as well as in environmental monitoring
to qualitatively and quantitatively characterise odours
(Gardner and Bartrlett, 1999; Hodgins and Simmonds, 1995;
Sironi et al., 2007b; Stuetz and Fenner, 2001). In the waste-
water industry, recent work has focused primarily on quali-
tative and quantitative odour assessment, although some
work has focused on the detection of undesirable components
in influent wastewater such as diesel fuel. Table 6 illustrates
some of the most recent environmental odour monitoring
applications of electronic noses.
2.3.1. Non-specific gas monitoring limitationsElectronic noses are a cost effective means of continuously
monitoring complex environmental odours, which is their
primary competitive advantage over specific gas sensors and
gas chromatography for odour characterisation (Hudon et al.,
2000). However, their non-invasive nature and operational
similarities to human olfaction resulted in overoptimistic
performance expectations. Thus, when early researchers
faced severe limitationsderived fromthe still primitive state of
development, a progressive loss of interest in non-specific
sensor array technologies resulted (Stetter and Penrose, 2002).
One of the primary limitations of non-specific sensors is
response variability associated with environmental factors,
particularly temperature and relative humidity (Bourgeois and
Stuetz, 2002; Nake et al., 2005). Two approaches have been
applied to deal with these effects: establishing a controlled
environment for the sensor to operate in, and software
compensation (Bourgeois et al., 2003b). The use of controlled
sensing environments has become relatively common, with
the primary approaches consisting of bubbling inert nitrogen
gas though the liquid sample to transfer the odorants to the
gas phase, delivering them to a temperature controlled non-
specific sensor array in the headspace (Bourgeois et al., 2003a;
Bourgeois and Stuetz, 2002). These modifications however
increase the cost and technical complexity of the monitoring
system. Furthermore, they result in the system being partially
invasive since a liquid samplemust be removed from the bulk
process and sent to the analysis chamber. This introduces
several of the limitations associated with invasive monitoring
techniques, particularly sample representativeness, sample
collection system fouling, and increased sensor response
time.
An approach to compensate for the effects of these
parameters in the sampling results (called parametric
compensation) has been investigated by Bourgeois et al.
(2003b), who utilised a moving window technique to mitigate
the effects of temperature and relative humidity changes,
sensor drift, and changes in background matrices. While this
method was quite successful in identifying deviations from
normal influent conditions, it is not suitable for the determi-
nation of specific component concentrations. The develop-
ment of correlations between temperature, relative humidity
andflowwith sensor responsehas beenproblematic, although
some success has been achieved by utilising these parameters
as inputs to ANNs, which have resulted in significant
enhancement of sensor performance for odour classification
and quantification (Bourgeois et al., 2003b; Li, 2005; Onkal-
Engin et al., 2005; Sohn et al., 2009a,, 2008).
Long term sensor response stability in particular remains
an area of ongoing investigation. Exposure to the high odorant
concentrations found in wastewater over extended periods of
time can contribute to sensor aging or poisoning, reducing
instrument sensitivity (Gardner and Bartrlett, 1999). Further-
more, sewage odours are a reflection of sewage composition
(Stuetz et al., 1999b) and experience corresponding time
dependent variations (Stuetz et al., 1999c). In utilising non-
specific sensors to predict wastewater biochemical oxygen
demand (BOD), poor correlation was observed over the long
term (due to temporal variations), although strong correla-
tions could be obtained for short term periods of 4 weeks or
less (Stuetz et al., 1999b,c). This temporal dependence could
impose the requirement for frequent recalibration or training
which would have a negative impact on usability and accep-
tance at wastewater treatment plants.
Overall, the use of electronic noses for non-invasive
wastewater process monitoring is a rapidly emerging appli-
cation. While electronic noses themselves are commercially
available and possess the advantages of being a relatively low
cost means of odour monitoring, a number of research and
technical challenges remain before these applications become
commercially viable and accepted monitoring techniques.
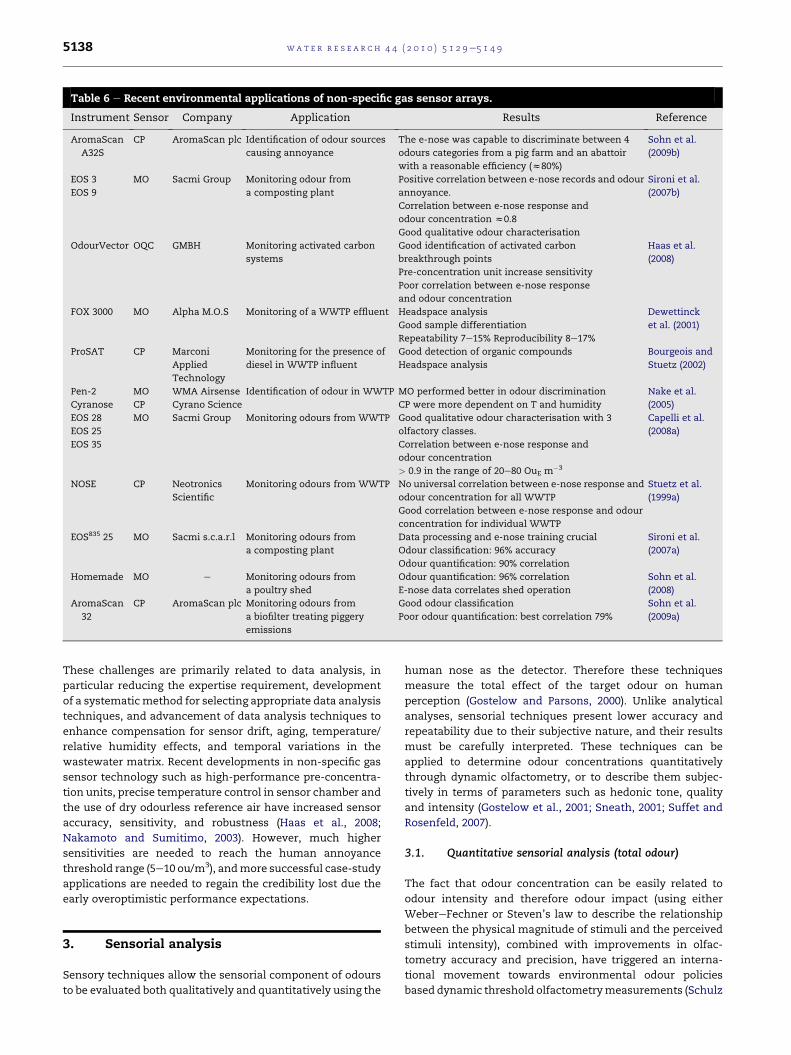
Table 6 e Recent environmental applications of non-specific gas sensor arrays.
Instrument Sensor Company Application Results Reference
AromaScan
A32S
CP AromaScan plc Identification of odour sources
causing annoyance
The e-nose was capable to discriminate between 4
odours categories from a pig farm and an abattoir
with a reasonable efficiency (z80%)
Sohn et al.
(2009b)
EOS 3
EOS 9
MO Sacmi Group Monitoring odour from
a composting plant
Positive correlation between e-nose records and odour
annoyance.
Correlation between e-nose response and
odour concentration z0.8
Good qualitative odour characterisation
Sironi et al.
(2007b)
OdourVector OQC GMBH Monitoring activated carbon
systems
Good identification of activated carbon
breakthrough points
Pre-concentration unit increase sensitivity
Poor correlation between e-nose response
and odour concentration
Haas et al.
(2008)
FOX 3000 MO Alpha M.O.S Monitoring of a WWTP effluent Headspace analysis
Good sample differentiation
Repeatability 7e15% Reproducibility 8e17%
Dewettinck
et al. (2001)
ProSAT CP Marconi
Applied
Technology
Monitoring for the presence of
diesel in WWTP influent
Good detection of organic compounds
Headspace analysis
Bourgeois and
Stuetz (2002)
Pen-2
Cyranose
MO
CP
WMA Airsense
Cyrano Science
Identification of odour in WWTP MO performed better in odour discrimination
CP were more dependent on T and humidity
Nake et al.
(2005)
EOS 28
EOS 25
EOS 35
MO Sacmi Group Monitoring odours from WWTP Good qualitative odour characterisation with 3
olfactory classes.
Correlation between e-nose response and
odour concentration
> 0.9 in the range of 20e80 OuE m�3
Capelli et al.
(2008a)
NOSE CP Neotronics
Scientific
Monitoring odours from WWTP No universal correlation between e-nose response and
odour concentration for all WWTP
Good correlation between e-nose response and odour
concentration for individual WWTP
Stuetz et al.
(1999a)
EOS835 25 MO Sacmi s.c.a.r.l Monitoring odours from
a composting plant
Data processing and e-nose training crucial
Odour classification: 96% accuracy
Odour quantification: 90% correlation
Sironi et al.
(2007a)
Homemade MO e Monitoring odours from
a poultry shed
Odour quantification: 96% correlation
E-nose data correlates shed operation
Sohn et al.
(2008)
AromaScan
32
CP AromaScan plc Monitoring odours from
a biofilter treating piggery
emissions
Good odour classification
Poor odour quantification: best correlation 79%
Sohn et al.
(2009a)
wat e r r e s e a r c h 4 4 ( 2 0 1 0 ) 5 1 2 9e5 1 4 95138
These challenges are primarily related to data analysis, in
particular reducing the expertise requirement, development
of a systematicmethod for selecting appropriate data analysis
techniques, and advancement of data analysis techniques to
enhance compensation for sensor drift, aging, temperature/
relative humidity effects, and temporal variations in the
wastewater matrix. Recent developments in non-specific gas
sensor technology such as high-performance pre-concentra-
tion units, precise temperature control in sensor chamber and
the use of dry odourless reference air have increased sensor
accuracy, sensitivity, and robustness (Haas et al., 2008;
Nakamoto and Sumitimo, 2003). However, much higher
sensitivities are needed to reach the human annoyance
threshold range (5e10 ou/m3), andmore successful case-study
applications are needed to regain the credibility lost due the
early overoptimistic performance expectations.
3. Sensorial analysis
Sensory techniques allow the sensorial component of odours
to be evaluated both qualitatively and quantitatively using the
human nose as the detector. Therefore these techniques
measure the total effect of the target odour on human
perception (Gostelow and Parsons, 2000). Unlike analytical
analyses, sensorial techniques present lower accuracy and
repeatability due to their subjective nature, and their results
must be carefully interpreted. These techniques can be
applied to determine odour concentrations quantitatively
through dynamic olfactometry, or to describe them subjec-
tively in terms of parameters such as hedonic tone, quality
and intensity (Gostelow et al., 2001; Sneath, 2001; Suffet and
Rosenfeld, 2007).
3.1. Quantitative sensorial analysis (total odour)
The fact that odour concentration can be easily related to
odour intensity and therefore odour impact (using either
WebereFechner or Steven’s law to describe the relationship
between the physical magnitude of stimuli and the perceived
stimuli intensity), combined with improvements in olfac-
tometry accuracy and precision, have triggered an interna-
tional movement towards environmental odour policies
based dynamic threshold olfactometrymeasurements (Schulz
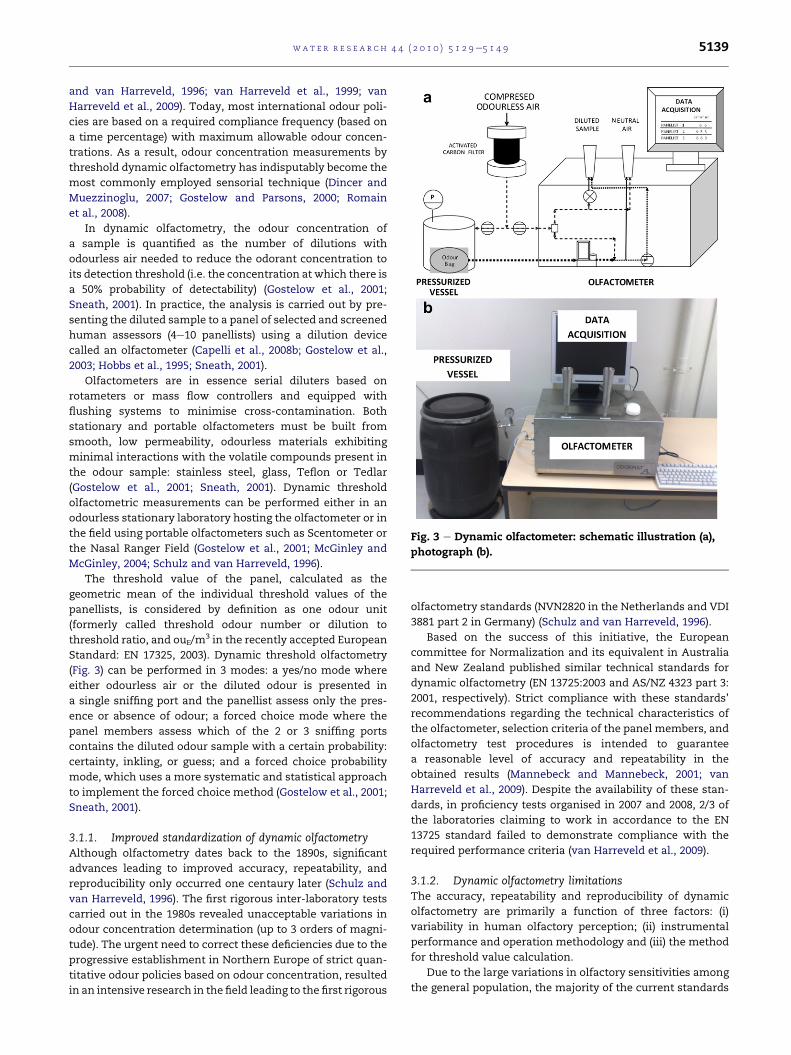
Fig. 3 e Dynamic olfactometer: schematic illustration (a),
photograph (b).
wat e r r e s e a r c h 4 4 ( 2 0 1 0 ) 5 1 2 9e5 1 4 9 5139
and van Harreveld, 1996; van Harreveld et al., 1999; van
Harreveld et al., 2009). Today, most international odour poli-
cies are based on a required compliance frequency (based on
a time percentage) with maximum allowable odour concen-
trations. As a result, odour concentration measurements by
threshold dynamic olfactometry has indisputably become the
most commonly employed sensorial technique (Dincer and
Muezzinoglu, 2007; Gostelow and Parsons, 2000; Romain
et al., 2008).
In dynamic olfactometry, the odour concentration of
a sample is quantified as the number of dilutions with
odourless air needed to reduce the odorant concentration to
its detection threshold (i.e. the concentration at which there is
a 50% probability of detectability) (Gostelow et al., 2001;
Sneath, 2001). In practice, the analysis is carried out by pre-
senting the diluted sample to a panel of selected and screened
human assessors (4e10 panellists) using a dilution device
called an olfactometer (Capelli et al., 2008b; Gostelow et al.,
2003; Hobbs et al., 1995; Sneath, 2001).
Olfactometers are in essence serial diluters based on
rotameters or mass flow controllers and equipped with
flushing systems to minimise cross-contamination. Both
stationary and portable olfactometers must be built from
smooth, low permeability, odourless materials exhibiting
minimal interactions with the volatile compounds present in
the odour sample: stainless steel, glass, Teflon or Tedlar
(Gostelow et al., 2001; Sneath, 2001). Dynamic threshold
olfactometric measurements can be performed either in an
odourless stationary laboratory hosting the olfactometer or in
the field using portable olfactometers such as Scentometer or
the Nasal Ranger Field (Gostelow et al., 2001; McGinley and
McGinley, 2004; Schulz and van Harreveld, 1996).
The threshold value of the panel, calculated as the
geometric mean of the individual threshold values of the
panellists, is considered by definition as one odour unit
(formerly called threshold odour number or dilution to
threshold ratio, and ouE/m3 in the recently accepted European
Standard: EN 17325, 2003). Dynamic threshold olfactometry
(Fig. 3) can be performed in 3 modes: a yes/no mode where
either odourless air or the diluted odour is presented in
a single sniffing port and the panellist assess only the pres-
ence or absence of odour; a forced choice mode where the
panel members assess which of the 2 or 3 sniffing ports
contains the diluted odour sample with a certain probability:
certainty, inkling, or guess; and a forced choice probability
mode, which uses a more systematic and statistical approach
to implement the forced choice method (Gostelow et al., 2001;
Sneath, 2001).
3.1.1. Improved standardization of dynamic olfactometryAlthough olfactometry dates back to the 1890s, significant
advances leading to improved accuracy, repeatability, and
reproducibility only occurred one centaury later (Schulz and
van Harreveld, 1996). The first rigorous inter-laboratory tests
carried out in the 1980s revealed unacceptable variations in
odour concentration determination (up to 3 orders of magni-
tude). The urgent need to correct these deficiencies due to the
progressive establishment in Northern Europe of strict quan-
titative odour policies based on odour concentration, resulted
in an intensive research in the field leading to the first rigorous
olfactometry standards (NVN2820 in the Netherlands and VDI
3881 part 2 in Germany) (Schulz and van Harreveld, 1996).
Based on the success of this initiative, the European
committee for Normalization and its equivalent in Australia
and New Zealand published similar technical standards for
dynamic olfactometry (EN 13725:2003 and AS/NZ 4323 part 3:
2001, respectively). Strict compliance with these standards’
recommendations regarding the technical characteristics of
the olfactometer, selection criteria of the panel members, and
olfactometry test procedures is intended to guarantee
a reasonable level of accuracy and repeatability in the
obtained results (Mannebeck and Mannebeck, 2001; van
Harreveld et al., 2009). Despite the availability of these stan-
dards, in proficiency tests organised in 2007 and 2008, 2/3 of
the laboratories claiming to work in accordance to the EN
13725 standard failed to demonstrate compliance with the
required performance criteria (van Harreveld et al., 2009).
3.1.2. Dynamic olfactometry limitationsThe accuracy, repeatability and reproducibility of dynamic
olfactometry are primarily a function of three factors: (i)
variability in human olfactory perception; (ii) instrumental
performance and operation methodology and (iii) the method
for threshold value calculation.
Due to the large variations in olfactory sensitivities among
the general population, the majority of the current standards
wat e r r e s e a r c h 4 4 ( 2 0 1 0 ) 5 1 2 9e5 1 4 95140
and guidelines for dynamic threshold olfactometry recom-
mend the selection of average-sensitivity panellists (hyper
and hypo-sensitive noses are discarded) in order to produce
more reproducible results (Bliss et al., 1996; van Harreveld
et al., 2009). In this context, between 50 and 70% of potential
panellists are rejected due to their unsuitable olfactory
sensitivity based on a reference gas (n-butanol) (Sneath, 2001;
van Harreveld et al., 1999). It should be noted that no signifi-
cant differences in olfactory response have been found with
regards to panellist gender (Bliss et al., 1996). Panellist selec-
tion is further complicated by the decrease in human olfactory
sensitivity and accuracy with age (which is also dependent on
the type of odour sensed), and by olfactory fatigue (adapta-
tion) during continuous exposure to odours as well as
increases in sensitivity that are commonly observed under
repeated but not continuous exposures (Gostelow et al., 2001).
As a result, continuous monitoring of panellists sensitivity is
highly recommended in most international olfactometry
standards.
Studies have shown that olfactometer operation may
introduce sources of error in dynamic olfactometry. The use of
single sniffing stations composed of two sniffing cups
prevents olfactory fatigue in panellists as result of the resting
time between assessments (2 min). Cross-contamination as
a result of odorant adsorption on tubing, rotameters or mass
flow controllers is suggested to be common bias in dynamic
threshold olfactometry. Olfactometers based on needle valves
(rather than rotameters or mass flow controllers) flushed with
high-speed/high pressure odourless air have also been sug-
gested to minimise cross-contamination (which allows the
random presentation of diluted samples) and exhibit reason-
able dilution accuracy (Jiang et al., 2006). Finally, constant flow
rates at the sniffing cup are a prerequisite for accurate odour
threshold determination (Dravnieks and Jarke, 1980). Flow
rates of 20 L/min (sufficient flow rate to support normal
human breathing and sniffing rates) are normally used in
commercial olfactometers (van Harreveld et al., 1999).
Testing procedures have also been reported to bias panel-
lists. For instance, a decreasing order of presentation can
cause olfactory fatigue or adaption and is not recommended
(Gostelow et al., 2001). Better repeatability can be achieved by
using forced choice olfactometry with a certainty approach
(guess/inkling/certain) that allows reducing the size of the
panel to 4e6 persons (Schulz and van Harreveld, 1996). Other
observations have suggested that the schedule of sample
presentation can bias the panellist’s response (Jiang et al.,
2006). Thus a random sample presentation schedule is
preferred over a sequentially increasing one, since the former
avoid any bias due to panellist prediction (anticipation based
on previous experience).
The method for threshold value calculation has also been
suggested as influencing the accuracy of dynamic olfac-
tometry. In Europe and Australia, the individual threshold
value is often calculated as the geometric mean of the first
dilution where the diluted odour sample can be detected and
the previous dilution factor where the panellist could not
detect the stimulus.
Despite significant breakthroughs in the last 20 years in the
field of sensory analysis, dynamic olfactometry still exhibits
higher variability than the analytical counterparts (replicate
measurements of a sample under the EN 13725 standard can
differ by a factor of 3) and a significant cost (200e300 V per
sample). Recent advances in the design and operation of
olfactometers are gradually increasing their accuracy and
precision, while decreasing detection limits (Gostelow et al.,
2001). Even with recent advances, the current detection
limits are on the order of 20e50 ou/m3, hence the applicability
of olfactometry to assess ambient air samples around the
threshold for nuisance levels (5e10 ou/m3) is limited
(Gostelow et al., 2001). Field olfactometers are seen as being
more convenient for the determination of ambient air
concentrations near this threshold as a result of their lower
operating range 2e500 ou/m3 (McGinley and McGinley, 2004).
Ongoing work at the European level by the CEN TC264/WG27
working group will certainly result in a field inspection stan-
dard for the determination of odour exposure in ambient air
(Bilsen and De Fre, 2008).
Significant concern also exists in the preservation of
sample prior to analysis due to the high reactivity of some
odorants or potential interferences due to water condensation
in hot and wet samples (Hobbs et al., 1995; Sluis and Vossen,
2008). Most of the current olfactometry standards recom-
mend sample storage in Tedlar� and/or Nalophan NA� bags
for periods not exceeding 24e30 h (Gostelow et al., 2001).
However, knowledge gaps exist with regards to permeation
(loss) of specific odorants through these materials in addition
to odorant transformation during collection and storage.
Additional work is required to assess the impact of these
factors on olfactometry in addition to developing guidelines
for sample collection and storage.
While olfactometry has been widely applied for compli-
ance assessment with existing odour regulations and evalu-
ation of odour abatement performance, the binary nature of
the measurement (focus on detection or non-detection) is
a fundamental limitation with regards to the ability of this
technique to enhance existing understanding of the specific
types of odorants, their productionmechanisms, or sources of
odour abatement failure. The current poor understanding of
non-H2S odorant emissions from wastewater is hindering the
development of odour abatement technology, and further
uptake ofmore informative analytical techniques (such as GC-
O or the Odour Profile Method) is needed to advance odour
management for wastewater sources.
3.2. Qualitative sensorial analysis (odour profilemethod)
Subjective aspects of odorant emissions such as the relative
pleasantness or unpleasantness of an odorous emission
(odour hedonic tone), the type of odour descriptor from
a standard odour wheel that best represents the odour smell
(odour quality), or the perceived strength of odour sensation
(odour intensity) are assessed using sensorial analysis tech-
niques (Burlingame et al., 2004; Sneath, 2001; Suffet et al.,
2004a). These 3 dimensions of an odour, although not explic-
itly employed in odour regulation policies, are crucial to
establish odour-impact criteria (Jiang et al., 2006). In fact, most
of the doseeeffect relationships between odour exposure
and annoyance used in Northern European legislation are
based on the empirical determination of odour
wat e r r e s e a r c h 4 4 ( 2 0 1 0 ) 5 1 2 9e5 1 4 9 5141
concentrationeintensity relationships (Jiang et al., 2006;
Schulz and van Harreveld, 1996).
3.2.1. Odour profile methodWhile qualitative sensorial analysis has had a role in the
development of odour standards, the application of these
techniques for wastewater odour assessment has been
limited. Only relatively recently has there been a concerted
effort to apply qualitative sensorial analysis techniques in
a rigorous manner to enhance our understanding of odorant
emissions, most notably in the form of the Odour Profile
Method (OPM).
The OPM utilises a panel who have been trained to char-
acterise the individual components of odours using odour
descriptors and intensity ratings (Burlingame, 1999). Indi-
vidual odour descriptors can be linked to typical odorants,
although confirmation through combined sensory and
chemical analytical techniques (such as GC-O) is required to
complete the identification (Suffet et al., 2004b).
Due to the subjective nature of this method, comparison
and interoperation of data collected by different laboratories
(or even between different analysts) can be difficult. This has
been reflected in recent literature where there has been
a focus on the development of odour wheels to standardise
the basis on which to classify, communicate and identify
odour qualities (Burlingame et al., 2004; Suffet et al., 2004a,
2009; Suffet and Rosenfeld, 2007).
While this technique has been applied with much success
to address odour issues in the drinking water industry,
reported application for wastewater odour assessment has
been limited (Burlingame, 1999,, 2009). Through the applica-
tion of OPM over a three year period at a wastewater treat-
ment plant, Burlingame (1999) demonstrated the potential for
this technique to identify specific odour sources at the facility
based upon their odour profile. More recent work has focused
on fenceline monitoring using this technique to assess
annoyance associated with odorous emissions to prioritise
abatement (Burlingame, 2009). Due to the limited number of
reported applications, a need exists for further case-studies
demonstrating the utility of this technique in identifying the
responsible odour sources to support the abatement of
nuisance odours.
3.2.2. Qualitative field analysis of odorantsThe existing OPM has been developed to be applicable in
both laboratory and field settings. With the recent push in
Europe towards the application of qualitative techniques
in the field for the purposes of identifying and assessing
environmental odour sources and impacts, additional
methodologies have been developed. Innovative sensorial
methodologies based on odour field measurement such as
“field of odours”, and “reverse modelling” have significantly
improved both odour mapping and odour emission esti-
mation (Bilsen and De Fre, 2008; Burlingame, 1999; De
Bruyn et al., 2008; Leger, 2008).
In France, the French Ministry for the Environment has
promoted the “field of odours” method in the last decade
through the development of odourmonitoring networks based
on trained panels of neighbourhood volunteers (Leger, 2008).
These panels evaluate air quality by sniffing the air twice a day
(all at the same time) during 3e12 month campaigns, identi-
fying the major odour sources contributing to odour pollution
(associating an “olfactory imprint” to each company) and
quantifying the impact of any potential odour abatement
process on air quality (Leger, 2008). More scientifically-groun-
ded studies are being conducted at both the European and
national level (Belgium) in order to standardise odour field
measurements using “reverse modelling”. In a recent study,
Bilsen and De Fre (2008) achieved satisfactory estimations of
odour emissions using sniffing teams of at least 2 qualified
panellists (according to EN 13725) under stable atmospheric
conditions, moderate wind velocities (2e8 m/s) and using at
least 10e15 sniffing measurements. By carefully recording the
extent of the odour plumeusing teams of 4e6 panellists, odour
emissions were estimated by “reverse modelling” using
bi-Gaussian atmospheric dispersion models and local meteo-
rological conditions.
Overall, sensorial techniques such as the OPM are still
regarded as emerging techniques for wastewater odour
assessment. However, with their proven track record in
assisting other industries in addressing odour issues and their
inherent advantages in terms of speed and cost compared to
more intensive analytical procedures, it is expected that the
application of these qualitative techniques will contribute
significantly to the advancement of odour abatement for
sewerage collection networks and wastewater treatment
processes.
4. Combined sensorial-analytical techniques
Gas Chromatography-olfactometry (GC-O) is based on the
sensory evaluation of the elute following GC separation and
aims at characterising odour active volatile compounds from
odorous samples (Pollien et al., 1999; Ranau et al., 2005). While
the most sensitive physical detectors (MSD, ECD, and FID)
exhibit limits of detection ranging from 1 to 10 pg, human
noses can easily detect down to 0.050 pg of odour active
compounds (Marin et al., 1991). GC-O brings together the high
resolution power of capillary gas chromatography with the
high selectivity and sensitivity of human olfaction.
This technique is primarily implemented in parallel toMSD
(Hochereau and Bruchet, 2004), and is known as GC-MS-O. In
this particular configuration, the elute from the capillary
column is split into a portion reaching the MSD and a portion
delivered to a dedicated olfactory detection port (ODP)made of
glass or PTFE and fitted to the shape of a nose (Plutowska and
Wardencki, 2008). By superimposing the conventional MSD
chromatogram with the aromagram recorded by the human
assessor (also called O-chromatogram), the odour character
can be identified and quantified (Kleeberg et al., 2005; Parcsi
and Stuetz, 2007; Wright et al., 2005). A typical GC-O system
equipped with an additional chemical detector for odorant
quantification and identification is illustrated in Fig. 4.
Since its conception in 1952, GC-O has been primarily
applied for food, beverage, and perfume research (Delahunty
et al., 2006; Fuller et al., 1964), with limited application to
environmental analysis. Currently no published data on GC-
MS-O characterisation of emissions from sewers and WWTPs
exist, and the characterisation of odorous emissions from
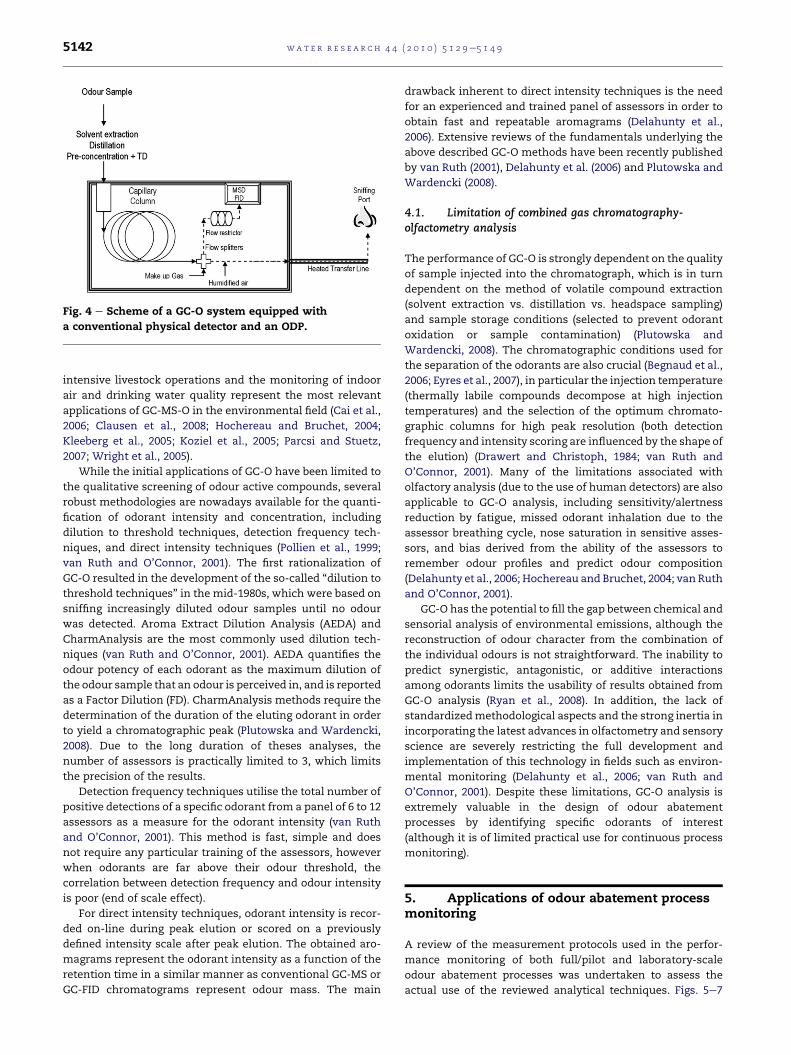
Fig. 4 e Scheme of a GC-O system equipped with
a conventional physical detector and an ODP.
wat e r r e s e a r c h 4 4 ( 2 0 1 0 ) 5 1 2 9e5 1 4 95142
intensive livestock operations and the monitoring of indoor
air and drinking water quality represent the most relevant
applications of GC-MS-O in the environmental field (Cai et al.,
2006; Clausen et al., 2008; Hochereau and Bruchet, 2004;
Kleeberg et al., 2005; Koziel et al., 2005; Parcsi and Stuetz,
2007; Wright et al., 2005).
While the initial applications of GC-O have been limited to
the qualitative screening of odour active compounds, several
robust methodologies are nowadays available for the quanti-
fication of odorant intensity and concentration, including
dilution to threshold techniques, detection frequency tech-
niques, and direct intensity techniques (Pollien et al., 1999;
van Ruth and O’Connor, 2001). The first rationalization of
GC-O resulted in the development of the so-called “dilution to
threshold techniques” in the mid-1980s, which were based on
sniffing increasingly diluted odour samples until no odour
was detected. Aroma Extract Dilution Analysis (AEDA) and
CharmAnalysis are the most commonly used dilution tech-
niques (van Ruth and O’Connor, 2001). AEDA quantifies the
odour potency of each odorant as the maximum dilution of
the odour sample that an odour is perceived in, and is reported
as a Factor Dilution (FD). CharmAnalysis methods require the
determination of the duration of the eluting odorant in order
to yield a chromatographic peak (Plutowska and Wardencki,
2008). Due to the long duration of theses analyses, the
number of assessors is practically limited to 3, which limits
the precision of the results.
Detection frequency techniques utilise the total number of
positive detections of a specific odorant from a panel of 6 to 12
assessors as a measure for the odorant intensity (van Ruth
and O’Connor, 2001). This method is fast, simple and does
not require any particular training of the assessors, however
when odorants are far above their odour threshold, the
correlation between detection frequency and odour intensity
is poor (end of scale effect).
For direct intensity techniques, odorant intensity is recor-
ded on-line during peak elution or scored on a previously
defined intensity scale after peak elution. The obtained aro-
magrams represent the odorant intensity as a function of the
retention time in a similar manner as conventional GC-MS or
GC-FID chromatograms represent odour mass. The main
drawback inherent to direct intensity techniques is the need
for an experienced and trained panel of assessors in order to
obtain fast and repeatable aromagrams (Delahunty et al.,
2006). Extensive reviews of the fundamentals underlying the
above described GC-O methods have been recently published
by van Ruth (2001), Delahunty et al. (2006) and Plutowska and
Wardencki (2008).
4.1. Limitation of combined gas chromatography-olfactometry analysis
The performance of GC-O is strongly dependent on the quality
of sample injected into the chromatograph, which is in turn
dependent on the method of volatile compound extraction
(solvent extraction vs. distillation vs. headspace sampling)
and sample storage conditions (selected to prevent odorant
oxidation or sample contamination) (Plutowska and
Wardencki, 2008). The chromatographic conditions used for
the separation of the odorants are also crucial (Begnaud et al.,
2006; Eyres et al., 2007), in particular the injection temperature
(thermally labile compounds decompose at high injection
temperatures) and the selection of the optimum chromato-
graphic columns for high peak resolution (both detection
frequency and intensity scoring are influenced by the shape of
the elution) (Drawert and Christoph, 1984; van Ruth and
O’Connor, 2001). Many of the limitations associated with
olfactory analysis (due to the use of human detectors) are also
applicable to GC-O analysis, including sensitivity/alertness
reduction by fatigue, missed odorant inhalation due to the
assessor breathing cycle, nose saturation in sensitive asses-
sors, and bias derived from the ability of the assessors to
remember odour profiles and predict odour composition
(Delahunty et al., 2006; Hochereau and Bruchet, 2004; van Ruth
and O’Connor, 2001).
GC-O has the potential to fill the gap between chemical and
sensorial analysis of environmental emissions, although the
reconstruction of odour character from the combination of
the individual odours is not straightforward. The inability to
predict synergistic, antagonistic, or additive interactions
among odorants limits the usability of results obtained from
GC-O analysis (Ryan et al., 2008). In addition, the lack of
standardizedmethodological aspects and the strong inertia in
incorporating the latest advances in olfactometry and sensory
science are severely restricting the full development and
implementation of this technology in fields such as environ-
mental monitoring (Delahunty et al., 2006; van Ruth and
O’Connor, 2001). Despite these limitations, GC-O analysis is
extremely valuable in the design of odour abatement
processes by identifying specific odorants of interest
(although it is of limited practical use for continuous process
monitoring).
5. Applications of odour abatement processmonitoring
A review of the measurement protocols used in the perfor-
mance monitoring of both full/pilot and laboratory-scale
odour abatement processes was undertaken to assess the
actual use of the reviewed analytical techniques. Figs. 5e7
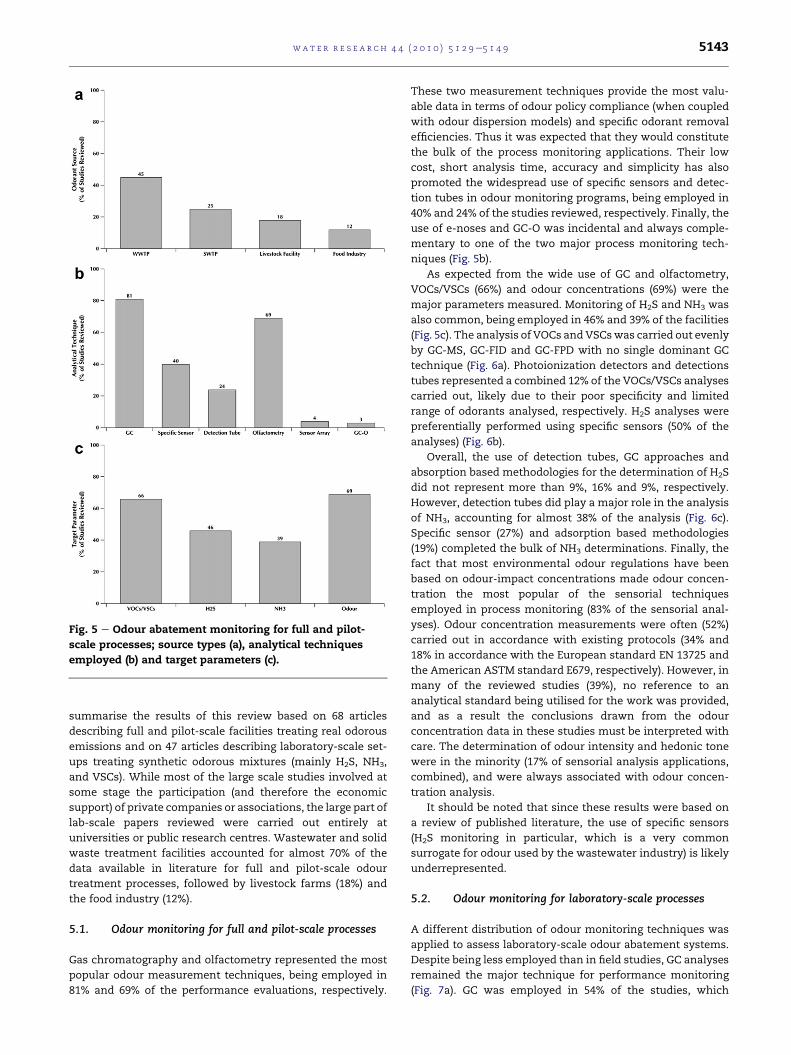
Fig. 5 e Odour abatement monitoring for full and pilot-
scale processes; source types (a), analytical techniques
employed (b) and target parameters (c).
wat e r r e s e a r c h 4 4 ( 2 0 1 0 ) 5 1 2 9e5 1 4 9 5143
summarise the results of this review based on 68 articles
describing full and pilot-scale facilities treating real odorous
emissions and on 47 articles describing laboratory-scale set-
ups treating synthetic odorous mixtures (mainly H2S, NH3,
and VSCs). While most of the large scale studies involved at
some stage the participation (and therefore the economic
support) of private companies or associations, the large part of
lab-scale papers reviewed were carried out entirely at
universities or public research centres. Wastewater and solid
waste treatment facilities accounted for almost 70% of the
data available in literature for full and pilot-scale odour
treatment processes, followed by livestock farms (18%) and
the food industry (12%).
5.1. Odour monitoring for full and pilot-scale processes
Gas chromatography and olfactometry represented the most
popular odour measurement techniques, being employed in
81% and 69% of the performance evaluations, respectively.
These two measurement techniques provide the most valu-
able data in terms of odour policy compliance (when coupled
with odour dispersion models) and specific odorant removal
efficiencies. Thus it was expected that they would constitute
the bulk of the process monitoring applications. Their low
cost, short analysis time, accuracy and simplicity has also
promoted the widespread use of specific sensors and detec-
tion tubes in odour monitoring programs, being employed in
40% and 24% of the studies reviewed, respectively. Finally, the
use of e-noses and GC-O was incidental and always comple-
mentary to one of the two major process monitoring tech-
niques (Fig. 5b).
As expected from the wide use of GC and olfactometry,
VOCs/VSCs (66%) and odour concentrations (69%) were the
major parameters measured. Monitoring of H2S and NH3 was
also common, being employed in 46% and 39% of the facilities
(Fig. 5c). The analysis of VOCs and VSCswas carried out evenly
by GC-MS, GC-FID and GC-FPD with no single dominant GC
technique (Fig. 6a). Photoionization detectors and detections
tubes represented a combined 12% of the VOCs/VSCs analyses
carried out, likely due to their poor specificity and limited
range of odorants analysed, respectively. H2S analyses were
preferentially performed using specific sensors (50% of the
analyses) (Fig. 6b).
Overall, the use of detection tubes, GC approaches and
absorption based methodologies for the determination of H2S
did not represent more than 9%, 16% and 9%, respectively.
However, detection tubes did play a major role in the analysis
of NH3, accounting for almost 38% of the analysis (Fig. 6c).
Specific sensor (27%) and adsorption based methodologies
(19%) completed the bulk of NH3 determinations. Finally, the
fact that most environmental odour regulations have been
based on odour-impact concentrations made odour concen-
tration the most popular of the sensorial techniques
employed in process monitoring (83% of the sensorial anal-
yses). Odour concentration measurements were often (52%)
carried out in accordance with existing protocols (34% and
18% in accordance with the European standard EN 13725 and
the American ASTM standard E679, respectively). However, in
many of the reviewed studies (39%), no reference to an
analytical standard being utilised for the work was provided,
and as a result the conclusions drawn from the odour
concentration data in these studies must be interpreted with
care. The determination of odour intensity and hedonic tone
were in the minority (17% of sensorial analysis applications,
combined), and were always associated with odour concen-
tration analysis.
It should be noted that since these results were based on
a review of published literature, the use of specific sensors
(H2S monitoring in particular, which is a very common
surrogate for odour used by the wastewater industry) is likely
underrepresented.
5.2. Odour monitoring for laboratory-scale processes
A different distribution of odour monitoring techniques was
applied to assess laboratory-scale odour abatement systems.
Despite being less employed than in field studies, GC analyses
remained the major technique for performance monitoring
(Fig. 7a). GC was employed in 54% of the studies, which
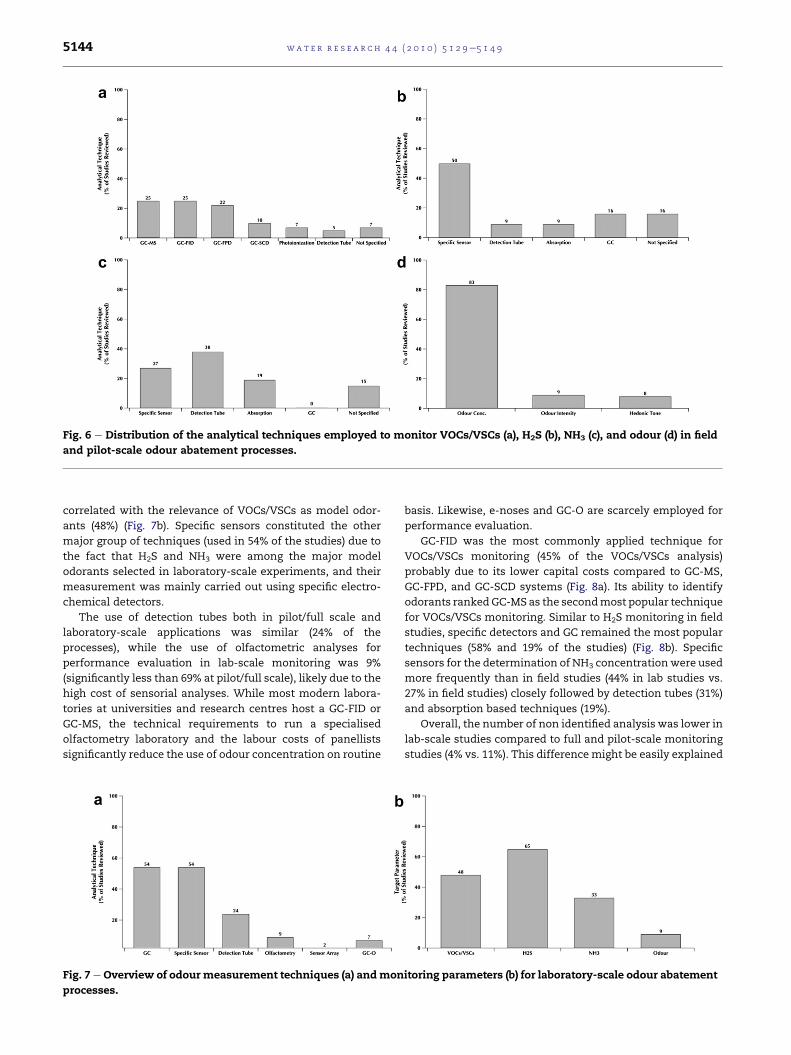
Fig. 6 e Distribution of the analytical techniques employed to monitor VOCs/VSCs (a), H2S (b), NH3 (c), and odour (d) in field
and pilot-scale odour abatement processes.
wat e r r e s e a r c h 4 4 ( 2 0 1 0 ) 5 1 2 9e5 1 4 95144
correlated with the relevance of VOCs/VSCs as model odor-
ants (48%) (Fig. 7b). Specific sensors constituted the other
major group of techniques (used in 54% of the studies) due to
the fact that H2S and NH3 were among the major model
odorants selected in laboratory-scale experiments, and their
measurement was mainly carried out using specific electro-
chemical detectors.
The use of detection tubes both in pilot/full scale and
laboratory-scale applications was similar (24% of the
processes), while the use of olfactometric analyses for
performance evaluation in lab-scale monitoring was 9%
(significantly less than 69% at pilot/full scale), likely due to the
high cost of sensorial analyses. While most modern labora-
tories at universities and research centres host a GC-FID or
GC-MS, the technical requirements to run a specialised
olfactometry laboratory and the labour costs of panellists
significantly reduce the use of odour concentration on routine
Fig. 7 e Overview of odour measurement techniques (a) andmon
processes.
basis. Likewise, e-noses and GC-O are scarcely employed for
performance evaluation.
GC-FID was the most commonly applied technique for
VOCs/VSCs monitoring (45% of the VOCs/VSCs analysis)
probably due to its lower capital costs compared to GC-MS,
GC-FPD, and GC-SCD systems (Fig. 8a). Its ability to identify
odorants ranked GC-MS as the secondmost popular technique
for VOCs/VSCs monitoring. Similar to H2S monitoring in field
studies, specific detectors and GC remained the most popular
techniques (58% and 19% of the studies) (Fig. 8b). Specific
sensors for the determination of NH3 concentrationwere used
more frequently than in field studies (44% in lab studies vs.
27% in field studies) closely followed by detection tubes (31%)
and absorption based techniques (19%).
Overall, the number of non identified analysis was lower in
lab-scale studies compared to full and pilot-scale monitoring
studies (4% vs. 11%). This differencemight be easily explained
itoring parameters (b) for laboratory-scale odour abatement
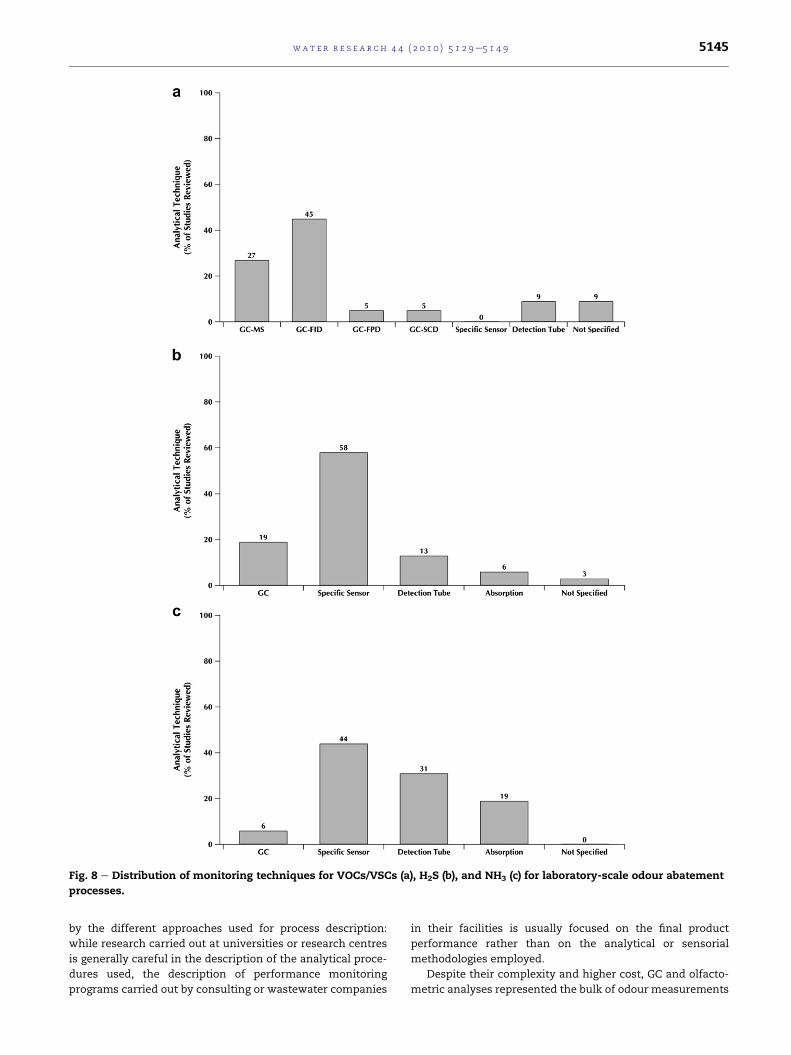
Fig. 8 e Distribution of monitoring techniques for VOCs/VSCs (a), H2S (b), and NH3 (c) for laboratory-scale odour abatement
processes.
wat e r r e s e a r c h 4 4 ( 2 0 1 0 ) 5 1 2 9e5 1 4 9 5145
by the different approaches used for process description:
while research carried out at universities or research centres
is generally careful in the description of the analytical proce-
dures used, the description of performance monitoring
programs carried out by consulting or wastewater companies
in their facilities is usually focused on the final product
performance rather than on the analytical or sensorial
methodologies employed.
Despite their complexity and higher cost, GC and olfacto-
metric analyses represented the bulk of odour measurements
wat e r r e s e a r c h 4 4 ( 2 0 1 0 ) 5 1 2 9e5 1 4 95146
in the monitoring of full scale odour abatement facilities
probably due to the relevanceof thedata provided: compliance
with environmental odour legislation and characterisation of
the removal performance from a chemical viewpoint. Budget
restrictions and the fundamental nature of most of the
research carried out at laboratory scale might explain the
extended use of low cost measurement techniques such as
electrochemical sensors or GC-FID methodologies.
6. Conclusions
Due to the variability in hedonic tone and chemical character
of odorous emissions, no analytical technique can be applied
universally for the measurement of odours from abatement
processes used to treat odour emissions from sewers and
WWTPs. The sensory and analytical techniques currently
used to characterise odours must be regarded as comple-
mentary rather thanmutually exclusive since the information
provided by each technique will cover different monitoring
needs for odour abatement systems. Based upon the litera-
ture, GC and dynamic olfactometry represented the most
widely used odorant monitoring techniques for pilot and full
scale applications (81% and 69% of the pilot and full scale
facilities reviewed, respectively), although odorant moni-
toring for laboratory-scale processes relied primarily on the
use of low cost techniques such as specific sensors and GC-
FID.
It should be noted that since these results were based on
a review of published literature, the use of specific sensors
(H2S monitoring in particular, which is a very common
surrogate for odour used by the wastewater industry) is likely
underrepresented.
Lacking a universally applicable odour characterisation
methodology, recent research and development has focused
on a range of techniques. The development of odour wheels
has decisively contributed a standardised basis to classify,
communicate, and identify the character of odour emissions,
while the standardisation of dynamic olfactometry has
significantly improved the accuracy and repeatability of odour
concentration measurements. Technological advances in
sample pre-concentration, sorbents, and thermal desorption/
cryogenic pre-concentration units, combined with improve-
ments in separation and identification capabilities brought
about by Multidimensional GC, have resulted in improved
characterisation of malodorous emissions. Furthermore, the
introduction of GC-MS-O has greatly enhanced the potential
characterisation of odours by allowing a full identification of
the volatile compounds present in environmental emissions
from both chemical and sensory viewpoints. These advances
in analytical capacity have contributed to improvements in
both the design and evaluation of odour abatement processes,
as well as in the assessment of odour impacts.
While intense research in e-nose technology has resulted in
significantprogress in thefieldofcontinuousodourmonitoring,
more successful long term case-studies are still needed to
overcome the early overoptimistic performance expectations.
Overall, there has been substantial development in recent
years with regards to analytical techniques for odorant anal-
ysis. It is anticipated that these techniques will be further
enhanced as the result of continued technological develop-
ments in the fields of gas chromatography, olfactometry and
non-specific sensor arrays. However, significant knowledge
gaps remain with regards to the sampling component of the
analysis chain. In particular, there exists a lack of stand-
ardised sampling methodologies, as well as knowledge gaps
with regards to the fate and transformation of odorants in
sample containers (in particular during sample transport and
storage), as well as odorant transformation during analysis.
Further research and development is required to address
these issues.
Acknowledgments
This work was supported by Australian Research Council
Linkage Project LP0882016with industry support from Barwon
Regional Water Corporation, Gold Coast Water, Hunter Water
Corporation, Melbourne Water Corporation, South Australian
Water Corporation, South East Water Limited, Sydney Water
Corporation, United Water International, Water Quality
ResearchAustralia, andWater CorporationWesternAustralia,
and by the Spanish Ministry of Education and Science (RYC-
2007-01667 contract, and projects PPQ2009-07601; CON-
SOLIDER-INGENIO 2010 CSD 2007-00055).
r e f e r e n c e s
Abalos, M., Prieto, X., Bayona, J.M., 2002. Determination of volatilealkyl sulfides in wastewater by headspace solid-phasemicroextraction followed by gas chromatography-massspectrometry. Journal of Chromatography A 963 (1e2),249e257.
Ameer, Q., Adeloju, S.B., 2005. Polypyrrole-based electronic nosesfor environmental and industrial analysis. Sensors andActuators B: Chemical 106 (2), 541e552.
Arshak, K., Moore, E., Lyons, G.M., Harris, J., Clifford, S., 2004.A review of gas sensors employed in electronic noseapplications. Sensor Review 24 (2), 181e198.
Begnaud, F., Starkenmann, C., Van de Waalb, M., Chaintreau, A.,2006. Chiral multidimensional gas chromatography (MDGC)and chiral GC-olfactometry with a double-cool-strandinterface: application to malodors. Chemistry & Biodiversity 3(2), 150e160.
Bilsen, I., De Fre, R., 2008. Sniffing team measurements inFlanders: code of good practice. In: 3rd IWA InternationalConference on Odour and VOCs: Measurement, Regulationand Control Techniques. Barcelona, Spain.
Bliss, P.J., Schulz, T.J., Senger, T., Kaye, R.B., 1996. Odourmeasurement e factors affecting olfactometry panelperformance.Water Science and Technology 34 (3e4), 549e556.
Bourgeois, W., Hogben, P., Pike, A., Stuetz, R.M., 2003a.Development of a sensor array based measurement systemfor continuous monitoring of water and wastewater. Sensorsand Actuators B: Chemical 88 (3), 312e319.
Bourgeois, W., Romain, A.C., Nicolas, J., Stuetz, R.M., 2003b. Theuse of sensor arrays for environmental monitoring: interestsand limitations. Journal of Environmental Monitoring 5 (6),852e860.
Bourgeois, W., Stuetz, R.M., 2002. Use of a chemical sensor arrayfor detecting pollutants in domestic wastewater. WaterResearch 36 (18), 4505e4512.
wat e r r e s e a r c h 4 4 ( 2 0 1 0 ) 5 1 2 9e5 1 4 9 5147
Bruno, P., Caselli, M., de Gennaro, G., Solito, M., Tutino, M., 2007.Monitoring of odor compounds produced by solid wastetreatment plants with diffusive samplers. Waste Management27 (4), 539e544.
Burlingame, G.A., 1999. Odor profiling of environmental odors.Water Science and Technology 40 (6), 31e38.
Burlingame, G.A., 2009. A practical framework using odor surveydata to prioritize nuisance odors. Water Science andTechnology 59 (3), 595e602.
Burlingame, G.A., Suffet, I.H., Khiari, D., Bruchet, A.L., 2004.Development of an odor wheel classification scheme forwastewater. Water Science and Technology, 201e209.
Cai, L.S., Koziel, J.A., Lo, Y.C., Hoff, S.J., 2006. Characterization ofvolatile organic compounds and odorants associated withswine barn particulate matter using solid-phasemicroextraction and gas chromatography-massspectrometry-olfactometry. Journal of Chromatography A1102 (1e2), 60e72.
Capelli, L., Sironi, S., Centola, P., Del Rosso, R., Il Grande, M.,2008a. Electronic noses for the continuous monitoring ofodours from a wastewater treatment plant at specificreceptors: focus on training methods. Sensors and ActuatorsB: Chemical 131 (1), 53e62.
Capelli, L., Sironi, S., Del Rosso, R., Centola, P., Il Grande, M.,2008b. A comparative and critical evaluation of odourassessment methods on a landfill site. AtmosphericEnvironment 42 (30), 7050e7058.
Cheng, X., Peterkin, E., Burlingame, G.A., 2005. A study on volatileorganic sulfidecausesofodorsatPhiladelphia’sNortheastWaterPollution Control Plant. Water Research 39 (16), 3781e3790.
Cheng, X.H., Peterkin, E., Narangajavana, K., 2007. Wastewateranalysis for volatile organic sulfides using purge-and-trapwith gas chromatography/mass spectrometry. WaterEnvironment Research 79 (4), 442e446.
Cho, K.S., Hirai, M., Shoda, M., 1991. Degradation characteristicsof hydrogen sulfide, methanethiol, dimethyl sulfide anddimethyl disulfide by Thiobacillus thioparus DW44 isolated frompeat biofilter. Journal of Fermentation and Bioengineering 71(6), 384e389.
Clausen, P.A., Knudsen, H.N., Larsen, K., Kofoed-Sorensen, V.,Wolkoff, P., Wilkins, C.K., 2008. Use of thermal desorption gaschromatography-olfactometry/mass spectrometry for thecomparison of identified and unidentified odor activecompounds emitted from building products containinglinseed oil. Journal of Chromatography A 1210 (2), 203e211.
De Bruyn, G., Van Elst, T., Robinet, P., Vandenbroek, K., 2008. Fullscale evaluation of the odour emissions of two yard trimmingscomposting methods using two complementary odourmeasurement techniques e field panel measurement vs.olfactometry measurements using a Lindvall hool. In: 3rd IWAInternational Conference on Odour and VOCs: Measurement,Regulation and Control Techniques, Barcelona, Spain.
Defoer, N., De Bo, I., Van Langenhove, H., Dewulf, J., Van Elst, T.,2002. Gas chromatography-mass spectrometry as a tool forestimating odour concentrations of biofilter effluents ataerobic composting and rendering plants. Journal ofChromatography A 970 (1e2), 259e273.
Delahunty, C.M., Eyres, G., Dufour, J.P., 2006. Gaschromatography-olfactometry. Journal of Separation Science29 (14), 2107e2125.
Deshusses,M.A.,Hamer,G.,Dunn, I.J., 1995. Behaviorofbiofilters forwaste air biotreatment. 2. Experimental evaluation of a dynamicmodel. Environmental Science & Technology 29 (4), 1059e1068.
Dewettinck, T., Van Hege, K., Verstraete, W., 2001. The electronicnose as a rapid sensor for volatile compounds in treateddomestic wastewater. Water Research 35 (10), 2475e2483.
Dewulf, J., Van Langenhove, H., 1999. Anthropogenic volatileorganic compounds in ambient air and natural waters:
a review on recent developments of analytical methodology,performance and interpretation of field measurements.Journal of Chromatography A 843 (1e2), 163e177.
Dewulf, J., Van Langenhove, H., 2002. Analysis of volatile organiccompounds using gas chromatography. Trac-Trends inAnalytical Chemistry 21 (9e10), 637e646.
Dincer, F., Muezzinoglu, A., 2007. Odor determination atwastewater collection systems: olfactometry versus H2Sanalyses. Clean-Soil Air Water 35 (6), 565e570.
Dravnieks, A., Jarke, F., 1980. Odor threshold measurement bydynamic olfactometry e significant operational variables.Journal of the Air Pollution Control Association 30 (12),1284e1289.
Drawert, F., Christoph, N., 1984. Analysis of Volatiles. Methodsand Applications. Walter de Gruyter, Berlin. 269e291.
Eiceman, G.A., Hill, H.H., Gardea-Torresdey, J., 1998. Gaschromatography. Analytical Chemistry 70 (12), 321Re339R.
Eiceman, G.A., Hill, H.H., Gardea-Torresdey, J., 2000. Gaschromatography. Analytical Chemistry 72 (12), 137Re144R.
Escalas, A., Guadayol, J.M., Cortina, M., Rivera, J., Caixach, J.J., 2003.Time and space patterns of volatile organic compounds ina sewage treatment plant. Water Research 37 (16), 3913e3920.
Eyres, G., Marriott, P.J., Dufour, J.P., 2007. The combination of gaschromatography-olfactometry and multidimensional gaschromatography for the characterisation of essential oils.Journal of Chromatography A 1150 (1e2), 70e77.
Fox,D.L., 1999.Airpollution.AnalyticalChemistry71 (12), 109Re119R.Frechen, F.B., 2001. Regulations and policies. In: Stuetz, R.M.,
Frechen, F.B. (Eds.), Odours in Wastewater Treatment:Measurement,Modelling andControl. IWAPublishing, London.
Fuchs, S., Strobel, P., Siadat, M., Lumbreras, M., 2008. Evaluationof unpleasant odor with a portable electronic nose. MaterialsScience and Engineering: C 28 (5e6), 949e953.
Fuller, G.H., Tisserand, G.A., Steltenk., R., 1964. The gaschromatograph with human sensor: perfumer model. Annalsof the New York Academy of Sciences 116 (A2), 711e724.
Gabriel, D., Deshusses, M.A., 2003. Retrofitting existing chemicalscrubbers to biotrickling filters for H2S emission control.Proceedings of the National Academy of Sciences of theUnited States of America 100 (11), 6308.
Gardner, J.W., Bartrlett, P.N., 1999. Electronic Noses Principles andApplications. Oxford University Press, Oxford.
Goschnick, J., Koronczi, I., Frietsch, M., Kiselev, I., 2005. Waterpollution recognition with the electronic nose KAMINA.Sensors and Actuators B: Chemical 106 (1), 182.
Gostelow, P., Parsons, S.A., Stuetz, R.M., 2001. Odourmeasurements for sewage treatment works. Water Research35 (3), 579e597.
Gostelow, P., Longhurst, P.J., Parsons, S.A., Stuetz, R.M., 2003.Sampling forMeasurement ofOdours. IWAPublishing, London.
Gostelow, P., Parsons, S.A., 2000. Sewage treatment works odourmeasurement. Water Science and Technology 41 (6), 33e40.
Gostelow, P., Parsons, S.A., 2001. Hydrogen sulphidemeasurement. In: Stuetz, R.M., Frechen, F.B. (Eds.), Odours inWastewater Treatment: Measurement, Modelling and Control.IWA Publishing, London.
Guisasola,A.,deHaas,D.,Keller, J.,Yuan,Z., 2008.Methaneformationin sewer systems. Water Research 42 (6e7), 1421e1430.
Guiterrez-Osuna, R., 2002. Pattern analysis for machine olfaction:a review. IEEE Sensors Journal 2 (3), 189e202.
Haas, T., Lammers, P.S., Diekmann, B., Horner, G., Boeker, P.,2008. A method for online measurement of odour witha chemosensor system. Sensors and Actuators B: Chemical132 (2), 545e550.
van Harreveld, A.P., Heeres, P., Harssema, H., 1999. A review of 20years of standardization of odor concentration measurementby dynamic olfactometry in Europe. Journal of the Air & WasteManagement Association 49 (6), 705e715.
wat e r r e s e a r c h 4 4 ( 2 0 1 0 ) 5 1 2 9e5 1 4 95148
van Harreveld, A.P., Mannebeck, D., Maxeiner, B., 2009. Proficiencytesting as the key element in implementing EN13275olfactometry. Water Science and Technology 59 (8), 1649e1655.
Hobbs, P., 2001. Odour analysis by gas chromatography. In:Stuetz, R.M., Frechen, F.B. (Eds.), Odours in WastewaterTreatment: Measurement, Modelling and Control. IWAPublishing, London.
Hobbs, P.J., Misselbrook, T.H., Pain, B.F., 1995. Assessment ofodours from livestock wastes by a photoionization detector,an electronic nose, olfactometry and gas chromatography-mass spectrometry. Journal of Agricultural EngineeringResearch 60 (2), 137e144.
Hobson, J., Yang, G., 2002. Odour mapping using H2Smeasurements. In: Stuetz, R.M., Frechen, F.B. (Eds.), Odours inWastewater Treatment: Measurement, Modelling and Control.IWA Publishing, London.
Hochereau, C., Bruchet, A., 2004. Design and application of a GC-SNIFF/MS system for solving taste and odour episodes indrinking water. Water Science and Technology 49 (9), 81e87.
Hodgins, D., Simmonds, D., 1995. The electronic nose and itsapplication to the manufacture of food-products. Journal ofAutomatic Chemistry 17 (5), 179e185.
Hudon, G., Guy, C., Hermia, J., 2000. Measurement of odorintensity by an electronic nose. Journal of the Air & WasteManagement Association 50 (10), 1750e1758.
Iranpour, R., Coxa, H.H.J., Deshusses, M.A., Schroeder, E.D., 2005.Literature review of air pollution control biofilters andbiotrickling filters for odor and volatile organic compoundremoval. Environmental Progress 24 (3), 254e267.
Jiang, J., Coffey, P., Toohey, B., 2006. Improvement of odorintensity measurement using dynamic olfactometry. Journalof the Air & Waste Management Association 56 (5), 675.
Kilburn, K.H., Warshaw, R.H., 1995. Neurotoxic effects fromresidential exposure to chemicals from an oil processingfacility and superfund site. Neurotoxicology and Teratology 17(2), 89e102.
Kleeberg, K.K., Liu, Y., Jans, M., Schlegelmilch, M., Streese, J.,Stegmann, R., 2005. Development of a simple and sensitivemethod for the characterization of odorous waste gasemissions by means of solid-phase microextraction (SPME)and GC-MS/olfactometry. Waste Management 25 (9), 872e879.
Koziel, J.A., Cai, L.S., Hoff, S., Xin, H., Wright, D.W., Trabue, S.,2005. Analysis of gases and odours associated with particulatematter in swine barns using SPME-GS-MS-olfactometry. In:Proceedings of the 2005 ASAE Annual International Meeting,Tampa, Florida.
Larroque, V., Desauziers, V., Mocho, P., 2006. Comparison of twosolid-phase microextraction methods for the quantitativeanalysis of VOCs in indoor air. Analytical and BioanalyticalChemistry 386 (5), 1457e1464.
Leff, J.W., Fierer, N., 2008. Volatile organic compound (VOC)emissions from soil and litter samples. Soil Biology &Biochemistry 40 (7), 1629e1636.
Leger, C., 2008. Odours supervision setting by Air Normand, airpollution monitoring network. In: 3rd IWA InternationalConference on Odour and VOCs: Measurement, Regulationand Control Techniques, Barcelona, Spain.
Lewis, A.C., 2000. New directions: novel separation techniques inVOC analysis pose new challenges to atmospheric chemistry.Atmospheric Environment 34 (7), 1155e1156.
Li, K.C., Shooter, D., 2004. Analysis of sulfur-containingcompounds in ambient air using solid-phase microextractionand gas chromatography with pulsed flame photometricdetection. International Journal of Environmental AnalyticalChemistry 84 (10), 749e760.
Li, T., 2005. The Application of Artificial Neural Networks in theElectronic Nose for Odour Measurement [M.Sc.]. University ofManitoba (Canada), Canada.
Mannebeck, D., Mannebeck, H., 2001. Interlaboratory comparisonof dynamic olfactometry in Central Europe 2000. WaterScience and Technology 44 (9), 27e32.
Marin, A.B., Barnard, J., Darlington, R.B., Acree, T.E., 1991. Sensorythresholds: estimation from dose-response curves. Journal ofSensory Studies 6 (4), 205e225.
McGinley, M.A., McGinley, C.M., 2004. Comparison of fieldolfactometers in a controlled chamber using hydrogen sulfideas the test odorant.Water ScienceandTechnology50 (4), 75e82.
Monn, C., Hangartner, M., 1996. Passive sampling of aromaticvolatile organic compounds (VOC) in ambient air inSwitzerland. Environmental Technology 17 (3), 301e307.
Muezzinoglu, A., 2003. A study of volatile organic sulfuremissions causing urban odors. Chemosphere 51 (4), 245e252.
Nakamoto, T., Sumitimo, E., 2003. Study of robust odor sensingsystem with auto-sensitivity control. Sensors and Actuators B:Chemical 89 (3), 285e291.
Nake, A., Dubreuil, B., Raynaud, C., Talou, T., 2005. Outdoor in situmonitoring of volatile emissions from wastewater treatmentplants with two portable technologies of electronic noses.Sensors and Actuators B: Chemical 106 (1), 36e39.
Nielsen, A.T., Jonsson, S., 2002. Quantification of volatile sulfurcompounds in complex gaseous matrices by solid-phasemicroextraction. Journal of Chromatography A 963 (1e2),57e64.
Onkal-Engin, G., Demir, I., Engin, S.N., 2005. Determination of therelationship between sewage odour and BOD by neuralnetworks. Environmental Modelling & Software 20 (7),843e850.
Ozturk, Z.Z., Tasaltin, C., Engin, G.O., Gurek, A.G., Atilla, D.,Ahsen, V., Ince, M., 2009. Evaluation of a fast wastewater odourcharacterisation procedure using a chemical sensor array.EnvironmentalMonitoring andAssessment 151 (1e4), 369e375.
Parcsi G, Stuetz RM., 2007. Improving odour management andabatement performance using Olfactory GC-MS. In: 2ndCongress on Biotechniques for Air Pollution Control, ACoruna, Spain.
Plutowska, B., Wardencki, W., 2008. Application of gaschromatography-olfactometry (GC-O) in analysis and qualityassessment of alcoholic beverages e a review. Food Chemistry107 (1), 449e463.
Pollien, P., Fay, L.B., Baumgartner, M., Chaintreau, A., 1999. Firstattempt of odorant quantitation using gas chromatography-olfactometry. Analytical Chemistry 71 (23), 5391e5397.
Ranau, R., Kleeberg, K.K., Schlegelmilch, M., Streese, J.,Stegmann, R., Steinhart, H., 2005. Analytical determination ofthe suitability of different processes for the treatment ofodorous waste gas. Waste Management 25 (9), 908e916.
Rehmann, L., Prpich, G.P., Daugulis, A.J., 2008. Remediation ofPAH contaminated soils: application of a solideliquid two-phase partitioning bioreactor. Chemosphere 73 (5), 798e804.
Ras, M.R., Borrull, F., Marce, R.M., 2008. Determination of volatileorganic sulfur compounds in the air at sewage managementareas by thermal desorption and gas chromatography-massspectrometry. Talanta 74 (4), 562e569.
Romain, A.-C., Delva, J., Nicolas, J., 2008. Complementaryapproaches to measure environmental odours emitted bylandfill areas. Sensors andActuators B: Chemical 131 (1), 18e23.
Rosenfeld, P.E., Suffet, I.H., 2004. Understanding odorantsassociated with compost, biomass facilities, and the landapplication of biosolids. Water Science and Technology 49 (9),193e199.
vanRuth, S.M., 2001.Methods for gas chromatography-olfactometry:a review. Biomolecular Engineering 17 (4e5), 121e128.
van Ruth, S.M., O’Connor, C.H., 2001. Influence of assessors’qualities and analytical conditions on gas chromatography-olfactometry analysis. European Food Research andTechnology 213 (1), 77e82.
wat e r r e s e a r c h 4 4 ( 2 0 1 0 ) 5 1 2 9e5 1 4 9 5149
Ryan, D., Prenzler, P.D., Saliba, A.J., Scollary, G.R., 2008. Thesignificance of low impact odorants in global odour perception.Trends in Food Science & Technology 19 (7), 383e389.
Schulz, T.J., vanHarreveld, A.P., 1996. Internationalmoves towardsstandardisation of odour measurement using olfactometry.Water Science and Technology 34 (3e4), 541e547.
Sharma, K.R., Yuan, Z., de Haas, D., Hamilton, G., Corrie, S.,Keller, J., 2008. Dynamics and dynamic modelling of H2Sproduction in sewer systems. Water Research 42 (10e11),2527e2538.
Sheng,Y., Chen, F.,Wang,X., Sheng,G., Fu, J., 2008.OdorousVolatileOrganic Sulfides inWastewaterTreatment Plants inGuangzhou,China. Water Environment Research 80 (4), 324e330.
Sironi, S., Capelli, L., Centola, P., Del Rosso, R., 2007a.Development of a system for the continuous monitoring ofodours from a composting plant: focus on training, dataprocessing and results validation methods. Sensors andActuators B: Chemical 124 (2), 336e346.
Sironi, S., Capelli, L., Centola, P., Del Rosso, R., Il Grande, M., 2007b.Continuous monitoring of odours from a composting plantusing electronic noses. Waste Management 27 (3), 389e397.
Sluis, N.I., Vossen, F.J.H., 2008. Odour Assessment at an IronFoundry in the Netherlands. 3rd IWA InternationalConference on Odour and VOCs. International WaterAssociation, Barcelona, Spain.
Smet, E., VanLangenhove, H., Verstraete, W., 1997.Isobutyraldehyde as a competitor of the dimethyl sulfidedegrading activity in biofilters. Biodegradation 8 (1), 53e59.
Sneath, R.W., 2001. Olfactometry and the CEN standard. In:Stuetz, R.M., Frechen, F.B. (Eds.), Odours in WastewaterTreatment: Measurement, Modelling and Control. IWAPublishing, London.
Snopok, B.A., Kruglenko, I.V., 2001. Multisensor systems forchemical analysis: state-of-the-art in electronic nosetechnology and new trends in machine olfaction. In:International School on Gas Sensors in Conjunction with the3rd European School of the NOSE Network, Lecce, Italy.
Sohn, J.H., Hudson, N., Gallagher, E., Dunlop, M., Zeller, L.,Atzeni, M., 2008. Implementation of an electronic nose forcontinuous odour monitoring in a poultry shed. Sensors andActuators B: Chemical 133 (1), 60e69.
Sohn, J.H., Dunlop, M., Hudson, N., Kim, T.I., Yoo, Y.H., 2009a.Non-specific conducting polymer-based array capable ofmonitoring odour emissions from a biofiltration system ina piggery building. Sensors and Actuators B: Chemical 135 (2),455e464.
Sohn, J.H., Pioggia, G., Craig, I.P., Stuetz, R.M., Atzeni, M.G., 2009b.Identifying major contributing sources to odour annoyanceusing a non-specific gas sensor array. Biosystems Engineering102 (3), 305e312.
Srivastava, A., Joseph, A.E., Wachasunder, S.D., 2004. Qualitativedetection of volatile organic compounds in outdoor andindoor air. Environmental Monitoring and Assessment 96(1e3), 263e271.
Stetter, J.R., Penrose, W.R., 2002. Understanding chemical sensorsand chemical sensor arrays (electronic noses): past, present,and future. Sensors Update 10 (1), 189e229.
Stuetz, R.M., Fenner, R.A., Engin, G., 1999a. Assessment of odoursfrom sewage treatment works by an electronic nose, H2Sanalysis and olfactometry. Water Research 33 (2), 453e461.
Stuetz, R.M., Fenner, R.A., Engin, G., 1999b. Characterisation ofwastewater using an electronic nose. Water Research 33 (2),442e452.
Stuetz, R.M., George, S., Fenner, R.A., Hall, S.J., 1999c. Monitoringwastewater BOD using a non-specific sensor array. Journal ofChemical Technology and Biotechnology 74 (11), 1069e1074.
Stuetz, R.M., Gostelow, P., Burgess, J.E., 2001. Odour perception.In: Stuetz, R.M., Frechen, F.B. (Eds.), Odours in Wastewater
Treatment: Measurement, Modelling and Control. IWAPublishing, London.
Stuetz, R.M., Fenner, R.A., 2001. Odour measurements usingsensor arrays. In: Stuetz, R.M., Frechen, F.B. (Eds.), Odours inWastewater Treatment: Measurement, Modelling and Control.IWA Publishing, London.
Stuetz, R.M., Nicolas, J., 2001. Sensor arrays: an inspired idea or anobjective measurement of environmental odours? WaterScience and Technology 44 (9), 53e58.
Sucker, K., Both, R., Bischoff, M., Guski, R., Winneke, G., 2008.Odor frequency and odor annoyance. Part I: assessment offrequency, intensity and hedonic tone of environmental odorsin the field. International Archives of Occupational andEnvironmental Health 81 (6), 671e682.
Suffet, I.H., Burlingame, G.A., Rosenfeld, P.E., Bruchet, A., 2004a.The value of an odor-quality-wheel classification scheme forwastewater treatment plants. Water Science and Technology50 (4), 25e32.
Suffet, I.H., Schweitzer, L., Djanette, K., 2004b. Olfactory andchemical analysis of taste and odor episodes in drinking watersupplies. Reviews in Environmental Science andBiotechnology 3 (1), 3e13.
Suffet, I.H., Decottignies, V., Senante, E., Bruchet, A., 2009.Sensory assessment and characterization of odor nuisanceemissions during the composting of wastewater biosolids.Water Environment Research 81 (7), 670e679.
Suffet, I.H., Rosenfeld, P., 2007. The anatomy of odour wheels forodours of drinking water, wastewater, compost and theurban environment. Water Science and Technology 55 (5),335e344.
Trincavelli, M., Coradeschi, S., Loutfi, A., 2009. Odourclassification system for continuous monitoring applications.Sensors and Actuators B: Chemical 139 (2), 265e273.
Turkmen, M., Dentel, S.K., Chiu, P.C., Hepner, S., 2004. Analysis ofsulfur and nitrogen odorants using solid-phasemicroextraction and GC-MS. Water Science and Technology 50(4), 115e120.
Van Harreveld, A.P., 2003. Odour management tools e filling thegaps. Water Science and Technology 50 (4), 1e8.
Van Langenhove, H., Roelstraete, K., Schamp, N., Houtmeyers, J.,1985. GC-MS identification of odorous volatiles in wastewater.Water Research 19 (5), 597e603.
Vincent, A.J., 2001. Sources of odours in wastewater treatment. In:Stuetz, R.M., Frechen, F.B. (Eds.), Odours in WastewaterTreatment: Measurement, Modelling and Control. IWAPublishing, London.
Wang, D.K.W., Austin, C.C., 2006. Determination of complexmixtures of volatile organic compounds in ambient air: anoverview. Analytical and Bioanalytical Chemistry 386 (4),1089e1098.
Wright, D.W., Eaton, D.K., Nielsen, L.T., Kuhrt, F.W., Koziel, J.A.,Spinhirne, J.P., Parker, D.B., 2005. Multidimensional gaschromatography-olfactometry for the identification andprioritization of malodors from confined animal feedingoperations. Journal of Agricultural and Food Chemistry 53 (22),8663e8672.
Wu, B.-Z., Feng, T.-Z., Sree, U., Chiu, K.-H., Lo, J.-G., 2006.Sampling and analysis of volatile organics emitted fromwastewater treatment plant and drain system of an industrialscience park. Analytica Chimica Acta 576 (1), 100e111.
Zarra, T., Naddeo, V., Belgiorno, V., Reiser, M., Kranert, M., 2008.Odour monitoring of small wastewater treatment plantlocated in sensitive environment. Water Science andTechnology 58 (1), 89e94.
Zarra, T., Naddeo, V., Belgiorno, V., Reiser, M., Kranert, M., 2009.Instrumental characterization of odour: a combination ofolfactory and analytical methods. Water Science andTechnology 59 (8), 1603e1609.


![Panasonic...Durian odour 6 Natural reduction 60tmin.] Sweat odour Nonanoic acid Natural reduction 120[min.] Garbage odour Methylmercaptan Natural reduction 601minJ Scalp odour Panasonic](https://img.pdfslide.net/doc/110x75/60d72199474aa2073d394000/panasonic-durian-odour-6-natural-reduction-60tmin-sweat-odour-nonanoic-acid.jpg)