Embed Size (px)
Citation preview
MonitoringMonitoringMonitoringMonitoringMonitoring TTTTTrends in Bat Populations ofrends in Bat Populations ofrends in Bat Populations ofrends in Bat Populations ofrends in Bat Populations of the United Sthe United Sthe United Sthe United Sthe United States andtates andtates andtates andtates and TTTTTerritories:erritories:erritories:erritories:erritories: Problems and ProspectsProblems and ProspectsProblems and ProspectsProblems and ProspectsProblems and Prospects
Information and Technology Report USGS/BRD/ITR–2003-0003
U.S. Department of the Interior U.S. Geological Survey

To purchase this report, contact the National Technical Information Service, 5285 Port Royal Road, Springfield, VA 22161 (call toll free 1-800-553-6847), or the Defense Technical Information Center, 8725 Kingman Rd., Suite 0944, Fort Belvoir, VA 22060-6218.
Cover photograph by Thomas J. O’Shea U.S. Geological Survey
MonitoringMonitoringMonitoringMonitoringMonitoring TTTTTrends in Bat Populationsrends in Bat Populationsrends in Bat Populationsrends in Bat Populationsrends in Bat Populations of the United Sof the United Sof the United Sof the United Sof the United States andtates andtates andtates andtates and TTTTTerritories:erritories:erritories:erritories:erritories: Problems and ProspectsProblems and ProspectsProblems and ProspectsProblems and ProspectsProblems and Prospects
Information and Technology Report USGS/BRD/ITR–2003-0003
By T.J. O’Shea M.A. Bogan Editors
U.S. Department of the Interior U.S. Geological Survey

Suggested citation:
O’Shea, T.J. and Bogan, M.A., eds., 2003, Monitoring trends in bat populations of the United States and territories: problems and prospects: U.S. Geological Survey, Biological Resources Discipline, Information and Technology Report, USGS/BRD/ITR--2003–0003, 274 p.
ii
ContentsContentsContentsContentsContents
Page
IntroductionIntroductionIntroductionIntroductionIntroduction (T.J. O’Shea and M.A. Bogan) ............................................................................................ 1 Bats of the United States and Territories .......................................................................................................................2 Problems and Prospects for Monitoring Trends in Bat Populations .............................................................................3 Acknowledgments ..........................................................................................................................................................5 References Cited .............................................................................................................................................................5
Part I.Part I.Part I.Part I.Part I. Assessing SAssessing SAssessing SAssessing SAssessing Status andtatus andtatus andtatus andtatus and TTTTTrends in Populations of Bats:rends in Populations of Bats:rends in Populations of Bats:rends in Populations of Bats:rends in Populations of Bats: An OverviewAn OverviewAn OverviewAn OverviewAn Overview
Censusing Bats: Challenges, Solutions, and Sampling BiasesCensusing Bats: Challenges, Solutions, and Sampling BiasesCensusing Bats: Challenges, Solutions, and Sampling BiasesCensusing Bats: Challenges, Solutions, and Sampling BiasesCensusing Bats: Challenges, Solutions, and Sampling Biases (T.H. Kunz) .................................. 9 Introduction ....................................................................................................................................................................9 Visual Counts of Roosting Bats ................................................................................................................................... 10 Evening Emergence Counts .......................................................................................................................................... 12 Evening Dispersal or “Flyout” Counts ......................................................................................................................... 12 Disturbance Counts ...................................................................................................................................................... 13 Estimates Based on Mark-Recapture ............................................................................................................................ 13 Challenges and Recent Advances in Censusing Bats ................................................................................................. 13 Conclusions .................................................................................................................................................................. 16 Acknowledgments ........................................................................................................................................................ 17 References Cited ........................................................................................................................................................... 17
Estimates of Population Sizes in Summer Colonies of Brazilian Free-TEstimates of Population Sizes in Summer Colonies of Brazilian Free-TEstimates of Population Sizes in Summer Colonies of Brazilian Free-TEstimates of Population Sizes in Summer Colonies of Brazilian Free-TEstimates of Population Sizes in Summer Colonies of Brazilian Free-Tailed Batsailed Batsailed Batsailed Batsailed Bats (((((TTTTTadarida brasiliensisadarida brasiliensisadarida brasiliensisadarida brasiliensisadarida brasiliensis))))) (G.F. McCracken) .......................................................................................... 21
Introduction .................................................................................................................................................................. 21 Life-History Attributes ................................................................................................................................................. 22 Techniques Used for Assessing Abundance ............................................................................................................... 24
Counts at Exits ....................................................................................................................................................... 25 Combined Still and Motion Picture Photography ................................................................................................. 26 Extrapolation from Densities within Roosts .......................................................................................................... 26 Mark-Recapture ..................................................................................................................................................... 27 Indices of Abundance–Guano Deposition, and Bat Trapping ............................................................................. 27
Trends in Abundance ................................................................................................................................................... 27 Challenges and Prospects for the Future ..................................................................................................................... 28
Challenges and Prospects for Counting ................................................................................................................ 28 Challenges and Prospects for Monitoring ............................................................................................................ 29
References Cited ........................................................................................................................................................... 29
Estimating Population Sizes of Hibernating Bats in Caves and MinesEstimating Population Sizes of Hibernating Bats in Caves and MinesEstimating Population Sizes of Hibernating Bats in Caves and MinesEstimating Population Sizes of Hibernating Bats in Caves and MinesEstimating Population Sizes of Hibernating Bats in Caves and Mines (M.D. Tuttle) ............... 31 Introduction .................................................................................................................................................................. 31 Natural History of Bat Hibernation ............................................................................................................................... 32 Use of Hibernation Surveys in Status Monitoring ....................................................................................................... 33 Precautions for Underground Surveys ......................................................................................................................... 34 Procedures and Biases in Counting Hibernating Bats ................................................................................................. 34
Substrate Temperature ........................................................................................................................................... 35 Cave and Mine Complexity .................................................................................................................................... 37 Sampling Consistency ........................................................................................................................................... 37 Management Applications of Population Estimates During Hibernation ............................................................. 38
Conclusions .................................................................................................................................................................. 38 References Cited ........................................................................................................................................................... 39
iii

Contents (continued)Contents (continued)Contents (continued)Contents (continued)Contents (continued) Page
PopulationPopulationPopulationPopulationPopulation TTTTTrends of Solitary Foliage-Roosting Batsrends of Solitary Foliage-Roosting Batsrends of Solitary Foliage-Roosting Batsrends of Solitary Foliage-Roosting Batsrends of Solitary Foliage-Roosting Bats (T.C. Carter, M.A. Menzel, and D.A. Saugey) ..................................................................................................................................... 41
Introduction .................................................................................................................................................................. 42 Historical Information ................................................................................................................................................... 42 Habitat Analysis ........................................................................................................................................................... 43
Historical Changes ................................................................................................................................................ 43 Potential Population Responses ........................................................................................................................... 44
Health Department Submissions .................................................................................................................................. 45 Lasiurines and Fire ....................................................................................................................................................... 45 Conclusions .................................................................................................................................................................. 45 References Cited ........................................................................................................................................................... 46
Count Methods and PopulationCount Methods and PopulationCount Methods and PopulationCount Methods and PopulationCount Methods and Population TTTTTrends in Pacific Island Flying Foxesrends in Pacific Island Flying Foxesrends in Pacific Island Flying Foxesrends in Pacific Island Flying Foxesrends in Pacific Island Flying Foxes (R.C.B. Utzurrum, G.J. Wiles, A.P. Brooke, and D.J. Worthington) ........................................................................................ 49
Introduction .................................................................................................................................................................. 50 Study Areas .................................................................................................................................................................. 50
American Samoa .................................................................................................................................................... 50 The Mariana Islands .............................................................................................................................................. 51
Monitoring Considerations .......................................................................................................................................... 51 Species Characteristics .......................................................................................................................................... 52 Island Characteristics ............................................................................................................................................ 52
Count Techniques ........................................................................................................................................................ 52 Direct Counts at Colonies ..................................................................................................................................... 53 Counts of Bats Dispersing from Colonies ............................................................................................................. 53 Station Counts of Non-Colonial Bats .................................................................................................................... 53 Variable Circular Plot Technique ............................................................................................................................ 54
Population Trends ........................................................................................................................................................ 54 American Samoa .................................................................................................................................................... 55 Commonwealth of the Northern Mariana Islands ................................................................................................. 57 Guam ...................................................................................................................................................................... 58
Conclusions .................................................................................................................................................................. 58 Acknowledgments ........................................................................................................................................................ 58 References Cited ........................................................................................................................................................... 58
Current SCurrent SCurrent SCurrent SCurrent Status of Pollinating Bats in Southwestern Northtatus of Pollinating Bats in Southwestern Northtatus of Pollinating Bats in Southwestern Northtatus of Pollinating Bats in Southwestern Northtatus of Pollinating Bats in Southwestern North AmericaAmericaAmericaAmericaAmerica (T.H. Fleming, T. Tibbitts, Y.Petryszyn, and V. Dalton) .................................................................................................... 63
Introduction .................................................................................................................................................................. 63 Methods of Population Assessment ............................................................................................................................ 64 Population Trends in the Three Species of Plant-Visiting Bats ................................................................................... 64
The Lesser Long-Nosed Bat ................................................................................................................................. 64 The Greater Long-Nosed Bat ................................................................................................................................ 65 The Mexican Long-Tongued Bat .......................................................................................................................... 66
Conclusions .................................................................................................................................................................. 67 Acknowledgments ........................................................................................................................................................ 67 References Cited ........................................................................................................................................................... 67
WWWWWestern Crevice and Cavity-Roosting Batsestern Crevice and Cavity-Roosting Batsestern Crevice and Cavity-Roosting Batsestern Crevice and Cavity-Roosting Batsestern Crevice and Cavity-Roosting Bats (M.A. Bogan, P.M. Cryan, E.W. Valdez, L.E. Ellison, and T.J. O’Shea) ............................................................................................................................... 69
Introduction .................................................................................................................................................................. 70 Methods ....................................................................................................................................................................... 71 Results and Discussion ................................................................................................................................................ 71
Basic Life History of Crevice-Dwelling Bats ......................................................................................................... 71
iv
Contents (continued)Contents (continued)Contents (continued)Contents (continued)Contents (continued) Page
Roosting Behavior of Crevice-Dwelling Bats ....................................................................................................... 73 Monitoring Crevice-Roosting Bats: Challenges and Opportunities ..................................................................... 73 Techniques Used for Assessing Abundance ........................................................................................................ 74
Summary and Recommendations .................................................................................................................................. 75 References Cited ........................................................................................................................................................... 75
Survey and Monitoring of Rare Bats in Bottomland Hardwood ForestsSurvey and Monitoring of Rare Bats in Bottomland Hardwood ForestsSurvey and Monitoring of Rare Bats in Bottomland Hardwood ForestsSurvey and Monitoring of Rare Bats in Bottomland Hardwood ForestsSurvey and Monitoring of Rare Bats in Bottomland Hardwood Forests (M.K. Clark) ............ 79 Introduction .................................................................................................................................................. 79 Background .................................................................................................................................................................. 79 Surveys: State-by-State Review ................................................................................................................................... 81
Virginia ................................................................................................................................................................... 81 North Carolina ....................................................................................................................................................... 82 South Carolina ....................................................................................................................................................... 82 Florida .................................................................................................................................................................... 83 Louisiana ............................................................................................................................................................... 84 Arkansas ................................................................................................................................................................ 84 Texas ...................................................................................................................................................................... 84 Conclusions from the State-by-State Review ....................................................................................................... 84
Factors Affecting Survey and Monitoring Success ..................................................................................................... 85 Recommendations and Conclusions ............................................................................................................................ 87 Acknowledgments ........................................................................................................................................................ 89 References Cited ........................................................................................................................................................... 90
Bat Colonies in BuildingsBat Colonies in BuildingsBat Colonies in BuildingsBat Colonies in BuildingsBat Colonies in Buildings (T.H. Kunz and D.S. Reynolds) .................................................................. 91 Introduction .................................................................................................................................................................. 91 Impact of Human Attitudes and Activities ................................................................................................................... 92 Factors Affecting Roost Preferences in Buildings ....................................................................................................... 92 Building Roosts in North America ................................................................................................................................ 96
Case Studies in North America .............................................................................................................................. 96 Colony Persistence ................................................................................................................................................ 97
Censusing and Inventorying Bats in Buildings ........................................................................................................... 98 Roosts for Research and Conservation ........................................................................................................................ 98 Acknowledgments ........................................................................................................................................................ 99 References Cited ........................................................................................................................................................... 99
The United Kingdom National Bat Monitoring Programme:The United Kingdom National Bat Monitoring Programme:The United Kingdom National Bat Monitoring Programme:The United Kingdom National Bat Monitoring Programme:The United Kingdom National Bat Monitoring Programme: TTTTTurning Conservation Goalsurning Conservation Goalsurning Conservation Goalsurning Conservation Goalsurning Conservation Goals intointointointointo TTTTTangible Resultsangible Resultsangible Resultsangible Resultsangible Results (A.L. Walsh, C.M.C. Catto, T.M. Hutson, S. Langton, and P.A. Racey) ..... 103
Introduction ................................................................................................................................................................ 104 Bat Populations in the U.K: Status and Trends .................................................................................................. 104 Bat Populations in the U.K.: Policy Background ................................................................................................ 105
Program Development ................................................................................................................................................ 106 National Bat Monitoring Programme Goals ......................................................................................................... 106 Scope, Target Species, and Principal Methods ................................................................................................... 106 Volunteer Network ............................................................................................................................................... 107 Statistical Design ................................................................................................................................................. 107
Program Methods ....................................................................................................................................................... 107 Counts at Maternity Colonies ............................................................................................................................. 107 Counts at Winter Hibernation Sites .................................................................................................................... 108 Summer Bat Detector Surveys ............................................................................................................................. 108 Power Analyses ................................................................................................................................................... 109
v
Contents (continued)Contents (continued)Contents (continued)Contents (continued)Contents (continued)
Page
Population Decline Alert Levels .......................................................................................................................... 110 Program Results .......................................................................................................................................................... 110
Volunteers ............................................................................................................................................................ 110 Baseline Data ....................................................................................................................................................... 110 Power and Monitoring Targets ........................................................................................................................... 111
Discussion .................................................................................................................................................................. 112 Methodological Considerations .......................................................................................................................... 112 Statistical Monitoring Targets ............................................................................................................................. 114 Program Sustainability ......................................................................................................................................... 115 Outlook for the Future ......................................................................................................................................... 116
Acknowledgments ...................................................................................................................................................... 116 References Cited ......................................................................................................................................................... 116
AAAAA Critical Look at National Monitoring Programs for Birds and OtherCritical Look at National Monitoring Programs for Birds and OtherCritical Look at National Monitoring Programs for Birds and OtherCritical Look at National Monitoring Programs for Birds and OtherCritical Look at National Monitoring Programs for Birds and Other WWWWWildlifeildlifeildlifeildlifeildlife SpeciesSpeciesSpeciesSpeciesSpecies (J.R. Sauer) ............................................................................................................................. 119
Introduction ................................................................................................................................................................ 119 Why Monitor? ............................................................................................................................................................ 120 Design Issues for Wildlife Surveys ............................................................................................................................ 120 Common Problems with Bird Surveys ........................................................................................................................ 121 Analysis of Survey Data ............................................................................................................................................ 122
Analysis of 2-Stage Surveys ............................................................................................................................... 122 Analysis of Index Surveys .................................................................................................................................. 122
What Can Be Done to Develop Monitoring Programs for Species that are Difficult to Survey? .............................. 123 Developing Reasonable Population Estimates Within Sample Units ................................................................. 123 Sampling Over Space ........................................................................................................................................... 124
Conclusions ................................................................................................................................................................ 125 A Final Comment ........................................................................................................................................................ 125 References Cited ......................................................................................................................................................... 125
Existing Data on Colonies of Bats in the United SExisting Data on Colonies of Bats in the United SExisting Data on Colonies of Bats in the United SExisting Data on Colonies of Bats in the United SExisting Data on Colonies of Bats in the United States: Summary andtates: Summary andtates: Summary andtates: Summary andtates: Summary and Analysis of the U.S.Analysis of the U.S.Analysis of the U.S.Analysis of the U.S.Analysis of the U.S. Geological Survey’Geological Survey’Geological Survey’Geological Survey’Geological Survey’s Bat Population Databases Bat Population Databases Bat Population Databases Bat Population Databases Bat Population Database (L.E. Elllison, T.J. O’Shea, M.A. Bogan, A.L. Everette, and D.M. Schneider) ................................................................................................................. 127
Introduction ................................................................................................................................................................ 128 Methods ..................................................................................................................................................................... 128
Database Design ................................................................................................................................................. 128 Data Acquisition .................................................................................................................................................. 129 Data Summaries ................................................................................................................................................... 129 Trend Analyses ................................................................................................................................................... 129 Terminology and Definitions ............................................................................................................................... 130
Results and Discussion .............................................................................................................................................. 130 Data Summaries ................................................................................................................................................... 130 Trend Analyses ................................................................................................................................................... 135 Data Summaries for Bats in the Pacific Island Territories ................................................................................... 138 Data Summaries for Bats in the Caribbean Territories ......................................................................................... 139 Data Summaries for Bats in the United States ..................................................................................................... 141
Conclusions ................................................................................................................................................................ 157 Acknowledgments ...................................................................................................................................................... 159 References Cited ......................................................................................................................................................... 160 Appendices 1–21: Results of analyses for trends in counts of bats at colony sites ................................................. 171
vi
Contents (continued)Contents (continued)Contents (continued)Contents (continued)Contents (continued) Page
Part II. Report of thePart II. Report of thePart II. Report of thePart II. Report of thePart II. Report of the WWWWWorkshoporkshoporkshoporkshoporkshop Workshop Format ....................................................................................................................................................... 240
Monitoring Bat Populations on a Broad Scale Will Require Strong Commitment and Well-Planned
Working Group A. Analytical and Methodological Problems in Assessing Bat Numbers and Trends,
Colonial Bat Species Subgroup Issue 4. Developing a National Monitoring Program (See Also Working
Over-Dispersed Bats Subgroup Issue 2. Use of Echolocation-Monitoring to Determine Trends in Habitat
Over-Dispersed Bats Subgroup Issue 3. Use of Mist Netting Surveys to Evaluate Trends of Over-Dispersed
Southwestern Pollinator Subgroup Issue 1. Relative Value of Current Efforts to Monitor Leptonycteris
Southwestern Pollinator Subgroup Issue 2. Standardizing Monitoring Techniques for
Working Group B. Categorizing U.S. Bat Species or Species Groups, and Regions in Terms of Priorities for Establishing Population-Trend Monitoring Programs Based on Conservation Concerns, Roosting Habits,
Principal Conclusions and Recommendations ........................................................................................................... 240 The Natural History of Bats Poses Many Challenges to Population Monitoring .............................................. 240 Major Improvements are Needed in Methods of Estimating Numbers of Bats ................................................. 241 Objectives and Priorities of Bat Population Monitoring Need Careful Consideration ....................................... 242
Sampling Designs ............................................................................................................................................... 242 Information Exchange Among Bat Specialists Should be Enhanced .................................................................. 242
Their Basis, and Needed Research and Improvements in Techniques .................................................................... 243 Panel Discussion ........................................................................................................................................................ 243 Seminar ....................................................................................................................................................................... 244 Definitions and Monitoring Requirements ................................................................................................................. 245 Subgroup Report: Colonial Species ............................................................................................................................ 245
Colonial Bat Species Subgroup Issue 1. Timing of Monitoring Surveys ........................................................... 245 Colonial Bat Species Subgroup Issue 2. Estimation of Colony Size and Population Trends ............................. 246 Colonial Bat Species Subgroup Issue 3. Roost-Switching Between Colonies ................................................... 248
Group C Report) ................................................................................................................................................. 248 Subgroup Report: Over-Dispersed Bats: Foliage, Cavity, and Crevice Roosting Bats .............................................. 249
Over-Dispersed Bats Subgroup Issue 1. Estimation of Population Parameters of Over-Dispersed Bats ........... 249
Use by Over-Dispersed Bats ............................................................................................................................. 250
Bats ................................................................................................................................................................... 251 Over-Dispersed Bats Subgroup Issue 4. Spatial Scale Considerations in Monitoring Over-Dispersed Bats .... 252 Over-Dispersed Bats Subgroup Issue 5. Alternatives to Monitoring ................................................................. 252
Subgroup Report: Assessment of Population Size and Trends in Pacific Island Fruit Bats ...................................... 253 Pacific Island Fruit Bat Subgroup Issue 1. Difficulties in Censusing Pacific Island Fruit Bats .......................... 253
Subgroup Report: Improving Assessment of Numbers and Trends in Southwestern Pollinators ............................ 254
curasoae ............................................................................................................................................................ 254
Leptonycteris curasoae ..................................................................................................................................... 255 Southwestern Pollinator Subgroup Issue 3. Monitoring of Leptonycteris nivalis ............................................. 255 Southwestern Pollinator Subgroup Issue 4. Monitoring of Choeronycteris mexicana ....................................... 256 Southwestern Pollinator Subgroup Issue 5. Continuation of Baseline Monitoring Efforts ................................ 257 Southwestern Pollinator Subgroup Issue 6. Sharing of Baseline and Monitoring Data for the Three Species . 257 Southwestern Pollinator Subgroup Issue 7. Funding for Monitoring and Research ......................................... 257 Southwestern Pollinator Subgroup Issue 8. Associated Research Activities .................................................... 258
Distribution, Threats, and Other Factors ............................................................................................................... 258 Distribution ......................................................................................................................................................... 258 Feeding Strategy ................................................................................................................................................. 259 Roosting Habits .................................................................................................................................................. 259 Population Status ................................................................................................................................................ 260 Threats ................................................................................................................................................................. 260
vii

Contents (concluded)Contents (concluded)Contents (concluded)Contents (concluded)Contents (concluded) Page
Reality .................................................................................................................................................................. 261
Working Group C. Existing Information and Programs to Monitor Bat Population Trends: Utility and Coverage
Working Group C Issue 3. Lack of a Unifying Mandate or Legislative Foundation for a National Bat
Concluding Comments ........................................................................................................................................ 261
of Current Efforts and Potential Expansion in Scale ............................................................................................ 261 Overview .............................................................................................................................................................. 261 Working Group C Issue 1. Lack of Organization of Existing Programs and Information .................................... 262 Working Group C Issue 2. Analytical Considerations for a National Bat Monitoring Program.......................... 263
Conservation Program ...................................................................................................................................... 266 Working Group C Issue 4. National Bat Awareness Week .................................................................................. 267 Working Group C Issue 5. Optimizing Information Obtained from Marked Bats ................................................ 268
References Cited in Working Group Reports ............................................................................................................. 269 Workshop Participants ............................................................................................................................................... 272
viii
IntroductionIntroductionIntroductionIntroductionIntroduction
By
Thomas J. O’Shea
U.S. Geological Survey Fort Collins Science Center
2150 Centre Avenue, Building C Fort Collins, CO 80526-8118
and
Michael A. Bogan
U.S. Geological Survey Fort Collins Science Center
Aridlands Field Station Museum of Southwestern Biology
University of New Mexico Albuquerque, NM 87131
Abstract. Bats are ecologically and economically important mammals. The life histories of bats (particularly their low reproductive rates and the need for some species to gather in large aggregations at limited numbers of roosting sites) make their populations vulnerable to declines. Many of the species of bats in the United States (U.S.) and territories are categorized as endangered or threatened, have been candidates for such categories, or are considered species of concern. The importance and vulnerability of bat populations makes monitoring trends in their populations a goal for their future management. However, scientifically rigorous monitoring of bat populations requires well-planned, statistically defensible efforts. This volume reports findings of an expert workshop held to examine the topic of monitoring populations of bats. The workshop participants included leading experts in sampling and analysis of wildlife populations, as well as experts in the biology and conservation of bats. Findings are reported in this volume under two sections. Part I of the report presents contributed papers that provide overviews of past and current efforts at monitoring trends in populations of bats in the U.S. and territories. These papers consider current techniques and problems, and summarize what is known about the status and trends in populations of selected groups of bats. The contributed papers in Part I also include a description of the monitoring program developed for bat populations in the United Kingdom, a critique of monitoring programs in wildlife in general with recommendations for survey and sampling strategies, and a compilation and analysis of existing data on trends in bats of the U.S. and territories. Efforts directed at monitoring bat populations are piecemeal and have shortcomings. In Part II of the report, the workshop participants provide critical analyses of these problems and develop recommendations for improving methods, defining objectives and priorities, gaining mandates, and enhancing information exchange to facilitate future efforts for monitoring trends in U.S. bat populations.
AbstractAbstractAbstractAbstract
KeyKeyKeyKeyKey WWWWWordsordsordsordsords: Bats, endangered species, population estimation, species of concern, status and trends.
1
2 INFORMATION AND TECHNOLOGY REPORT–2003-0003
Bats of the United StatesBats of the United StatesBats of the United StatesBats of the United StatesBats of the United States andandandandand TTTTTerritorieserritorieserritorieserritorieserritories
The bat (Order Chiroptera) fauna of the United States (U.S.) and territories includes about 60 species. There is growing concern about the population status of many species in this diverse group of mammals. There is also growing interest in the science underlying management and conservation of bats. In terms of biodiversity, there are about 45 species of bats in the U.S., including Hawaii (Pierson, 1998; but also see Kunz and Reynolds, 2003), 13 species in Puerto Rico and the U.S. Virgin Islands [including at least 2 species in common with the mainland; Koopman (1989)], and 4 species in the Pacific island territories (Flannery, 1995). In addition to their contribution to biodiversity, bats can play critical roles in ecosystems and provide important economic benefits as consumers of agricultural and forest pest insects. Bats serve as pollinators and seed dispersers in deserts of the southwestern U.S. (see Fleming and others, 2003) and in tropical ecosystems in the territories [see, for example, Banack (1998); Gannon and Willig (1992)] where these functions can be of economic importance (Wiles and Fujita, 1992). In the mainland U.S., insectivorous bats consume large numbers of insect pests that could otherwise cost agriculture and forestry millions of dollars for control with insecticides (Whitaker, 1995; Pierson, 1998; McCracken and Westbrook, 2002).
Bats have life history traits that make their populations vulnerable to factors that can result in population declines. Unlike many other small mammals, most species of bats give birth once annually, typically have a single young per birth, and usually do not reproduce until at least one year of age (Racey and Entwistle, 2000). Bats can have high maximum longevities (25 or more years, with up to 34 years recorded in one U.S. species; Barclay and Harder, 2003). Populations require high adult survival rates to offset low reproductive rates and prevent declines (Tuttle and Stevenson, 1982). Many U.S. bats gather in large aggregations or colonies to raise young in summer or to hibernate in winter, and seek roosts that provide critical microclimates for these purposes. Such specialized sites may not be in abundance (bats that require caves, for example, may find suitable conditions only at a small subset of caves in a given region), and large segments of regional populations of bats may be restricted to a few specific roosts during critical times of the year. Under such conditions, bats can be very vulnerable to disturbance and disruption by human activities, as well as to physical destruction of the roosts. Numerous instances of vandalism and killing of bats have been reported from underground bat roosts in the U.S., and loss of caves as roosting habitat has occurred as human
populations and activities have grown with time [see, for example, Tuttle (1979)]. Bats in forested areas have also suffered from loss of old growth trees that historically provided large basal hollows used as roosts (Gellman and Zielinski, 1996) as well as a greater array of other roosting possibilities (Pierson, 1998). Transformation of various habitats across the landscape have likely also negatively impacted bat populations, not only through loss of roosts, but through changes in vegetation structure and availability of prey and water (Pierson, 1998; Hayes, 2003). In addition to deliberate killing and loss of habitat, insecticides and other environmental contaminants have impacted bat populations [for reviews see Clark (1981) and Clark and Shore (2001)]. Direct mortality of both young and adult bats through exposure to persistent pesticides in the food chain has been well documented in U.S. bats, including endangered species (Geluso and others, 1976; Clark, 2001; Clark and others, 1978; O’Shea and Clark, 2002).
Six species or subspecies of bats in the continental U.S. have been declared endangered under the U.S. Endangered Species Act of 1973 (ESA), as has the sole species of bat on Hawaii (Table 1). The Florida mastiff bat (Eumops glaucinus floridanus), found in the continental U.S. only in southern Florida, was categorized as a Category 1 candidate for listing as endangered in 1994 (U.S. Fish and Wildlife Service, 1994), but was subsequently judged not to warrant this status until additional information becomes available (U.S. Fish and Wildlife Service, 1996a).
Populations of bats of the U.S. territories have also suffered negative impacts that have resulted in federal protection or designation as candidates for protection. One species of flying fox (Pteropus tokudae) endemic to Guam was last observed in 1967 and is now extinct (Wiles, 1987). The remaining species of flying fox on Guam (P. mariannus) is legally protected as endangered on that island (Table 1) and has been proposed for a legal status of threatened under the ESA in the neighboring Commonwealth of the Northern Mariana Islands (CNMI; U.S. Fish and Wildlife Service, 1998, 2001). The Pacific or Polynesian sheath-tailed bat (Emballonura semicaudata) is the only insectivorous bat in the Pacific island territories, but is now extinct on Guam and parts of the CNMI. OnAmerican Samoa and parts of the CNMI, the Polynesian sheath-tailed bat is a candidate species for which listing as endangered or threatened under ESA is deemed warranted but precluded due to other priorities (U.S. Fish and Wildlife Service, 2001).
In addition to the species or subspecies noted above that are currently listed or proposed for listing under ESA, many of the other species of bats in the U.S. and territories were previously designated as Category 2 candidates for listing under the ESA, including 19 mainland taxa, 4 Pacific
3 O’SHEA AND BOGAN
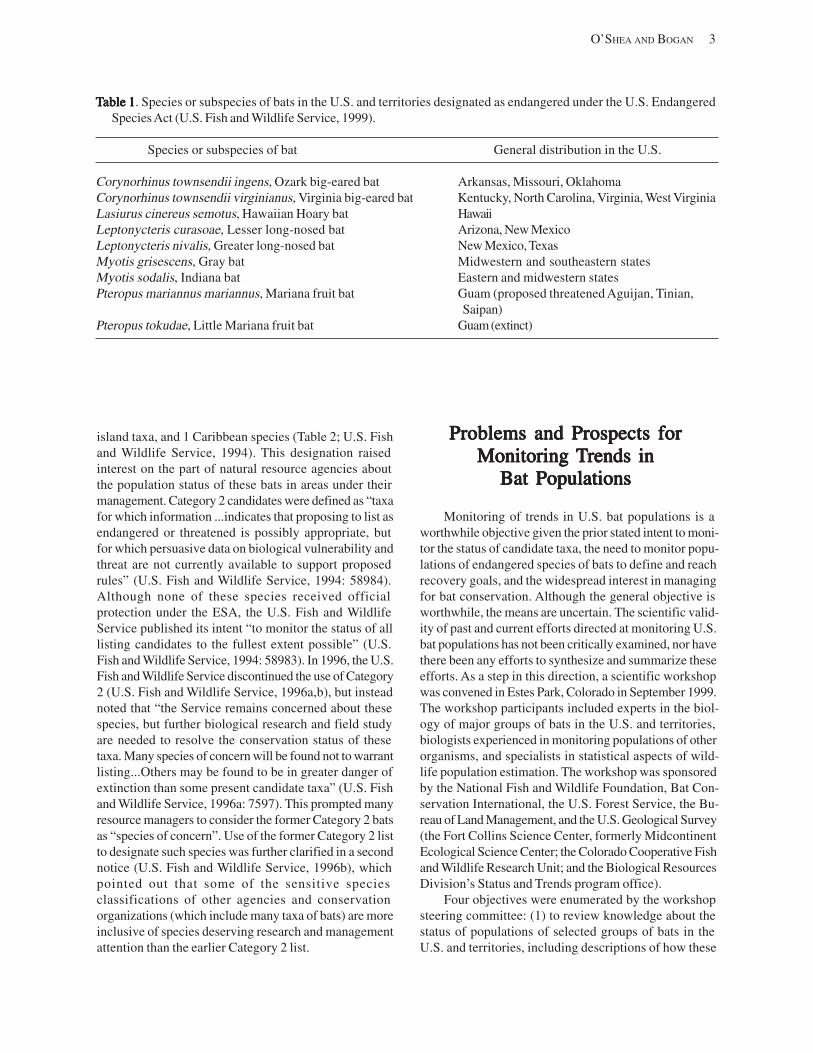
TTTTTable 1able 1able 1able 1able 1. Species or subspecies of bats in the U.S. and territories designated as endangered under the U.S. Endangered Species Act (U.S. Fish and Wildlife Service, 1999).
Species or subspecies of bat General distribution in the U.S.
Corynorhinus townsendii ingens, Ozark big-eared bat Arkansas, Missouri, Oklahoma Corynorhinus townsendii virginianus, Virginia big-eared bat Kentucky, North Carolina, Virginia, West Virginia Lasiurus cinereus semotus, Hawaiian Hoary bat Hawaii Leptonycteris curasoae, Lesser long-nosed bat Arizona, New Mexico Leptonycteris nivalis, Greater long-nosed bat New Mexico, Texas Myotis grisescens, Gray bat Midwestern and southeastern states Myotis sodalis, Indiana bat Eastern and midwestern states Pteropus mariannus mariannus, Mariana fruit bat Guam (proposed threatened Aguijan, Tinian,
Saipan) Pteropus tokudae, Little Mariana fruit bat Guam (extinct)
island taxa, and 1 Caribbean species (Table 2; U.S. Fish and Wildlife Service, 1994). This designation raised interest on the part of natural resource agencies about the population status of these bats in areas under their management. Category 2 candidates were defined as “taxa for which information ...indicates that proposing to list as endangered or threatened is possibly appropriate, but for which persuasive data on biological vulnerability and threat are not currently available to support proposed rules” (U.S. Fish and Wildlife Service, 1994: 58984). Although none of these species received official protection under the ESA, the U.S. Fish and Wildlife Service published its intent “to monitor the status of all listing candidates to the fullest extent possible” (U.S. Fish and Wildlife Service, 1994: 58983). In 1996, the U.S. Fish and Wildlife Service discontinued the use of Category 2 (U.S. Fish and Wildlife Service, 1996a,b), but instead noted that “the Service remains concerned about these species, but further biological research and field study are needed to resolve the conservation status of these taxa. Many species of concern will be found not to warrant listing...Others may be found to be in greater danger of extinction than some present candidate taxa” (U.S. Fish and Wildlife Service, 1996a: 7597). This prompted many resource managers to consider the former Category 2 bats as “species of concern”. Use of the former Category 2 list to designate such species was further clarified in a second notice (U.S. Fish and Wildlife Service, 1996b), which pointed out that some of the sensitive species classifications of other agencies and conservation organizations (which include many taxa of bats) are more inclusive of species deserving research and management attention than the earlier Category 2 list.
Problems and Prospects forProblems and Prospects forProblems and Prospects forProblems and Prospects forProblems and Prospects for MonitoringMonitoringMonitoringMonitoringMonitoring TTTTTrends inrends inrends inrends inrends in
Bat PopulationsBat PopulationsBat PopulationsBat PopulationsBat Populations
Monitoring of trends in U.S. bat populations is a worthwhile objective given the prior stated intent to monitor the status of candidate taxa, the need to monitor populations of endangered species of bats to define and reach recovery goals, and the widespread interest in managing for bat conservation. Although the general objective is worthwhile, the means are uncertain. The scientific validity of past and current efforts directed at monitoring U.S. bat populations has not been critically examined, nor have there been any efforts to synthesize and summarize these efforts. As a step in this direction, a scientific workshop was convened in Estes Park, Colorado in September 1999. The workshop participants included experts in the biology of major groups of bats in the U.S. and territories, biologists experienced in monitoring populations of other organisms, and specialists in statistical aspects of wildlife population estimation. The workshop was sponsored by the National Fish and Wildlife Foundation, Bat Conservation International, the U.S. Forest Service, the Bureau of Land Management, and the U.S. Geological Survey (the Fort Collins Science Center, formerly Midcontinent Ecological Science Center; the Colorado Cooperative Fish and Wildlife Research Unit; and the Biological Resources Division’s Status and Trends program office).
Four objectives were enumerated by the workshop steering committee: (1) to review knowledge about the status of populations of selected groups of bats in the U.S. and territories, including descriptions of how these
4 INFORMATION AND TECHNOLOGY REPORT–2003-0003
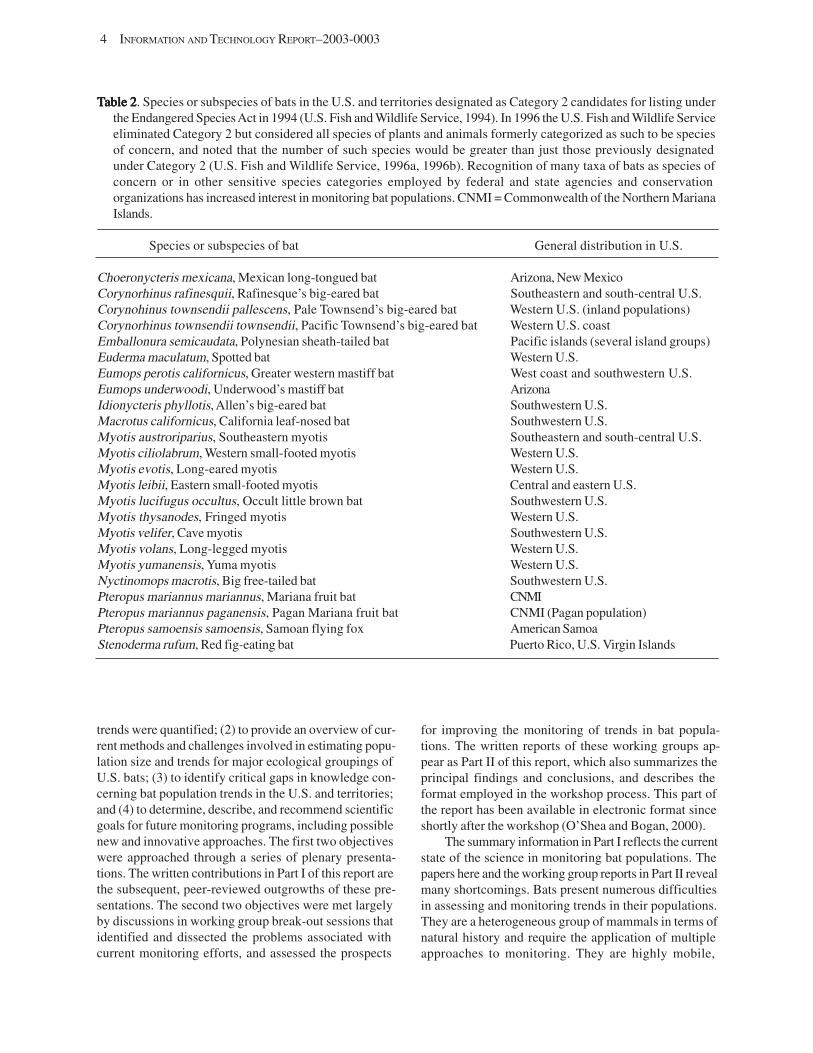
TTTTTable 2able 2able 2able 2able 2. Species or subspecies of bats in the U.S. and territories designated as Category 2 candidates for listing under the Endangered Species Act in 1994 (U.S. Fish and Wildlife Service, 1994). In 1996 the U.S. Fish and Wildlife Service eliminated Category 2 but considered all species of plants and animals formerly categorized as such to be species of concern, and noted that the number of such species would be greater than just those previously designated under Category 2 (U.S. Fish and Wildlife Service, 1996a, 1996b). Recognition of many taxa of bats as species of concern or in other sensitive species categories employed by federal and state agencies and conservation organizations has increased interest in monitoring bat populations. CNMI = Commonwealth of the Northern Mariana Islands.
Species or subspecies of bat General distribution in U.S.
Choeronycteris mexicana, Mexican long-tongued bat Arizona, New Mexico Corynorhinus rafinesquii, Rafinesque’s big-eared bat Southeastern and south-central U.S. Corynohinus townsendii pallescens, Pale Townsend’s big-eared bat Western U.S. (inland populations) Corynorhinus townsendii townsendii, Pacific Townsend’s big-eared bat Western U.S. coast Emballonura semicaudata, Polynesian sheath-tailed bat Pacific islands (several island groups) Euderma maculatum, Spotted bat Western U.S. Eumops perotis californicus, Greater western mastiff bat West coast and southwestern U.S. Eumops underwoodi, Underwood’s mastiff bat Arizona Idionycteris phyllotis, Allen’s big-eared bat Southwestern U.S. Macrotus californicus, California leaf-nosed bat Southwestern U.S. Myotis austroriparius, Southeastern myotis Southeastern and south-central U.S. Myotis ciliolabrum, Western small-footed myotis Western U.S. Myotis evotis, Long-eared myotis Western U.S. Myotis leibii, Eastern small-footed myotis Central and eastern U.S. Myotis lucifugus occultus, Occult little brown bat Southwestern U.S. Myotis thysanodes, Fringed myotis Western U.S. Myotis velifer, Cave myotis Southwestern U.S. Myotis volans, Long-legged myotis Western U.S. Myotis yumanensis, Yuma myotis Western U.S. Nyctinomops macrotis, Big free-tailed bat Southwestern U.S. Pteropus mariannus mariannus, Mariana fruit bat CNMI Pteropus mariannus paganensis, Pagan Mariana fruit bat CNMI (Pagan population) Pteropus samoensis samoensis, Samoan flying fox American Samoa Stenoderma rufum, Red fig-eating bat Puerto Rico, U.S. Virgin Islands
trends were quantified; (2) to provide an overview of current methods and challenges involved in estimating population size and trends for major ecological groupings of U.S. bats; (3) to identify critical gaps in knowledge concerning bat population trends in the U.S. and territories; and (4) to determine, describe, and recommend scientific goals for future monitoring programs, including possible new and innovative approaches. The first two objectives were approached through a series of plenary presentations. The written contributions in Part I of this report are the subsequent, peer-reviewed outgrowths of these presentations. The second two objectives were met largely by discussions in working group break-out sessions that identified and dissected the problems associated with current monitoring efforts, and assessed the prospects
for improving the monitoring of trends in bat populations. The written reports of these working groups appear as Part II of this report, which also summarizes the principal findings and conclusions, and describes the format employed in the workshop process. This part of the report has been available in electronic format since shortly after the workshop (O’Shea and Bogan, 2000).
The summary information in Part I reflects the current state of the science in monitoring bat populations. The papers here and the working group reports in Part II reveal many shortcomings. Bats present numerous difficulties in assessing and monitoring trends in their populations. They are a heterogeneous group of mammals in terms of natural history and require the application of multiple approaches to monitoring. They are highly mobile,
5
predominantly nocturnal, and generally roost in inaccessible or concealed situations. Basic natural history, distribution, roosting preferences, and colony locations are poorly known for many species. Major improvements are also needed in methods for estimating numbers of bats. Most attempts have relied heavily on use of indices at local sites. The use of such sampling approaches to estimate population size and trends in animals in general is inferior to more statistically defensible methods and can lead to incorrect inferences (Thompson and others, 1998; Anderson, 2001).
New techniques must be explored and modern statistical designs applied to improve the scientific basis for future conclusions about bat population trends. Major declines in some bat populations are supported by dramatic evidence linked to various causal factors, and bat conservation efforts are well founded. However, greater sophistication in monitoring is needed in the future to detect declining trends before they become catastrophic, or to quantify increasing trends as positive responses to management. Some suggestions regarding new technologies and sampling designs that should be explored to improve monitoring efforts are provided in Part II of this report and in some of the papers in Part I [see, for example, Kunz (2003)]. Similar deficiencies and shortcomings can be found in attempts to monitor populations of many other groups of wildlife. Sauer (2003) calls attention to some of the problems that continue to complicate the ability to make inferences about trends in well-known monitoring programs for other species, and offers a blueprint of considerations for developing statistically sound sampling schemes for monitoring wildlife populations.
As detailed in Part II, advances in monitoring bat populations will also benefit from careful consideration of objectives and priorities. Implementation of monitoring programs may be possible for certain species and populations, but a more widely encompassing vision for monitoring U.S. bat populations will require a stronger underlying mandate and greater efforts at information exchange. Nonetheless, it is our hope that the recommendations contained in this report will improve the scientific bases of future efforts at monitoring U.S. bat populations, and that the assessments of existing data on the status of our nation’s bat populations will help encourage greater efforts towards their conservation and more effective monitoring.
AcknowledgmentsAcknowledgmentsAcknowledgmentsAcknowledgmentsAcknowledgments
Numerous individuals and organizations were involved in this effort. Fellow members of the steering committee (Mary K. Clark, Laura E. Ellison, Joseph A. Kath,
O’SHEA AND BOGAN
Thomas H. Kunz, Lyle Lewis, Kirk W. Navo, William E. Rainey, and Merlin D. Tuttle) provided critical input to planning the direction and focus of the workshop. David R. Anderson, Kenneth P. Burnham, John R. Sauer, and Gary C. White provided insightful discussions of issues and principles in sampling, estimation, and survey design and their applications in monitoring wildlife population trends. In addition to the above individuals, significant contributions to the scientific discussions and written reports of the working groups were made by Robert D. Berry, Anne P. Brooke, Patricia E. Brown, Timothy C. Carter, Norita A. Chaney,Alice L. Chung-MacCoubrey, Richard L. Clawson, Paul M. Cryan, Virginia M. Dalton, Steven G. Fancy, Theodore H. Fleming, Jeffrey A. Gore, John P. Hayes, Michael J. Herder, Joseph A. Kath, Allen Kurta, Gary F. McCracken, Rodrigo A. Medellin, Michael A. Menzel, Michael J. Rabe, Paul A. Racey, David A. Saugey, Ruth C. B. Utzurrum, Ernest W. Valdez, Allyson L. Walsh, Gary J. Wiles, Don E. Wilson, and Michael B. Wunder. Staff of the U.S. Geological Survey, the Colorado Cooperative Fish and Wildlife Research Unit, and the National Fish and Wildlife Foundation who provided important logistical support included Karen J. Adleman, Michele M. Banowetz, Gabriella Chavarria, Beverly Klein, and Pamela H. Leinweber. Marc Bosch (U.S. Forest Service), Fred Stabler (U.S. Bureau of Land Management), and Steven M. Walker (Bat Conservation International) facilitated attendance of some participants. Manuscript reviews were provided by J. Scott Altenbach, Robert M. R. Barclay, Brian S. Cade, Mary K. Clark, Richard L. Clawson, E. Lendell Cockrum, Michael J. Conroy, Denny G. Constantine, Paul M. Cryan, Robert R. Currie, Laura E. Ellison, Keith N. Geluso, Jeffrey A. Gore, Shauna Haymond, Thomas E. Morrell, Sara J. Oyler-McCance, Mark F. Robinson, Armando Rodriguez-Duran, David A. Saugey, Richard E. Sherwin, Ronnie M. Sidner, John O. Whitaker, Jr., Gary J. Wiles, Kenneth T. Wilkins, and Don E. Wilson. Production of the final report was facilitated by the technical support of Dora Medellin, Jennifer Shoemaker, Dale Crawford, and Delia Story.
References CitedReferences CitedReferences CitedReferences CitedReferences Cited
Anderson, D. R., 2001, The need to get the basics right in wildlife field studies: Wildlife Society Bulletin, vol. 29, p. 1294–1297.
Banack, S.A., 1998, Diet selection and resource use by flying foxes (genus Pteropus): Ecology, vol. 79, p. 1949–1967.
Barclay, R.M.R., and Harder, L.D., 2003, Life histories of bats: life in the slow lane, in Kunz, T. H. and Fenton, M.B., eds., Bat ecology: Chicago, Illinois: University of Chicago Press, p. 209–253.
6 INFORMATION AND TECHNOLOGY REPORT–2003-0003
Clark, D.R., Jr., 1981, Bats and environmental contaminants: A review, Washington, D.C.: U.S. Fish and Wildlife Service Special Scientific Report-Wildlife No. 235, p. 1–27.
Clark, D.R., Jr., 2001, DDT and the decline of free-tailed bats (Tadarida brasiliensis) at Carlsbad Cavern, New Mexico: Archives of Environmental Contamination and Toxicology, vol. 40, p. 537–543.
Clark, D.R., Jr., and Shore, R.F., 2001, Chiroptera in Shore, R.F. and Rattner, B.A., eds., Ecotoxicology of wild mammals: Chichester, West Sussex, England, Wiley & Sons, p. 159–214.
Clark, D.R., Jr., LaVal, R.K., and Swineford, D.M., 1978, Dieldrin-induced mortality in an endangered species, the gray bat (Myotis grisescens): Science, vol. 199, p. 1357–1359.
Flannery, T.F., 1995, Mammals of the south-west Pacific and Moluccan Islands: Ithaca, New York: Cornell University Press, 464 p.
Fleming, T.H., Tibbitts, T., Petryszyn, Y., and Dalton, V., 2003, Current status of pollinating bats in southwestern North America, in O’Shea, T.J. and Bogan, M.A., eds., Monitoring trends in bat populations of the United States and territories: problems and prospects: U.S. Geological Survey, Information and Technology Report, USGS/BRD/ITR--2003–0003, p. 63–77.
Gannon, M.R., and Willig, M.R., 1992, Bat reproduction in the Luquillo Experimental Forest of Puerto Rico: Southwestern Naturalist, vol. 37, p. 414–419.
Gellman, S.T., and Zielinski, W.J., 1996, Use by bats of old-growth redwood hollows on the North Coast of California: Journal of Mammalogy, vol. 77, p. 255–265.
Geluso, K.N., Altenbach, J.S., and Wilson, D.E., 1976, Bat mortality: pesticide poisoning and migratory stress: Science, vol. 194, p.184–186.
Hayes, J.P., 2003, Habitat ecology and conservation of bats in western coniferous forests, in Zabel, C.J. and Anthony, R.G. , eds., Mammal community dynamics: management and conservation in the coniferous forests of western North America: New York, Cambridge University Press, p. 81–119.
Koopman, K.F., 1989, A review and analysis of bats of the West Indies, in Woods, C.A., ed., Biogeography of the West Indies: past, present, and future: Gainesville, Florida, Sandhill Crane Press, p. 635–643.
Kunz, T.H., 2003, Censusing bats: challenges, solutions, and sampling biases, in O’Shea, T.J. and Bogan, M.A., eds., Monitoring trends in bat populations of the United States and territories: problems and prospects: U.S. Geological Survey, Information and Technology Report, USGS/BRD/ITR--2003–0003, p. 9–19.
Kunz, T.H., and Reynolds, D.S., 2003, Bat colonies in buildings, in O’Shea, T.J. and Bogan, M.A., eds., Monitoring trends in bat populations of the United States and
territories: problems and prospects: U.S. Geological Survey, Information and Technology Report, USGS/ BRD/ITR--2003–0003, p. 91–102.
McCracken, G.F., and Westbrook, J.K., 2002, Bat patrol: National Geographic Magazine, vol. 201, no. 4, p.114123.
O’Shea, T.J., and Bogan, M.A., 2000, Interim report of the workshop on monitoring trends in U.S. bat populations: problems and prospects, Fort Collins, Colorado, U.S. Geological Survey, Fort Collins Science Center, online interim report at (http://www.fort.usgs.gov/products/Publications/20005/20005.pdf), 124 pp.
O’Shea, T.J., and Clark, D.R., Jr., 2002, An overview of contaminants and bats, with special reference to insecticides and the Indiana bat in Kurta, A. and Kennedy, J., eds., The Indiana bat: biology and management of an endangered species: Austin, Texas: Bat Conservation International, p. 237–253.
Pierson, E.D., 1998, Tall trees, deep holes, and scarred landscapes: conservation biology of North American bats, in Kunz, T.H. and Racey, P.A., eds, Bat biology and conservation: Washington, D.C., Smithsonian Institution Press, p. 309–325.
Racey, P.A., and Entwistle, A.C., 2000, Life-history and reproductive strategies of bats, in Crichton, E.G. and Krutzsch, P.H., eds., Reproductive biology of bats: San Diego, Calif., Academic Press, p. 364-414.
Sauer, J.R., 2003, A critical look at national monitoring programs for birds and other wildlife species, in O’Shea, T.J. and Bogan, M.A., eds., Monitoring trends in bat populations of the United States and territories: problems and prospects: U.S. Geological Survey, Information and Technology Report, USGS/BRD/ ITR--2003–0003, p. 119–126.
Thompson, W.L., White, G.C., and Gowan, C., 1998, Monitoring vertebrate populations: New York, Academic Press, 365 p.
Tuttle, M.D., 1979, Status, causes of decline, and management of endangered gray bats: Journal of Wildlife Management, vol. 43, p. 1–17.
Tuttle, M.D., and Stevenson, D., 1982, Growth and survival of bats, in Kunz, T.H., ed., Ecology of bats: New York, Plenum Press, p. 105–150.
U.S. Fish and Wildlife Service, 1994, 50 CFR Part 17, Endangered and threatened wildlife and plants: Animal candidate review for listing as endangered or threatened species: Federal Register, vol. 59, p. 58982–59028.
U.S. Fish and Wildlife Service, 1996a, 50 CFR Part 17, Endangered and threatened species, plant and animal taxa: Proposed rule: Federal Register, vol. 61(40), p. 7595–7613.
U.S. Fish and Wildlife Service, 1996b, 50 CFR Part 17, Endangered and threatened wildlife and plants: Notice of final decision on identification of candidates for
7
listing as endangered or threatened: Federal Register, vol. 61(235), p. 64481–64485.
U.S. Fish and Wildlife Service, 1998, 50 CFR Part 17, Endangered and threatened wildlife and plants: Proposed reclassification from endangered to threatened status for the Mariana fruit bat from Guam, and proposed threatened status for the Mariana fruit bat from the Commonwealth of the Northern Mariana Islands: Federal Register, vol. 63 (58), p. 14641–14650.
U.S. Fish and Wildlife Service, 1999, Reprint of 50 CFR Part 17, Endangered and threatened wildlife and plants: Subpart B, Lists: Available online at http:// endangered.fws.gov/50cfr_animals.pdf.
U.S. Fish and Wildlife Service, 2001, 50 CFR Part 17, Endangered and threatened wildlife and plants: Review of plant and animal species that are candidates or
O’SHEA AND BOGAN
proposed for listing as endangered or threatened, annual notice of findings on recycled petitions, and annual description of progress on listing actions: Federal Register, vol. 66 (210), p. 54808–54832.
Whitaker, J.O. Jr., 1995, Food of the big brown bat Eptesicus fuscus from maternity colonies in Indiana and Illinois: American Midland Naturalist, vol. 134, p. 346–360.
Wiles, G.J., 1987, The status of fruit bats on Guam: Pacific Science, vol. 41, p. 148–157.
Wiles, G.J., and Fujita, M.S, 1992, Food plants and economic importance of flying foxes on Pacific islands, in Wilson, D.E. and Graham, G.L., eds., Pacific island flying foxes: proceedings of an international conservation conference: Washington, D.C., U.S. Fish and Wildlife Service Biological Report 90 (23), p. 24–35.
Part I.Part I.Part I.Part I.Part I. Assessing SAssessing SAssessing SAssessing SAssessing Status andtatus andtatus andtatus andtatus and TTTTTrends inrends inrends inrends inrends in Populations of Bats:Populations of Bats:Populations of Bats:Populations of Bats:Populations of Bats: An OverviewAn OverviewAn OverviewAn OverviewAn Overview
Censusing Bats: Challenges, Solutions, and Sampling BiasesCensusing Bats: Challenges, Solutions, and Sampling BiasesCensusing Bats: Challenges, Solutions, and Sampling BiasesCensusing Bats: Challenges, Solutions, and Sampling BiasesCensusing Bats: Challenges, Solutions, and Sampling Biases
By
Thomas H. Kunz
Center for Ecology and Conservation Biology Department of Biology
Boston University Boston, MA 02215
Abstract. Historically, four methods have been used for censusing bats: roost counts, evening emergence counts, evening dispersal counts, and disturbance counts. Accurate and reliable estimates of the number of bats present in roosting situations are seldom feasible except for relatively small, gregarious species. In other situations, estimates of relative abundance may be the most appropriate data that can be obtained using a reasonable amount of time and effort. Mark-recapture methods can be used only if certain assumptions are met, including: (1) no differences in mortality between marked and unmarked animals; (2) marked and unmarked individuals have the same probability of being recaptured; (3) marks are not lost or overlooked; and (4) marked animals mix freely and randomly with the study population. Questions have been raised about the validity of this technique when applied to most bat species. There are numerous challenges associated with censusing bats, due largely to the wide range of roosting habits. Species that form large aggregations or that roost solitarily in cavities and crevices will be difficult to census. Censuses of hibernating bats must be designed to reduce disturbance and minimize the incidence of arousals. Recent technological advances offer promise for improving our ability to census bats reliably.
AbstractAbstractAbstractAbstract
ords: Commuting bats, disturbance counts, emergence counts, foraging, hibernacula, mark-recapture, maternity roosts, roost counts.
KeyKeyKeyKeyKey WWWWWordsordsordsords
IntroductionIntroductionIntroductionIntroductionIntroduction
Methods suitable for censusing bats vary depending on the size and mobility of the species, the relative numbers of individuals present, access of investigators to roosting sites, and the availability and applicability of devices used for censusing (Mitchell-Jones, 1987; Kunz and Kurta, 1988; Thomas and LaVal, 1988; Frantz, 1989; Sabol and Hudson, 1995; Kunz and others, 1996a,b). A basic knowledge of the species to be censused is important before selecting one or more methods. This knowledge should include a general understanding of roosting habits, foraging behavior, seasonal movements, and how environmental factors may affect local abundance and distribution. Knowledge of temporal and spatial patterns
associated with a particular species or population is also important. If devices such as binoculars, video cameras, night-vision devices, or ultrasonic detectors are used to extend the sensory capabilities of an observer while censusing, researchers must be thoroughly familiar with their operation, limitations, and potential biases (Kunz and others, 1996b).
Roost sites that are relatively easy to locate and house relatively small to moderately sized colonies of bats (<1,000) offer the greatest potential for conducting a reliable census (e.g., Kunz and Anthony, 1996; Hoying and Kunz, 1998; O’Donnell, 2000). Species that roost alone or in small groups in foliage, rock crevices and tree cavities, and species that form large colonies pose the greatest challenges for censusing (Constantine, 1966; Humphrey, 1971; Sabol and Hudson, 1995).
9
10 INFORMATION AND TECHNOLOGY REPORT–2003--0003
Historically, four methods have been used for censusing bats (Kunz and others, 1996b). These include roost counts, evening emergence counts, evening dispersal counts, and disturbance counts. Accurate and reliable estimates of the number of bats present in roosting situations are seldom feasible except for relatively small, gregarious species. Many solitary bats are cryptic and thus difficult to locate. Highly gregarious species often require the coordinated efforts of several individuals or use of sophisticated imaging devices. Some species are highly susceptible to disturbance in roosting situations, and may abandon these sites in response to census efforts (Tuttle, 1979). In other situations, lack of observer access to a roost or low visibility may preclude making reliable estimates during evening emergences.
In situations where direct access to the interior of a roost area is precluded or inadvisable (based on safety risks to observers), evening emergence counts offer the best alternative for censusing (Kunz and Anthony, 1996; Hoying and Kunz, 1998). In other situations, estimates of relative abundance may be the most appropriate data that can be obtained using a reasonable amount of time and effort. Disturbance counts may be of value in some limited situations (Racey, 1979), but in general they are not reliable and may increase mortality, especially of non-volant young.
VVVVVisual Counts of Roosting Batsisual Counts of Roosting Batsisual Counts of Roosting Batsisual Counts of Roosting Batsisual Counts of Roosting Bats
In some roosting situations, where a species forms small, compact, clusters, direct visual counts can provide reliable estimates of colony size (Tuttle, 1979; Hoying and Kunz, 1998; Fig. 1A). In other situations, where the probability of disturbing adults in maternity roosts is high, the number of lactating females can be estimated by counting the number of non-volant young in the roost after adults have departed to feed (Kunz, 1974; Tuttle, 1979; Fig. 1B). This method requires knowledge of litter size and an assumption that all females have given birth.
Direct visual counts of some gregarious megachiropterans may be possible in situations where the colonies are relatively small or where roost trees have been fully or partially defoliated, making it possible to see all or most of the bats (Fig. 2A). However, because colonies (camps) of many gregarious species are so large and diffuse or obscured by surrounding vegetation (Fig. 2B), a roost census may only yield estimates in orders of magnitude. For example, in very large colonies of pteropodids, incremental counts (e.g., 1–100, 100–1,000, 1,000–10,000, and 10,000 plus) have been used for extrapolating to larger areas occupied by the colony (Vardon and Tidemann, 1997, 1999). If numbers of roosting bats
cannot be assessed reliably, “flyout” or dispersal counts (described below) may be more appropriate.
As with highly gregarious, tree-roosting megachiropterans, reliable visual censuses of large, active colonies of cave-roosting bats pose several challenges. Estimates of cluster density averaged from capture or
Fig. 1Fig. 1Fig. 1Fig. 1Fig. 1. (A) Small maternity colony of eastern pipistrelles (Pipistrellus subflavus) during late pregnancy, roosting near the ridgepole of a barn. The number of adult bats present in a colony can be censused by direct observation, assuming that all bats are visible. (B) Young cave myotis (Myotis velifer) roosting on the beam of a barn. The number of lactating females in a colony may be estimated by counting the number of non-volant young present in the roost after adults depart to feed. If the litter size is known for a given species being censused, and all females have produced young, the number of lactating females can be estimated. Photographs by T.H. Kunz.
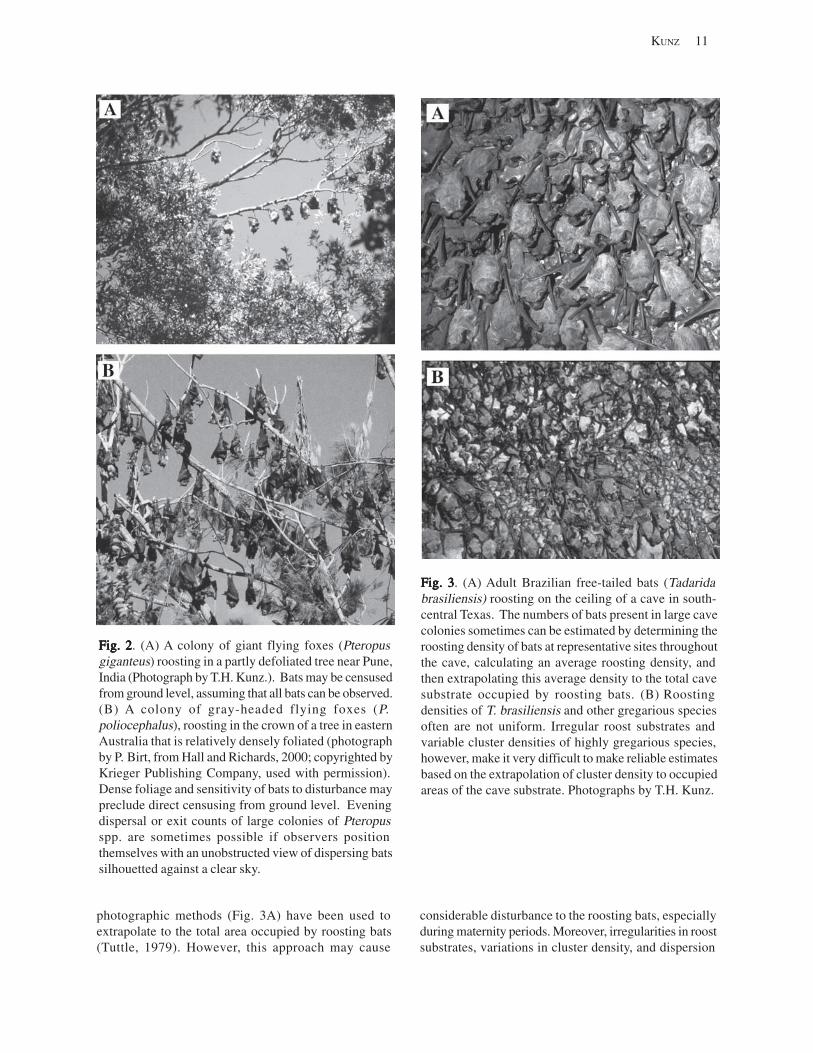
KUNZ 11
Fig. 2Fig. 2Fig. 2Fig. 2Fig. 2. (A) A colony of giant flying foxes (Pteropus giganteus) roosting in a partly defoliated tree near Pune, India (Photograph by T.H. Kunz.). Bats may be censused from ground level, assuming that all bats can be observed. (B) A colony of gray-headed flying foxes (P. poliocephalus), roosting in the crown of a tree in eastern Australia that is relatively densely foliated (photograph by P. Birt, from Hall and Richards, 2000; copyrighted by Krieger Publishing Company, used with permission). Dense foliage and sensitivity of bats to disturbance may preclude direct censusing from ground level. Evening dispersal or exit counts of large colonies of Pteropus spp. are sometimes possible if observers position themselves with an unobstructed view of dispersing bats silhouetted against a clear sky.
photographic methods (Fig. 3A) have been used to extrapolate to the total area occupied by roosting bats (Tuttle, 1979). However, this approach may cause
Fig. 3Fig. 3Fig. 3Fig. 3Fig. 3. (A) Adult Brazilian free-tailed bats (Tadarida brasiliensis) roosting on the ceiling of a cave in south-central Texas. The numbers of bats present in large cave colonies sometimes can be estimated by determining the roosting density of bats at representative sites throughout the cave, calculating an average roosting density, and then extrapolating this average density to the total cave substrate occupied by roosting bats. (B) Roosting densities of T. brasiliensis and other gregarious species often are not uniform. Irregular roost substrates and variable cluster densities of highly gregarious species, however, make it very difficult to make reliable estimates based on the extrapolation of cluster density to occupied areas of the cave substrate. Photographs by T.H. Kunz.
considerable disturbance to the roosting bats, especially during maternity periods. Moreover, irregularities in roost substrates, variations in cluster density, and dispersion
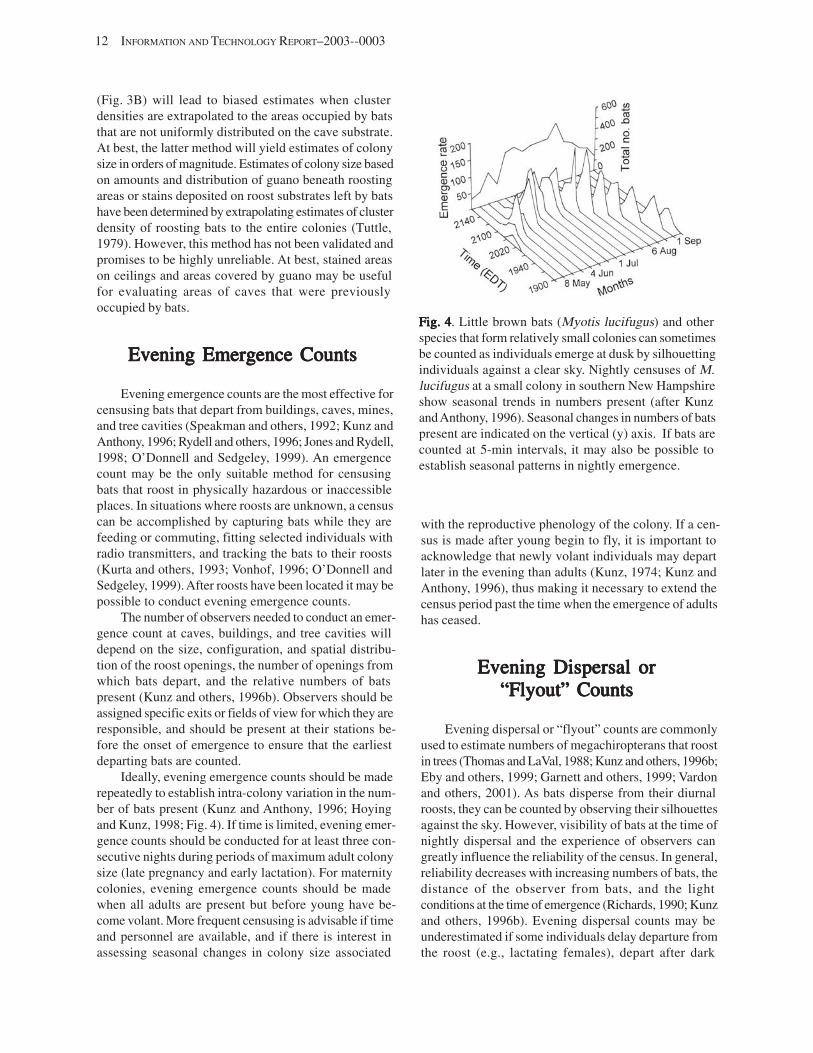
12 INFORMATION AND TECHNOLOGY REPORT–2003--0003
(Fig. 3B) will lead to biased estimates when cluster densities are extrapolated to the areas occupied by bats that are not uniformly distributed on the cave substrate. At best, the latter method will yield estimates of colony size in orders of magnitude. Estimates of colony size based on amounts and distribution of guano beneath roosting areas or stains deposited on roost substrates left by bats have been determined by extrapolating estimates of cluster density of roosting bats to the entire colonies (Tuttle, 1979). However, this method has not been validated and promises to be highly unreliable. At best, stained areas on ceilings and areas covered by guano may be useful for evaluating areas of caves that were previously occupied by bats.
Evening Emergence CountsEvening Emergence CountsEvening Emergence CountsEvening Emergence CountsEvening Emergence Counts
Evening emergence counts are the most effective for censusing bats that depart from buildings, caves, mines, and tree cavities (Speakman and others, 1992; Kunz and Anthony, 1996; Rydell and others, 1996; Jones and Rydell, 1998; O’Donnell and Sedgeley, 1999). An emergence count may be the only suitable method for censusing bats that roost in physically hazardous or inaccessible places. In situations where roosts are unknown, a census can be accomplished by capturing bats while they are feeding or commuting, fitting selected individuals with radio transmitters, and tracking the bats to their roosts (Kurta and others, 1993; Vonhof, 1996; O’Donnell and Sedgeley, 1999). After roosts have been located it may be possible to conduct evening emergence counts.
The number of observers needed to conduct an emergence count at caves, buildings, and tree cavities will depend on the size, configuration, and spatial distribution of the roost openings, the number of openings from which bats depart, and the relative numbers of bats present (Kunz and others, 1996b). Observers should be assigned specific exits or fields of view for which they are responsible, and should be present at their stations before the onset of emergence to ensure that the earliest departing bats are counted.
Ideally, evening emergence counts should be made repeatedly to establish intra-colony variation in the number of bats present (Kunz and Anthony, 1996; Hoying and Kunz, 1998; Fig. 4). If time is limited, evening emergence counts should be conducted for at least three consecutive nights during periods of maximum adult colony size (late pregnancy and early lactation). For maternity colonies, evening emergence counts should be made when all adults are present but before young have become volant. More frequent censusing is advisable if time and personnel are available, and if there is interest in assessing seasonal changes in colony size associated
Fig. 4Fig. 4Fig. 4Fig. 4Fig. 4. Little brown bats (Myotis lucifugus) and other species that form relatively small colonies can sometimes be counted as individuals emerge at dusk by silhouetting individuals against a clear sky. Nightly censuses of M. lucifugus at a small colony in southern New Hampshire show seasonal trends in numbers present (after Kunz and Anthony, 1996). Seasonal changes in numbers of bats present are indicated on the vertical (y) axis. If bats are counted at 5-min intervals, it may also be possible to establish seasonal patterns in nightly emergence.
with the reproductive phenology of the colony. If a census is made after young begin to fly, it is important to acknowledge that newly volant individuals may depart later in the evening than adults (Kunz, 1974; Kunz and Anthony, 1996), thus making it necessary to extend the census period past the time when the emergence of adults has ceased.
Evening Dispersal orEvening Dispersal orEvening Dispersal orEvening Dispersal orEvening Dispersal or “Flyout” Counts“Flyout” Counts“Flyout” Counts“Flyout” Counts“Flyout” Counts
Evening dispersal or “flyout” counts are commonly used to estimate numbers of megachiropterans that roost in trees (Thomas and LaVal, 1988; Kunz and others, 1996b; Eby and others, 1999; Garnett and others, 1999; Vardon and others, 2001). As bats disperse from their diurnal roosts, they can be counted by observing their silhouettes against the sky. However, visibility of bats at the time of nightly dispersal and the experience of observers can greatly influence the reliability of the census. In general, reliability decreases with increasing numbers of bats, the distance of the observer from bats, and the light conditions at the time of emergence (Richards, 1990; Kunz and others, 1996b). Evening dispersal counts may be underestimated if some individuals delay departure from the roost (e.g., lactating females), depart after dark
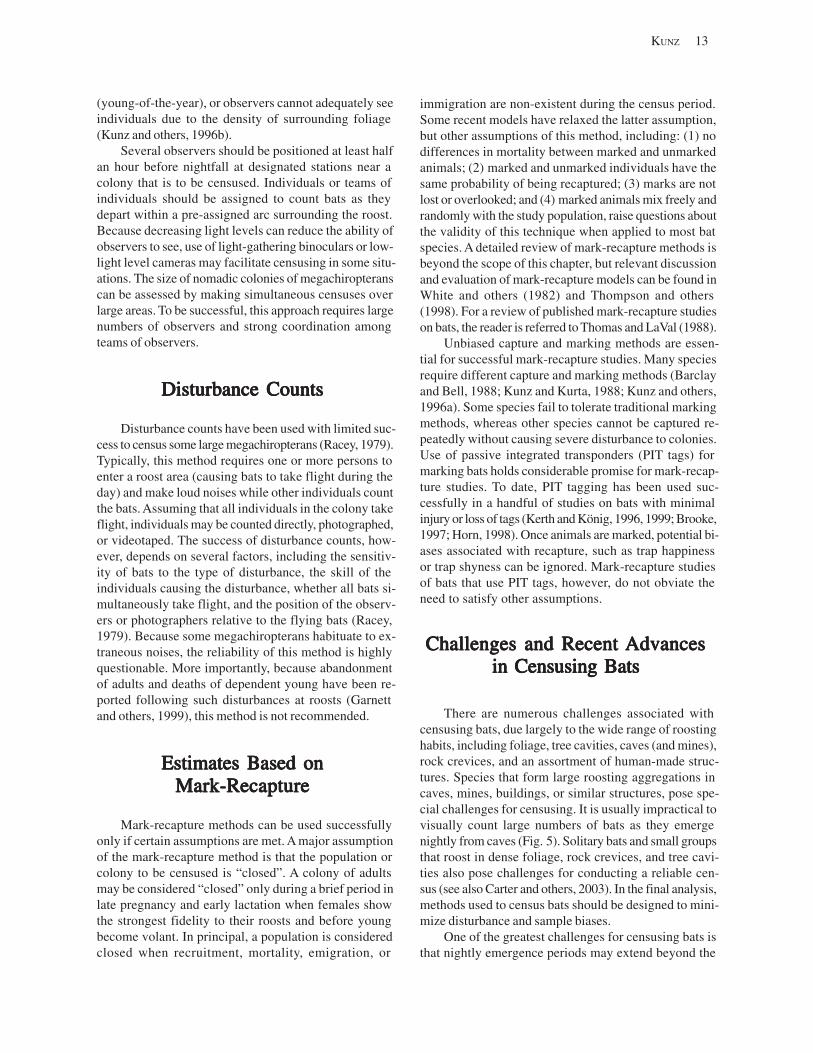
(young-of-the-year), or observers cannot adequately see individuals due to the density of surrounding foliage (Kunz and others, 1996b).
Several observers should be positioned at least half an hour before nightfall at designated stations near a colony that is to be censused. Individuals or teams of individuals should be assigned to count bats as they depart within a pre-assigned arc surrounding the roost. Because decreasing light levels can reduce the ability of observers to see, use of light-gathering binoculars or low-light level cameras may facilitate censusing in some situations. The size of nomadic colonies of megachiropterans can be assessed by making simultaneous censuses over large areas. To be successful, this approach requires large numbers of observers and strong coordination among teams of observers.
Disturbance CountsDisturbance CountsDisturbance CountsDisturbance CountsDisturbance Counts
Disturbance counts have been used with limited success to census some large megachiropterans (Racey, 1979). Typically, this method requires one or more persons to enter a roost area (causing bats to take flight during the day) and make loud noises while other individuals count the bats. Assuming that all individuals in the colony take flight, individuals may be counted directly, photographed, or videotaped. The success of disturbance counts, however, depends on several factors, including the sensitivity of bats to the type of disturbance, the skill of the individuals causing the disturbance, whether all bats simultaneously take flight, and the position of the observers or photographers relative to the flying bats (Racey, 1979). Because some megachiropterans habituate to extraneous noises, the reliability of this method is highly questionable. More importantly, because abandonment of adults and deaths of dependent young have been reported following such disturbances at roosts (Garnett and others, 1999), this method is not recommended.
Estimates Based onEstimates Based onEstimates Based onEstimates Based onEstimates Based on Mark-RecaptureMark-RecaptureMark-RecaptureMark-RecaptureMark-Recapture
Mark-recapture methods can be used successfully only if certain assumptions are met. A major assumption of the mark-recapture method is that the population or colony to be censused is “closed”. A colony of adults may be considered “closed” only during a brief period in late pregnancy and early lactation when females show the strongest fidelity to their roosts and before young become volant. In principal, a population is considered closed when recruitment, mortality, emigration, or
KUNZ 13
immigration are non-existent during the census period. Some recent models have relaxed the latter assumption, but other assumptions of this method, including: (1) no differences in mortality between marked and unmarked animals; (2) marked and unmarked individuals have the same probability of being recaptured; (3) marks are not lost or overlooked; and (4) marked animals mix freely and randomly with the study population, raise questions about the validity of this technique when applied to most bat species. A detailed review of mark-recapture methods is beyond the scope of this chapter, but relevant discussion and evaluation of mark-recapture models can be found in White and others (1982) and Thompson and others (1998). For a review of published mark-recapture studies on bats, the reader is referred to Thomas and LaVal (1988).
Unbiased capture and marking methods are essential for successful mark-recapture studies. Many species require different capture and marking methods (Barclay and Bell, 1988; Kunz and Kurta, 1988; Kunz and others, 1996a). Some species fail to tolerate traditional marking methods, whereas other species cannot be captured repeatedly without causing severe disturbance to colonies. Use of passive integrated transponders (PIT tags) for marking bats holds considerable promise for mark-recapture studies. To date, PIT tagging has been used successfully in a handful of studies on bats with minimal injury or loss of tags (Kerth and König, 1996, 1999; Brooke, 1997; Horn, 1998). Once animals are marked, potential biases associated with recapture, such as trap happiness or trap shyness can be ignored. Mark-recapture studies of bats that use PIT tags, however, do not obviate the need to satisfy other assumptions.
Challenges and RecentChallenges and RecentChallenges and RecentChallenges and RecentChallenges and Recent AdvancesAdvancesAdvancesAdvancesAdvances in Censusing Batsin Censusing Batsin Censusing Batsin Censusing Batsin Censusing Bats
There are numerous challenges associated with censusing bats, due largely to the wide range of roosting habits, including foliage, tree cavities, caves (and mines), rock crevices, and an assortment of human-made structures. Species that form large roosting aggregations in caves, mines, buildings, or similar structures, pose special challenges for censusing. It is usually impractical to visually count large numbers of bats as they emerge nightly from caves (Fig. 5). Solitary bats and small groups that roost in dense foliage, rock crevices, and tree cavities also pose challenges for conducting a reliable census (see also Carter and others, 2003). In the final analysis, methods used to census bats should be designed to minimize disturbance and sample biases.
One of the greatest challenges for censusing bats is that nightly emergence periods may extend beyond the
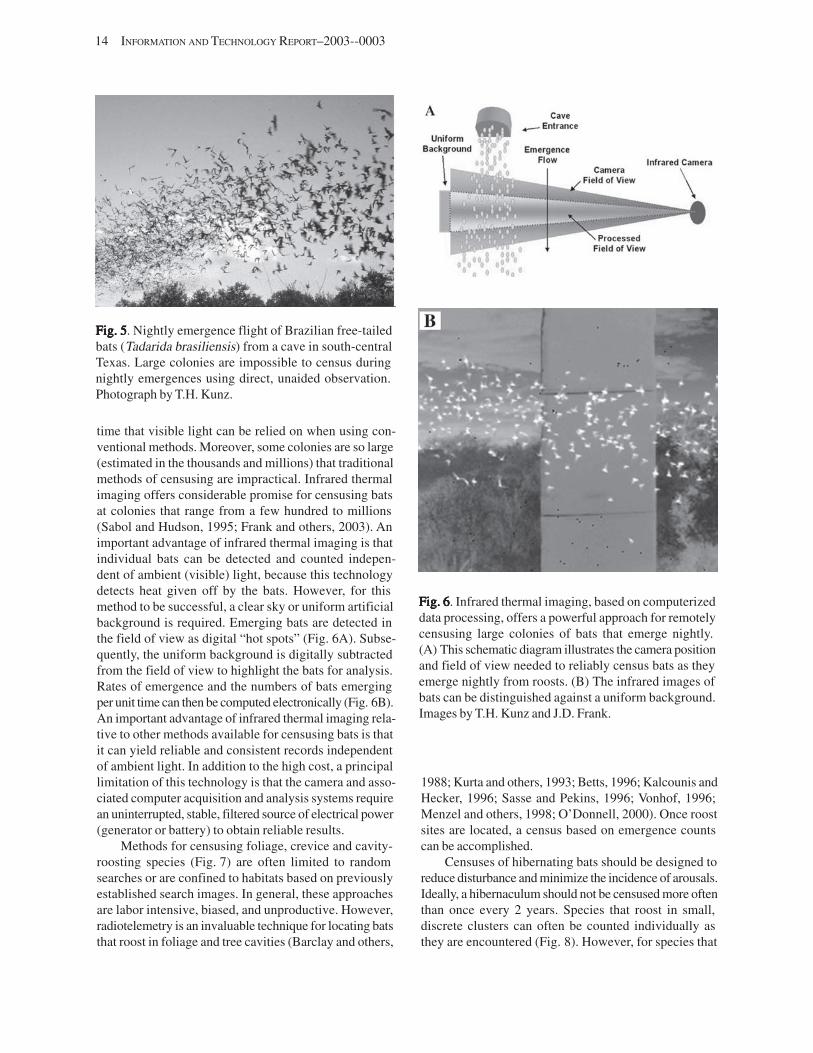
14 INFORMATION AND TECHNOLOGY REPORT–2003--0003
Fig. 5Fig. 5Fig. 5Fig. 5Fig. 5. Nightly emergence flight of Brazilian free-tailed bats (Tadarida brasiliensis) from a cave in south-central Texas. Large colonies are impossible to census during nightly emergences using direct, unaided observation. Photograph by T.H. Kunz.
time that visible light can be relied on when using conventional methods. Moreover, some colonies are so large (estimated in the thousands and millions) that traditional methods of censusing are impractical. Infrared thermal imaging offers considerable promise for censusing bats at colonies that range from a few hundred to millions (Sabol and Hudson, 1995; Frank and others, 2003). An important advantage of infrared thermal imaging is that individual bats can be detected and counted independent of ambient (visible) light, because this technology detects heat given off by the bats. However, for this method to be successful, a clear sky or uniform artificial background is required. Emerging bats are detected in the field of view as digital “hot spots” (Fig. 6A). Subsequently, the uniform background is digitally subtracted from the field of view to highlight the bats for analysis. Rates of emergence and the numbers of bats emerging per unit time can then be computed electronically (Fig. 6B). An important advantage of infrared thermal imaging relative to other methods available for censusing bats is that it can yield reliable and consistent records independent of ambient light. In addition to the high cost, a principal limitation of this technology is that the camera and associated computer acquisition and analysis systems require an uninterrupted, stable, filtered source of electrical power (generator or battery) to obtain reliable results.
Methods for censusing foliage, crevice and cavity-roosting species (Fig. 7) are often limited to random searches or are confined to habitats based on previously established search images. In general, these approaches are labor intensive, biased, and unproductive. However, radiotelemetry is an invaluable technique for locating bats that roost in foliage and tree cavities (Barclay and others,
Fig. 6Fig. 6Fig. 6Fig. 6Fig. 6. Infrared thermal imaging, based on computerized data processing, offers a powerful approach for remotely censusing large colonies of bats that emerge nightly. (A) This schematic diagram illustrates the camera position and field of view needed to reliably census bats as they emerge nightly from roosts. (B) The infrared images of bats can be distinguished against a uniform background. Images by T.H. Kunz and J.D. Frank.
1988; Kurta and others, 1993; Betts, 1996; Kalcounis and Hecker, 1996; Sasse and Pekins, 1996; Vonhof, 1996; Menzel and others, 1998; O’Donnell, 2000). Once roost sites are located, a census based on emergence counts can be accomplished.
Censuses of hibernating bats should be designed to reduce disturbance and minimize the incidence of arousals. Ideally, a hibernaculum should not be censused more often than once every 2 years. Species that roost in small, discrete clusters can often be counted individually as they are encountered (Fig. 8). However, for species that
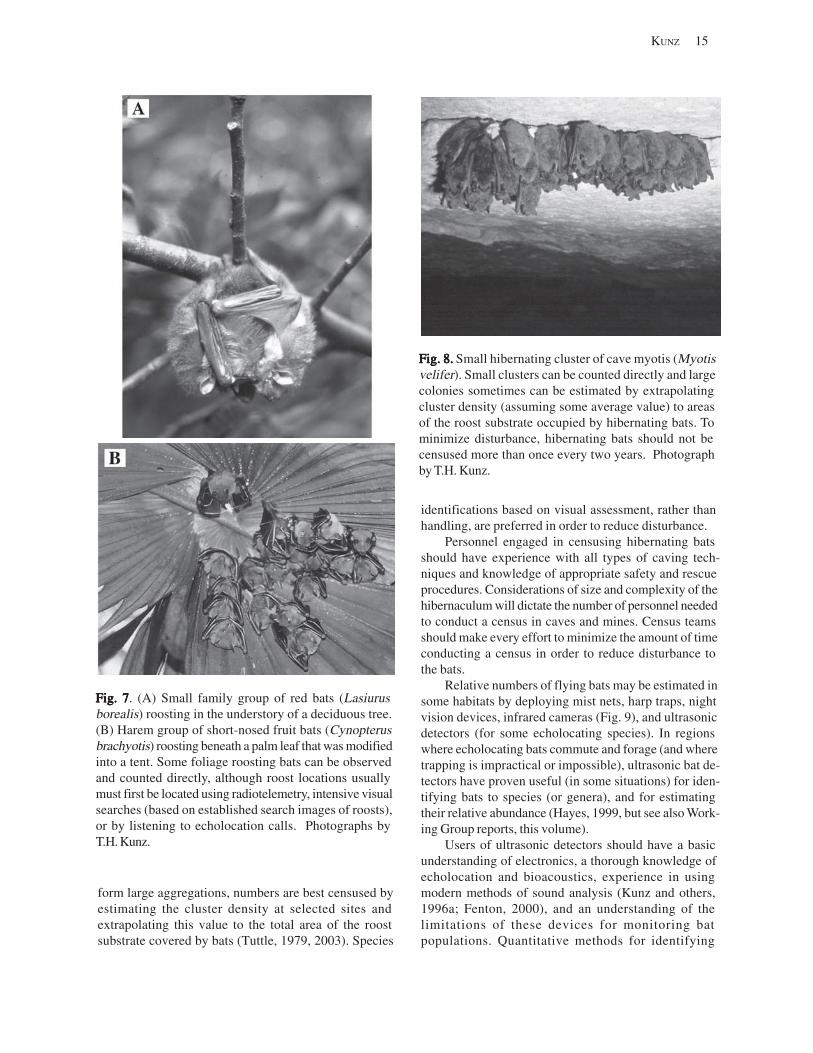
KUNZ 15
Fig. 7Fig. 7Fig. 7Fig. 7Fig. 7. (A) Small family group of red bats (Lasiurus borealis) roosting in the understory of a deciduous tree. (B) Harem group of short-nosed fruit bats (Cynopterus brachyotis) roosting beneath a palm leaf that was modified into a tent. Some foliage roosting bats can be observed and counted directly, although roost locations usually must first be located using radiotelemetry, intensive visual searches (based on established search images of roosts), or by listening to echolocation calls. Photographs by T.H. Kunz.
form large aggregations, numbers are best censused by estimating the cluster density at selected sites and extrapolating this value to the total area of the roost substrate covered by bats (Tuttle, 1979, 2003). Species
Fig. 8.Fig. 8.Fig. 8.Fig. 8.Fig. 8. Small hibernating cluster of cave myotis (Myotis velifer). Small clusters can be counted directly and large colonies sometimes can be estimated by extrapolating cluster density (assuming some average value) to areas of the roost substrate occupied by hibernating bats. To minimize disturbance, hibernating bats should not be censused more than once every two years. Photograph by T.H. Kunz.
identifications based on visual assessment, rather than handling, are preferred in order to reduce disturbance.
Personnel engaged in censusing hibernating bats should have experience with all types of caving techniques and knowledge of appropriate safety and rescue procedures. Considerations of size and complexity of the hibernaculum will dictate the number of personnel needed to conduct a census in caves and mines. Census teams should make every effort to minimize the amount of time conducting a census in order to reduce disturbance to the bats.
Relative numbers of flying bats may be estimated in some habitats by deploying mist nets, harp traps, night vision devices, infrared cameras (Fig. 9), and ultrasonic detectors (for some echolocating species). In regions where echolocating bats commute and forage (and where trapping is impractical or impossible), ultrasonic bat detectors have proven useful (in some situations) for identifying bats to species (or genera), and for estimating their relative abundance (Hayes, 1999, but see also Working Group reports, this volume).
Users of ultrasonic detectors should have a basic understanding of electronics, a thorough knowledge of echolocation and bioacoustics, experience in using modern methods of sound analysis (Kunz and others, 1996a; Fenton, 2000), and an understanding of the limitations of these devices for monitoring bat populations. Quantitative methods for identifying
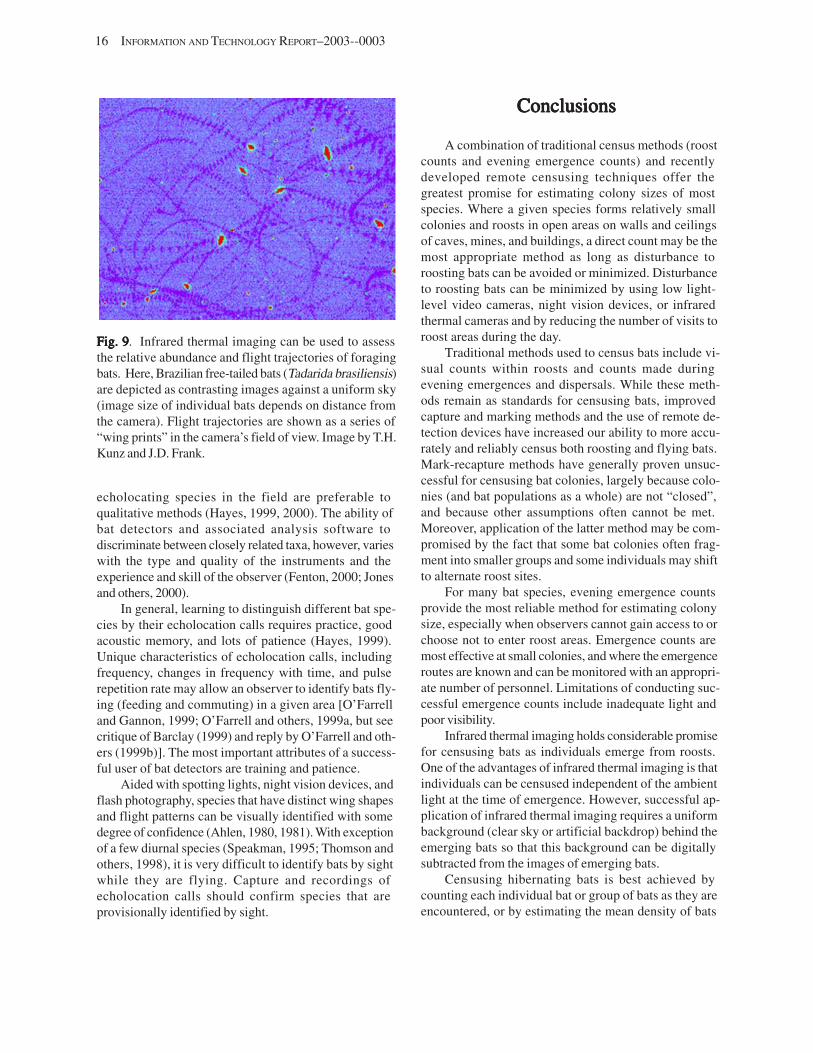
16 INFORMATION AND TECHNOLOGY REPORT–2003--0003
Fig. 9Fig. 9Fig. 9Fig. 9Fig. 9. Infrared thermal imaging can be used to assess the relative abundance and flight trajectories of foraging bats. Here, Brazilian free-tailed bats (Tadarida brasiliensis) are depicted as contrasting images against a uniform sky (image size of individual bats depends on distance from the camera). Flight trajectories are shown as a series of “wing prints” in the camera’s field of view. Image by T.H. Kunz and J.D. Frank.
echolocating species in the field are preferable to qualitative methods (Hayes, 1999, 2000). The ability of bat detectors and associated analysis software to discriminate between closely related taxa, however, varies with the type and quality of the instruments and the experience and skill of the observer (Fenton, 2000; Jones and others, 2000).
In general, learning to distinguish different bat species by their echolocation calls requires practice, good acoustic memory, and lots of patience (Hayes, 1999). Unique characteristics of echolocation calls, including frequency, changes in frequency with time, and pulse repetition rate may allow an observer to identify bats flying (feeding and commuting) in a given area [O’Farrell and Gannon, 1999; O’Farrell and others, 1999a, but see critique of Barclay (1999) and reply by O’Farrell and others (1999b)]. The most important attributes of a successful user of bat detectors are training and patience.
Aided with spotting lights, night vision devices, and flash photography, species that have distinct wing shapes and flight patterns can be visually identified with some degree of confidence (Ahlen, 1980, 1981). With exception of a few diurnal species (Speakman, 1995; Thomson and others, 1998), it is very difficult to identify bats by sight while they are flying. Capture and recordings of echolocation calls should confirm species that are provisionally identified by sight.
ConclusionsConclusionsConclusionsConclusionsConclusions
A combination of traditional census methods (roost counts and evening emergence counts) and recently developed remote censusing techniques offer the greatest promise for estimating colony sizes of most species. Where a given species forms relatively small colonies and roosts in open areas on walls and ceilings of caves, mines, and buildings, a direct count may be the most appropriate method as long as disturbance to roosting bats can be avoided or minimized. Disturbance to roosting bats can be minimized by using low light-level video cameras, night vision devices, or infrared thermal cameras and by reducing the number of visits to roost areas during the day.
Traditional methods used to census bats include visual counts within roosts and counts made during evening emergences and dispersals. While these methods remain as standards for censusing bats, improved capture and marking methods and the use of remote detection devices have increased our ability to more accurately and reliably census both roosting and flying bats. Mark-recapture methods have generally proven unsuccessful for censusing bat colonies, largely because colonies (and bat populations as a whole) are not “closed”, and because other assumptions often cannot be met. Moreover, application of the latter method may be compromised by the fact that some bat colonies often fragment into smaller groups and some individuals may shift to alternate roost sites.
For many bat species, evening emergence counts provide the most reliable method for estimating colony size, especially when observers cannot gain access to or choose not to enter roost areas. Emergence counts are most effective at small colonies, and where the emergence routes are known and can be monitored with an appropriate number of personnel. Limitations of conducting successful emergence counts include inadequate light and poor visibility.
Infrared thermal imaging holds considerable promise for censusing bats as individuals emerge from roosts. One of the advantages of infrared thermal imaging is that individuals can be censused independent of the ambient light at the time of emergence. However, successful application of infrared thermal imaging requires a uniform background (clear sky or artificial backdrop) behind the emerging bats so that this background can be digitally subtracted from the images of emerging bats.
Censusing hibernating bats is best achieved by counting each individual bat or group of bats as they are encountered, or by estimating the mean density of bats
in several representative clusters, and extrapolating this density to the total area of the cave wall or ceiling that is covered by bats. Censuses of hibernating bats should be limited to one census period every other year.
Methods used for censusing foraging and commuting bats are more problematic and generally limited to making relative estimates based on captures or remote sensing. Devices suitable for capture include mist nets and harp traps, whereas photography and videography using supplemental light sources, ultrasonic detectors, and infrared thermal cameras are valuable remote sensing devices for assessing relative abundance.
AcknowledgmentsAcknowledgmentsAcknowledgmentsAcknowledgmentsAcknowledgments
I would like to thank T. O’Shea and M. Bogan for inviting me to contribute this paper, and to L. Ellison for help in organizing the Bat Monitoring Workshop held in Estes Park, Colorado, where this paper was presented. Many students and colleagues have worked closely with me over the years to develop and refine census methods for bats. In particular, I would like to thank E. Anthony, P. August, B. Fenton, J. Frank, A. Kurta, G. McCracken, and M. Tuttle, each of whom freely shared their ideas and expertise. The Kansas Biological Survey, Boston University, the Lubee Foundation, Inc., the National Geographic Society, and the National Science Foundation have supported my research on bats.
References CitedReferences CitedReferences CitedReferences CitedReferences Cited
Ahlen, I., 1980, 1981, Field identification of bats and survey methods based on sounds: Myotis, vol. 18–19, p. 128–136.
Barclay, R.M.R., 1999, Bats are not birds—a cautionary note on using echolocation calls to identify bats: A comment: Journal of Mammalogy, vol. 80, p. 290–296.
Barclay, R.M.R., and Bell, G.P., 1988, Marking and observational techniques, in Kunz, T.H., ed., Ecological and behavioral methods for the study of bats: Washington, D.C., Smithsonian Institution Press, p. 59–76.
Barclay, R.M.R., Faure, P.A., and Farr, D.R., 1988, Roosting behavior and roost selection by migrating silver-haired bats (Lasionycteris noctivagans): Journal of Mammalogy, vol. 69, p. 821–825.
Betts, B.J., 1996, Roosting behavior of silver-haired bats (Lasionycteris noctivagans) and big brown bats (Eptesicus fuscus) in northeast Oregon, in Barclay,
KUNZ 17
R.M.R. and Brigham, R.M., eds., Bats and forests symposium, October 19–21, 1995, Victoria, British Columbia, Canada: Research Branch, British Columbia, Ministry of Forests, Working Paper No. 23, p. 55–61.
Brooke, A.P., 1997, Social organization and foraging behavior of the fishing bat, Noctilio leporinus (Chiroptera: Noctilionidae): Ethology, vol. 103, p. 421–436.
Carter, T.C., Menzel, M.A., and Saugey, D.A. 2003, Population trends of solitary foliage-roosting bats, in O’Shea, T.J. and Bogan, M.A., eds., Monitoring trends in bat populations of the United States and territories: problems and prospects: U.S. Geological Survey, Information and Technology Report, USGS/BRD/ITR-2003–0003, p. 41–47.
Constantine, D.G., 1966, Ecological observations on lasiurine bats in Iowa: Journal of Mammalogy, vol. 47, p. 34–41.
Eby, P., Richards, G., Collins, L., and Parry-Jones, K., 1999, The distribution, abundance, and vulnerability to population reduction of a nomadic nectarivore, the grey-headed flying fox Pteropus poliocephalus in New South Wales, during a period of resource concentration: Australian Zoologist, vol. 31, p. 240–253.
Fenton, M.B., 2000, Choosing the ‘correct’detector: Acta Chiropterologica, vol. 2, p. 215–224.
Frank, J.D., Kunz,T.H., Horn, J., Cleveland, C., and Petronio, S., 2003, Advanced infrared detection and image processing for automated bat censusing, in Andersen, B.G. and Fulop, G.F., eds., Infrared Technology and Applications XXIX: Proceedings of SPIE, the International Society for Optical Engineering, vol. 5074, p. 261–271.
Frantz, S.C., 1989, Remote videography of small mammals under conditions of dim illumination or darkness, in American Society for Testing Materials: Special Technical Publication, No. 1055, p. 41–51.
Garnett, S., Whybird, O., and Spencer, H., 1999, The conservation status of the spectacled flying fox Pteropus conspicillatus in Australia: Australian Zoologist, vol. 31, p. 38–49.
Hall, L., and Richards, G., 2000, Flying foxes: fruit and blossom bats of Australia: Malabar, Fla, Krieger Publishing Company, 135 p.
Hayes, J.P., 1999, Temporal variation in activity of bats and the design of echolocation-monitoring studies: Journal of Mammalogy, vol. 78, p. 514–524.
Hayes, J.P., 2000, Assumptions and practical considerations in the design and interpretation of echolocation-monitoring studies: Acta Chiropterologica, vol. 2, p. 225–236.
Horn, J.W., 1998, Individual variation in the nightly time budgets of the little brown bat, Myotis lucifugus, M.A. thesis: Boston University, Massachusetts, 64 p.
18 INFORMATION AND TECHNOLOGY REPORT–2003--0003
Hoying, K.M., and Kunz, T.H., 1998, Variation in the size at birth and post-natal growth in the insectivorous bat Pipistrellus subflavus (Chiroptera: Vespertilionidae): Journal of Zoology (London), vol. 245, p. 15–17.
Humphrey, S.R., 1971, Photographic estimation of population size of the Mexican free-tailed bat, Tadarida brasiliensis: American Midland Naturalist, vol. 86, p. 220–223.
Jones, G., and Rydell, J., 1998, Foraging strategy and predation risk as factors influencing emergence times in echolocating bats: Philosophical Transactions of the Royal Society of London, B, vol. 346, p. 445–455.
Jones, G., Vaughan, N., and Parsons, S., 2000, Acoustic identification of bats from directly sampled and time expanded recordings of vocalizations: Acta Chiropterologica, vol. 2, p. 155–170.
Kalcounis, M.C., and Hecker, K.R., 1996, Intraspecific variation in roost-site selection by little brown bats, in Barclay, R.M.R. and Brigham, R.M., eds., Bats and forests symposium, October 19–21, 1995, Victoria, British Columbia, Canada: Research Branch, British Columbia, Ministry of Forests, Working Paper, No. 23, p. 81– 90.
Kerth, G., and König, B., 1996, Transponders and an infrared-video camera as methods in a field study on the social behaviour of Bechstein’s bats (Myotis bechsteinii): Myotis, vol. 34, p. 27–34.
Kerth, G., and König, B., 1999, Fission, fusion, and nonrandom associations in female Bechstein’s bats (Myotis bechsteinii): Behaviour, vol. 136, p. 1187–1202.
Kunz, T.H., 1974, Feeding ecology of a temperate insectivorous bat (Myotis velifer): Ecology, vol. 55, p. 693– 711.
Kunz, T.H., and Anthony, E.L.P., 1996, Variation in the time of nightly emergence behavior in the little brown bat, Myotis lucifugus (Chiroptera: Vespertilionidae), in Genoways, H.H. and Baker, R.J., eds., Contributions in mammalogy: A memorial volume honoring Dr. J. Knox Jones, Jr.: Museum of Texas Tech University, p. 225– 235.
Kunz, T.H., and Kurta, A., 1988, Capture methods and holding devices, in Kunz, T.H., ed., Ecological and behavioral methods for the study of bats: Washington, D.C., Smithsonian Institution Press, p. 1–30.
Kunz, T.H., Richards, G.R., and Tidemann, C.R., 1996a, Capturing small volant mammals, in Wilson, D.E., Cole, F.R., Nichols, J.D., Rudran, R., and Foster, M.S., eds., Measuring and monitoring biological diversity: Standard methods for mammals, Washington, D.C., Smithsonian Institution Press, p. 157–164.
Kunz, T.H., Thomas, D.W., Richards, G.C., Tidemann, C.R., Pierson, E.D., and Racey, P.A., 1996b, Observational techniques, in Wilson, D.E., Cole, F.R., Nichols, J.D., Rudran, R., and Foster, M.S., eds., Measuring and
monitoring biological diversity: Standard methods for mammals: Washington, D.C., Smithsonian Institution Press, p. 105–114.
Kurta, A., King, D., Teramino, J.A., Stribley, J.M., and Williams, K.J., 1993, Summer roosts of the endangered Indiana bat (Myotis sodalis) on the northern edge of its range: American Midland Naturalist, vol. 129, p. 132–138.
Menzel, M.A., Carter, T.C., Chapman, B.R., and Laerm, J., 1998, Quantitative comparison of tree roosts used by red bats (Lasiurus borealis) and Seminole bats (L. seminolus): Canadian Journal of Zoology, vol. 76, p. 630–634.
Mitchell-Jones, A.J., ed., 1987, The bat worker’s manual: Nature Conservancy Council, Interpretative Services Branch, United Kingdom, 108 p.
O’Donnell, C.F.J., 2000, Cryptic populations in a temperate rainforest bat Chalinolobus tuberculatus in New Zealand: Animal Conservation, vol. 3, p. 287–297.
O’Donnell, C.F.J., and Sedgeley, J.A., 1999, Use of roosts by the long-tailed bat, Chalinolobus tuberculatus, in temperate rainforest in New Zealand: Journal of Mammalogy, vol. 80, p. 813–823.
O’Farrell, M.J., and Gannon, W.L., 1999, A comparison of acoustic versus capture techniques for the inventory of bats: Journal of Mammalogy, vol. 80, p. 24–30.
O’Farrell, M.J., Miller, B.W., and Gannon, W.L., 1999a, Qualitative identification of free-ranging bats using the Anabat detector: Journal of Mammalogy, vol. 80, p. 11–23.
O’Farrell, M.J., Corben, C., Gannon, W.L., and Miller, B.W., 1999b, Confronting the dogma: A reply: Journal of Mammalogy, vol. 80, p. 297–302.
Racey, P.A., 1979, Two bats in the Seychelles: Oryx, vol. 15, p. 148–152.
Richards, G.C., 1990, The spectacled flying-fox, Pteropus conspicillatus (Chiroptera: Peropodidae), in North Queensland 1, Roost sites and distribution patterns: Australian Mammalogy, vol. 13, p. 17–24.
Rydell, J., Entwistle, A., and Racey, P.A., 1996, Timing of foraging flights of three species of bats in relation to insect activity and predation risk: Oikos, vol. 76, p. 243–252.
Sabol, B.M., and Hudson, M.K., 1995, Technique using thermal infrared-imaging for estimating populations of gray bats: Journal of Mammalogy, vol. 76, p. 1242–1248.
Sasse, D.B., and Pekins, P.J., 1996, Summer roosting ecology of northern long-eared bats (Myotis septentrionalis) in the White Mountain National Forest, in Barclay, R.M.R. and Brigham, R.M., eds., Bats and forests symposium, October 19–21, 1995, Victoria, British Columbia, Canada: Research Branch, British Columbia, Ministry of Forests, Working Paper No. 23, p. 91–101.
Speakman, J.R., 1995, Chiropteran nocturnality: Symposium of the Zoological Society of London, vol. 67, p. 182–202.
Speakman, J.R., Bullock, D.J., Eales, L.A., and Racey, P.A., 1992, A problem defining temporal pattern in animal behaviour: Clustering in the emergence behaviour of bats from maternity roosts: Animal Behaviour, vol. 43, p. 491–500.
Thomas, D.W., and LaVal, R.K., 1988, Survey and census methods, in Kunz, T.H., ed., Ecological and behavioral methods for the study of bats: Washington, D.C., Smithsonian Institution Press, p. 77–89.
Thompson, W.L., White, G.C., and Gowan, C., 1998, Monitoring vertebrate populations: New York, Academic Press, 365 p.
Thomson, S.C., Brooke, A.P., and Speakman, J.R., 1998, Diurnal activity of the Samoan flying fox, Pteropus samoensis: Philosophical Transactions of the Royal Society of London, B, vol. 353, p. 1595–1606.
Tuttle, M.D., 1979, Status, causes of decline, and management of endangered gray bats: Journal of Wildlife Management, vol. 43, p. 1–17.
Tuttle, M.D., 2003, Estimating population sizes of hibernating bats in caves and mines, in O’Shea, T.J. and Bogan, M.A., eds., Monitoring trends in bat populations of the United States and territories: problems and prospects: U.S. Geological Survey, Information
KUNZ 19
and Technology Report, USGS/BRD/ITR--2003–0003, p. 31–39.
Vardon, M.J., and Tidemann, C.R., 1997, Black flying foxes Pteropus alecto: Are they different in north Australia?: Australian Mammalogy, vol. 20, p. 131–134.
Vardon, M.J., and Tidemann, C.R., 1999, Flying foxes (Pteropus alecto and P. scapulatus) in the Darwin region, north Australia: Patterns in camp size and structure: Australian Journal of Zoology, vol. 47, p. 411–423.
Vardon, M.J., Brocklehurst, P.S., Woinarski, J.C.Z., Cunningham, R.B., Donnelly, C.F., and Tidemann, C.R., 2001, Seasonal habitat use by flying foxes, Pteropus alecto and P. scapulatus (Megachiroptera) in monsoonal Australia: Journal of Zoology (London), vol. 253, p. 523–535.
Vonhof, M.J., 1996, Roost-site preferences of big brown bats (Eptesicus fuscus) and silver-haired bats (Lasionycteris noctivagans) in the Pend d’Oreille Valley in southern British Columbia, in Barclay, R.M.R. and Brigham, R.M., eds., Bats and forests symposium, October 19–21, 1995, Victoria, British Columbia, Canada: Research Branch, British Columbia Ministry of Forests, Working Paper No. 23, p. 62–80.
White, G.C., Anderson, D.R., Burnham, K.P., and Otis, D.L., 1982, Capture-recapture and removal methods for sampling closed populations: Los Alamos National Laboratory, New Mexico, 235 p.
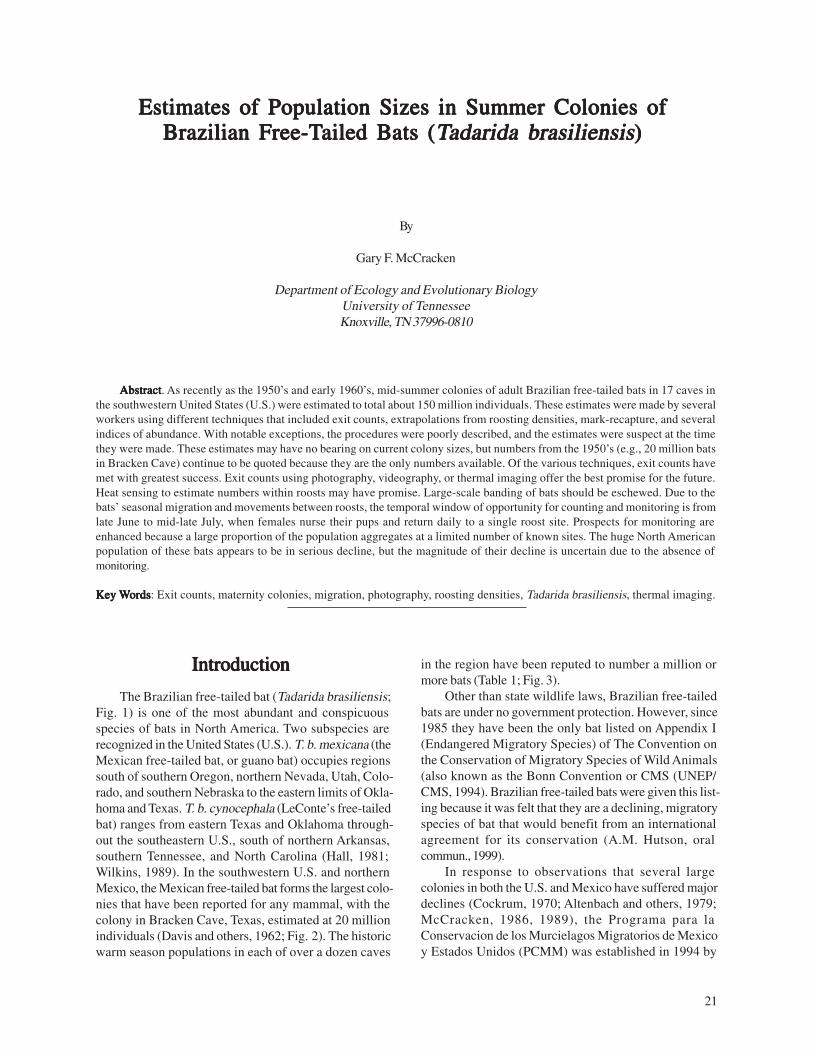
Estimates of Population Sizes in Summer Colonies ofEstimates of Population Sizes in Summer Colonies ofEstimates of Population Sizes in Summer Colonies ofEstimates of Population Sizes in Summer Colonies ofEstimates of Population Sizes in Summer Colonies of Brazilian Free-TBrazilian Free-TBrazilian Free-TBrazilian Free-TBrazilian Free-Tailed Bats (ailed Bats (ailed Bats (ailed Bats (ailed Bats (TTTTTadarida brasiliensisadarida brasiliensisadarida brasiliensisadarida brasiliensisadarida brasiliensis)))))
By
Gary F. McCracken
Department of Ecology and Evolutionary Biology University of Tennessee Knoxville, TN 37996-0810
Abstract. As recently as the 1950’s and early 1960’s, mid-summer colonies of adult Brazilian free-tailed bats in 17 caves in the southwestern United States (U.S.) were estimated to total about 150 million individuals. These estimates were made by several workers using different techniques that included exit counts, extrapolations from roosting densities, mark-recapture, and several indices of abundance. With notable exceptions, the procedures were poorly described, and the estimates were suspect at the time they were made. These estimates may have no bearing on current colony sizes, but numbers from the 1950’s (e.g., 20 million bats in Bracken Cave) continue to be quoted because they are the only numbers available. Of the various techniques, exit counts have met with greatest success. Exit counts using photography, videography, or thermal imaging offer the best promise for the future. Heat sensing to estimate numbers within roosts may have promise. Large-scale banding of bats should be eschewed. Due to the bats’ seasonal migration and movements between roosts, the temporal window of opportunity for counting and monitoring is from late June to mid-late July, when females nurse their pups and return daily to a single roost site. Prospects for monitoring are enhanced because a large proportion of the population aggregates at a limited number of known sites. The huge North American population of these bats appears to be in serious decline, but the magnitude of their decline is uncertain due to the absence of monitoring.
AbstractAbstractAbstractAbstract
KeyKeyKeyKeyKey WWWWWordsordsordsordsords: Exit counts, maternity colonies, migration, photography, roosting densities, Tadarida brasiliensis, thermal imaging.
IntroductionIntroductionIntroductionIntroductionIntroduction
The Brazilian free-tailed bat (Tadarida brasiliensis; Fig. 1) is one of the most abundant and conspicuous species of bats in North America. Two subspecies are recognized in the United States (U.S.). T. b. mexicana (the Mexican free-tailed bat, or guano bat) occupies regions south of southern Oregon, northern Nevada, Utah, Colorado, and southern Nebraska to the eastern limits of Oklahoma and Texas. T. b. cynocephala (LeConte’s free-tailed bat) ranges from eastern Texas and Oklahoma throughout the southeastern U.S., south of northern Arkansas, southern Tennessee, and North Carolina (Hall, 1981; Wilkins, 1989). In the southwestern U.S. and northern Mexico, the Mexican free-tailed bat forms the largest colonies that have been reported for any mammal, with the colony in Bracken Cave, Texas, estimated at 20 million individuals (Davis and others, 1962; Fig. 2). The historic warm season populations in each of over a dozen caves
in the region have been reputed to number a million or more bats (Table 1; Fig. 3).
Other than state wildlife laws, Brazilian free-tailed bats are under no government protection. However, since 1985 they have been the only bat listed on Appendix I (Endangered Migratory Species) of The Convention on the Conservation of Migratory Species of Wild Animals (also known as the Bonn Convention or CMS (UNEP/ CMS, 1994). Brazilian free-tailed bats were given this listing because it was felt that they are a declining, migratory species of bat that would benefit from an international agreement for its conservation (A.M. Hutson, oral commun., 1999).
In response to observations that several large colonies in both the U.S. and Mexico have suffered major declines (Cockrum, 1970; Altenbach and others, 1979; McCracken, 1986, 1989), the Programa para la Conservacion de los Murcielagos Migratorios de Mexico y Estados Unidos (PCMM) was established in 1994 by
21
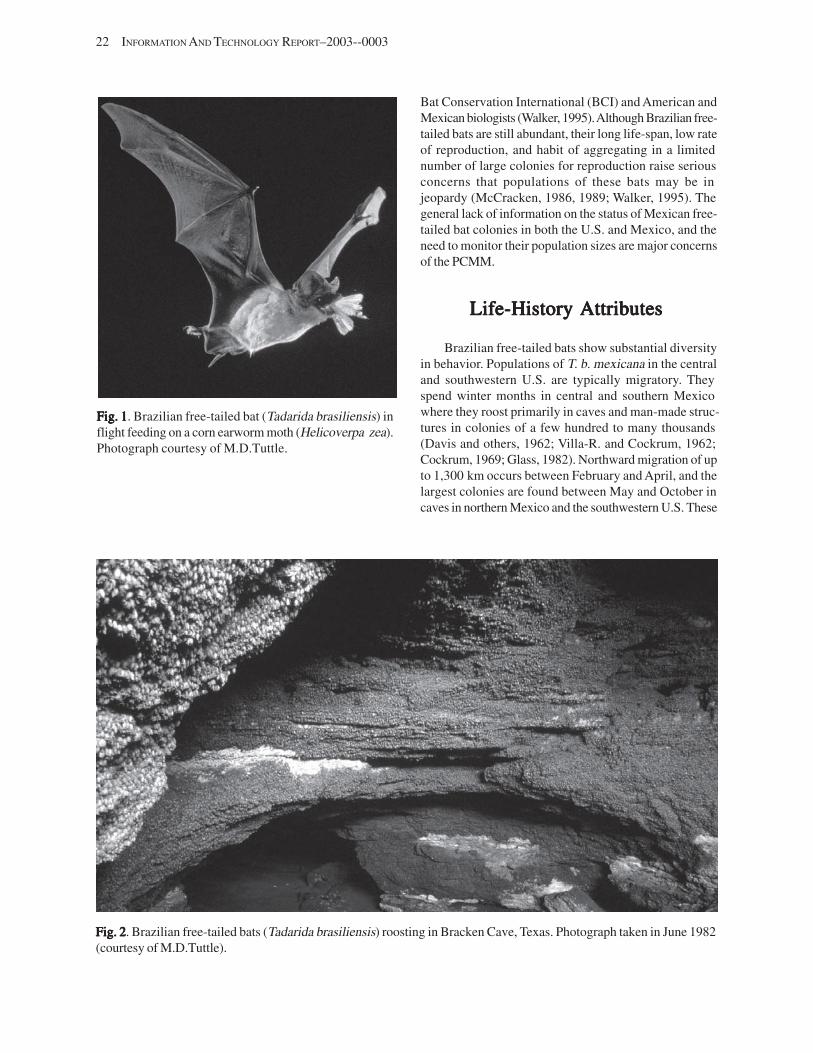
22 INFORMATION AND TECHNOLOGY REPORT–2003--0003
Fig. 1Fig. 1Fig. 1Fig. 1Fig. 1. Brazilian free-tailed bat (Tadarida brasiliensis) in flight feeding on a corn earworm moth (Helicoverpa zea). Photograph courtesy of M.D.Tuttle.
Bat Conservation International (BCI) and American and Mexican biologists (Walker, 1995).Although Brazilian free-tailed bats are still abundant, their long life-span, low rate of reproduction, and habit of aggregating in a limited number of large colonies for reproduction raise serious concerns that populations of these bats may be in jeopardy (McCracken, 1986, 1989; Walker, 1995). The general lack of information on the status of Mexican free-tailed bat colonies in both the U.S. and Mexico, and the need to monitor their population sizes are major concerns of the PCMM.
Life-HistoryLife-HistoryLife-HistoryLife-HistoryLife-History AttributesAttributesAttributesAttributesAttributes
Brazilian free-tailed bats show substantial diversity in behavior. Populations of T. b. mexicana in the central and southwestern U.S. are typically migratory. They spend winter months in central and southern Mexico where they roost primarily in caves and man-made structures in colonies of a few hundred to many thousands (Davis and others, 1962; Villa-R. and Cockrum, 1962; Cockrum, 1969; Glass, 1982). Northward migration of up to 1,300 km occurs between February and April, and the largest colonies are found between May and October in caves in northern Mexico and the southwestern U.S. These
Fig. 2Fig. 2Fig. 2Fig. 2Fig. 2. Brazilian free-tailed bats (Tadarida brasiliensis) roosting in Bracken Cave, Texas. Photograph taken in June 1982 (courtesy of M.D.Tuttle).
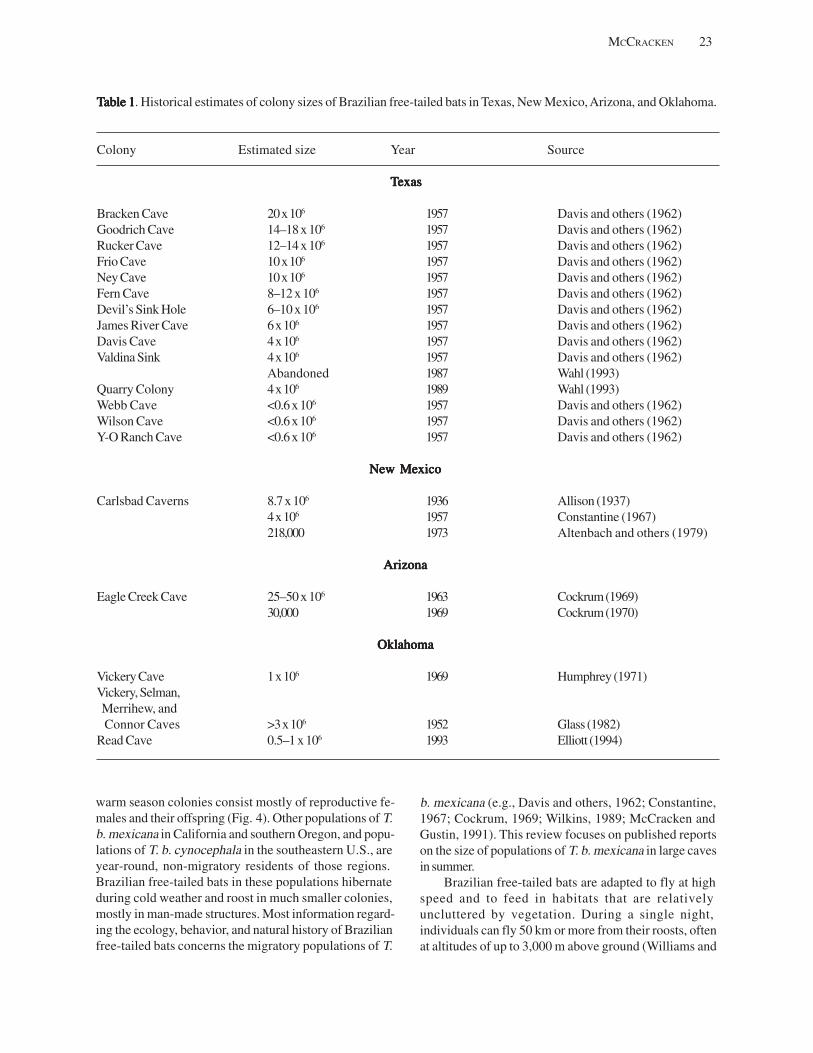
MCCRACKEN 23
able 1. Historical estimates of colony sizes of Brazilian free-tailed bats in Texas, New Mexico, Arizona, and Oklahoma.TTTTTable 1able 1able 1able 1
Colony Estimated size Year Source
TTTTTexasexasexasexasexas
Bracken Cave 20x106 1957 Davis and others (1962) Goodrich Cave 14–18 x 106 1957 Davis and others (1962) Rucker Cave 12–14 x 106 1957 Davis and others (1962) Frio Cave 10x 106 1957 Davis and others (1962) Ney Cave 10 x106 1957 Davis and others (1962) Fern Cave 8–12 x 106 1957 Davis and others (1962) Devil’s Sink Hole 6–10 x 106 1957 Davis and others (1962) James River Cave 6x10⁶ 1957 Davis and others (1962) Davis Cave 4x10⁶ 1957 Davis and others (1962) Valdina Sink 4 x10⁶ 1957 Davis and others (1962)
Abandoned 1987 Wahl (1993) Quarry Colony 4x 10⁶ 1989 Wahl (1993) Webb Cave <0.6 x 10⁶ 1957 Davis and others (1962) Wilson Cave <0.6 x 10⁶ 1957 Davis and others (1962) Y-O Ranch Cave <0.6 x 10⁶ 1957 Davis and others (1962)
New MexicoNew MexicoNew MexicoNew MexicoNew Mexico
Carlsbad Caverns 8.7 x 10⁶ 1936 Allison (1937) 4 x 10⁶ 1957 Constantine (1967) 218,000 1973 Altenbach and others (1979)
ArizonaArizonaArizonaArizonaArizona
Eagle Creek Cave 25–50 x 106 1963 Cockrum (1969) 30,000 1969 Cockrum (1970)
OklahomaOklahomaOklahomaOklahomaOklahoma
Vickery Cave 1 x 10⁶ 1969 Humphrey (1971) Vickery, Selman, Merrihew, and Connor Caves >3x10⁶ 1952 Glass (1982)
Read Cave 0.5–1 x 10⁶ 1993 Elliott (1994)
warm season colonies consist mostly of reproductive females and their offspring (Fig. 4). Other populations of T. b. mexicana in California and southern Oregon, and populations of T. b. cynocephala in the southeastern U.S., are year-round, non-migratory residents of those regions. Brazilian free-tailed bats in these populations hibernate during cold weather and roost in much smaller colonies, mostly in man-made structures. Most information regarding the ecology, behavior, and natural history of Brazilian free-tailed bats concerns the migratory populations of T.
b. mexicana (e.g., Davis and others, 1962; Constantine, 1967; Cockrum, 1969; Wilkins, 1989; McCracken and Gustin, 1991). This review focuses on published reports on the size of populations of T. b. mexicana in large caves in summer.
Brazilian free-tailed bats are adapted to fly at high speed and to feed in habitats that are relatively uncluttered by vegetation. During a single night, individuals can fly 50 km or more from their roosts, often at altitudes of up to 3,000 m above ground (Williams and
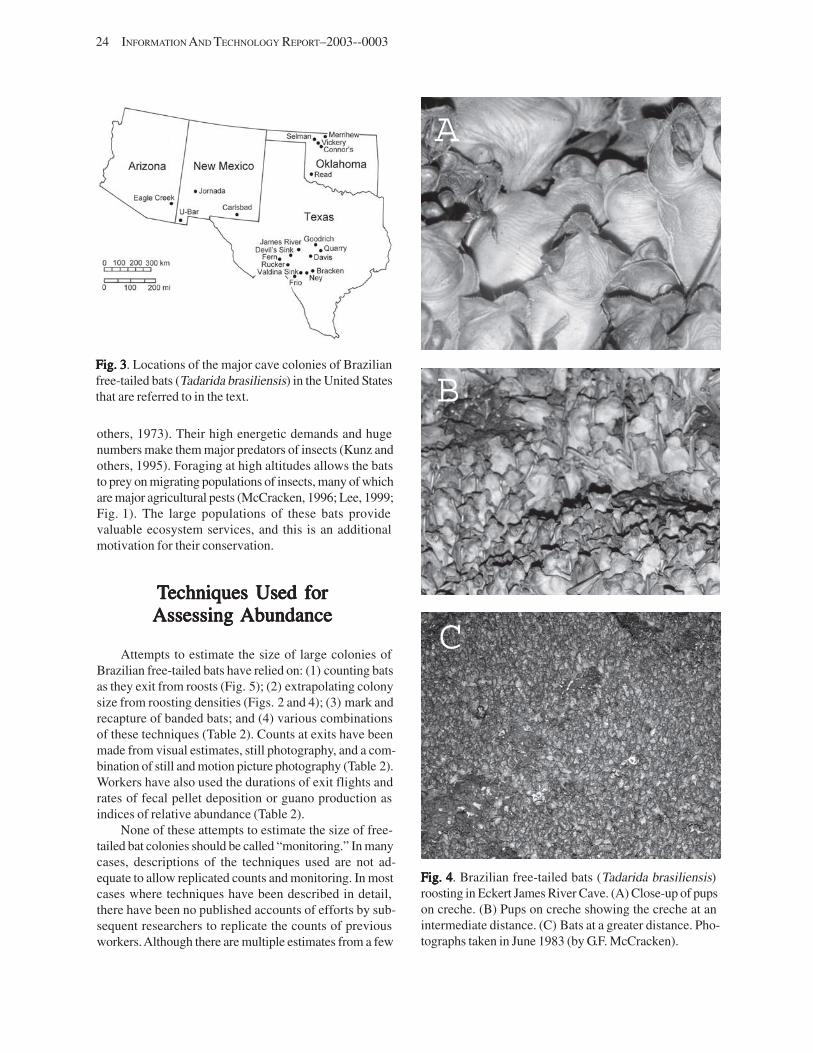
B
24 INFORMATION AND TECHNOLOGY REPORT–2003--0003
Fig. 3Fig. 3Fig. 3Fig. 3Fig. 3. Locations of the major cave colonies of Brazilian free-tailed bats (Tadarida brasiliensis) in the United States that are referred to in the text.
others, 1973). Their high energetic demands and huge numbers make them major predators of insects (Kunz and others, 1995). Foraging at high altitudes allows the bats to prey on migrating populations of insects, many of which are major agricultural pests (McCracken, 1996; Lee, 1999; Fig. 1). The large populations of these bats provide valuable ecosystem services, and this is an additional motivation for their conservation.
TTTTTechniques Used forechniques Used forechniques Used forechniques Used forechniques Used for AssessingAssessingAssessingAssessingAssessing AbundanceAbundanceAbundanceAbundanceAbundance
Attempts to estimate the size of large colonies of Brazilian free-tailed bats have relied on: (1) counting bats as they exit from roosts (Fig. 5); (2) extrapolating colony size from roosting densities (Figs. 2 and 4); (3) mark and recapture of banded bats; and (4) various combinations of these techniques (Table 2). Counts at exits have been made from visual estimates, still photography, and a combination of still and motion picture photography (Table 2). Workers have also used the durations of exit flights and rates of fecal pellet deposition or guano production as indices of relative abundance (Table 2).
None of these attempts to estimate the size of free-tailed bat colonies should be called “monitoring.” In many cases, descriptions of the techniques used are not adequate to allow replicated counts and monitoring. In most cases where techniques have been described in detail, there have been no published accounts of efforts by subsequent researchers to replicate the counts of previous workers. Although there are multiple estimates from a few
A
B
C
Fig. 4Fig. 4Fig. 4Fig. 4Fig. 4. Brazilian free-tailed bats (Tadarida brasiliensis) roosting in Eckert James River Cave. (A) Close-up of pups on creche. (B) Pups on creche showing the creche at an intermediate distance. (C) Bats at a greater distance. Photographs taken in June 1983 (by G.F. McCracken).
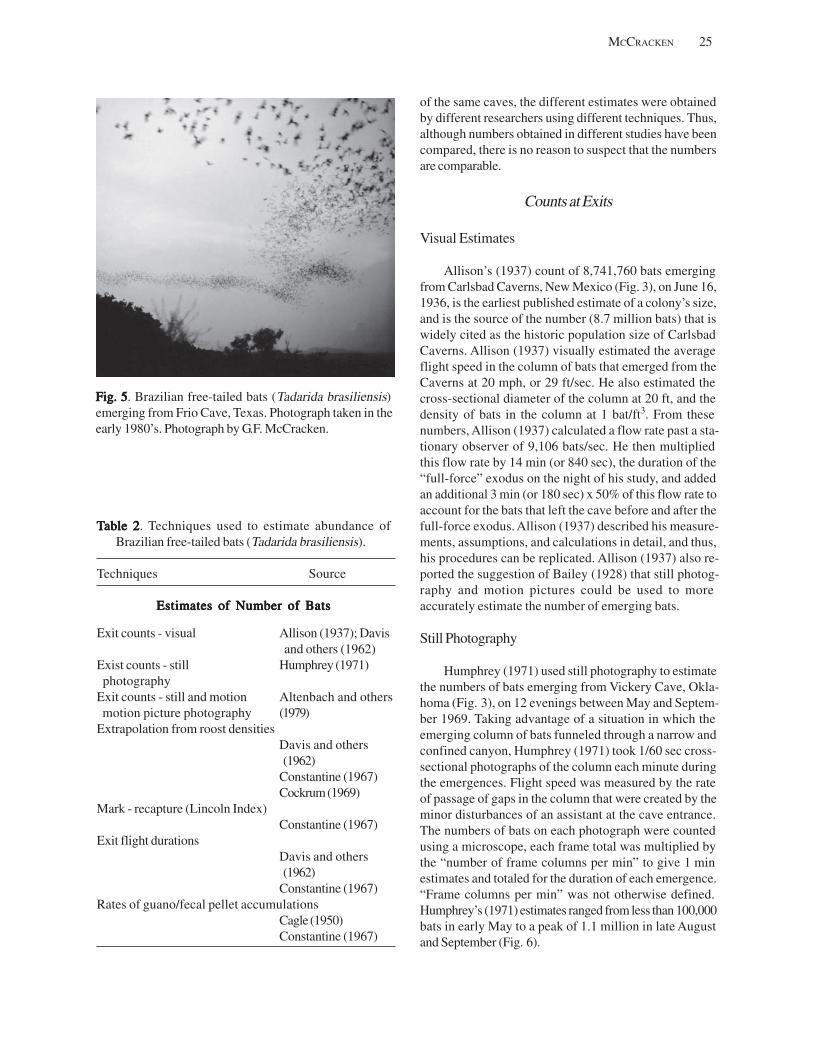
Fig. 5Fig. 5Fig. 5Fig. 5Fig. 5. Brazilian free-tailed bats (Tadarida brasiliensis) emerging from Frio Cave, Texas. Photograph taken in the early 1980’s. Photograph by G.F. McCracken.
TTTTTable 2able 2able 2able 2able 2. Techniques used to estimate abundance of Brazilian free-tailed bats (Tadarida brasiliensis).
Techniques Source
Estimates of Number of BatsEstimates of Number of BatsEstimates of Number of BatsEstimates of Number of BatsEstimates of Number of Bats
Exit counts - visual Allison (1937); Davis and others (1962)
Exist counts - still Humphrey (1971) photography Exit counts - still and motion Altenbach and others motion picture photography (1979)
Extrapolation from roost densities Davis and others (1962) Constantine (1967) Cockrum (1969)
Mark - recapture (Lincoln Index) Constantine (1967)
Exit flight durations Davis and others (1962) Constantine (1967)
Rates of guano/fecal pellet accumulations Cagle (1950) Constantine (1967)
MCCRACKEN 25
of the same caves, the different estimates were obtained by different researchers using different techniques. Thus, although numbers obtained in different studies have been compared, there is no reason to suspect that the numbers are comparable.
Counts at Exits
Visual Estimates
Allison’s (1937) count of 8,741,760 bats emerging from Carlsbad Caverns, New Mexico (Fig. 3), on June 16, 1936, is the earliest published estimate of a colony’s size, and is the source of the number (8.7 million bats) that is widely cited as the historic population size of Carlsbad Caverns. Allison (1937) visually estimated the average flight speed in the column of bats that emerged from the Caverns at 20 mph, or 29 ft/sec. He also estimated the cross-sectional diameter of the column at 20 ft, and the density of bats in the column at 1 bat/ft3. From these numbers, Allison (1937) calculated a flow rate past a stationary observer of 9,106 bats/sec. He then multiplied this flow rate by 14 min (or 840 sec), the duration of the “full-force” exodus on the night of his study, and added an additional 3 min (or 180 sec) x 50% of this flow rate to account for the bats that left the cave before and after the full-force exodus. Allison (1937) described his measurements, assumptions, and calculations in detail, and thus, his procedures can be replicated. Allison (1937) also reported the suggestion of Bailey (1928) that still photography and motion pictures could be used to more accurately estimate the number of emerging bats.
Still Photography
Humphrey (1971) used still photography to estimate the numbers of bats emerging from Vickery Cave, Oklahoma (Fig. 3), on 12 evenings between May and September 1969. Taking advantage of a situation in which the emerging column of bats funneled through a narrow and confined canyon, Humphrey (1971) took 1/60 sec cross-sectional photographs of the column each minute during the emergences. Flight speed was measured by the rate of passage of gaps in the column that were created by the minor disturbances of an assistant at the cave entrance. The numbers of bats on each photograph were counted using a microscope, each frame total was multiplied by the “number of frame columns per min” to give 1 min estimates and totaled for the duration of each emergence. “Frame columns per min” was not otherwise defined. Humphrey’s (1971) estimates ranged from less than 100,000 bats in early May to a peak of 1.1 million in late August and September (Fig. 6).
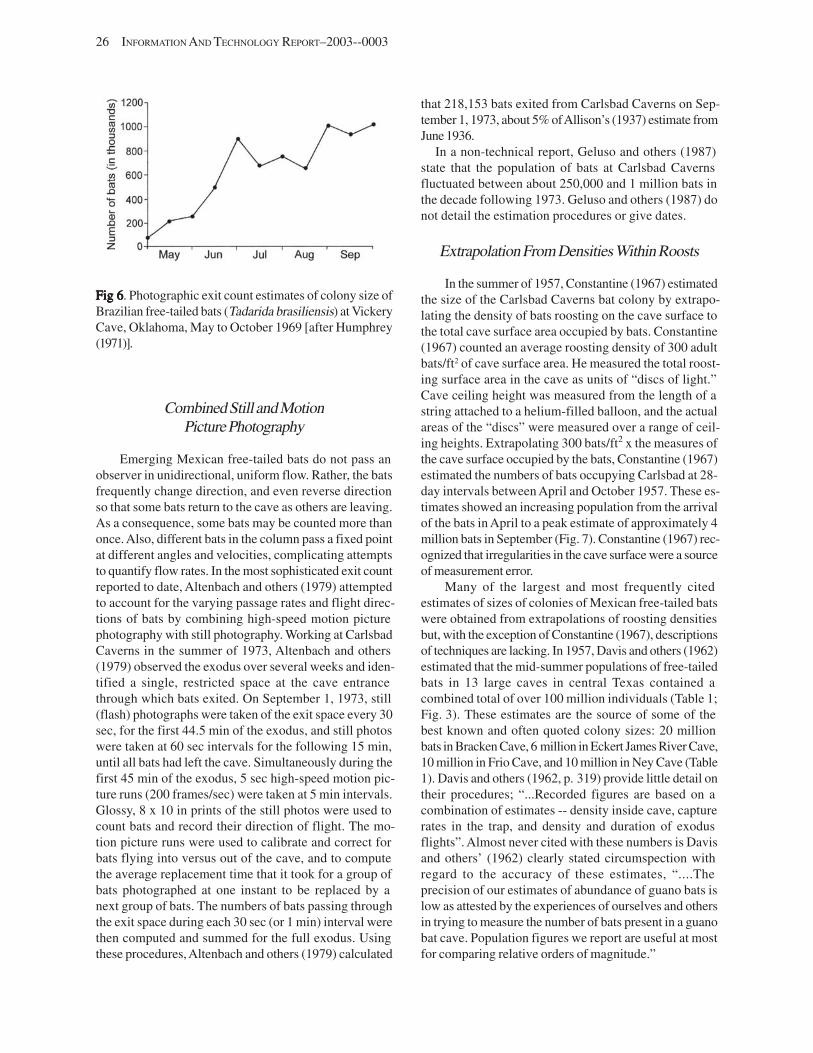
26 INFORMATION AND TECHNOLOGY REPORT–2003--0003
Fig 6Fig 6Fig 6Fig 6Fig 6. Photographic exit count estimates of colony size of Brazilian free-tailed bats (Tadarida brasiliensis) at Vickery Cave, Oklahoma, May to October 1969 [after Humphrey (1971)].
Combined Still and Motion Picture Photography
Emerging Mexican free-tailed bats do not pass an observer in unidirectional, uniform flow. Rather, the bats frequently change direction, and even reverse direction so that some bats return to the cave as others are leaving. As a consequence, some bats may be counted more than once. Also, different bats in the column pass a fixed point at different angles and velocities, complicating attempts to quantify flow rates. In the most sophisticated exit count reported to date, Altenbach and others (1979) attempted to account for the varying passage rates and flight directions of bats by combining high-speed motion picture photography with still photography. Working at Carlsbad Caverns in the summer of 1973, Altenbach and others (1979) observed the exodus over several weeks and identified a single, restricted space at the cave entrance through which bats exited. On September 1, 1973, still (flash) photographs were taken of the exit space every 30 sec, for the first 44.5 min of the exodus, and still photos were taken at 60 sec intervals for the following 15 min, until all bats had left the cave. Simultaneously during the first 45 min of the exodus, 5 sec high-speed motion picture runs (200 frames/sec) were taken at 5 min intervals. Glossy, 8 x 10 in prints of the still photos were used to count bats and record their direction of flight. The motion picture runs were used to calibrate and correct for bats flying into versus out of the cave, and to compute the average replacement time that it took for a group of bats photographed at one instant to be replaced by a next group of bats. The numbers of bats passing through the exit space during each 30 sec (or 1 min) interval were then computed and summed for the full exodus. Using these procedures, Altenbach and others (1979) calculated
that 218,153 bats exited from Carlsbad Caverns on September 1, 1973, about 5% of Allison’s (1937) estimate from June 1936.
In a non-technical report, Geluso and others (1987) state that the population of bats at Carlsbad Caverns fluctuated between about 250,000 and 1 million bats in the decade following 1973. Geluso and others (1987) do not detail the estimation procedures or give dates.
Extrapolation From Densities Within Roosts
In the summer of 1957, Constantine (1967) estimated the size of the Carlsbad Caverns bat colony by extrapolating the density of bats roosting on the cave surface to the total cave surface area occupied by bats. Constantine (1967) counted an average roosting density of 300 adult bats/ft2 of cave surface area. He measured the total roosting surface area in the cave as units of “discs of light.” Cave ceiling height was measured from the length of a string attached to a helium-filled balloon, and the actual areas of the “discs” were measured over a range of ceiling heights. Extrapolating 300 bats/ft2 x the measures of the cave surface occupied by the bats, Constantine (1967) estimated the numbers of bats occupying Carlsbad at 28-day intervals between April and October 1957. These estimates showed an increasing population from the arrival of the bats in April to a peak estimate of approximately 4 million bats in September (Fig. 7). Constantine (1967) recognized that irregularities in the cave surface were a source of measurement error.
Many of the largest and most frequently cited estimates of sizes of colonies of Mexican free-tailed bats were obtained from extrapolations of roosting densities but, with the exception of Constantine (1967), descriptions of techniques are lacking. In 1957, Davis and others (1962) estimated that the mid-summer populations of free-tailed bats in 13 large caves in central Texas contained a combined total of over 100 million individuals (Table 1; Fig. 3). These estimates are the source of some of the best known and often quoted colony sizes: 20 million bats in Bracken Cave, 6 million in Eckert James River Cave, 10 million in Frio Cave, and 10 million in Ney Cave (Table 1). Davis and others (1962, p. 319) provide little detail on their procedures; “...Recorded figures are based on a combination of estimates -- density inside cave, capture rates in the trap, and density and duration of exodus flights”. Almost never cited with these numbers is Davis and others’ (1962) clearly stated circumspection with regard to the accuracy of these estimates, “....The precision of our estimates of abundance of guano bats is low as attested by the experiences of ourselves and others in trying to measure the number of bats present in a guano bat cave. Population figures we report are useful at most for comparing relative orders of magnitude.”
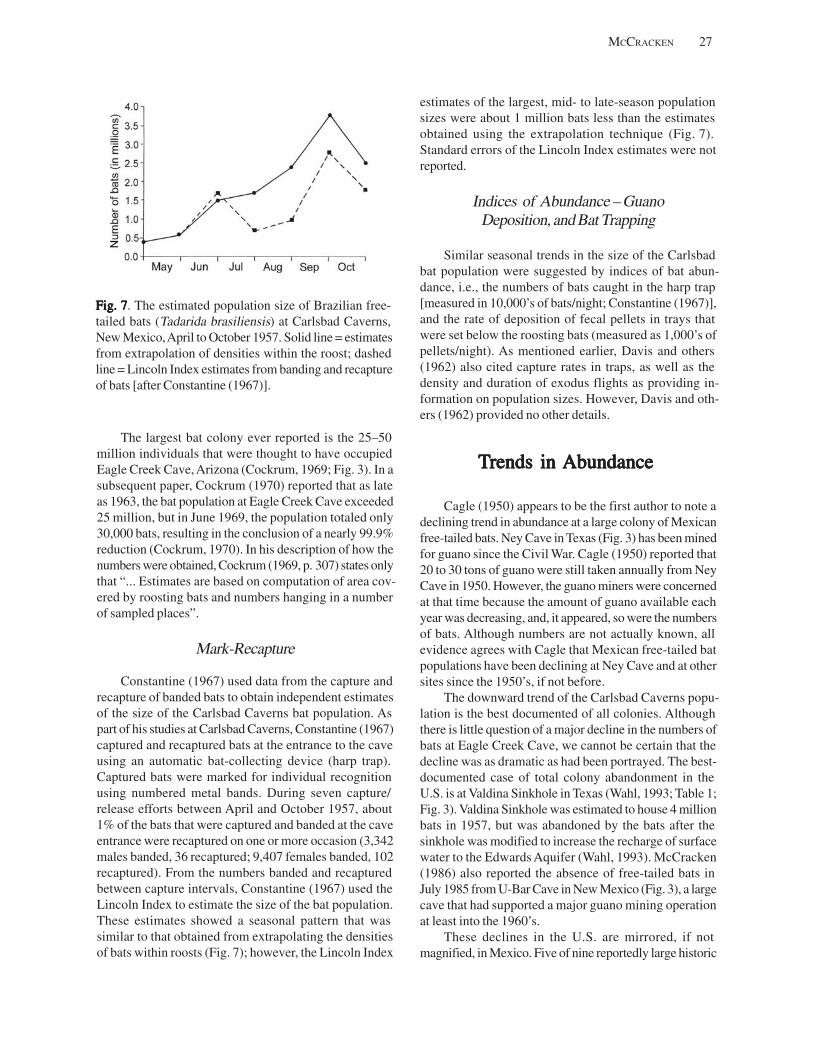
Fig. 7Fig. 7Fig. 7Fig. 7Fig. 7. The estimated population size of Brazilian free-tailed bats (Tadarida brasiliensis) at Carlsbad Caverns, New Mexico, April to October 1957. Solid line = estimates from extrapolation of densities within the roost; dashed line = Lincoln Index estimates from banding and recapture of bats [after Constantine (1967)].
The largest bat colony ever reported is the 25–50 million individuals that were thought to have occupied Eagle Creek Cave, Arizona (Cockrum, 1969; Fig. 3). In a subsequent paper, Cockrum (1970) reported that as late as 1963, the bat population at Eagle Creek Cave exceeded 25 million, but in June 1969, the population totaled only 30,000 bats, resulting in the conclusion of a nearly 99.9% reduction (Cockrum, 1970). In his description of how the numbers were obtained, Cockrum (1969, p. 307) states only that “... Estimates are based on computation of area covered by roosting bats and numbers hanging in a number of sampled places”.
Mark-Recapture
Constantine (1967) used data from the capture and recapture of banded bats to obtain independent estimates of the size of the Carlsbad Caverns bat population. As part of his studies at Carlsbad Caverns, Constantine (1967) captured and recaptured bats at the entrance to the cave using an automatic bat-collecting device (harp trap). Captured bats were marked for individual recognition using numbered metal bands. During seven capture/ release efforts between April and October 1957, about 1% of the bats that were captured and banded at the cave entrance were recaptured on one or more occasion (3,342 males banded, 36 recaptured; 9,407 females banded, 102 recaptured). From the numbers banded and recaptured between capture intervals, Constantine (1967) used the Lincoln Index to estimate the size of the bat population. These estimates showed a seasonal pattern that was similar to that obtained from extrapolating the densities of bats within roosts (Fig. 7); however, the Lincoln Index
MCCRACKEN 27
estimates of the largest, mid- to late-season population sizes were about 1 million bats less than the estimates obtained using the extrapolation technique (Fig. 7). Standard errors of the Lincoln Index estimates were not reported.
Indices of Abundance – Guano Deposition, and Bat Trapping
Similar seasonal trends in the size of the Carlsbad bat population were suggested by indices of bat abundance, i.e., the numbers of bats caught in the harp trap [measured in 10,000’s of bats/night; Constantine (1967)], and the rate of deposition of fecal pellets in trays that were set below the roosting bats (measured as 1,000’s of pellets/night). As mentioned earlier, Davis and others (1962) also cited capture rates in traps, as well as the density and duration of exodus flights as providing information on population sizes. However, Davis and others (1962) provided no other details.
TTTTTrends inrends inrends inrends inrends in AbundanceAbundanceAbundanceAbundanceAbundance
Cagle (1950) appears to be the first author to note a declining trend in abundance at a large colony of Mexican free-tailed bats. Ney Cave in Texas (Fig. 3) has been mined for guano since the Civil War. Cagle (1950) reported that 20 to 30 tons of guano were still taken annually from Ney Cave in 1950. However, the guano miners were concerned at that time because the amount of guano available each year was decreasing, and, it appeared, so were the numbers of bats. Although numbers are not actually known, all evidence agrees with Cagle that Mexican free-tailed bat populations have been declining at Ney Cave and at other sites since the 1950’s, if not before.
The downward trend of the Carlsbad Caverns population is the best documented of all colonies. Although there is little question of a major decline in the numbers of bats at Eagle Creek Cave, we cannot be certain that the decline was as dramatic as had been portrayed. The best-documented case of total colony abandonment in the U.S. is at Valdina Sinkhole in Texas (Wahl, 1993; Table 1; Fig. 3). Valdina Sinkhole was estimated to house 4 million bats in 1957, but was abandoned by the bats after the sinkhole was modified to increase the recharge of surface water to the Edwards Aquifer (Wahl, 1993). McCracken (1986) also reported the absence of free-tailed bats in July 1985 from U-Bar Cave in New Mexico (Fig. 3), a large cave that had supported a major guano mining operation at least into the 1960’s.
These declines in the U.S. are mirrored, if not magnified, in Mexico. Five of nine reportedly large historic
28 INFORMATION AND TECHNOLOGY REPORT–2003--0003
roost sites in Mexico that were surveyed in January and February 1985 contained no bats. These colonies appeared to have been abandoned because of disturbance caused by cave commercialization, quarrying, and vandalism (McCracken, 1986). In 1991, a subsequent survey of 10 major historic roost sites in Mexico (including 4 of the roosts surveyed in 1985) revealed that two roosts had been abandoned and populations at six other roosts had declined (Walker, 1995; A. Moreno, oral commun., 1999). One of the abandoned sites had contained a large population of free-tailed bats only 6 years earlier (McCracken, 1986), and showed obvious signs of recent vandalism (A. Moreno, oral commun., 1999). Although we lack any accurate estimate of the numbers of bats that have been lost from these roosts, the outcome of the declining trend is established for several roosts. Zero is an easy number to approximate.
The decline of several colonies is documented, but it is not documented whether, and to what degree, these declines translate into an overall decline of the population of Mexican free-tailed bats in North America. The population size estimates from the 1950’s were largely suspect at the time they were made. Even if accurate estimates of current colony sizes were available for comparison, most of the older estimates did not provide the baseline to assess overall trends in abundance. Not knowing, we may fail to respond to the possibility that Carlsbad Caverns and Eagle Creek Cave are more the norm than the exception.
Challenges and ProspectsChallenges and ProspectsChallenges and ProspectsChallenges and ProspectsChallenges and Prospects for the Futurefor the Futurefor the Futurefor the Futurefor the Future
Our first challenge is to obtain accurate, baseline counts of the numbers of Mexican free-tailed bats in the large colonies. This is essential to our second challenge, which is to establish a long-term program to monitor changes in the size of the North American population.
Our prospects for the future are improved if we learn from the past, and a primary lesson from the past is the need to carefully document the procedures and assumptions in any counting effort. There are at least two reasons why this is essential. The first is so that replication and monitoring are possible. Although the counts of Allison (1937), Constantine (1967), Humphrey (1971), and Altenbach and others (1979) may be inaccurate, the techniques, measurements, and assumptions are described, and the counts could be replicated. In contrast, replication of the counts of Davis and others (1962) and Cockrum (1969) are impossible. The second reason is to allow for improvements on past
techniques. Allison’s (1937), Humphrey’s (1971), and Altenbach and others (1979) techniques have not been replicated, but each subsequent effort was obviously built in part upon the previous efforts.
Challenges and Prospects for Counting
Both published efforts that used photography to count bats as they exited from a roost met with some success, and it is obvious that the potential of photography or videography has not been fully explored. Counts at exits using photography, videography, or more advanced imaging techniques appear to offer the best opportunity for accurately estimating the size of large colonies. In 1995, infrared (IR) video techniques that had been successful in counting exits of colonies of gray bats (Myotis grisescens) that numbered in the 1,000’s (Sabol and Hudson, 1995) were unsuccessful when applied to the much larger colonies of Mexican free-tailed bats at the Bracken and Eckert-James River Cave colonies (Bruce Sabol, oral commun., 1999). Currently, a new generation of high resolution IR videography is being tested to obtain counts of the numbers of individuals at the Bracken, Eckert James River, and Davis Cave colonies (T.H. Kunz, oral commun., 1999). Estimation of colony sizes using the new generation of IR videography may ultimately allow calibration and monitoring of colony sizes using the U.S. Weather Service’s NEXRAD WRS 88 Doppler radar facilities (T.H. Kunz, oral commun., 1999). The possible use of NEXRAD as a monitoring tool is exciting because information is collected daily as part of the NEXRAD’s normal operations.
Other approaches appear to offer less promise. Counts based on extrapolation of roosting densities suffer from variable densities of roosting bats and irregularities in the cave roosting surfaces. The disturbance caused by observers who must go into roosts is an added problem. The use of heat sensing technology to calibrate numbers of bats on the cave surface might circumvent these problems, but to my knowledge these techniques have not been explored. Counts based on extrapolation of the density of pups in creches and the size of creches has not been reported (Fig. 4). Such counts of pups in creches may be useful for monitoring population trends.
The use of conventional bat banding is a routine technique to monitor populations using mark-recapture estimators. Because of their rapid flight, injuries due to bands are likely in Mexican free-tailed bats. It is difficult to imagine any justification for large-scale banding efforts involving these bats. In the 1950’s and 1960’s a combined total of more than 430,000 Mexican free-tailed bats were banded at roosts in Texas, Oklahoma, New Mexico,
Arizona, and Mexico. Researchers working over several years at these locations recaptured only about 1,300 banded bats (McCracken and others, 1994). These banding efforts of the past would be difficult to duplicate or improve upon, and given the likely injury to large numbers of bats, there should be no attempts to do so. However, the ability to obtain reliable and accurate estimates of aspects of animal population dynamics using a new generation of mark-recapture statistical theory has advanced tremendously since Constantine’s (1967) use of the simple Lincoln Index. Development of non-harmful methods of marking bats could have promise for taking advantage of such advances. Simulations of sample size requirements are needed to determine if the level of effort necessary to mark a sufficient number of individuals is feasible for these large colonies of Brazilian free-tailed bats.
Indices of abundance, such as rates of guano deposition (Cagle, 1950; Constantine, 1967) and the duration of exit flights from roosts (Davis and others, 1962) have the advantages of being non-invasive to the bats, simple, inexpensive, and repeatable. Indices could have value in monitoring population trends but do not inform us on numbers and are not a substitute for counts (see Working Group reports, this volume). Thus, indices are a poor substitute and last resort to be used only if counting is impossible. Because it should be possible to accurately estimate the numbers of Mexican free-tailed bats in colonies, efforts should be directed toward obtaining actual counts.
In a recent effort, Bat Conservation International has established a program to monitor numbers of bats at fixed photopoints within key roosts (B. Keeley, oral commun., 1999) as an index to track population trends. Photos taken annually at fixed points at about the same time of the year might provide an index of the relative numbers of bats within a roost. However, because of the extreme mobility of these migratory bats, the day-to-day variation in colony size can be enormous as large numbers of bats arrive, mingle in the roost, and depart. Because of these movements, S. Altenbach (oral commun., 1999) has noted up to 5-fold, day-to-day increases and decreases in the sizes of the Brazilian free-tailed bat colonies in Carlsbad Caverns and Jornada Cave in New Mexico (Fig. 3).
Challenges and Prospects for Monitoring
Because Mexican free-tailed bats in the U.S. are migratory and seasonal in abundance, there are spatial and temporal components to their population dynamics that complicate monitoring efforts. Colony sizes fluctuate over the spring, summer, and autumn (Figs. 6 and 7) as bats
MCCRACKEN 29
arrive, give birth, depart, and move among roosts. The temporal window of opportunity for estimating and monitoring the size of the large maternity colonies occurs during the approximately 6-week period between parturition and weaning, when females return to the roost for the daily care of their pups (McCracken and Gustin, 1991). In Texas, over 90% of all females give birth during the first two weeks in June, pups begin to wean and fly in late July and early August, and females do not move between roosts at this time. Therefore, the window of opportunity for colony size estimates that can be compared from year to year is between late June and mid to late July.
Apart from their seasonal movements, the banding studies of the 1950’s and 1960’s show that individuals can roost at different sites in different years (Cockrum, 1969; Constantine, 1967; Glass, 1982). These movements, as well as studies of their population genetic structure (McCracken and others, 1994; McCracken and Gassel, 1997), suggest that colonies from throughout North America belong to the same large population. Thus, from a monitoring perspective, estimating the size of a single colony may tell us little about the status of the total population. If the bats are less abundant or absent at one site, is it because the population has declined, or is it because those bats are someplace else?
The issue of “what is a colony?” pertains to most, and perhaps all, species of bats. However, the situation with Mexican free-tailed bats is probably simpler than the situation with most other species of bats because a large proportion of their population is found at a very limited number of sites. Assuming that we know the locations of the major roost sites (Table 1), the status of the warm season colonies of Mexican free-tailed bats in the U.S. could be monitored by estimating colony sizes at only about a dozen major roost sites each year between late June and mid to late July. Given that adults typically survive 8 to 10 years, placing these 12 major roosts on a 2 or 3 year rotation for counting might be adequate.
References CitedReferences CitedReferences CitedReferences CitedReferences Cited
Allison, V.C., 1937, Evening bat flight from Carlsbad Caverns: Journal of Mammalogy, vol. 18, p. 80–82.
Altenbach, J.S., Geluso, K.N., and Wilson, D.E., 1979, Population size of Tadarida brasiliensis at Carlsbad Caverns in 1973, in Genoways, H.H. and Baker, R.J., eds.: Biological investigations in the Guadalupe Mountains National Park, Texas, National Park Service Proceedings and Transactions, Series Number 4, p. 341–348.
Bailey, V., 1928,Animal life of the Carlsbad Caverns:American Society of Mammalogists, Monograph No. 3, 195 p.
30 INFORMATION AND TECHNOLOGY REPORT–2003--0003
Cagle, F.R., 1950, A Texas colony of bats, Tadarida mexicana: Journal of Mammalogy, vol. 31, p. 400–402.
Cockrum, E.L., 1969, Migration in the guano bat Tadarida brasiliensis: University of Kansas Museum of Natural History, Miscellaneous Publication, vol. 51, p. 303–336.
Cockrum, E.L., 1970, Insecticides and guano bats: Ecology, vol. 51, p. 761–762.
Constantine, D.G., 1967, Activity patterns of the Mexican free-tailed bat: University of New Mexico Publications in Biology, vol. 7, p. 1–79.
Davis, R.B., Herreid, II, C.F., and Short, H.L., 1962, Mexican free-tailed bats in Texas: Ecological Monographs, vol. 32, p. 311–346.
Elliott, W.R., 1994, Conservation of western Oklahoma bat caves: Oklahoma Underground, vol. 17, p. 44–53.
Geluso, K.N., Altenbach, J.S., and Kerbo, R.C., 1987, Bats of Carlsbad Caverns National Park: Carlsbad Caverns Natural History Association, Carlsbad, NM, 33 p.
Glass, B.P., 1982, Seasonal movements of Mexican free- tailed bats Tadarida brasiliensis mexicana banded in the Great Plains: Southwestern Naturalist, vol. 27, p. 127–133.
Hall, E.R., 1981, The Mammals of North America, (2nd ed.): New York, John Wiley & Sons, vol. 1, p. 1– 600 + 90.
Humphrey, S.R., 1971, Photographic estimation of population size of the Mexican free-tailed bat, Tadarida brasiliensis: American Midland Naturalist, vol. 86, p. 220–223.
Kunz, T.H., Whitaker, J.O., Jr., and Wadanoli, M.D., 1995. Dietary energetics of the insectivorous Mexican free-tailed bat (Tadarida brasiliensis) during pregnancy and lactation: Oecologia, 101, p. 407–415.
Lee, Y.F., 1999, Resource use and foraging activity of Mexican free-tailed bats, Tadarida brasiliensis mexicana (Molossidae): University of Tennessee, Ph.D. dissertation, 130 p.
McCracken, G.F., 1986, Why are we losing our Mexican free-tailed bats? Bats: Newsletter of Bat Conservation International vol. 3, p. 1–4, (Reprinted, 1987, Endangered Species Technical Bulletin, vol. 4, p. 1–4).
McCracken, G.F., 1989, Cave conservation: Special problems with bats: The National Speleological Society Bulletin, vol. 51, p. 47–51.
McCracken, G.F., 1996, Bats aloft: A study of high-altitude feeding: Bats, Newsletter of Bat Conservation International, vol. 14, p. 7–10.
McCracken, G.F., and Gustin, M.F., 1991, Nursing behavior in Mexican free-tailed bat maternity colonies: Ethology vol. 89, p. 305–321.
McCracken, G.F., and Gassel, M.F., 1997, Genetic structure of migratory and nonmigratory populations of Brazilian free-tailed bats: Journal of Mammalogy, vol. 78, p. 348–357.
McCracken, G.F., McCracken, M.K., and Vawter, A.T., 1994. Genetic structure in migratory populations of the bat Tadarida brasiliensis mexicana: Journal of Mammalogy, vol. 75, p. 500–514.
Sabol, B.M., and Hudson, M.K., 1995, Technique using thermal infrared imaging for estimating populations of gray bats: Journal of Mammalogy, vol. 76, p. 1242–1248.
Tuttle, M.D., 1994, The lives of Mexican free-tailed bats: Bats, Newsletter of Bat Conservation International, vol. 12, p. 6–14.
UNEP/CMS, 1994, Appendices I and II of the Convention on the Conservation of Migratory Species of Wild Animals (CMS): UNEP/CMS Secretariat, Bonn, 7 p.
Villa-R., B., and Cockrum, E.L., 1962, Migration in the guano bat Tadarida brasiliensis mexicana (Saussure): Journal of Mammalogy, vol. 43, p. 43–64.
Wahl, R., 1993, Important Mexican free-tailed bat colonies in Texas, in Jordan, J. and Obele, R., eds., 1989 National Cave Management–Proceedings of the Symposium, Texas Parks and Wildlife Department, Austin, p. 47–50
Walker, S, 1995, Mexico-U.S. partnership makes gains for migratory bats: Bats, Newsletter of Bat Conservation International, vol. 13, p. 3–5.
Wilkins, K.T., 1989, Tadarida brasiliensis: Mammalian Species No. 331, p. 1–10.
Williams, T.C., Ireland, L.C., and Williams, J.M., 1973, High altitude flights of the free-tailed bat, Tadarida brasiliensis, observed with radar: Journal of Mammalogy, vol. 54, p. 807–821.
Estimating Population Sizes ofEstimating Population Sizes ofEstimating Population Sizes ofEstimating Population Sizes ofEstimating Population Sizes of Hibernating Bats in Caves and MinesHibernating Bats in Caves and MinesHibernating Bats in Caves and MinesHibernating Bats in Caves and MinesHibernating Bats in Caves and Mines
By
Merlin D. Tuttle
Bat Conservation International P.O. Box 162603
Austin, TX 78716
AbstractAbstractAbstractAbstractAbstract. Many temperate-zone bats form their largest, most consistent aggregations during hibernation in caves or mines. Thus, these sites are of extraordinary importance to management and are focal points for estimating populations. Monitoring at hibernation sites has contributed greatly to monitoring trends in status and to determining protection priorities. Abundance can be measured directly by counting and identifying individual bats where small populations live in simple caves or mines. However, the only technique currently available for estimating large populations involves calculations of densities and areas covered by roosting clusters. Accurate estimates are difficult, and sometimes impossible, because bats: (1) vary clustering density according to surface roughness and temperature; (2) frequently roost in crevices or high above floors on extremely irregular surface contours; (3) sometimes learn to avoid roosts disturbed by scientists by moving to inaccessible areas; and (4) in some instances have access to large sections of caves or mines that are not reachable by scientists. Knowledge of temperature requirements of bats, combined with an understanding of cave and mine contours that produce desired temperature gradients, provides a powerful tool for predicting the locations bats will select. Where populations cannot be fully measured, estimates of numbers using ideal roosts can be indicative of overall trends in status for the location. Consistent visitation schedules, measuring procedures, and assumptions must be well documented, and at least two observers should make estimates independently. Appropriate gear and an understanding of risks are essential, and disturbance of bats must be minimized.
ords: Bats, caves, hibernation, population trends and status, mines.KeyKeyKeyKeyKey WWWWWordsordsordsords
IntroductionIntroductionIntroductionIntroductionIntroduction
Many North American bats hibernate in winter, typically in dense aggregations that form in caves or mines, to which they exhibit extreme loyalty (Barbour and Davis, 1969; Tuttle, 1976). Because the largest, most predictable aggregations occur in these sites, status determination for threatened and endangered species of bats has relied extensively on midwinter monitoring (e.g., Brady and others, 1983). Numbers of bats at hibernation sites have been estimated based on counts of individuals (Rehak and Gaisler, 1999); calculations based on roosting density and area covered (Brady and others, 1983); and mark and recapture (Tinkle and Milstead, 1960; Dwyer, 1966). Counts of individuals can be a reliable means of monitoring trends in status for relatively small groups roosting on the walls or ceilings of small caves or mines
(Rehak and Gaisler, 1999). However this becomes impossible where bats roost in crevices, form large or dense clusters, or occupy sites too complex to fully explore during each visit. Crevice-roosting bats require individual extraction, or at least prior knowledge of the capacity of each occupied crevice. Large or dense clusters require calculations of density multiplied by the area covered. Although widely relied upon, this technique suffers from biases associated with highly variable cluster densities (Fig. 1) and varied wall and ceiling textures and contours (Tuttle, 1975; Thomas and LaVal, 1988). Nevertheless, calculations of cluster density and area remain the most reliable for large populations and are widely used for monitoring endangered species of bats. Approaches that rely on mark and recapture require that marked individuals roost randomly and that they remain equally “catchable.” Because these criteria are rarely, if
31
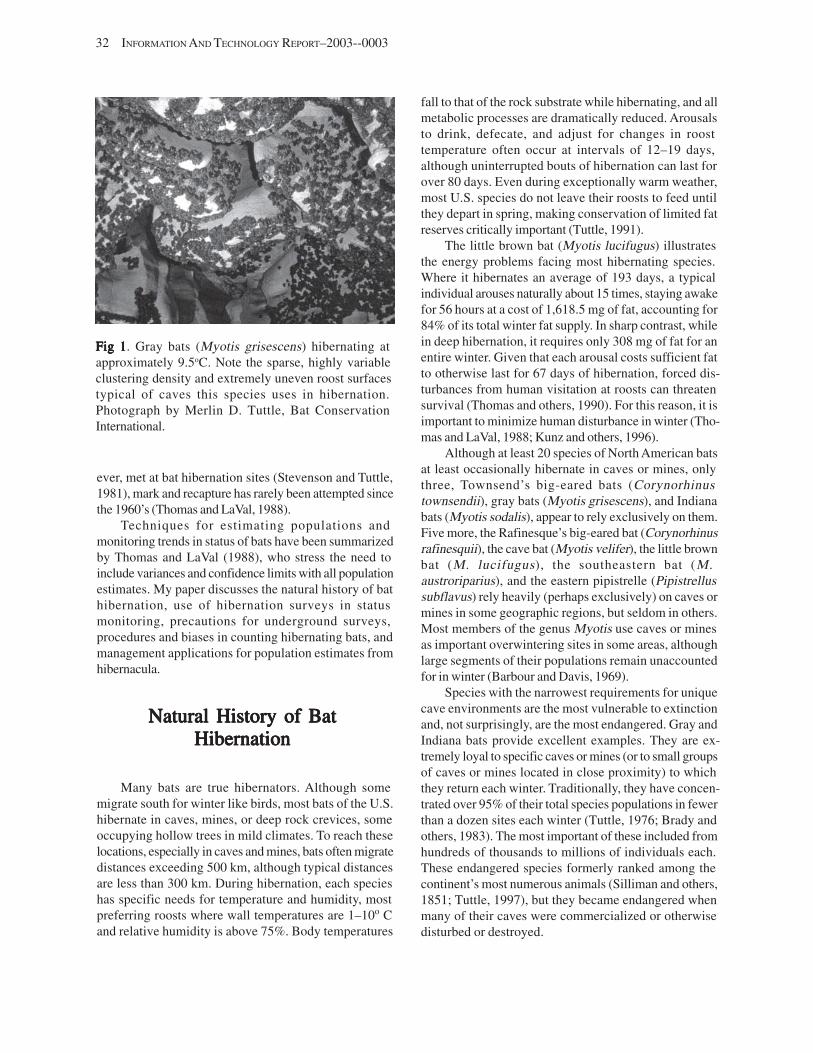
32 INFORMATION AND TECHNOLOGY REPORT–2003--0003
Fig 1Fig 1Fig 1Fig 1Fig 1. Gray bats (Myotis grisescens) hibernating at approximately 9.5oC. Note the sparse, highly variable clustering density and extremely uneven roost surfaces typical of caves this species uses in hibernation. Photograph by Merlin D. Tuttle, Bat Conservation International.
ever, met at bat hibernation sites (Stevenson and Tuttle, 1981), mark and recapture has rarely been attempted since the 1960’s (Thomas and LaVal, 1988).
Techniques for estimating populations and monitoring trends in status of bats have been summarized by Thomas and LaVal (1988), who stress the need to include variances and confidence limits with all population estimates. My paper discusses the natural history of bat hibernation, use of hibernation surveys in status monitoring, precautions for underground surveys, procedures and biases in counting hibernating bats, and management applications for population estimates from hibernacula.
Natural History of BatNatural History of BatNatural History of BatNatural History of BatNatural History of Bat HibernationHibernationHibernationHibernationHibernation
Many bats are true hibernators. Although some migrate south for winter like birds, most bats of the U.S. hibernate in caves, mines, or deep rock crevices, some occupying hollow trees in mild climates. To reach these locations, especially in caves and mines, bats often migrate distances exceeding 500 km, although typical distances are less than 300 km. During hibernation, each species has specific needs for temperature and humidity, most preferring roosts where wall temperatures are 1–10o C and relative humidity is above 75%. Body temperatures
fall to that of the rock substrate while hibernating, and all metabolic processes are dramatically reduced. Arousals to drink, defecate, and adjust for changes in roost temperature often occur at intervals of 12–19 days, although uninterrupted bouts of hibernation can last for over 80 days. Even during exceptionally warm weather, most U.S. species do not leave their roosts to feed until they depart in spring, making conservation of limited fat reserves critically important (Tuttle, 1991).
The little brown bat (Myotis lucifugus) illustrates the energy problems facing most hibernating species. Where it hibernates an average of 193 days, a typical individual arouses naturally about 15 times, staying awake for 56 hours at a cost of 1,618.5 mg of fat, accounting for 84% of its total winter fat supply. In sharp contrast, while in deep hibernation, it requires only 308 mg of fat for an entire winter. Given that each arousal costs sufficient fat to otherwise last for 67 days of hibernation, forced disturbances from human visitation at roosts can threaten survival (Thomas and others, 1990). For this reason, it is important to minimize human disturbance in winter (Thomas and LaVal, 1988; Kunz and others, 1996).
Although at least 20 species of North American bats at least occasionally hibernate in caves or mines, only three, Townsend’s big-eared bats (Corynorhinus townsendii), gray bats (Myotis grisescens), and Indiana bats (Myotis sodalis), appear to rely exclusively on them. Five more, the Rafinesque’s big-eared bat (Corynorhinus rafinesquii), the cave bat (Myotis velifer), the little brown bat (M. lucifugus), the southeastern bat (M. austroriparius), and the eastern pipistrelle (Pipistrellus subflavus) rely heavily (perhaps exclusively) on caves or mines in some geographic regions, but seldom in others. Most members of the genus Myotis use caves or mines as important overwintering sites in some areas, although large segments of their populations remain unaccounted for in winter (Barbour and Davis, 1969).
Species with the narrowest requirements for unique cave environments are the most vulnerable to extinction and, not surprisingly, are the most endangered. Gray and Indiana bats provide excellent examples. They are extremely loyal to specific caves or mines (or to small groups of caves or mines located in close proximity) to which they return each winter. Traditionally, they have concentrated over 95% of their total species populations in fewer than a dozen sites each winter (Tuttle, 1976; Brady and others, 1983). The most important of these included from hundreds of thousands to millions of individuals each. These endangered species formerly ranked among the continent’s most numerous animals (Silliman and others, 1851; Tuttle, 1997), but they became endangered when many of their caves were commercialized or otherwise disturbed or destroyed.
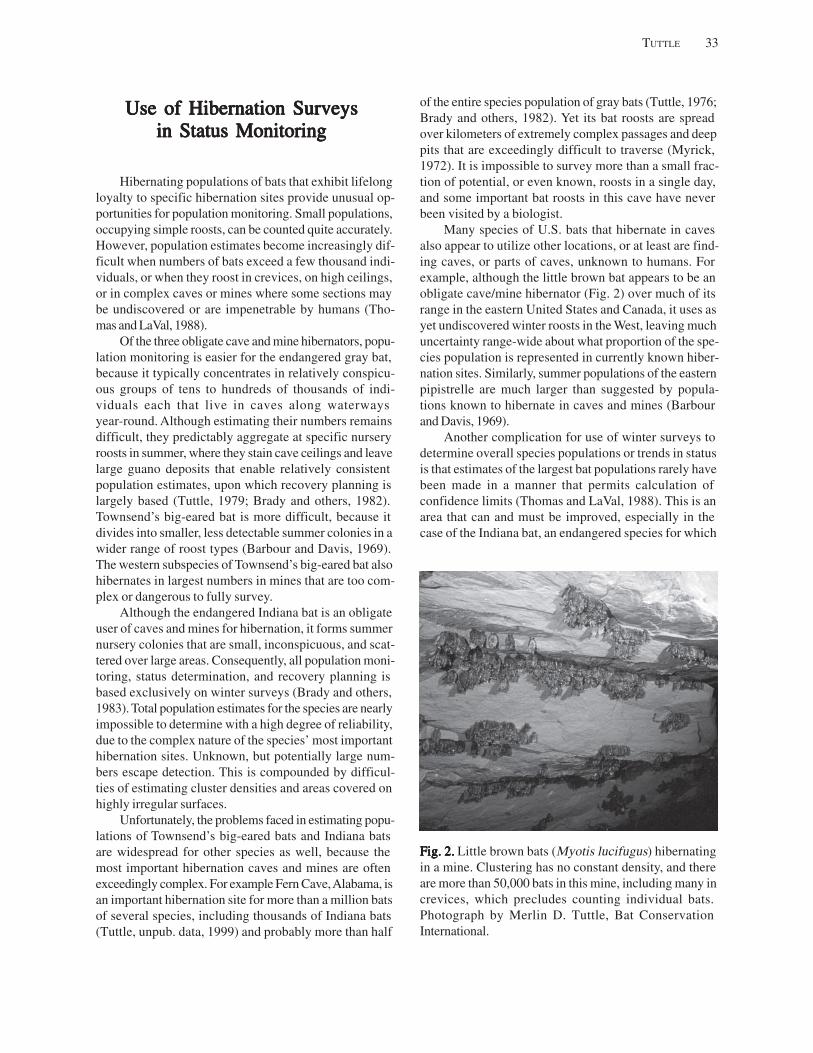
TUTTLE 33
Use of Hibernation SurveysUse of Hibernation SurveysUse of Hibernation SurveysUse of Hibernation SurveysUse of Hibernation Surveys in Status Monitoringin Status Monitoringin Status Monitoringin Status Monitoringin Status Monitoring
Hibernating populations of bats that exhibit lifelong loyalty to specific hibernation sites provide unusual opportunities for population monitoring. Small populations, occupying simple roosts, can be counted quite accurately. However, population estimates become increasingly difficult when numbers of bats exceed a few thousand individuals, or when they roost in crevices, on high ceilings, or in complex caves or mines where some sections may be undiscovered or are impenetrable by humans (Thomas and LaVal, 1988).
Of the three obligate cave and mine hibernators, population monitoring is easier for the endangered gray bat, because it typically concentrates in relatively conspicuous groups of tens to hundreds of thousands of individuals each that live in caves along waterways year-round. Although estimating their numbers remains difficult, they predictably aggregate at specific nursery roosts in summer, where they stain cave ceilings and leave large guano deposits that enable relatively consistent population estimates, upon which recovery planning is largely based (Tuttle, 1979; Brady and others, 1982). Townsend’s big-eared bat is more difficult, because it divides into smaller, less detectable summer colonies in a wider range of roost types (Barbour and Davis, 1969). The western subspecies of Townsend’s big-eared bat also hibernates in largest numbers in mines that are too complex or dangerous to fully survey.
Although the endangered Indiana bat is an obligate user of caves and mines for hibernation, it forms summer nursery colonies that are small, inconspicuous, and scattered over large areas. Consequently, all population monitoring, status determination, and recovery planning is based exclusively on winter surveys (Brady and others, 1983). Total population estimates for the species are nearly impossible to determine with a high degree of reliability, due to the complex nature of the species’ most important hibernation sites. Unknown, but potentially large numbers escape detection. This is compounded by difficulties of estimating cluster densities and areas covered on highly irregular surfaces.
Unfortunately, the problems faced in estimating populations of Townsend’s big-eared bats and Indiana bats are widespread for other species as well, because the most important hibernation caves and mines are often exceedingly complex. For example Fern Cave, Alabama, is an important hibernation site for more than a million bats of several species, including thousands of Indiana bats (Tuttle, unpub. data, 1999) and probably more than half
of the entire species population of gray bats (Tuttle, 1976; Brady and others, 1982). Yet its bat roosts are spread over kilometers of extremely complex passages and deep pits that are exceedingly difficult to traverse (Myrick, 1972). It is impossible to survey more than a small fraction of potential, or even known, roosts in a single day, and some important bat roosts in this cave have never been visited by a biologist.
Many species of U.S. bats that hibernate in caves also appear to utilize other locations, or at least are finding caves, or parts of caves, unknown to humans. For example, although the little brown bat appears to be an obligate cave/mine hibernator (Fig. 2) over much of its range in the eastern United States and Canada, it uses as yet undiscovered winter roosts in the West, leaving much uncertainty range-wide about what proportion of the species population is represented in currently known hibernation sites. Similarly, summer populations of the eastern pipistrelle are much larger than suggested by populations known to hibernate in caves and mines (Barbour and Davis, 1969).
Another complication for use of winter surveys to determine overall species populations or trends in status is that estimates of the largest bat populations rarely have been made in a manner that permits calculation of confidence limits (Thomas and LaVal, 1988). This is an area that can and must be improved, especially in the case of the Indiana bat, an endangered species for which
Fig. 2.Fig. 2.Fig. 2.Fig. 2.Fig. 2. Little brown bats (Myotis lucifugus) hibernating in a mine. Clustering has no constant density, and there are more than 50,000 bats in this mine, including many in crevices, which precludes counting individual bats. Photograph by Merlin D. Tuttle, Bat Conservation International.
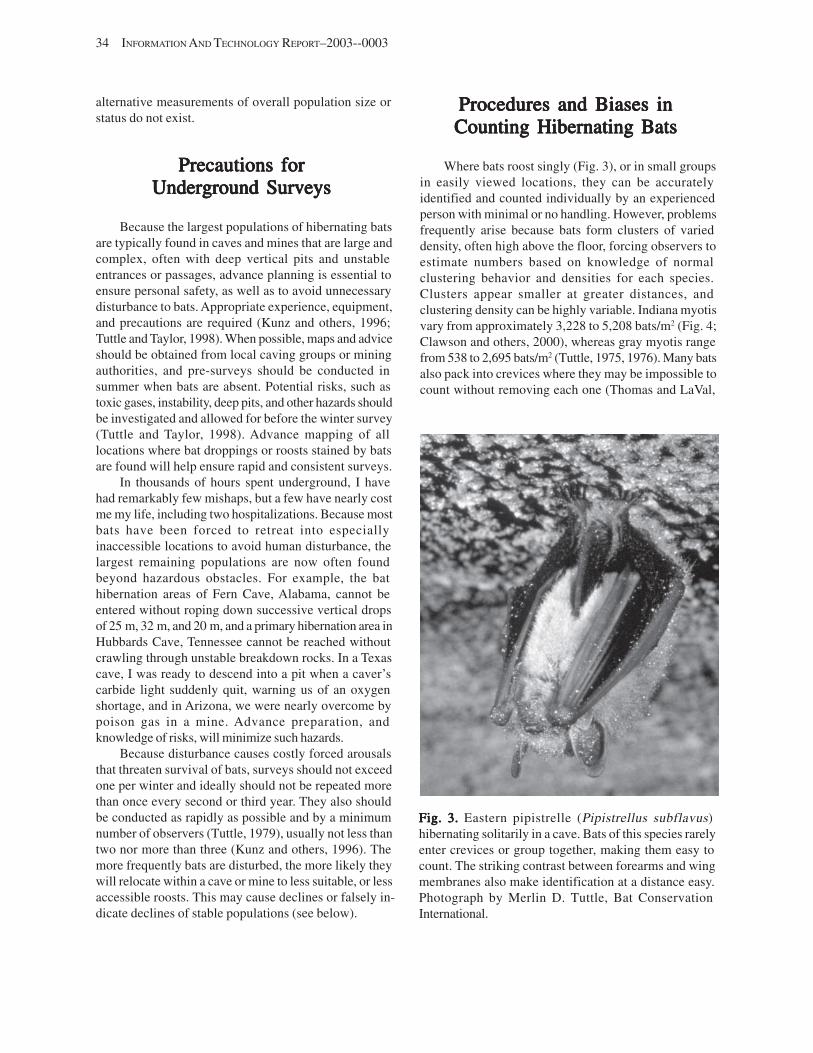
34 INFORMATION AND TECHNOLOGY REPORT–2003--0003
alternative measurements of overall population size or status do not exist.
Precautions forPrecautions forPrecautions forPrecautions forPrecautions for Underground SurveysUnderground SurveysUnderground SurveysUnderground SurveysUnderground Surveys
Because the largest populations of hibernating bats are typically found in caves and mines that are large and complex, often with deep vertical pits and unstable entrances or passages, advance planning is essential to ensure personal safety, as well as to avoid unnecessary disturbance to bats. Appropriate experience, equipment, and precautions are required (Kunz and others, 1996; Tuttle and Taylor, 1998). When possible, maps and advice should be obtained from local caving groups or mining authorities, and pre-surveys should be conducted in summer when bats are absent. Potential risks, such as toxic gases, instability, deep pits, and other hazards should be investigated and allowed for before the winter survey (Tuttle and Taylor, 1998). Advance mapping of all locations where bat droppings or roosts stained by bats are found will help ensure rapid and consistent surveys.
In thousands of hours spent underground, I have had remarkably few mishaps, but a few have nearly cost me my life, including two hospitalizations. Because most bats have been forced to retreat into especially inaccessible locations to avoid human disturbance, the largest remaining populations are now often found beyond hazardous obstacles. For example, the bat hibernation areas of Fern Cave, Alabama, cannot be entered without roping down successive vertical drops of 25 m, 32 m, and 20 m, and a primary hibernation area in Hubbards Cave, Tennessee cannot be reached without crawling through unstable breakdown rocks. In a Texas cave, I was ready to descend into a pit when a caver’s carbide light suddenly quit, warning us of an oxygen shortage, and in Arizona, we were nearly overcome by poison gas in a mine. Advance preparation, and knowledge of risks, will minimize such hazards.
Because disturbance causes costly forced arousals that threaten survival of bats, surveys should not exceed one per winter and ideally should not be repeated more than once every second or third year. They also should be conducted as rapidly as possible and by a minimum number of observers (Tuttle, 1979), usually not less than two nor more than three (Kunz and others, 1996). The more frequently bats are disturbed, the more likely they will relocate within a cave or mine to less suitable, or less accessible roosts. This may cause declines or falsely indicate declines of stable populations (see below).
Procedures and Biases inProcedures and Biases inProcedures and Biases inProcedures and Biases inProcedures and Biases in Counting Hibernating BatsCounting Hibernating BatsCounting Hibernating BatsCounting Hibernating BatsCounting Hibernating Bats
Where bats roost singly (Fig. 3), or in small groups in easily viewed locations, they can be accurately identified and counted individually by an experienced person with minimal or no handling. However, problems frequently arise because bats form clusters of varied density, often high above the floor, forcing observers to estimate numbers based on knowledge of normal clustering behavior and densities for each species. Clusters appear smaller at greater distances, and clustering density can be highly variable. Indiana myotis vary from approximately 3,228 to 5,208 bats/m2 (Fig. 4; Clawson and others, 2000), whereas gray myotis range from 538 to 2,695 bats/m2 (Tuttle, 1975, 1976). Many bats also pack into crevices where they may be impossible to count without removing each one (Thomas and LaVal,
Fig. 3.Fig. 3.Fig. 3.Fig. 3.Fig. 3. Eastern pipistrelle (Pipistrellus subflavus) hibernating solitarily in a cave. Bats of this species rarely enter crevices or group together, making them easy to count. The striking contrast between forearms and wing membranes also make identification at a distance easy. Photograph by Merlin D. Tuttle, Bat Conservation International.
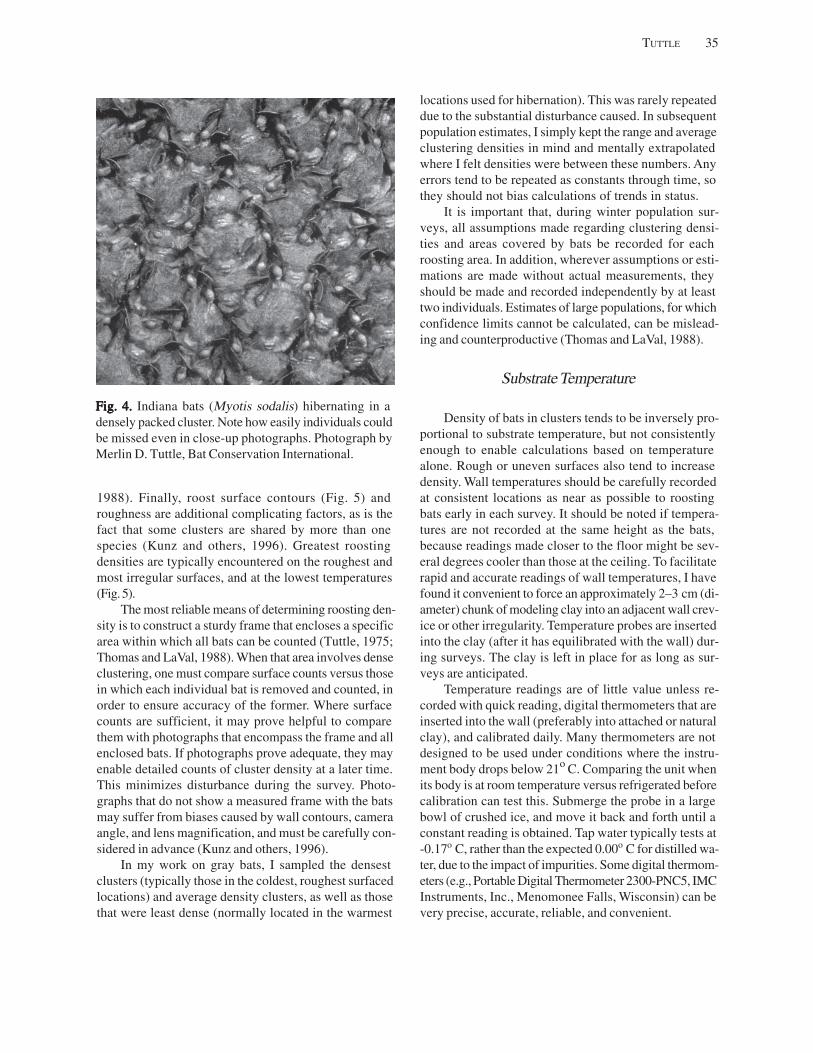
Fig. 4.Fig. 4.Fig. 4.Fig. 4.Fig. 4. Indiana bats (Myotis sodalis) hibernating in a densely packed cluster. Note how easily individuals could be missed even in close-up photographs. Photograph by Merlin D. Tuttle, Bat Conservation International.
1988). Finally, roost surface contours (Fig. 5) and roughness are additional complicating factors, as is the fact that some clusters are shared by more than one species (Kunz and others, 1996). Greatest roosting densities are typically encountered on the roughest and most irregular surfaces, and at the lowest temperatures (Fig. 5).
The most reliable means of determining roosting density is to construct a sturdy frame that encloses a specific area within which all bats can be counted (Tuttle, 1975; Thomas and LaVal, 1988). When that area involves dense clustering, one must compare surface counts versus those in which each individual bat is removed and counted, in order to ensure accuracy of the former. Where surface counts are sufficient, it may prove helpful to compare them with photographs that encompass the frame and all enclosed bats. If photographs prove adequate, they may enable detailed counts of cluster density at a later time. This minimizes disturbance during the survey. Photographs that do not show a measured frame with the bats may suffer from biases caused by wall contours, camera angle, and lens magnification, and must be carefully considered in advance (Kunz and others, 1996).
In my work on gray bats, I sampled the densest clusters (typically those in the coldest, roughest surfaced locations) and average density clusters, as well as those that were least dense (normally located in the warmest
TUTTLE 35
locations used for hibernation). This was rarely repeated due to the substantial disturbance caused. In subsequent population estimates, I simply kept the range and average clustering densities in mind and mentally extrapolated where I felt densities were between these numbers. Any errors tend to be repeated as constants through time, so they should not bias calculations of trends in status.
It is important that, during winter population surveys, all assumptions made regarding clustering densities and areas covered by bats be recorded for each roosting area. In addition, wherever assumptions or estimations are made without actual measurements, they should be made and recorded independently by at least two individuals. Estimates of large populations, for which confidence limits cannot be calculated, can be misleading and counterproductive (Thomas and LaVal, 1988).
Substrate Temperature
Density of bats in clusters tends to be inversely proportional to substrate temperature, but not consistently enough to enable calculations based on temperature alone. Rough or uneven surfaces also tend to increase density. Wall temperatures should be carefully recorded at consistent locations as near as possible to roosting bats early in each survey. It should be noted if temperatures are not recorded at the same height as the bats, because readings made closer to the floor might be several degrees cooler than those at the ceiling. To facilitate rapid and accurate readings of wall temperatures, I have found it convenient to force an approximately 2–3 cm (diameter) chunk of modeling clay into an adjacent wall crevice or other irregularity. Temperature probes are inserted into the clay (after it has equilibrated with the wall) during surveys. The clay is left in place for as long as surveys are anticipated.
Temperature readings are of little value unless recorded with quick reading, digital thermometers that are inserted into the wall (preferably into attached or natural clay), and calibrated daily. Many thermometers are not designed to be used under conditions where the instrument body drops below 21o C. Comparing the unit when its body is at room temperature versus refrigerated before calibration can test this. Submerge the probe in a large bowl of crushed ice, and move it back and forth until a constant reading is obtained. Tap water typically tests at -0.17o C, rather than the expected 0.00o C for distilled water, due to the impact of impurities. Some digital thermometers (e.g., Portable Digital Thermometer 2300-PNC5, IMC Instruments, Inc., Menomonee Falls, Wisconsin) can be very precise, accurate, reliable, and convenient.
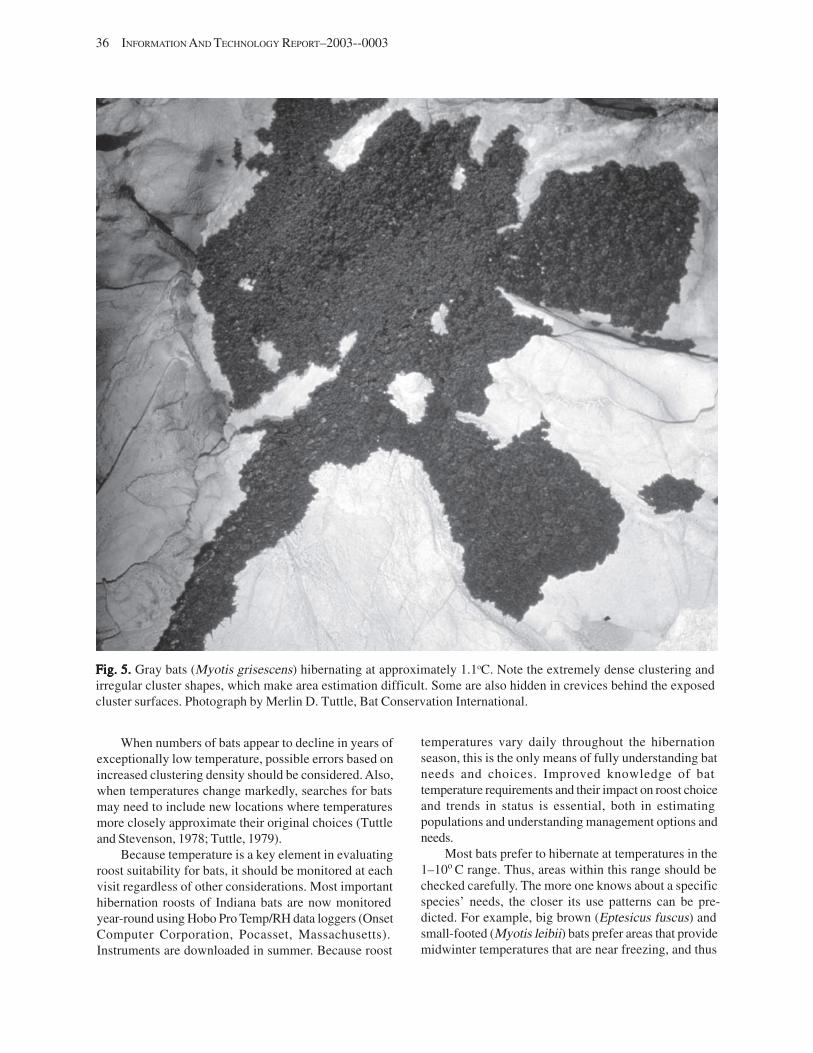
36 INFORMATION AND TECHNOLOGY REPORT–2003--0003
Fig. 5.Fig. 5.Fig. 5.Fig. 5.Fig. 5. Gray bats (Myotis grisescens) hibernating at approximately 1.1oC. Note the extremely dense clustering and irregular cluster shapes, which make area estimation difficult. Some are also hidden in crevices behind the exposed cluster surfaces. Photograph by Merlin D. Tuttle, Bat Conservation International.
When numbers of bats appear to decline in years of exceptionally low temperature, possible errors based on increased clustering density should be considered. Also, when temperatures change markedly, searches for bats may need to include new locations where temperatures more closely approximate their original choices (Tuttle and Stevenson, 1978; Tuttle, 1979).
Because temperature is a key element in evaluating roost suitability for bats, it should be monitored at each visit regardless of other considerations. Most important hibernation roosts of Indiana bats are now monitored year-round using Hobo Pro Temp/RH data loggers (Onset Computer Corporation, Pocasset, Massachusetts). Instruments are downloaded in summer. Because roost
temperatures vary daily throughout the hibernation season, this is the only means of fully understanding bat needs and choices. Improved knowledge of bat temperature requirements and their impact on roost choice and trends in status is essential, both in estimating populations and understanding management options and needs.
Most bats prefer to hibernate at temperatures in the 1–10o C range. Thus, areas within this range should be checked carefully. The more one knows about a specific species’ needs, the closer its use patterns can be predicted. For example, big brown (Eptesicus fuscus) and small-footed (Myotis leibii) bats prefer areas that provide midwinter temperatures that are near freezing, and thus
tend to be found near entrances where cold winter air enters. Gray and Indiana bats like more stable, intermediate temperatures which in midwinter are typically 4–10o C and 3–7o C, respectively. Many species prefer the lowest available temperatures that are safe from freezing, but often must settle for warmer locations to avoid this risk or human disturbance. Thus, in caves that provide exceptional stability, bats tend to be found at cooler roosts.
Detailed descriptions of cave (Tuttle and Stevenson, 1978) and mine (Tuttle and Taylor, 1998) contours that best meet bat needs are available, and combined with knowledge of bat requirements, provide a powerful predictive tool for locating hibernating bats. For example, at latitudes and elevations where mean annual surface temperatures are above 10o C, all underground roosts require cooling from outside winter air in order to meet needs of gray or Indiana bats. This normally requires “chimneyeffect” flow between two or more entrances, meaning that hibernating bat populations are restricted to relatively small and predictable portions of total cave or mine systems. Sections that are too warm for hibernation need not be checked. However, any time that cool air is detected moving into an area that could be reached by bats, every possible effort should be made to follow it, at which times a quick-reading digital thermometer is extremely helpful. Such air flow “tracking” is most easily accomplished when the fastest airflow is occurring on extra cold days of late fall or early winter. This is exactly how I followed the flow of cool air through a large pile of breakdown rocks in Hubbards Cave, Tennessee, to discover a new roost occupied by 200,000 gray bats. This has worked well on other occasions.
Cave and Mine Complexity
Because bats are extremely loyal to specific hibernation caves and mines and prefer to use the same roosting sites year after year (Hall, 1962; Tuttle, 1976), it is tempting to believe that local populations can be reliably monitored. Nevertheless, major roost switching within caves or mines may occur in response to changes in either temperature or human disturbance. Critically important gray and Indiana bat hibernacula often include large and complex areas of multilevel passages in which it can be exceedingly difficult to find even the largest aggregations of bats.
Roost switching within complex caves or mines frequently causes serious errors in year-to-year population estimates. Over a 14-year study involving the most important gray bat hibernation caves, I continually discovered new roosts, despite thorough previous searches of these sites (Tuttle, 1976). Pearson Cave, in Tennessee, was my best-studied, simplest hibernation site. Yet, following 16 years of band recovery efforts there, I found
TUTTLE 37
yet another important roosting area into which a large proportion of my oldest banded bats had moved in an apparent attempt to avoid recapture. This had significantly reduced estimates of survivorship (Stevenson and Tuttle, 1981). At Hubbards Cave, Tennessee, another of the U.S.’s most important bat hibernation sites, only 50,000 gray bats were known for the first 8 years of my visits. However, in 1968 I discovered a new section of the cave that contained approximately 200,000 more bats. I also discovered a section too dangerous to enter that also contained a large number of bats but which to this day has never been reached by a biologist.
These are not isolated examples. On one of my final visits to Fern Cave, Alabama, the world’s largest known bat hibernation site, I discovered a previously unvisited room containing over 250,000 gray bats and an uncounted number of Indiana bats. At Tobbaccoport Cave, Tennessee, I discovered a new section in 1969 that contained 50,000 gray bats that could be reached by humans only by tunneling through 3 m of clay, which I subsequently replaced for their protection. At James Cave, Kentucky, another critical gray bat hibernation cave, is a narrow passage, filled mostly with water, that leads to a room where I have seen approximately 100,000 gray bats. Humans can reach this roost only by first siphoning water out of the passage, and I and the Gray and Indiana Bat Recovery Team Leader, Richard Clawson, are the only biologists to have reached it. Because no one is willing to return, any estimate made in that cave can be incorrect by at least 100,000 bats. Such experiences have led me to focus nearly all of my efforts to report and monitor status of gray bats in caves used in summer, where nursery groups are far easier to detect and measure (Tuttle, 1979). Based on currently existing technology, I know of no practical means of gaining more than a ball park estimate of numbers in major gray bat hibernation caves, although periodic monitoring is essential to detect problems and ensure continued protection.
Where other species, including Indiana bats, occupy similarly complex caves, many of the problems I discovered in estimating populations of gray bats are similar. This should not be interpreted as reason to ignore the results of many such estimates of the past. They are the best we have. However, it should sound a cautionary note that serious efforts are needed to improve our understanding of key sites and the unique biases inherent in determining bat numbers and status.
Sampling Consistency
Bat population monitoring often has been seriously compromised by a lack of consistent sampling techniques and assumptions over time, especially those involving estimates of clustering density and areas covered. Sam
38 INFORMATION AND TECHNOLOGY REPORT–2003--0003
pling intervals, dates, and procedures need to be rigorously adhered to at each location, and any new assumptions must be clearly recorded.
All areas of caves and mines where bats hibernate should be mapped in summer, and as early as possible, each roosting site should be numbered, measured, and described, including wall temperatures at each one. This is especially important in complex systems. Later, when population estimates are made, there should be a consistent order of visitation that assures equal coverage during each visit. Knowledge of temperature will help predict new locations of bats that may be forced to move during extreme weather. For example, when bats are absent from a traditional roost following a drop in temperature, they should be searched for in warmer rather than in cooler areas of the system.
Measuring roost areas and attaching removable reflective markers to delineate scale on subsequent visits, especially where surfaces are uneven or high above floors, can substantially increase the accuracy of surface area estimates. This enables consistent estimates, including use of photographs, and is especially important where highly irregular wall contours, high ceilings, and other factors confuse observers regarding true distances and areas covered. This alone can dramatically improve yearto-year consistency.
When surveys must be conducted by new individuals, such persons always should have at least one or two prior opportunities to accompany and compare their results with those of their predecessors to familiarize themselves with roost locations, counting techniques and assumptions made at each roost. At such times, accurate maps and records of all assumptions can be extremely helpful. In all cases, estimates of cluster area and density should be simultaneously and independently conducted by at least two people who average results and report error values.
ManagementApplications of Population Estimates During Hibernation
Population estimates made at hibernation sites can be extremely useful indicators of the importance of a given site and of the trends in status of its bats. In numerous cases, such estimates are invaluable in gaining protection of specific cave or mine roosts. They also are essential to early detection of adverse changes at a particular location. For example, at Pearson Cave, Tennessee, an entrance that is key to maintaining the bats’ required roost temperatures is gradually closing. Over a 30-year period, I have observed it decrease to less than a quarter of its original size. Complete closure could lead to the loss of approximately 200,000 gray bats and smaller numbers of
five other species. Entrance blockage also poses a serious threat to Indiana bats (Tuttle and Kennedy, 2002) and other species. Routine population estimates, combined with temperature monitoring, enable early detection and avoidance of such threats.
In addition, even at the largest and most complex caves and mines, knowledge of bat temperature requirements is highly predictive of where they should be found during hibernation (see above). When large numbers of bats are not found occupying these areas, which are almost invariably near air intake entrances, it should be assumed that the population in question is at sufficient risk to require additional protection. For example, Fern Cave, Alabama, cannot be fully surveyed to estimate the size of its very large gray bat population. However, estimates at roosts nearest the main cold air intake entrance can be used to indicate population status for the cave. Full occupancy of these roosts implies a healthy population, whereas a drop in numbers, despite the continued availability of ideal temperatures, would suggest a need for increased protection from human disturbance. Alternatively, a decline associated with a change in temperature beyond gray bat requirements should be considered indicative of a very serious problem, perhaps involving natural or unnatural alteration of one or more entrances. Because this cave supports a majority of the entire species population each winter, such findings would impact status consideration for the species, despite the lack of hard data on absolute numbers.
ConclusionsConclusionsConclusionsConclusionsConclusions
Though biases often preclude estimates of total population size, even for a given cave or mine, absolute numbers are not required to document population trends which provide a basis for management planning and status determination. Also, many of the biases I have discussed tend to cause consistent errors in the same direction from year to year within a given site, greatly reducing their impact on calculation of trends in status. Problems aside, population monitoring at roosts used for hibernation is an essential tool that continues to play a critical role in prioritizing and gaining protective actions for bats.
Nevertheless, many improvements can and should be made. Inferences about trends in status can be biased if estimates are not based on consistent techniques and assumptions that permit calculation of confidence limits. Where caves or mines provide only small areas of appropriate temperature, there is little likelihood of missing an important segment of the population that gradually learns to avoid detection. Nevertheless, where sufficiently low temperatures are likely to exist in areas potentially
reachable by bats, but not humans, this should be documented as a possible explanation for apparent decline. Improved knowledge of bat temperature requirements and their impact on roost choice and trends in status is essential, both in estimating populations and in understanding management options and needs. To this end, the recent availability of temperature data loggers provides an important tool for improving the interpretation of population data.
References CitedReferences CitedReferences CitedReferences CitedReferences Cited
Barbour, R.W., and Davis, W.H., 1969, Bats of America: Lexington, University Press of Kentucky, 286 p.
Brady, J.T., Kunz, T.H., Tuttle, M.D., and Wilson, D.E., 1982, Gray bat recovery plan: U.S. Department of the Interior, Fish and Wildlife Service, Denver, Colo, 21 p.
Brady, J.T., LaVal, R.K., Kunz, T.H., Tuttle, M.D., Wilson, D.E., and Clawson, R.L., 1983, Recovery plan for the Indiana bat: U.S. Department of the Interior, Fish and Wildlife Service, Rockville, Md, 21 p.
Clawson, R.L., Brack, V., Currie, R., Gardner, J.E., Harvey, M.J., Johnson, S., Kurta, A., MacGregor, J., Stihler, C., and Tuttle, M.D., 2000, Indiana bat revised recovery plan: U.S. Fish and Wildlife Service, Region 3, Minneapolis, 53 p.
Dwyer, P.D. 1966, The population pattern of Miniopterus schreibersii (Chiroptera) in northeastern New South Wales:Australian Journal of Zoology, vol. 14, p. 1073– 1137.
Hall, J.S., 1962, A life history and taxonomic study of the Indiana bat, Myotis sodalis: Scientific Publication, Reading Public Museum andArt Gallery, vol. 12, p. 1–68.
Kunz, T.H., Thomas, D.W., Richards, G.C., Tidemann, C.R., Pierson, E.D., and Racey, P.A., 1996, Observational techniques for bats, in Wilson, D.E., Cole, F.R., Nichols, J.D., Rudran, R., and Foster, M.S., eds., Measuring and monitoring biological diversity, standard methods for mammals: Smithsonian Institution Press, Washington, D.C., p. 105–114.
Myrick, D.R., 1972, Fern Cave, Donal R. Myrick, Huntsville, Al, 106 p.
Rehak, Z., and Gaisler, J., 1999, Long-term changes in the number of bats in the largest man-made hibernaculum of the Czech Republic: Acta Chiropterologica, vol. 1, series 1, p. 113–123.
TUTTLE 39
Silliman, B.S., Jr., Dana, J.D., and Gibbs, W., 1851, On the Mammoth Cave of Kentucky: American Journal of Science and Arts, vol. 11, p. 332–339.
Stevenson, D.E., and Tuttle, M.D., 1981, Survivorship in the endangered gray bat (Myotis grisescens): Journal of Mammalogy, vol. 62, p. 244–257.
Thomas, D.W., and LaVal, R.K., 1988, Survey and census methods, in Kunz, T.H., ed., Ecological and behavioral methods for the study of bats: Smithsonian Institution Press, Washington, D.C., p. 77–89.
Thomas, D.W., Dorais, M., and Bergeron, J.M., 1990, Winter energy budgets and cost of arousals for hibernating little brown bats, Myotis lucifugus: Journal of Mammalogy, vol. 7, p. 475–479.
Tinkle, D.W., and Milstead, W.W., 1960, Sex ratios and population density in hibernating Myotis: American Midland Naturalist, vol. 63, p. 327–334.
Tuttle, M.D., 1975, Population ecology of the gray bat (Myotis grisescens), Factors influencing early growth and development: University of Kansas Occasional Papers Museum of Natural History, vol. 36, p. 1–24.
Tuttle, M.D., 1976, Population ecology of the gray bat (Myotis grisescens), Philopatry, timing and patterns of movement, weight loss during migration, and seasonal adaptive strategies: University of Kansas Occasional Papers Museum of Natural History, vol. 54, p. 1–38.
Tuttle, M.D., 1979, Status, causes of decline, and management of endangered gray bats: Journal of Wildlife Management, vol. 43, p. 1–17.
Tuttle, M.D., 1991, How North America’s bats survive the winter: Bats, vol. 9, p. 7–12.
Tuttle, M.D., 1997, A mammoth discovery: Bats, vol. 15, p. 3–5.
Tuttle, M.D., and Kennedy, J., 2002, Thermal requirements during hibernation, in Kurta, A., and Kennedy, J., eds., the Indiana bat: biology and management of an endangered species: Bat Conservation International, Austin, Tex, p. 68–78.
Tuttle, M.D., and Stevenson, D.E., 1978, Variation in the cave environment and its biological implications, in Zuber, R., Chester, J., Gilbertt, S., and Rhoads, D., eds, National Cave Management Symposium Proceedings, 1977: Adobe Press, Albuquerque, NM, p. 108–121.
Tuttle, M.D., and Taylor, D.R., 1998, Bats and mines: Bat Conservation International Resource Publication Number 3, 50 p.

PopulationPopulationPopulationPopulationPopulation TTTTTrends of Solitary Foliage-Roosting Batsrends of Solitary Foliage-Roosting Batsrends of Solitary Foliage-Roosting Batsrends of Solitary Foliage-Roosting Batsrends of Solitary Foliage-Roosting Bats
By
Timothy C. Carter
Southern Illinois University Department of Zoology
Carbondale, IL 62901-6501
Michael A. Menzel
West Virginia University Division of Forestry
Wildlife and Fisheries Resources Box 6125
Morgantown, WV 26506-6125
and
David A. Saugey
U.S. Forest Service Ouachita National Forest
P.O. Box 189 Jessieville, AR 71949
Abstract. There are seven species of foliage-roosting bats in the United States (U.S.), all in the genus Lasiurus. Little is known about historical or recent population trends in these bats. Anecdotal accounts suggest higher abundances of some lasiurines in the past. However, quantitative analysis of long-term population trends of solitary foliage-roosting bats is not possible because of constraints to existing data. We review historical changes in the dynamics of North American forests since European settlement as a possible index to the availability of roosting habitat, a potential limiting factor for some bat populations. Greatest rates of forest clearing occurred in the late 1800’s, and areas in forest cover stabilized by the 1920’s. However, the resulting increase in forest edges may have had a compensatory effect on lasiurines by increasing foraging habitat. As of 1992, 70% of the area originally forested in the U.S. remains in forest. We speculate about how changes in forest management and associated human activities may have impacted populations of different species of lasiurines in the U.S. We also examine a case study of declining trends in submissions of eastern red bats (Lasiurus borealis) for rabies examinations in Arkansas as a possible index of abundance. Eastern red bats have recently been documented to hibernate in the leaf litter on the forest floor in some areas, a habit that may render them susceptible to fire and negatively impact their abundance.
AbstractAbstractAbstractAbstract
KeyKeyKeyKeyKey WWWWWordsordsordsordsords: Lasiurus, monitoring systems, population trends, roosting, tree bats.
41
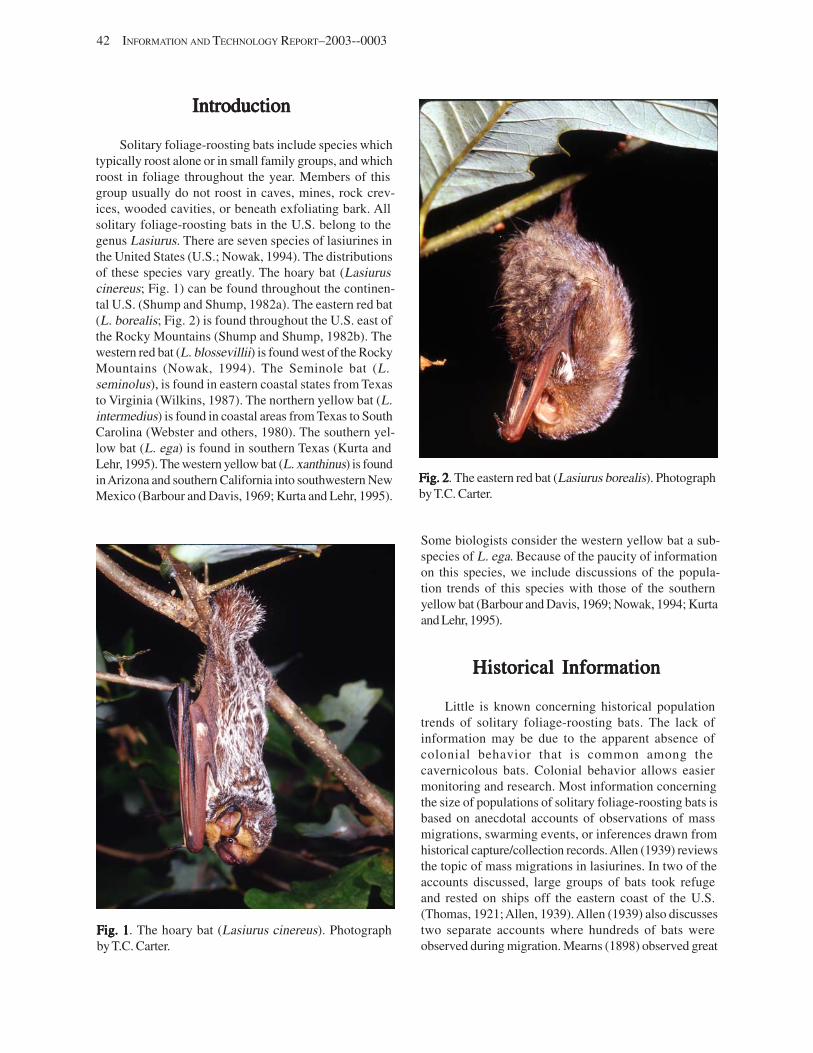
42 INFORMATION AND TECHNOLOGY REPORT–2003--0003
IntroductionIntroductionIntroductionIntroductionIntroduction
Solitary foliage-roosting bats include species which typically roost alone or in small family groups, and which roost in foliage throughout the year. Members of this group usually do not roost in caves, mines, rock crevices, wooded cavities, or beneath exfoliating bark. All solitary foliage-roosting bats in the U.S. belong to the genus Lasiurus. There are seven species of lasiurines in the United States (U.S.; Nowak, 1994). The distributions of these species vary greatly. The hoary bat (Lasiurus cinereus; Fig. 1) can be found throughout the continental U.S. (Shump and Shump, 1982a). The eastern red bat (L. borealis; Fig. 2) is found throughout the U.S. east of the Rocky Mountains (Shump and Shump, 1982b). The western red bat (L. blossevillii) is found west of the Rocky Mountains (Nowak, 1994). The Seminole bat (L. seminolus), is found in eastern coastal states from Texas to Virginia (Wilkins, 1987). The northern yellow bat (L. intermedius) is found in coastal areas from Texas to South Carolina (Webster and others, 1980). The southern yellow bat (L. ega) is found in southern Texas (Kurta and Lehr, 1995). The western yellow bat (L. xanthinus) is found in Arizona and southern California into southwestern New Mexico (Barbour and Davis, 1969; Kurta and Lehr, 1995).
Fig. 1Fig. 1Fig. 1Fig. 1Fig. 1. The hoary bat (Lasiurus cinereus). Photograph by T.C. Carter.
Fig. 2Fig. 2Fig. 2Fig. 2Fig. 2. The eastern red bat (Lasiurus borealis). Photograph by T.C. Carter.
Some biologists consider the western yellow bat a subspecies of L. ega. Because of the paucity of information on this species, we include discussions of the population trends of this species with those of the southern yellow bat (Barbour and Davis, 1969; Nowak, 1994; Kurta and Lehr, 1995).
Historical InformationHistorical InformationHistorical InformationHistorical InformationHistorical Information
Little is known concerning historical population trends of solitary foliage-roosting bats. The lack of information may be due to the apparent absence of colonial behavior that is common among the cavernicolous bats. Colonial behavior allows easier monitoring and research. Most information concerning the size of populations of solitary foliage-roosting bats is based on anecdotal accounts of observations of mass migrations, swarming events, or inferences drawn from historical capture/collection records. Allen (1939) reviews the topic of mass migrations in lasiurines. In two of the accounts discussed, large groups of bats took refuge and rested on ships off the eastern coast of the U.S. (Thomas, 1921; Allen, 1939). Allen (1939) also discusses two separate accounts where hundreds of bats were observed during migration. Mearns (1898) observed great
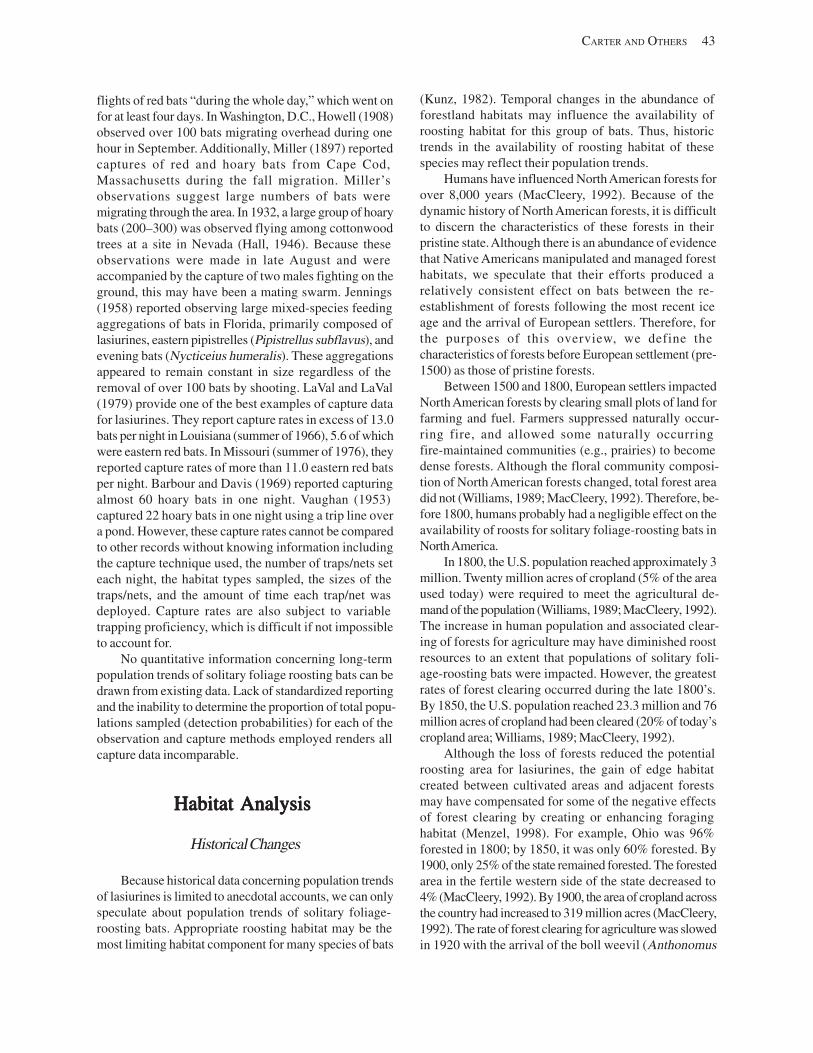
flights of red bats “during the whole day,” which went on for at least four days. In Washington, D.C., Howell (1908) observed over 100 bats migrating overhead during one hour in September. Additionally, Miller (1897) reported captures of red and hoary bats from Cape Cod, Massachusetts during the fall migration. Miller’s observations suggest large numbers of bats were migrating through the area. In 1932, a large group of hoary bats (200–300) was observed flying among cottonwood trees at a site in Nevada (Hall, 1946). Because these observations were made in late August and were accompanied by the capture of two males fighting on the ground, this may have been a mating swarm. Jennings (1958) reported observing large mixed-species feeding aggregations of bats in Florida, primarily composed of lasiurines, eastern pipistrelles (Pipistrellus subflavus), and evening bats (Nycticeius humeralis). These aggregations appeared to remain constant in size regardless of the removal of over 100 bats by shooting. LaVal and LaVal (1979) provide one of the best examples of capture data for lasiurines. They report capture rates in excess of 13.0 bats per night in Louisiana (summer of 1966), 5.6 of which were eastern red bats. In Missouri (summer of 1976), they reported capture rates of more than 11.0 eastern red bats per night. Barbour and Davis (1969) reported capturing almost 60 hoary bats in one night. Vaughan (1953) captured 22 hoary bats in one night using a trip line over a pond. However, these capture rates cannot be compared to other records without knowing information including the capture technique used, the number of traps/nets set each night, the habitat types sampled, the sizes of the traps/nets, and the amount of time each trap/net was deployed. Capture rates are also subject to variable trapping proficiency, which is difficult if not impossible to account for.
No quantitative information concerning long-term population trends of solitary foliage roosting bats can be drawn from existing data. Lack of standardized reporting and the inability to determine the proportion of total populations sampled (detection probabilities) for each of the observation and capture methods employed renders all capture data incomparable.
HabitatHabitatHabitatHabitatHabitat AnalysisAnalysisAnalysisAnalysisAnalysis
Historical Changes
Because historical data concerning population trends of lasiurines is limited to anecdotal accounts, we can only speculate about population trends of solitary foliage-roosting bats. Appropriate roosting habitat may be the most limiting habitat component for many species of bats
CARTER AND OTHERS 43
(Kunz, 1982). Temporal changes in the abundance of forestland habitats may influence the availability of roosting habitat for this group of bats. Thus, historic trends in the availability of roosting habitat of these species may reflect their population trends.
Humans have influenced North American forests for over 8,000 years (MacCleery, 1992). Because of the dynamic history of North American forests, it is difficult to discern the characteristics of these forests in their pristine state.Although there is an abundance of evidence that Native Americans manipulated and managed forest habitats, we speculate that their efforts produced a relatively consistent effect on bats between the reestablishment of forests following the most recent ice age and the arrival of European settlers. Therefore, for the purposes of this overview, we define the characteristics of forests before European settlement (pre-1500) as those of pristine forests.
Between 1500 and 1800, European settlers impacted North American forests by clearing small plots of land for farming and fuel. Farmers suppressed naturally occurring fire, and allowed some naturally occurring fire-maintained communities (e.g., prairies) to become dense forests. Although the floral community composition of North American forests changed, total forest area did not (Williams, 1989; MacCleery, 1992). Therefore, before 1800, humans probably had a negligible effect on the availability of roosts for solitary foliage-roosting bats in North America.
In 1800, the U.S. population reached approximately 3 million. Twenty million acres of cropland (5% of the area used today) were required to meet the agricultural demand of the population (Williams, 1989; MacCleery, 1992). The increase in human population and associated clearing of forests for agriculture may have diminished roost resources to an extent that populations of solitary foliage-roosting bats were impacted. However, the greatest rates of forest clearing occurred during the late 1800’s. By 1850, the U.S. population reached 23.3 million and 76 million acres of cropland had been cleared (20% of today’s cropland area; Williams, 1989; MacCleery, 1992).
Although the loss of forests reduced the potential roosting area for lasiurines, the gain of edge habitat created between cultivated areas and adjacent forests may have compensated for some of the negative effects of forest clearing by creating or enhancing foraging habitat (Menzel, 1998). For example, Ohio was 96% forested in 1800; by 1850, it was only 60% forested. By 1900, only 25% of the state remained forested. The forested area in the fertile western side of the state decreased to 4% (MacCleery, 1992). By 1900, the area of cropland across the country had increased to 319 million acres (MacCleery, 1992). The rate of forest clearing for agriculture was slowed in 1920 with the arrival of the boll weevil (Anthonomus
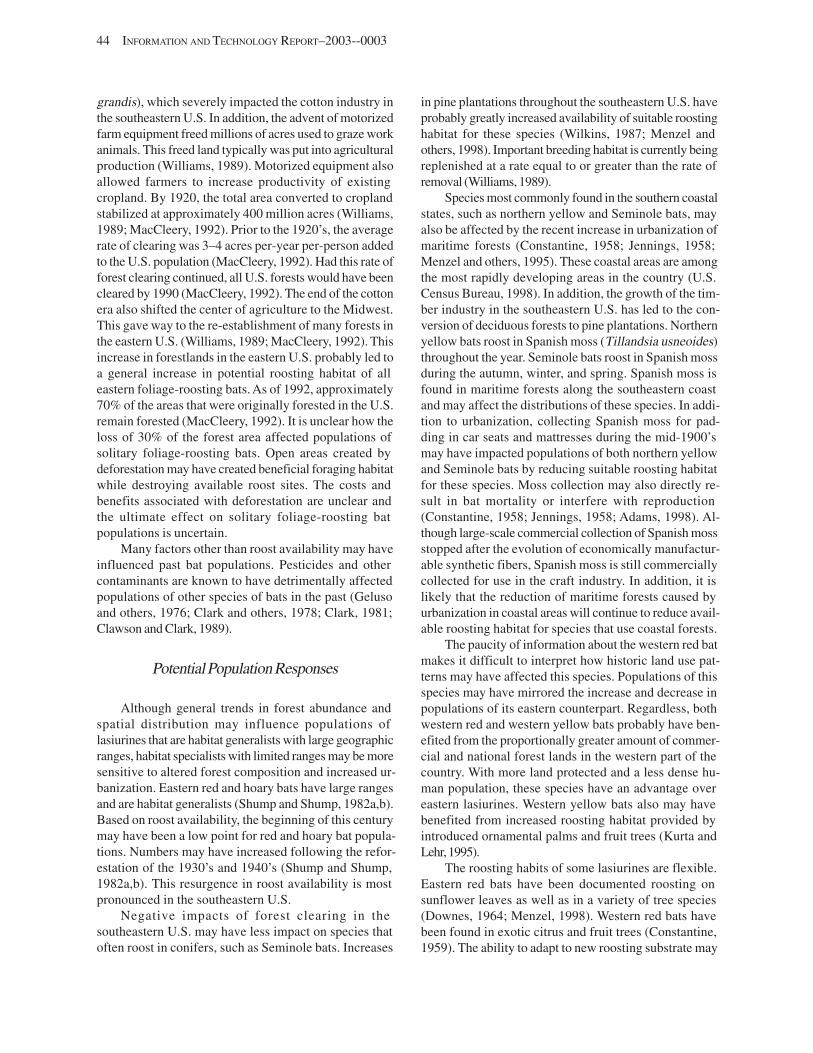
44 INFORMATION AND TECHNOLOGY REPORT–2003--0003
grandis), which severely impacted the cotton industry in the southeastern U.S. In addition, the advent of motorized farm equipment freed millions of acres used to graze work animals. This freed land typically was put into agricultural production (Williams, 1989). Motorized equipment also allowed farmers to increase productivity of existing cropland. By 1920, the total area converted to cropland stabilized at approximately 400 million acres (Williams, 1989; MacCleery, 1992). Prior to the 1920’s, the average rate of clearing was 3–4 acres per-year per-person added to the U.S. population (MacCleery, 1992). Had this rate of forest clearing continued, all U.S. forests would have been cleared by 1990 (MacCleery, 1992). The end of the cotton era also shifted the center of agriculture to the Midwest. This gave way to the re-establishment of many forests in the eastern U.S. (Williams, 1989; MacCleery, 1992). This increase in forestlands in the eastern U.S. probably led to a general increase in potential roosting habitat of all eastern foliage-roosting bats. As of 1992, approximately 70% of the areas that were originally forested in the U.S. remain forested (MacCleery, 1992). It is unclear how the loss of 30% of the forest area affected populations of solitary foliage-roosting bats. Open areas created by deforestation may have created beneficial foraging habitat while destroying available roost sites. The costs and benefits associated with deforestation are unclear and the ultimate effect on solitary foliage-roosting bat populations is uncertain.
Many factors other than roost availability may have influenced past bat populations. Pesticides and other contaminants are known to have detrimentally affected populations of other species of bats in the past (Geluso and others, 1976; Clark and others, 1978; Clark, 1981; Clawson and Clark, 1989).
Potential Population Responses
Although general trends in forest abundance and spatial distribution may influence populations of lasiurines that are habitat generalists with large geographic ranges, habitat specialists with limited ranges may be more sensitive to altered forest composition and increased urbanization. Eastern red and hoary bats have large ranges and are habitat generalists (Shump and Shump, 1982a,b). Based on roost availability, the beginning of this century may have been a low point for red and hoary bat populations. Numbers may have increased following the reforestation of the 1930’s and 1940’s (Shump and Shump, 1982a,b). This resurgence in roost availability is most pronounced in the southeastern U.S.
Negative impacts of forest clearing in the southeastern U.S. may have less impact on species that often roost in conifers, such as Seminole bats. Increases
in pine plantations throughout the southeastern U.S. have probably greatly increased availability of suitable roosting habitat for these species (Wilkins, 1987; Menzel and others, 1998). Important breeding habitat is currently being replenished at a rate equal to or greater than the rate of removal (Williams, 1989).
Species most commonly found in the southern coastal states, such as northern yellow and Seminole bats, may also be affected by the recent increase in urbanization of maritime forests (Constantine, 1958; Jennings, 1958; Menzel and others, 1995). These coastal areas are among the most rapidly developing areas in the country (U.S. Census Bureau, 1998). In addition, the growth of the timber industry in the southeastern U.S. has led to the conversion of deciduous forests to pine plantations. Northern yellow bats roost in Spanish moss (Tillandsia usneoides) throughout the year. Seminole bats roost in Spanish moss during the autumn, winter, and spring. Spanish moss is found in maritime forests along the southeastern coast and may affect the distributions of these species. In addition to urbanization, collecting Spanish moss for padding in car seats and mattresses during the mid-1900’s may have impacted populations of both northern yellow and Seminole bats by reducing suitable roosting habitat for these species. Moss collection may also directly result in bat mortality or interfere with reproduction (Constantine, 1958; Jennings, 1958; Adams, 1998). Although large-scale commercial collection of Spanish moss stopped after the evolution of economically manufacturable synthetic fibers, Spanish moss is still commercially collected for use in the craft industry. In addition, it is likely that the reduction of maritime forests caused by urbanization in coastal areas will continue to reduce available roosting habitat for species that use coastal forests.
The paucity of information about the western red bat makes it difficult to interpret how historic land use patterns may have affected this species. Populations of this species may have mirrored the increase and decrease in populations of its eastern counterpart. Regardless, both western red and western yellow bats probably have benefited from the proportionally greater amount of commercial and national forest lands in the western part of the country. With more land protected and a less dense human population, these species have an advantage over eastern lasiurines. Western yellow bats also may have benefited from increased roosting habitat provided by introduced ornamental palms and fruit trees (Kurta and Lehr, 1995).
The roosting habits of some lasiurines are flexible. Eastern red bats have been documented roosting on sunflower leaves as well as in a variety of tree species (Downes, 1964; Menzel, 1998). Western red bats have been found in exotic citrus and fruit trees (Constantine, 1959). The ability to adapt to new roosting substrate may
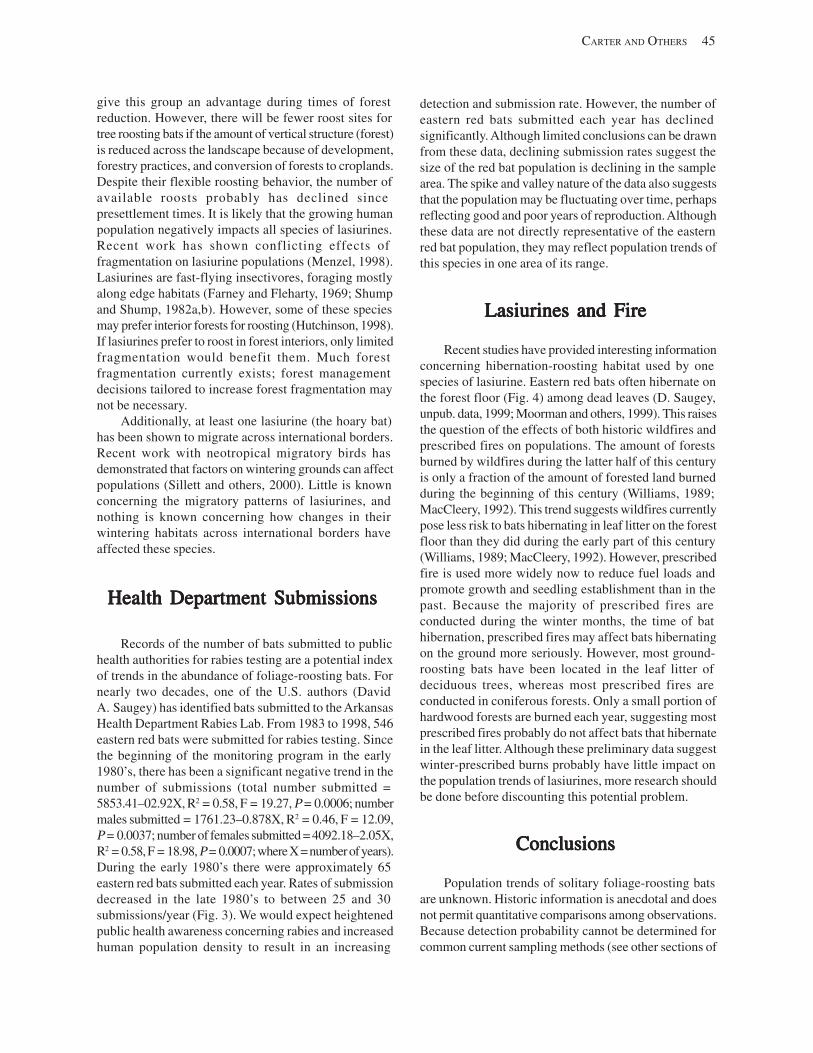
give this group an advantage during times of forest reduction. However, there will be fewer roost sites for tree roosting bats if the amount of vertical structure (forest) is reduced across the landscape because of development, forestry practices, and conversion of forests to croplands. Despite their flexible roosting behavior, the number of available roosts probably has declined since presettlement times. It is likely that the growing human population negatively impacts all species of lasiurines. Recent work has shown conflicting effects of fragmentation on lasiurine populations (Menzel, 1998). Lasiurines are fast-flying insectivores, foraging mostly along edge habitats (Farney and Fleharty, 1969; Shump and Shump, 1982a,b). However, some of these species may prefer interior forests for roosting (Hutchinson, 1998). If lasiurines prefer to roost in forest interiors, only limited fragmentation would benefit them. Much forest fragmentation currently exists; forest management decisions tailored to increase forest fragmentation may not be necessary.
Additionally, at least one lasiurine (the hoary bat) has been shown to migrate across international borders. Recent work with neotropical migratory birds has demonstrated that factors on wintering grounds can affect populations (Sillett and others, 2000). Little is known concerning the migratory patterns of lasiurines, and nothing is known concerning how changes in their wintering habitats across international borders have affected these species.
Health Department SubmissionsHealth Department SubmissionsHealth Department SubmissionsHealth Department SubmissionsHealth Department Submissions
Records of the number of bats submitted to public health authorities for rabies testing are a potential index of trends in the abundance of foliage-roosting bats. For nearly two decades, one of the U.S. authors (David A. Saugey) has identified bats submitted to the Arkansas Health Department Rabies Lab. From 1983 to 1998, 546 eastern red bats were submitted for rabies testing. Since the beginning of the monitoring program in the early 1980’s, there has been a significant negative trend in the number of submissions (total number submitted = 5853.41–02.92X, R2 = 0.58, F = 19.27, P = 0.0006; number males submitted = 1761.23–0.878X, R2 = 0.46, F = 12.09, P = 0.0037; number of females submitted = 4092.18–2.05X, R2 = 0.58, F = 18.98, P = 0.0007; where X = number of years). During the early 1980’s there were approximately 65 eastern red bats submitted each year. Rates of submission decreased in the late 1980’s to between 25 and 30 submissions/year (Fig. 3). We would expect heightened public health awareness concerning rabies and increased human population density to result in an increasing
CARTER AND OTHERS 45
detection and submission rate. However, the number of eastern red bats submitted each year has declined significantly. Although limited conclusions can be drawn from these data, declining submission rates suggest the size of the red bat population is declining in the sample area. The spike and valley nature of the data also suggests that the population may be fluctuating over time, perhaps reflecting good and poor years of reproduction. Although these data are not directly representative of the eastern red bat population, they may reflect population trends of this species in one area of its range.
Lasiurines and FireLasiurines and FireLasiurines and FireLasiurines and FireLasiurines and Fire
Recent studies have provided interesting information concerning hibernation-roosting habitat used by one species of lasiurine. Eastern red bats often hibernate on the forest floor (Fig. 4) among dead leaves (D. Saugey, unpub. data, 1999; Moorman and others, 1999). This raises the question of the effects of both historic wildfires and prescribed fires on populations. The amount of forests burned by wildfires during the latter half of this century is only a fraction of the amount of forested land burned during the beginning of this century (Williams, 1989; MacCleery, 1992). This trend suggests wildfires currently pose less risk to bats hibernating in leaf litter on the forest floor than they did during the early part of this century (Williams, 1989; MacCleery, 1992). However, prescribed fire is used more widely now to reduce fuel loads and promote growth and seedling establishment than in the past. Because the majority of prescribed fires are conducted during the winter months, the time of bat hibernation, prescribed fires may affect bats hibernating on the ground more seriously. However, most ground-roosting bats have been located in the leaf litter of deciduous trees, whereas most prescribed fires are conducted in coniferous forests. Only a small portion of hardwood forests are burned each year, suggesting most prescribed fires probably do not affect bats that hibernate in the leaf litter.Although these preliminary data suggest winter-prescribed burns probably have little impact on the population trends of lasiurines, more research should be done before discounting this potential problem.
ConclusionsConclusionsConclusionsConclusionsConclusions
Population trends of solitary foliage-roosting bats are unknown. Historic information is anecdotal and does not permit quantitative comparisons among observations. Because detection probability cannot be determined for common current sampling methods (see other sections of
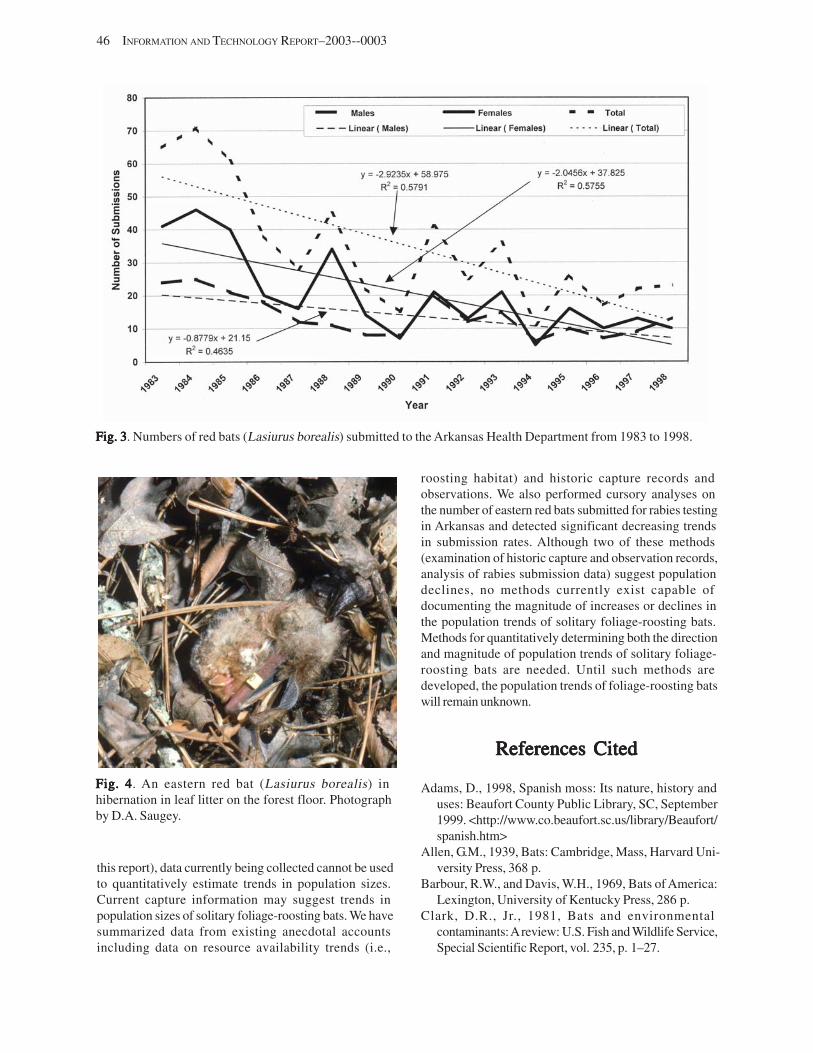
46 INFORMATION AND TECHNOLOGY REPORT–2003--0003
Fig. 3Fig. 3Fig. 3Fig. 3Fig. 3. Numbers of red bats (Lasiurus borealis) submitted to the Arkansas Health Department from 1983 to 1998.
Fig. 4Fig. 4Fig. 4Fig. 4Fig. 4. An eastern red bat (Lasiurus borealis) in hibernation in leaf litter on the forest floor. Photograph by D.A. Saugey.
this report), data currently being collected cannot be used to quantitatively estimate trends in population sizes. Current capture information may suggest trends in population sizes of solitary foliage-roosting bats. We have summarized data from existing anecdotal accounts including data on resource availability trends (i.e.,
roosting habitat) and historic capture records and observations. We also performed cursory analyses on the number of eastern red bats submitted for rabies testing in Arkansas and detected significant decreasing trends in submission rates. Although two of these methods (examination of historic capture and observation records, analysis of rabies submission data) suggest population declines, no methods currently exist capable of documenting the magnitude of increases or declines in the population trends of solitary foliage-roosting bats. Methods for quantitatively determining both the direction and magnitude of population trends of solitary foliage-roosting bats are needed. Until such methods are developed, the population trends of foliage-roosting bats will remain unknown.
References CitedReferences CitedReferences CitedReferences CitedReferences Cited
Adams, D., 1998, Spanish moss: Its nature, history and uses: Beaufort County Public Library, SC, September 1999. <http://www.co.beaufort.sc.us/library/Beaufort/ spanish.htm>
Allen, G.M., 1939, Bats: Cambridge, Mass, Harvard University Press, 368 p.
Barbour, R.W., and Davis, W.H., 1969, Bats of America: Lexington, University of Kentucky Press, 286 p.
Clark, D.R., Jr., 1981, Bats and environmental contaminants: Areview: U.S. Fish and Wildlife Service, Special Scientific Report, vol. 235, p. 1–27.
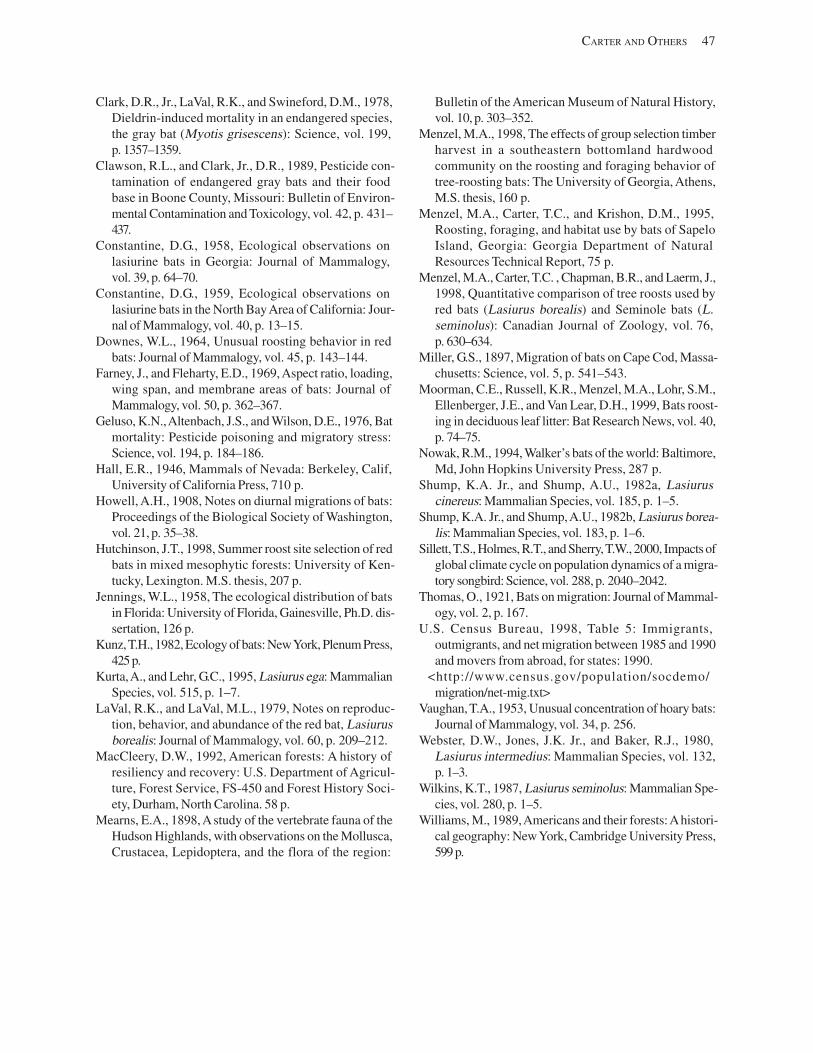
Clark, D.R., Jr., LaVal, R.K., and Swineford, D.M., 1978, Dieldrin-induced mortality in an endangered species, the gray bat (Myotis grisescens): Science, vol. 199, p. 1357–1359.
Clawson, R.L., and Clark, Jr., D.R., 1989, Pesticide contamination of endangered gray bats and their food base in Boone County, Missouri: Bulletin of Environmental Contamination and Toxicology, vol. 42, p. 431– 437.
Constantine, D.G., 1958, Ecological observations on lasiurine bats in Georgia: Journal of Mammalogy, vol. 39, p. 64–70.
Constantine, D.G., 1959, Ecological observations on lasiurine bats in the North Bay Area of California: Journal of Mammalogy, vol. 40, p. 13–15.
Downes, W.L., 1964, Unusual roosting behavior in red bats: Journal of Mammalogy, vol. 45, p. 143–144.
Farney, J., and Fleharty, E.D., 1969, Aspect ratio, loading, wing span, and membrane areas of bats: Journal of Mammalogy, vol. 50, p. 362–367.
Geluso, K.N., Altenbach, J.S., and Wilson, D.E., 1976, Bat mortality: Pesticide poisoning and migratory stress: Science, vol. 194, p. 184–186.
Hall, E.R., 1946, Mammals of Nevada: Berkeley, Calif, University of California Press, 710 p.
Howell, A.H., 1908, Notes on diurnal migrations of bats: Proceedings of the Biological Society of Washington, vol. 21, p. 35–38.
Hutchinson, J.T., 1998, Summer roost site selection of red bats in mixed mesophytic forests: University of Kentucky, Lexington. M.S. thesis, 207 p.
Jennings, W.L., 1958, The ecological distribution of bats in Florida: University of Florida, Gainesville, Ph.D. dissertation, 126 p.
Kunz, T.H., 1982, Ecology of bats: New York, Plenum Press, 425 p.
Kurta, A., and Lehr, G.C., 1995, Lasiurus ega: Mammalian Species, vol. 515, p. 1–7.
LaVal, R.K., and LaVal, M.L., 1979, Notes on reproduction, behavior, and abundance of the red bat, Lasiurus borealis: Journal of Mammalogy, vol. 60, p. 209–212.
MacCleery, D.W., 1992, American forests: A history of resiliency and recovery: U.S. Department of Agriculture, Forest Service, FS-450 and Forest History Society, Durham, North Carolina. 58 p.
Mearns, E.A., 1898, A study of the vertebrate fauna of the Hudson Highlands, with observations on the Mollusca, Crustacea, Lepidoptera, and the flora of the region:
CARTER AND OTHERS 47
Bulletin of the American Museum of Natural History, vol. 10, p. 303–352.
Menzel, M.A., 1998, The effects of group selection timber harvest in a southeastern bottomland hardwood community on the roosting and foraging behavior of tree-roosting bats: The University of Georgia, Athens, M.S. thesis, 160 p.
Menzel, M.A., Carter, T.C., and Krishon, D.M., 1995, Roosting, foraging, and habitat use by bats of Sapelo Island, Georgia: Georgia Department of Natural Resources Technical Report, 75 p.
Menzel, M.A., Carter, T.C. , Chapman, B.R., and Laerm, J., 1998, Quantitative comparison of tree roosts used by red bats (Lasiurus borealis) and Seminole bats (L. seminolus): Canadian Journal of Zoology, vol. 76, p. 630–634.
Miller, G.S., 1897, Migration of bats on Cape Cod, Massachusetts: Science, vol. 5, p. 541–543.
Moorman, C.E., Russell, K.R., Menzel, M.A., Lohr, S.M., Ellenberger, J.E., and Van Lear, D.H., 1999, Bats roosting in deciduous leaf litter: Bat Research News, vol. 40, p. 74–75.
Nowak, R.M., 1994, Walker’s bats of the world: Baltimore, Md, John Hopkins University Press, 287 p.
Shump, K.A. Jr., and Shump, A.U., 1982a, Lasiurus cinereus: Mammalian Species, vol. 185, p. 1–5.
Shump, K.A. Jr., and Shump, A.U., 1982b, Lasiurus borealis: Mammalian Species, vol. 183, p. 1–6.
Sillett, T.S., Holmes, R.T., and Sherry, T.W., 2000, Impacts of global climate cycle on population dynamics of a migratory songbird: Science, vol. 288, p. 2040–2042.
Thomas, O., 1921, Bats on migration: Journal of Mammalogy, vol. 2, p. 167.
U.S. Census Bureau, 1998, Table 5: Immigrants, outmigrants, and net migration between 1985 and 1990 and movers from abroad, for states: 1990.
<http://www.census.gov/population/socdemo/ migration/net-mig.txt>
Vaughan, T.A., 1953, Unusual concentration of hoary bats: Journal of Mammalogy, vol. 34, p. 256.
Webster, D.W., Jones, J.K. Jr., and Baker, R.J., 1980, Lasiurus intermedius: Mammalian Species, vol. 132, p. 1–3.
Wilkins, K.T., 1987, Lasiurus seminolus: Mammalian Species, vol. 280, p. 1–5.
Williams, M., 1989, Americans and their forests: A historical geography: New York, Cambridge University Press, 599 p.

Count Methods and PopulationCount Methods and PopulationCount Methods and PopulationCount Methods and PopulationCount Methods and Population TTTTTrendsrendsrendsrendsrends in Pacific Island Flying Foxesin Pacific Island Flying Foxesin Pacific Island Flying Foxesin Pacific Island Flying Foxesin Pacific Island Flying Foxes
By
Ruth C.B. Utzurrum
Department of Marine and Wildlife Resources P.O. Box 3730
Pago Pago, American Samoa 96799
Gary J. Wiles1
Division of Aquatic and Wildlife Resources 192 Dairy Road
Mangilao, Guam 96923
Anne P. Brooke2
Department of Marine and Wildlife Resources P.O. Box 3730
Pago Pago, American Samoa 96799
and
David J. Worthington3
Division of Fish and Wildlife Department of Lands and Natural Resources
Rota, CNMI 96951 U.S.A.
Abstract. Three species of flying foxes occur in the U.S. Pacific island territories: P. samoensis and Pteropus tonganus in American Samoa, and P. mariannus in the Commonwealth of the Northern Mariana Islands (CNMI) and Guam. Population assessments for these species have been underway for the last 20–25 years, although early efforts often resulted in erroneous estimates. Population abundances of colonial species have been determined primarily through direct counts at colonies or counts of individuals dispersing from colonies. Largely solitary species or populations were sampled primarily diurnally, and indices of abundance were derived from counts. Survey approaches and protocols have undergone historical revisions, precluding long-term statistical analyses of population trends. However, the data have yielded a descriptive profile of temporal trajectories in population sizes. Currently, populations of P. samoensis and P. tonganus in American Samoa are stable after recovering from hunting and successive hurricanes in 1990 and 1991. Populations of P. mariannus in the CNMI (primarily Sarigan Island) and Guam are likewise stable, albeit at levels lower than historically recorded. Although flying foxes in Guam are under federal protection, those in the CNMI are still threatened by hunting. At present, methodological options for monitoring are logistically limited by the unique topographic and geographic properties of island territories. Moreover, behavioral and ecological characteristics of the species do not lend themselves to application of standard population estimation techniques. We summarize the approaches used for monitoring the three species and discuss the relative virtues of each approach.
AbstractAbstractAbstractAbstract
ords: Population estimates, Pteropus, survey methods, U.S. territories.KeyKeyKeyKeyKey WWWWWordsordsordsords
1Current address: 1692 Sunflower Lane, Apt. 19202, Tumwater, WA 98512 2Current address: Guam National Wildlife Refuge, P.O. Box 8134, MOU-3, Dededo, Guam 96929 3Current address: NPS, Capitol Reef National Park, HC 70 Box 15, Torrey, UT 84775
49
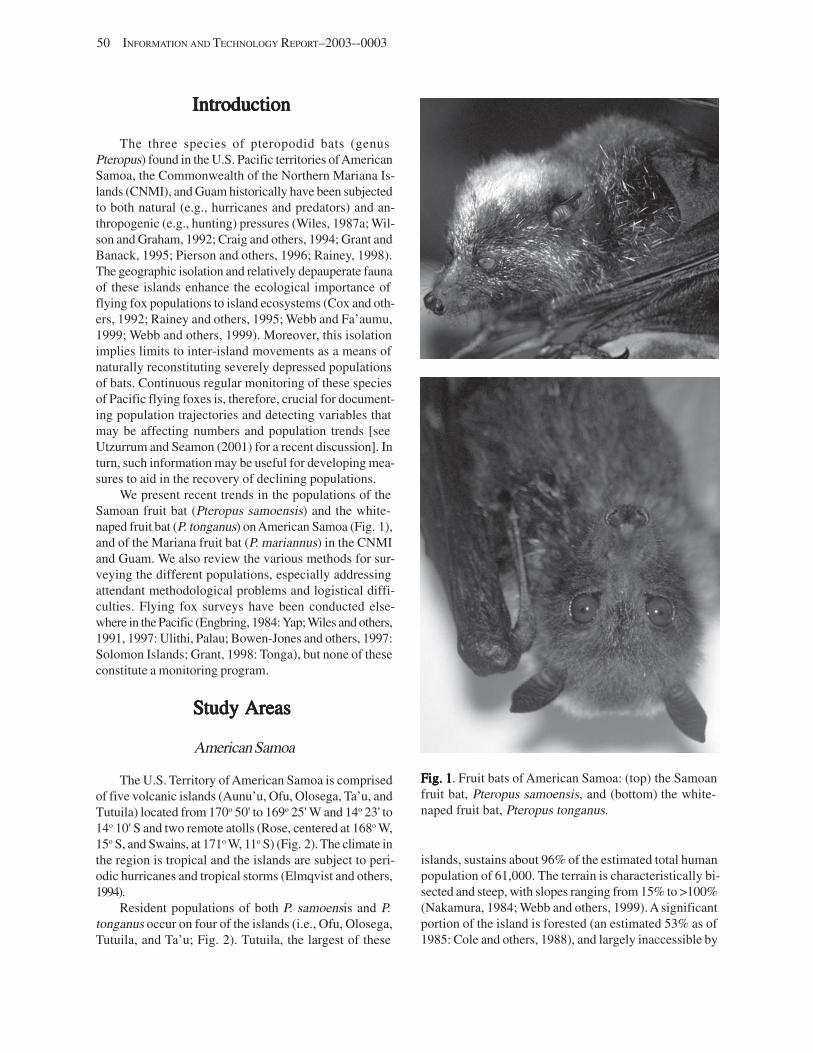
50 INFORMATION AND TECHNOLOGY REPORT–2003--0003
IntroductionIntroductionIntroductionIntroductionIntroduction
The three species of pteropodid bats (genus Pteropus) found in the U.S. Pacific territories of American Samoa, the Commonwealth of the Northern Mariana Islands (CNMI), and Guam historically have been subjected to both natural (e.g., hurricanes and predators) and anthropogenic (e.g., hunting) pressures (Wiles, 1987a; Wilson and Graham, 1992; Craig and others, 1994; Grant and Banack, 1995; Pierson and others, 1996; Rainey, 1998). The geographic isolation and relatively depauperate fauna of these islands enhance the ecological importance of flying fox populations to island ecosystems (Cox and others, 1992; Rainey and others, 1995; Webb and Fa’aumu, 1999; Webb and others, 1999). Moreover, this isolation implies limits to inter-island movements as a means of naturally reconstituting severely depressed populations of bats. Continuous regular monitoring of these species of Pacific flying foxes is, therefore, crucial for documenting population trajectories and detecting variables that may be affecting numbers and population trends [see Utzurrum and Seamon (2001) for a recent discussion]. In turn, such information may be useful for developing measures to aid in the recovery of declining populations.
We present recent trends in the populations of the Samoan fruit bat (Pteropus samoensis) and the whitenaped fruit bat (P. tonganus) on American Samoa (Fig. 1), and of the Mariana fruit bat (P. mariannus) in the CNMI and Guam. We also review the various methods for surveying the different populations, especially addressing attendant methodological problems and logistical difficulties. Flying fox surveys have been conducted elsewhere in the Pacific (Engbring, 1984: Yap; Wiles and others, 1991, 1997: Ulithi, Palau; Bowen-Jones and others, 1997: Solomon Islands; Grant, 1998: Tonga), but none of these constitute a monitoring program.
SSSSStudytudytudytudytudy AreasAreasAreasAreasAreas
American Samoa
The U.S. Territory of American Samoa is comprised of five volcanic islands (Aunu’u, Ofu, Olosega, Ta’u, and Tutuila) located from 170o 50' to 169o 25' W and 14o 23' to 14o 10' S and two remote atolls (Rose, centered at 168o W, 15o S, and Swains, at 171o W, 11o S) (Fig. 2). The climate in the region is tropical and the islands are subject to periodic hurricanes and tropical storms (Elmqvist and others, 1994).
Resident populations of both P. samoensis and P. tonganus occur on four of the islands (i.e., Ofu, Olosega, Tutuila, and Ta’u; Fig. 2). Tutuila, the largest of these
Fig. 1Fig. 1Fig. 1Fig. 1Fig. 1. Fruit bats of American Samoa: (top) the Samoan fruit bat, Pteropus samoensis, and (bottom) the whitenaped fruit bat, Pteropus tonganus.
islands, sustains about 96% of the estimated total human population of 61,000. The terrain is characteristically bisected and steep, with slopes ranging from 15% to >100% (Nakamura, 1984; Webb and others, 1999). A significant portion of the island is forested (an estimated 53% as of 1985: Cole and others, 1988), and largely inaccessible by
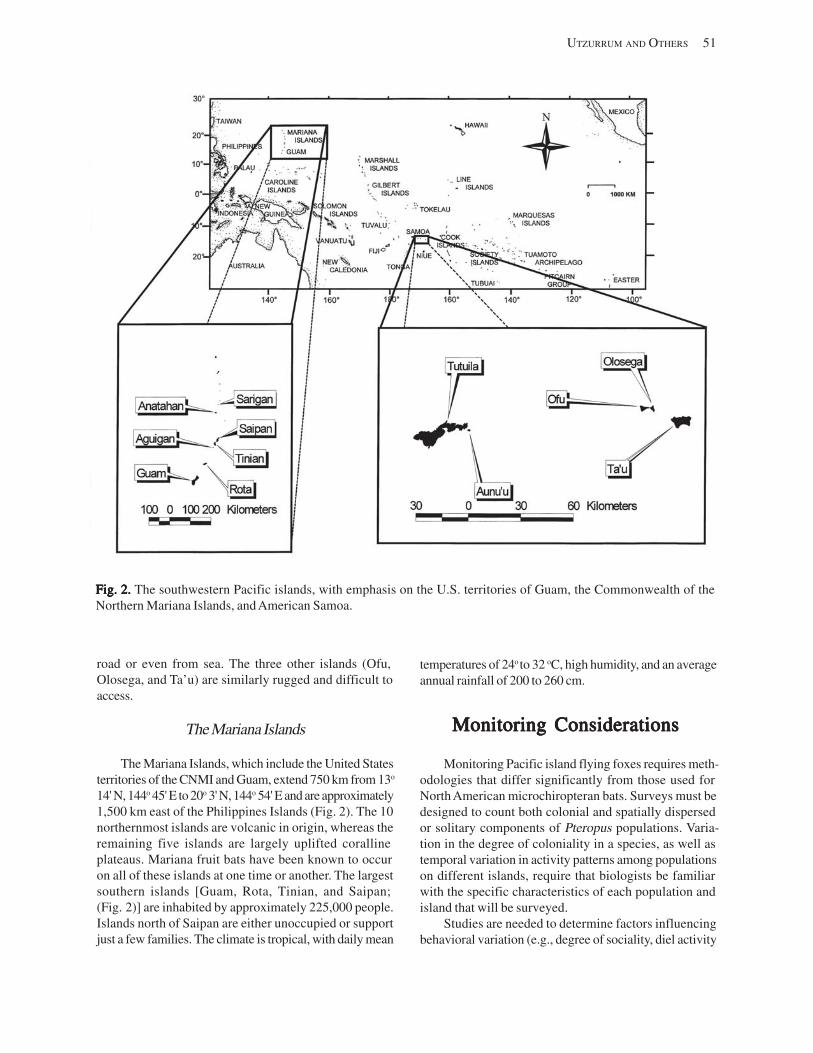
UTZURRUM AND OTHERS 51
Fig. 2.Fig. 2.Fig. 2.Fig. 2.Fig. 2. The southwestern Pacific islands, with emphasis on the U.S. territories of Guam, the Commonwealth of the Northern Mariana Islands, and American Samoa.
road or even from sea. The three other islands (Ofu, Olosega, and Ta’u) are similarly rugged and difficult to access.
The Mariana Islands
The Mariana Islands, which include the United States territories of the CNMI and Guam, extend 750 km from 13o
14' N, 144o 45' E to 20o 3' N, 144o 54' E and are approximately 1,500 km east of the Philippines Islands (Fig. 2). The 10 northernmost islands are volcanic in origin, whereas the remaining five islands are largely uplifted coralline plateaus. Mariana fruit bats have been known to occur on all of these islands at one time or another. The largest southern islands [Guam, Rota, Tinian, and Saipan; (Fig. 2)] are inhabited by approximately 225,000 people. Islands north of Saipan are either unoccupied or support just a few families. The climate is tropical, with daily mean
temperatures of 24oto 32 oC, high humidity, and an average annual rainfall of 200 to 260 cm.
Monitoring ConsiderationsMonitoring ConsiderationsMonitoring ConsiderationsMonitoring ConsiderationsMonitoring Considerations
Monitoring Pacific island flying foxes requires methodologies that differ significantly from those used for North American microchiropteran bats. Surveys must be designed to count both colonial and spatially dispersed or solitary components of Pteropus populations. Variation in the degree of coloniality in a species, as well as temporal variation in activity patterns among populations on different islands, require that biologists be familiar with the specific characteristics of each population and island that will be surveyed.
Studies are needed to determine factors influencing behavioral variation (e.g., degree of sociality, diel activity
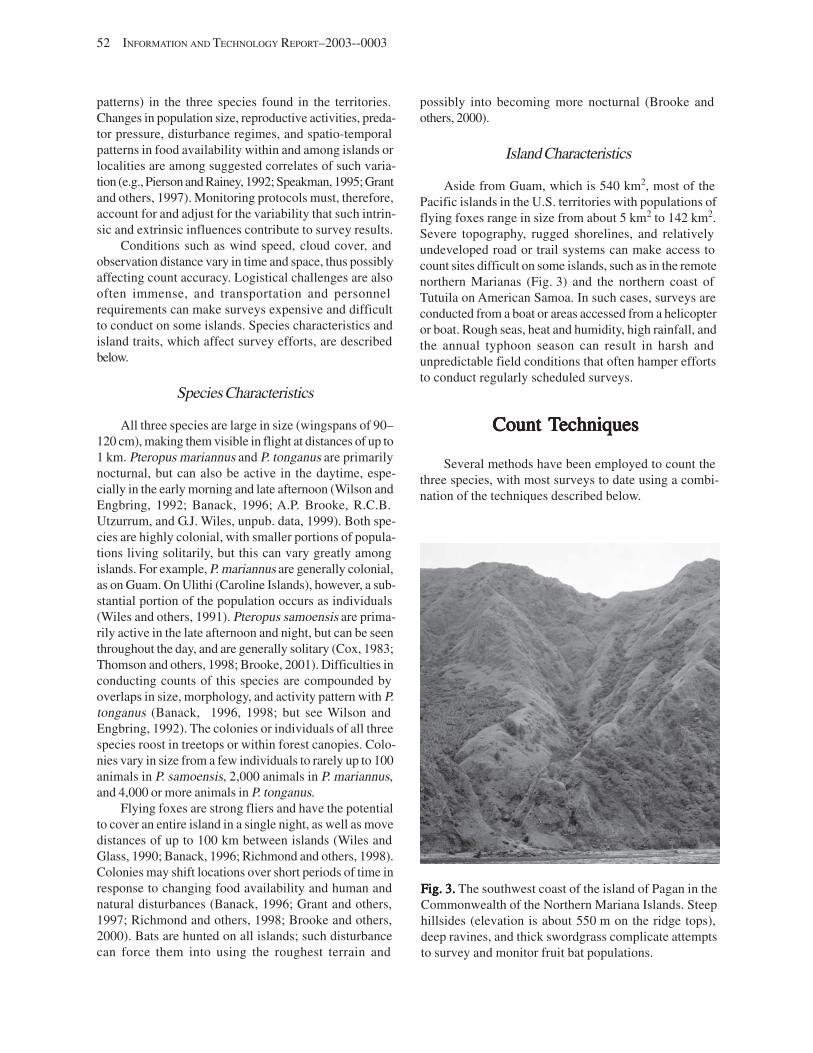
52 INFORMATION AND TECHNOLOGY REPORT–2003--0003
patterns) in the three species found in the territories. Changes in population size, reproductive activities, predator pressure, disturbance regimes, and spatio-temporal patterns in food availability within and among islands or localities are among suggested correlates of such variation (e.g., Pierson and Rainey, 1992; Speakman, 1995; Grant and others, 1997). Monitoring protocols must, therefore, account for and adjust for the variability that such intrinsic and extrinsic influences contribute to survey results.
Conditions such as wind speed, cloud cover, and observation distance vary in time and space, thus possibly affecting count accuracy. Logistical challenges are also often immense, and transportation and personnel requirements can make surveys expensive and difficult to conduct on some islands. Species characteristics and island traits, which affect survey efforts, are described below.
Species Characteristics
All three species are large in size (wingspans of 90– 120 cm), making them visible in flight at distances of up to 1 km. Pteropus mariannus and P. tonganus are primarily nocturnal, but can also be active in the daytime, especially in the early morning and late afternoon (Wilson and Engbring, 1992; Banack, 1996; A.P. Brooke, R.C.B. Utzurrum, and G.J. Wiles, unpub. data, 1999). Both species are highly colonial, with smaller portions of populations living solitarily, but this can vary greatly among islands. For example, P. mariannus are generally colonial, as on Guam. On Ulithi (Caroline Islands), however, a substantial portion of the population occurs as individuals (Wiles and others, 1991). Pteropus samoensis are primarily active in the late afternoon and night, but can be seen throughout the day, and are generally solitary (Cox, 1983; Thomson and others, 1998; Brooke, 2001). Difficulties in conducting counts of this species are compounded by overlaps in size, morphology, and activity pattern with P. tonganus (Banack, 1996, 1998; but see Wilson and Engbring, 1992). The colonies or individuals of all three species roost in treetops or within forest canopies. Colonies vary in size from a few individuals to rarely up to 100 animals in P. samoensis, 2,000 animals in P. mariannus, and 4,000 or more animals in P. tonganus.
Flying foxes are strong fliers and have the potential to cover an entire island in a single night, as well as move distances of up to 100 km between islands (Wiles and Glass, 1990; Banack, 1996; Richmond and others, 1998). Colonies may shift locations over short periods of time in response to changing food availability and human and natural disturbances (Banack, 1996; Grant and others, 1997; Richmond and others, 1998; Brooke and others, 2000). Bats are hunted on all islands; such disturbance can force them into using the roughest terrain and
possibly into becoming more nocturnal (Brooke and others, 2000).
Island Characteristics
Aside from Guam, which is 540 km2, most of the Pacific islands in the U.S. territories with populations of flying foxes range in size from about 5 km2 to 142 km2. Severe topography, rugged shorelines, and relatively undeveloped road or trail systems can make access to count sites difficult on some islands, such as in the remote northern Marianas (Fig. 3) and the northern coast of Tutuila on American Samoa. In such cases, surveys are conducted from a boat or areas accessed from a helicopter or boat. Rough seas, heat and humidity, high rainfall, and the annual typhoon season can result in harsh and unpredictable field conditions that often hamper efforts to conduct regularly scheduled surveys.
CountCountCountCountCount TTTTTechniquesechniquesechniquesechniquesechniques
Several methods have been employed to count the three species, with most surveys to date using a combination of the techniques described below.
Fig. 3.Fig. 3.Fig. 3.Fig. 3.Fig. 3. The southwest coast of the island of Pagan in the Commonwealth of the Northern Mariana Islands. Steep hillsides (elevation is about 550 m on the ridge tops), deep ravines, and thick swordgrass complicate attempts to survey and monitor fruit bat populations.
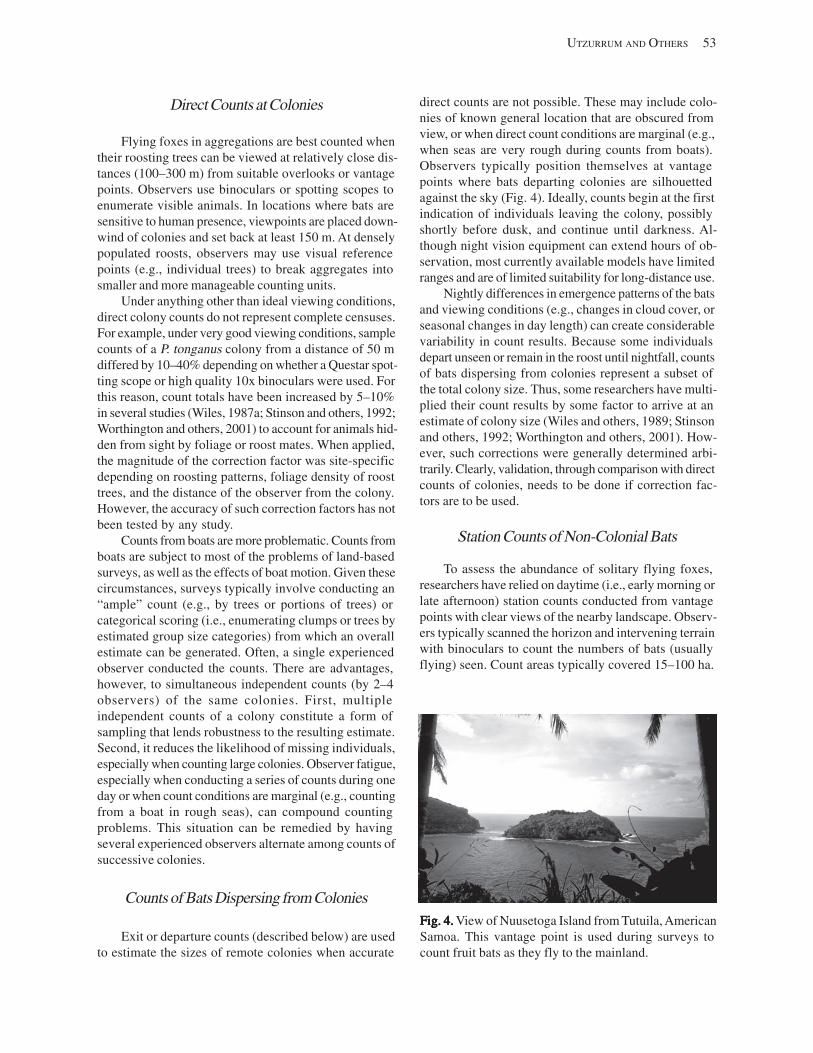
Direct Counts at Colonies
Flying foxes in aggregations are best counted when their roosting trees can be viewed at relatively close distances (100–300 m) from suitable overlooks or vantage points. Observers use binoculars or spotting scopes to enumerate visible animals. In locations where bats are sensitive to human presence, viewpoints are placed downwind of colonies and set back at least 150 m. At densely populated roosts, observers may use visual reference points (e.g., individual trees) to break aggregates into smaller and more manageable counting units.
Under anything other than ideal viewing conditions, direct colony counts do not represent complete censuses. For example, under very good viewing conditions, sample counts of a P. tonganus colony from a distance of 50 m differed by 10–40% depending on whether a Questar spotting scope or high quality 10x binoculars were used. For this reason, count totals have been increased by 5–10% in several studies (Wiles, 1987a; Stinson and others, 1992; Worthington and others, 2001) to account for animals hidden from sight by foliage or roost mates. When applied, the magnitude of the correction factor was site-specific depending on roosting patterns, foliage density of roost trees, and the distance of the observer from the colony. However, the accuracy of such correction factors has not been tested by any study.
Counts from boats are more problematic. Counts from boats are subject to most of the problems of land-based surveys, as well as the effects of boat motion. Given these circumstances, surveys typically involve conducting an “ample” count (e.g., by trees or portions of trees) or categorical scoring (i.e., enumerating clumps or trees by estimated group size categories) from which an overall estimate can be generated. Often, a single experienced observer conducted the counts. There are advantages, however, to simultaneous independent counts (by 2–4 observers) of the same colonies. First, multiple independent counts of a colony constitute a form of sampling that lends robustness to the resulting estimate. Second, it reduces the likelihood of missing individuals, especially when counting large colonies. Observer fatigue, especially when conducting a series of counts during one day or when count conditions are marginal (e.g., counting from a boat in rough seas), can compound counting problems. This situation can be remedied by having several experienced observers alternate among counts of successive colonies.
Counts of Bats Dispersing from Colonies
Exit or departure counts (described below) are used to estimate the sizes of remote colonies when accurate
UTZURRUM AND OTHERS 53
direct counts are not possible. These may include colonies of known general location that are obscured from view, or when direct count conditions are marginal (e.g., when seas are very rough during counts from boats). Observers typically position themselves at vantage points where bats departing colonies are silhouetted against the sky (Fig. 4). Ideally, counts begin at the first indication of individuals leaving the colony, possibly shortly before dusk, and continue until darkness. Although night vision equipment can extend hours of observation, most currently available models have limited ranges and are of limited suitability for long-distance use.
Nightly differences in emergence patterns of the bats and viewing conditions (e.g., changes in cloud cover, or seasonal changes in day length) can create considerable variability in count results. Because some individuals depart unseen or remain in the roost until nightfall, counts of bats dispersing from colonies represent a subset of the total colony size. Thus, some researchers have multiplied their count results by some factor to arrive at an estimate of colony size (Wiles and others, 1989; Stinson and others, 1992; Worthington and others, 2001). However, such corrections were generally determined arbitrarily. Clearly, validation, through comparison with direct counts of colonies, needs to be done if correction factors are to be used.
Station Counts of Non-Colonial Bats
To assess the abundance of solitary flying foxes, researchers have relied on daytime (i.e., early morning or late afternoon) station counts conducted from vantage points with clear views of the nearby landscape. Observers typically scanned the horizon and intervening terrain with binoculars to count the numbers of bats (usually flying) seen. Count areas typically covered 15–100 ha.
Fig. 4.Fig. 4.Fig. 4.Fig. 4.Fig. 4. View of Nuusetoga Island from Tutuila, American Samoa. This vantage point is used during surveys to count fruit bats as they fly to the mainland.
54 INFORMATION AND TECHNOLOGY REPORT–2003--0003
Since 1993, counts in the morning in American Samoa were standardized to start at dawn and continue for 2 hours thereafter (Craig and others, 1994; Brooke, 2001). Late afternoon counts, on the other hand, usually lasted 2 hours and extended until darkness or until dispersing colonial animals began to intermingle with solitary individuals. Results were based on the total number of bats active per unit area per unit time. Numbers obtained were used to index abundance, for example, as the number of bats per km2 per 10 min. Some converted these counts to density estimates for an area or island (e.g., Craig and others, 1994; Brooke, 1997). The estimates were derived on the assumption that bat activity at a counting station was representative of the total number of solitary animals in all similar habitats on an island. The use of indices for population monitoring has been criticized (e.g., Lancia and others, 1994; Link and Sauer, 1998), as has the practice of converting indices to population size estimates (Nichols and Conroy, 1996). However, problems attendant to index methods for detecting trends in abundances are not entirely intractable (Bart and others, 1998; Conroy, 1996).
The diurnal station count (described above) suffers from methodological problems. The difficulty in distinguishing between sympatric P. tonganus and P. samoensis has consistently been a problem in American Samoa, even for experienced observers (Craig, 1992). Additionally, the presence of large numbers of bats increases the likelihood of double-counting the same individuals. Because difficulty in tracking individual bats can increase with count duration, determining an appropriate interval length is important. Finally, some animals may not be active during count periods and can go unrecorded (Brooke, 2001).
Substantial variation in diurnal station counts has been noted in American Samoa. In the past, this problem arose in part from the use of multiple observers of varying degree of expertise spread across multiple (>10) counting sites. Morrell and Craig (1995) conducted a series of randomized counts and concluded that 10 replicated counts (i.e., visits) were needed per site to stabilize mean estimates. No surveys in the Marianas have incorporated such replications.
In American Samoa, changes to the counting protocol for P. samoensis have been made to address some of the conceptual and practical problems discussed above. These include: (1) reducing the number of monitoring sites from >20 to 6; (2) limiting the number of observers to 1–3 competent individuals, often working in tandem; (3) shortening individual count periods from 30 to 10 minutes; (4) increasing the number of count replicates within a survey from a single 30-minute to eight 10-minute counts; and (5) increasing the frequency of surveys from annually to monthly. Because of these changes, statistical
analysis of long-term trends in indices compiled since 1987 is impossible. However, we believe the measures were necessary to reduce variance in counts among observers (changes 1 and 2 above) and within counts (4), to minimize errors in identification (2), to avoid double counting of individuals across space (1), and in time (4), and to account for inter-habitat and intra-annual variation in numbers (1 and 5).
Opposition to the use of indices for monitoring of population changes remains strong (see Workshop Group A report, this volume). Presently, however, these counts constitute the only practical option for monitoring solitary pteropodids in the U.S. Pacific island territories [see Working Group A, Pacific Islands Fruit Bat Subgroup Report in Part II of this volume; Conroy and Nichols (1996) discuss practical limitations in estimating populations in mammals]. The number of survey sites (7), their geographic representation (along an east-west continuum), frequency of sampling (monthly), and intensity of counts (eight 10-minute counts per visit per site) currently employed in P. samoensis surveys suffice for examining population changes across various spatial and temporal scales [see DeSante and Rosenberg (1998) for criteria and a discussion on sampling design and scale].
Variable Circular PlotTechnique
Flying foxes have been counted on one island in the Marianas using the variable circular plot (VCP) technique (Fancy and others, 1999), a method widely used for forest birds. An observer records all bats seen and estimates distances during a standardized time period (usually 8 minutes) at multiple stations along a series of transects. A density estimate is then computed for each habitat using count and distance values. Flying foxes violate several important assumptions of the technique because: (1) animals clumped in colonies are not evenly distributed across the landscape, (2) roosting individuals may frequently go undetected because they rarely vocalize and are less active during the daytime when counts are conducted, and (3) flying individuals may be recorded more than once as they move back and forth through a count area.
PopulationPopulationPopulationPopulationPopulation TTTTTrendsrendsrendsrendsrends
Following is a synopsis of trends in populations of P. mariannus, P. samoensis, and P. tonganus. Accounts are descriptive because changes in survey protocol over the years preclude statistical detection of long-term changes.
American Samoa
Most survey work has been done on the largest island of Tutuila (142 km2), with minimal effort spent in the three islands of the Manu’a group (5–45 km2). Amerson and others (1982) made the first estimates of bat populations in 1975–1976 by converting counts of bats in 0.3 ha survey plots to absolute numbers as follows: total estimated numbers = mean number of bats per 0.3 ha of a specific vegetation type x estimated total area occupied by vegetation type on island. Amerson and others, (1982) did not specify the duration of the counts, and observers did not distinguish between P. tonganus and P. samoensis. Their combined estimates for both species were 75,000 bats on Tutuila and 65,000 bats in the Manu’a Islands, but these were undoubtedly overestimates.
Pteropus samoensis
Projecting a trend in numbers of P. samoensis in American Samoa is impossible because methods used for its survey have undergone numerous changes since counts were conducted in the 1980’s. In most cases, the surveys generate an index of abundance (bats/unit time or bats/unit time/unit area). However, there have been instances when these indices were converted to population estimates as discussed in preceding sections. The following is our attempt to summarize the data available from records at the Department of Marine and Wildlife Resources (DMWR) and from various publications.
In the early 1980’s, Cox (1983) reported extremely low numbers of P. samoensis in American Samoa following limited sightings of bats on Tutuila (a breeding pair) and Ta’u (one individual). Cox and Tuttle (1986) estimated that 300 individuals remained on Tutuila and petitioned the U.S. Fish and Wildlife Service (USFWS) for endangered status. This petition did not receive much local support, but it did result in a memorandum of agreement between the Office of Marine and Wildlife Resources and the U.S. Fish and Wildlife Service to commission systematic surveys. Multiple non-replicated 20- to 30-minute counts were subsequently conducted between 1986 and 1989 by Wilson and Engbring (1992) and by staff of the DMWR of American Samoa. Although no estimates of population size were generated, the survey data were statistically compared among years and results indicated that populations were stable on both Tutuila and Manu’a during this period (Wilson and Engbring, 1992).
The population of P. samoensis on Tutuila declined in the aftermath of two hurricanes in the early 1990’s. Prior to Hurricane Ofa in 1990, the population was estimated at 700 individuals (Pierson and others, 1992).
UTZURRUM AND OTHERS 55
Surveys in 1992 (shortly after Hurricane Val in December 1991) placed the population at 200–400 bats. The decrease in estimated numbers was attributed largely to opportunistic and extensive take of weakened and exposed (due to habitat damage) individuals by hunters (Craig and others, 1994). Since 1995, the estimated number of P. samoensis based on dawn (station) counts on Tutuila has remained roughly the same at about 900 animals (Brooke, 1997). The Manu’a Islands’ collective population was estimated at 100 bats in 1996 (Brooke, 1997). Although station counts using the survey protocol instituted in 1995 have been conducted since 1996 on Tutuila and all three Manu’a islands, the practice of converting the resulting indices to estimates was discontinued. Results from the 1997 to 2000 surveys indicate that: (1) the Tutuila population, based on relative indices (i.e., number of bats sighted per 10 minutes per km2), appears stable at levels found since 1995; and (2) the Manu’a populations remain low, with counts generally averaging less than one bat per 10 minutes at a station (Department of Marine and Wildlife Resources annual reports: 1997–2000).
Pteropus tonganus
Results of direct and indirect counts of colonies of P. tonganus since 1987 on Tutuila are summarized from data compiled in the DMWR and as published in Craig and others (1994), Brooke (1997), and Utzurrum and Seamon (2001) (Table 1). Between 1987–1989, surveys yielded estimates of 12,750–28,000 bats island-wide. An export ban and a seasonal hunting program instituted in 1986 were apparently ineffective and the population appeared to be in slow decline (Craig and others, 1994; Utzurrum and Seamon, 2001). The population declined dramatically in the wake of Hurricane Ofa in 1990 to about 4,500 bats (Craig and others, 1994). It dropped further to about 1,700 bats in early 1992 after Hurricane Val hit the island in December 1991 (Brooke, 1997). An executive order instituting a total hunting ban was enacted shortly thereafter.
Two to four island-wide roost surveys of P. tonganus on Tutuila have been conducted annually since 1992. Counts increased to about 5,000 bats in 1996 (Brooke and others, 2000). Although estimates were lower in the two subsequent years (i.e., 3,265–4,000 bats in 1997 and 1998), the average estimate from surveys in 1999 suggests a population of approximately 6,000 bats (DMWR 1999 annual report).
Single annual surveys of the Manu’a islands (i.e., Ofu, Olosega, and Ta’u) in 1990–1994 gave estimates of 33–390 bats (Department of Marine and Wildlife Resources annual reports). In 1996, two colonial roosts were located and numbers estimated at 1,770 bats (Brooke,
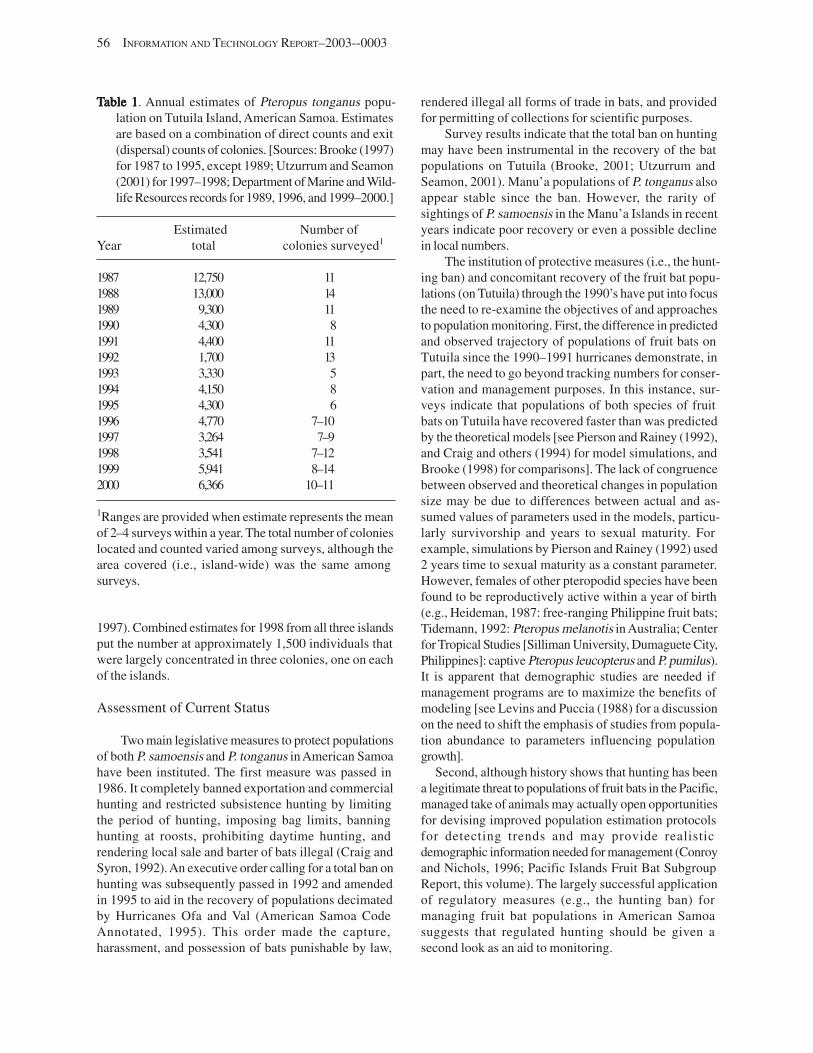
56 INFORMATION AND TECHNOLOGY REPORT–2003--0003
TTTTTable 1able 1able 1able 1able 1. Annual estimates of Pteropus tonganus population on Tutuila Island, American Samoa. Estimates are based on a combination of direct counts and exit (dispersal) counts of colonies. [Sources: Brooke (1997) for 1987 to 1995, except 1989; Utzurrum and Seamon (2001) for 1997–1998; Department of Marine and Wildlife Resources records for 1989, 1996, and 1999–2000.]
Estimated Number of Year total colonies surveyed1
1987 12,750 11 1988 13,000 14 1989 9,300 11 1990 4,300 8 1991 4,400 11 1992 1,700 13 1993 3,330 5 1994 4,150 8 1995 4,300 6 1996 4,770 7–10 1997 3,264 7–9 1998 3,541 7–12 1999 5,941 8–14 2000 6,366 10–11
1Ranges are provided when estimate represents the mean of 2–4 surveys within a year. The total number of colonies located and counted varied among surveys, although the area covered (i.e., island-wide) was the same among surveys.
1997). Combined estimates for 1998 from all three islands put the number at approximately 1,500 individuals that were largely concentrated in three colonies, one on each of the islands.
Assessment of Current Status
Two main legislative measures to protect populations of both P. samoensis and P. tonganus in American Samoa have been instituted. The first measure was passed in 1986. It completely banned exportation and commercial hunting and restricted subsistence hunting by limiting the period of hunting, imposing bag limits, banning hunting at roosts, prohibiting daytime hunting, and rendering local sale and barter of bats illegal (Craig and Syron, 1992). An executive order calling for a total ban on hunting was subsequently passed in 1992 and amended in 1995 to aid in the recovery of populations decimated by Hurricanes Ofa and Val (American Samoa Code Annotated, 1995). This order made the capture, harassment, and possession of bats punishable by law,
rendered illegal all forms of trade in bats, and provided for permitting of collections for scientific purposes.
Survey results indicate that the total ban on hunting may have been instrumental in the recovery of the bat populations on Tutuila (Brooke, 2001; Utzurrum and Seamon, 2001). Manu’a populations of P. tonganus also appear stable since the ban. However, the rarity of sightings of P. samoensis in the Manu’a Islands in recent years indicate poor recovery or even a possible decline in local numbers.
The institution of protective measures (i.e., the hunting ban) and concomitant recovery of the fruit bat populations (on Tutuila) through the 1990’s have put into focus the need to re-examine the objectives of and approaches to population monitoring. First, the difference in predicted and observed trajectory of populations of fruit bats on Tutuila since the 1990–1991 hurricanes demonstrate, in part, the need to go beyond tracking numbers for conservation and management purposes. In this instance, surveys indicate that populations of both species of fruit bats on Tutuila have recovered faster than was predicted by the theoretical models [see Pierson and Rainey (1992), and Craig and others (1994) for model simulations, and Brooke (1998) for comparisons]. The lack of congruence between observed and theoretical changes in population size may be due to differences between actual and assumed values of parameters used in the models, particularly survivorship and years to sexual maturity. For example, simulations by Pierson and Rainey (1992) used 2 years time to sexual maturity as a constant parameter. However, females of other pteropodid species have been found to be reproductively active within a year of birth (e.g., Heideman, 1987: free-ranging Philippine fruit bats; Tidemann, 1992: Pteropus melanotis in Australia; Center for Tropical Studies [Silliman University, Dumaguete City, Philippines]: captive Pteropus leucopterus and P. pumilus). It is apparent that demographic studies are needed if management programs are to maximize the benefits of modeling [see Levins and Puccia (1988) for a discussion on the need to shift the emphasis of studies from population abundance to parameters influencing population growth].
Second, although history shows that hunting has been a legitimate threat to populations of fruit bats in the Pacific, managed take of animals may actually open opportunities for devising improved population estimation protocols for detecting trends and may provide realistic demographic information needed for management (Conroy and Nichols, 1996; Pacific Islands Fruit Bat Subgroup Report, this volume). The largely successful application of regulatory measures (e.g., the hunting ban) for managing fruit bat populations in American Samoa suggests that regulated hunting should be given a second look as an aid to monitoring.
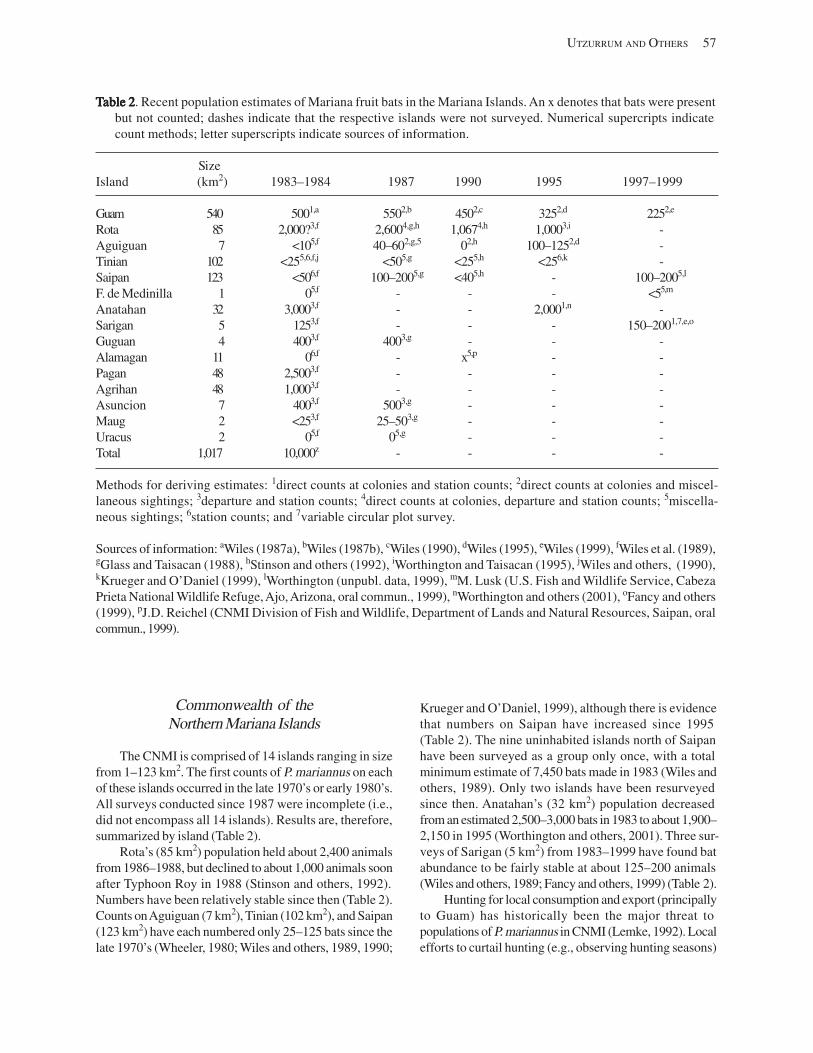
UTZURRUM AND OTHERS 57
TTTTTable 2able 2able 2able 2able 2. Recent population estimates of Mariana fruit bats in the Mariana Islands. An x denotes that bats were present but not counted; dashes indicate that the respective islands were not surveyed. Numerical supercripts indicate count methods; letter superscripts indicate sources of information.
Size Island (km2) 1983–1984 1987 1990 1995 1997–1999
Guam 540 5001,a 5502,b 4502,c 3252,d 2252,e
Rota 85 2,000?3,f 2,6004,g,h 1,0674,h 1,0003,i -Aguiguan 7 <105,f 40–602,g,5 02,h 100–1252,d -Tinian 102 <255,6,f,j <505,g <255,h <256,k -Saipan 123 <506,f 100–2005,g <405,h - 100–2005,l
F. de Medinilla 1 05,f - - - <55,m
Anatahan 32 3,0003,f - 2,0001,n -Sarigan 5 1253,f - - 150–2001,7,e,o
Guguan 4 4003,f 4003,g - - -Alamagan 11 06,f - x5,p - -Pagan 48 2,5003,f - - - -Agrihan 48 1,0003,f - - - -Asuncion 7 4003,f 5003,g - - -Maug 2 <253,f 25–503,g - - -Uracus 2 05,f 05,g - - -Total 1,017 10,000z - - - -
Methods for deriving estimates: 1direct counts at colonies and station counts; 2direct counts at colonies and miscellaneous sightings; 3departure and station counts; 4direct counts at colonies, departure and station counts; 5miscellaneous sightings; 6station counts; and 7variable circular plot survey.
Sources of information: aWiles (1987a), bWiles (1987b), cWiles (1990), dWiles (1995), eWiles (1999), fWiles et al. (1989), gGlass and Taisacan (1988), hStinson and others (1992), iWorthington and Taisacan (1995), jWiles and others, (1990), kKrueger and O’Daniel (1999), lWorthington (unpubl. data, 1999), mM. Lusk (U.S. Fish and Wildlife Service, Cabeza Prieta National Wildlife Refuge, Ajo, Arizona, oral commun., 1999), nWorthington and others (2001), oFancy and others (1999), pJ.D. Reichel (CNMI Division of Fish and Wildlife, Department of Lands and Natural Resources, Saipan, oral commun., 1999).
Commonwealth of the Krueger and O’Daniel, 1999), although there is evidence Northern Mariana Islands that numbers on Saipan have increased since 1995
(Table 2). The nine uninhabited islands north of Saipan The CNMI is comprised of 14 islands ranging in size have been surveyed as a group only once, with a total
from 1–123 km2. The first counts of P. mariannus on each minimum estimate of 7,450 bats made in 1983 (Wiles and of these islands occurred in the late 1970’s or early 1980’s. others, 1989). Only two islands have been resurveyed All surveys conducted since 1987 were incomplete (i.e., since then. Anatahan’s (32 km2) population decreased did not encompass all 14 islands). Results are, therefore, from an estimated 2,500–3,000 bats in 1983 to about 1,900– summarized by island (Table 2). 2,150 in 1995 (Worthington and others, 2001). Three sur
Rota’s (85 km2) population held about 2,400 animals veys of Sarigan (5 km2) from 1983–1999 have found bat from 1986–1988, but declined to about 1,000 animals soon abundance to be fairly stable at about 125–200 animals after Typhoon Roy in 1988 (Stinson and others, 1992). (Wiles and others, 1989; Fancy and others, 1999) (Table 2). Numbers have been relatively stable since then (Table 2). Hunting for local consumption and export (principally Counts on Aguiguan (7 km2), Tinian (102 km2), and Saipan to Guam) has historically been the major threat to (123 km2) have each numbered only 25–125 bats since the populations of P. mariannus in CNMI (Lemke, 1992). Local late 1970’s (Wheeler, 1980; Wiles and others, 1989, 1990; efforts to curtail hunting (e.g., observing hunting seasons)
58 INFORMATION AND TECHNOLOGY REPORT–2003--0003
were instituted independently by some islands in the early 1970’s but enforcement of regulations was poor. Anominal territory-wide hunting moratorium (1 year for islands north of Saipan and 2 years for the remaining southern islands) enacted in 1977 has since been regularly reauthorized (Lemke, 1992), but illegal hunting continues to be the most serious threat to local bat populations. Commercial trade of bats declined when the P. mariannus population on Guam gained endangered status in the 1980’s (see following section). However, illegal exportation to Guam is believed to continue. Local (CNMI) and regional (e.g., Guam) statutes constitute the only protective measures presently in effect. It is uncertain whether these measures are sufficient to stave off further decline and/or stimulate recovery of decimated populations. A formal proposal to list fruit bat populations on CNMI as threatened (U.S. Fish and Wildlife Service, 1998) needs to progress beyond the “proposed” stage. Official listing of this species could have a salutary effect on populations of P. mariannus by enabling additional funding and creating a more favorable climate for protection and conservation enforcement.
Guam
Woodside (1958) estimated that a maximum of 3,000 P. mariannus remained on Guam (540 km2) in the late 1950’s. Although it was unclear how this estimate was derived, it was assumed that it was based in part on direct counts at colonies. Bat abundance declined greatly through the late 1970’s, when less than 50 bats were estimated for the entire island and no colonies were known (Wheeler and Aguon, 1978). A colony of 200–300 bats reappeared in northern Guam in 1980 and increased to about 800 bats by 1982 (Wiles, 1987a). Since the late 1980’s, it has typically held 150–350 bats during most months of the year, with numbers increasing by 100–600 bats during the winter months due to apparent migration from Rota 60 km to the north (Wiles and others, 1995). Guam’s population also contains small numbers (50–75) of solitary animals scattered throughout the island.
Hunting was the primary cause of historical declines in the numbers of P. mariannus on Guam. Hence, this local population was placed on the endangered species list, first under local statutes in 1981 and then under the U.S. Endangered Species Act in 1984 (Lemke, 1992). Recent surveys indicate that the population remains small (Table 2). Extreme predation on juvenile bats by introduced brown tree snakes (Boiga irregularis) is believed to be the major problem preventing recovery of the population (Wiles, 1987a).
ConclusionsConclusionsConclusionsConclusionsConclusions
Effective conservation and management of populations of flying foxes in the U.S. territories depend in part on the availability of reliable estimates or indices of population sizes.Analysis of much of the data collected has been confounded by methods that fail to account for temporal and spatial factors that influence population sizes both seasonally and circ-annually. There are inherent difficulties posed by surveying species that are primarily nocturnal, behaviorally and ecologically complex, and occur in unpredictable and rugged environments. These multi-faceted constraints on surveys have resulted (albeit primarily out of necessity) in the use of sundry counting and survey methods, thus hampering accurate assessment of population trends. However, it is possible to design efficacious protocols that can generate data that are comparable over time and that permit statistical analysis. Recommendations for achieving more standardized protocols for counts and for the field evaluation of the applicability of true estimation techniques (e.g., distance sampling) are discussed in greater detail in the Pacific islands fruit bat subgroup report of Working Group A in Part II of this volume.
AcknowledgmentsAcknowledgmentsAcknowledgmentsAcknowledgmentsAcknowledgments
Studies on flying foxes inAmerican Samoa, the CNMI, and Guam are funded by the Federal Aid to Wildlife Restoration Act through the U.S. Fish and Wildlife Service. A.P. Brooke and R.C.B. Utzurrum recognize the effort of various visiting researchers (P.A. Cox, J. Engbring, E.D. Pierson, W.E. Rainey, and D.E. Wilson among others) and of staff at the Department of Marine and Wildlife Resources (including P. Craig, S. Fa’aumu, G. Grant, T. Morrell, W. Syron, P. Trail, and A. Tualaulelei) for compiling counts of P. samoensis and P. tonganus in American Samoa prior to 1995. In the Mariana Islands, we acknowledge the previous efforts of E. Taisacan, P. Glass, T. Lemke, D. Stinson, and M. Wheeler.
References CitedReferences CitedReferences CitedReferences CitedReferences Cited
American Samoa Code Annotated, 1995, A.S.C.A. 24.08, A rule to regulate hunting by adding Chapter 08 to Title 24 of the American Samoa Administrative Code: Pago Pago, American Samoa.
Amerson, Jr., A.B., Whistler,W.A., and Schwaner,T.D., 1982, Wildlife and wildlife habitat of American Samoa (2 vols.): Washington, D.C., U.S. Fish and Wildlife Service.
Banack, S.A., 1996, Flying foxes, genus Pteropus, in the Samoan Islands: Interactions with forest communities: University of California, Berkeley, Ph.D. dissertation, 281 p.
Banack, S.A., 1998, Diet selection and resource use by flying foxes (Genus Pteropus): Ecology, vol. 79, p. 1949–1967.
Bart, J., Fligner, M.A., and Notz, W.I., 1998, Sampling and statistical methods for behavioral ecologists: Cambridge, United Kingdom, Cambridge University Press, xii + 330 p.
Bowen-Jones, E., Abrutat, D., Markham, D., and Bowe, S., 1997, Flying foxes on Choiseul (Solomon Islands)--the needed conservation action: Oryx, vol. 31, p. 209–217.
Brooke, A.P., 1997, Fruit bat studies: Pteropus samoensis and Pteropus tonganus 1995–1996: A report to the Department of Marine and Wildlife Resources, Pago Pago, American Samoa, 64 p.
Brooke, A.P., 1998, Biology of the flying foxes in American Samoa: Pteropus samoensis and Pteropus tonganus: A report to the U.S. National Park of American Samoa, 61 p.
Brooke, A.P., 2001, Population status and behaviours of the Samoa flying fox, Pteropus samoensis, on Tutuila Island, American Samoa: Journal of Zoology, vol. 254, p. 309–319.
Brooke, A.P., Solek, C., and Tualaulelei, A., 2000, Roosting behavior of colonial and solitary flying foxes in American Samoa (Chiroptera: Pteropodidae): Biotropica, vol. 32, p. 338–350.
Cole, T.G., Whitesell, C.D., Whistler, W.A., McKay, N., and Ambacher, A.H., 1988, Vegetation survey and forest inventory, American Samoa: U.S. Forest Service, Resource Bulletin PSW-25.
Conroy, M.J., 1996, Techniques for estimating abundance and species richness: Abundance indices, in Wilson, D.E., Cole, F.R., Nichols, J.D., Rudran, R., and Foster, M.S., eds., Measuring and monitoring biological diversity, standard methods for mammals: Smithsonian Institution Press, Washington and London, p. 179–192.
Conroy, M.J., and Nichols, J.D., 1996, Techniques for estimating abundance and species richness: Recommendations, in Wilson, D.E., Cole, F.R., Nichols, J.D., Rudran, R., and Foster, M.S., eds., Measuring and monitoring biological diversity: Standard methods for mammals: Washington and London, Smithsonian Institution Press, p.226.
UTZURRUM AND OTHERS 59
Cox, P.A., 1983, Observations on the natural history of Samoan bats: Mammalia, vol. 47, p. 519–523.
Cox, P.A., and Tuttle, M.D., 1986, Report to the Governor: Pago Pago, American Samoa.
Cox, P.A., Elmqvist, T., Pierson, E.D., and Rainey, W.E., 1992, Flying foxes as pollinators and seed dispersers in Pacific island ecosystems, in Wilson, D.E., and Graham, G.L., eds., Pacific Island flying foxes: Proceedings of an international conservation conference: U.S. Fish and Wildlife Service, Biological Report 90(23), p. 18–23.
Craig, P., 1992, Species identification problems during fruit bat surveys in American Samoa: Department of Marine and Wildlife Resources, Biological Report 25.
Craig, P., and Syron, W., 1992, Fruit bats in American Samoa: Their status and future, in Wilson, D.E., and Graham, G.L., eds., Pacific Island flying foxes: Proceedings of an international conservation conference: U.S. Fish and Wildlife Service, Biological Report 90(23), p. 145–149.
Craig, P., Trail, P., and Morrell, T.E., 1994, The decline of fruit bats in American Samoa due to hurricanes and overhunting: Biological Conservation, vol. 69, p. 261– 266.
DeSante, D.F., and Rosenberg, D.K., 1998, What do we need to monitor in order to manage land birds?, in Marzluff, J.M., and Sallabanks, R., eds., Avian conservation, research and management: Washington, D.C., Island Press, p. 93–106.
Elmqvist, T., Rainey, W.E., Pierson, E.D., and Cox, P.A., 1994, Effects of tropical cyclones Ofa and Val on the structure of a Samoan lowland rain forest: Biotropica, vol. 28, p. 142–158.
Engbring, J., 1984, A 1984 survey of the fruit bat (maga’lau) on Yap: U.S. Fish and Wildlife Service, Honolulu, Hawaii.
Fancy, S.G., Craig, R.J., and Kessler, C.W., 1999, Forest bird and fruit bat populations on Sarigan, Mariana Islands: Micronesica, vol. 31, p. 247–254.
Glass, P.O., and Taisacan, E., 1988, Marianas fruit bat surveys and research, in Division of Fish and Wildlife, Five-year progress report (Fiscal Years 1983–1987): Pittman-Robertson Federal Aid in Wildlife Restoration Program, Saipan, Commonwealth of the Northern Mariana Islands, p. 1–22.
Grant, G.S. 1998, Population status of Pteropus tonganus in Tonga: Atoll Research Bulletin, vol. 454, p. 1–13.
Grant, G.S., and S.A. Banack, 1995, Predation on Pteropus tonganus by a barn owl in American Samoa: Australian Mammalogy, vol. 18, p. 77–78.
60 INFORMATION AND TECHNOLOGY REPORT–2003--0003
Grant, G.S., Craig, P., and Trail, P., 1997, Cyclone induced shift in foraging behavior of flying foxes in American Samoa: Biotropica, vol. 29, p. 224–228.
Heideman, P.D., 1987, The reproductive ecology of a community of Philippine fruit bats (Pteropodidae. Megachiroptera): University of Michigan, Ann Arbor, Ph.D. thesis, 348 p.
Krueger, S., and O’Daniel, D., 1999, Observations of Mariana fruit bats on Tinian: Micronesica vol. 31, p. 367–371.
Lancia, R.A., Nichols, J.D., and Pollock, K.H., 1994, Estimating the number of animals in wildlife populations, in Bookhout, T.A., ed., Research and management techniques for wildlife and habitats, (5th ed.), Bethesda, Md, USA: Wildlife Society, p. 215–253.
Lemke, T.O., 1992, History of fruit bat use, research, and protection in the Northern Mariana Islands, in Wilson, D.E. and Graham, G.L., eds., Pacific Island flying foxes, Proceedings of an international conservation conference: U.S. Fish and Wildlife Service, Biological Report 90(23), p. 135–142.
Levins, R., and Puccia, C.J., 1988, The controlling factor in biological communities: Coenoses, vol. 3, p. 149–154.
Link, W.A., and Sauer, J.R., 1998, Estimating population change from count data: Application to the North American breeding bird survey: Ecological Applications, vol. 8, p. 258–268.
Morrell, T.E., and Craig, P., 1995, Temporal variation in fruit bats observed during daytime surveys in American Samoa: Wildlife Society Bulletin, vol. 23, p. 36–40.
Nakamura, S., 1984, Soil survey of American Samoa: Washington, D.C., U.S. Department of Agriculture, Soil Conservation Service, 95 p.
Nichols, J.D., and Conroy, M.J., 1996, Techniques for estimating abundance and species richness: Introduction, in Wilson, D.E., Cole, F.R., Nichols, J.D., Rudran, R., and Foster, M.S., eds., Measuring and monitoring biological diversity, Standard methods for mammals: Washington and London, Smithsonian Institution Press, p. 177–179.
Pierson, E.D., Elmqvist, T., and Cox, P.A., 1992, The effects of Cyclone Val on areas proposed for inclusion in the National Park of American Samoa: A report to the U.S. National Park Service, Pago Pago, 35 p.
Pierson, E.D., Elmqvist, T., Rainey, W.E., and Cox, P.A., 1996, Effects of cyclonic storms on flying fox populations on the South Pacific islands of Samoa: Conservation Biology, vol. 10, p. 438–451.
Pierson, E.D., and Rainey, W.E., 1992, The biology of flying foxes of the Genus Pteropus: Areview, in Wilson, D.E. and Graham, G.L., eds., Pacific Island flying foxes, Proceedings of an international conservation conference: U.S. Fish and Wildlife Service, Biological Report 90(23), p. 1–17.
Rainey, W.E., 1998, Conservation of bats on remote Indo-Pacific islands, in Kunz, T.H. and Racey, P.A., eds., Bat biology and conservation: Washington, D.C., Smithsonian Institution Press, p. 326–341.
Rainey, W.E., Pierson, E.D., Elmqvist, T.H., and Cox, P.A., 1995, The role of flying foxes (Pteropodidae) in oceanic island ecosystems of the Pacific, in Racey, P.A. and Swift, S.M., eds., Ecology, evolution, and behaviour of bats: Symposia of the Zoological Society of London No. 67, Clarendon Press, Oxford, p. 47– 62.
Richmond, J.Q., Banack, S.A., and Grant, G.S., 1998, Comparative analysis of wing morphology, flight behaviour, and habitat use in flying foxes (Genus: Pteropus): Australian Journal of Zoology, vol. 46, p. 283–289.
Speakman, J.R., 1995, Chiropteran nocturnality, in Racey, P.A. and Swift, S.M., eds., Ecology, evolution and behaviour of bats: Symposia of the Zoological Society of London No. 67, Oxford, Clarendon Press, p. 187– 201.
Stinson, D.W., Glass, P.O., and Taisacan, E.M., 1992, Declines and trade in fruit bats on Saipan, Tinian, Aguijan, and Rota, in Wilson, D.E., and Graham, G.L., eds., Pacific Island flying foxes, Proceedings of an international conservation conference: U.S. Fish and Wildlife Service, Biological Report 90(23), p. 61–67.
Tidemann, C., 1992, Pteropus melanotus, in Mickleburgh, S.P., Huston, A.M., and Racey, P.A., eds., Old World fruit bats, an action plan for their conservation: Gland, Switzerland, IUCN, p. 115–117.
Thomson, S.W., Brooke, A.P., and Speakman, J.R., 1998, Diurnal activity in the Samoan flying fox, Pteropus samoensis: Philosophical Transactions of the Royal Society, London, vol. 353, p. 1595–1606.
U.S. Fish and Wildlife Service, 1998, Endangered and threatened wildlife and plants: Proposed reclassification from endangered to threatened status for the Mariana fruit bat from Guam, and proposed threatened status for the Mariana fruit bat from the Commonwealth of the Northern Mariana Islands: Federal Register, vol. 63, issue 58, p. 14641–14650.
Utzurrum, R.C.B., and Seamon, J.O., 2001, Monitoring for conservation and management: Some empirical and theoretical approaches, Sylvatrop: The Technical Journal of Ecosystems and Natural Resources, vol. 10, p. 88–105.
Webb, E.L., and Fa’aumu, S., 1999, Diversity and structure of tropical rain forest of Tutuila, American Samoa, Effects of site age and substrate: Plant Ecology, vol. 44, p. 257–274.
Webb, E.L., Stanfield, B.J., and Jensen, M.L., 1999, Effects of topography on rain forest tree community structure and diversity in American Samoa, and implications for
UTZURRUM AND OTHERS 61
frugivore and nectarivore populations: Journal of Biogeography, vol. 26, p. 887–897.
Wheeler, M.E., 1980, The status of the Marianas fruit bat on Saipan, Tinian, and Rota: ‘Elepaio, vol. 40, p. 109– 113.
Wheeler, M.E., and Aguon, C.F., 1978, The current status and distribution of the Mariana fruit bat on Guam, Agana: Division of Aquatic and Wildlife Resources Technical Report, No. 1, 29 p.
Wiles, G.J., 1987a, The status of fruit bats on Guam: Pacific Science, vol. 41, p. 148–157.
Wiles, G.J., 1987b, Natural history, biology, and habitat protection for the Marianas fruit bat, in Division of Aquatic and Wildlife Resources Annual Report (Fiscal Year 1987): Guam Department of Agriculture, Mangilao, p. 124–135.
Wiles, G.J., 1990, Natural history, biology, and habitat protection for the Marianas fruit bat, in Division of Aquatic and Wildlife Resources Annual Report (Fiscal Year 1990): Guam Department of Agriculture, Mangilao, p. 136–144.
Wiles, G.J., 1995, Natural history, biology, and habitat protection for the Mariana fruit bat, in Division of Aquatic and Wildlife Resources Annual Report (Fiscal Year 1995), Guam Department of Agriculture, Mangilao, Guam, p. 91–97.
Wiles, G.J., 1999, Current status, distribution, and habitat protection for Mariana fruit bats, in Division of Aquatic and Wildlife Resources Annual Report (Fiscal Year 1999): Guam Department of Agriculture, Mangilao, p. 110–122.
Wiles, G.J., and Glass, P.O., 1990, Interisland movements of fruit bats (Pteropus mariannus) in the Mariana Islands: Atoll Research Bulletin, vol. 343, p. 1–6.
Wiles, G.J., Engbring, J., and Falanrus, M.V.C., 1991, Population status and natural history of Pteropus mariannus
on Ulithi Atoll, Caroline Islands: Pacific Science, vol. 45, issue 1, p. 76–84.
Wiles, G.J., Engbring, J., and Otobed, D., 1997, Abundance, biology, and human exploitation of bats in the Palau Islands: Journal of Zoology, vol. 241, p. 203–227.
Wiles, G.J., Amerson, Jr., A.B., and Beck, R.E. Jr., 1990, The mammals of Tinian, Mariana Islands: Micronesica, vol. 23, p. 167–180.
Wiles, G.J., Lemke, T.O., and Payne, N.H., 1989, Population estimates of fruit bats (Pteropus mariannus) in the Mariana Islands: Conservation Biology, vol. 3, p. 66– 76.
Wiles, G.J., Aguon, C.F., Davis, G.W., and Grout, D.J., 1995, The status and distribution of endangered animals and plants in northern Guam: Micronesica, vol. 28, p. 31–49.
Wilson, D.E., and J. Engbring, 1992, The flying foxes Pteropus samoensis and Pteropus tonganus: Status in Fiji and Samoa, in Wilson, D.E. and Graham, G.L., eds., Pacific Island flying foxes, Proceedings of an international conservation conference: U.S. Fish and Wildlife Service, Biological Report 90(23), p. 74–101.
Wilson, D.E., and Graham, G.L., eds., 1992, Pacific Island flying foxes, Proceedings of an international conservation conference: U.S. Fish and Wildlife Service, Biological Report 90(23).
Worthington, D.J., and Taisacan, E.M., 1995, Fruit bat research, in Division of Fish and Wildlife Annual Report (Fiscal Year 1995): CNMI Department of Lands and Natural Resources, Saipan, p. 6–17.
Worthington, D.J., Marshall, A.P., Wiles, G.J., and Kessler, C.C., 2001, Abundance and management of Mariana fruit bats and feral ungulates on Anatahan, Mariana Islands: Pacific Conservation Biology, vol. 7, p. 134– 142.
Woodside, D.H., 1958, Fish and wildlife investigation: A report to the Department of Agriculture, Agana, Guam.

Current Status of Pollinating BatsCurrent Status of Pollinating BatsCurrent Status of Pollinating BatsCurrent Status of Pollinating BatsCurrent Status of Pollinating Bats in Southwestern Northin Southwestern Northin Southwestern Northin Southwestern Northin Southwestern North AmericaAmericaAmericaAmericaAmerica
By
Theodore H. Fleming1
Tim Tibbitts2
Yar Petryszyn3
and
Virginia Dalton4
Abstract. Three species of phyllostomid bats, Leptonycteris curasoae, L. nivalis, and Choeronycteris mexicana, are important pollinators of columnar cacti and paniculate agaves in parts of the arid Southwest. Presumed population declines in both species of Leptonycteris during the 1960’s and 1970’s resulted in their being declared “endangered” in 1988. Since then, considerable effort has gone into documenting population trends in L. curasoae in Arizona and Sonora, Mexico. We conducted annual exit censuses at one cave and two mines in southern Arizona and at two caves in Sonora. Census data indicate that although roost sizes vary from year to year, there is no evidence of a secular population decline in this species in the northern part of its range. Data further indicate that the size of northern populations of L. curasoae is much larger (by at least two orders of magnitude) than indicated by U.S. Fish and Wildlife Service (USFWS) surveys in the early 1980’s. Far less information is available for the other two species. We recommend that systematic surveys of sites known to harbor L. nivalis and C. mexicana in the United States (U.S.) be conducted annually.
AbstractAbstractAbstractAbstract
KeyKeyKeyKeyKey WWWWWordsordsordsordsords: Choeronycteris, columnar cacti, Leptonycteris, paniculate agaves.
IntroductionIntroductionIntroductionIntroductionIntroduction
Except for three species of nectar-feeding bats whose evolutionary affinities are clearly tropical, the bat fauna of the United States (U.S.) is dominated by insectivores. The three plant visitors include the lesser long-nosed bat, Leptonycteris curasoae; the greater long-nosed bat, L. nivalis; and the Mexican long-tongued bat, Choeronycteris mexicana (Phyllostomidae, Glossophaginae). These species are seasonal migrants into southern Arizona (L. curasoae, C. mexicana); southwestern New Mexico (L. curasoae, L. nivalis, C. mexicana); and southwestern Texas (L. nivalis) from Mexico. While in the northern parts of their ranges,
they visit and pollinate flowers of columnar cacti in the Sonoran Desert (L. curasoae) and flowers of paniculate agaves at higher elevations in Arizona (L. curasoae, C. mexicana); New Mexico (all three species); and Texas (L. nivalis). Leptonycteris curasoae also eats fruit pulp and ingests seeds of columnar cacti. Two species, L. curasoae and C. mexicana, form maternity roosts in Arizona in the spring; maternity roosts of L. nivalis are unknown in the U.S.
Except for L. curasoae in Arizona, none of these species appears to be common in the U.S. Furthermore, because roost surveys in the 1970’s and 1980’s suggested that population sizes of the two species of Leptonycteris in Mexico and the U.S. were smaller than in previous
1Department of Biology, University of Miami, Coral Gables, FL 33124 2U.S. National Park Service, Organ Pipe Cactus National Monument, Route 1, Box 100, Ajo, AZ 85321 3Department of Ecology and Evolutionary Biology, University of Arizona, Tucson, AZ 85121 4Pima Community College, Tucson, AZ 85709
63
64 INFORMATION AND TECHNOLOGY REPORT–2003--0003
decades, some biologists urged that these species receive “endangered” status in the U.S. Subsequently, both species were added to the Endangered Species List (Shull, 1988). After reviewing all relevant information, however, Cockrum and Petryszyn (1991) questioned whether L. curasoae truly deserved to be classified as “endangered”.
Inspired by the federal listing, bat biologists have expended considerable effort since 1988 assessing the population status of L. curasoae in Arizona and Sonora, Mexico. Less effort has been directed at determining the status of L. nivalis and C. mexicana anywhere in their ranges. Moreno (1999), however, recently completed an intensive study of L. nivalis in northeastern Mexico, and in 1999, Cryan and Bogan (2003) surveyed sites where C. mexicana had previously been reported in Arizona and New Mexico.
The purpose of this paper is to summarize our current knowledge about the population status of the three plant-visiting species. We first describe methods that have been used to estimate colony sizes before summarizing estimates of year-to-year variation in roost populations. Major emphasis is placed on populations in the U.S., but additional data from Mexico are included.
Methods of PopulationMethods of PopulationMethods of PopulationMethods of PopulationMethods of Population AssessmentAssessmentAssessmentAssessmentAssessment
Assessment of population trends for any species requires accurate census techniques. Highly gregarious bats, such as L. curasoae, which lives with other gregarious bats (e.g., species of Mormoopidae in Mexican roosts), can be difficult to census. Three different census techniques have been used to estimate the size of lesser long-nosed bat colonies: direct exit counts, counts from videotape images of exiting bats, and visual censuses within day roosts.
At certain roosts (e.g., the maternity roost in Organ Pipe Cactus National Monument (ORPI), Arizona, and Pinacate Cave in Sonora, Mexico), reasonably accurate exit counts are possible because L. curasoae is the sole inhabitant, bats fly straight out of the roost without excessive “swirling around” at the entrance, and they depart at rates slow enough for accurate counting. Depending on the time of year, however, such exit counts are likely to underestimate the total number of bats in a roost because not all individuals leave with the first wave of departures. This is especially true during the nursing period (approximately mid-May through June; Fleming and others, 1998).
The second census technique involves videotaping the exit flight and counting the net number of departing bats (i.e., number of bats flying back into the roost are
subtracted from the number flying out) at 1-minute intervals directly from the videotape (Dalton and Dalton, 1994). It is critical to choose a census period when most or all bats are leaving the roost to feed. Comparison of simultaneous direct exit counts and video counts at the Organ Pipe roost indicate that substantial discrepancies (e.g., up to 40%) can sometimes occur between the two methods (Dalton and Dalton, 1994).
The third and most commonly used census technique for all three species has been to quietly enter a roost during the day to obtain a visual count of the resting bats. The two of us using this technique (Petryszyn and Fleming) attempt to quickly note the areal coverage of Leptonycteris bats (in ft2) before many bats take flight and then multiply that number by an estimate of the number of bats/ft2. Petryszyn usually uses an estimate of 50 bats/ft2. This is a conservative value because Leptonycteris bats are contact-loving and often roost by day in very dense masses of more than 50/ft2. Depending on the density of bats, Fleming has used values of 50 or 100 bats/ft2 in his calculations. With all census techniques, we have tried to be conservative in estimating the size of Leptonycteris colonies.
PopulationPopulationPopulationPopulationPopulation TTTTTrends in therends in therends in therends in therends in the ThreeThreeThreeThreeThree Species of Plant-VSpecies of Plant-VSpecies of Plant-VSpecies of Plant-VSpecies of Plant-Visiting Batsisiting Batsisiting Batsisiting Batsisiting Bats
The Lesser Long-Nosed Bat
Based on surveys conducted in Mexico and Arizona in 1983–1984, Wilson (1985) reported finding a total of about 15,500 individuals of L. curasoae in two roosts: 15,000 in a sea cave near Chamela, Jalisco, and 500 in a cave near Patagonia, Arizona. Since those surveys, annual (or more frequent) censuses of L. curasoae have been conducted at three roosts in Arizona (a mine in ORPI, Patagonia Bat Cave, and State of Texas Mine) and two roosts in Sonora, Mexico (Pinacate Bat Cave and Sierra Kino Cave). Results of these plus other censuses (e.g., Wilkinson and Fleming, 1996; Ceballos and others, 1997) indicate that the total population size of this species is orders of magnitude greater than Wilson’s (1985) estimate. Moreover, based on an analysis of genetic diversity of mitochondrial DNA haplotypes, Wilkinson and Fleming (1996) estimated that the genetically effective population size of this species in western Mexico is 50,000–100,000 adults.
In Arizona, maternity roosts are located in the southwestern corner of the state in desertscrub containing large populations of columnar cacti whose flowers and fruit are major food sources for this species. An abandoned mine in ORPI apparently represents the largest maternity
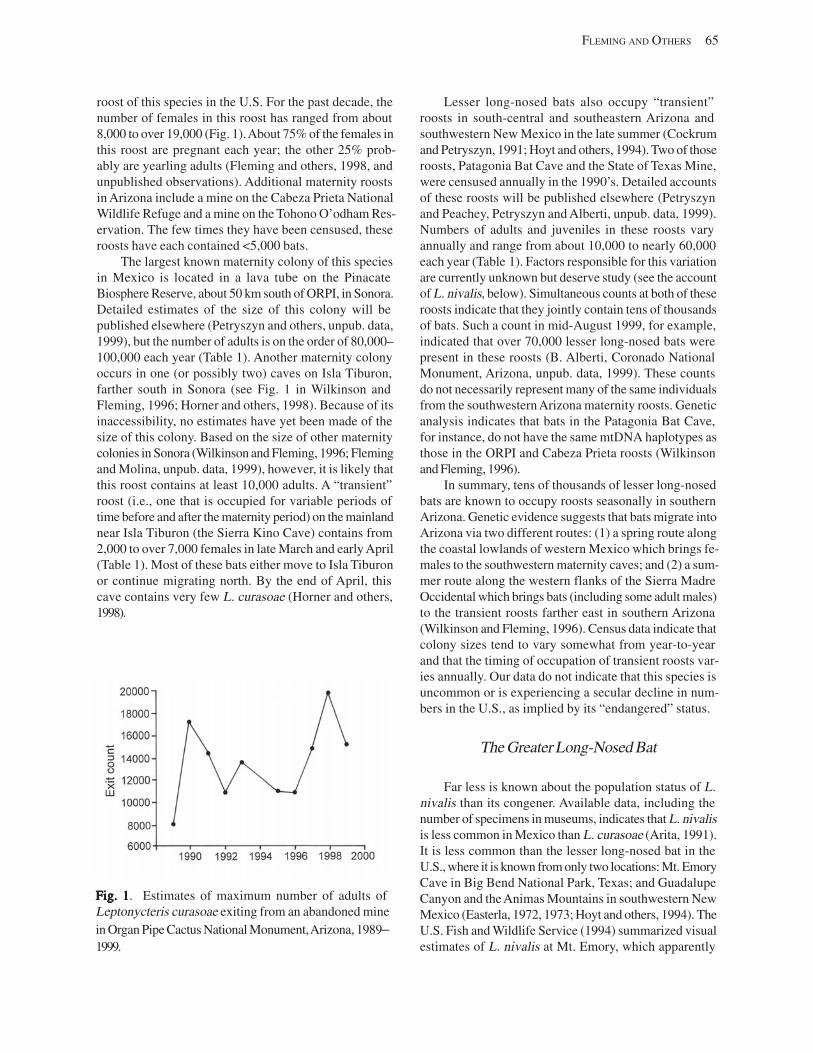
roost of this species in the U.S. For the past decade, the number of females in this roost has ranged from about 8,000 to over 19,000 (Fig. 1). About 75% of the females in this roost are pregnant each year; the other 25% probably are yearling adults (Fleming and others, 1998, and unpublished observations). Additional maternity roosts in Arizona include a mine on the Cabeza Prieta National Wildlife Refuge and a mine on the Tohono O’odham Reservation. The few times they have been censused, these roosts have each contained <5,000 bats.
The largest known maternity colony of this species in Mexico is located in a lava tube on the Pinacate Biosphere Reserve, about 50 km south of ORPI, in Sonora. Detailed estimates of the size of this colony will be published elsewhere (Petryszyn and others, unpub. data, 1999), but the number of adults is on the order of 80,000– 100,000 each year (Table 1). Another maternity colony occurs in one (or possibly two) caves on Isla Tiburon, farther south in Sonora (see Fig. 1 in Wilkinson and Fleming, 1996; Horner and others, 1998). Because of its inaccessibility, no estimates have yet been made of the size of this colony. Based on the size of other maternity colonies in Sonora (Wilkinson and Fleming, 1996; Fleming and Molina, unpub. data, 1999), however, it is likely that this roost contains at least 10,000 adults. A “transient” roost (i.e., one that is occupied for variable periods of time before and after the maternity period) on the mainland near Isla Tiburon (the Sierra Kino Cave) contains from 2,000 to over 7,000 females in late March and early April (Table 1). Most of these bats either move to Isla Tiburon or continue migrating north. By the end of April, this cave contains very few L. curasoae (Horner and others, 1998).
Fig. 1Fig. 1Fig. 1Fig. 1Fig. 1. Estimates of maximum number of adults of Leptonycteris curasoae exiting from an abandoned mine in Organ Pipe Cactus National Monument,Arizona, 1989– 1999.
FLEMING AND OTHERS 65
Lesser long-nosed bats also occupy “transient” roosts in south-central and southeastern Arizona and southwestern New Mexico in the late summer (Cockrum and Petryszyn, 1991; Hoyt and others, 1994). Two of those roosts, Patagonia Bat Cave and the State of Texas Mine, were censused annually in the 1990’s. Detailed accounts of these roosts will be published elsewhere (Petryszyn and Peachey, Petryszyn and Alberti, unpub. data, 1999). Numbers of adults and juveniles in these roosts vary annually and range from about 10,000 to nearly 60,000 each year (Table 1). Factors responsible for this variation are currently unknown but deserve study (see the account of L. nivalis, below). Simultaneous counts at both of these roosts indicate that they jointly contain tens of thousands of bats. Such a count in mid-August 1999, for example, indicated that over 70,000 lesser long-nosed bats were present in these roosts (B. Alberti, Coronado National Monument, Arizona, unpub. data, 1999). These counts do not necessarily represent many of the same individuals from the southwestern Arizona maternity roosts. Genetic analysis indicates that bats in the Patagonia Bat Cave, for instance, do not have the same mtDNA haplotypes as those in the ORPI and Cabeza Prieta roosts (Wilkinson and Fleming, 1996).
In summary, tens of thousands of lesser long-nosed bats are known to occupy roosts seasonally in southern Arizona. Genetic evidence suggests that bats migrate into Arizona via two different routes: (1) a spring route along the coastal lowlands of western Mexico which brings females to the southwestern maternity caves; and (2) a summer route along the western flanks of the Sierra Madre Occidental which brings bats (including some adult males) to the transient roosts farther east in southern Arizona (Wilkinson and Fleming, 1996). Census data indicate that colony sizes tend to vary somewhat from year-to-year and that the timing of occupation of transient roosts varies annually. Our data do not indicate that this species is uncommon or is experiencing a secular decline in numbers in the U.S., as implied by its “endangered” status.
The Greater Long-Nosed Bat
Far less is known about the population status of L. nivalis than its congener. Available data, including the number of specimens in museums, indicates that L. nivalis is less common in Mexico than L. curasoae (Arita, 1991). It is less common than the lesser long-nosed bat in the U.S., where it is known from only two locations: Mt. Emory Cave in Big Bend National Park, Texas; and Guadalupe Canyon and the Animas Mountains in southwestern New Mexico (Easterla, 1972, 1973; Hoyt and others, 1994). The U.S. Fish and Wildlife Service (1994) summarized visual estimates of L. nivalis at Mt. Emory, which apparently
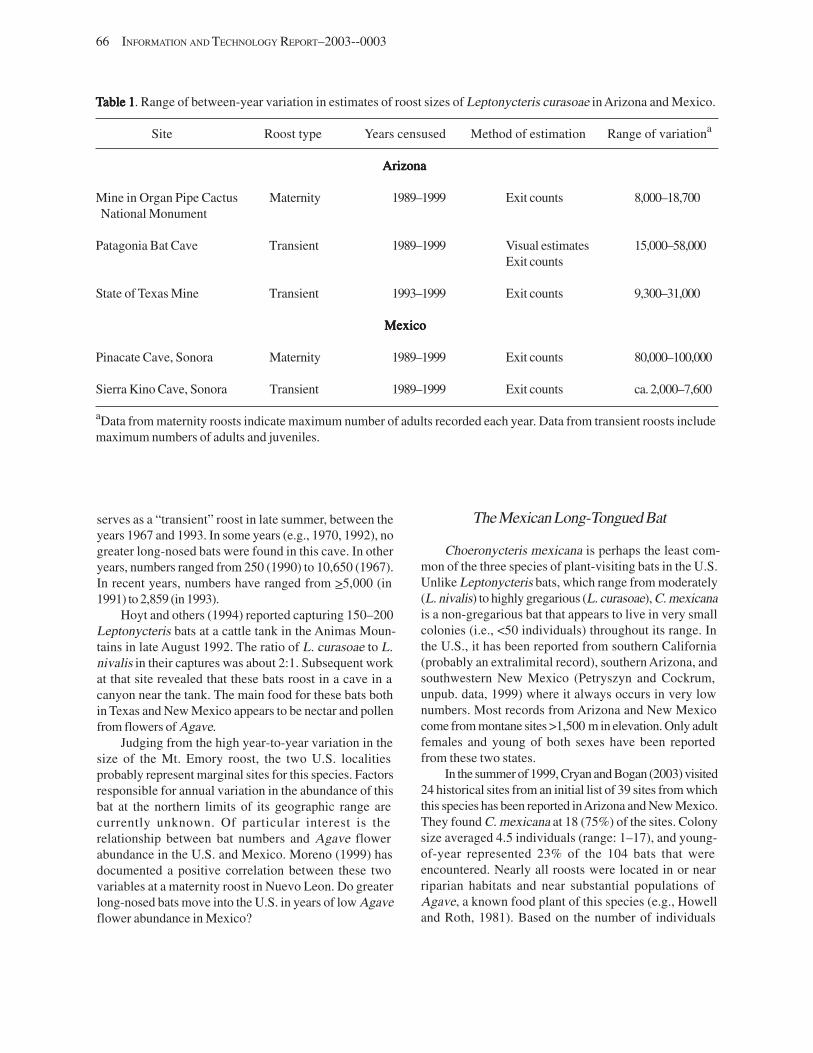
66 INFORMATION AND TECHNOLOGY REPORT–2003--0003
TTTTTable 1able 1able 1able 1able 1. Range of between-year variation in estimates of roost sizes of Leptonycteris curasoae in Arizona and Mexico.
Site Roost type Years censused Method of estimation Range of variationa
ArizonaArizonaArizonaArizonaArizona
Mine in Organ Pipe Cactus Maternity 1989–1999 Exit counts 8,000–18,700 National Monument
Patagonia Bat Cave Transient 1989–1999 Visual estimates 15,000–58,000 Exit counts
State of Texas Mine Transient 1993–1999 Exit counts 9,300–31,000
MexicoMexicoMexicoMexicoMexico
Pinacate Cave, Sonora Maternity 1989–1999 Exit counts 80,000–100,000
Sierra Kino Cave, Sonora Transient 1989–1999 Exit counts ca. 2,000–7,600
aData from maternity roosts indicate maximum number of adults recorded each year. Data from transient roosts include maximum numbers of adults and juveniles.
serves as a “transient” roost in late summer, between the years 1967 and 1993. In some years (e.g., 1970, 1992), no greater long-nosed bats were found in this cave. In other years, numbers ranged from 250 (1990) to 10,650 (1967). In recent years, numbers have ranged from >5,000 (in 1991) to 2,859 (in 1993).
Hoyt and others (1994) reported capturing 150–200 Leptonycteris bats at a cattle tank in the Animas Mountains in late August 1992. The ratio of L. curasoae to L. nivalis in their captures was about 2:1. Subsequent work at that site revealed that these bats roost in a cave in a canyon near the tank. The main food for these bats both in Texas and New Mexico appears to be nectar and pollen from flowers of Agave.
Judging from the high year-to-year variation in the size of the Mt. Emory roost, the two U.S. localities probably represent marginal sites for this species. Factors responsible for annual variation in the abundance of this bat at the northern limits of its geographic range are currently unknown. Of particular interest is the relationship between bat numbers and Agave flower abundance in the U.S. and Mexico. Moreno (1999) has documented a positive correlation between these two variables at a maternity roost in Nuevo Leon. Do greater long-nosed bats move into the U.S. in years of low Agave flower abundance in Mexico?
The Mexican Long-Tongued Bat
Choeronycteris mexicana is perhaps the least common of the three species of plant-visiting bats in the U.S. Unlike Leptonycteris bats, which range from moderately (L. nivalis) to highly gregarious (L. curasoae), C. mexicana is a non-gregarious bat that appears to live in very small colonies (i.e., <50 individuals) throughout its range. In the U.S., it has been reported from southern California (probably an extralimital record), southern Arizona, and southwestern New Mexico (Petryszyn and Cockrum, unpub. data, 1999) where it always occurs in very low numbers. Most records from Arizona and New Mexico come from montane sites >1,500 m in elevation. Only adult females and young of both sexes have been reported from these two states.
In the summer of 1999, Cryan and Bogan (2003) visited 24 historical sites from an initial list of 39 sites from which this species has been reported in Arizona and New Mexico. They found C. mexicana at 18 (75%) of the sites. Colony size averaged 4.5 individuals (range: 1–17), and youngof-year represented 23% of the 104 bats that were encountered. Nearly all roosts were located in or near riparian habitats and near substantial populations of Agave, a known food plant of this species (e.g., Howell and Roth, 1981). Based on the number of individuals
encountered and the relatively high rate of recurrence at historic sites, Cryan and Bogan (2003) stated that they did not have sufficient evidence to conclude that populations of this species have declined dramatically in recent years.
ConclusionsConclusionsConclusionsConclusionsConclusions
Arid regions of the southwestern U.S. are geographically marginal habitats for migratory, nectar-feeding phyllostomid bats. The three species discussed here probably moved into the U.S. with their major food plants, columnar cacti and paniculate species of Agave, as aridity increased in the southwest. Certain columnar cacti (e.g., Carnegiea gigantea and Stenocereus thurberi) appear to have moved into the U.S. within the last 3,500– 10,500 years (Van Devender, 1987; Van Devender and others, 1990), well after the last glacial maximum.As is the case for many marginal populations, year-to-year fluctuations are to be expected in the abundance of these species. Judging from the size and stability of maternity roosts near the northern edge of its distribution, L. curasoae appears to be the most successful of the three species. Despite its small colony sizes, which reflect the non-gregarious nature of this species, C. mexicana also appears to be well-integrated into arid land ecosystems. Only L. nivalis, which appears to be an “irruptive” species that roosts in numbers in the U.S. only under certain conditions, seems to be a problematic species in the arid Southwest.
Current evidence suggests that at least two of these species (L. curasoae and C. mexicana) are not undergoing population declines, although both species of Leptonycteris will always be vulnerable to population losses because of their gregarious roosting behavior. Furthermore, none of these species are likely to have been particularly common in the Southwestern U.S. in the past. Biotic evidence for this hypothesis comes from studies of the pollination biology of their major food species, columnar cacti and paniculate species of Agave. Neither saguaros and organ pipe cacti nor century plants such as Agave palmeri are solely dependent on bats for fruit and seed set (McGregor and others, 1962; Fleming and others, 1996; Slauson, 1996), despite having flowers that conform to the classic chiropterophilous “syndrome.” At the northern edges of their geographic ranges, these species are effectively pollinated by diurnal animals such as birds and insects, in addition to bats. Chronic scarcity or unreliability of bat visitation in the arid southwestern U.S. has apparently favored the evolution of subtle changes in flowering phenology, including nectar
FLEMING AND OTHERS 67
secretion patterns and time of flower closing (Fleming and others, 1996). These changes increase the diversity of animals that can pollinate their flowers. Tropical nectar-feeding bats may seasonally inhabit the southwestern U.S., but their food plants tell us that these bats are not to be trusted as their exclusive pollinators.
AcknowledgmentsAcknowledgmentsAcknowledgmentsAcknowledgmentsAcknowledgments
Many people have helped us gather the data summarized in this report. Special thanks go to B. Alberti, T. Beathard, D. Dalton, J. Holland, M. Horner, A. Pate, and W. Peachey for their field assistance and contribution of data. Support for our research has come from the National Geographic Society, National Fish and Wildlife Foundation, U.S. National Science Foundation, U.S. National Park Service, and the Arizona Department of Game and Fish.
References CitedReferences CitedReferences CitedReferences CitedReferences Cited
Arita, H.T., 1991, Spatial segregation in long-nosed bats, Leptonycteris nivalis and Leptonycteris curasoae, in Mexico: Journal of Mammalogy, vol. 79, p. 706–714.
Ceballos, G., Fleming, T.H., Chavez, C., and Nassar, J., 1997, Population dynamics of Leptonycteris curasoae (Chiroptera: Phyllostomidae) in Jalisco, Mexico: Journal of Mammalogy, vol. 78, p. 1220–1230
Cockrum, E.L., and Petryszyn, Y., 1991, The long-nosed bat, Leptonycteris: An endangered species in the southwest?: Occasional Papers, Museum Texas Tech University, vol. 142, p. 1–32.
Cryan, P.M., and Bogan, M.A., 2003, Recurrence of the Mexican long-tongued bat (Choeronycteris mexicana) at historical sites in Arizona and New Mexico: Western North American Naturalist, vol. 63, p. 314–319.
Dalton, V.M., and Dalton, D.C., 1994, Census protocol for the long-nosed bat (Leptonycteris curasoae) at Copper Mountain Mine, report to Organ Pipe Cactus National Monument.
Easterla, D.A., 1972, Status of Leptonycteris nivalis (Phyllostomatidae) in Big Bend National Park, Texas: Southwestern Naturalist, vol. 17, p. 287–292.
Easterla, D.A., 1973, Ecology of the 18 species of Chiroptera at Big Bend National Park, Texas: Northwestern Missouri State University Studies, vol. 34, p. 1–165.
Fleming, T.H., Tuttle, M.D., and Horner, M.A., 1996, Pollination biology and the relative importance of
68 INFORMATION AND TECHNOLOGY REPORT–2003--0003
nocturnal and diurnal pollinators in three species of Sonoran Desert columnar cacti: Southwestern Naturalist, vol. 41, p. 257–269.
Fleming, T. H., Nelson, A.A., and Dalton, V.M., 1998, Roosting behaviors of the lesser long-nosed bat, Leptonycteris curasoae: Journal of Mammalogy, vol. 79, p. 147–155.
Horner, M.A., Fleming, T.H., and Sahley, C. T., 1998, Foraging behaviour and energetics of a nectar-feeding bat, Leptonycteris curasoae (Chiroptera: Phyllostomidae): Journal of Zoology, vol. 244, p. 575– 586.
Howell, D. J., and Roth, B.S., 1981, Sexual reproduction in agaves, the benefits of bats: Cost of semelparous advertising: Ecology, vol. 62, p. 3–7.
Hoyt, R.A., Altenbach, J.S., and Hafner, D.J., 1994, Observations on long-nosed bats (Leptonycteris) in New Mexico: Southwestern Naturalist, vol. 39, p. 175–179.
McGregor, S.F., Alcorn, S.M., and Olin, G., 1962, Pollination and pollinating agents of the Saguaro: Ecology, vol. 43, p. 259–267.
Moreno, A., 1999, Population ecology of the greater long- nosed bat (Leptonycteris nivalis) in northeastern Mexico: College Station, Texas, Texas A&M University, Ph.D. dissertation.
Shull, A.M., 1988, Endangered and threatened wildlife and plants; determination of endangered status for two
long-nosed bats: Federal Register, vol. 53 , no. 190, p. 38456–38460.
Slauson, L.A., 1996, A morphometric and pollination ecology study of Agave chrysantha Peebles and Agave palmeri Engelm, (Agavaceae): Tempe, Arizona State University, Ph.D. dissertation.
U.S. Fish and Wildlife Service, 1994, Mexican long-nosed bat (Leptonycteris nivalis) recovery plan: U.S. Fish and Wildlife Service, Albuquerque, New Mexico, 100 p.
Van Devender, T.R., 1987, Holocene vegetation and climate in the Puerto Blanco Mountains, southwestern Arizona: Quaternary Research, vol. 27, p. 51–72.
Van Devender, T.R., Toolin, L.J., and Burgess, T.L., 1990, The ecology and paleoecology of grasses in selected Sonoran Desert communities, in Betancourt, J.L., Van Devender, T.R., and Martin, P.S., eds., Packrat middens: The last 40,000 years of biotic change: Tucson, University of Arizona Press, p. 326–349.
Wilkinson, G.S., and Fleming, T.H., 1996, Migration and evolution of lesser long-nosed bats, Leptonycteris curasoae, inferred from mitochondrial DNA: Molecular Ecology, vol. 5, p. 329–339.
Wilson, D.E., 1985, Status report, Leptonycteris sanborni Hoffmeister, Sanborn’s long-nosed bat: Report to the U.S. Fish and Wildlife Service, Denver Wildlife Research Center, National Museum of Natural History, Washington, D.C.

WWWWWestern Crevice and Cavity-Roosting Batsestern Crevice and Cavity-Roosting Batsestern Crevice and Cavity-Roosting Batsestern Crevice and Cavity-Roosting Batsestern Crevice and Cavity-Roosting Bats
By
Michael A. Bogan Paul M. Cryan
Ernest W. Valdez
U.S. Geological Survey Fort Collins Science Center
Museum of Southwestern Biology University of New Mexico Albuquerque, NM 87131
and
Laura E. Ellison Thomas J. O’Shea
U.S. Geological Survey Fort Collins Science Center
2150 Centre Avenue, Building C Fort Collins, CO 80526
Abstract. Among the 45 species of bats that occur in the United States (U.S.), 34 species regularly occur in western regions of the country. Many of these “western” species choose roost sites in crevices or cavities. Herein we provide an introduction to the biology of bats that roost in cavities and crevices and assess the challenges and opportunities associated with monitoring their populations. We reviewed recent studies and examined the U.S. Geological Survey Bat Population Database (BPD) for records of western bats using crevice and cavity roosts. We found records of 25 species of western bats that use crevice or cavity roosts for at least part of their annual cycle. There were relatively few (n = 92) observations or counts for these species in the BPD, representing only 6% of the observations in the database. This paucity of records likely reflects the difficulty of observing bats in such situations rather than actual use. We found no long-term data adequate for population trend analysis among this group of bats. Since the development of miniaturized radio transmitters, our knowledge about bats that roost in cavities and crevices has increased. Future challenges associated with monitoring these species will include understanding variability in the types of roosts used as well as the roost-switching behavior exhibited by many species.
AbstractAbstractAbstractAbstract
KeyKeyKeyKeyKey WWWWWordsordsordsordsords: Bat Population Database, BPD, cavity-counting bats, crevice roosting bats, roost selection, roost-switching, western U.S. bats.
69
70 INFORMATION AND TECHNOLOGY REPORT–2003--0003
IntroductionIntroductionIntroductionIntroductionIntroduction
“Our bats may be placed for convenience in two arbitrary groups—those which roost singly or a very few together in trees, high cliffs, or similar locations; and those which are in the habit of gathering in numbers in caves, hollow trees, and old buildings. In the case of the formerIn the case of the formerIn the case of the formerIn the case of the formerIn the case of the former class, few of us are qualified to talk atclass, few of us are qualified to talk atclass, few of us are qualified to talk atclass, few of us are qualified to talk atclass, few of us are qualified to talk at great lengthgreat lengthgreat lengthgreat lengthgreat length.” (Howell, 1919:169; emphasis ours)
There are 45 species of bats of 19 genera and four families in the United States (U.S.) (Hall, 1981; Harvey and others, 1999). Twenty-seven of these have distributions mostly confined to the western U.S. and six species occur in both eastern and western North America. Myotis septentrionalis occurs westward to British Columbia in Canada and eastern Wyoming in the U.S. (Bogan and Cryan, 2000) and we include it as a western species. Thus, we tabulate a minimum of 34 species of bats that can be said to be “western” bats. Some eastern species of bats are extending their range westward, likely as a result of habitat change (e.g., Pipistrellus subflavus; Yancey and others, 1995), so we may expect this number to change over time. A considerable proportion of the 34 western species of bats use crevices and cavities as roost sites, at least seasonally.
The relatively high diversity of bats in the western U.S. undoubtedly results from a greater variety of potential roosts than are found in other regions. Roosts play an important role in the lives of bats and the availability of suitable roosts likely influences species diversity and abundance (Kunz 1982). In particular, Humphrey (1975) found that bat diversity and evenness were highest in areas with a variety of potential roost structures (e.g., cliffs, caves, forests) and that species diversity was generally low in areas where roost structures were lacking (e.g., grasslands).
Roosts are critically important for bats because they provide a haven from the elements and predators as well as places to mate, raise young, hibernate, rest, digest food, and interact socially.Although specific requirements vary among species, in general, roosts must meet rather specific microclimatic conditions, restrict access to competitors and predators, and be within commuting distance of food and water. The diversity of roosting adaptations shown by bats was examined by Kunz (1982) and although he avoided a rigid classification of roost types, he noted that day roosts of bats included sites such as caves, crevices in rocks and narrow spaces beneath exfoliating tree bark, tree cavities, and foliage and other “external” roosts. He stated that crevice-dwelling was a prevalent
feature of vespertilionid and molossid bats, especially in arid and semiarid regions, and commented (p. 5) that “little is known about the roosting ecology of crevice-dwelling bats, because they are difficult to find and often located in inaccessible places.” Kunz (1982) found numerous examples of the use of tree cavities by bats but interestingly, gave no examples of use of cavities by bats of the western U.S. He restricted his comments on New World bats to Neotropical species, although he gave examples of several Palearctic vespertilionids that roost in trees.
Our ability to obtain information on the roosting habits of bats has improved markedly since Kunz (1982) made his comments. In particular, the availability of miniaturized radio-transmitters and their application to bats has truly revolutionized field studies of bats, especially in the western U.S. In the past decade, a plethora of studies using transmitters has greatly expanded our knowledge of bat roosting ecology (e.g., Barclay and Brigham, 1996, and papers therein).
Nonetheless, a variety of factors still continue to confound our attempts to better understand the roosting ecology of bats. One of these factors is the extent to which bats use multiple roosts, even during a single life history event such as lactation. Data on roost fidelity among 43 species of bats (not all North American) was summarized by Lewis (1995), who found that 25 species frequently change roosts, 14 rarely change, and 4 show intraspecific variability in roost switching. Her analysis showed that fidelity is directly related to roost permanency and inversely related to roost availability. Thus, she predicted that bats would demonstrate low fidelity for ephemeral sites that are abundant on the landscape, whereas they would show increased fidelity to relatively rare sites of high permanence. Since the publication of Lewis’paper, multiple papers have appeared that support her assertions. In particular, bats that roost in crevices and cavities in forest trees, sites that are presumably abundant and ephemeral, seem prone to use multiple roosts and to switch among them on a frequent basis (e.g., Kalcounis and Brigham, 1998; Weller and Zabel, 2001; Menzel and others, 2002). Data also support the existence of the same behavior in some species that use crevices and cavities in cliffs and rocks (e.g., Lewis, 1993; Cryan and others, 2001; Lausen and Barclay, 2002; S. Haymond and others, written commun., 2003).
The purpose of this chapter is to provide an introduction, but not an extensive review (such as Hayes, 2003), to the biology of bats that roost in cavities, crevices, and similar structures. In addition, we characterized features of bats that use such structures, assessed challenges and opportunities to monitor these species, and attempted to discern the extent to which long-term data on their populations exist and might be
used to determine trends in abundance. We were primarily interested in bats that use crevices or cavities in cliffs, rocks, or trees and similar human-made structures. It was primarily these species that were described as “overdispersed” in the Working Group reports in this volume.
MethodsMethodsMethodsMethodsMethods
To obtain information on western bat species that roost in crevices and cavities in rocks and trees we examined the U.S. Geological Survey’s Bat Population Database (BPD; Ellison and others, 2003) for records of bats using such roosts. In addition, we reviewed an array of recent studies that provide new data on species known to roost in crevices or cavities in trees and rocks. Our search criteria for species that use cavities, crevices, or rock shelters were defined as follows:
• Cavity. A hollow space, typically of small size (e.g., < 1 m3), and occurring in trees, rocks, or cliffs. These do not include caves.
• Crevice. A crack forming an opening in a substrate, such as a cliff or tree.
• Rock shelter. Shallow caves of small size (e.g., < 5–10 m3), usually moderately well-lighted and distinguished from larger caves by lack of complexity.
Results and DiscussionResults and DiscussionResults and DiscussionResults and DiscussionResults and Discussion
We tabulated 25 species of bats in the western U.S. that use crevices or cavities as roosts (Table 1). Whereas some of these species may only use such sites opportunistically or at certain times of the year, cavities and crevices likely play an important role in the lives of most of these species, especially during reproductive periods. Variation in the type of roost used within a species is likely influenced by such factors as sex, season, and roost availability. One species, Eumops underwoodi, is likely to roost in crevices in cliffs, but no roosts of this species in the U.S. have been described in the literature. Records of counts in crevices for some species, such as M. keenii and M. velifer, did not exist in the database, although these species are known to use crevice roosts (e.g., Kunz, 1974; Nagorsen and Brigham, 1993) and occur in the U.S. (e.g., Parker and Cook, 1996).
The BPD reveals only 92 observations of western bats using crevices or cavities, representing only 6% of the 1,513 observations for western bats in the database (Table 2). Observations of bats roosting in caves (45%)
BOGAN AND OTHERS 71
and mines (23%) accounted for most records. The low count for crevices and cavities reflects both the paucity of recorded observations at such sites as well as the historic emphasis on counting or studying bats in large aggregations in caves and mines. For at least some of the species that we now know use crevices or cavities, information on roosting habits came from opportunistic encounters at, or in, caves, mines, bridges, tunnels, and buildings. Many of these roosting sites are likely surrogates for crevices or cavities, at least seasonally. Information from the BPD also reveals that, among the species known to use cavities and crevices, use of other more spacious structures (i.e., caves, mines, and buildings) may occur during hibernation, although not exclusively so. Some of the largest roosting groups observed for several of these species come from observations in mines and caves during winter. For example, in many areas of the U.S., Myotis lucifugus typically roosts in crevices within buildings, trees, or rocks during the warmer months, but then aggregates in large clusters on the ceilings of caves and mines during the hibernation season. Nonetheless, there are very few descriptions of winter roosts for many species of western bats that roost in crevices and cavities during the warmer months. It is likely that many species over-winter in cavities and crevices, but the difficulty of detecting bats wintering in well-hidden sites has led to limited documentation of such behavior. As a result of their cryptic roosting habits, there are few observations of crevice and cavity dwelling bats that extend over years or even months (Ellison and others, 2003).
Basic Life History of Crevice-Dwelling Bats
Much of the basic life history information we have for bats that roost in cavities and crevices has come, at least since the late 1950’s, from captures of these species in mist nets set over water. Such efforts have provided considerable information on reproduction, diet, foraging areas, activity times, associates, and other aspects of natural history. Western landscapes, in particular, promote this activity due to the isolation of one waterhole from another, a circumstance that may concentrate bats. This “concentration effect” likely depends on seasonal precipitation, with wet summers that produce more and closer waterholes tending to disperse bats over the landscape with consequently lower capture rates (Findley, 1993; K.N. Geluso, oral commun., 2000). Most investigators agree that captures of bats in mist nets, although they provide considerable “hands-on” data, are fraught with a variety of biases and may offer few opportunities, beyond monitoring for presence and relative abundance, for long-term population monitoring (see Working Group
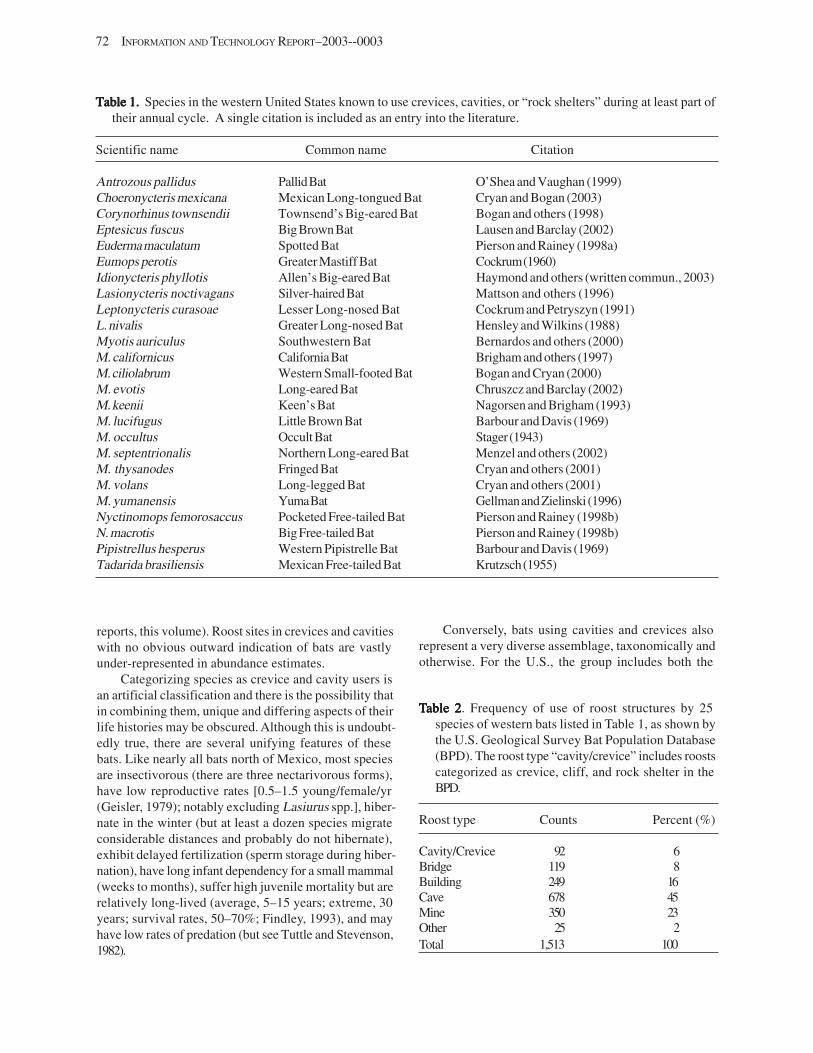
72 INFORMATION AND TECHNOLOGY REPORT–2003--0003
Table 1.Table 1.Table 1.Table 1.Table 1. Species in the western United States known to use crevices, cavities, or “rock shelters” during at least part of their annual cycle. A single citation is included as an entry into the literature.
Scientific name Common name Citation
Antrozous pallidus PallidBat O’Shea and Vaughan (1999) Choeronycteris mexicana Mexican Long-tongued Bat Cryan and Bogan (2003) Corynorhinus townsendii Townsend’s Big-eared Bat Bogan and others (1998) Eptesicus fuscus Big Brown Bat Lausen and Barclay (2002) Euderma maculatum Spotted Bat Pierson and Rainey (1998a) Eumops perotis Greater Mastiff Bat Cockrum (1960) Idionycteris phyllotis Allen’s Big-eared Bat Haymond and others (written commun., 2003) Lasionycteris noctivagans Silver-hairedBat Mattson and others (1996) Leptonycteris curasoae Lesser Long-nosed Bat Cockrum and Petryszyn (1991) L. nivalis Greater Long-nosed Bat Hensley and Wilkins (1988) Myotis auriculus Southwestern Bat Bernardos and others (2000) M. californicus CaliforniaBat Brigham and others (1997) M. ciliolabrum Western Small-footed Bat Bogan and Cryan (2000) M. evotis Long-eared Bat Chruszcz and Barclay (2002) M. keenii Keen’s Bat Nagorsen and Brigham (1993) M. lucifugus Little Brown Bat Barbour and Davis (1969) M. occultus Occult Bat Stager (1943) M. septentrionalis Northern Long-eared Bat Menzel and others (2002) M. thysanodes Fringed Bat Cryan and others (2001) M. volans Long-legged Bat Cryan and others (2001) M. yumanensis YumaBat Gellman and Zielinski (1996) Nyctinomops femorosaccus Pocketed Free-tailed Bat Pierson and Rainey (1998b) N. macrotis Big Free-tailed Bat Pierson and Rainey (1998b) Pipistrellus hesperus Western Pipistrelle Bat Barbour and Davis (1969) Tadarida brasiliensis Mexican Free-tailed Bat Krutzsch (1955)
reports, this volume). Roost sites in crevices and cavities with no obvious outward indication of bats are vastly under-represented in abundance estimates.
Categorizing species as crevice and cavity users is an artificial classification and there is the possibility that in combining them, unique and differing aspects of their life histories may be obscured. Although this is undoubtedly true, there are several unifying features of these bats. Like nearly all bats north of Mexico, most species are insectivorous (there are three nectarivorous forms), have low reproductive rates [0.5–1.5 young/female/yr (Geisler, 1979); notably excluding Lasiurus spp.], hibernate in the winter (but at least a dozen species migrate considerable distances and probably do not hibernate), exhibit delayed fertilization (sperm storage during hibernation), have long infant dependency for a small mammal (weeks to months), suffer high juvenile mortality but are relatively long-lived (average, 5–15 years; extreme, 30 years; survival rates, 50–70%; Findley, 1993), and may have low rates of predation (but see Tuttle and Stevenson, 1982).
Conversely, bats using cavities and crevices also represent a very diverse assemblage, taxonomically and otherwise. For the U.S., the group includes both the
TTTTTable 2able 2able 2able 2able 2. Frequency of use of roost structures by 25 species of western bats listed in Table 1, as shown by the U.S. Geological Survey Bat Population Database (BPD). The roost type “cavity/crevice” includes roosts categorized as crevice, cliff, and rock shelter in the BPD.
Roost type Counts Percent (%)
Cavity/Crevice 92 6 Bridge 119 8 Building 249 16 Cave 678 45 Mine 350 23 Other 25 2 Total 1,513 100
smallest (P. hesperus) and largest (E. perotis) species (Barbour and Davis, 1969), slow- (P. hesperus, several Myotis) and fast- (lasiurines and molossids) flying species (Hayward and Davis, 1964), relatively well- (M. lucifugus) and poorly- (Eumops, Nyctinomops) known species, slow- (A. pallidus) and faster- (M. lucifugus; Kunz and Stern, 1995) developing species, those that escape (sensu Findley, 1993) food shortage in north temperate winters in time (hibernators) versus those that escape in space (migrators), those with protein-rich diets (insectivores) and those with low protein diets (nectarivores), and those with large (Tadarida brasiliensis; Constantine, 1967) and small (Myotis evotis; Chruszcz and Barclay, 2002) group sizes.
Roosting Behavior of Crevice-Dwelling Bats
Since the emergence of miniaturized radio-transmitters in the mid-1980’s, bats have been shown to roost in a variety of structures and situations that were previously undocumented. Radio-tracking studies in forested areas during the summer months reveal that bats frequently form maternity colonies in trees (Barclay and others, 1988; Sasse, 1995; Barclay and Brigham, 1996, 2001; Campbell and others, 1996; Mattson and others, 1996; Vonhof and Barclay, 1996; Brigham and others, 1997; Callahan and others, 1997; Betts, 1998; Kalcounis and Brigham, 1998; Ormsbee and McComb, 1998; Rabe and others, 1998; Waldien and others, 2000; Cryan and others, 2001; Lacki and Schwierjohann, 2001; Menzel and others, 2002; Weller and Zabel, 2001; Parsons and others, 2003). Although the use of trees by bats had been documented previous to the advent of radio-transmitters (Barbour and Davis, 1969), there were no practical means by which to find and examine such roosts. Similar disclosure of rock crevices used as roosts by bats also has been possible with radio-transmitters (e.g., Lewis, 1993; Bogan and others, 1998; Cryan and others, 2001; Lausen and Barclay, 2002). However, most work to date has involved simply characterizing such roosts, following movements of radio-tracked bats (often among a network of roosts), obtaining information on foraging behavior, and making counts of emerging bats. Monitoring of trends in these species has not been a focus.
Monitoring Crevice-Roosting Bats: Challenges and Opportunities
Western bat species that use crevices and cavities are variable and flexible in their roosting behaviors. For example, M. septentrionalis uses buildings and caves, as well as several species of trees (Mumford and Cope, 1964; Foster, 1993; Sasse, 1995; Foster and Kurta, 1999; Cryan
BOGAN AND OTHERS 73
and others, 2001; Lacki and Schwierjohann, 2001; Menzel and others, 2002); Myotis thysanodes is known to inhabit buildings (Dalquest, 1947; Musser and Durrant, 1960; Studier, 1968), rock crevices (Bogan and others, 1998; Cryan and others, 2001), trees (Rabe and others, 1998; Cryan and others, 2001; Chung-MacCoubrey, 2003), mines (J.S. Altenbach, oral commun., 2000), and caves (Baker, 1962); M. volans uses buildings (Dalquest and Ramage, 1946), several species of trees (Baker and Phillips, 1965; Vonhof and Barclay, 1996; Ormsbee and McComb, 1998; Rabe and others, 1998; Chung-MacCoubrey, 2003), and rock crevices (Quay, 1948; Cryan and others, 2001); and E. fuscus is known to use buildings (Barbour and Davis, 1969; Barclay, 1991), several species of trees (Brigham, 1991; Vonhof and Barclay, 1996; Bogan and others, 1998; Kalcounis and Brigham, 1998; Cryan and others, 2001); cactus (Cross and Huibregtse, 1964); and caves and rock crevices (Barbour and Davis, 1969; Barclay, 1991; Lausen and Barclay, 2002). The considerable variation in the type of roost structures occupied by these species cannot be entirely attributed to regional differences in roost availability or roosting behavior. In the Black Hills of South Dakota, Cryan and others (2001) documented individuals of both M. volans and M. thysanodes moving from crevices in rocks to crevices in trees, showing that local populations are not limited to using crevices and cavities in a single type of roost structure. Furthermore, for many species there is still not sufficient information to draw definitive conclusions.
Another source of variation in roosting habits of bats is that in most species, males and females exhibit contrasting roosting behaviors during the summer. Differences in roost selection between sexes of bats stem from increased energy and water demands placed on pregnant and lactating females. In brief, males are able to use periodic (usually daily) periods of torpor to lower their body temperature and, hence, their energy expenditure (Grinevitch and others, 1995). Females, however, usually maintain a constant body temperature during pregnancy and lactation. This promotes rapid and timely growth of the fetus and young, thus enabling young-of-the-year to acquire and store energy to meet the demands of either hibernation or migration (Racey and Entwistle, 2000). In general, males are frequently encountered roosting alone in caves, mines, under tree bark, or in buildings. Females typically choose sites that retain heat (e.g., cavities in large trees and snags or crevices in exposed cliff faces) and where both they and their young can maintain the constant body temperatures that promote rapid growth. During the summer months, maternity groups must find larger spaces in which to aggregate than solitary males, likely influencing the type of structure selected. In addition to sex differences in summer roost use by species that use cavities and
74 INFORMATION AND TECHNOLOGY REPORT–2003--0003
crevices, there are often differences in roost selection among reproductive stages. For example, Chruszcz and Barclay (2002) found that the type of rock crevices used by female M. evotis differed with their reproductive state; pregnant females typically roosted in horizontally oriented crevices, whereas lactating females frequently used vertically oriented crevices. Differential roost selection among female reproductive groups was also observed among pregnant, lactating, and postlactating E. fuscus using rock crevices (Lausen and Barclay, 2002). Variability in roost use that results from different energy needs between the sexes during the warmer months likely diminishes with the annual cessation of reproductive activity. Therefore, both sexes probably exhibit less dichotomous roosting behaviors during the colder months and may be more likely to occupy the same roosts during winter.
Given the incidental nature of many observations and lack of data on specific locations of overwintering sites, it is not yet clear that cavity- and crevice-dwelling bats can be monitored in a systematic fashion at their winter roosts. Certainly this will be difficult for many of the migratory species that travel great distances (e.g., Cryan, 2003). Even for species that only migrate very short distances to their winter quarters, we must be able to track them to such sites. The development of smaller and longer-lasting transmitters and the application of new tracking techniques (e.g., stable isotopes; Cryan and others, in press) may enhance our ability to follow some species from summer to winter quarters. Likewise, development of remote-monitoring methods may allow censuses of some species in roosts that cannot or should not be entered in the winter. Once roost locations are known, it will be feasible to contemplate the establishment of a long-term monitoring program, assuming funding for such activities is available. In the meantime some level of continued inventory for new roost locations may be required.
A major obstacle confounding any attempt to assess the abundance of crevice or cavity roosting bats, at least during the summer months, is the fact that many species change roosts frequently. As Lewis (1995) noted, costs of short-term movement (of bats among roosts) should be balanced by benefits associated with moving. The presumed benefits of fidelity include greater site familiarity, maintenance of social relationships, and retention of roosts suited for raising offspring. Conversely, the benefits of lability include decreased commuting costs to foraging areas, familiarity with roosts that may differ in microclimate, and possible lower probability of predation and parasitism. In relation to caves and mines, cavities and crevices in trees and rock are generally less permanent, likely influencing bats roosting in such structures to move frequently. There are many problems
associated with monitoring roosts used by crevice-roosting bats that switch roosts frequently. For example, Lausen and Barclay (2002) studied a maternity group of E. fuscus that roosted in a series of rock crevices in western Canada. After following approximately 32 members of this colony for two seasons, they documented the use of 72 different roost crevices within the study area. With so many potential roosts, current methods of monitoring (e.g., visual emergence counts) would be inadequate in such a situation. However, there is increasing evidence that roost- switching bats that roost in both rock and tree crevices/ cavities typically move within relatively small areas (Vonhof and Barclay, 1996; Callahan and others, 1997; Kalcounis and Brigham, 1998; Cryan and others, 2001; Lausen and Barclay, 2002). Unfortunately, most studies of roost switching in bats are limited in time (~2–3 years; Miller and others, 2003) and have not adequately determined the level of fidelity that roost-switching bats exhibit toward their roosting areas. Currently there are too many unanswered questions regarding the basic natural history of roost-switching bats to competently proceed with monitoring of such populations. Important topics to address with future research include determining the seasonal movements and dispersal patterns of roost-changing bats in a given area and how such factors vary with locality (Cryan and others, 2001). In addition, determination of underlying roost characteristics (e.g., microclimate, internal dimensions) that are common to the various structures occupied by these bats might help explain their roost-switching behavior and aid in future attempts at monitoring (i.e., help predict “suitable” roosts).
Techniques Used for Assessing Abundance
Many relatively standardized techniques potentially can be used for monitoring bats using crevices and cavities, including netting, banding, exit counts (both unassisted and assisted), use of passive integrated-transponder tags, thermal imaging, and bat detectors (see also Kunz, 1988, 2003). Because bats roosting in cavities or crevices are typically not visible from the outside, abundance estimates must be based on counts of the bats leaving the roost or by somehow looking into the roost. The former method is the most commonly used technique and typically involves capturing or visually observing bats as they exit the roost. Capture methods allow positive species identification and determination of colony demographics, but are invasive and may bias future monitoring. Visual emergence counts are minimally invasive, but the drawbacks to visual counts include limited light levels by the time the bats emerge, distance from roost (e.g. crevice high on cliff wall, cavity high in
tree), difficulty in counting multiple bats leaving at once, and not being able to confirm species identification. Such obstacles can be minimized by using night-vision scopes, infrared or thermal-imaging cameras, automated counting devices, and ultrasonic bat detectors (for species identification in some cases). Actually looking into a bat roost may seem to be a less practical way of counting bats, but miniaturized camera probes, if used in a manner that does not unduly disturb bats, may allow such efforts in the future.
Summary and RecommendationsSummary and RecommendationsSummary and RecommendationsSummary and RecommendationsSummary and Recommendations
In spite of the proliferation of new data on roosting behavior of western bats, we are not aware of any current long-term monitoring efforts of bats that roost in cavities or crevices in the western U.S. Nonetheless, follow-up surveys of historically occupied bat roosts indicate the utility and importance of monitoring crevices and shelters to assess long-term population trends (e.g., Pierson and Rainey, 1998a; O’Shea and Vaughan, 1999; Cryan and Bogan, 2003). In light of the lack of long-term studies as well as our limited understanding of colony dynamics in those species of bats that roost in cavities and crevices, we recommend that efforts be made to establish research projects which investigate colonies of these species over longer periods of time (> 5–10 years). Only by studying the movements and levels of site fidelity exhibited by these species at larger landscape scales and for longer periods, will we be able to make progress toward better understanding them and effectively monitoring their populations.
References CitedReferences CitedReferences CitedReferences CitedReferences Cited
Baker, J. K., 1962, Notes on the Myotis of the Carlsbad Caverns: Journal of Mammalogy, vol. 48, p. 270–286.
Baker, R.H., and Phillips, C.J., 1965, Mammals from El Nevado de Colima, Mexico: Journal of Mammalogy, vol. 46, p. 691–693.
Barbour, R.W., and Davis, W.H., 1969, Bats of America: Lexington, The University Press of Kentucky, 286 p.
Barclay, R.M.R., 1991, Population structure of temperate zone insectivorous bats in relation to foraging behavior and energy demand: Journal ofAnimal Ecology, vol. 60, p. 165–178.
Barclay, R.M.R., and Brigham, R.M., eds., 1996, Bats and forests symposium, October 19–21, 1995, Victoria, British Columbia, Canada: Research Branch, British Columbia, Ministry of Forests, Working Paper No. 23, 292 p.
BOGAN AND OTHERS 75
Barclay, R.M.R., and Brigham, R.M., 2001, Year-to-year reuse of tree-roosts by California bats (Myotis californicus) in southern British Columbia: American Midland Naturalist, vol. 146, p. 80–85.
Barclay, R.M.R., Faure, P.A., and Farr, D.R., 1988, Roosting behavior and roost selection by migrating silver-haired bats (Lasionycteris noctivagans): Journal of Mammalogy, vol. 69, p. 821–825.
Bernardos, D.A., Chambers, C.L., and Rabe, M.J., 2000, Use of ponderosa pine/Gambel oak forests by bats in northern Arizona. Abstract, Arizona, and New Mexico Chapters: The Wildlife Society, Sierra Vista,Arizona, p. 17.
Betts, B.J., 1998, Roosts used by maternity colonies of silver-haired bats in northeastern Oregon: Journal of Mammalogy, vol. 79, p. 643–650.
Bogan, M.A., and Cryan, P.M., 2000, Bats of Wyoming, in Choate, J.R., ed., Reflections of a naturalist: Papers honoring Professor Eugene D. Fleharty: Fort Hays State University, Kansas, p. 71–94.
Bogan, M.A., O’Shea, T.J., Cryan, P.M., Ditto, A.M., Schaedla, W.H., Valdez, E.W., and Castle, K.T., 1998, A study of bat populations at Los Alamos National Laboratory and Bandelier National Monument, Jemez Mountains, New Mexico: Los Alamos National Laboratory, LA-UR-98-2418.
Brigham, R.M., 1991, Flexibility in foraging and roosting behavior by the big brown bat (Eptesicus fuscus): Canadian Journal of Zoology, vol. 69, p. 117–121.
Brigham, R.M.,Vonhof, M.J., Barclay, R.M.R., and Gwilliam, J.C., 1997, Roosting behavior and roost-site preferences of forest-dwelling California bats (Myotis californicus): Journal of Mammalogy, vol. 78, p. 1231–1239.
Callahan, E.V., Drobney, R.D., and Clawson, R.L., 1997, Selection of summer roosting sites by Indiana bats (Myotis sodalis) in Missouri: Journal of Mammalogy, vol. 78, p. 818–825.
Campbell, L.A., Hallett, J.G., and O’Connell, M.A., 1996, Conservation of bats in managed forests: Use of roosts by Lasionycteris noctivagans: Journal of Mammalogy, vol. 77, p. 976–984.
Chruszcz, B., and Barclay, R.M.R., 2002, Thermoregulatory ecology of a solitary bat, Myotis evotis, roosting in rock crevices: Functional Ecology, vol. 16, p. 18–26.
Chung-MacCoubrey,A., 2003, Monitoring long-term reuse of trees by bats in pinyon-juniper woodlands of New Mexico: Wildlife Society Bulletin,vol. 31, p. 73–79.
Cockrum, E.L., 1960, Distribution, habitat and habits of the mastiff bat, Eumops perotis, in North America: Journal of the Arizona Academy of Science, vol. 1, p. 79– 84.
Cockrum, E.L., and Petryszyn, Y., 1991, The long-nosed bat Leptonycteris: An endangered species in the Southwest?: Occasional Papers, The Museum, Texas Tech University, vol. 142, p. 1–32.
76 INFORMATION AND TECHNOLOGY REPORT–2003--0003
Constantine, D.G., 1967, Activity patterns of the Mexican free-tailed bat: University of New Mexico Publications in Biology, vol. 7, p. 1–79.
Cross, S.P., and Huibregtse, W., 1964, Unusual roosting site of Eptesicus fuscus: Journal of Mammalogy, vol. 45, p. 628.
Cryan, P.M., 2003, Migration in North American tree bats: Journal of Mammalogy, vol. 84, 579–593.
Cryan, P.M., and Bogan, M.A., 2003, Recurrence of Mexican long-tongued bats (Choeronycteris mexicana) at historical sites in Arizona and New Mexico: Western North American Naturalist, vol. 63, p. 314–319.
Cryan, P.M., Bogan, M.A., Rye, R.O. Landis, G.P., and Kester, C.L., in press, Stable hydrogen isotope analysis of bat hair as evidence of seasonal molt and long-distance migration: Journal of Mammalogy.
Cryan, P., Bogan, M., and Yanega, G., 2001, Roosting habits of four bat species in the Black Hills of South Dakota: Acta Chiropterologica, vol. 3, p. 43–52.
Dalquest, W.W., 1947, Notes on the natural history of the bat Corynorhinus townsendii in California: Journal of Mammalogy, vol. 28, p. 17–30.
Dalquest, W.W., and Ramage, M.C., 1946, Notes on the long-legged bat (Myotis volans) at Old Fort Tejon and vicinity, California: Journal of Mammalogy, vol. 27, p. 60–63.
Ellison, L.E., O’Shea, T.J., Bogan, M.A., Everette, A.L., and Schneider, D.M., 2003, Existing data on colonies of Bats in the United States: Summary and analysis of the U.S. Geological Survey’s Bat Population Database, in O’Shea, T.J. and Bogan, M.A., eds., Monitoring trends in bat populations of the United States and territories: problems and prospects: U.S. Geological Survey, Information and Technology Report, USGS/ BRD/ITR--2003–0003, p. 127–237.
Findley, J.S., 1993, Bats: A community perspective: Cambridge, U.K., Cambridge University Press, 179 p.
Foster, R.W., 1993, Roost site selection by the northern bat (Myotis septentrionalis): Bat Research News, vol. 34, p. 108.
Foster, R.W., and Kurta, A., 1999, Roosting ecology of the northern bat (Myotis septentrionalis) and comparisons with the endangered Indiana bat (Myotis sodalis): Journal of Mammalogy, vol. 80, p. 659–672.
Geisler, J., 1979, Ecology of bats, in Stoddart, D.M., ed., Ecology of small mammals: London, Chapman and Hall, p. 281–342.
Gellman, S.T., and Zielinski, W.J., 1996, Use by bats of old-growth redwood hollows on the north coast of California: Journal of Mammalogy, vol. 77, p. 255–265.
Grinevitch, L., Holroyd, S.L., Barclay, R.M.R., 1995, Sex difference in the use of daily torpor and foraging time by big brown bats: Journal of Zoology, vol. 235, p. 301–309.
Hall, E.R., 1981, The mammals of North America: New York, John Wiley & Sons, vol. 1, p. 1–600.
Harvey, M.J., Altenbach, J.S., and Best, T.L., 1999, Bats of the United States: Arkansas Game and Fish Commission, 64 p.
Hayes, J.P., 2003, Habitat ecology and conservation of bats in western coniferous forests, in Zabel, C.J. and Anthony, R.G., eds., Mammal community dynamics: management and conservation in the coniferous forests of western North America: New York, Cambridge University Press, p. 81–119.
Hayward, B., and Davis, R., 1964, Flight speeds in western bats: Journal of Mammalogy, vol. 45, p. 236–242.
Hensley, A.P., and Wilkins, K.T., 1988, Leptonycteris nivalis: Mammalian Species, vol. 307, p. 1–4.
Howell, A.B., 1919, Some Californian experiences with bat roosts: Journal of Mammalogy, vol. 1, p. 169–177.
Humphrey, S.R., 1975, Nursery roosts and community diversity of Nearctic bats: Journal of Mammalogy, vol. 56, p. 321–346.
Kalcounis, M.C., and Brigham, R.M., 1998, Secondary use of aspen cavities by tree-roosting big brown bats: Journal of Wildlife Management, vol. 62, p. 603–611.
Krutzsch, P.H., 1955, Observations on the Mexican free- tailed bat, Tadarida mexicana: Journal of Mammalogy, vol. 36, p. 236–242.
Kunz, T.H., 1974, Feeding ecology of a temperate insectivorous bat (Myotis velifer): Ecology, vol. 55, p. 693– 711.
Kunz, T.H., 1982, Roosting ecology of bats, in Kunz, T.H., ed., Ecology of bats: New York, Plenum Press, p. 1–55.
Kunz, T.H, ed., 1988, Ecological and behavioral methods for the study of bats: Washington, D.C., Smithsonian Institution Press.
Kunz, T.H., 2003, Censusing bats: Challenges, solutions, and sampling biases, in O’Shea, T.J. and Bogan, M.A., eds., Monitoring trends in bat populations of the United States and territories: problems and prospects: U.S. Geological Survey, Information and Technology Report, USGS/BRD/ITR--2003–0003, p. 9–19.
Kunz, T.H., and Stern, A.A., 1995, Maternal investment and post-natal growth in bats, in P. A. Racey and S. M. Swift, eds., Ecology, evolution and behaviour of bats: Oxford, Clarendon Press, Zoological Society of London, p. 123–138.
Lacki, M., and Schwierjohann, J., 2001, Day-roost characteristics of northern bats in mixed mesophytic forest: Journal of Wildlife Management, vol. 65, p. 482–488.
Lausen, C.L., and Barclay, R.M.R., 2002, Roosting behavior and roost selection of female big brown bats (Eptesicus fuscus) roosting in rock crevices in southeastern Alberta: Canadian Journal of Zoology, vol. 80, p. 1069–1076.
Lewis, S.E., 1993, Roosting and social ecology of pallid bats (Antrozous pallidus) in central Oregon: St. Paul, University of Minnesota, Ph.D. dissertation, 157 p.
Lewis, S.E., 1995, Roost fidelity in bats: A review: Journal of Mammalogy, vol. 76, p. 481–496.
Mattson, T.A., Buskirk, S.W., and Stanton, N.L., 1996, Roost sites of the silver-haired bat (Lasionycteris noctivagans) in the Black Hills, South Dakota: Great Basin Naturalist, vol. 56, p. 247–253.
Menzel, M., Owen, S., Ford, W., Edwards, J., Wood, P., Chapman, B., and Miller, K., 2002, Roost tree selection by northern long-eared bat (Myotis septentrionalis) maternity colonies in an industrial forest of the central Appalachian mountains: Forest Ecology and Management, vol. 155, p. 107–114.
Miller, D.A., Arnett, E.B., and Lacki, M.J., 2003, Habitat management for forest-roosting bats of North America: A critical review of habitat studies: Wildlife Society Bulletin, vol. 31, p. 30–44.
Mumford, R.E., and Cope, J.B., 1964, Distribution and status of the Chiroptera of Indiana: American Midland Naturalist, vol. 72, p. 473–489.
Musser, G.G., and Durrant, S.D., 1960, Notes on Myotis thysanodes in Utah: Journal of Mammalogy, vol. 41, p. 393–394.
Nagorsen, D.W., and Brigham, R.M., 1993, Bats of British Columbia: Royal British Columbia Museum, University of British Columbia Press, Vancouver, 164 p.
Ormsbee, P.C., and McComb, W.C., 1998, Selection of day roosts by female long-legged myotis in the central Oregon Cascade range: Journal of Wildlife Management, vol. 62, p. 596–603.
O’Shea, T.J., and Vaughan, T.A., 1999, Population changes in bats from central Arizona: 1972 and 1997: Southwestern Naturalist, vol. 44, p. 495–500.
Parker, D.I., and Cook, J.A., 1996, Keen’s long-eared bat, Myotis keenii, confirmed in southeast Alaska: Canadian Field Naturalist, vol. 110, p. 611–614.
Parsons, S., Lewis, K., and Psyllakis, J., 2003, Relationships between roosting habitat of bats and decay of aspen in the sub-boreal forests of British Columbia: Forest Ecology and Management, vol. 177, p. 559–570.
Pierson, E.D., and Rainey, W.E., 1998a, Distribution of the spotted bat, Euderma maculatum, in California: Journal of Mammalogy, vol. 79, p. 1296–1305.
BOGAN AND OTHERS 77
Pierson, E.D., and Rainey, W.E., 1998b, Distribution, habitat associations, status, and survey methodologies for three molossid bat species (Eumops perotis, Nyctinomops femorosaccus, Nyctinomops macrotis) and the vespertilionid Euderma maculatum, final report: Contract #FG2328WM, California Department of Fish and Game, 61 p.
Quay, W.B., 1948, Notes on some bats from Nebraska and Wyoming: Journal of Mammalogy, vol. 29, p. 181–182.
Rabe, M.J., Morrell, T.E., Green, H., DeVoss, Jr., J.C., and Miller, C.R., 1998, Characteristics of ponderosa pine snag roosts used by reproductive bats in northern Arizona: Journal of Wildlife Management, vol. 62, p. 612–621.
Racey, P.A., and Entwistle, A.C., 2000, Life-history and reproductive strategies of bats, in Crichton, E.G., and Krutzsch, P.H., eds., Reproductive biology of bats: San Diego, Academic Press, p. 363–414.
Sasse, D.B., 1995, Summer roosting ecology of cavity-dwelling bats in the White Mountain National Forest. Durham, University of New Hampshire, M.S. thesis.
Stager, K.E., 1943, Remarks on Myotis occultus in California: Journal of Mammalogy, vol. 24, p. 197–199.
Studier, E.H., 1968, Fringe-tailed bat in northeast New Mexico: Southwestern Naturalist, vol. 13, p. 362.
Tuttle, M.D., and Stevenson, D., 1982, Growth and survival of bats, in Kunz, T.H., ed., Ecology of bats: New York, Plenum Publishing Corporation, p. 105–150.
Vonhof, M.J., and Barclay, R.M.R., 1996, Roost-site selection and roosting ecology of forest-dwelling bats in southern British Columbia: Canadian Journal of Zoology, vol. 74, p. 1797–1805.
Waldien, D., Hayes, J., and Arnett, E., 2000, Day-roosts of female long-eared myotis in western Oregon: Journal of Wildlife Management, vol. 64, p. 785–796.
Weller, T., and Zabel, C., 2001, Characteristics of fringed myotis day roosts in northern California: Journal of Wildlife Management, vol. 65, p. 489–497.
Yancey, F.D., Jones, C., and Manning, R.W., 1995, The eastern pipistrelle, Pipistrellus subflavus (Chiroptera, Vespertilionidae), from the Big Bend Region of Texas: Texas Journal of Science, vol. 47, p. 229–231.

Survey and Monitoring of Rare Bats inSurvey and Monitoring of Rare Bats inSurvey and Monitoring of Rare Bats inSurvey and Monitoring of Rare Bats inSurvey and Monitoring of Rare Bats in Bottomland Hardwood ForestsBottomland Hardwood ForestsBottomland Hardwood ForestsBottomland Hardwood ForestsBottomland Hardwood Forests
By
Mary Kay Clark
North Carolina State Museum of Natural Sciences 11 W. Jones Street Raleigh, NC 27603
Abstract.Abstract.Abstract.Abstract.Abstract. Survey and monitoring efforts for Rafinesque’s big-eared bat (Corynorhinus rafinesquii) and the southeastern myotis (Myotis austroriparius) are needed in bottomland hardwood forests. These forests occur in a large part of the ranges of these two species, but little is known about the status of populations of these bats in this habitat. The possible rare status of these two species, combined with the documented decline of bottomland hardwood forests in the United States, indicate that survey and monitoring in these areas should be a high priority. Surveys for these bats in seven states that contain large areas of bottomland hardwood forests demonstrate that new records for these species are not difficult to obtain. However, estimation of colony and population sizes has not been feasible for these species. Exploration of alternative methods to determine population status should include evaluation of geospatial technology to develop predictive models.
ords: Distribution, geospatial technology, habitat specificity, population status, Rafinesque’s big-eared bat, southeastern myotis, tree cavity roost. KeyKeyKeyKeyKey WWWWWordsordsordsords
“Not everything that can be counted counts, and not everything that counts can be counted.” Albert Einstein
IntroductionIntroductionIntroductionIntroductionIntroduction
The above quote sums up one of the conundrums that all biologists face when the need arises to enumerate a population—what can be counted and what should be counted?
Ideally, for bats what should be counted are the numbers of individuals in a given area, but aspects of the life histories of bats make it difficult to make the counts or estimates that are needed for population monitoring. Species of bats that are widely dispersed over large forested areas and that roost alone, or in low densities, probably pose the greatest challenges for survey and monitoring. Natural roosts for many of these species include a variety of structural components of trees such as foliage, large and small cavities, and various types of crevices (e.g., loose bark, lightning scars). The broad dispersal patterns of these species, combined with their preference for roosting in inconspicuous structures that are located within vast forested landscapes, makes it difficult to find individuals and colonies. But many of the bats in the United States (U.S.) roost in some type of structural component of trees for at least part of the year
(Pierson, 1998). Forest loss and degradation are of concern throughout the U.S. (Noss and others, 1995), resulting in a need to address survey and monitoring efforts for forest-dwelling bats.
This paper discusses the survey and monitoring challenges and needs for two forest bats, Rafinesque’s big-eared bat (Corynorhinus rafinesquii) (Fig. 1A) and the southeastern myotis (Myotis austroriparius) (Fig. 1B), in the parts of their ranges where they use bottomland hardwood forests (Fig. 2). The objectives of this paper are to review surveys and summarize other available information relevant to population status and the survey and monitoring needs for these two species; describe factors that may affect survey and monitoring design for these species in bottomland hardwood forests; and provide recommendations for study to improve our knowledge of the status of these two species.
BackgroundBackgroundBackgroundBackgroundBackground
The conservation status of bottomland hardwood forests has been of concern to natural resource managers
79
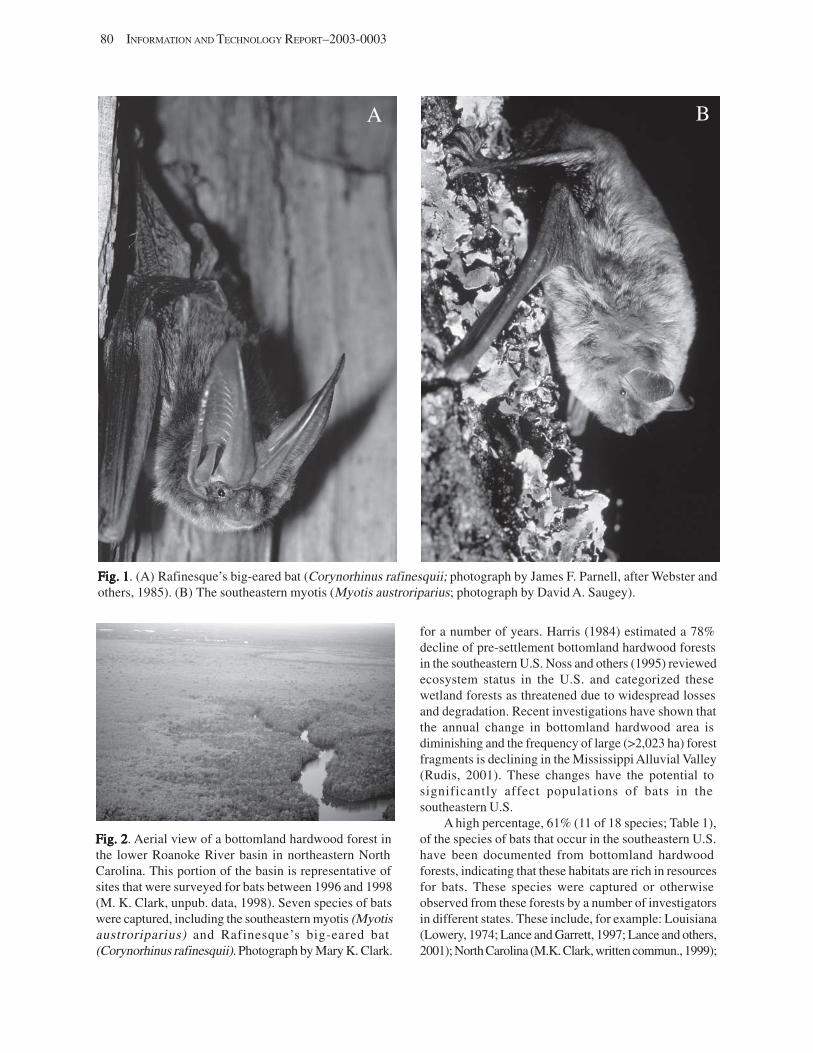
80 INFORMATION AND TECHNOLOGY REPORT–2003-0003
A B
Fig. 1Fig. 1Fig. 1Fig. 1Fig. 1. (A) Rafinesque’s big-eared bat (Corynorhinus rafinesquii; photograph by James F. Parnell, after Webster and others, 1985). (B) The southeastern myotis (Myotis austroriparius; photograph by David A. Saugey).
Fig. 2Fig. 2Fig. 2Fig. 2Fig. 2. Aerial view of a bottomland hardwood forest in the lower Roanoke River basin in northeastern North Carolina. This portion of the basin is representative of sites that were surveyed for bats between 1996 and 1998 (M. K. Clark, unpub. data, 1998). Seven species of bats were captured, including the southeastern myotis (Myotis austroriparius) and Rafinesque’s big-eared bat (Corynorhinus rafinesquii). Photograph by Mary K. Clark.
for a number of years. Harris (1984) estimated a 78% decline of pre-settlement bottomland hardwood forests in the southeastern U.S. Noss and others (1995) reviewed ecosystem status in the U.S. and categorized these wetland forests as threatened due to widespread losses and degradation. Recent investigations have shown that the annual change in bottomland hardwood area is diminishing and the frequency of large (>2,023 ha) forest fragments is declining in the Mississippi Alluvial Valley (Rudis, 2001). These changes have the potential to significantly affect populations of bats in the southeastern U.S.
A high percentage, 61% (11 of 18 species; Table 1), of the species of bats that occur in the southeastern U.S. have been documented from bottomland hardwood forests, indicating that these habitats are rich in resources for bats. These species were captured or otherwise observed from these forests by a number of investigators in different states. These include, for example: Louisiana (Lowery, 1974; Lance and Garrett, 1997; Lance and others, 2001); North Carolina (M.K. Clark, written commun., 1999);
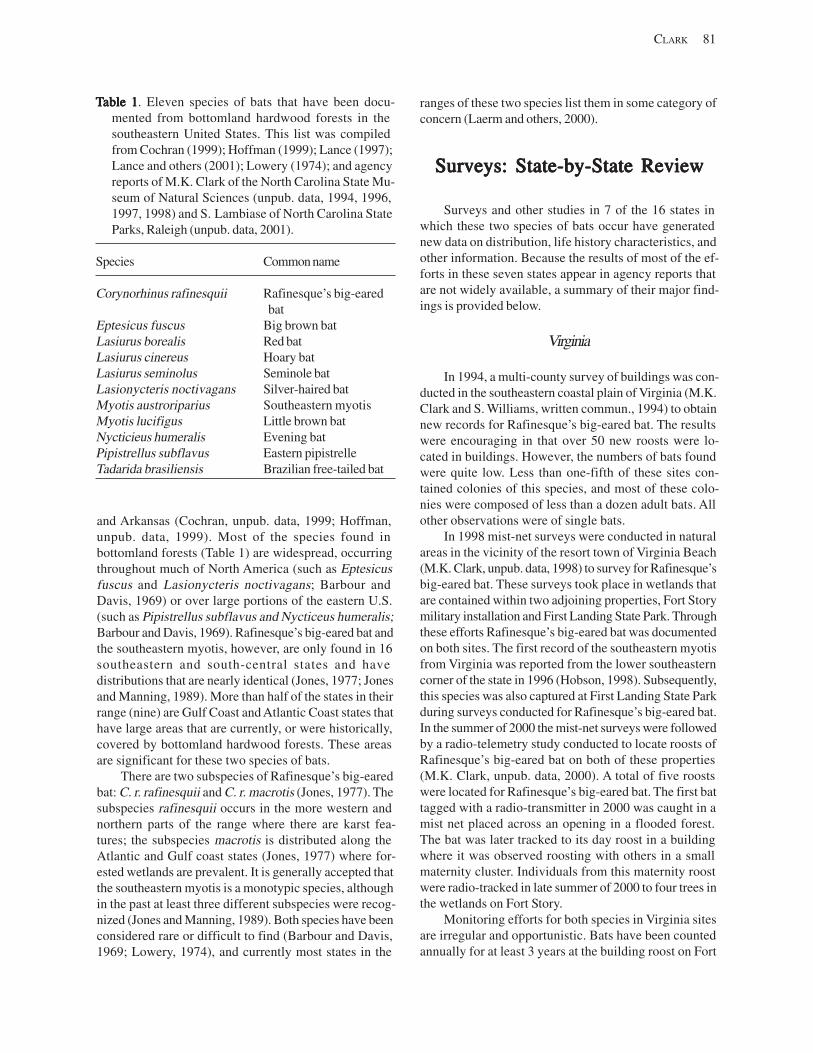
CLARK 81
TTTTTable 1able 1able 1able 1able 1. Eleven species of bats that have been documented from bottomland hardwood forests in the southeastern United States. This list was compiled from Cochran (1999); Hoffman (1999); Lance (1997); Lance and others (2001); Lowery (1974); and agency reports of M.K. Clark of the North Carolina State Museum of Natural Sciences (unpub. data, 1994, 1996, 1997, 1998) and S. Lambiase of North Carolina State Parks, Raleigh (unpub. data, 2001).
Species Common name
Corynorhinus rafinesquii Rafinesque’s big-eared bat
Eptesicus fuscus Big brown bat Lasiurus borealis Red bat Lasiurus cinereus Hoary bat Lasiurus seminolus Seminole bat Lasionycteris noctivagans Silver-haired bat Myotis austroriparius Southeastern myotis Myotis lucifigus Little brown bat Nycticieus humeralis Evening bat Pipistrellus subflavus Eastern pipistrelle Tadarida brasiliensis Brazilian free-tailed bat
and Arkansas (Cochran, unpub. data, 1999; Hoffman, unpub. data, 1999). Most of the species found in bottomland forests (Table 1) are widespread, occurring throughout much of North America (such as Eptesicus fuscus and Lasionycteris noctivagans; Barbour and Davis, 1969) or over large portions of the eastern U.S. (such as Pipistrellus subflavus and Nycticeus humeralis; Barbour and Davis, 1969). Rafinesque’s big-eared bat and the southeastern myotis, however, are only found in 16 southeastern and south-central states and have distributions that are nearly identical (Jones, 1977; Jones and Manning, 1989). More than half of the states in their range (nine) are Gulf Coast and Atlantic Coast states that have large areas that are currently, or were historically, covered by bottomland hardwood forests. These areas are significant for these two species of bats.
There are two subspecies of Rafinesque’s big-eared bat: C. r. rafinesquii and C. r. macrotis (Jones, 1977). The subspecies rafinesquii occurs in the more western and northern parts of the range where there are karst features; the subspecies macrotis is distributed along the Atlantic and Gulf coast states (Jones, 1977) where forested wetlands are prevalent. It is generally accepted that the southeastern myotis is a monotypic species, although in the past at least three different subspecies were recognized (Jones and Manning, 1989). Both species have been considered rare or difficult to find (Barbour and Davis, 1969; Lowery, 1974), and currently most states in the
ranges of these two species list them in some category of concern (Laerm and others, 2000).
Surveys: State-by-State ReviewSurveys: State-by-State ReviewSurveys: State-by-State ReviewSurveys: State-by-State ReviewSurveys: State-by-State Review
Surveys and other studies in 7 of the 16 states in which these two species of bats occur have generated new data on distribution, life history characteristics, and other information. Because the results of most of the efforts in these seven states appear in agency reports that are not widely available, a summary of their major findings is provided below.
Virginia
In 1994, a multi-county survey of buildings was conducted in the southeastern coastal plain of Virginia (M.K. Clark and S. Williams, written commun., 1994) to obtain new records for Rafinesque’s big-eared bat. The results were encouraging in that over 50 new roosts were located in buildings. However, the numbers of bats found were quite low. Less than one-fifth of these sites contained colonies of this species, and most of these colonies were composed of less than a dozen adult bats. All other observations were of single bats.
In 1998 mist-net surveys were conducted in natural areas in the vicinity of the resort town of Virginia Beach (M.K. Clark, unpub. data, 1998) to survey for Rafinesque’s big-eared bat. These surveys took place in wetlands that are contained within two adjoining properties, Fort Story military installation and First Landing State Park. Through these efforts Rafinesque’s big-eared bat was documented on both sites. The first record of the southeastern myotis from Virginia was reported from the lower southeastern corner of the state in 1996 (Hobson, 1998). Subsequently, this species was also captured at First Landing State Park during surveys conducted for Rafinesque’s big-eared bat. In the summer of 2000 the mist-net surveys were followed by a radio-telemetry study conducted to locate roosts of Rafinesque’s big-eared bat on both of these properties (M.K. Clark, unpub. data, 2000). A total of five roosts were located for Rafinesque’s big-eared bat. The first bat tagged with a radio-transmitter in 2000 was caught in a mist net placed across an opening in a flooded forest. The bat was later tracked to its day roost in a building where it was observed roosting with others in a small maternity cluster. Individuals from this maternity roost were radio-tracked in late summer of 2000 to four trees in the wetlands on Fort Story.
Monitoring efforts for both species in Virginia sites are irregular and opportunistic. Bats have been counted annually for at least 3 years at the building roost on Fort
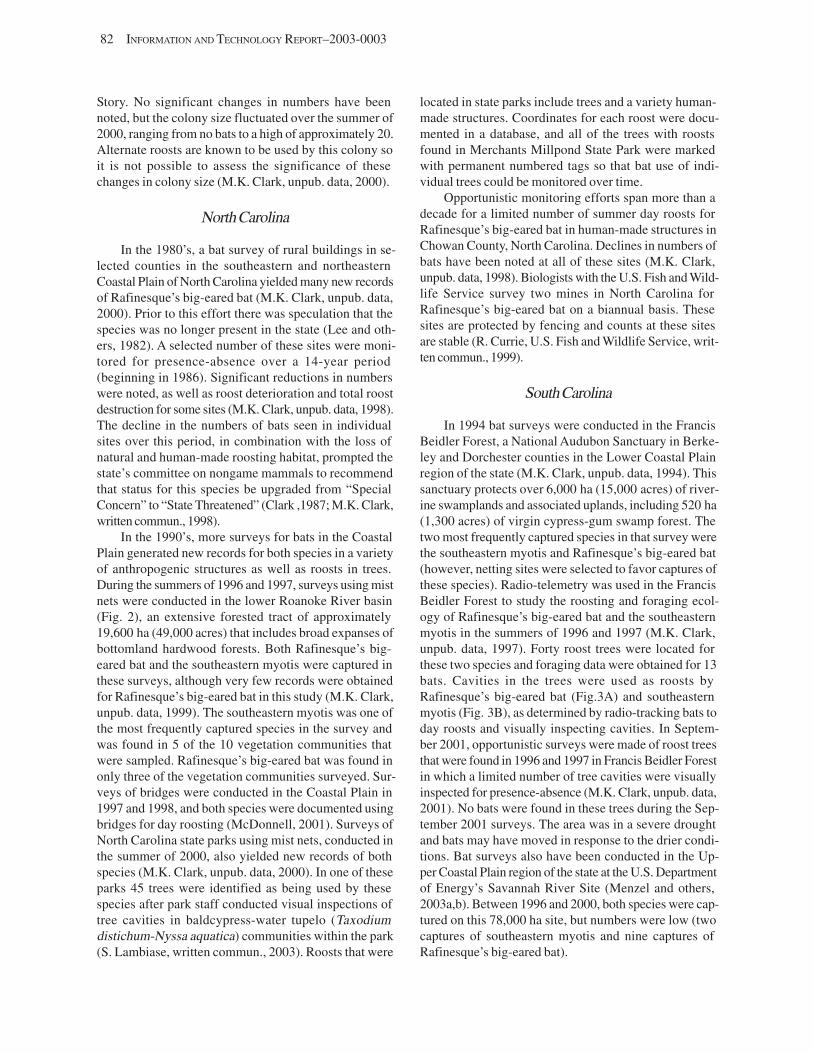
82 INFORMATION AND TECHNOLOGY REPORT–2003-0003
Story. No significant changes in numbers have been noted, but the colony size fluctuated over the summer of 2000, ranging from no bats to a high of approximately 20. Alternate roosts are known to be used by this colony so it is not possible to assess the significance of these changes in colony size (M.K. Clark, unpub. data, 2000).
North Carolina
In the 1980’s, a bat survey of rural buildings in selected counties in the southeastern and northeastern Coastal Plain of North Carolina yielded many new records of Rafinesque’s big-eared bat (M.K. Clark, unpub. data, 2000). Prior to this effort there was speculation that the species was no longer present in the state (Lee and others, 1982). A selected number of these sites were monitored for presence-absence over a 14-year period (beginning in 1986). Significant reductions in numbers were noted, as well as roost deterioration and total roost destruction for some sites (M.K. Clark, unpub. data, 1998). The decline in the numbers of bats seen in individual sites over this period, in combination with the loss of natural and human-made roosting habitat, prompted the state’s committee on nongame mammals to recommend that status for this species be upgraded from “Special Concern” to “State Threatened” (Clark ,1987; M.K. Clark, written commun., 1998).
In the 1990’s, more surveys for bats in the Coastal Plain generated new records for both species in a variety of anthropogenic structures as well as roosts in trees. During the summers of 1996 and 1997, surveys using mist nets were conducted in the lower Roanoke River basin (Fig. 2), an extensive forested tract of approximately 19,600 ha (49,000 acres) that includes broad expanses of bottomland hardwood forests. Both Rafinesque’s big-eared bat and the southeastern myotis were captured in these surveys, although very few records were obtained for Rafinesque’s big-eared bat in this study (M.K. Clark, unpub. data, 1999). The southeastern myotis was one of the most frequently captured species in the survey and was found in 5 of the 10 vegetation communities that were sampled. Rafinesque’s big-eared bat was found in only three of the vegetation communities surveyed. Surveys of bridges were conducted in the Coastal Plain in 1997 and 1998, and both species were documented using bridges for day roosting (McDonnell, 2001). Surveys of North Carolina state parks using mist nets, conducted in the summer of 2000, also yielded new records of both species (M.K. Clark, unpub. data, 2000). In one of these parks 45 trees were identified as being used by these species after park staff conducted visual inspections of tree cavities in baldcypress-water tupelo (Taxodium distichum-Nyssa aquatica) communities within the park (S. Lambiase, written commun., 2003). Roosts that were
located in state parks include trees and a variety human-made structures. Coordinates for each roost were documented in a database, and all of the trees with roosts found in Merchants Millpond State Park were marked with permanent numbered tags so that bat use of individual trees could be monitored over time.
Opportunistic monitoring efforts span more than a decade for a limited number of summer day roosts for Rafinesque’s big-eared bat in human-made structures in Chowan County, North Carolina. Declines in numbers of bats have been noted at all of these sites (M.K. Clark, unpub. data, 1998). Biologists with the U.S. Fish and Wildlife Service survey two mines in North Carolina for Rafinesque’s big-eared bat on a biannual basis. These sites are protected by fencing and counts at these sites are stable (R. Currie, U.S. Fish and Wildlife Service, written commun., 1999).
South Carolina
In 1994 bat surveys were conducted in the Francis Beidler Forest, a National Audubon Sanctuary in Berkeley and Dorchester counties in the Lower Coastal Plain region of the state (M.K. Clark, unpub. data, 1994). This sanctuary protects over 6,000 ha (15,000 acres) of riverine swamplands and associated uplands, including 520 ha (1,300 acres) of virgin cypress-gum swamp forest. The two most frequently captured species in that survey were the southeastern myotis and Rafinesque’s big-eared bat (however, netting sites were selected to favor captures of these species). Radio-telemetry was used in the Francis Beidler Forest to study the roosting and foraging ecology of Rafinesque’s big-eared bat and the southeastern myotis in the summers of 1996 and 1997 (M.K. Clark, unpub. data, 1997). Forty roost trees were located for these two species and foraging data were obtained for 13 bats. Cavities in the trees were used as roosts by Rafinesque’s big-eared bat (Fig.3A) and southeastern myotis (Fig. 3B), as determined by radio-tracking bats to day roosts and visually inspecting cavities. In September 2001, opportunistic surveys were made of roost trees that were found in 1996 and 1997 in Francis Beidler Forest in which a limited number of tree cavities were visually inspected for presence-absence (M.K. Clark, unpub. data, 2001). No bats were found in these trees during the September 2001 surveys. The area was in a severe drought and bats may have moved in response to the drier conditions. Bat surveys also have been conducted in the Upper Coastal Plain region of the state at the U.S. Department of Energy’s Savannah River Site (Menzel and others, 2003a,b). Between 1996 and 2000, both species were captured on this 78,000 ha site, but numbers were low (two captures of southeastern myotis and nine captures of Rafinesque’s big-eared bat).
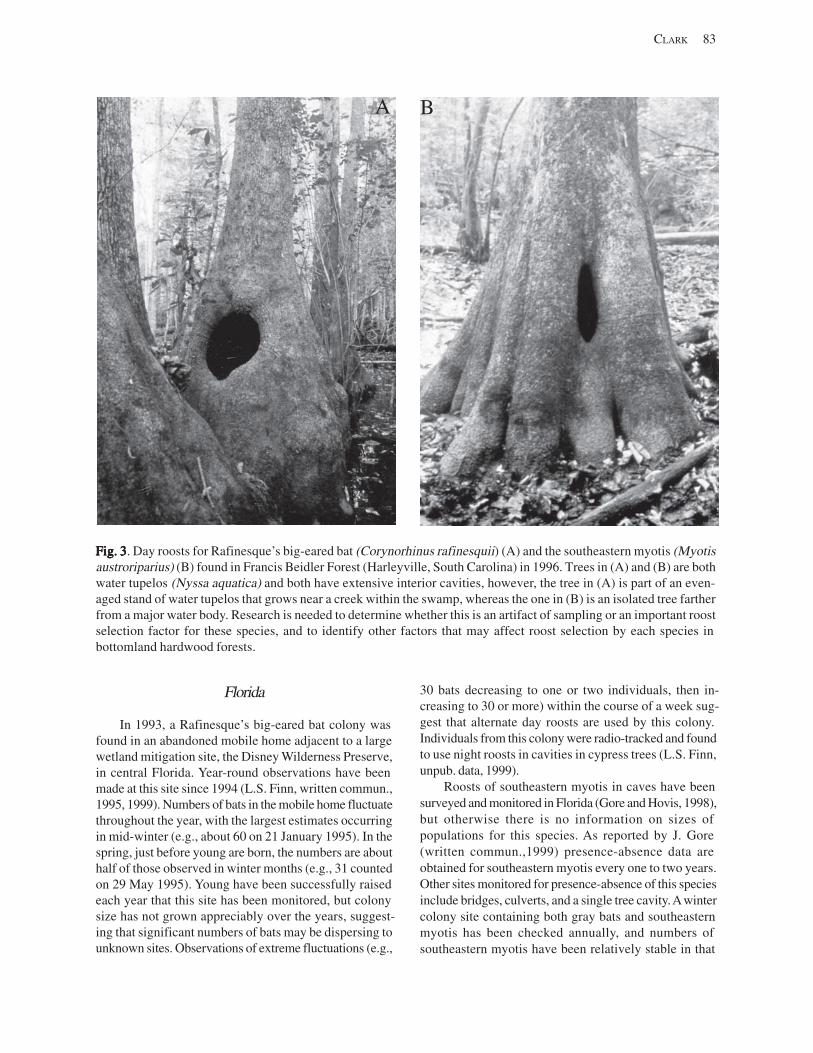
CLARK 83
A B
Fig. 3Fig. 3Fig. 3Fig. 3Fig. 3. Day roosts for Rafinesque’s big-eared bat (Corynorhinus rafinesquii) (A) and the southeastern myotis (Myotis austroriparius) (B) found in Francis Beidler Forest (Harleyville, South Carolina) in 1996. Trees in (A) and (B) are both water tupelos (Nyssa aquatica) and both have extensive interior cavities, however, the tree in (A) is part of an even-aged stand of water tupelos that grows near a creek within the swamp, whereas the one in (B) is an isolated tree farther from a major water body. Research is needed to determine whether this is an artifact of sampling or an important roost selection factor for these species, and to identify other factors that may affect roost selection by each species in bottomland hardwood forests.
Florida
In 1993, a Rafinesque’s big-eared bat colony was found in an abandoned mobile home adjacent to a large wetland mitigation site, the Disney Wilderness Preserve, in central Florida. Year-round observations have been made at this site since 1994 (L.S. Finn, written commun., 1995, 1999). Numbers of bats in the mobile home fluctuate throughout the year, with the largest estimates occurring in mid-winter (e.g., about 60 on 21 January 1995). In the spring, just before young are born, the numbers are about half of those observed in winter months (e.g., 31 counted on 29 May 1995). Young have been successfully raised each year that this site has been monitored, but colony size has not grown appreciably over the years, suggesting that significant numbers of bats may be dispersing to unknown sites. Observations of extreme fluctuations (e.g.,
30 bats decreasing to one or two individuals, then increasing to 30 or more) within the course of a week suggest that alternate day roosts are used by this colony. Individuals from this colony were radio-tracked and found to use night roosts in cavities in cypress trees (L.S. Finn, unpub. data, 1999).
Roosts of southeastern myotis in caves have been surveyed and monitored in Florida (Gore and Hovis, 1998), but otherwise there is no information on sizes of populations for this species. As reported by J. Gore (written commun.,1999) presence-absence data are obtained for southeastern myotis every one to two years. Other sites monitored for presence-absence of this species include bridges, culverts, and a single tree cavity.A winter colony site containing both gray bats and southeastern myotis has been checked annually, and numbers of southeastern myotis have been relatively stable in that
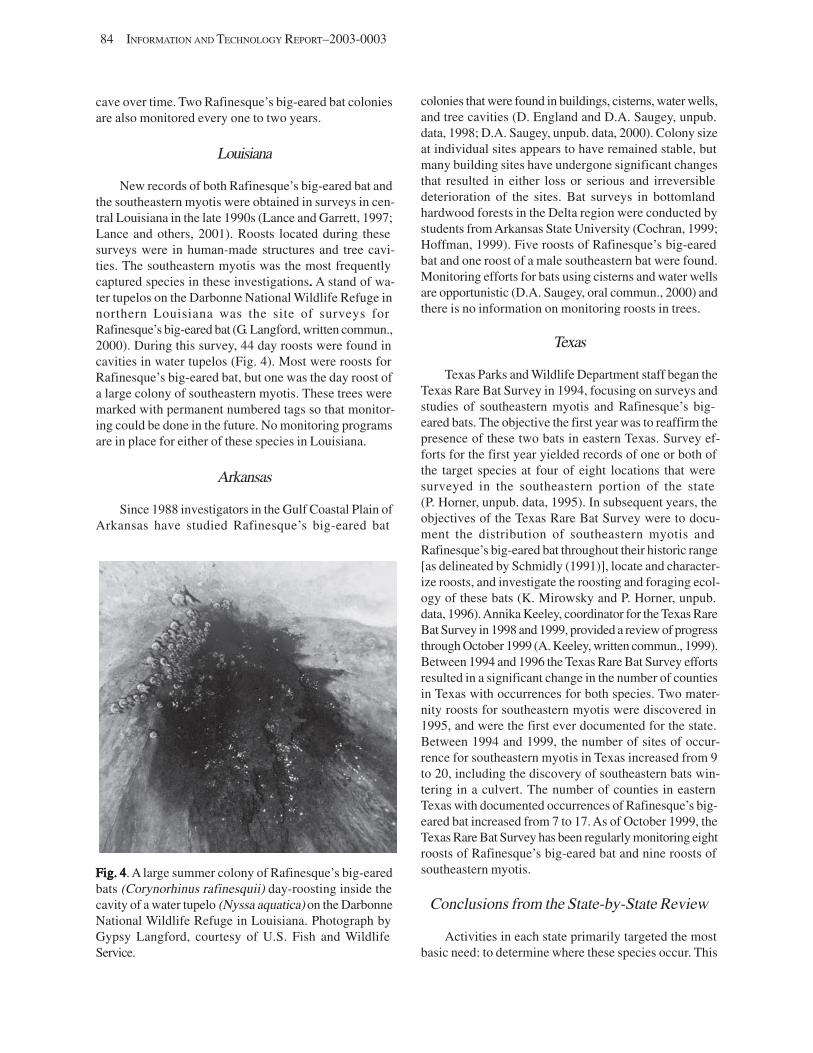
84 INFORMATION AND TECHNOLOGY REPORT–2003-0003
cave over time. Two Rafinesque’s big-eared bat colonies are also monitored every one to two years.
Louisiana
New records of both Rafinesque’s big-eared bat and the southeastern myotis were obtained in surveys in central Louisiana in the late 1990s (Lance and Garrett, 1997; Lance and others, 2001). Roosts located during these surveys were in human-made structures and tree cavities. The southeastern myotis was the most frequently captured species in these investigations..... A stand of water tupelos on the Darbonne National Wildlife Refuge in northern Louisiana was the site of surveys for Rafinesque’s big-eared bat (G. Langford, written commun., 2000). During this survey, 44 day roosts were found in cavities in water tupelos (Fig. 4). Most were roosts for Rafinesque’s big-eared bat, but one was the day roost of a large colony of southeastern myotis. These trees were marked with permanent numbered tags so that monitoring could be done in the future. No monitoring programs are in place for either of these species in Louisiana.
Arkansas
Since 1988 investigators in the Gulf Coastal Plain of Arkansas have studied Rafinesque’s big-eared bat
Fig. 4Fig. 4Fig. 4Fig. 4Fig. 4. A large summer colony of Rafinesque’s big-eared bats (Corynorhinus rafinesquii) day-roosting inside the cavity of a water tupelo (Nyssa aquatica) on the Darbonne National Wildlife Refuge in Louisiana. Photograph by Gypsy Langford, courtesy of U.S. Fish and Wildlife Service.
colonies that were found in buildings, cisterns, water wells, and tree cavities (D. England and D.A. Saugey, unpub. data, 1998; D.A. Saugey, unpub. data, 2000). Colony size at individual sites appears to have remained stable, but many building sites have undergone significant changes that resulted in either loss or serious and irreversible deterioration of the sites. Bat surveys in bottomland hardwood forests in the Delta region were conducted by students from Arkansas State University (Cochran, 1999; Hoffman, 1999). Five roosts of Rafinesque’s big-eared bat and one roost of a male southeastern bat were found. Monitoring efforts for bats using cisterns and water wells are opportunistic (D.A. Saugey, oral commun., 2000) and there is no information on monitoring roosts in trees.
Texas
Texas Parks and Wildlife Department staff began the Texas Rare Bat Survey in 1994, focusing on surveys and studies of southeastern myotis and Rafinesque’s big-eared bats. The objective the first year was to reaffirm the presence of these two bats in eastern Texas. Survey efforts for the first year yielded records of one or both of the target species at four of eight locations that were surveyed in the southeastern portion of the state (P. Horner, unpub. data, 1995). In subsequent years, the objectives of the Texas Rare Bat Survey were to document the distribution of southeastern myotis and Rafinesque’s big-eared bat throughout their historic range [as delineated by Schmidly (1991)], locate and characterize roosts, and investigate the roosting and foraging ecology of these bats (K. Mirowsky and P. Horner, unpub. data, 1996). Annika Keeley, coordinator for the Texas Rare Bat Survey in 1998 and 1999, provided a review of progress through October 1999 (A. Keeley, written commun., 1999). Between 1994 and 1996 the Texas Rare Bat Survey efforts resulted in a significant change in the number of counties in Texas with occurrences for both species. Two maternity roosts for southeastern myotis were discovered in 1995, and were the first ever documented for the state. Between 1994 and 1999, the number of sites of occurrence for southeastern myotis in Texas increased from 9 to 20, including the discovery of southeastern bats wintering in a culvert. The number of counties in eastern Texas with documented occurrences of Rafinesque’s big-eared bat increased from 7 to 17. As of October 1999, the Texas Rare Bat Survey has been regularly monitoring eight roosts of Rafinesque’s big-eared bat and nine roosts of southeastern myotis.
Conclusions from the State-by-State Review
Activities in each state primarily targeted the most basic need: to determine where these species occur. This
CLARK 85
is not surprising because the lack of data range wide for Rafinesque’s big-eared bat and the southeastern myotis is often cited as a reason that these species are listed in some category of concern (Clark, 1987; U.S. Fish and Wildlife Service, 1994). New records were obtained in all states where surveys were conducted for one or both of these species. The findings from all of these states support Lowery’s (1974) contention that with some effort, many new records for southeastern myotis can be obtained. Results from these states also indicate that this is also the case for Rafinesque’s big-eared bat. Other than the two mines monitored for Rafinesque’s big-eared bat in North Carolina, and the caves that are monitored in Florida for the southeastern myotis, there are no regular monitoring efforts for these two species.
Surveys in most of these states included efforts to locate natural roosts as well as those in anthropogenic structures. Cavities used as night roosts were identified in two states (Florida and South Carolina) and there are now numerous trees identified as day-roosts for these species. Although six of the states (Virginia, North Carolina, South Carolina, Louisiana, Texas, and Arkansas) reported finding one or both species day-roosting in tree cavities, most of these types of roosts were found in three states (South Carolina, North Carolina, and Louisiana each identified 40 or more tree cavities that were used by these two species). The large numbers of trees found in those states can be attributed to intentional concentration of field efforts in continuous tracts of bottomland hardwood forests (Francis Beidler Forest, South Carolina; Darbonne National Wildlife Refuge, Louisiana; and Merchants Millpond State Park, North Carolina) where the goals were to learn more about the natural roosts used by these bats. None of these sites contained anthropogenic structures used as roosts. Each of these sites is managed to conserve natural resources by public or private entities, and were known to contain large stands of mature baldcypress-water tupelo swamp forest (Francis Beidler Forest, Merchants Millpond State Park) or a nearly pure stand of mature water tupelos (Darbonne National Wildlife Refuge).
Survey methods used most often were mist-netting and visual inspections of both anthropogenic structures and basal cavities in trees. Radio-telemetry was used successfully to locate roosting sites and foraging areas in six states (Virginia, North Carolina, South Carolina, Florida, Louisiana, and Texas). Visual inspections of basal cavities in trees proved to be an effective means of finding new roost sites for both species in four states (Virginia, North Carolina, South Carolina, and Texas). Two examples from state survey efforts illustrate the value of this method for survey: (1) Hobson (1998) documented the first record of the southeastern myotis in Virginia after he found a roost of this species by visually inspecting a tree cavity;
and (2) this was the only method used in surveys conducted in 2002 and 2003 in Merchants Millpond State Park in North Carolina, where 45 tree cavities were found to be used by both Rafinesque’s big-eared bats and southeastern myotis. Investigations that used radio-telemetry as a means to locate roosts also supplemented those efforts by using the visual inspection method, often finding roosts that were used by bats that were not radio-tagged.
FactorsFactorsFactorsFactorsFactors AfAfAfAfAffecting Survey andfecting Survey andfecting Survey andfecting Survey andfecting Survey and Monitoring SuccessMonitoring SuccessMonitoring SuccessMonitoring SuccessMonitoring Success
Bottomland hardwood forests are challenging environments in which to work. Gaining access to study sites requires a considerable amount of planning and resources. These forests are characterized by variable hydrology, ranging from some relatively dry soils on ridges to saturated soils and areas that are flooded temporarily, permanently, semipermanently, intermittently, and seasonally. These hydrologic conditions have largely prevented development and widespread road-building in these areas, resulting in the preservation of some large tracts of unfragmented forested wetlands (Fig. 2). This is good for wildlife, but challenging for the biologist.
A combination of travel methods may be needed in order to transport equipment and personnel to selected sites. This includes transport over land by four-wheel drive vehicles, boating to sites in various types of watercraft, and significant foot travel..... Initially, it is essential to consult maps, aerial photographs, and all other materials that aid in the identification of desired study site characteristics and access points, and to work with knowledgeable people in the area, including local residents. It is also helpful to conduct an aerial reconnaissance of the area to gain a landscape perspective and assist in the identification of access points..... All of these factors make studies in bottomland forests equipment- and labor-intensive.
Key to any bat survey is knowledge of the roosting ecology of the target species. Roost availability may limit the distribution of bats (Kunz, 1982). Rafinesque’s big-eared bat and the southeastern myotis both roost in a variety of human-made and natural structures including buildings, mines, and caves (Jones, 1977; Jones and Manning, 1989). Trees that are used by these species for day roosts are found only where certain conditions occur, may not be abundant on the landscape for a number of reasons, may not be as stable as other kinds of roosts (caves, mines, buildings) and may occur in patches. Significant differences in roosting ecology may occur between bats using roosts that are distributed more randomly than tree roosts and bats occurring in areas
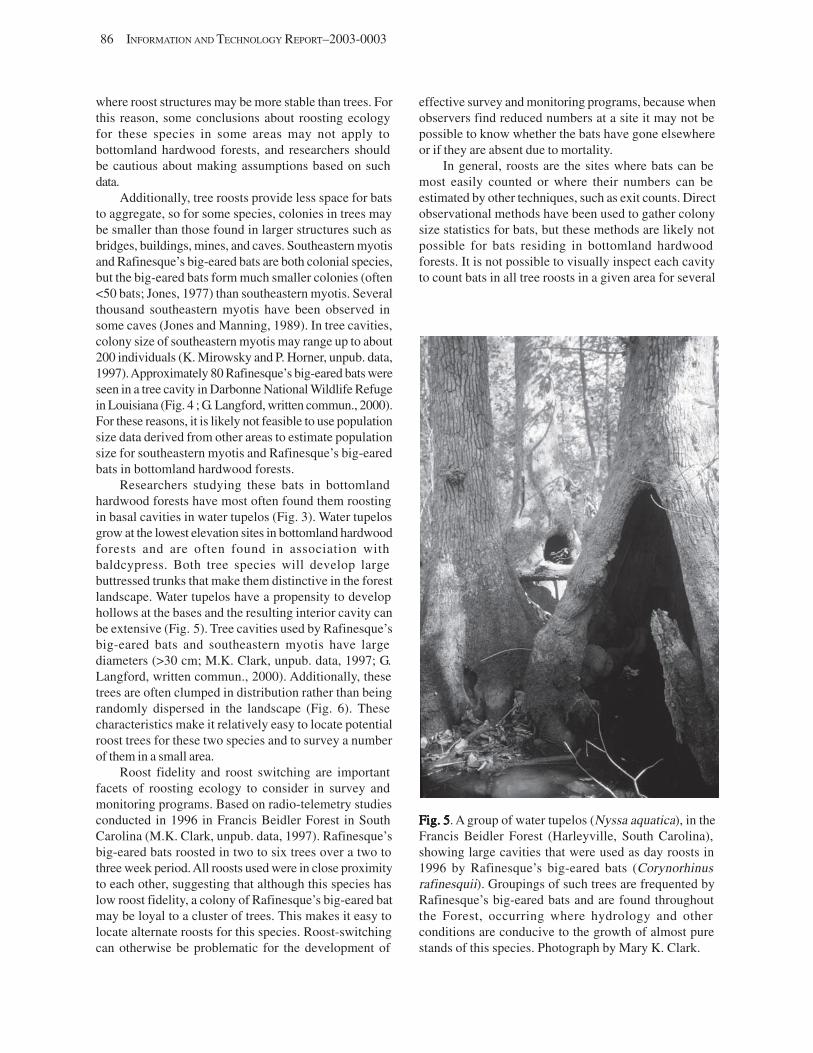
86 INFORMATION AND TECHNOLOGY REPORT–2003-0003
where roost structures may be more stable than trees. For this reason, some conclusions about roosting ecology for these species in some areas may not apply to bottomland hardwood forests, and researchers should be cautious about making assumptions based on such data.
Additionally, tree roosts provide less space for bats to aggregate, so for some species, colonies in trees may be smaller than those found in larger structures such as bridges, buildings, mines, and caves. Southeastern myotis and Rafinesque’s big-eared bats are both colonial species, but the big-eared bats form much smaller colonies (often <50 bats; Jones, 1977) than southeastern myotis. Several thousand southeastern myotis have been observed in some caves (Jones and Manning, 1989). In tree cavities, colony size of southeastern myotis may range up to about 200 individuals (K. Mirowsky and P. Horner, unpub. data, 1997). Approximately 80 Rafinesque’s big-eared bats were seen in a tree cavity in Darbonne National Wildlife Refuge in Louisiana (Fig. 4 ; G. Langford, written commun., 2000). For these reasons, it is likely not feasible to use population size data derived from other areas to estimate population size for southeastern myotis and Rafinesque’s big-eared bats in bottomland hardwood forests.
Researchers studying these bats in bottomland hardwood forests have most often found them roosting in basal cavities in water tupelos (Fig. 3). Water tupelos grow at the lowest elevation sites in bottomland hardwood forests and are often found in association with baldcypress. Both tree species will develop large buttressed trunks that make them distinctive in the forest landscape. Water tupelos have a propensity to develop hollows at the bases and the resulting interior cavity can be extensive (Fig. 5). Tree cavities used by Rafinesque’s big-eared bats and southeastern myotis have large diameters (>30 cm; M.K. Clark, unpub. data, 1997; G. Langford, written commun., 2000). Additionally, these trees are often clumped in distribution rather than being randomly dispersed in the landscape (Fig. 6). These characteristics make it relatively easy to locate potential roost trees for these two species and to survey a number of them in a small area.
Roost fidelity and roost switching are important facets of roosting ecology to consider in survey and monitoring programs. Based on radio-telemetry studies conducted in 1996 in Francis Beidler Forest in South Carolina (M.K. Clark, unpub. data, 1997). Rafinesque’s big-eared bats roosted in two to six trees over a two to three week period. All roosts used were in close proximity to each other, suggesting that although this species has low roost fidelity, a colony of Rafinesque’s big-eared bat may be loyal to a cluster of trees. This makes it easy to locate alternate roosts for this species. Roost-switching can otherwise be problematic for the development of
effective survey and monitoring programs, because when observers find reduced numbers at a site it may not be possible to know whether the bats have gone elsewhere or if they are absent due to mortality.
In general, roosts are the sites where bats can be most easily counted or where their numbers can be estimated by other techniques, such as exit counts. Direct observational methods have been used to gather colony size statistics for bats, but these methods are likely not possible for bats residing in bottomland hardwood forests. It is not possible to visually inspect each cavity to count bats in all tree roosts in a given area for several
Fig. 5Fig. 5Fig. 5Fig. 5Fig. 5. A group of water tupelos (Nyssa aquatica), in the Francis Beidler Forest (Harleyville, South Carolina), showing large cavities that were used as day roosts in 1996 by Rafinesque’s big-eared bats (Corynorhinus rafinesquii). Groupings of such trees are frequented by Rafinesque’s big-eared bats and are found throughout the Forest, occurring where hydrology and other conditions are conducive to the growth of almost pure stands of this species. Photograph by Mary K. Clark.
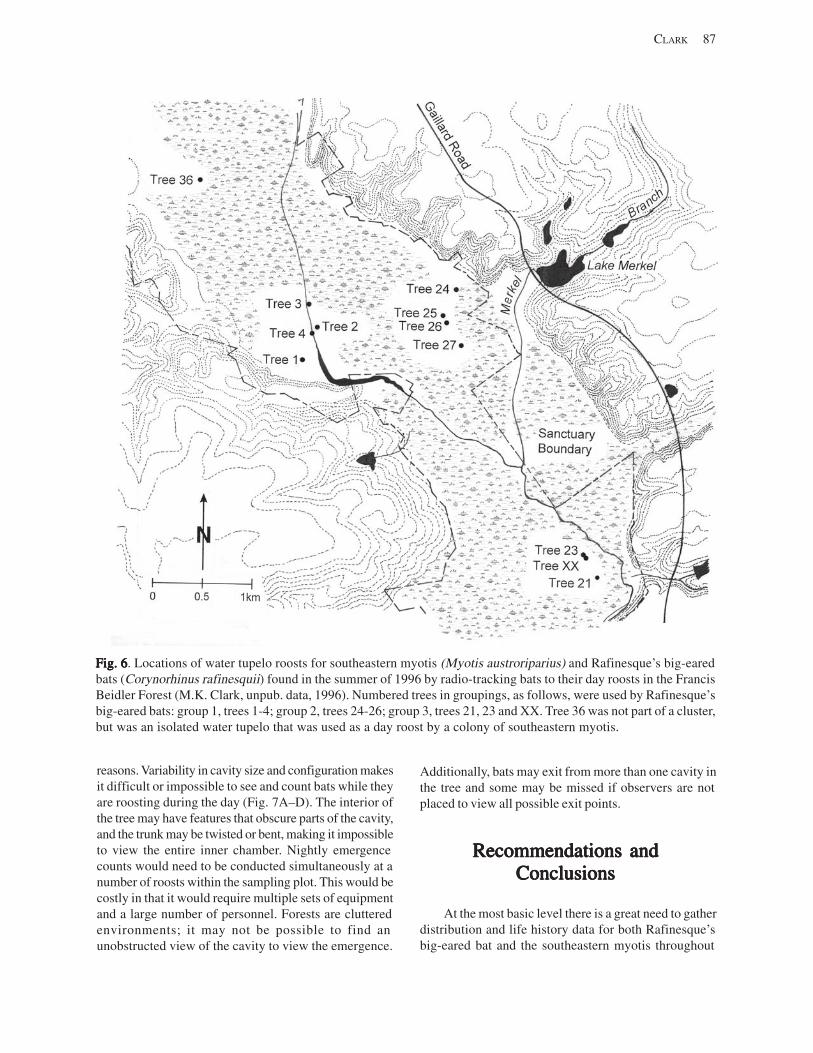
CLARK 87
Fig. 6Fig. 6Fig. 6Fig. 6Fig. 6. Locations of water tupelo roosts for southeastern myotis (Myotis austroriparius) and Rafinesque’s big-eared bats (Corynorhinus rafinesquii) found in the summer of 1996 by radio-tracking bats to their day roosts in the Francis Beidler Forest (M.K. Clark, unpub. data, 1996). Numbered trees in groupings, as follows, were used by Rafinesque’s big-eared bats: group 1, trees 1-4; group 2, trees 24-26; group 3, trees 21, 23 and XX. Tree 36 was not part of a cluster, but was an isolated water tupelo that was used as a day roost by a colony of southeastern myotis.
reasons. Variability in cavity size and configuration makes it difficult or impossible to see and count bats while they are roosting during the day (Fig. 7A–D). The interior of the tree may have features that obscure parts of the cavity, and the trunk may be twisted or bent, making it impossible to view the entire inner chamber. Nightly emergence counts would need to be conducted simultaneously at a number of roosts within the sampling plot. This would be costly in that it would require multiple sets of equipment and a large number of personnel. Forests are cluttered environments; it may not be possible to find an unobstructed view of the cavity to view the emergence.
Additionally, bats may exit from more than one cavity in the tree and some may be missed if observers are not placed to view all possible exit points.
Recommendations andRecommendations andRecommendations andRecommendations andRecommendations and ConclusionsConclusionsConclusionsConclusionsConclusions
At the most basic level there is a great need to gather distribution and life history data for both Rafinesque’s big-eared bat and the southeastern myotis throughout
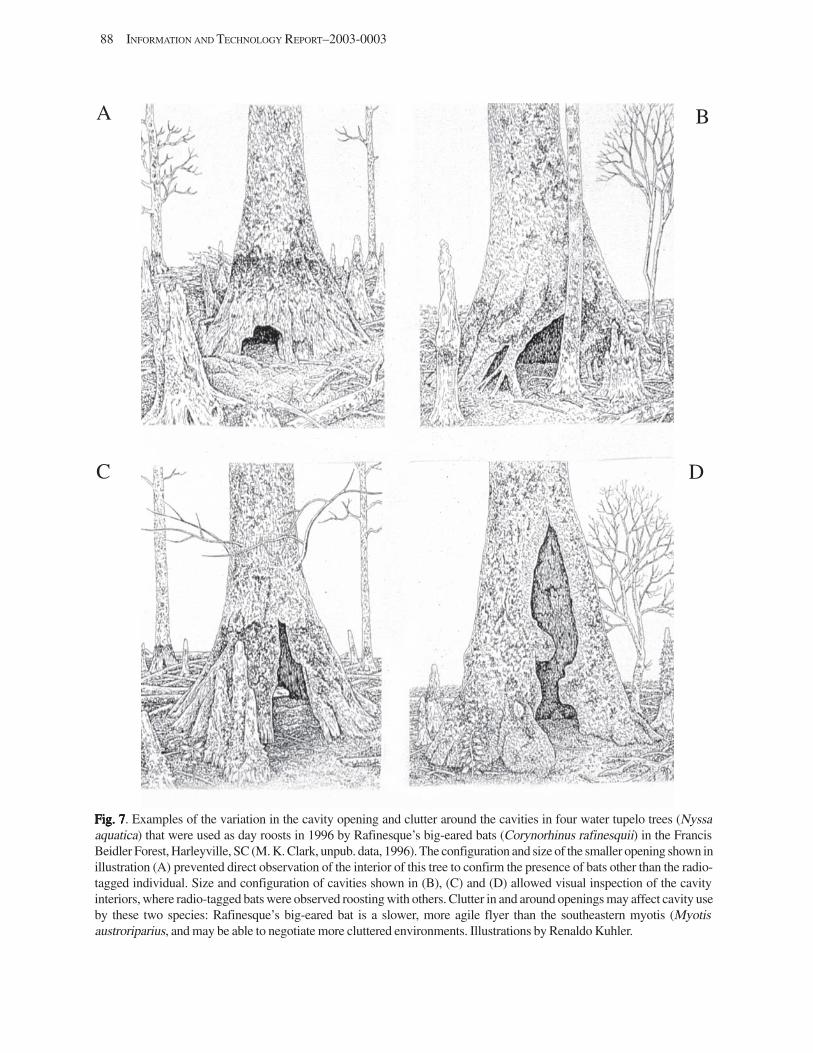
88 INFORMATION AND TECHNOLOGY REPORT–2003-0003
A
C D
B
Fig. 7Fig. 7Fig. 7Fig. 7Fig. 7. Examples of the variation in the cavity opening and clutter around the cavities in four water tupelo trees (Nyssa aquatica) that were used as day roosts in 1996 by Rafinesque’s big-eared bats (Corynorhinus rafinesquii) in the Francis Beidler Forest, Harleyville, SC (M. K. Clark, unpub. data, 1996). The configuration and size of the smaller opening shown in illustration (A) prevented direct observation of the interior of this tree to confirm the presence of bats other than the radio-tagged individual. Size and configuration of cavities shown in (B), (C) and (D) allowed visual inspection of the cavity interiors, where radio-tagged bats were observed roosting with others. Clutter in and around openings may affect cavity use by these two species: Rafinesque’s big-eared bat is a slower, more agile flyer than the southeastern myotis (Myotis austroriparius, and may be able to negotiate more cluttered environments. Illustrations by Renaldo Kuhler.
the geographic ranges of these species. Survey and monitoring efforts for these two species in bottomland hardwood forests should be given high priority. These forests constitute a large portion of the regions used by these two species (occurring in over half the states in their ranges), but these ecosystems have experienced significant loss and degradation (Noss and others, 1995). These bats also show some degree of habitat specificity to a limited habitat type (cypress-gum swamp forest) that occurs within bottomland hardwood forests.
Bottomland hardwood forests are highly variable in terms of their quality and potential to provide adequate roosting habitat for Rafinesque’s big-eared bats and southeastern myotis. Information on habitat quality and its effects on distribution and population size of these bats is needed. Optimal and suboptimal roosting habitat should be identified in bottomland hardwood forests. Results from the most pristine situations should be considered the baseline for comparison to other situations. Conditions in high quality (undisturbed) mature bottomland forests may provide population size and trend information that is most representative of natural conditions before European settlement.
The use of infrared technology for locating and counting bats in tree cavities warrants some consideration as a survey method in bottomland hardwood forests. Two locations where a high number of roost trees have been found (Darbonne National Wildlife in Louisiana and Merchants Millpond State Park in North Carolina) would make good test sites for this technique because they are on public lands, some baseline data are available at each of these sites, roost trees are permanently marked with unique numbers to permit future monitoring, and both sites have high density bat use in a discrete area (vs. clusters of trees spread throughout a larger landscape).
There may be enough data available on the natural history of these species and their use of bottomland hardwood forests to develop predictive habitat models for each species. Predictive habitat models aim to simulate the geographic distribution of organisms using geospatial technology, a set of explanatory variables, and statistical models. Once a statistical model has been formulated and the explanatory variables are mapped, the distribution and abundance of species or habitats in space can be predicted. Although it may not be possible to make abundance predictions for the target species, this technique should allow for better assessments of their status based on the distribution and size of available habitat. Additionally, a historical review of the land-use practices that affect bottomland hardwood forests in the southeastern U.S. may provide some insight into the historical range and distribution of these two species,
CLARK 89
and help to identify the factors that may have affected their distribution and population status over time.
The success of survey efforts in Arkansas, the Carolinas, Florida, Louisiana, Texas, and Virginia should encourage and inspire others to devote resources to learn more about the distribution and habitat preferences of these two species. This information is needed to provide baseline data for monitoring populations. Bottomland hardwood forests likely contain some of the best remaining continuous habitat for Rafinesque’s big-eared bat and southeastern myotis, but in order to understand their range-wide status it will be important to study populations in other systems as well. It is clear that anthropogenic structures (such as bridges and cisterns) are important roosting sites for these two species and the role that these types of roosts play in population status should be assessed. The loss of more permanent types of human-made roosts, such as the water wells and cisterns used by wintering Rafinesque’s big-eared bats in Arkansas, should be further investigated. Loss of these structures for wintering aggregations may render this species unable to maintain viable population levels in its current range in southern Arkansas (D. Saugey, written commun., 2000).
AcknowledgmentsAcknowledgmentsAcknowledgmentsAcknowledgmentsAcknowledgments
I am grateful to the following colleagues for sharing their unpublished data with me: Shawn Cochran, Laura Finn, Jeff Gore, Vernon Hoffman, Peggy Horner, Annika Keeley, Richard Lance, Gypsy Langford, Alex Menzel, Katy Mirowsky, and David Saugey. This paper was vastly improved by review comments provided by Jeff Gore and David Saugey.A number of federal and state agencies, as well as nonprofit groups, supported the work described in this paper, including The North Carolina State Museum of Natural Sciences, North Carolina Natural Heritage Trust, North Carolina State Parks, North Carolina Wildlife Resources Commission-Nongame Division, the U.S. Geological Survey Biological Resources Division, U.S. Department of Defense, U.S. Forest Service, U.S. Fish and Wildlife Service, The Audubon Society, Bat Conservation International, Disney Wilderness Preserve and various chapters of the Nature Conservancy. I am especially grateful for the invitation to participate in the Bat Population Monitoring Workshop, which provided the incentive to organize thoughts on this subject, and for the opportunity to assist in the process of advancing surveying and monitoring efforts for bats.
90 INFORMATION AND TECHNOLOGY REPORT–2003-0003
References CitedReferences CitedReferences CitedReferences CitedReferences Cited
Barbour, R.W., and Davis, W.H., 1969, Bats of America: Lexington, University Press of Kentucky, 286 p.
Clark, M.K., 1987, Endangered, threatened and rare fauna of North Carolina, Part I: A re-evaluation of the mammals: Occasional Papers of the North Carolina Biological Survey, 1987-3, p. 1–52.
Cochran, S.M., 1999, Roosting and habitat use by Rafinesque’s big-eared bat and other species in a bottomland hardwood forest ecosystem: Jonesboro, Arkansas State University, M.S. thesis, 50 p.
Gore, J.A., and Hovis, J.A., 1998, Status and conservation of southeastern myotis maternity colonies in Florida caves: Florida Scientist, vol. 61, p. 160–170.
Harris, L.D., 1984, Bottomland hardwoods: valuable, vanishing, vulnerable: Florida Cooperative Extension Service, University of Florida, Gainesville.
Hobson, C.S., 1998, Bat records from southeastern Virginia, including a new resident species, Myotis austroriparius (Chiroptera: Vespertilionidae): Banisteria, vol. 12, p. 8–23.
Hoffman, V.E. III, 1999, Roosting and relative abundance of the southeastern myotis, Myotis austroriparius, in a bottomland hardwood forest: Arkansas State University, Jonesboro, M.S. thesis, 35 p.
Jones, C., 1977, Plecotus rafinesquii.: Mammalian Species, vol. 69, 1–4.
Jones, C., and Manning, R.W., 1989, Myotis austroriparius: Mammalian Species, vol. 332, p. 1–3.
Kunz, T.H., 1982, Roosting ecology of bats, in Kunz, T.H., ed.: Ecology of bats, New York, N.Y., Plenum Press, p. 1–55.
Laerm, J., Ford, W.M., and Chapman, B.R., 2000, Conservation status of terrestrial mammals of the southeastern United States, in Chapman, B.R., and Laerm, J., eds., Fourth Colloquium on conservation of mammals in the southeastern United States: Occasional Papers of the North Carolina Museum of Natural Sciences and the North Carolina Biological Survey, no. 12, 92 p.
Lance, R.F., and Garrett, R.W., 1997, Bats of the Kisatchie National Forest: Texas Journal of Science 49 (supplement), p. 181–189.
Lance, R.F., Hardcastle, B.T., Talley, A., and Leberg, P.A., 2001, Day-roost selection by Rafinesque’s big-eared bats (Corynorhinus rafinesquii) in Louisiana forests: Journal of Mammalogy, vol. 82, p. 166–172.
Lee, D.S., Funderburg, Jr., J.B., and Clark, M.K., 1982, A distributional survey of North Carolina mammals: Occasional Papers of the North Carolina Biological Survey, no. 10, 70 p.
Lowery, G.H. Jr., 1974, The mammals of Louisiana and its adjacent waters: Baton Rouge, Louisiana State University Press, 565 p.
McDonnell, J.E., 2001, Use of bridges as day roosts by bats in the North Carolina Coastal Plain: North Carolina State University, Raleigh, M.S. thesis, 74 p.
Menzel, J.M., Menzel, M.A., Ford, W.M., Edwards, J.W., Sheffield, S.R., Kilgo, J.C., and Bunch, M.S., 2003a, The distribution of the bats of South Carolina: Southeastern Naturalist, vol. 2, p. 121–152.
Menzel, M.A., Menzel, J.M., Kilgo, J.C., Ford, W.M., Carter, T.C., and Edwards, J.W., 2003b, Bats of the Savannah River site and vicinity: General Technical Report SRS68, Asheville, NC: U.S. Department of Agriculture, Forest Service, Southern Research Station, 69 p.
Noss, R.F., LaRoe, III, E.T., Scott, J.M., 1995, Endangered ecosystems of the United States: A preliminary assessment of loss and degradation: Biological Report 28, U.S. Department of the Interior, National Biological Service, Washington D.C.
Pierson, E.D., 1998, Tall trees, deep holes and scarred landscapes: Conservation biology of North American bats, in Kunz, T.H., and Racey, P.A., eds., Bat biology and conservation: Smithsonian Institution Press, Washington, D.C., p. 309–325.
Rudis, V.A., 2001, Composition, potential old growth, fragmentation, and ownership of MississippiAlluvial Valley bottomland hardwoods: a regional assessment of historic change, in Hamel, P.B. and Foti, T.L., eds., Bottomland hardwoods of the Mississippi Alluvial Valley: Characteristics and management of natural function, structure, and compositions, Conference on Natural Areas, 1995, Fayetteville,AR: GeneralTechnical Report SRS-42, Asheville, NC: U.S. Department of Agriculture, Forest Service, Southern Research Station, p. 28–48.
Schmidly, D.J., 1991, The bats of Texas: College Station, Texas A&M University Press, 185 p.
U.S. Fish and Wildlife Service, 1994, 50 CFR Part 17, Endangered and threatened wildlife and plants; animal candidate review for listing as endangered or threatened species: Federal Register, vol. 59(219), p. 58982–59028.
Webster, W.D., Parnell, J.F., and Biggs, Jr., W.C., 1985, Mammals of the Carolinas, Virginia, and Maryland: Chapel Hill, University of North Carolina Press, 255 p.
Bat Colonies in BuildingsBat Colonies in BuildingsBat Colonies in BuildingsBat Colonies in BuildingsBat Colonies in Buildings
By
Thomas H. Kunz and
D. Scott Reynolds
Department of Biology Boston University Boston, MA 02215
Abstract.Abstract.Abstract.Abstract.Abstract. Bats use buildings as maternity roosts, night roosts, bachelor roosts, transient roosts, and occasionally as hibernacula. Of the 46 species of bats known from North America north of Mexico, over half are known to use buildings as roosts at least for part of the year. Use of human-made structures is a consequence of the loss of natural shelters that no longer exist and occurs wherever bats and humans co-exist. Nonetheless, the few available data suggest that the number of colonies in buildings is declining and that persistence is limited by deterioration of structures and attempts by residents to exclude bats. In North America, big brown bats (Eptesicus fuscus), little brown bats (Myotis lucifugus), eastern pipistrelles (Pipistrellus subflavus), and Brazilian free-tailed bats (Tadarida brasiliensis) are the best-known species that roost in buildings. All form maternity colonies in buildings during the summer. Efforts to census bats in buildings pose several challenges. Evening emergence counts provide the most reliable estimates, especially where colonies consist of less than 1,000 individuals. Such counts should be made on at least three consecutive evenings in the period of late pregnancy to mid-lactation, which generally corresponds to the maximum adult population. With continued loss of natural habitats, bat houses offer opportunities for bat conservation as well as platforms for research on aspects of bat biology that are difficult or impossible to study in natural roosts.
KeyKeyKeyKeyKey WWWWWordsordsordsordsords: Buildings, hibernacula, maternity roosts, night roosts, transient roosts.
IntroductionIntroductionIntroductionIntroductionIntroduction
Roosts and food are the two most important resources known to influence the distribution and abundance of bats (Humphrey, 1975; Kunz, 1982; Kunz and Lumsden, 2003). Bats seek shelter in a number of natural structures, including caves, foliage, rock crevices, and tree cavities, but they also exploit various human-made structures, such as mines, tombs, houses, barns, bridges, culverts, and bat houses (Kunz, 1982; Tuttle and Hensley, 1993; Keeley and Tuttle, 1999; Kunz and Lumsden, 2003). As a consequence of increased urbanization, conversion of natural landscapes to agriculture and management of forests, bats use human-made structures as alternatives to many natural shelters that no longer exist.
Buildings, mostly of European-style architecture, offer a range of internal and external habitats for roosting bats (Gaisler, 1979; Greenhall, 1982; Kunz, 1982; Entwistle and others, 1997; Jenkins and others, 1998). Interior spaces in houses, churches, barns, schools, and similar structures have, in effect, become substitutes for tree cavities and exfoliating bark (Figs. 1–4). Spaces beneath tile, corrugated metal and fiberglass roofs, wood shingles, and areas behind shutters offer physical characteristics similar to natural roosts. The widespread use of buildings by bats in both temperate and tropical regions clearly indicates that these structures are important roosting habitats for bats. Bats use buildings as maternity roosts, night roosts, bachelor roosts, transient roosts, and occasionally as hibernacula. Of the 46 species of bats known from North America (north of Mexico), over half
91
92 INFORMATION AND TECHNOLOGY REPORT–2003--0003
are known to use buildings as roosts at least for part of the year (Barbour and Davis, 1969; Wilson and Ruff, 1999; Table 1). At present, the use of buildings by bats ranges from the occasional to the obligatory.
In North America, bats that most commonly roost in buildings include the big brown bat (Eptesicus fuscus), Brazilian free-tailed bat (Tadarida brasiliensis), eastern pipistrelle (Pipistrellus subflavus), evening bat (Nycticeius humeralis), little brown myotis (Myotis lucifugus), cave myotis (M. velifer), southeastern myotis (M. austroriparius), Yuma myotis (M. yumanensis), and pallid bat (Antrozous pallidus) (Wilson and Ruff, 1999). Three species (Eptesicus fuscus, M. lucifugus, and M. yumanensis) have become so completely associated with buildings in warm months that there are few records of their occurrence in natural roosts (Barbour and Davis, 1969). Exceptions include populations in western North America where these three species are also known to roost in tree cavities (Barclay and Brigham, 1996).
Since the construction of European-style buildings in North America, some bat species have probably increased in number and distribution. For example, by forming maternity colonies in buildings, Myotis velifer (Fig. 1A) and T. brasiliensis (Fig. 1B) have extended their summer ranges beyond the limits of historical distributions (Kunz, 1974; Genoways and others, 2000). In Texas, populations of T. brasiliensis have increased as much as 15% above numbers recorded before modern building construction (Schmidly, 1999). Similarly, the use of buildings by E. fuscus (Fig. 2) and M. lucifugus (Fig. 3) has also made it possible for these two species to extend their summer ranges into previously uninhabitable regions of NorthAmerica (Fenton and Barclay, 1980; Kurta and Baker, 1990; Whitaker and Gummer, 2000).
In Europe, at least 11 species of bats are associated with buildings. The most common of these are the pipistrelle (Pipistrellus pipistrellus), noctule (Nyctalus noctula), greater horseshoe bat (Rhinolophus ferrumequinum), common long-eared bat (Plecotus auritus), serotine (Eptesicus serotinus), northern bat (E. nilssoni), Natterer’s bat (M. nattereri), and greater mouse-eared bat (Myotis myotis) (Entwistle and others, 1997; Schober and Grimmberger, 1997; Jenkins and others, 1998; Racey, 1998). Several species that commonly roost in buildings are listed as vulnerable or are considered at severe risk (Schober and Grimmberger, 1997; Hutson and others, 2001) largely due to a decrease in natural roosts (Racey, 1998), contamination of human-made roosts with pesticides and wood preservatives (Voûte, 1980–1981), and loss of foraging habitats (Limpens and Kapteyn, 1991).
The exploitation of buildings by bats in tropical regions also appears to have contributed to expanded distributions and increased local abundance. For example,
in tropical Africa, several crevice-dwelling species regularly roost in buildings, such as Mops midas, Nycteris grandis, Chaerephon pumila, Pipistrellus nanus, and Scotophilus spp. (Kingdon, 1974; O’Shea, 1980; Fenton and Rautenbach, 1998). Several members of the genus Eptesicus, including E. tenuipinnis, E. capensis, and E. redalli, show strong affinities for buildings (Verschuren, 1957; Rosevear, 1965). In the Indian subcontinent, Taphozous melanopogan, T. perforatus, and Megaderma lyra almost exclusively roost in buildings (Bates and Harrison, 1997).
Several neotropical species use buildings as roosts, including Saccopteryx bilineata, Desmodus rotundus, Artibeus jamaicensis, Phyllostomus hastatus, and Carollia perspicillata (Nowak, 1994), although they rarely do so exclusively. Two widely distributed insectivorous species, Myotis nigricans (Wilson, 1971) and Molossus molossus (Greenhall and Stell, 1960; Rodriguez-Duran and Kunz, 2001), commonly roost in buildings in the Neotropics.
Impact of HumanImpact of HumanImpact of HumanImpact of HumanImpact of Human AttitudesAttitudesAttitudesAttitudesAttitudes andandandandand ActivitiesActivitiesActivitiesActivitiesActivities
Although the relatively recent availability of buildings as roosting sites may have contributed to expanded ranges and increased numbers in some species, other human activities such as overuse of non-target pesticides, contamination of water, and misguided forest management have had detrimental effects on their roosting and foraging activities. Extensive deforestation and habitat deterioration has had a marked effect on the availability of roosting and foraging habitats for many species (Barclay and Brigham, 1996; Racey, 1998). Fear of rabies (as well as fear from the mere presence of bats in human dwellings), indifference, and misunderstanding have also led to the extermination of bats from some buildings (Tuttle, 1987). Building restorations have led to the elimination of some bat roosts. In addition, the direct application of toxic chemicals and repellants has contributed to the reduction and/or extirpation of some bat colonies in buildings (Kunz and others, 1977; Daan, 1980; Hurley and Fenton, 1980; Tuttle, 1987; Clark, 1981).
FactorsFactorsFactorsFactorsFactors AfAfAfAfAffecting Roostfecting Roostfecting Roostfecting Roostfecting Roost Preferences in BuildingsPreferences in BuildingsPreferences in BuildingsPreferences in BuildingsPreferences in Buildings
Few studies have been conducted to assess preferences of bats for roosting in buildings. Entwistle and others (1997) compared the characteristics of
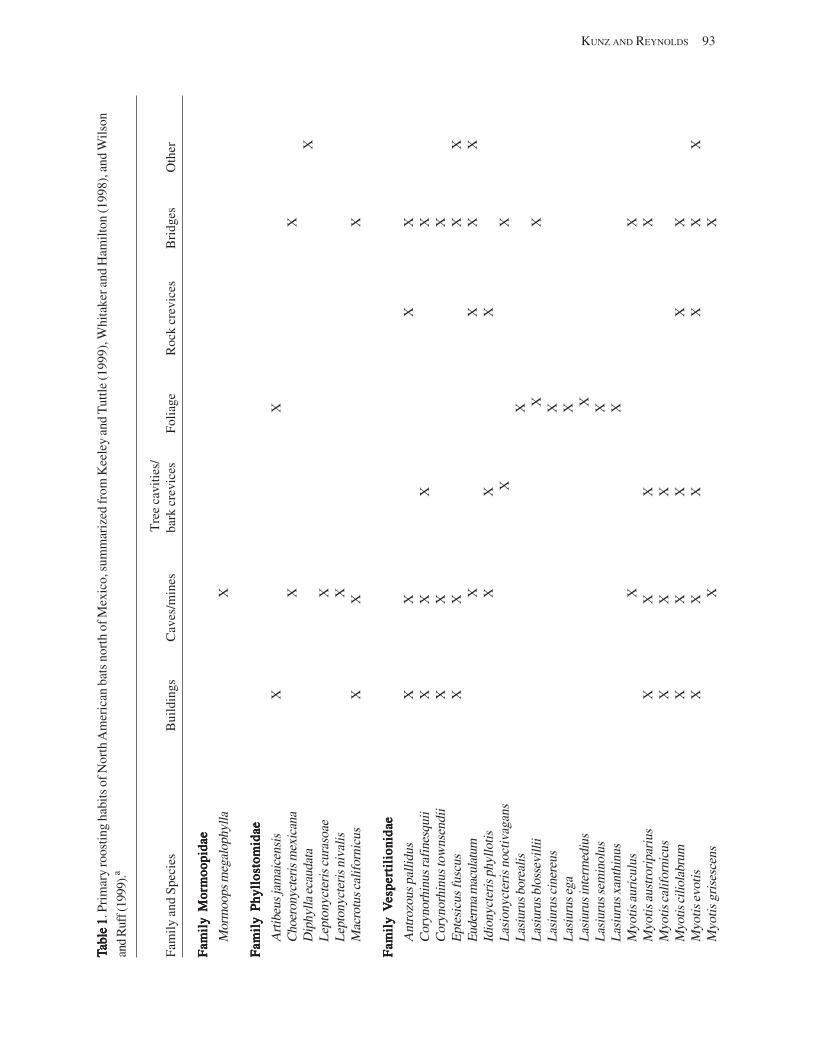
TTTT Tab
le 1
able
1ab
le 1
able
1ab
le 1
. Pri
mar
y ro
ostin
g ha
bits
of N
orth
Am
eric
an b
ats
nort
h of
Mex
ico,
sum
mar
ized
from
Kee
ley
and
Tut
tle (1
999)
, Whi
take
r and
Ham
ilton
(199
8), a
nd W
ilson
and
Ruf
f (19
99).a
Tre
e ca
vitie
s/
Fam
ily a
nd S
peci
es
Bui
ldin
gs
Cav
es/m
ines
ba
rk c
revi
ces
Folia
ge
Roc
k cr
evic
es
Bri
dges
O
ther
Fam
ily
Mor
moo
pida
eF
amil
y M
orm
oopi
dae
Fam
ily
Mor
moo
pida
eF
amil
y M
orm
oopi
dae
Fam
ily
Mor
moo
pida
e
Mor
moo
ps m
egal
ophy
lla
X
Fam
ily
Phy
llos
tom
idae
Fam
ily
Phy
llos
tom
idae
Fam
ily
Phy
llos
tom
idae
Fam
ily
Phy
llos
tom
idae
Fam
ily
Phy
llos
tom
idae
Art
ibeu
s jam
aice
nsis
X
X
C
hoer
onyc
teri
s mex
ican
a
X
X
Dip
hylla
eca
udat
a X
L
epto
nyct
eris
cur
asoa
e
X
Lep
tony
cter
is n
ival
is
X
Mac
rotu
s cal
ifor
nicu
s
X
X
X
Fam
ily
Fam
ily
Fam
ily
Fam
ily
Fam
ily
VVVV Ves
pert
ilio
nida
ees
pert
ilio
nida
ees
pert
ilio
nida
ees
pert
ilio
nida
ees
pert
ilio
nida
e
Ant
rozo
us p
allid
us
X
X
X
X
Cor
ynor
hinu
s raf
ines
quii
X
X
X
X
C
oryn
orhi
nus
tow
nsen
dii
X
X
X
Ept
esic
us fu
scus
X
X
X
X
E
uder
ma
mac
ulat
um
X
X
X
X
Idio
nyct
eris
phy
llotis
X
X
X
L
asio
nyct
eris
noc
tivag
ans
X
X
L
asiu
rus b
orea
lis
X
Las
iuru
s blo
ssev
illii
X
X
L
asiu
rus c
iner
eus
X
Las
iuru
s ega
X
L
asiu
rus i
nter
med
ius
X
L
asiu
rus s
emin
olus
X
L
asiu
rus x
anth
inus
X
M
yotis
aur
icul
us
X
X
Myo
tis a
ustr
orip
ariu
s
X
X
X
X
Myo
tis c
alif
orni
cus
X
X
X
M
yotis
cili
olab
rum
X
X
X
X
X
M
yotis
evo
tis
X
X
X
X
X
X
Myo
tis g
rise
scen
s
X
X
KUNZ AND REYNOLDS 93
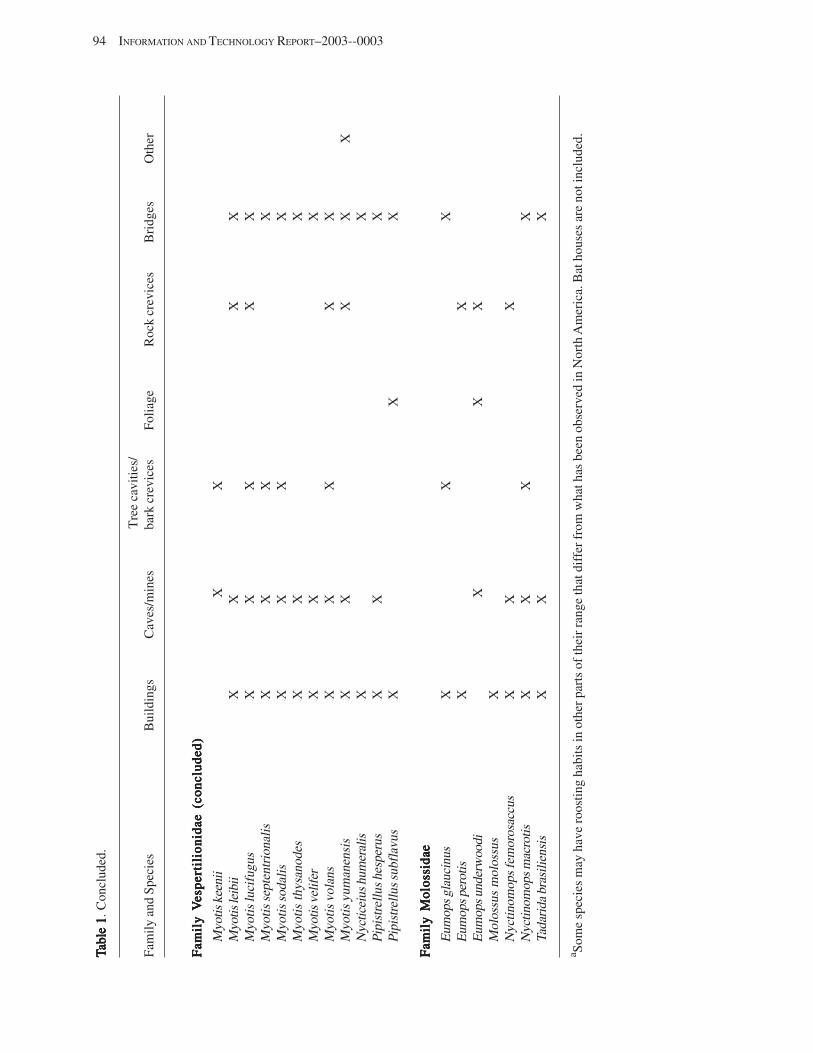
TTTT Tab
le 1
able
1ab
le 1
able
1ab
le 1
. Con
clud
ed.
Tre
e ca
vitie
s/
Fam
ily a
nd S
peci
es
Bui
ldin
gs
Cav
es/m
ines
ba
rk c
revi
ces
Folia
ge
Roc
k cr
evic
es
Bri
dges
O
ther
Fam
ily
Fam
ily
Fam
ily
Fam
ily
Fam
ily
VVVV Ves
pert
ilio
nida
e (c
oncl
uded
)es
pert
ilio
nida
e (c
oncl
uded
)es
pert
ilio
nida
e (c
oncl
uded
)es
pert
ilio
nida
e (c
oncl
uded
)es
pert
ilio
nida
e (c
oncl
uded
)
Myo
tis k
eeni
i X
X
M
yotis
leib
ii
X
X
X
X
Myo
tis lu
cifu
gus
X
X
X
X
X
M
yotis
sep
tent
rion
alis
X
X
X
X
M
yotis
sod
alis
X
X
X
X
M
yotis
thys
anod
es
X
X
X
Myo
tis v
elif
er
X
X
X
Myo
tis v
olan
s
X
X
X
X
X
Myo
tis y
uman
ensi
s
X
X
X
X
X
Nyc
ticei
us h
umer
alis
X
X
Pi
pist
rellu
s he
sper
us
X
X
X
Pipi
stre
llus
subf
lavu
s
X
X
X
Fam
ily
Mol
ossi
dae
Fam
ily
Mol
ossi
dae
Fam
ily
Mol
ossi
dae
Fam
ily
Mol
ossi
dae
Fam
ily
Mol
ossi
dae
Eum
ops g
lauc
inus
X
X
X
E
umop
s per
otis
X
X
E
umop
s und
erw
oodi
X
X
X
M
olos
sus
mol
ossu
s
X
Nyc
tinom
ops
fem
oros
accu
s
X
X
X
Nyc
tinom
ops m
acro
tis
X
X
X
X
Tada
rida
bra
silie
nsis
X
X
X
a Som
e sp
ecie
s m
ay h
ave
roos
ting
habi
ts in
oth
er p
arts
of
thei
r ra
nge
that
dif
fer
from
wha
t has
bee
n ob
serv
ed in
Nor
th A
mer
ica.
Bat
hou
ses
are
not i
nclu
ded.
94 INFORMATION AND TECHNOLOGY REPORT–2003--0003
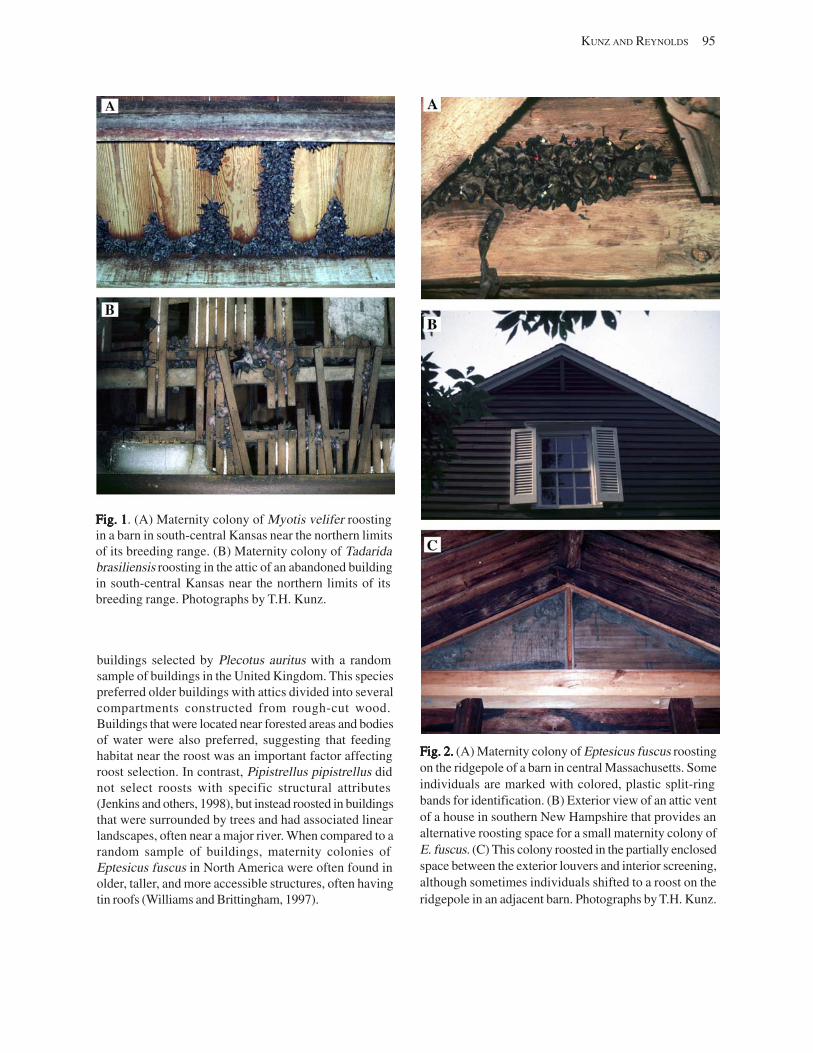
KUNZ AND REYNOLDS 95
Fig. 1Fig. 1Fig. 1Fig. 1Fig. 1. (A) Maternity colony of Myotis velifer roosting in a barn in south-central Kansas near the northern limits of its breeding range. (B) Maternity colony of Tadarida brasiliensis roosting in the attic of an abandoned building in south-central Kansas near the northern limits of its breeding range. Photographs by T.H. Kunz.
buildings selected by Plecotus auritus with a random sample of buildings in the United Kingdom. This species preferred older buildings with attics divided into several compartments constructed from rough-cut wood. Buildings that were located near forested areas and bodies of water were also preferred, suggesting that feeding habitat near the roost was an important factor affecting roost selection. In contrast, Pipistrellus pipistrellus did not select roosts with specific structural attributes (Jenkins and others, 1998), but instead roosted in buildings that were surrounded by trees and had associated linear landscapes, often near a major river. When compared to a random sample of buildings, maternity colonies of Eptesicus fuscus in North America were often found in older, taller, and more accessible structures, often having tin roofs (Williams and Brittingham, 1997).
Fig. 2.Fig. 2.Fig. 2.Fig. 2.Fig. 2. (A) Maternity colony of Eptesicus fuscus roosting on the ridgepole of a barn in central Massachusetts. Some individuals are marked with colored, plastic split-ring bands for identification. (B) Exterior view of an attic vent of a house in southern New Hampshire that provides an alternative roosting space for a small maternity colony of E. fuscus. (C) This colony roosted in the partially enclosed space between the exterior louvers and interior screening, although sometimes individuals shifted to a roost on the ridgepole in an adjacent barn. Photographs by T.H. Kunz.
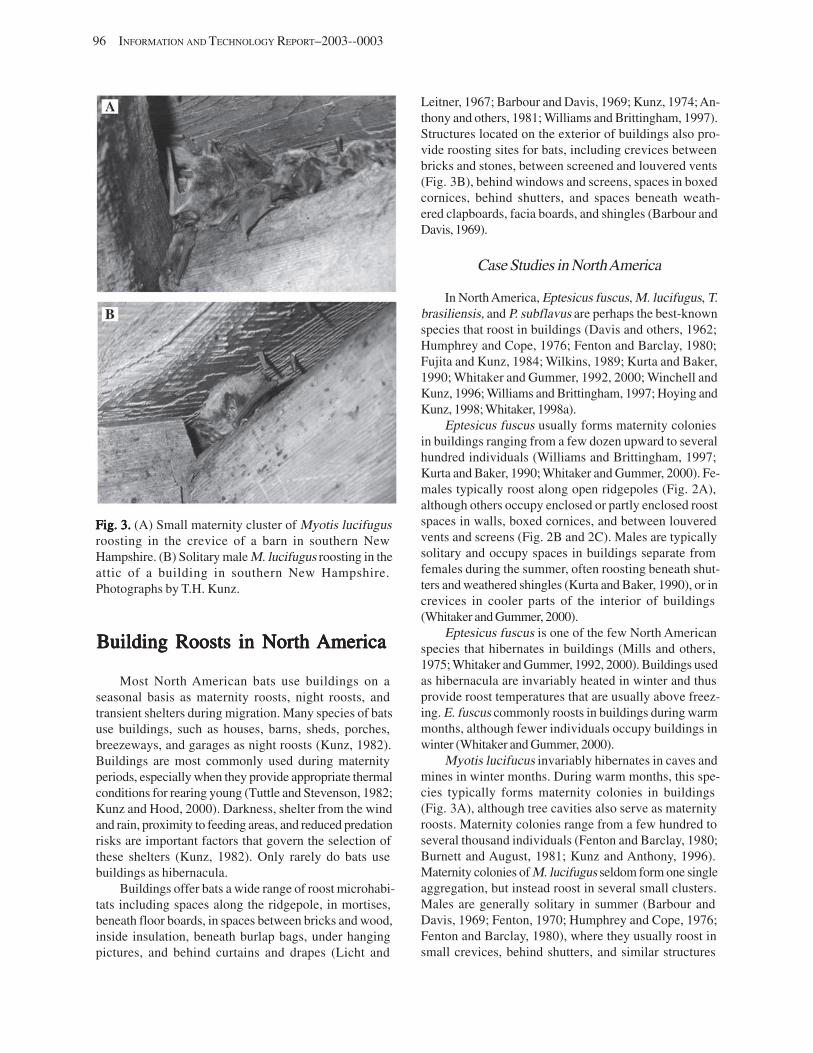
96 INFORMATION AND TECHNOLOGY REPORT–2003--0003
Fig. 3.Fig. 3.Fig. 3.Fig. 3.Fig. 3. (A) Small maternity cluster of Myotis lucifugus roosting in the crevice of a barn in southern New Hampshire. (B) Solitary male M. lucifugus roosting in the attic of a building in southern New Hampshire. Photographs by T.H. Kunz.
Building Roosts in NorthBuilding Roosts in NorthBuilding Roosts in NorthBuilding Roosts in NorthBuilding Roosts in North AmericaAmericaAmericaAmericaAmerica
Most North American bats use buildings on a seasonal basis as maternity roosts, night roosts, and transient shelters during migration. Many species of bats use buildings, such as houses, barns, sheds, porches, breezeways, and garages as night roosts (Kunz, 1982). Buildings are most commonly used during maternity periods, especially when they provide appropriate thermal conditions for rearing young (Tuttle and Stevenson, 1982; Kunz and Hood, 2000). Darkness, shelter from the wind and rain, proximity to feeding areas, and reduced predation risks are important factors that govern the selection of these shelters (Kunz, 1982). Only rarely do bats use buildings as hibernacula.
Buildings offer bats a wide range of roost microhabitats including spaces along the ridgepole, in mortises, beneath floor boards, in spaces between bricks and wood, inside insulation, beneath burlap bags, under hanging pictures, and behind curtains and drapes (Licht and
Leitner, 1967; Barbour and Davis, 1969; Kunz, 1974; Anthony and others, 1981; Williams and Brittingham, 1997). Structures located on the exterior of buildings also provide roosting sites for bats, including crevices between bricks and stones, between screened and louvered vents (Fig. 3B), behind windows and screens, spaces in boxed cornices, behind shutters, and spaces beneath weathered clapboards, facia boards, and shingles (Barbour and Davis, 1969).
Case Studies in NorthAmerica
In North America, Eptesicus fuscus, M. lucifugus, T. brasiliensis, and P. subflavus are perhaps the best-known species that roost in buildings (Davis and others, 1962; Humphrey and Cope, 1976; Fenton and Barclay, 1980; Fujita and Kunz, 1984; Wilkins, 1989; Kurta and Baker, 1990; Whitaker and Gummer, 1992, 2000; Winchell and Kunz, 1996; Williams and Brittingham, 1997; Hoying and Kunz, 1998; Whitaker, 1998a).
Eptesicus fuscus usually forms maternity colonies in buildings ranging from a few dozen upward to several hundred individuals (Williams and Brittingham, 1997; Kurta and Baker, 1990; Whitaker and Gummer, 2000). Females typically roost along open ridgepoles (Fig. 2A), although others occupy enclosed or partly enclosed roost spaces in walls, boxed cornices, and between louvered vents and screens (Fig. 2B and 2C). Males are typically solitary and occupy spaces in buildings separate from females during the summer, often roosting beneath shutters and weathered shingles (Kurta and Baker, 1990), or in crevices in cooler parts of the interior of buildings (Whitaker and Gummer, 2000).
Eptesicus fuscus is one of the few North American species that hibernates in buildings (Mills and others, 1975; Whitaker and Gummer, 1992, 2000). Buildings used as hibernacula are invariably heated in winter and thus provide roost temperatures that are usually above freezing. E. fuscus commonly roosts in buildings during warm months, although fewer individuals occupy buildings in winter (Whitaker and Gummer, 2000).
Myotis lucifucus invariably hibernates in caves and mines in winter months. During warm months, this species typically forms maternity colonies in buildings (Fig. 3A), although tree cavities also serve as maternity roosts. Maternity colonies range from a few hundred to several thousand individuals (Fenton and Barclay, 1980; Burnett and August, 1981; Kunz and Anthony, 1996). Maternity colonies of M. lucifugus seldom form one single aggregation, but instead roost in several small clusters. Males are generally solitary in summer (Barbour and Davis, 1969; Fenton, 1970; Humphrey and Cope, 1976; Fenton and Barclay, 1980), where they usually roost in small crevices, behind shutters, and similar structures
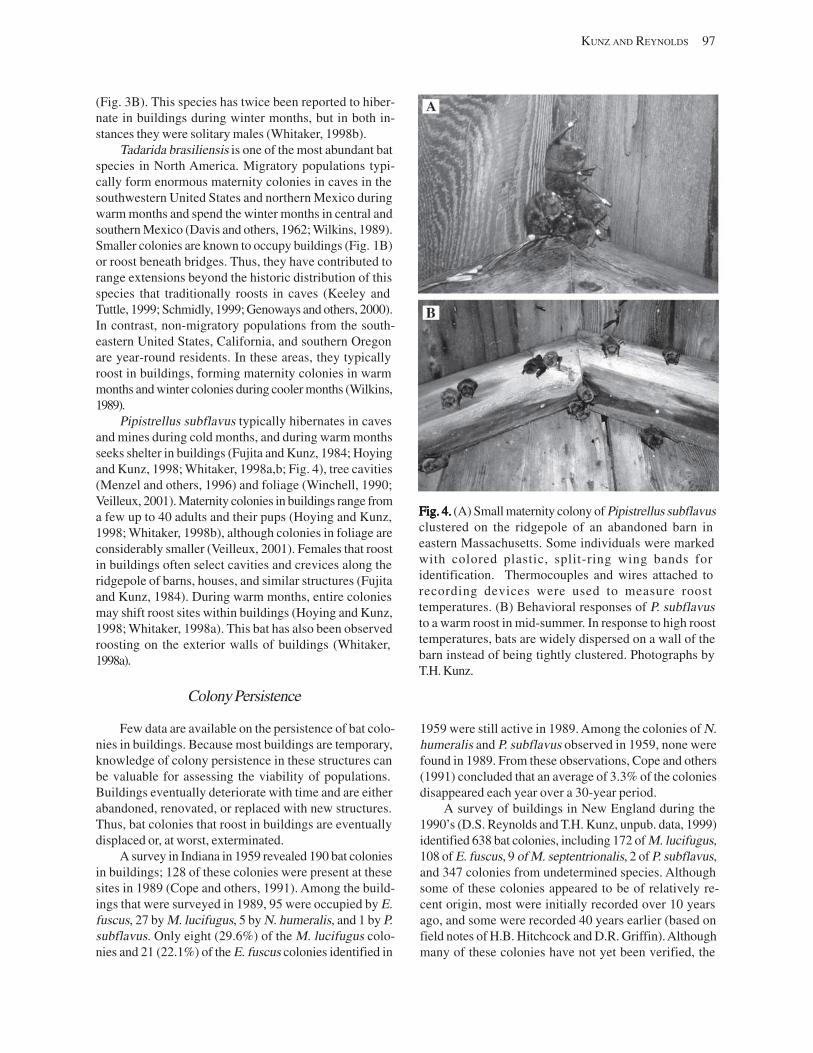
(Fig. 3B). This species has twice been reported to hibernate in buildings during winter months, but in both instances they were solitary males (Whitaker, 1998b).
Tadarida brasiliensis is one of the most abundant bat species in North America. Migratory populations typically form enormous maternity colonies in caves in the southwestern United States and northern Mexico during warm months and spend the winter months in central and southern Mexico (Davis and others, 1962; Wilkins, 1989). Smaller colonies are known to occupy buildings (Fig. 1B) or roost beneath bridges. Thus, they have contributed to range extensions beyond the historic distribution of this species that traditionally roosts in caves (Keeley and Tuttle, 1999; Schmidly, 1999; Genoways and others, 2000). In contrast, non-migratory populations from the southeastern United States, California, and southern Oregon are year-round residents. In these areas, they typically roost in buildings, forming maternity colonies in warm months and winter colonies during cooler months (Wilkins, 1989).
Pipistrellus subflavus typically hibernates in caves and mines during cold months, and during warm months seeks shelter in buildings (Fujita and Kunz, 1984; Hoying and Kunz, 1998; Whitaker, 1998a,b; Fig. 4), tree cavities (Menzel and others, 1996) and foliage (Winchell, 1990; Veilleux, 2001). Maternity colonies in buildings range from a few up to 40 adults and their pups (Hoying and Kunz, 1998; Whitaker, 1998b), although colonies in foliage are considerably smaller (Veilleux, 2001). Females that roost in buildings often select cavities and crevices along the ridgepole of barns, houses, and similar structures (Fujita and Kunz, 1984). During warm months, entire colonies may shift roost sites within buildings (Hoying and Kunz, 1998; Whitaker, 1998a). This bat has also been observed roosting on the exterior walls of buildings (Whitaker, 1998a).
Colony Persistence
Few data are available on the persistence of bat colonies in buildings. Because most buildings are temporary, knowledge of colony persistence in these structures can be valuable for assessing the viability of populations. Buildings eventually deteriorate with time and are either abandoned, renovated, or replaced with new structures. Thus, bat colonies that roost in buildings are eventually displaced or, at worst, exterminated.
A survey in Indiana in 1959 revealed 190 bat colonies in buildings; 128 of these colonies were present at these sites in 1989 (Cope and others, 1991). Among the buildings that were surveyed in 1989, 95 were occupied by E. fuscus, 27 by M. lucifugus, 5 by N. humeralis, and 1 by P. subflavus. Only eight (29.6%) of the M. lucifugus colonies and 21 (22.1%) of the E. fuscus colonies identified in
KUNZ AND REYNOLDS 97
Fig. 4.Fig. 4.Fig. 4.Fig. 4.Fig. 4. (A) Small maternity colony of Pipistrellus subflavus clustered on the ridgepole of an abandoned barn in eastern Massachusetts. Some individuals were marked with colored plastic, split-ring wing bands for identification. Thermocouples and wires attached to recording devices were used to measure roost temperatures. (B) Behavioral responses of P. subflavus to a warm roost in mid-summer. In response to high roost temperatures, bats are widely dispersed on a wall of the barn instead of being tightly clustered. Photographs by T.H. Kunz.
1959 were still active in 1989. Among the colonies of N. humeralis and P. subflavus observed in 1959, none were found in 1989. From these observations, Cope and others (1991) concluded that an average of 3.3% of the colonies disappeared each year over a 30-year period.
A survey of buildings in New England during the 1990’s (D.S. Reynolds and T.H. Kunz, unpub. data, 1999) identified 638 bat colonies, including 172 of M. lucifugus, 108 of E. fuscus, 9 of M. septentrionalis, 2 of P. subflavus, and 347 colonies from undetermined species. Although some of these colonies appeared to be of relatively recent origin, most were initially recorded over 10 years ago, and some were recorded 40 years earlier (based on field notes of H.B. Hitchcock and D.R. Griffin). Although many of these colonies have not yet been verified, the
98 INFORMATION AND TECHNOLOGY REPORT–2003--0003
trends from those that have been evaluated are alarming. For example, at least 21% of the historic colonies (median record date of 1962) are known to have been extirpated. More recent colonies (recorded by T.H. Kunz, with a median record date of 1981) had a known extirpation rate of 20%. Lastly, a data set with a median record date of 1994 (primarily from Massachusetts Fish and Wildlife records) was found to have a known extirpation rate of 36%.
Interviews with building owners have revealed that some type of exclusion was attempted at 160 of these colonies; in 15 cases, multiple methods were employed to remove the bats. Physical exclusion was the most common method (47%), particularly in the most recently controlled colonies. However, chemical control (including napthalene, DDT, rodenticides, insect sprays, and sulfur candles) accounted for 38% of all exclusion attempts, followed by electronic control (10%: lights or ultrasonic devices) and killing or relocation of individuals (10%). Clearly, these data suggest that more effort is needed to adequately census commensal bats and determine the full extent of exclusion and harassment that such colonies are experiencing.
Censusing and InventoryingCensusing and InventoryingCensusing and InventoryingCensusing and InventoryingCensusing and Inventorying Bats in BuildingsBats in BuildingsBats in BuildingsBats in BuildingsBats in Buildings
Efforts to census bats that roost in buildings pose several challenges. Some homeowners do not permit researchers to enter buildings for the purpose of inventorying and censusing bats, and even if access is allowed, many bats that occupy crevices and cavities cannot be observed and counted directly. Mark-recapture studies seldom yield reliable estimates because the assumptions inherent in using this method cannot be met (see Kunz, 2003). Evening emergence counts provide the most reliable estimates and are most successful when colonies are relatively small (<1,000 individuals) (Kunz and others, 1996). Depending on the number of observers, it may be possible to count all or most bats that emerge from buildings at dusk by observing their silhouettes against the sky (Kunz and others, 1996; Hoying and Kunz, 1998), or by recording (and counting) them using infrared video cameras (Frantz, 1989). Notwithstanding, colony censuses based on nightly emergence counts can be biased when bats shift to alternate roost sites (Brigham and Fenton, 1986; Brigham, 1991; Lewis, 1995; Barclay and Brigham, 1996; Whitaker, 1998a). Roost-shifting behavior highlights the need for researchers to explore all possible exit routes and alternate roosts before conducting a colony inventory or census (Thomas and LaVal, 1988; Kunz and others, 1996).
Whenever emergence counts are used to assess long-term trends in colony size, they should be made on at least three consecutive evenings in the period from late pregnancy to mid-lactation. This period generally corresponds to the maximum adult population [Thomas and LaVal (1988); Kunz and Anthony (1996); Kunz and others (1996); also see Kunz (2003)]. If additional time is available for censusing, emergence counts should be repeated after young-of-the-year have become volant, but before adults have emigrated for a given year. When assessing annual or seasonal changes in colony size, emergence counts should be made at weekly intervals to insure that seasonal patterns of reproductive phenology can be detected (Hoying and Kunz, 1988; Kunz and Anthony, 1996).
Guano accumulation can also be used as a crude method of inventory to estimate the relative size of a colony. Once the species has been verified by direct observation and all pre-existing guano has been removed, an analysis of fresh guano accumulation can be used as a rough estimate of colony size. This method is useful for extensive, long-term surveys where regular emergence counts are unrealistic, but the quality of the estimates is limited to broad classes that can be delineated by successive orders of magnitude (one or few, 10–20, around 100, and over 1,000).
Estimates of colony size based on guano accumulation are more reliable in colonies where bats roost in the open (e.g., on the ridge pole of a barn that is too high to reliably count) or where the bats roost in a crevice that opens below (such as bats roosting under fascia boards, flashing, or between the wood structure and the chimney of a house). In situations where roosts are not known, or no clear accumulation of guano occurs, this method is not appropriate. To validate the guano estimation method, an emergence count or visual count should be performed periodically and compared to estimates derived from guano accumulation.
Roosts for ResearchRoosts for ResearchRoosts for ResearchRoosts for ResearchRoosts for Research and Conservationand Conservationand Conservationand Conservationand Conservation
Buildings offer ideal opportunities for investigating aspects of bat biology that are difficult or impossible to study in natural roosts (e.g., Kunz, 1974; Burnett and August, 1981; Burnett and Kunz, 1982; Kunz andAnthony, 1982; Kurta and others, 1989; Wilkinson, 1992; Winchell and Kunz, 1996; Hoying and Kunz, 1998). With continued loss of natural habitats, structures (bat houses) specifically designed to mimic the physical and thermal conditions of tree cavities have been increasingly used in Europe and North America for conservation purposes
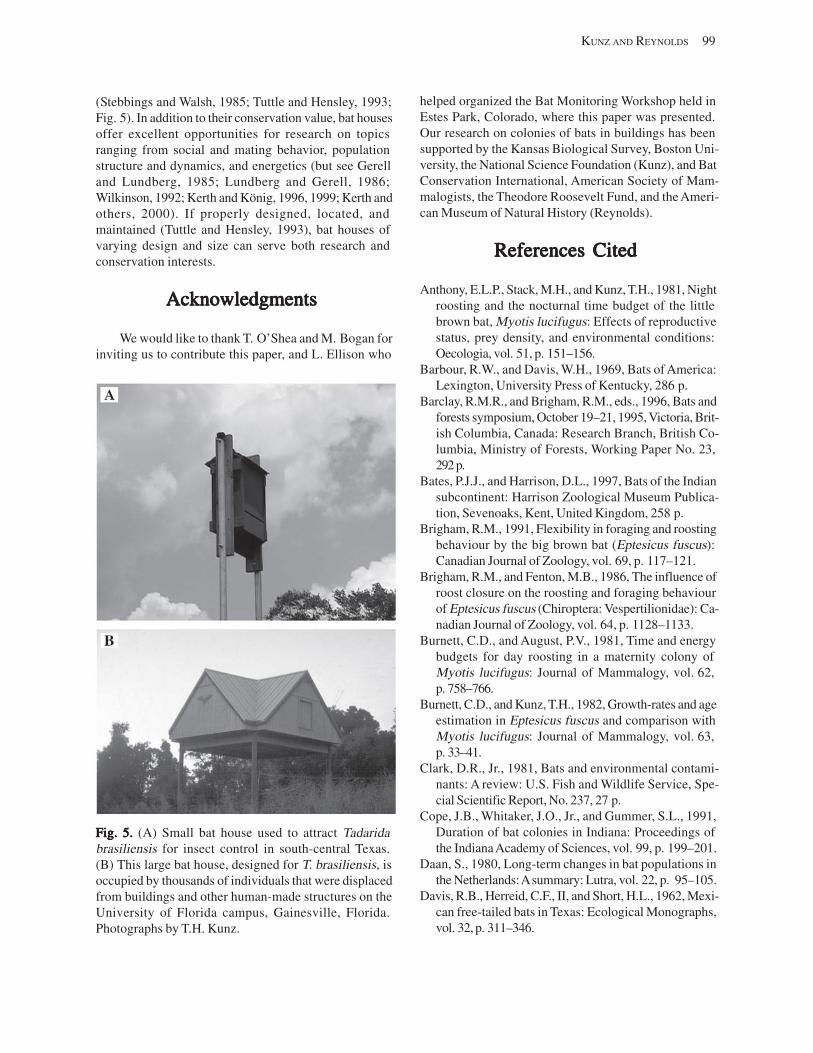
(Stebbings and Walsh, 1985; Tuttle and Hensley, 1993; Fig. 5). In addition to their conservation value, bat houses offer excellent opportunities for research on topics ranging from social and mating behavior, population structure and dynamics, and energetics (but see Gerell and Lundberg, 1985; Lundberg and Gerell, 1986; Wilkinson, 1992; Kerth and König, 1996, 1999; Kerth and others, 2000). If properly designed, located, and maintained (Tuttle and Hensley, 1993), bat houses of varying design and size can serve both research and conservation interests.
AcknowledgmentsAcknowledgmentsAcknowledgmentsAcknowledgmentsAcknowledgments
We would like to thank T. O’Shea and M. Bogan for inviting us to contribute this paper, and L. Ellison who
Fig. 5.Fig. 5.Fig. 5.Fig. 5.Fig. 5. (A) Small bat house used to attract Tadarida brasiliensis for insect control in south-central Texas. (B) This large bat house, designed for T. brasiliensis, is occupied by thousands of individuals that were displaced from buildings and other human-made structures on the University of Florida campus, Gainesville, Florida. Photographs by T.H. Kunz.
KUNZ AND REYNOLDS 99
helped organized the Bat Monitoring Workshop held in Estes Park, Colorado, where this paper was presented. Our research on colonies of bats in buildings has been supported by the Kansas Biological Survey, Boston University, the National Science Foundation (Kunz), and Bat Conservation International, American Society of Mammalogists, the Theodore Roosevelt Fund, and the American Museum of Natural History (Reynolds).
References CitedReferences CitedReferences CitedReferences CitedReferences Cited
Anthony, E.L.P., Stack, M.H., and Kunz, T.H., 1981, Night roosting and the nocturnal time budget of the little brown bat, Myotis lucifugus: Effects of reproductive status, prey density, and environmental conditions: Oecologia, vol. 51, p. 151–156.
Barbour, R.W., and Davis, W.H., 1969, Bats of America: Lexington, University Press of Kentucky, 286 p.
Barclay, R.M.R., and Brigham, R.M., eds., 1996, Bats and forests symposium, October 19–21, 1995, Victoria, British Columbia, Canada: Research Branch, British Columbia, Ministry of Forests, Working Paper No. 23, 292 p.
Bates, P.J.J., and Harrison, D.L., 1997, Bats of the Indian subcontinent: Harrison Zoological Museum Publication, Sevenoaks, Kent, United Kingdom, 258 p.
Brigham, R.M., 1991, Flexibility in foraging and roosting behaviour by the big brown bat (Eptesicus fuscus): Canadian Journal of Zoology, vol. 69, p. 117–121.
Brigham, R.M., and Fenton, M.B., 1986, The influence of roost closure on the roosting and foraging behaviour of Eptesicus fuscus (Chiroptera: Vespertilionidae): Canadian Journal of Zoology, vol. 64, p. 1128–1133.
Burnett, C.D., and August, P.V., 1981, Time and energy budgets for day roosting in a maternity colony of Myotis lucifugus: Journal of Mammalogy, vol. 62, p. 758–766.
Burnett, C.D., and Kunz, T.H., 1982, Growth-rates and age estimation in Eptesicus fuscus and comparison with Myotis lucifugus: Journal of Mammalogy, vol. 63, p. 33–41.
Clark, D.R., Jr., 1981, Bats and environmental contaminants: A review: U.S. Fish and Wildlife Service, Special Scientific Report, No. 237, 27 p.
Cope, J.B., Whitaker, J.O., Jr., and Gummer, S.L., 1991, Duration of bat colonies in Indiana: Proceedings of the Indiana Academy of Sciences, vol. 99, p. 199–201.
Daan, S., 1980, Long-term changes in bat populations in the Netherlands: A summary: Lutra, vol. 22, p. 95–105.
Davis, R.B., Herreid, C.F., II, and Short, H.L., 1962, Mexican free-tailed bats in Texas: Ecological Monographs, vol. 32, p. 311–346.
100 INFORMATION AND TECHNOLOGY REPORT–2003--0003
Entwistle, A.C., Racey, P.A., and Speakman, J.R., 1997, Roost selection by the brown long-eared bat (Plecotus auritus): Journal of Applied Ecology, vol. 34, p. 399– 408.
Fenton, M.B., 1970, Population studies of Myotis lucifugus (Chiroptera: Vespertilionidae) in Ontario: Royal Ontario Museum, Toronto, Life Science Contributions, vol. 77, p. 1–34.
Fenton, M.B., and Barclay, R.M.R., 1980, Myotis lucifugus: Mammalian Species, vol. 142, p. 1–8.
Fenton, M.B., and Rautenbach, I.L., 1998, Impacts of ignorance and human and elephant populations on the conservation of bats in African woodlands, in Kunz, T.H. and Racey, P.A., eds., Bat biology and conservation: Washington, D.C., Smithsonian Institution Press, p. 261–270.
Frantz, S.C., 1989, Remote videography of small mammals under conditions of dim illumination or darkness: American Society for Testing Materials, Special Technical Publication, no. 1055, p. 41–51.
Fujita, M., and Kunz, T.H., 1984, Pipistrellus subflavus: Mammalian Species, vol. 228, p. 1–6.
Gaisler, J., 1979, Ecology of bats, in Stoddard, D.M., ed., Ecology of small mammals: London, Chapman and Hall, p. 281–343.
Genoways, H.H., Freeman, P.W., and Grell, C., 2000, Extralimital records of the Mexican free-tailed bat (Tadarida brasiliensis mexicana) in the central United States and their biological significance: Transactions of the Nebraska Academy of Sciences, vol. 26, p. 85–96.
Gerell, R., and Lundberg, K., 1985, Social organization in the bat Pipistrellus pipistrellus: Behavioral Ecology and Sociobiology, vol. 16, p. 177–184.
Greenhall, A.M., 1982, House bat management: U.S. Fish and Wildlife Service, Resources Publication, No. 143, 33 p., Washington, D.C.
Greenhall, A.M., and Stell, G., 1960, Bionomics and chemical control of free-tailed house bats (Molossus) in Trinidad: U.S. Fish and Wildlife Service, Washington, D.C.: Special Scientific Report, no. 53, 20 p.
Hoying, K.M., and Kunz, T.H., 1998, Variation in the size at birth and post-natal growth in the insectivorous bat Pipistrellus subflavus (Chiroptera: Vespertilionidae): Journal of Zoology (London) vol. 245, p. 15–17.
Humphrey, S.R., 1975, Nursery roosts and community diversity of Nearctic bats: Journal of Mammalogy, vol. 56, p. 321–346.
Humphrey, S.R., and Cope, J.B., 1976, Population ecology of the little brown bat, Myotis lucifugus, in Indiana and north-central Kentucky: Lawrence, Kansas: Special Publications of the American Society of Mammalogists, vol. 4, p. 1–81.
Hurley, S., and Fenton, M.B., 1980, Ineffectiveness of fenthion, zinc phosphate, DDT and two ultrasonic ro
dent repellers for control of little brown bats (Myotis lucifugus): Bulletin of Environmental Contamination and Toxicology, vol. 25, p. 503–507.
Hutson, A.M., Mickleburgh, S.P., and Racey, P.A., compilers, 2001, Microchiropteran bats: Global status survey and conservation action plan: IUCN, Gland, Switzerland, 259 p.
Jenkins, E.V., Laine, T., Morgan, S.E., Cole, K.R., and Speakman, J.R., 1998, Roost selection in the pipistrelle bat Pipistrellus pipistrellus (Chiroptera: Vespertilionidae) in north-east Scotland: Animal Behaviour, vol. 56, p. 909–917.
Keeley, B.K., and Tuttle, M.D., 1999, Bats in American bridges: Bat Conservation International, Resource Publication, no. 4, Austin, Texas, 41 p.
Kerth, G., and König, B., 1996, Transponders and infrared-video camera as methods in a field study on the social behaviour of Bechstein’s bats (Myotis bechsteini): Myotis, vol. 34, p. 27–34.
Kerth, G., and König, B., 1999, Fission, fusion and nonrandom associations in female Bechstein’s bats (Myotis bechsteinii): Behaviour, vol. 136, p. 1187–1202.
Kerth, G., Weissmann, K., and König, B., 2000, Day-roost selection in female Bechstein’s bats (Myotis bechsteinii): A field experiment to determine the influence of roost temperature: Oecologia, vol. 126, p. 1–9.
Kingdon, J., 1974, East African mammals, volume II, part A, Insectivores and bats: London, Academic Press, 341 p.
Kunz, T.H., 1974, Feeding ecology of an insectivorous bat (Myotis velifer): Ecology, vol. 55, p. 693–711.
Kunz, T.H., 1982, Roosting ecology of bats, in Kunz, T.H., ed., Ecology of bats: New York, Plenum Press, p. 1–58.
Kunz, T.H., 2003, Censusing bats: Challenges, solutions, and sampling biases, in O’Shea, T.J. and Bogan, M.A., eds., Monitoring trends in bat populations of the United States and territories: problems and prospects: U.S. Geological Survey, Information and Technology Report, USGS/BRD/ITR--2003–0003, p. 9–19.
Kunz, T.H., and Anthony, E.L.P., 1982, Age estimation and post-natal growth in the little brown bat, Myotis lucifugus: Journal of Mammalogy, vol. 63, p. 23–32.
Kunz, T.H., and Anthony, E.L.P., 1996, Variation in the time of nightly emergence behavior in the little brown bat, Myotis lucifugus (Chiroptera: Vespertilionidae), in Genoways, H.H. and Baker, R.J., eds., Contributions in mammalogy: A memorial volume honoring Dr. J. Knox Jones, Jr.: Museum of Texas Tech University, p. 225–235.
Kunz, T.H., and Hood, W.H., 2000, Parental care and postnatal growth in the Chiroptera, in Creighton, E.G., and Krutzsch, P.H., eds., Reproductive biology of bats: New York, Academic Press, p. 415–468.
Kunz, T.H., and Lumsden, L.F., 2003, Ecology of cavity and foliage roosting bats, in Kunz, T.H., and Fenton,
KUNZ AND REYNOLDS 101
M.B., eds., Bat ecology, Chicago, University of Chicago Press, p. 3–89.
Kunz, T.H., Anthony, E.L.P., and Rumage, W.T., III, 1977, Mortality of little brown bats following multiple pesticide applications: Journal of Wildlife Management, vol. 41, p. 476–483.
Kunz, T.H., Thomas, D.W., Richard, G.C., Tidemann, C.R., Pierson, E.D., and Racey, P.A., 1996, Observational techniques: Measuring and monitoring biological diversity: standard methods for mammals, in Wilson, D.E., Cole, F.R., Nichols, J.D., Rudran, R., and Foster, M.S., eds.: Washington, D.C., Smithsonian Institution Press, 409 p.
Kurta, A., and Baker, R.H., 1990, Eptesicus fuscus: Mammalian Species, vol. 356, p. 1–10.
Kurta, A., Bell, G.P., Nagy, K.A., and Kunz, T.H., 1989, Energetics of pregnancy and lactation in free-ranging little brown bats (Myotis lucifugus): Physiological Zoology, vol. 62, p. 804–818.
Lewis, S.E., 1995, Roost fidelity of bats: A review: Journal of Mammalogy, vol. 76, p. 481–496.
Licht, P., and Leitner, P., 1967, Behavioral responses to high temperature in three species of California bats: Journal of Mammalogy, vol. 48, p. 52–61.
Limpens, H.G.J.A., and Kapteyn, K., 1991, Bats, their behaviour and linear landscape elements: Myotis, vol. 29, p. 39–48.
Lundberg, K., and Gerell, R., 1986, Territorial advertisement and mate attraction in the bat Pipistrellus pipistrellus: Ethology, vol. 71, p. 115–124.
Menzel, M.A., Lepardo, L.T., and Laerm, J., 1996, Possible use of a basal cavity as a maternity roost by the eastern pipistrelle Pipistrellus subflavus: Bat Research News, vol. 37, p. 115–116.
Mills, R.W., Barrett, G.W., and Farrell, M.P., 1975, Population dynamics of the big brown bat (Eptesicus fuscus) in southwestern Ohio: Journal of Mammalogy, vol. 56, p. 591–604.
Nowak, R.M., 1994, Walker’s bats of the world: Baltimore, Johns Hopkins University Press, 287 p.
O’Shea, T.J., 1980, Roosting, social organization and the annual cycle of a Kenya population of the bat Pipistrellus nanus: Zeitschrift für Tierpsychologie, vol. 53, p. 171–195.
Racey, P.A., 1998, Ecology of European bats in relation to their conservation, in Kunz, T.H. and Racey, P.A., eds., Bat biology and conservation: Washington, D.C., Smithsonian Institution Press, p. 249–260.
Rodriquez-Duran, A., and Kunz, T.H., 2001, Biogeography of West Indian bats: An ecological approach, in Woods, C.A. and Sergile, F. , eds., Biogeography of West Indian Mammals: Gainesville, University of Florida Press, p. 353–366.
Rosevear, D.R., 1965, The bats of West Africa: London, British Museum of Natural History, 418 p.
Schmidly, D.J., 1999, The bats of Texas: College Station, Texas A&M University Press, 224 p.
Schober, W., and Grimmberger, E., 1997, The bats of Europe and North America: Neptune City, New Jersey, T.F.H. Publications, 239 p.
Stebbings, R.E., and Walsh, S.T., 1985, Bat boxes: London, Fauna and Flora Preservation Society, United Kingdom.
Thomas, D.W., and LaVal, R.K., 1988, Survey and census methods, in Kunz, T.H., ed., Ecological and behavioral methods for the study of bats: Washington, D.C., Smithsonian Institution Press, p. 77–90.
Tuttle, M.D., 1987, Bats, pesticides and politics, Austin, Texas: Special Publication, Bat Conservation International, 42 p.
Tuttle, M.D., and Hensley, D., 1993, Bat houses: The secrets of success, Bats, vol. 11, p. 3–14.
Tuttle, M.D., and Stevenson, D., 1982, Growth and survival of bats, in Kunz, T.H., ed., Ecology of bats: New York, Plenum Press, p. 105–150.
Verschuren, J., 1957, Ecologies, biologie, et systematique des Chiropteres, Exploration du Parc National de la Garamba, No. 7 (Mission H. De Saeger): Institute des Parc Nationaux du Congo Belge, Bruxelles, 473 p.
Veilleux, J.P., 2001, Natural history and roosting ecology of the eastern pipistrelle, Pipistrellus subflavus: Terre Haute, Indiana State University, Ph.D. dissertation, 97 p.
Voûte, A.M., 1980–1981, The conflict between bats and wood preservatives: Myotis, vols. 18–19, p. 41–44.
Whitaker, J.O., Jr., 1998a, Life history and roost switching in six summer colonies of eastern pipistrelles: Journal of Mammalogy, vol. 79, p. 651–659.
Whitaker, J.O., Jr., 1998b, Hibernation of a little brown myotis in a building: Bat Research News, vol. 39, p. 3.
Whitaker, J.O., Jr., and Gummer, S.L., 1992, Hibernation of the big brown bat in buildings: Journal of Mammalogy, vol. 73, p. 312–316.
Whitaker, J.O., Jr., and Gummer, S.L., 2000, Population structure and dynamics of big brown bats (Eptesicus fuscus) hibernating in buildings in Indiana: American Midland Naturalist, vol. 143, p. 389–396.
Whitaker, J.O., Jr., and Hamilton, W.J., 1998, Mammals of the Eastern United States (3rd ed.): Ithaca, N.Y., Comstock Publishing Associates, 583 p.
Wilkins, K.T., 1989, Tadarida brasiliensis: Mammalian Species, vol. 331, p. 1–10.
Wilkinson, G.S., 1992, Information transfer at evening bat colonies: Animal Behaviour, vol. 44, p. 501–518.
Williams, L.M., and Brittingham, M.C., 1997, Selection of maternity roosts by big brown bats: Journal of Wildlife Management, vol. 61, p. 359–368.
Wilson, D.E., 1971, Ecology of Myotis nigricans (Mammalia: Chiroptera) on Barro Colorado Island: Journal of Zoology (London), vol. 163, p. 1–13.

102 INFORMATION AND TECHNOLOGY REPORT–2003--0003
Wilson, D.E., and Ruff, S., 1999, The Smithsonian Book of North American Mammals: Washington, D.C., Smithsonian Institution Press, 750 p.
Winchell, J.M., 1990, Time budgets and roosting ecology of an eastern pipistrelle (Pipistrellus subflavus) maternity colony: Boston University, M.A. thesis.
Winchell, J.M., and Kunz, T.H., 1996, Day roosting activity budgets of the eastern pipistrelle bat, Pipistrellus subflavus (Chiroptera: Vespertilionidae): Canadian Journal of Zoology, vol. 74, p. 431–441.
The United Kingdom National Bat Monitoring Programme:The United Kingdom National Bat Monitoring Programme:The United Kingdom National Bat Monitoring Programme:The United Kingdom National Bat Monitoring Programme:The United Kingdom National Bat Monitoring Programme: TTTTTurning Conservation Goals Intourning Conservation Goals Intourning Conservation Goals Intourning Conservation Goals Intourning Conservation Goals Into TTTTTangible Resultsangible Resultsangible Resultsangible Resultsangible Results
By
Allyson L. Walsh1
Colin M.C. Catto Tony M. Hutson Steve Langton
and Paul A. Racey
The Bat Conservation Trust 15 Cloisters House
8 Battersea Park Road London, SW8 4 BG
Abstract. Effective bat conservation relies on gathering information to identify changes in populations that are of conservation concern, and to measure the population response to management. From 1996 to 2000, the Bat Conservation Trust was commissioned by the United Kingdom (U.K.) government’s Department of the Environment, Transport and Regions to develop and implement monitoring procedures for eight target species of bats and to assess how these techniques could be applied to all 16 resident U.K. species. The resultant “National Bat Monitoring Programme” (NBMP) is designed to provide accurate information about bat population trends based on data gathered by a volunteer network covering large numbers of sites. The application of formal sampling strategies and standardized counting techniques enables meaningful estimations of bat population trends. By 1999, the NBMP had approximately 807 volunteers active annually in bat surveys (returning data) and a total membership of 1,447 people. The NBMP site network currently includes a total of 796 maternity colony sites monitored using evening exit counts, 952 field sites monitored using bat detector transect survey counts, and 255 underground hibernation sites monitored using visual counts of hibernating bats. Power analyses based on counts from these schemes indicate that after approximately 10 to 20 years of monitoring, all NBMP schemes will detect small annual declines (1– 2%) at powers of over 90% and satisfy monitoring targets. Although there are obvious difficulties in monitoring bats, and elements of the NBMP are likely to be improved over time, it is essential to establish sustainable monitoring programs for bats within a time frame and on a scale that will contribute to conservation interests.
AbstractAbstractAbstractAbstract
KeyKeyKeyKeyKey WWWWWordsordsordsordsords: Bats, population trends, power analysis, survey design.
1Current address: The Lubee Foundation, Inc., 1309 NW 192nd Avenue, Gainesville, FL 32609
103
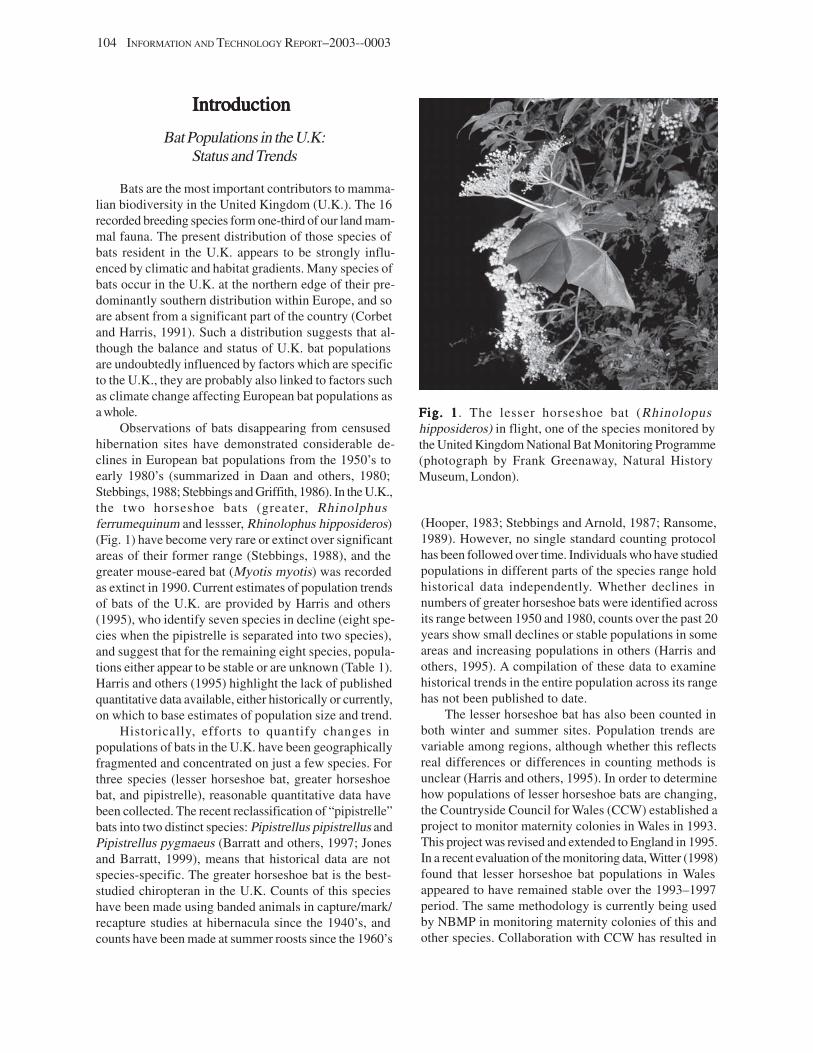
104 INFORMATION AND TECHNOLOGY REPORT–2003--0003
IntroductionIntroductionIntroductionIntroductionIntroduction
Bat Populations in the U.K: Status and Trends
Bats are the most important contributors to mammalian biodiversity in the United Kingdom (U.K.). The 16 recorded breeding species form one-third of our land mammal fauna. The present distribution of those species of bats resident in the U.K. appears to be strongly influenced by climatic and habitat gradients. Many species of bats occur in the U.K. at the northern edge of their predominantly southern distribution within Europe, and so are absent from a significant part of the country (Corbet and Harris, 1991). Such a distribution suggests that although the balance and status of U.K. bat populations are undoubtedly influenced by factors which are specific to the U.K., they are probably also linked to factors such as climate change affecting European bat populations as a whole.
Observations of bats disappearing from censused hibernation sites have demonstrated considerable declines in European bat populations from the 1950’s to early 1980’s (summarized in Daan and others, 1980; Stebbings, 1988; Stebbings and Griffith, 1986). In the U.K., the two horseshoe bats (greater, Rhinolphus ferrumequinum and lessser, Rhinolophus hipposideros) (Fig. 1) have become very rare or extinct over significant areas of their former range (Stebbings, 1988), and the greater mouse-eared bat (Myotis myotis) was recorded as extinct in 1990. Current estimates of population trends of bats of the U.K. are provided by Harris and others (1995), who identify seven species in decline (eight species when the pipistrelle is separated into two species), and suggest that for the remaining eight species, populations either appear to be stable or are unknown (Table 1). Harris and others (1995) highlight the lack of published quantitative data available, either historically or currently, on which to base estimates of population size and trend.
Historically, efforts to quantify changes in populations of bats in the U.K. have been geographically fragmented and concentrated on just a few species. For three species (lesser horseshoe bat, greater horseshoe bat, and pipistrelle), reasonable quantitative data have been collected. The recent reclassification of “pipistrelle” bats into two distinct species: Pipistrellus pipistrellus and Pipistrellus pygmaeus (Barratt and others, 1997; Jones and Barratt, 1999), means that historical data are not species-specific. The greater horseshoe bat is the best-studied chiropteran in the U.K. Counts of this species have been made using banded animals in capture/mark/ recapture studies at hibernacula since the 1940’s, and counts have been made at summer roosts since the 1960’s
Fig. 1Fig. 1Fig. 1Fig. 1Fig. 1. The lesser horseshoe bat (Rhinolopus hipposideros) in flight, one of the species monitored by the United Kingdom National Bat Monitoring Programme (photograph by Frank Greenaway, Natural History Museum, London).
(Hooper, 1983; Stebbings and Arnold, 1987; Ransome, 1989). However, no single standard counting protocol has been followed over time. Individuals who have studied populations in different parts of the species range hold historical data independently. Whether declines in numbers of greater horseshoe bats were identified across its range between 1950 and 1980, counts over the past 20 years show small declines or stable populations in some areas and increasing populations in others (Harris and others, 1995). A compilation of these data to examine historical trends in the entire population across its range has not been published to date.
The lesser horseshoe bat has also been counted in both winter and summer sites. Population trends are variable among regions, although whether this reflects real differences or differences in counting methods is unclear (Harris and others, 1995). In order to determine how populations of lesser horseshoe bats are changing, the Countryside Council for Wales (CCW) established a project to monitor maternity colonies in Wales in 1993. This project was revised and extended to England in 1995. In a recent evaluation of the monitoring data, Witter (1998) found that lesser horseshoe bat populations in Wales appeared to have remained stable over the 1993–1997 period. The same methodology is currently being used by NBMP in monitoring maternity colonies of this and other species. Collaboration with CCW has resulted in
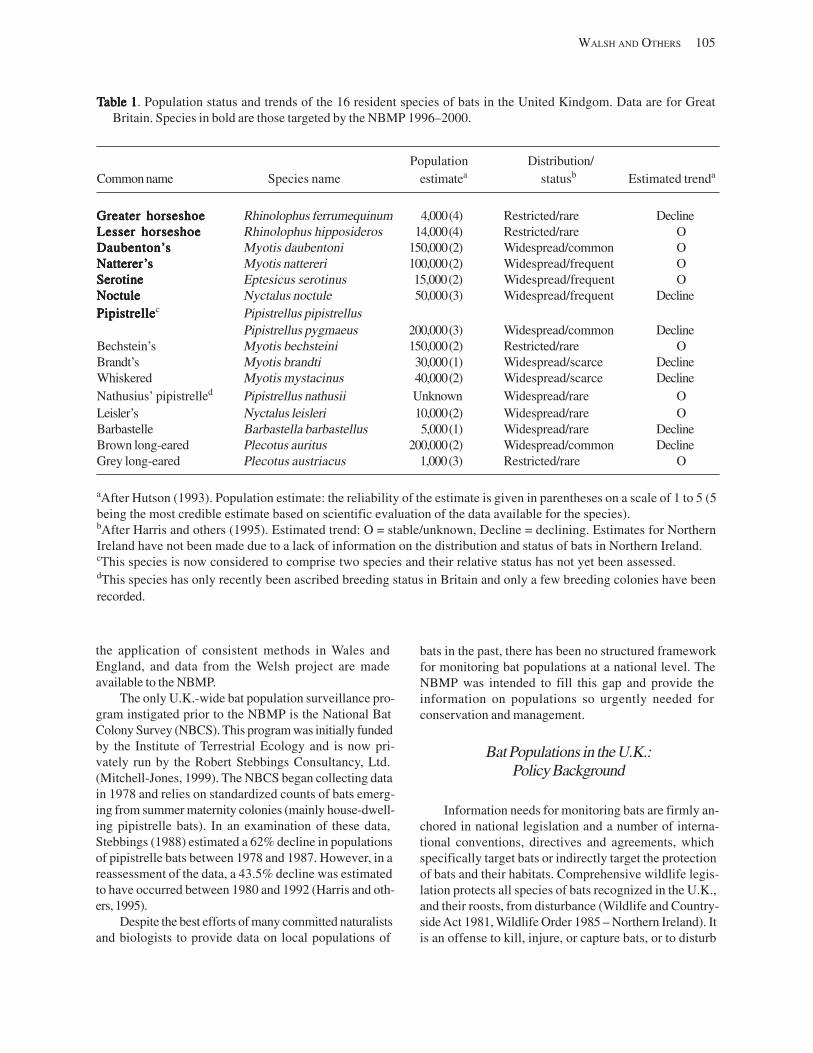
WALSH AND OTHERS 105
TTTTTable 1able 1able 1able 1able 1. Population status and trends of the 16 resident species of bats in the United Kindgom. Data are for Great Britain. Species in bold are those targeted by the NBMP 1996–2000.
Population Distribution/ Common name Species name estimatea statusb Estimated trenda
Greater horseshoeGreater horseshoeGreater horseshoeGreater horseshoeGreater horseshoe Rhinolophus ferrumequinum 4,000(4) Restricted/rare Decline Lesser horseshoeLesser horseshoeLesser horseshoeLesser horseshoeLesser horseshoe Rhinolophus hipposideros 14,000(4) Restricted/rare O Daubenton’Daubenton’Daubenton’Daubenton’Daubenton’sssss Myotis daubentoni 150,000(2) Widespread/common O NattererNattererNattererNattererNatterer’’’’’sssss Myotis nattereri 100,000(2) Widespread/frequent O SerotineSerotineSerotineSerotineSerotine Eptesicus serotinus 15,000(2) Widespread/frequent O NoctuleNoctuleNoctuleNoctuleNoctule Nyctalus noctule 50,000(3) Widespread/frequent Decline PipistrellePipistrellePipistrellePipistrellePipistrellec Pipistrellus pipistrellus
Pipistrellus pygmaeus 200,000(3) Widespread/common Decline Bechstein’s Myotis bechsteini 150,000(2) Restricted/rare O Brandt’s Myotis brandti 30,000(1) Widespread/scarce Decline Whiskered Myotis mystacinus 40,000(2) Widespread/scarce Decline Nathusius’ pipistrelled Pipistrellus nathusii Unknown Widespread/rare O Leisler’s Nyctalus leisleri 10,000(2) Widespread/rare O Barbastelle Barbastella barbastellus 5,000(1) Widespread/rare Decline Brown long-eared Plecotus auritus 200,000(2) Widespread/common Decline Grey long-eared Plecotus austriacus 1,000(3) Restricted/rare O
aAfter Hutson (1993). Population estimate: the reliability of the estimate is given in parentheses on a scale of 1 to 5 (5 being the most credible estimate based on scientific evaluation of the data available for the species). bAfter Harris and others (1995). Estimated trend: O = stable/unknown, Decline = declining. Estimates for Northern Ireland have not been made due to a lack of information on the distribution and status of bats in Northern Ireland. cThis species is now considered to comprise two species and their relative status has not yet been assessed. dThis species has only recently been ascribed breeding status in Britain and only a few breeding colonies have been recorded.
the application of consistent methods in Wales and England, and data from the Welsh project are made available to the NBMP.
The only U.K.-wide bat population surveillance program instigated prior to the NBMP is the National Bat Colony Survey (NBCS). This program was initially funded by the Institute of Terrestrial Ecology and is now privately run by the Robert Stebbings Consultancy, Ltd. (Mitchell-Jones, 1999). The NBCS began collecting data in 1978 and relies on standardized counts of bats emerging from summer maternity colonies (mainly house-dwelling pipistrelle bats). In an examination of these data, Stebbings (1988) estimated a 62% decline in populations of pipistrelle bats between 1978 and 1987. However, in a reassessment of the data, a 43.5% decline was estimated to have occurred between 1980 and 1992 (Harris and others, 1995).
Despite the best efforts of many committed naturalists and biologists to provide data on local populations of
bats in the past, there has been no structured framework for monitoring bat populations at a national level. The NBMP was intended to fill this gap and provide the information on populations so urgently needed for conservation and management.
Bat Populations in the U.K.: Policy Background
Information needs for monitoring bats are firmly anchored in national legislation and a number of international conventions, directives and agreements, which specifically target bats or indirectly target the protection of bats and their habitats. Comprehensive wildlife legislation protects all species of bats recognized in the U.K., and their roosts, from disturbance (Wildlife and Countryside Act 1981, Wildlife Order 1985 – Northern Ireland). It is an offense to kill, injure, or capture bats, or to disturb
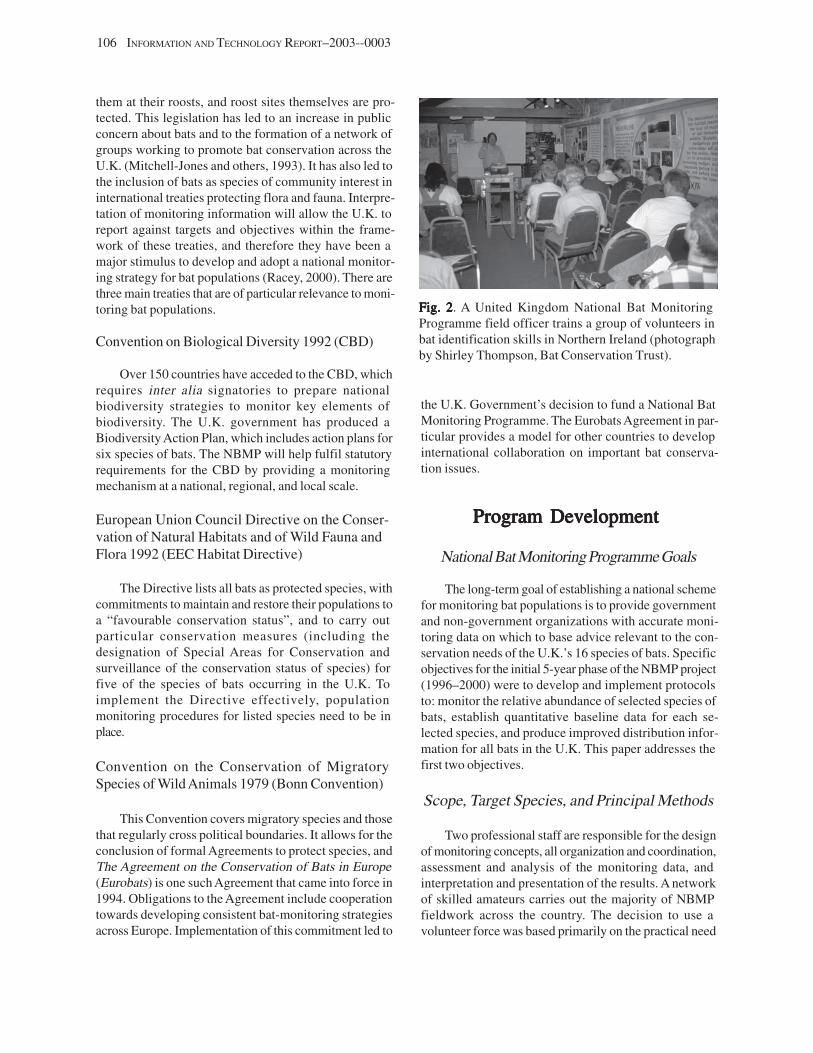
106 INFORMATION AND TECHNOLOGY REPORT–2003--0003
them at their roosts, and roost sites themselves are protected. This legislation has led to an increase in public concern about bats and to the formation of a network of groups working to promote bat conservation across the U.K. (Mitchell-Jones and others, 1993). It has also led to the inclusion of bats as species of community interest in international treaties protecting flora and fauna. Interpretation of monitoring information will allow the U.K. to report against targets and objectives within the framework of these treaties, and therefore they have been a major stimulus to develop and adopt a national monitoring strategy for bat populations (Racey, 2000). There are three main treaties that are of particular relevance to monitoring bat populations.
Convention on Biological Diversity 1992 (CBD)
Over 150 countries have acceded to the CBD, which requires inter alia signatories to prepare national biodiversity strategies to monitor key elements of biodiversity. The U.K. government has produced a Biodiversity Action Plan, which includes action plans for six species of bats. The NBMP will help fulfil statutory requirements for the CBD by providing a monitoring mechanism at a national, regional, and local scale.
European Union Council Directive on the Conservation of Natural Habitats and of Wild Fauna and Flora 1992 (EEC Habitat Directive)
The Directive lists all bats as protected species, with commitments to maintain and restore their populations to a “favourable conservation status”, and to carry out particular conservation measures (including the designation of Special Areas for Conservation and surveillance of the conservation status of species) for five of the species of bats occurring in the U.K. To implement the Directive effectively, population monitoring procedures for listed species need to be in place.
Convention on the Conservation of Migratory Species of Wild Animals 1979 (Bonn Convention)
This Convention covers migratory species and those that regularly cross political boundaries. It allows for the conclusion of formal Agreements to protect species, and The Agreement on the Conservation of Bats in Europe (Eurobats) is one such Agreement that came into force in 1994. Obligations to the Agreement include cooperation towards developing consistent bat-monitoring strategies across Europe. Implementation of this commitment led to
Fig. 2Fig. 2Fig. 2Fig. 2Fig. 2. A United Kingdom National Bat Monitoring Programme field officer trains a group of volunteers in bat identification skills in Northern Ireland (photograph by Shirley Thompson, Bat Conservation Trust).
the U.K. Government’s decision to fund a National Bat Monitoring Programme. The Eurobats Agreement in particular provides a model for other countries to develop international collaboration on important bat conservation issues.
Program DevelopmentProgram DevelopmentProgram DevelopmentProgram DevelopmentProgram Development
National Bat Monitoring Programme Goals
The long-term goal of establishing a national scheme for monitoring bat populations is to provide government and non-government organizations with accurate monitoring data on which to base advice relevant to the conservation needs of the U.K.’s 16 species of bats. Specific objectives for the initial 5-year phase of the NBMP project (1996–2000) were to develop and implement protocols to: monitor the relative abundance of selected species of bats, establish quantitative baseline data for each selected species, and produce improved distribution information for all bats in the U.K. This paper addresses the first two objectives.
Scope, Target Species, and Principal Methods
Two professional staff are responsible for the design of monitoring concepts, all organization and coordination, assessment and analysis of the monitoring data, and interpretation and presentation of the results. A network of skilled amateurs carries out the majority of NBMP fieldwork across the country. The decision to use a volunteer force was based primarily on the practical need
to achieve representative coverage of a large geographical area. The monitoring program encompasses the whole of the U.K.: England, Wales, Scotland, and Northern Ireland.
At the start of the program, it was clear that not all species could be monitored. Eight target species were selected: lesser horseshoe, greater horseshoe, serotine (Eptesicus serotinus), noctule (Nyctalus noctule), Natterer’s (Myotis nattereri) and Daubenton’s (Myotis daubentoni) bats, as well as Pipistrellus pipistrellus and Pipistrellus pygmaeus. Target species were chosen according to conservation concern and because they constitute a representative range of different roosting, feeding and habitat requirements with populations of a sufficient size to provide adequate data for countrywide surveys. Estimating bat population trends at a large scale demands simple, repeatable methods that balance disturbance to animals, survey effort, cost, and geographical coverage. Three broad monitoring methods were selected: summer maternity colony counts, hibernacula counts, and surveys of foraging areas. All three methods have potential biases, either through the nature of the bats themselves, through exogenous factors that influence bat behavior, or through skill levels of those undertaking the monitoring. Therefore, to evaluate methods, a double-sampling approach is being taken whereby each target species is being monitored using at least two of these methods.
Volunteer Network
To implement the NBMP, it has been necessary to develop and maintain a volunteer force covering all regions of the U.K. and provide training for volunteers to ensure the collection of sufficiently high quality data. Recruitment of a volunteer force was based primarily on recruiting volunteers from an existing network of bat groups in the U.K. Volunteers from these groups already have considerable expertise on bats and provide long-term continuity and commitment. Recruitment of these and other volunteers (such as people with bats roosting in their homes, members of other nature groups, and the wider public) is targeted in areas of low coverage, and includes talks, workshops, leaflet distribution, popular articles, and web-based information. Training of volunteers to improve skill levels is carried out through an annual series of bat identification workshops: introductory day or weekend workshops for beginners and workshops introducing time expansion techniques for echolocation surveys to more advanced volunteers (Fig. 2). Efforts to improve training techniques have included the development of an “electronic bat” which enables indoor training of volunteers during the winter season, and the publication of a species identification
WALSH AND OTHERS 107
training manual and accompanying compact disc of bat echolocation calls.
Statistical Design
The primary task in establishing the NBMP has been to develop the technical capacity to carry out standardized surveys of bats on a wide geographic scale. The first 5-year phase (1996–2000) has concentrated on the development of clearly defined, repeatable methods and their practical application using a volunteer workforce. Although a strong emphasis has been placed on the statistical design of monitoring schemes, the NBMP has sought solutions that balance statistical aspirations with the practical demands of field-based schemes. Early on in the development of the program, a working group was set up to assess available methods and sampling strategies. Input was sought from population statisticians and researchers involved in monitoring other species (birds and mammals). Power analyses have been carried out to aid the design of monitoring schemes. Wherever possible, three fundamental principles of sampling and survey design have been applied: sampling methods should minimize bias and maximize precision of counts, sampling should be as representative of the whole population as possible, and sampling should provide data that are adequate to detect the presence of biologically important trends.
Program MethodsProgram MethodsProgram MethodsProgram MethodsProgram Methods
Counts at Maternity Colonies
Many studies surveying or monitoring bat populations have focused on stable summer roosting aggregations of female bats, termed maternity colonies. Although visual counts may be made inside the roost (Tuttle, 1979), a less disruptive method is to make visual counts of adult female bats exiting the roost in the evening (e.g., Dwyer, 1966; Swift, 1980). In the U.K., maternity colonies are established in April/May. Numbers at the colony rise and reach a peak when the young are born in mid June to late July. Birth dates vary annually and are dependent on weather conditions (Ransome and McOwat, 1994). Some species are more mobile than others and switch roosts at intervals through the summer and show sporadic annual site fidelity. Species selected for this method are species that show relatively high roost fidelity and whose roosts are known and accessible.
Maternity roosts (generally in buildings) are chosen from a sample of sites known to exist locally by bat groups
108 INFORMATION AND TECHNOLOGY REPORT–2003--0003
or reported by roost-owners to the Bat Conservation Trust (BCT). Volunteers are encouraged to count sites with small numbers of bats as well as large sites, to search for new sites, and to initiate counts at new sites, as they become known. Two counts of bats are made as they emerge from roost sites during a 20-day period in May/June (29 May– 7 June, 8–17 June for lesser horseshoe bats, 6–15 June, 16–25 June for all other species). This is just prior to average parturition dates when the numbers of bats in the roosts are more stable and provide a repeatable estimate of colony size. On each survey evening observers record the net number of bats emerging, ambient weather conditions, and supplementary information, such as whether a bat detector was used to aid counting. A full emergence count is defined as the net number of bats leaving a roost, starting with the first bat to be observed and ending when there is no further activity, activity has ceased for 10 minutes, or when darkness or bat-exiting behavior results in bats not being seen clearly. For all new roosts entering the scheme, site and habitat details around the site are recorded. For several species, too few maternity roost sites are currently known to permit a countrywide scheme, and so exercises to stimulate the location of new colonies are being encouraged. Schemes are implemented annually. There is no overlap of species monitoring using this method, with a single species monitored at each roost site. Sometimes colonies are mixed, but differences in size, behavior, and emergence time allow species to be distinguished.
Counts at Winter Hibernation Sites
Traditionally, assessment of populations in hibernation sites during winter has been the most consistently and widely employed technique for population monitoring throughout Europe. Although there are constraints on the reliability of such data, it has been successful in highlighting declines and local extinctions (e.g., Daan and others, 1980; Kowalski and Lesinski, 1991). As a multi- species approach it provides a valuable comparison between species and has provided data on species not currently targeted by the NBMP. However, because some species are not as reliant on underground sites as others, this method is not appropriate for all species (Hutson, 1993). In the U.K., hibernation site surveys can only be carried out under the guidance of a licensee with an appropriate endorsement, which ensures data quality but restricts the number of people who can participate in surveys.
Hibernation sites (generally underground) are chosen from a sample of known sites. Volunteers are encouraged to incorporate smaller sites as well as larger sites, and to search for new sites and initiate counts at new sites as they become known. Surveyors make two counts of
hibernating bats at each site over a 2-month period: one in January and one in February. This is when temperatures in the U.K. are generally at their coolest and most stable. Supplementary data collected include information on the structure and type of site, habitat types present at the site, and for each survey conducted, ambient air temperature and the coolest and warmest internal temperatures at the site. An NBMP hibernation-monitoring scheme has been implemented annually from 1997 to 2000.
Summer Bat Detector Surveys
The availability of heterodyne bat detectors at an affordable price has increased the number of volunteers able to identify and record free-flying bats. This was demonstrated by the large number of sites surveyed by volunteers in the U.K. National Bats and Habitats Survey (Walsh and others, 1993; Walsh and Harris, 1996a,b), and also by the Dutch national bat survey (Limpens, 1993a,b). Although field surveys are labor intensive, they provide an opportunity for monitoring species simultaneously and validating count data at roosts. Surveyors require a minimum amount of training to differentiate between the species monitored by the NBMP; this training is being carried out through bat detector workshops organized by the NBMB. As expertise and equipment develop, the use of bat detectors is likely to become an increasingly important monitoring technique.
Monitoring foraging areas can be carried out using two basic techniques, continuous counts of bat passes along randomly placed transect lines of fixed or variable length, or counts of bat passes for a discrete time period at a fixed number of spots spaced systematically along randomly placed transect lines. The NBMP employs both methods. A1-km2 area is the basic sampling unit for NBMP field surveys. This is because 1-km2 areas are easily surveyed within a single evening, and they integrate with a land classification scheme developed by the Institute of Terrestrial Ecology (Bunce and others, 1996; Firbank and others, 2003). This system assigns every 1-km2 in Britain to one of 40 land classes (grouped into six major environmental zones). Land classes are defined through multivariate analysis of climate, geology, and morphology and are used to target surveys of vegetation and land use. In a previous national bat survey (Walsh and Harris, 1996a,b), land class was found to be a significant factor influencing abundance; therefore, it was selected as a stratification system for field surveys. Field sites are selected randomly from each land class following an optimal allocation scheme. This allocation scheme is based on the relative proportions of each land class in the U.K. and estimated variation in bat abundance within each land class. In allocating sites to volunteers, skilled observers
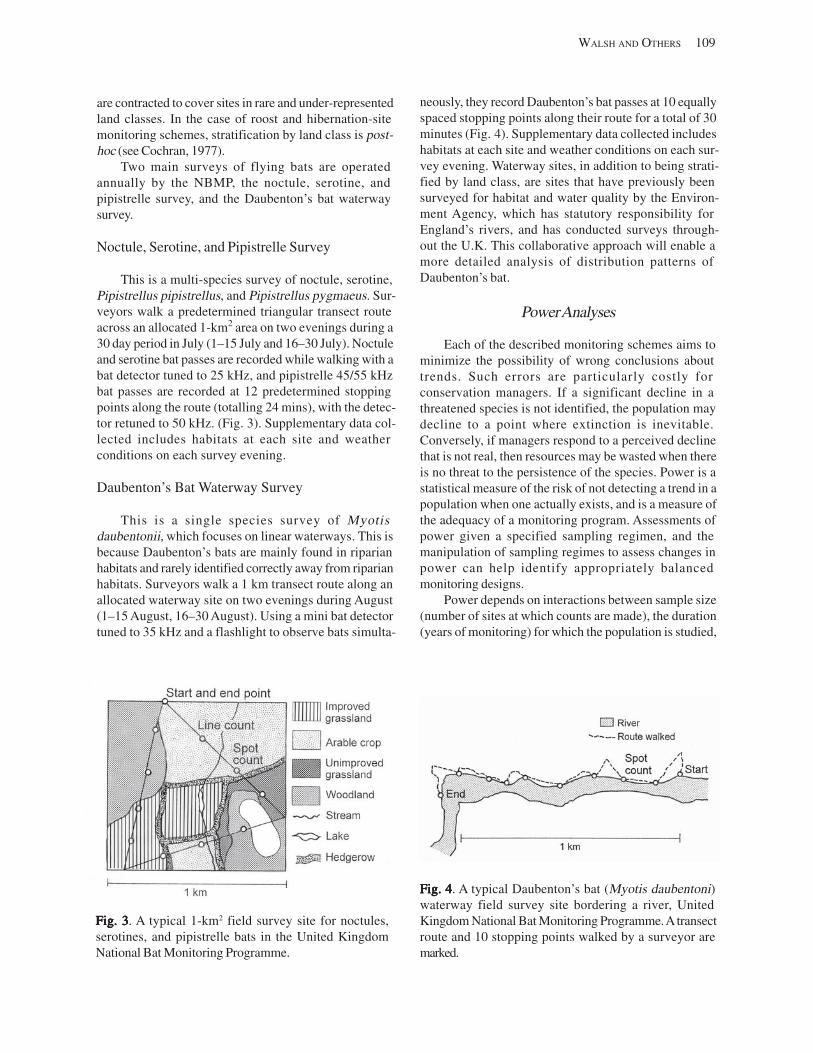
are contracted to cover sites in rare and under-represented land classes. In the case of roost and hibernation-site monitoring schemes, stratification by land class is post-hoc (see Cochran, 1977).
Two main surveys of flying bats are operated annually by the NBMP, the noctule, serotine, and pipistrelle survey, and the Daubenton’s bat waterway survey.
Noctule, Serotine, and Pipistrelle Survey
This is a multi-species survey of noctule, serotine, Pipistrellus pipistrellus, and Pipistrellus pygmaeus. Surveyors walk a predetermined triangular transect route across an allocated 1-km2 area on two evenings during a 30 day period in July (1–15 July and 16–30 July). Noctule and serotine bat passes are recorded while walking with a bat detector tuned to 25 kHz, and pipistrelle 45/55 kHz bat passes are recorded at 12 predetermined stopping points along the route (totalling 24 mins), with the detector retuned to 50 kHz. (Fig. 3). Supplementary data collected includes habitats at each site and weather conditions on each survey evening.
Daubenton’s Bat Waterway Survey
This is a single species survey of Myotis daubentonii, which focuses on linear waterways. This is because Daubenton’s bats are mainly found in riparian habitats and rarely identified correctly away from riparian habitats. Surveyors walk a 1 km transect route along an allocated waterway site on two evenings during August (1–15 August, 16–30 August). Using a mini bat detector tuned to 35 kHz and a flashlight to observe bats simulta
WALSH AND OTHERS 109
neously, they record Daubenton’s bat passes at 10 equally spaced stopping points along their route for a total of 30 minutes (Fig. 4). Supplementary data collected includes habitats at each site and weather conditions on each survey evening. Waterway sites, in addition to being stratified by land class, are sites that have previously been surveyed for habitat and water quality by the Environment Agency, which has statutory responsibility for England’s rivers, and has conducted surveys throughout the U.K. This collaborative approach will enable a more detailed analysis of distribution patterns of Daubenton’s bat.
Power Analyses
Each of the described monitoring schemes aims to minimize the possibility of wrong conclusions about trends. Such errors are particularly costly for conservation managers. If a significant decline in a threatened species is not identified, the population may decline to a point where extinction is inevitable. Conversely, if managers respond to a perceived decline that is not real, then resources may be wasted when there is no threat to the persistence of the species. Power is a statistical measure of the risk of not detecting a trend in a population when one actually exists, and is a measure of the adequacy of a monitoring program. Assessments of power given a specified sampling regimen, and the manipulation of sampling regimes to assess changes in power can help identify appropriately balanced monitoring designs.
Power depends on interactions between sample size (number of sites at which counts are made), the duration (years of monitoring) for which the population is studied,
Fig. 3Fig. 3Fig. 3Fig. 3Fig. 3. A typical 1-km2 field survey site for noctules, serotines, and pipistrelle bats in the United Kingdom National Bat Monitoring Programme.
Fig. 4Fig. 4Fig. 4Fig. 4Fig. 4. A typical Daubenton’s bat (Myotis daubentoni) waterway field survey site bordering a river, United Kingdom National Bat Monitoring Programme. A transect route and 10 stopping points walked by a surveyor are marked.
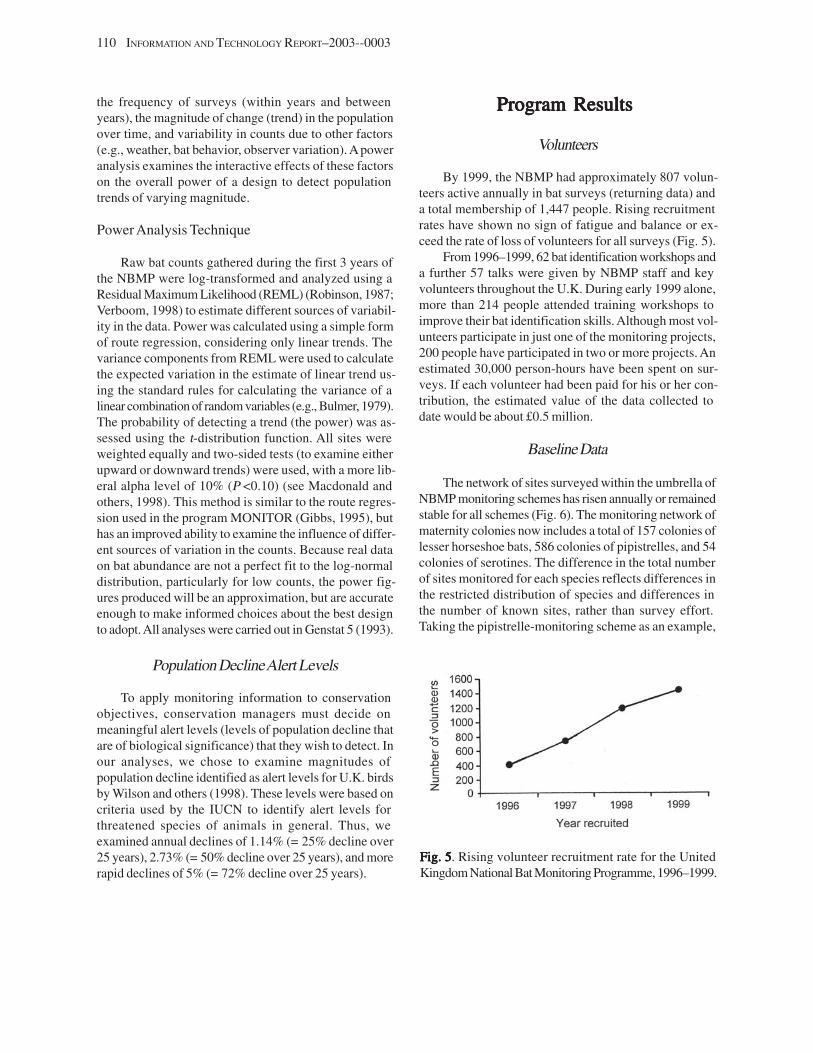
110 INFORMATION AND TECHNOLOGY REPORT–2003--0003
the frequency of surveys (within years and between years), the magnitude of change (trend) in the population over time, and variability in counts due to other factors (e.g., weather, bat behavior, observer variation). A power analysis examines the interactive effects of these factors on the overall power of a design to detect population trends of varying magnitude.
Power Analysis Technique
Raw bat counts gathered during the first 3 years of the NBMP were log-transformed and analyzed using a Residual Maximum Likelihood (REML) (Robinson, 1987; Verboom, 1998) to estimate different sources of variability in the data. Power was calculated using a simple form of route regression, considering only linear trends. The variance components from REML were used to calculate the expected variation in the estimate of linear trend using the standard rules for calculating the variance of a linear combination of random variables (e.g., Bulmer, 1979). The probability of detecting a trend (the power) was assessed using the t-distribution function. All sites were weighted equally and two-sided tests (to examine either upward or downward trends) were used, with a more liberal alpha level of 10% (P <0.10) (see Macdonald and others, 1998). This method is similar to the route regression used in the program MONITOR (Gibbs, 1995), but has an improved ability to examine the influence of different sources of variation in the counts. Because real data on bat abundance are not a perfect fit to the log-normal distribution, particularly for low counts, the power figures produced will be an approximation, but are accurate enough to make informed choices about the best design to adopt. All analyses were carried out in Genstat 5 (1993).
Population DeclineAlert Levels
To apply monitoring information to conservation objectives, conservation managers must decide on meaningful alert levels (levels of population decline that are of biological significance) that they wish to detect. In our analyses, we chose to examine magnitudes of population decline identified as alert levels for U.K. birds by Wilson and others (1998). These levels were based on criteria used by the IUCN to identify alert levels for threatened species of animals in general. Thus, we examined annual declines of 1.14% (= 25% decline over 25 years), 2.73% (= 50% decline over 25 years), and more rapid declines of 5% (= 72% decline over 25 years).
Program ResultsProgram ResultsProgram ResultsProgram ResultsProgram Results
Volunteers
By 1999, the NBMP had approximately 807 volunteers active annually in bat surveys (returning data) and a total membership of 1,447 people. Rising recruitment rates have shown no sign of fatigue and balance or exceed the rate of loss of volunteers for all surveys (Fig. 5).
From 1996–1999, 62 bat identification workshops and a further 57 talks were given by NBMP staff and key volunteers throughout the U.K. During early 1999 alone, more than 214 people attended training workshops to improve their bat identification skills. Although most volunteers participate in just one of the monitoring projects, 200 people have participated in two or more projects. An estimated 30,000 person-hours have been spent on surveys. If each volunteer had been paid for his or her contribution, the estimated value of the data collected to date would be about £0.5 million.
Baseline Data
The network of sites surveyed within the umbrella of NBMP monitoring schemes has risen annually or remained stable for all schemes (Fig. 6). The monitoring network of maternity colonies now includes a total of 157 colonies of lesser horseshoe bats, 586 colonies of pipistrelles, and 54 colonies of serotines. The difference in the total number of sites monitored for each species reflects differences in the restricted distribution of species and differences in the number of known sites, rather than survey effort. Taking the pipistrelle-monitoring scheme as an example,
Fig. 5Fig. 5Fig. 5Fig. 5Fig. 5. Rising volunteer recruitment rate for the United Kingdom National Bat Monitoring Programme, 1996–1999.
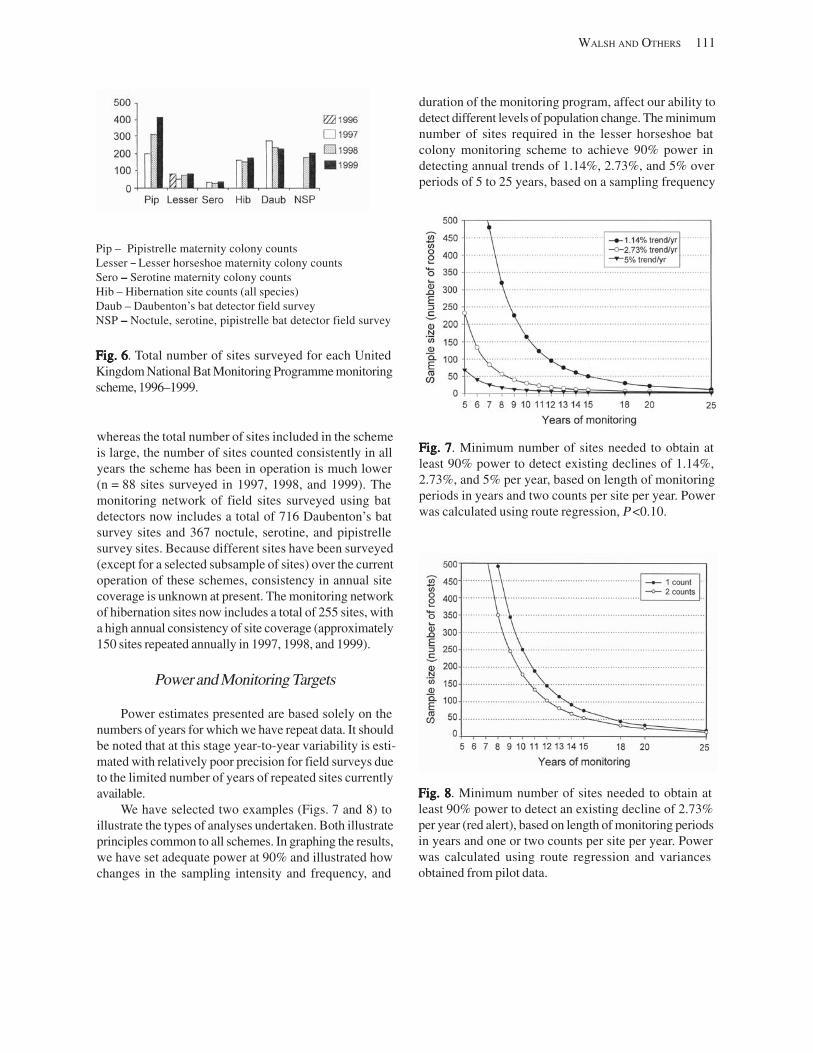
WALSH AND OTHERS 111
duration of the monitoring program, affect our ability to detect different levels of population change. The minimum number of sites required in the lesser horseshoe bat colony monitoring scheme to achieve 90% power in detecting annual trends of 1.14%, 2.73%, and 5% over periods of 5 to 25 years, based on a sampling frequency
Pip – Pipistrelle maternity colony counts Lesser – Lesser horseshoe maternity colony counts Sero ––––– Serotine maternity colony counts Hib – Hibernation site counts (all species) Daub – Daubenton’s bat detector field survey NSP ––––– Noctule, serotine, pipistrelle bat detector field survey
Fig. 6Fig. 6Fig. 6Fig. 6Fig. 6. Total number of sites surveyed for each United Kingdom National Bat Monitoring Programme monitoring scheme, 1996–1999.
whereas the total number of sites included in the scheme is large, the number of sites counted consistently in all years the scheme has been in operation is much lower (n = 88 sites surveyed in 1997, 1998, and 1999). The monitoring network of field sites surveyed using bat detectors now includes a total of 716 Daubenton’s bat survey sites and 367 noctule, serotine, and pipistrelle survey sites. Because different sites have been surveyed (except for a selected subsample of sites) over the current operation of these schemes, consistency in annual site coverage is unknown at present. The monitoring network of hibernation sites now includes a total of 255 sites, with a high annual consistency of site coverage (approximately 150 sites repeated annually in 1997, 1998, and 1999).
Power and Monitoring Targets
Power estimates presented are based solely on the numbers of years for which we have repeat data. It should be noted that at this stage year-to-year variability is estimated with relatively poor precision for field surveys due to the limited number of years of repeated sites currently available.
We have selected two examples (Figs. 7 and 8) to illustrate the types of analyses undertaken. Both illustrate principles common to all schemes. In graphing the results, we have set adequate power at 90% and illustrated how changes in the sampling intensity and frequency, and
Fig. 7Fig. 7Fig. 7Fig. 7Fig. 7. Minimum number of sites needed to obtain at least 90% power to detect existing declines of 1.14%, 2.73%, and 5% per year, based on length of monitoring periods in years and two counts per site per year. Power was calculated using route regression, P <0.10.
Fig. 8Fig. 8Fig. 8Fig. 8Fig. 8. Minimum number of sites needed to obtain at least 90% power to detect an existing decline of 2.73% per year (red alert), based on length of monitoring periods in years and one or two counts per site per year. Power was calculated using route regression and variances obtained from pilot data.
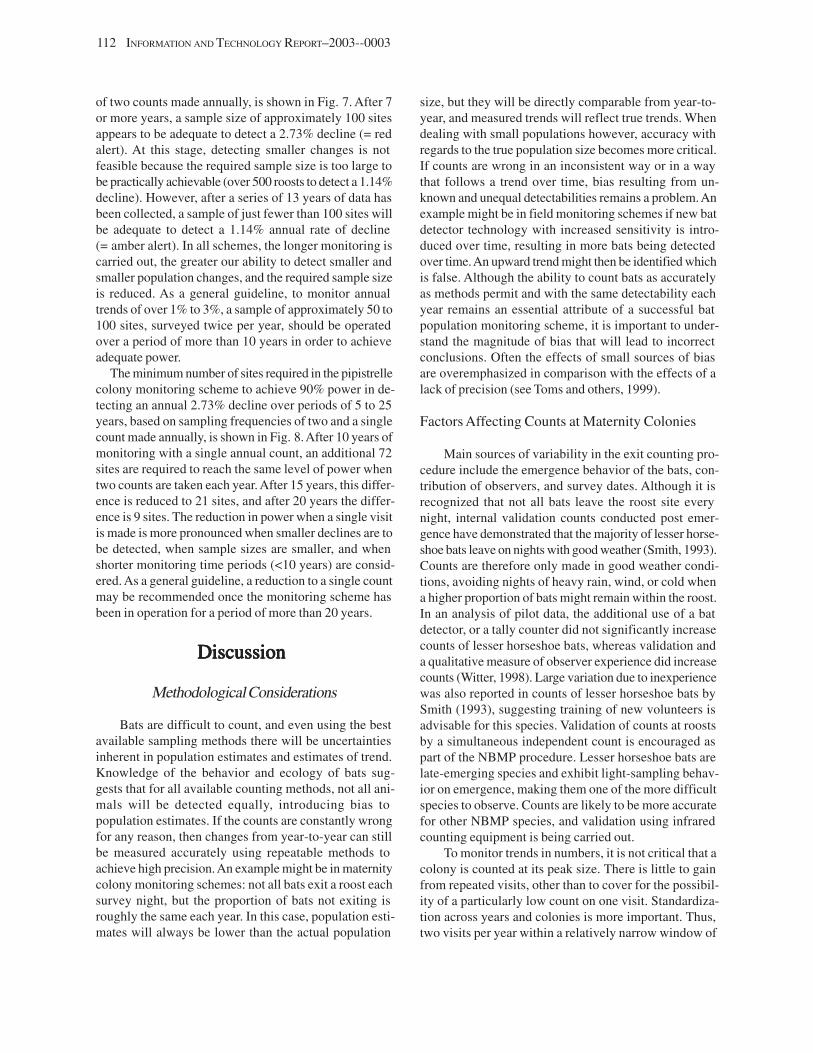
112 INFORMATION AND TECHNOLOGY REPORT–2003--0003
of two counts made annually, is shown in Fig. 7. After 7 or more years, a sample size of approximately 100 sites appears to be adequate to detect a 2.73% decline (= red alert). At this stage, detecting smaller changes is not feasible because the required sample size is too large to be practically achievable (over 500 roosts to detect a 1.14% decline). However, after a series of 13 years of data has been collected, a sample of just fewer than 100 sites will be adequate to detect a 1.14% annual rate of decline (= amber alert). In all schemes, the longer monitoring is carried out, the greater our ability to detect smaller and smaller population changes, and the required sample size is reduced. As a general guideline, to monitor annual trends of over 1% to 3%, a sample of approximately 50 to 100 sites, surveyed twice per year, should be operated over a period of more than 10 years in order to achieve adequate power.
The minimum number of sites required in the pipistrelle colony monitoring scheme to achieve 90% power in detecting an annual 2.73% decline over periods of 5 to 25 years, based on sampling frequencies of two and a single count made annually, is shown in Fig. 8. After 10 years of monitoring with a single annual count, an additional 72 sites are required to reach the same level of power when two counts are taken each year. After 15 years, this difference is reduced to 21 sites, and after 20 years the difference is 9 sites. The reduction in power when a single visit is made is more pronounced when smaller declines are to be detected, when sample sizes are smaller, and when shorter monitoring time periods (<10 years) are considered. As a general guideline, a reduction to a single count may be recommended once the monitoring scheme has been in operation for a period of more than 20 years.
DiscussionDiscussionDiscussionDiscussionDiscussion
Methodological Considerations
Bats are difficult to count, and even using the best available sampling methods there will be uncertainties inherent in population estimates and estimates of trend. Knowledge of the behavior and ecology of bats suggests that for all available counting methods, not all animals will be detected equally, introducing bias to population estimates. If the counts are constantly wrong for any reason, then changes from year-to-year can still be measured accurately using repeatable methods to achieve high precision. An example might be in maternity colony monitoring schemes: not all bats exit a roost each survey night, but the proportion of bats not exiting is roughly the same each year. In this case, population estimates will always be lower than the actual population
size, but they will be directly comparable from year-toyear, and measured trends will reflect true trends. When dealing with small populations however, accuracy with regards to the true population size becomes more critical. If counts are wrong in an inconsistent way or in a way that follows a trend over time, bias resulting from unknown and unequal detectabilities remains a problem. An example might be in field monitoring schemes if new bat detector technology with increased sensitivity is introduced over time, resulting in more bats being detected over time.An upward trend might then be identified which is false. Although the ability to count bats as accurately as methods permit and with the same detectability each year remains an essential attribute of a successful bat population monitoring scheme, it is important to understand the magnitude of bias that will lead to incorrect conclusions. Often the effects of small sources of bias are overemphasized in comparison with the effects of a lack of precision (see Toms and others, 1999).
Factors Affecting Counts at Maternity Colonies
Main sources of variability in the exit counting procedure include the emergence behavior of the bats, contribution of observers, and survey dates. Although it is recognized that not all bats leave the roost site every night, internal validation counts conducted post emergence have demonstrated that the majority of lesser horseshoe bats leave on nights with good weather (Smith, 1993). Counts are therefore only made in good weather conditions, avoiding nights of heavy rain, wind, or cold when a higher proportion of bats might remain within the roost. In an analysis of pilot data, the additional use of a bat detector, or a tally counter did not significantly increase counts of lesser horseshoe bats, whereas validation and a qualitative measure of observer experience did increase counts (Witter, 1998). Large variation due to inexperience was also reported in counts of lesser horseshoe bats by Smith (1993), suggesting training of new volunteers is advisable for this species. Validation of counts at roosts by a simultaneous independent count is encouraged as part of the NBMP procedure. Lesser horseshoe bats are late-emerging species and exhibit light-sampling behavior on emergence, making them one of the more difficult species to observe. Counts are likely to be more accurate for other NBMP species, and validation using infrared counting equipment is being carried out.
To monitor trends in numbers, it is not critical that a colony is counted at its peak size. There is little to gain from repeated visits, other than to cover for the possibility of a particularly low count on one visit. Standardization across years and colonies is more important. Thus, two visits per year within a relatively narrow window of
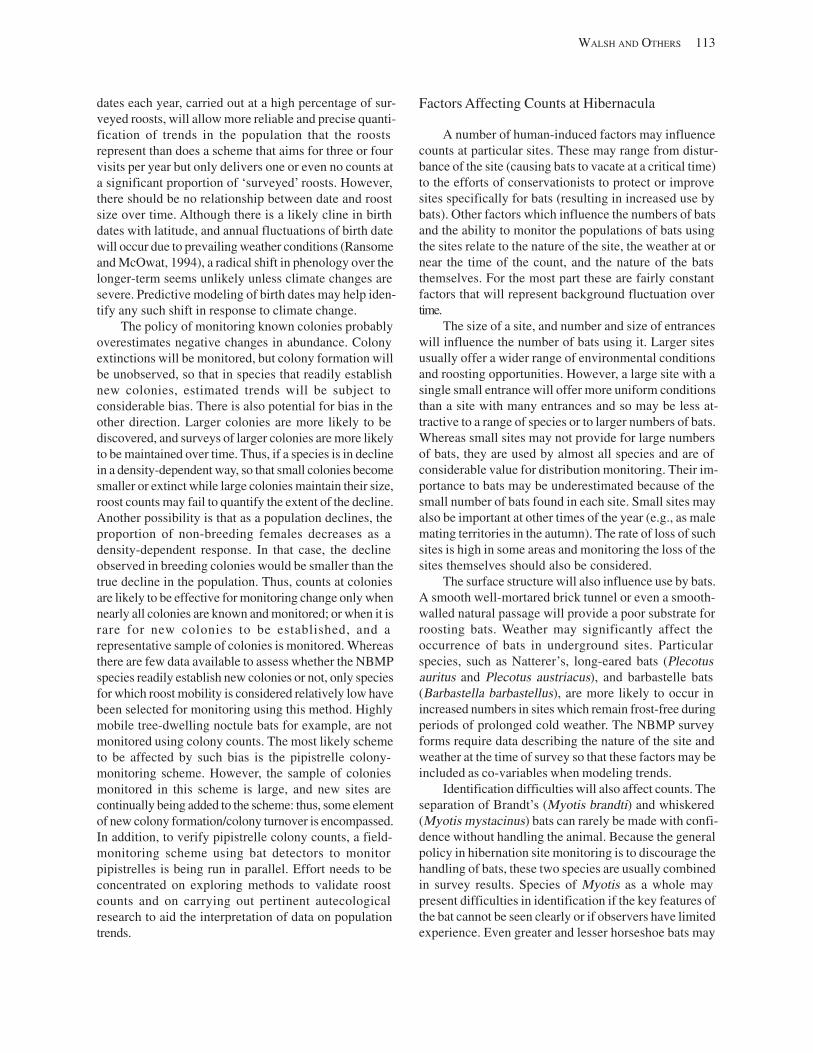
WALSH AND OTHERS 113
dates each year, carried out at a high percentage of surveyed roosts, will allow more reliable and precise quantification of trends in the population that the roosts represent than does a scheme that aims for three or four visits per year but only delivers one or even no counts at a significant proportion of ‘surveyed’ roosts. However, there should be no relationship between date and roost size over time. Although there is a likely cline in birth dates with latitude, and annual fluctuations of birth date will occur due to prevailing weather conditions (Ransome and McOwat, 1994), a radical shift in phenology over the longer-term seems unlikely unless climate changes are severe. Predictive modeling of birth dates may help identify any such shift in response to climate change.
The policy of monitoring known colonies probably overestimates negative changes in abundance. Colony extinctions will be monitored, but colony formation will be unobserved, so that in species that readily establish new colonies, estimated trends will be subject to considerable bias. There is also potential for bias in the other direction. Larger colonies are more likely to be discovered, and surveys of larger colonies are more likely to be maintained over time. Thus, if a species is in decline in a density-dependent way, so that small colonies become smaller or extinct while large colonies maintain their size, roost counts may fail to quantify the extent of the decline. Another possibility is that as a population declines, the proportion of non-breeding females decreases as a density-dependent response. In that case, the decline observed in breeding colonies would be smaller than the true decline in the population. Thus, counts at colonies are likely to be effective for monitoring change only when nearly all colonies are known and monitored; or when it is rare for new colonies to be established, and a representative sample of colonies is monitored. Whereas there are few data available to assess whether the NBMP species readily establish new colonies or not, only species for which roost mobility is considered relatively low have been selected for monitoring using this method. Highly mobile tree-dwelling noctule bats for example, are not monitored using colony counts. The most likely scheme to be affected by such bias is the pipistrelle colony-monitoring scheme. However, the sample of colonies monitored in this scheme is large, and new sites are continually being added to the scheme: thus, some element of new colony formation/colony turnover is encompassed. In addition, to verify pipistrelle colony counts, a field-monitoring scheme using bat detectors to monitor pipistrelles is being run in parallel. Effort needs to be concentrated on exploring methods to validate roost counts and on carrying out pertinent autecological research to aid the interpretation of data on population trends.
Factors Affecting Counts at Hibernacula
A number of human-induced factors may influence counts at particular sites. These may range from disturbance of the site (causing bats to vacate at a critical time) to the efforts of conservationists to protect or improve sites specifically for bats (resulting in increased use by bats). Other factors which influence the numbers of bats and the ability to monitor the populations of bats using the sites relate to the nature of the site, the weather at or near the time of the count, and the nature of the bats themselves. For the most part these are fairly constant factors that will represent background fluctuation over time.
The size of a site, and number and size of entrances will influence the number of bats using it. Larger sites usually offer a wider range of environmental conditions and roosting opportunities. However, a large site with a single small entrance will offer more uniform conditions than a site with many entrances and so may be less attractive to a range of species or to larger numbers of bats. Whereas small sites may not provide for large numbers of bats, they are used by almost all species and are of considerable value for distribution monitoring. Their importance to bats may be underestimated because of the small number of bats found in each site. Small sites may also be important at other times of the year (e.g., as male mating territories in the autumn). The rate of loss of such sites is high in some areas and monitoring the loss of the sites themselves should also be considered.
The surface structure will also influence use by bats. A smooth well-mortared brick tunnel or even a smooth-walled natural passage will provide a poor substrate for roosting bats. Weather may significantly affect the occurrence of bats in underground sites. Particular species, such as Natterer’s, long-eared bats (Plecotus auritus and Plecotus austriacus), and barbastelle bats (Barbastella barbastellus), are more likely to occur in increased numbers in sites which remain frost-free during periods of prolonged cold weather. The NBMP survey forms require data describing the nature of the site and weather at the time of survey so that these factors may be included as co-variables when modeling trends.
Identification difficulties will also affect counts. The separation of Brandt’s (Myotis brandti) and whiskered (Myotis mystacinus) bats can rarely be made with confidence without handling the animal. Because the general policy in hibernation site monitoring is to discourage the handling of bats, these two species are usually combined in survey results. Species of Myotis as a whole may present difficulties in identification if the key features of the bat cannot be seen clearly or if observers have limited experience. Even greater and lesser horseshoe bats may
114 INFORMATION AND TECHNOLOGY REPORT–2003--0003
be difficult to distinguish on the roof of a high cavern. However, most surveys at hibernation sites are carried out by groups of people where the range of experience can achieve accurate identification for most bats. The number of unidentified or questionably identified bats can be accounted for in the survey results, and are unlikely to affect the general trend over time.
The above factors can be accommodated in the long-term monitoring of underground sites to give reliable data on population changes, but the ability of bats to conceal themselves in spaces that cannot be inspected (such as gaps behind brickwork, natural rock or boulder formations, within rock scree on the floor) means the number counted may be an unknown proportion of the number of bats present. An assumption is made that even where the majority of bats may be hidden from view [as was shown for one site by Baagoe and others (1988)], the bats that are visible are representative and this representativeness remains constant from year to year. Movement of bats between sites, as identified in greater horseshoe bats by Park and others (1999), may also affect counts, although the magnitude of this is likely to be small.
Factors Affecting Field Surveys Using Bat Detectors
Randomized sample survey methods avoid many of the difficulties associated with roost and hibernation site counts. In principle, trends over time within a species can be estimated purely from the index of number of passes detected; precisely how many animals are detected is not needed. Over time however, several requirements need to be met.
Transect lines should be placed according to a randomized design. Failing that, they might be placed in the same, nonrandom locations each year, in which case trend estimates will apply to the locations covered, and not necessarily to a wider area of interest. There should be no trend over time in the sensitivity of the equipment. Advances in bat detector technology are inevitable, and as technology improves it is not logical to justify retaining inferior equipment. To introduce new detectors to monitoring schemes, calibration against the old detectors will be required for each species (see Waters and Walsh, 1994). If a measure of the effectiveness of a detector can be recorded, the analyst can adjust for it, although such sequences of data are notoriously difficult to model reliably.
There should be no trend in detectability of bats over time. For monitoring relative abundance, it does not matter if it is impossible to determine whether a count of, say, five bat passes corresponds to five different animals, or to just one animal passing five times. Provided the average number of passes per bat does not show a trend
over time, number of passes can be taken as an index of number of bats: if the number of passes halves in 5 years, and other factors are unchanged, we estimate that the number of bats has halved. If bats vary in their detectability between habitats, then habitat successional changes might cause bias in estimated trends. However, this must be examined on a species by species basis. Noctule bats prefer open habitats, and will rarely be found close to edge habitats, and never within cluttered habitats. Thus, their detectability remains relatively constant due to habitat specificity. Serotines most frequently forage in edge/open habitat, Daubenton’s bats most frequently forage over water, and pipistrelles favor edge (occasionally more enclosed areas) and tend to avoid open or very cluttered habitats. Thus, differential detectability between habitats is unlikely to be a large bias. However, in areas of high bat activity, it can be difficult to count the number of bat passes. If observers cannot reliably estimate the number, there is the potential for bias in estimated trends. It does not matter if the counts are subject to error, provided that observers do not consistently estimate high or low. If, for example, there were a tendency to underestimate the number of passes at high density, then any decline in numbers of bats would also be underestimated.
Detected passes should be reliably identifiable by species. Alternatively, a proportion of passes should be identifiable, and there should be no trend over time in this proportion. For example, if 80% of bat passes are correctly identified in the waterway-monitoring scheme for Daubenton’s bats, then this must remain at 80% for the duration of the monitoring scheme. If observers improve in their ability to identify bats over time, then a false increasing trend might be identified. In NBMP schemes, bats are recorded as bat passes of the species under study or, when the observer is uncertain of identification, as “unsure” bat passes. The ratio of identified to unsure bat passes may therefore be calculated and trends in this ratio examined. If a measure of the effectiveness of classes of observers can be made, the analyst can adjust for it.
Statistical Monitoring Targets
At the outset, the major point to consider when planning monitoring programs is the dominating effect of time over most survey variables. A key question to answer is how much time managers are willing or able to wait for conclusive results. Testing for trends is complicated because long-term declines may take the form of slow gradual declines or sudden crashes; trends are set against a backdrop of natural fluctuations in size of bat populations due to stochastic factors, such as the effects of weather
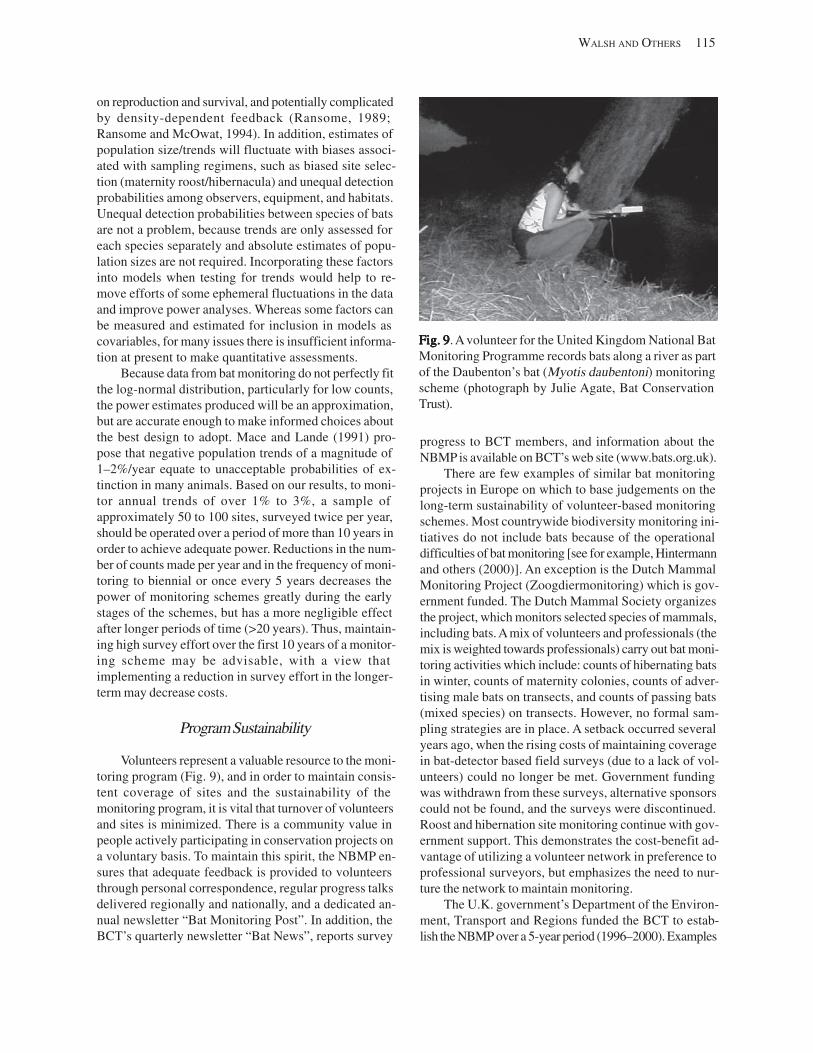
on reproduction and survival, and potentially complicated by density-dependent feedback (Ransome, 1989; Ransome and McOwat, 1994). In addition, estimates of population size/trends will fluctuate with biases associated with sampling regimens, such as biased site selection (maternity roost/hibernacula) and unequal detection probabilities among observers, equipment, and habitats. Unequal detection probabilities between species of bats are not a problem, because trends are only assessed for each species separately and absolute estimates of population sizes are not required. Incorporating these factors into models when testing for trends would help to remove efforts of some ephemeral fluctuations in the data and improve power analyses. Whereas some factors can be measured and estimated for inclusion in models as covariables, for many issues there is insufficient information at present to make quantitative assessments.
Because data from bat monitoring do not perfectly fit the log-normal distribution, particularly for low counts, the power estimates produced will be an approximation, but are accurate enough to make informed choices about the best design to adopt. Mace and Lande (1991) propose that negative population trends of a magnitude of 1–2%/year equate to unacceptable probabilities of extinction in many animals. Based on our results, to monitor annual trends of over 1% to 3%, a sample of approximately 50 to 100 sites, surveyed twice per year, should be operated over a period of more than 10 years in order to achieve adequate power. Reductions in the number of counts made per year and in the frequency of monitoring to biennial or once every 5 years decreases the power of monitoring schemes greatly during the early stages of the schemes, but has a more negligible effect after longer periods of time (>20 years). Thus, maintaining high survey effort over the first 10 years of a monitoring scheme may be advisable, with a view that implementing a reduction in survey effort in the longer-term may decrease costs.
Program Sustainability
Volunteers represent a valuable resource to the monitoring program (Fig. 9), and in order to maintain consistent coverage of sites and the sustainability of the monitoring program, it is vital that turnover of volunteers and sites is minimized. There is a community value in people actively participating in conservation projects on a voluntary basis. To maintain this spirit, the NBMP ensures that adequate feedback is provided to volunteers through personal correspondence, regular progress talks delivered regionally and nationally, and a dedicated annual newsletter “Bat Monitoring Post”. In addition, the BCT’s quarterly newsletter “Bat News”, reports survey
WALSH AND OTHERS 115
Fig. 9Fig. 9Fig. 9Fig. 9Fig. 9. A volunteer for the United Kingdom National Bat Monitoring Programme records bats along a river as part of the Daubenton’s bat (Myotis daubentoni) monitoring scheme (photograph by Julie Agate, Bat Conservation Trust).
progress to BCT members, and information about the NBMP is available on BCT’s web site (www.bats.org.uk).
There are few examples of similar bat monitoring projects in Europe on which to base judgements on the long-term sustainability of volunteer-based monitoring schemes. Most countrywide biodiversity monitoring initiatives do not include bats because of the operational difficulties of bat monitoring [see for example, Hintermann and others (2000)]. An exception is the Dutch Mammal Monitoring Project (Zoogdiermonitoring) which is government funded. The Dutch Mammal Society organizes the project, which monitors selected species of mammals, including bats. A mix of volunteers and professionals (the mix is weighted towards professionals) carry out bat monitoring activities which include: counts of hibernating bats in winter, counts of maternity colonies, counts of advertising male bats on transects, and counts of passing bats (mixed species) on transects. However, no formal sampling strategies are in place. A setback occurred several years ago, when the rising costs of maintaining coverage in bat-detector based field surveys (due to a lack of volunteers) could no longer be met. Government funding was withdrawn from these surveys, alternative sponsors could not be found, and the surveys were discontinued. Roost and hibernation site monitoring continue with government support. This demonstrates the cost-benefit advantage of utilizing a volunteer network in preference to professional surveyors, but emphasizes the need to nurture the network to maintain monitoring.
The U.K. government’s Department of the Environment, Transport and Regions funded the BCT to establish the NBMP over a 5-year period (1996–2000). Examples
116 INFORMATION AND TECHNOLOGY REPORT–2003--0003
of such significant investment in non-governmental organizations to undertake conservation research work are rare. Building on the success of the program, the BCT has secured substantial financial support from the government’s conservation agency (Joint Nature Conservation Committee) to maintain and develop the NBMP through 2005. Over the long-term, BCT is seeking to form a series of partnerships among government conservation agencies, the devolved statutory nature conservation organizations, and other government and non-government organizations, all of whom are important users of the monitoring results. Ultimately, funding from a number of diverse sponsors and the synergy between the amateur and professional sectors will provide a more stable support system than reliance on a single sponsor or single sector.
Outlook for the Future
This paper has focused on the early development and structure of the program. Publication of the results of the initial 5-year development phase of the monitoring program will be forthcoming. Future activities of the NBMP are likely to fall into two key areas: maintenance and revision of the core set of monitoring schemes, and identification and implementation of techniques to monitor the remaining (eight) nontarget species, particularly species that are rare or of international concern.
The monitoring techniques developed by the NBMP have already been widely recognized internationally and have provided a model for developing standard transboundary monitoring techniques for bats in Europe (accepted by Parties of the European Bats Agreement in 1998). Our success, alongside the long-standing success of the British Trust for Ornithology, in recruiting and coordinating volunteer work forces, has recently prompted the Department of the Environment, Transport and Regions to undertake a scoping study to assess how volunteers might be involved in a national mammal monitoring program within the U.K. In the future, it is likely that bat monitoring will become an integral part of a wider mammal monitoring network.
There is no doubt that considerable improvement of our knowledge of bat populations through supporting research projects is needed to assess and improve monitoring methods. However, conservation decisions must be based on the best available evidence at the time. The NBMP has taken the best scientific knowledge and techniques available, and put them directly into practice.
AcknowledgmentsAcknowledgmentsAcknowledgmentsAcknowledgmentsAcknowledgments
We thank the many people who have dedicated their spare time to help with the collection of field data under arduous nighttime conditions. We also extend thanks to the many volunteers, office and BCT staff (in particular Julie Agate, Julia Baker,Andy Jones, Meesha Patel, James Bell, Clare Bowen, Nicky Belbeck, James Farrell, Conrad Ellam, and Mari Monii) who have worked to keep the NBMP office running smoothly. The support of English Nature, Countryside Council for Wales, Scottish Natural Heritage, the Joint Nature Conservation Committee, and the Environment Agency are gratefully acknowledged. The Department of the Environment, Transport and Regions funded the program from 1996 to 2000.
References CitedReferences CitedReferences CitedReferences CitedReferences Cited
Baagoe, H., Degn, H.J., and Nielson, P., 1988, Departure dynamics of Myotis daubentoni (Chiroptera) leaving a large hibernaculum: Videnskabelige Meddelelser fra Dansk Naturhistorisk Forening, vol. 147, p. 7–24.
Barratt, E.M., Burland, T.M., Deaville, R., Bruford, M.W., Jones, G., Racey, P.A., and Wayne, R.K., 1997, DNA answers the call of the pipistrelle bat: Nature, vol. 387, p. 138–139.
Bulmer, M.G., 1979, Principles of statistics (2d ed.): New York, Dover Publications.
Bunce, R.G.H., Barr, C.J., Clarke, R.T., Howard, D.C., and Lane, A.M.J., 1996, Land classification for strategic ecological survey: Journal of Environmental Management, vol. 47, p. 37–60.
Cochran, W.G., 1977, Sampling techniques (3d ed.): New York, Wiley.
Corbet, G.B., and Harris, S., 1991, The handbook of British mammals (3d ed.): Oxford, Blackwell Scientific.
Daan, S., Glas, G.H., and Voûte, A.M., 1980, Long-term changes in bat populations in the Netherlands: Lutra, vol. 22, p. 1–118.
Dwyer, P.D., 1966, The population pattern of Miniopterus schreibersii (Chiroptera) in northeastern New South Wales:Australian Journal of Zoology, vol. 14, p. 1073– 1137.
Firbank, L.G., Barr, C.J., Bunce, R.G.H., Furse, M.T., Haines-Young, R.H., Hornung, M., Howard, D.C., Sheail, J., Sier, A.R.J., and Smart, S.M., 2003, Assessing stock
WALSH AND OTHERS 117
and change in land cover and biodiversity in GB: An introduction to the Countryside Survey 2000: Journal of Environmental Management, vol. 67, p. 207–218.
Genstat 5 Committee, 1993, Genstat 5 Release 3: Reference manual: Oxford, Clarendon Press.
Gibbs, J.P., 1995, Monitor: Users manual, Department of Biology: New Haven, Conn, Yale University.
Harris, S., Morris, P., Wray, S., and Yalden, D., 1995, A review of British mammals: Population estimates and conservation status of British mammals other than cetaceans: Joint Nature Conservation Committee, Peterborough, U.K.
Hintermann, U., Weber, D., and Zangger, A., 2000, Biodiversity monitoring in Switzerland, in Bischoff , C., and Dröschmeister, R., eds, European Monitoring for Nature Conservation. Bonn-Bad Godesberg (Bundesamt für Naturschutz) Schriftner: Landschaftspflege Naturschutz 62, p. 47–58.
Hooper, J.H.D., 1983, The study of horseshoe bats in Devon caves: A review of progress 1947–1982: Studies in Speleology, vol. 4, p. 59–70.
Hutson, A.M., 1993, Action plan for the conservation of bats in the United Kingdom: London, The Bat Conservation Trust.
Jones, G.J., and Barratt, E.M., 1999, Vespertilio pipistrellus Schreber, 1774 and V. pygmaeus Leach 1825 (currently Pipistrellus pipistrellus and P. pygmaeus; Mammalia Chiroptera): Proposed designation of neotypes: Bulletin of Zoological Nomenclature, vol. 56, p. 182–186.
Kowalski, M., and Lesinski, G., 1991, Changes in numbers of bats at Szachownica Cave (central Poland) during 10 years: Myotis, vol. 29, p. 35–38.
Limpens, H.J.G.A., 1993a, Bat-detectors in a detailed bat survey--a method, in Kapteyn, K., ed., Proceedings of the first European bat detector workshop: Netherlands Bat Foundation, Amsterdam, p. 79–89.
Limpens, H.J.G.A., 1993b, The Dutch national bat survey: A short introduction, in Kapteyn, K., ed., Proceedings of the first European bat detector workshop: Netherlands Bat Foundation, Amsterdam, p. 105–112.
Macdonald, D.W, Mace, G., and Rushton, S., 1998, Proposals for the future monitoring of British mammals: Joint Nature Conservation Committee, Peterborough, U.K.
Mace, G.M., and Lande, R., 1991, Assessing extinction threats: Towards a reevaluation of IUCN threatened species categories: Conservation Biology, vol. 5, p. 148–157.
Mitchell-Jones, A.J., 1999, ed., The bat workers’ manual (2d ed.): Joint Nature Conservation Committee, Peterborough, U.K.
Mitchell-Jones, A.J., Hutson, A.M., and Racey, P.A., 1993, The growth and development of bat conservation in Britain: Mammal Review, vol. 23, issues 3/4, p. 139– 148.
Park, K.J., Jones, G., and Ransome, R.D., 1999, Winter activity of a population of greater horseshoe bats (Rhinolphus ferrumequium): Journal of Zoology, vol. 248, p. 419–427.
Racey, P.A., 2000, Does legislation conserve and does research drive policy--the case of bats in the U.K.? in Entwistle, A.C., and Dunstone, N., eds., Future perspectives for the conservation of mammalian diversity: Has the Panda had its day? Cambridge University Press, England, p. 159–173.
Ransome, R.D., 1989, Population changes of greater horseshoe bats studied near Bristol over the past twenty-six years: Biological Journal of the Linnean Society, vol. 38, p. 71–82.
Ransome, R.D., and McOwat, T.M., 1994, Birth timing and population changes in greater horseshoe bat (Rhinolophus ferrumequinum) colonies are synchronised by climatic temperature: Zoological Journal of the Linnean Society, vol. 112, p. 337–351.
Robinson, D.L., 1987, Estimation and use of variance components: The Statistician, vol. 36, p. 3–14.
Smith, P.G., 1993, Lesser horseshoe bat monitoring in Wales, 20 May to 10 June 1993: CCW Report 25, Countryside Council for Wales.
Stebbings, R.E., 1988, Conservation of European bats: London, Christopher Helm Publishers, Ltd.
Stebbings, R.E., and Arnold, H.R., 1987, Assessment of trends in size and structure of a colony of the greater horseshoe bat: Symposium of the Zoological Society of London, vol. 58, p. 7–24.
Stebbings, R.E., and Griffith, F., 1986, Distribution and status of bats in Europe: London, Christopher Helm Publishers, Ltd.
Swift, S., 1980, Activity patterns of pipistrelle bats (Pipistrellus pipistrellus) in north east Scotland: Journal of Zoology, vol. 190, p. 285–295.
Toms, M.P., Siriwardena, G.M., and Greenwood, J.J.D., 1999, Developing a mammal monitoring programme for the U.K.: BTO Research Report No. 223, British Trust for Ornithology, Thetford.
Tuttle, M.D., 1979, Status, causes of decline, and management of endangered gray bats: Journal of Wildlife Management, vol. 43, p. 1–17.
Verboom, B., 1998, The use of edge habitats by commuting and foraging bats: IBN Scientific Contributions
118 INFORMATION AND TECHNOLOGY REPORT–2003--0003
10. DLO Institute for Forestry and Nature Research (IBN-DLO), Wageningen, Netherlands.
Walsh, A.L., and Harris, S., 1996a, Factors determining the abundance of vespertilionid bats in Britain: Geographical, land class and habitat relationships: Journal of Applied Ecology, vol. 33, p. 519–529.
Walsh, A.L., and Harris, S., 1996b, Foraging habitat preferences of vespertilionid bats in Britain: Journal of Applied Ecology, vol. 33, p. 508–518.
Walsh, A.L., Hutson, A.M., and Harris, S., 1993, U.K. volunteer bat groups and the British bats and habitats survey, in Kapteyn, K., ed., Proceedings of the first European bat detector workshop: Netherlands Bat Foundation, Amsterdam, p. 113–123.
Waters, D.A., and Walsh, A.L., 1994, The influence of bat detector brand on the quantitative estimation of bat activity: Bioacoustics, vol. 5, p. 205–221.
Witter, M.S., 1998, Analysis of the Wales lesser horseshoe bat summer roost survey data 1993–1997, CCW Contract Science Report No. 308: Countryside Council for Wales.
Wilson, A.M., Marchant, J.H., Gregory, R.D., Siriwardena, G.M., and Baillie, S.R., 1998, Enhancements for monitoring of opportunistic bird populations: BTO Research Report No. 200, British Trust for Ornithology, Norfolk, U.K.
A Critical Look at National Monitoring ProgramsA Critical Look at National Monitoring ProgramsA Critical Look at National Monitoring ProgramsA Critical Look at National Monitoring ProgramsA Critical Look at National Monitoring Programs for Birds and Otherfor Birds and Otherfor Birds and Otherfor Birds and Otherfor Birds and Other WWWWWildlife Speciesildlife Speciesildlife Speciesildlife Speciesildlife Species
By
John R. Sauer
U.S. Geological Survey Patuxent Wildlife Research Center
11510 American Holly Drive Laurel, MD 20708
AbstracAbstracAbstracAbstracAbstract. Concerns about declines in numerous taxa have created a great deal of interest in survey development. Because birds have traditionally been monitored by a variety of methods, bird surveys form natural models for development of surveys for other taxa. Here I suggest that most bird surveys are not appropriate models for survey design. Most lack important design components associated with estimation of population parameters at sample sites or with sampling over space, leading to estimates that may be biased. I discuss the limitations of national bird monitoring programs designed to monitor population size. Although these surveys are often analyzed, careful consideration must be given to factors that may bias estimates but that cannot be evaluated within the survey. Bird surveys with appropriate designs have generally been developed as part of management programs that have specific information needs. Experiences gained from bird surveys provide important information for development of surveys for other taxa, and statistical developments in estimation of population sizes from counts provide new approaches to overcoming the limitations evident in many bird surveys. Design of surveys is a collaborative effort, requiring input from biologists, statisticians, and the managers who will use the information from the surveys.
KeyKeyKeyKeyKey WWWWWordsordsordsordsords: Bats, bias, capture-recapture, estimation, index, monitoring, sample frame, surveys.
IntroductionIntroductionIntroductionIntroductionIntroduction
Birds are a highly visible and charismatic component of the natural world, and are often viewed as indexes to quality of nature. Most are protected by international treaties that create a legal mandate to monitor their populations, and hunted species are particularly well monitored by Federal and state agencies. Volunteers have proven to be enthusiastic counters of birds in large-scale projects such as the North American Breeding Bird Survey (BBS) and the Christmas Bird Count (CBC). Consequently, large amounts of information are available regarding counts of birds in NorthAmerica, and a remarkable number of projects exist that purport to function to provide population information on birds to assist in conservation. These activities include breeding and wintering bird atlases, roost counts, constant-effort mist netting, acoustic sampling, radar imaging of migrating birds,
roadside survey counts, nest-box monitoring, aerial surveys, point counts, play-back counts, and many other methods of encountering birds (e.g., Sauer and Droege, 1990). Surveys for other taxa are often modeled after bird surveys, including roadside surveys of calling amphibians (e.g., Mossman and others, 1998) and 4th of July butterfly counts that collect information analogous to that collected during CBCs.
Even though all of these programs provide information about the targeted populations, there is still a great deal of controversy regarding whether these surveys provide useful results for population management. Much of this controversy is based on statistical concerns that the design of the surveys does not permit unbiased estimation, and in part reflects recent advances in understanding of monitoring methods. Our knowledge of what constitutes a reasonable survey is much more sophisticated now than it was several decades ago. We have a much clearer view of how surveys should
119
120 INFORMATION AND TECHNOLOGY REPORT–2003-0003
be designed to provide precise estimates of trend or habitat-specific abundance to assist in achieving management goals, and technical tools for analysis and integration of data have undergone remarkable changes over the past few years. However, many new programs for surveying birds duplicate all the deficiencies of earlier programs. In general, they either are not sensitive to the management need that motivates them or they fail to appropriately sample the population of interest. Surveys must reflect collaboration between management, biological, and statistical expertise. Unfortunately, the interdisciplinary nature of survey design and implementation is often ignored in survey development, leading to surveys that are limited with regard to at least one critical component. In this paper, I review some ideas of what constitutes a reasonable survey, and review whether selected bird surveys provide reliable information about populations.
Why Monitor?Why Monitor?Why Monitor?Why Monitor?Why Monitor?
Many bird surveys are developed with only vague notions about the uses of the survey results. For example, surveys on federal lands sometimes result from legislative mandates to monitor, some surveys are established to provide birding activities for the public, and other programs develop simply from the perception that useful information can be gathered from a new technological tool such as weather radar or sound recording equipment. Vagueness associated with goals and uses of survey information often makes it impossible to design a relevant survey. Unless goals are precisely defined, it is impossible to define a population to be sampled, develop a survey design to meet the goals, or judge the relative merits of alternative procedures.
Most relevant surveys are tied directly to management and research needs for population management. Migratory bird managers use estimates of change in population size from waterfowl surveys to evaluate the consequences of harvest regulations; land managers use estimates of population change to judge the effectiveness of land management activities. Occasionally, estimates of movement rates among colony sites or refuges are needed for management, or demographic information such as survival and productivity is needed to assess the viability of local populations.
The information collected in a survey must be relevant to the goals of the management or research. Traditional management of migratory birds has relied primarily on time series of estimates of population size to assess population status. Often, these data are counts of observed numbers of birds, although occasionally banding
studies are used to estimate population size for populations that cannot be observed for counting. Although population size information has obvious relevance, it is often difficult to understand the causes of population change from population size data. The observation of change in numbers has little utility if it provides no insight into why change is occurring. Consequently, several bird monitoring programs focus on estimation of primary demographic parameters such as survival, productivity, and movement rates (e.g., DeSante, 1992) in an attempt to estimate parameters that are more likely to be associated with causal factors. Nonetheless, many biologists view estimation of population size (or change in population size) as a primary goal of surveys, and I will emphasize surveys that address this goal.
Waterfowl biologists have recently initiated adaptive harvest management of selected species (Williams and Johnson, 1995). In adaptive management, managers make a decision based on best predictions of the population responses to alternative management options. Monitoring is used to evaluate the quality of the predictions and to update the models used to make future management decisions. This use of monitoring provides insight into the causes of population change because it allows managers to determine which model will provide the best predictions for consequences of management, and is perhaps the most effective use of monitoring in a management context. When management goals exist, it is important to consider the role of monitoring information in assessing the consequences of management.
Design Issues forDesign Issues forDesign Issues forDesign Issues forDesign Issues for WWWWWildlifeildlifeildlifeildlifeildlife SurveysSurveysSurveysSurveysSurveys
Survey design has a large literature, both in wildlife and statistics journals. In particular, Thompson and others (1998) and Skalski and Robson (1992) provide general reviews of many components of the design of wildlife surveys. Surveys are generally based on probability sampling, in which the population is divided into a series of sample units, each of which has a known probability of appearing in a sample. The actual samples chosen in the survey are selected randomly based on associated probabilities of selection, allowing development of sampling theory and estimates of population attributes. In almost all wildlife surveys, an additional complication exists in that we generally cannot census sample units, and we have to estimate total numbers of animals (our attribute of interest) in each sample unit. Skalski (1994) refers to this as 2-stage sampling, where probability sampling over spatial sampling units is the first stage, and the estimation of animal density within sample units is the second
stage. This is an extremely useful distinction, as both components are critical in wildlife survey design. Note that the second stage requires estimation of population size for a known area.
Cochran (1977) outlines components that should be considered when planning and implementing a sample survey (Table 1). This very general outline should be consulted before any survey is designed, as it contains several logistical and conceptual components often omitted from wildlife surveys. For example, notions of goals, target populations, pilot studies, and planning for quality control all need additional emphasis in most wildlife studies. Also imbedded in this outline are the particular constraints of wildlife surveys, as Skalski’s (1994) first stage particularly relates to definition of the target population and development and sampling from the frame, whereas the second stage relates to methods of measurement and collection of relevant data (Table 1).
Common Problems withCommon Problems withCommon Problems withCommon Problems withCommon Problems with Bird SurveysBird SurveysBird SurveysBird SurveysBird Surveys
In my view, most bird monitoring programs are missing several of the components suggested by Cochran (1977). They often lack clear statements of objectives, and sometimes have vaguely defined target populations, incomplete sampling frames, and poorly thought-out methods of measurement. Even the most well-known bird surveys, such as the BBS or CBC, provide incomplete lists of species and numbers of individuals present at a particular time and place. The CBC, which was started to provide a recreational activity for birdwatchers, is often considered “the largest wildlife survey in the world”
SAUER 121
(Butcher, 1990, p. 5). The BBS was developed specifically to monitor landbirds (Robbins and others, 1986). Unfortunately, both surveys are deficient in two critical components:
Deficiency 1. The counts are not censuses. Instead, varying numbers of groups of counters record birds from areas within the 15-mile diameter “circles” that form the sample units of the CBC. Clearly, numbers of birds counted varies with the amount of effort in counting and the competence of the observers, and no attempt is made to estimate the number of birds actually present. In the BBS, the 50 point-counts that comprise each survey route are also not censuses, but count an unknown proportion of the birds present in an area. It is well known that the detectability of birds varies between routes and observers in the BBS (Sauer and others, 1994).
Deficiency 2. The sample units are not randomly selected. Instead, in the CBC they are generally centered in places likely to be of interest to birders. In the BBS, although there is an element of random route selection, the routes are restricted to roadsides, and any site >0.25 mile from a roadside is not in the sampling frame.
The consequences of these deficiencies are obvious. For Deficiency 1, it is clear that counts from the surveys always underestimate the population size. Thus, any use of the data requires that we assume that either the counts accurately index the population (i.e., the counts are a constant proportion of the population size), or that the variation in the proportion counted can be controlled by use of effort (for the CBC) or observer (for the BBS) covariates. Unless obviously incorrect assumptions are
TTTTTable 1able 1able 1able 1able 1. List of essential elements for development of a sample survey, as defined by Cochran (1977).
• Development of objectives is needed to provide structure for the project.
• The target population must be defined to ensure that it coincides with the sampled population.
• Data to be collected must be relevant to the objectives.
• Needed degree of precision must be specified.
• Methods of measurement must be chosen.
• A sampling frame (listing of all possible sample units) must be developed that covers the entire population.
• Methods of selecting a sample from the frame must be defined.
• Small-scale trials of design (pretests, pilot studies) are useful to evaluate efficiency.
• Organization of fieldwork must incorporate planning for quality control and quality assurance.
• Summary and analysis of data should be considered during survey design.
• All surveys must be viewed as providing information to be used in designing future surveys.
122 INFORMATION AND TECHNOLOGY REPORT–2003-0003
made, CBC and BBS count data cannot be considered a census. For Deficiency 2, it is clear that any information from the sample units cannot be used to extrapolate to areas not sampled unless we assume either that they constitute a random sample from the population, or that the lack of representativeness can be controlled by use of covariates that reflect differences among the actual sample sites and the rest of the area.
Statisticians refer to Deficiency 1 as visibility bias in estimation, and Deficiency 2 as an incomplete sample frame. Surveys containing these deficiencies are often called “index” surveys because they explicitly only count parts of the actual population of interest. Note that in the context of surveys, an index is often implicitly defined as a count that is related in some unknown (but assumed to be consistent) way to an underlying parameter. Most biologists tend to consider indexes in the context of the second stage of sampling because a count collected at a sample unit is often considered to index population size at a site. However, it is also useful to consider indexes in the spatial sampling context.
Almost all bird surveys have some deficiencies associated with use of indexes. Every survey discussed in Sauer and Droege (1990) as providing information on population trends could be categorized as an index survey. Popular bird survey methods, such as point counts (Ralph and others, 1995), only index population size at sample sites. The only example of a long-term, geographically extensive survey designed with explicit consideration of both stages of sampling is the Spring Breeding Ground Survey for waterfowl (Smith, 1995, p. 29).
Analysis of Survey DataAnalysis of Survey DataAnalysis of Survey DataAnalysis of Survey DataAnalysis of Survey Data
Analysis of index surveys has proven to be very controversial, and the statistical literature contains many cautions about their limitations. As examples, it has been stated that:
“Using just the count of birds detected (per unit effort) as an index (to) abundance is neither scientifically sound nor reliable” (Burnham, 1981, p. 325), and “It is imperative in designing the preliminary survey to build in the capability of the sampling program the ability of testing homogeneity of the proportionality factor values...” (Skalski and Robson, 1992).
Naive analysts of index surveys treat them as single stage sample surveys. That is, they assume that within-site indexes are censuses reflecting area-specific abundances, then ignore possible sample frame problems and calculate estimates using standard sample survey theory.
Estimating a total population size of a species from CBC data or using mean counts from BBS routes are examples of the naive approach to survey analysis. Although most analysts recognize that naive analyses of index surveys are likely to lead to biased estimates (e.g., James and others, 1990; Lancia and others, 1994), many examples of inappropriate analyses of index surveys exist. Generally, appropriate analysis of index surveys tend to be much more complicated (and problematic) than analysis of 2stage surveys.
Analysis of 2-Stage Surveys
The 2-stage nature of wildlife surveys always introduces some complications into analysis, in that within-sample unit abundances must be estimated. Two-stage surveys require some statistical modeling for estimation in the second stage, but then are design-based, in that the probabilistic design of the sampling in the first stage is model-free. This means that some statistical procedure such as capture-recapture is used to estimate visibility rates of animals within sample units, but once they are estimated the first stage can be treated using standard sample survey theory.
Analysis of Index Surveys
Index surveys often cannot be assumed to provide censuses with sites or even fixed areas of sampling. Appropriate analysis of data from surveys such as the CBC or the BBS requires that deficiencies of the surveys be acknowledged and accommodated. Generally, these accommodations involve additional statistical modeling that seeks to minimize bias in estimation at each stage of the survey. For the second stage, this involves identifying factors that might influence the visibility rates of birds (such as effort in the CBC), and modeling the effects of effort on counts as part of the analysis. For the first stage, factors such as habitat areas within regions form possible covariates. For either stage, resulting estimates are model-based, in that it must be assumed that the covariate adjustments adequately accommodate the deficiencies of the original sample. Care must be taken, however, to distinguish covariates influencing the proportion counted from covariates related to actual population sizes; the former should be included in analyses and the latter should not. Covariates influencing both population size and proportion counted introduce confounding (e.g., Bennetts and others, 1999).
Often, index surveys are used to estimate change over time in population size, rather than actual population size. Because it is acknowledged that sample units are
vaguely defined in index surveys, covariate adjustments that attempt to control for visibility differences over time within sites often have more credibility than adjustments that control for visibility differences among sites. This approach is used to estimate population change in the BBS, in which observer differences are controlled using covariates in a log-linear model (e.g., Link and Sauer, 1998). Model-based approaches to analysis of index surveys still have assumptions, and the validity of the overall results depends on how well the model accommodates differences in visibility. Of course, many factors that influence visibility are not observed and cannot be modeled (Lancia and others, 1994). Nevertheless, this model-based approach to survey analysis provides the only means to enhance the credibility of most bird surveys.
What Can Be Done to DevelopWhat Can Be Done to DevelopWhat Can Be Done to DevelopWhat Can Be Done to DevelopWhat Can Be Done to Develop Monitoring Programs for SpeciesMonitoring Programs for SpeciesMonitoring Programs for SpeciesMonitoring Programs for SpeciesMonitoring Programs for Species
ThatThatThatThatThat Are DifAre DifAre DifAre DifAre Difficult to Survey?ficult to Survey?ficult to Survey?ficult to Survey?ficult to Survey?
Because of widespread interest in monitoring, a variety of groups have been attempting to develop surveys for taxa that have never been effectively monitored. For example, regional surveys are under development for marsh-breeding birds, amphibians, and invertebrates. Unfortunately, many of these projects are at risk of duplicating the mistakes of earlier programs. In particular, the BBS is often presented as a model for these developing programs, and readily available results from the BBS (e.g., Sauer and others, 1997) tend to reinforce the notion that the large amounts of information available from the survey overwhelm potential deficiencies. In my view the BBS can provide reasonable results in many cases. However, the untestable assumptions implicit in analysis must always be considered when interpreting results from the survey (Link and Sauer, 1998) and corroborative evidence is often critical for confirmation of results when BBS data are used in management. Incorporating tests for visibility differences and correcting sampling frame deficiencies in the BBS would greatly enhance the credibility of the results.
Developing Reasonable Population EstimatesWithin Sample Units
Any experimental study involving inference about change in animal abundance over time and space requires a measure of abundance. For most taxa, indexes to abundances are routinely used in inference, but are often inappropriately treated as censuses. Although flawed, these indexes often have a basis in the biology of the
SAUER 123
species, and occasionally large historical databases of index information have been accumulated. Consequently, the indexes form a starting point in development of appropriate estimates of abundance.
Unfortunately, most indexes such as point counts and netting counts for birds and calling, pond, and cover-board counts for amphibians not only count an unknown proportion of the individuals present, but also do not provide a definable area of counting. To define appropriate abundance estimates in the context of such indexes requires:
1. Determining whether the population sampled by the index is the target population. For example, in bird point counts, the sampled population is often birds that are visible to the observer (such as singing males), while the implicit target population is all individuals.
2. Developing methods of estimation of detectability in the context of the index. Often, modification of survey methods allows estimation of detectability of individuals. For example, with bird point counts, distance methods (Buckland and others, 1993) or double-observer methods (Nichols and others, 2000) can be used to estimate detectability. For other situations such as mist netting of birds or cover board studies of salamanders, more intensive methods such as capture-recapture can be used to estimate population size (e.g., Otis and others, 1978). By introducing these methods, credibility of survey results are greatly enhanced because investigators can directly test for detectability differences over time and space.
3. Considering the area covered by the abundance index at a sample site. Often, the area covered by an index is only vaguely defined, and density of animals cannot be accurately estimated. Skalski (1994) emphasizes that understanding of the area associated with abundance estimates is required for estimation of population density. If areas cannot be specified, a different conceptual framework that explicitly defines the abundance estimate in the context of a model of spatial population change is needed for analysis (e.g., Link and Sauer, 1998).
Methods That Can Be Used to Estimate Detectability in the Context of Count Indexes
Distance methods. Distance methods include line and point transects and involve collection of counts of animals, but with a covariate (distance from observer to animal when first observed). The covariate information
124 INFORMATION AND TECHNOLOGY REPORT–2003-0003
allows modeling of detection rate as a function of distance from the observer. In line transect approaches, the observer walks along a transect and records individuals observed at varying distances from the transect line, whereas in point transects (also called variable circular plots) the observer stands at a point and records distances. From these data, decline in detection rate is modeled as a function of distance from the transect (or point), and by assuming the detection rate at the transect or point (distance 0) is 1, the density of animals can be estimated. Buckland and others (2001) provide a comprehensive review of these methods and describe the computer program DISTANCE that is used to fit models to the detection-rate distance relationship and estimate density.
Double-observer method. The double-observer method is also based on count data, but permits estimation of proportion of animals detected by statistical modeling of numbers of animals counted by dependent observers at multiple sites. In this design, two observers count at each sample site (or transect). One observer is designated a primary observer, the other a secondary observer. The primary observer notes all animals he or she sees at the site, and the secondary observer notes any animals missed by the primary observer. At the next sample site, they switch roles, and repeat the sampling procedure. These data provide sufficient information to allow estimation of detection rates for each observer (Nichols and others, 2000). Although density is not directly estimated using this method, restriction of counts to a fixed area or additional statistical modeling allows conversion of the abundance estimate to a density estimate (Nichols and others, 2000).
Capture-recapture methods. Although more effort-intensive, populations of many cryptic animals can only be estimated using capture-recapture methods, in which animals are captured, marked, and released at one time, then recaptured (or resighted) at a later time. Original uses of capture-recapture were to estimate population size during a short time period when the population was closed (not changing in size due to birth, death, or migration), or for estimation of population size and survival over longer periods during which the population could change in the between-trapping intervals (open population models, such as the Jolly-Seber model). In recent years, capture-recapture methods have been greatly extended through statistical developments that allow for better estimation of: detectability; movement among sites; influence of covariates on survival; and population change. Statistical software that allows users to implement these methods is now available (White, 1999; White and Burnham 1999). Capture-recapture estimates of population size generally only provide abundance estimates
for an unknown area, unless modeling is used to define effective areas (e.g., Otis and others, 1978) or captures are conducted in a restricted area (such as marsh habitat or a cave) that provides a natural unit for sampling.
Emerging methods. Recent research has provided a variety of new statistical methods for population estimation. Noteworthy new methods that refine existing methods or apply new approaches for estimation of detection rates from count data include: (1) a temporal removal method for analysis of point count data that provides an alternative to double-observer and distance approaches (Farnsworth and others, 2002); (2) a procedure for estimation of site occupancy rates from repeated visits to sites (MacKenzie and others, 2002); and (3) a method of estimating abundance from repeated counts at sites (Royle and Nichols, 2003).
Sampling Over Space
Unless sample units are selected at random from a sampling frame, standard statistical methods cannot be used to estimate population attributes. For example, a sampling frame for marsh birds would include a list of all marsh areas in a region, and sample units would be randomly selected from the list. When all sampling sites cannot be listed, area is often used as a sample frame, with the region of interest divided into area-based sample units that are then randomly selected and sampled. Unfortunately, logistical constraints often prevent biologists from selecting or accessing sample sites from the entire area of interest, leading to areas that are not covered. One important example of this is the roadside sampling frame of the BBS that prevents coverage of off-road sites. Frequently, biologists make these choices of areas to be sampled without consideration of the limitations that they will impose on the estimation. However, statisticians have considered a number of approaches that allow efficient sampling in the context of logistical and physical constraints. Some of these approaches, such as stratification to allow differing sample intensity over space, are well known to biologists. However, approaches such as dual-frame sampling (Haines and Pollock, 1998) and adaptive sampling (Thompson and Seber, 1996) also exist, and hold great potential for increasing efficiency of surveys.
Dual-frame sampling (Haines and Pollock, 1998) allows for efficient sampling in the case where traditional sites (such as colonies of birds, or nesting sites) are known to be used by animals. These traditional sites are known as the list frame, while all possible sites in the area of interest form an area frame. Random sampling is conducted in both frames, but generally the list frame is sampled at a relatively high intensity, while the area frame has a less
intensive sample. For analysis, the overlap among the samples is identified, and the overlapping samples are eliminated from the area sample. Frames are then treated as separate estimations and the population totals from the adjusted frames are summed to derive a total population estimate. See Haines and Pollock (1998) for an application of this method for estimation of active eagle nesting sites.
Adaptive sampling (Thompson and Seber, 1996) is a procedure for sampling rare attributes that tend to be clustered. In adaptive sampling, the sample selection procedure is modified as a consequence of information obtained during the survey. For example, one common application of adaptive cluster sampling is based on a simple random sample. For each sample unit in which an animal is found, adjacent units are sampled. The process is repeated with newly selected sample units until no new units with animals are found in the adjacent sample. Then, a variable-probability sampling procedure is used to estimate the total population. See Thompson and Seber (1996) for examples of adaptive sampling applications, and Smith and others (1995) for an example based on waterfowl surveying.
ConclusionsConclusionsConclusionsConclusionsConclusions
The Skalski (1994) formulation of biological sampling as a 2-stage process provides a reasonable and productive starting point for development (and improvement) of any monitoring program. All surveys must be judged in terms of their ability to adequately sample within sites and over space. For many taxa presently considered for survey development, indexes to abundance exist but little work has been conducted on development of efficient methods for estimation of visibility rates in the context of these indexes. Development of these methods, and incorporation of visibility rate estimation into routine sampling, are critical components of any monitoring program.
Fortunately, many tools now exist for survey development that can be very effectively applied in new programs. Recent years have seen an enormous amount of development of statistical theory and methods for visibility rate estimation, and Geographic Information Systems (GIS) provide a unique opportunity to develop and test alternative sampling frames. The challenge is for biologists to remain sensitive to the need for statistical rigor in survey design, and for statisticians to remain sensitive to biological concerns.
It is also important to recognize the implicit connection to management in all surveys, and to design surveys whenever possible to provide information that can explicitly be used in management. Monitoring provides
SAUER 125
the only means for managers to evaluate the population response to management, and if the survey is designed appropriately it can be a component of an adaptive management procedure (e.g., Conroy and Noon, 1996).
A Final CommentA Final CommentA Final CommentA Final CommentA Final Comment
One important limitation of operational survey programs is the inertia associated with historical data. Many managers are reluctant to modify surveys because of concerns of continuity of information and fears of undermining the credibility of the program. However, all surveys need to be amenable to constant revision as our understanding of populations and methods changes. In this context, it is productive to evaluate existing surveys, determine where model-based assumptions must be applied for analysis, and devote effort to development of modified sampling methods that will allow for direct estimation of population parameters.
References CitedReferences CitedReferences CitedReferences CitedReferences Cited
Bennetts, R.E., Link, W.A., Sauer, J.R., and Sikes, P.W., Jr., 1999, Factors influencing counts in an annual survey of snail kites in Florida:Auk, vol. 116, p. 316–323.
Buckland, S.T., Anderson, D.R., Burnham, K.P., Laake, J.L., Borchers, D.L., and Thomas, L., 2001, Introduction to distance sampling: New York, Oxford, 432 p.
Burnham, K.P., 1981, Summarizing remarks: Environmental influences, in Ralph, C.J. and Scott, J.M., eds., Estimating numbers of terrestrial birds: Studies in Avian Biology No. 6, Cooper Ornithological Society, Lawrence, Kansas, p. 324–325.
Butcher, G.S., 1990, Audubon Christmas bird counts, in Sauer, J.R. and Droege, S., eds., Survey designs and statistical methods for the estimation of avian population trends: U.S. Fish and Wildlife Service, Biological Report 90(1), 5–13.
Cochran, W.G., 1977, Sampling techniques (3rd ed), New York, Wiley, 428 p.
Conroy, M.J., and Noon, B.R., 1996, Mapping of species richness for conservation of biological diversity: Conceptual and methodological issues: Ecological Applications, vol. 6, p. 763–773.
DeSante, D.F., 1992, Monitoring avian productivity and survivorship (MAPS): A sharp, rather than blunt, tool for monitoring and assessing landbird populations, in McCullough, D.R. and Barrett, R.H., eds.,Wildlife 2001: Populations, New York, Elsevier, p. 511–521.
126 INFORMATION AND TECHNOLOGY REPORT–2003-0003
Farnsworth, G.L., Pollock, K.H., Nichols, J.D., Simons, T.R., Hines, J.E., and Sauer, J.R., 2002, A removal model for estimating detection probabilities from point count surveys: Auk, vol. 119, p. 414-425.
Haines, D.E., and Pollock, K.H., 1998, Estimating the number of active and successful bald eagle nests: An application of the dual frame method: Environmental and Ecological Statistics vol. 5, p. 245–256.
James, F.C., McCulloch, C.E., and Wolfe, L.E., 1990, Methodological issues in the estimation of trends in bird populations with an example: The pine warbler, in Sauer, J.R. and Droege, S., eds., Survey designs and statistical methods for the estimation of avian population trends: U.S. Fish and Wildlife Service, Biological Report 90(1), 84-97.
Lancia, R.A., Nichols, J.D., and Pollock, K.H., 1994, Estimating the number of animals in wildlife populations, in Bookhout, T.A., ed., Research and management techniques for wildlife and habitats: The Wildlife Society, Bethesda, Md, p. 215–253.
Link, W.A., and Sauer, J.R., 1998, Estimating population change from count data: Application to the North American Breeding Bird Survey: Ecological Applications, vol. 8, p. 258–268.
MacKenzie, D.I., Nichols, J.D., Lachman, G.B., Droege, S., Royle, J.A., and Langtimm, C.A., 2002, Estimating site occupancy rates when detection probablities are less than one: Ecology: vol. 83, p. 2248–2255.
Mossman, M.J., Hartman, L.M., Hay, R., Sauer, J.R., and Dhuey, B.J., 1998, Monitoring long-term trends in Wisconsin frog and toad populations, in Lannoo, M.J., ed., Status and conservation of midwestern amphibians: Bloomington, Ind, University of Indiana Press, p. 169–198.
Nichols, J.D., Hines, J.E., Sauer, J.R., Fallon, F., Fallon, J., and Heglund, P.J., 2000, A double-observer approach for estimating detection probability and abundance from avian point counts: Auk, vol. 117, p. 393–408.
Otis, D.L., Burnham, K.P., White, G.C., and Anderson, D.R., 1978, Statistical inference from capture data on closed animal populations: Wildlife Monographs, vol. 62, p. 1–135.
Ralph, C.J., Sauer, J.R., and Droege, S., eds., 1995, Monitoring bird populations by point counts: Forest Service, Pacific Southwest Research Station, General Technical Report PSW-GTR-149.
Robbins, C.S., Bystrak, D., and Geissler, P.H., 1986, The Breeding Bird Survey: Its first fifteen years, 1965–1979:
U.S. Fish and Wildlife Service, Research Publication 157.
Royle, J.A., and Nichols, J.D., 2003, Estimating abundance from repeated presence-absence data or point counts: Ecology, vol. 84, p. 777–790.
Sauer, J.R., and Droege, S., eds., 1990, Survey designs and statistical methods for the estimation of avian population trends: U.S. Fish and Wildlife Service, Biological Report 90(1).
Sauer, J.R., Barker, R.J., and Geissler, P.H., 1994, Statistical aspects of modeling population change from population size data, in Kendall, R.J. and Lacher, Jr., T.E., eds., Wildlife toxicology and population modeling: Integrated studies of agroecosystems: CRC Press, Boca Raton, Fl, p. 451–466.
Sauer, J.R., Hines, J.E., Gough, G., Thomas, I., and Peterjohn, B.G., 1997, The North American breeding bird survey results and analysis: Version 96.4: Patuxent Wildlife Research Center, Laurel, Md. http://www.mbr-pwrc.usgs.gov/bbs/bbs.html
Skalski, J.R., 1994, Estimating wildlife populations based on incomplete areas surveys: Wildlife Society Bulletin, vol. 22, p. 192–203.
Skalski, J.R., and Robson, D.S., 1992, Techniques for wildlife investigation: Design and analysis of capture data: New York, Academic Press, Inc., 237 p.
Smith, D.R., Conroy, M.J., and Brakhage, D.H., 1995, Efficiency of adaptive cluster sampling or estimating density of wintering waterfowl: Biometrics, vol. 51, p. 777–788.
Smith, G.W., 1995, A critical review of the aerial and ground surveys of breeding waterfowl in North America: U.S. Department of the Interior, National Biological Service, Biological Science Report, No. 5.
Thompson, S.K., and Seber, G.A., 1996, Adaptive sampling: New York, Wiley, 265 p.
Thompson, W.L., White, G.C., and Gowan, C., 1998, Monitoring vertebrate populations: New York, Academic Press.
White, G.C., 1999, Program MARK. Internet web site: http:/ /www.cnr.colostate.edu/~gwhite/mark/mark.htm
White, G.C., and Burnham, K.P., 1999, Program MARK: Survival estimation from populations of marked animals: Bird Study 46, Supplement, p. 120–138.
Williams, B.K., and Johnson, F.A., 1995, Adaptive management and the regulation of waterfowl harvests: Wildlife Society Bulletin, vol. 23, p. 430–436.
Existing Data on Colonies of Bats in theExisting Data on Colonies of Bats in theExisting Data on Colonies of Bats in theExisting Data on Colonies of Bats in theExisting Data on Colonies of Bats in the United SUnited SUnited SUnited SUnited States: Summary andtates: Summary andtates: Summary andtates: Summary andtates: Summary and Analysis of theAnalysis of theAnalysis of theAnalysis of theAnalysis of the
U.S. Geological Survey’U.S. Geological Survey’U.S. Geological Survey’U.S. Geological Survey’U.S. Geological Survey’s Bat Population Databases Bat Population Databases Bat Population Databases Bat Population Databases Bat Population Database
By
Laura E. Ellison Thomas J. O’Shea
U.S. Geological Survey Fort Collins Science Center
2150 Centre Avenue, Building C Fort Collins, CO 80526-8118
Michael A. Bogan
U.S. Geological Survey Fort Collins Science Center
Museum of Southwestern Biology University of New Mexico Albuquerque, NM 87131
and
A. Lance Everette Diane M. Schneider
U.S. Geological Survey Fort Collins Science Center
2150 Centre Avenue, Building C Fort Collins, CO 80526-8118
AbstractAbstractAbstractAbstractAbstract. There has been increasing concern about the status of bat populations in the United States (U.S.) and territories. However, there have been few efforts to compile and evaluate the fragmented information available on this topic. In this paper, we summarize and review existing information on the status of bat colonies in the U.S. and territories. We compiled a central database to store estimates of colony sizes made by others. We used these data to investigate colony trends and evaluate the potential of existing information to form the basis of monitoring programs. The U.S. Geological Survey Bat Population Database is available to the public on the Internet (http//www.fort.usgs.gov/products/data/bpd/bpd.asp). The database organizes estimates of colony size or counts of bats found in the scientific literature and in various recent efforts at inventorying and monitoring by others. Currently, the database includes more than 26,600 records for 43 species and three subspecies of bats in the U.S. and seven species in the territories. Although estimates date as early as 1855, two-thirds of the observations were made after 1980. We used nonparametric rank analysis to analyze counts in the database that were conducted in time series of >4 years at 179 summer and 294 winter roosts of 22 species of bats. Trends were not detectable at most of these roosts, and most time series had high coefficients of variation. In addition, we summarized reports by others pertinent to the status of populations, and provide comments on the sources of data, kinds of roosts occupied, and information on the trends for each species of bat. We discuss shortcomings of existing data that must be overcome in the design of future monitoring programs. These include the need to develop statistically valid sampling designs to meet monitoring objectives; to apply population estimation techniques such that both sampling and process-based variance can be determined; to develop and employ standards for surveys; to understand the basis for fluctuations in colony sizes at target roosts and to use this information to develop standards for timing of surveys; and to monitor greater numbers of species at more locations over longer spans of time.
ords: Bats, colonies, counts, emergence, hibernacula, maternity colonies, monitoring, roosts, territories, trends, United States.KeyKeyKeyKeyKey WWWWWordsordsordsords
127
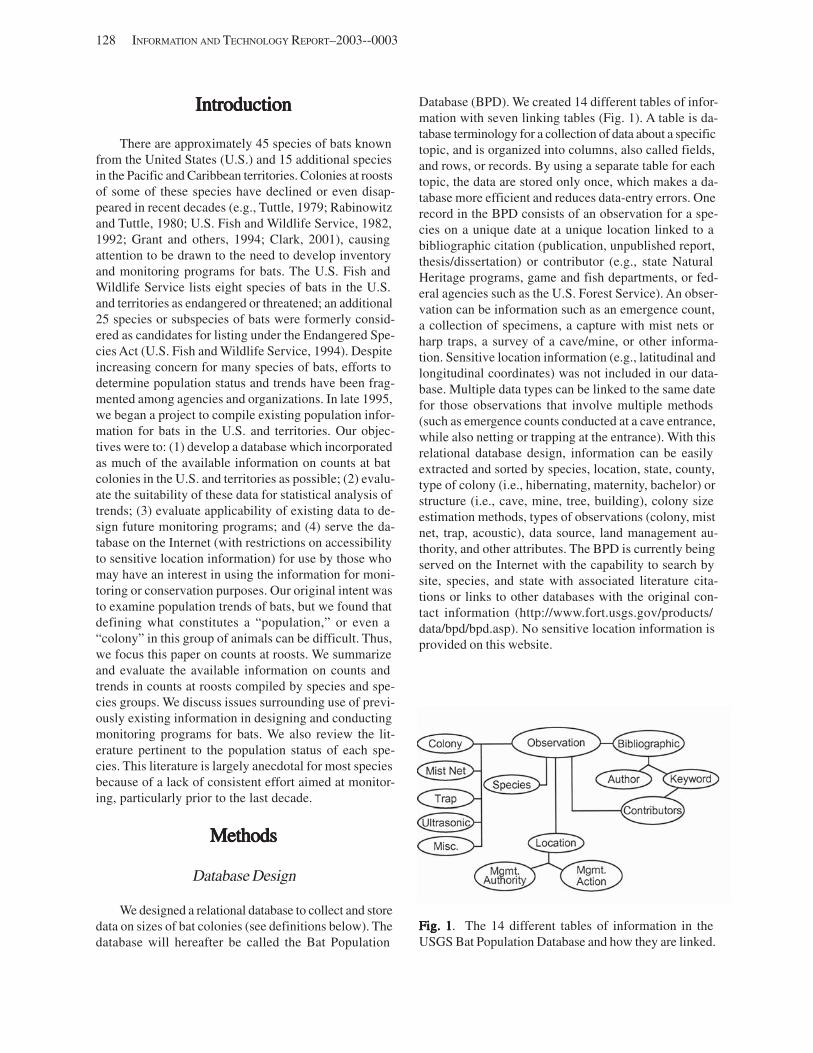
128 INFORMATION AND TECHNOLOGY REPORT–2003--0003
IntroductionIntroductionIntroductionIntroductionIntroduction
There are approximately 45 species of bats known from the United States (U.S.) and 15 additional species in the Pacific and Caribbean territories. Colonies at roosts of some of these species have declined or even disappeared in recent decades (e.g., Tuttle, 1979; Rabinowitz and Tuttle, 1980; U.S. Fish and Wildlife Service, 1982, 1992; Grant and others, 1994; Clark, 2001), causing attention to be drawn to the need to develop inventory and monitoring programs for bats. The U.S. Fish and Wildlife Service lists eight species of bats in the U.S. and territories as endangered or threatened; an additional 25 species or subspecies of bats were formerly considered as candidates for listing under the Endangered Species Act (U.S. Fish and Wildlife Service, 1994). Despite increasing concern for many species of bats, efforts to determine population status and trends have been fragmented among agencies and organizations. In late 1995, we began a project to compile existing population information for bats in the U.S. and territories. Our objectives were to: (1) develop a database which incorporated as much of the available information on counts at bat colonies in the U.S. and territories as possible; (2) evaluate the suitability of these data for statistical analysis of trends; (3) evaluate applicability of existing data to design future monitoring programs; and (4) serve the database on the Internet (with restrictions on accessibility to sensitive location information) for use by those who may have an interest in using the information for monitoring or conservation purposes. Our original intent was to examine population trends of bats, but we found that defining what constitutes a “population,” or even a “colony” in this group of animals can be difficult. Thus, we focus this paper on counts at roosts. We summarize and evaluate the available information on counts and trends in counts at roosts compiled by species and species groups. We discuss issues surrounding use of previously existing information in designing and conducting monitoring programs for bats. We also review the literature pertinent to the population status of each species. This literature is largely anecdotal for most species because of a lack of consistent effort aimed at monitoring, particularly prior to the last decade.
MethodsMethodsMethodsMethodsMethods
Database Design
We designed a relational database to collect and store data on sizes of bat colonies (see definitions below). The database will hereafter be called the Bat Population
Database (BPD). We created 14 different tables of information with seven linking tables (Fig. 1). A table is database terminology for a collection of data about a specific topic, and is organized into columns, also called fields, and rows, or records. By using a separate table for each topic, the data are stored only once, which makes a database more efficient and reduces data-entry errors. One record in the BPD consists of an observation for a species on a unique date at a unique location linked to a bibliographic citation (publication, unpublished report, thesis/dissertation) or contributor (e.g., state Natural Heritage programs, game and fish departments, or federal agencies such as the U.S. Forest Service). An observation can be information such as an emergence count, a collection of specimens, a capture with mist nets or harp traps, a survey of a cave/mine, or other information. Sensitive location information (e.g., latitudinal and longitudinal coordinates) was not included in our database. Multiple data types can be linked to the same date for those observations that involve multiple methods (such as emergence counts conducted at a cave entrance, while also netting or trapping at the entrance). With this relational database design, information can be easily extracted and sorted by species, location, state, county, type of colony (i.e., hibernating, maternity, bachelor) or structure (i.e., cave, mine, tree, building), colony size estimation methods, types of observations (colony, mist net, trap, acoustic), data source, land management authority, and other attributes. The BPD is currently being served on the Internet with the capability to search by site, species, and state with associated literature citations or links to other databases with the original contact information (http://www.fort.usgs.gov/products/ data/bpd/bpd.asp). No sensitive location information is provided on this website.
Fig. 1Fig. 1Fig. 1Fig. 1Fig. 1. The 14 different tables of information in the USGS Bat Population Database and how they are linked.
Data Acquisition
We began data acquisition by reviewing the scientific literature, starting with peer-reviewed journals (e.g., Journal of Mammalogy, Mammalian Species). We conducted literature searches in a number of databases, libraries, and the Internet. We also reviewed books specific to the mammal faunas of each state. Bibliographic citations were cross-examined for further references. We contacted 48 state Natural Heritage Programs for information in their databases. We also contacted researchers involved in ongoing bat surveys in several states (e.g., Colorado Division of Wildlife Bats and Mines project, New Hampshire Fish and Game Department, the New York Division of Wildlife Winter Bat Survey, the Pennsylvania Game Commission Winter Bat Hibernacula Survey, and the Wyoming Game and Fish Department). Other states and individual researchers conducting long-term monitoring programs for bats were also contacted.
We focused our data acquisition and entry on counts at roosts of colonial species. Geographic distribution records or lists of bat specimens in museum collections were not actively sought. Similarly, records of bats captured in mist-nets, traps or by other collection methods (such as acoustic surveys) at foraging locations or other sites away from roosts were not a focus of our search, except when those types of data were associated with a colony location and estimate of colony size. However, the BPD has the capacity to include such information in the future.
We reviewed data sources for mention of a roost location and colony size for each species of bat. Very few publications included monitoring of bat populations over time, and many were one-time observations. Location information (site name, county, state), date of the observation, and number of bats found at that location on that date were entered in the BPD. We also incorporated more detailed habitat descriptions, methods used to count individuals and other miscellaneous information when relevant. Each observation was linked to the literature citation or contributor and to individual species.
Each observation in the BPD was checked for accuracy and errors by at least one independent observer. The independent observer reviewed entered data for spelling errors, accuracy of counts, and any relevant information from articles that might have been missed in the review process.
Data Summaries
We used SAS software to summarize the records collected in the BPD (Version 8.02 of the SAS System
ELLISON AND OTHERS 129
for Windows, SAS Institute Inc., 2001). SAS procedures were used to compute frequency and summary statistics of observations by species, location, source of information, and types of data collection.
Trend Analyses
We summarized trends for those species with time series of four or more distinct annual surveys at a particular location, conducted in the same season of year, and using similar methods. A time series of counts did not necessarily consist of counts made in consecutive years, but could include surveys spanning several decades at irregular intervals greater than one year. If a range of counts was reported, we used the midpoint between the upper and lower bounds (i.e., if a survey reported 100–200 individuals, we used a value of 150 for the colony size estimate). Most counts were reported from different sources and almost none had sampling variances associated with them. Therefore, we used a Mann-Kendall nonparametric test for trend (Kendall and Gibbons, 1990) as recommended for analysis of count data with such attributes by Thompson and others (1998), who also noted that this technique has an advantage in that exact estimates of population size are not necessary. The Mann-Kendall nonparametric test is a rank correlation technique that takes the magnitudes of the counts and ranks their differences as pluses and minuses. We calculated an S-statistic to test for trend when time series were <10 distinct years. If the S-statistic was positive and large, counts taken later in time tended to be larger than those taken earlier and conversely, if the value for S was a large negative number, counts taken later in time tended to be smaller (Thompson and others, 1998). To test for an upward trend, we rejected the null hypothesis of no trend if S was positive and the probability value associated with the calculated S was less than the a priori level of 0.05. Similarly, to test for a downward trend in counts, we rejected the null hypothesis of no trend if S was negative and the probability value was less than 0.05. We calculated the Kendall tau coefficient, tau, for time series >10 (Kendall and Gibbons, 1990). The tau-statistic ranged from -1 to +1. We conducted one-tailed tests for downward or upward trends. If the null hypothesis was not rejected using either the Mann-Kendall S-statistic or Kendall’s tau-statistic, we concluded that no trend was detectable for the time series analyzed. Where counts at roosts through time had tied ranks, a modified tau was calculated per Kendall and Gibbons (1990). More rigorous regression techniques to analyze for trends were not considered valid because of the differing sources, methods, and quality of the data.
130 INFORMATION AND TECHNOLOGY REPORT–2003--0003
For each time series analyzed, we calculated a mean, standard deviation, and coefficient of variation (Zar, 1984). The coefficient of variation (CV), expressed as a percentage, is the ratio of a standard deviation of a parameter estimate to the parameter estimate, and is a measure of relative precision when comparing degree of variation between or among sets of data (Thompson and others, 1998). Large CVs indicated high variability in counts at roosts over time, and small CVs indicated low variability. We provide CVs to allow the reader to make a judgment regarding the basis for failure to reject a null hypothesis of no trend detectable. In cases where CVs are relatively high, failure to reject the null hypothesis may be due to high variability in counts. In cases where CVs are low, the trend may be stable.
Terminology and Definitions
Terms Used Throughout the Report
Census. A complete count of bats in a survey area, but usually made without estimating and correcting for sampling and observation probabilities.
Colony. A group of bats of a single species, which occupy a definable boundary at a particular time interval where population parameters can be defined (Working Group A Report, this volume). See also definition of colony size estimate below.
Colony size estimate. A count or estimate of the size of a group of individuals of the same species living in a particular area at a particular time. We make the assumption that most counts of bats at roosts are estimates of colony size. However, in many cases bats may exist in fusion-fission social groupings wherein fractions of such groups can be at different roosts at the same time. In such cases, counts at single roosts may not represent the entire social group. Because such situations are usually unknown at the time of counting, a more conservative definition of the data on counts of colony size can be reduced to simply “counts at a roost.”
Count. A generic term for how many bats were found in a particular location on a unique date. Methods used to obtain a “count” varied (e.g., counts of bats exiting at evening emergence, counts of bats in clusters within roosts, capturing bats at the entrance to roosts). Sometimes a count is a survey, or “best guess” of the original investigator and is not a census.
Day roost. Any place a bat settles down to rest during the daylight hours, but sources do not specify roost function (e.g., roost could be for a maternity, bachelor, or hibernating colony).
Hibernacula. Any site where bats roost for hibernation in winter.
Location. A unique site where bats were found. Maternity colony. A group of bats where most of the
individuals in the colony are pregnant females or lactating females with their young.
Night roost. Any site used by bats at night to rest and digest food, usually on a temporary basis between foraging bouts and usually at a different location than their day roosts.
Observation. A documented bat occurrence on a unique date at a unique location. An observation can be a count or any other method of estimating a colony size for a particular species of bat on a unique date at a unique location.
Population. A group of individuals of the same species living in a particular area (Working Group A Report, this volume). A population can consist of multiple colonies with spatial boundaries that vary within and among years.
Record. One row of information or data in a table in the BPD.
Roost. Any discrete location a bat settles down to rest. Summer colony. A colony of bats of unspecified func
tion found in the summer (could be a maternity, transient, or bachelor colony, but the function and composition were not documented in the original source).
Transient roost. Any roosting site used by bats on an irregular, short-term basis as defined by the original source (e.g., a roost used during migration).
Unspecified roost. Any site of unspecified function used by bats.
Results and DiscussionResults and DiscussionResults and DiscussionResults and DiscussionResults and Discussion
Data Summaries
The BPD contains 26,643 observations for 43 species and subspecies in the U.S., and seven species from the territories. Eighty-nine percent of these observations (23,716) consist of surveys, visits, or counts made at roosts. Fourteen percent of the observations (3,730) are from mist-netting records [8% (298) of these mist-netting records also included a count at a roost], and 3% (799) are from trapping, acoustic, and miscellaneous data types. The remainder of the summaries and analyses of this paper focuses on counts at roosts. Counts from mist netting, trapping and acoustic methods are biased due to different protocols and unknown factors, and were usually conducted where bats were dispersing and foraging, not concentrating at a roost.
There were seven different categories of data sources for observations of counts at roosts: Federal sources, unpublished or technical reports, individual researchers,
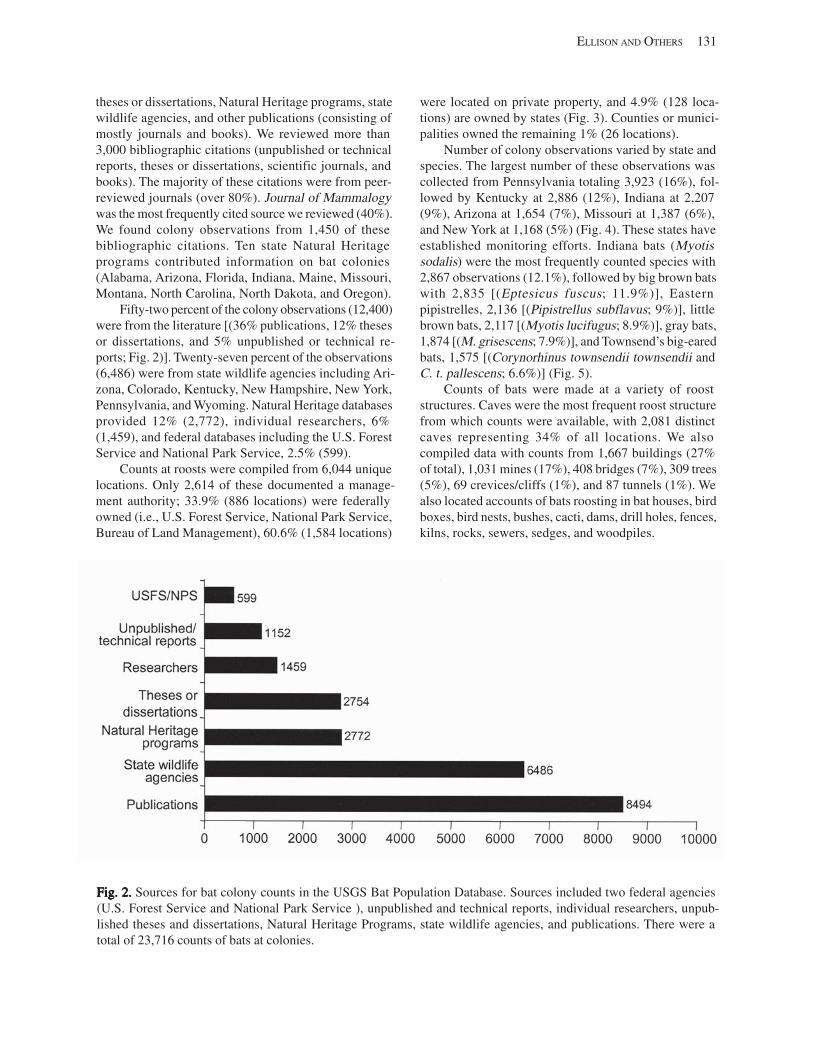
ELLISON AND OTHERS 131
theses or dissertations, Natural Heritage programs, state wildlife agencies, and other publications (consisting of mostly journals and books). We reviewed more than 3,000 bibliographic citations (unpublished or technical reports, theses or dissertations, scientific journals, and books). The majority of these citations were from peer-reviewed journals (over 80%). Journal of Mammalogy was the most frequently cited source we reviewed (40%). We found colony observations from 1,450 of these bibliographic citations. Ten state Natural Heritage programs contributed information on bat colonies (Alabama, Arizona, Florida, Indiana, Maine, Missouri, Montana, North Carolina, North Dakota, and Oregon).
Fifty-two percent of the colony observations (12,400) were from the literature [(36% publications, 12% theses or dissertations, and 5% unpublished or technical reports; Fig. 2)]. Twenty-seven percent of the observations (6,486) were from state wildlife agencies including Arizona, Colorado, Kentucky, New Hampshire, New York, Pennsylvania, and Wyoming. Natural Heritage databases provided 12% (2,772), individual researchers, 6% (1,459), and federal databases including the U.S. Forest Service and National Park Service, 2.5% (599).
Counts at roosts were compiled from 6,044 unique locations. Only 2,614 of these documented a management authority; 33.9% (886 locations) were federally owned (i.e., U.S. Forest Service, National Park Service, Bureau of Land Management), 60.6% (1,584 locations)
were located on private property, and 4.9% (128 locations) are owned by states (Fig. 3). Counties or municipalities owned the remaining 1% (26 locations).
Number of colony observations varied by state and species. The largest number of these observations was collected from Pennsylvania totaling 3,923 (16%), followed by Kentucky at 2,886 (12%), Indiana at 2,207 (9%), Arizona at 1,654 (7%), Missouri at 1,387 (6%), and New York at 1,168 (5%) (Fig. 4). These states have established monitoring efforts. Indiana bats (Myotis sodalis) were the most frequently counted species with 2,867 observations (12.1%), followed by big brown bats with 2,835 [(Eptesicus fuscus; 11.9%)], Eastern pipistrelles, 2,136 [(Pipistrellus subflavus; 9%)], little brown bats, 2,117 [(Myotis lucifugus; 8.9%)], gray bats, 1,874 [(M. grisescens; 7.9%)], and Townsend’s big-eared bats, 1,575 [(Corynorhinus townsendii townsendii and C. t. pallescens; 6.6%)] (Fig. 5).
Counts of bats were made at a variety of roost structures. Caves were the most frequent roost structure from which counts were available, with 2,081 distinct caves representing 34% of all locations. We also compiled data with counts from 1,667 buildings (27% of total), 1,031 mines (17%), 408 bridges (7%), 309 trees (5%), 69 crevices/cliffs (1%), and 87 tunnels (1%). We also located accounts of bats roosting in bat houses, bird boxes, bird nests, bushes, cacti, dams, drill holes, fences, kilns, rocks, sewers, sedges, and woodpiles.
Fig. 2.Fig. 2.Fig. 2.Fig. 2.Fig. 2. Sources for bat colony counts in the USGS Bat Population Database. Sources included two federal agencies (U.S. Forest Service and National Park Service ), unpublished and technical reports, individual researchers, unpublished theses and dissertations, Natural Heritage Programs, state wildlife agencies, and publications. There were a total of 23,716 counts of bats at colonies.
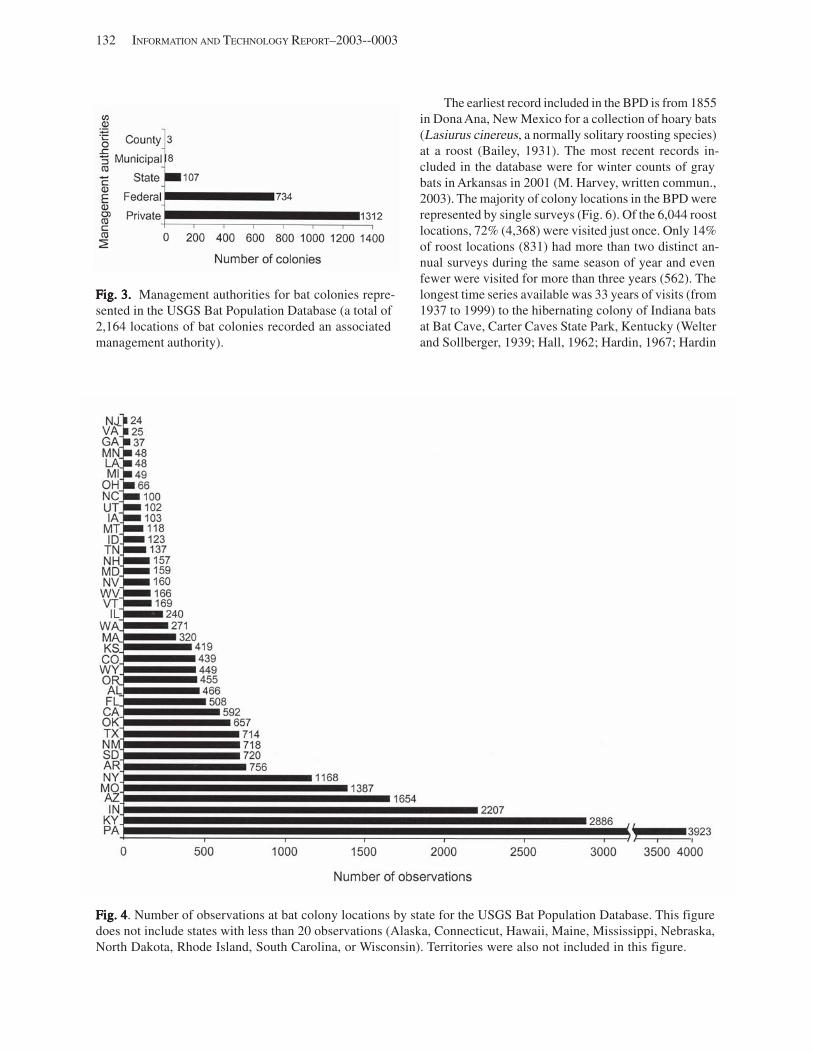
132 INFORMATION AND TECHNOLOGY REPORT–2003--0003
Fig. 3.Fig. 3.Fig. 3.Fig. 3.Fig. 3. Management authorities for bat colonies represented in the USGS Bat Population Database (a total of 2,164 locations of bat colonies recorded an associated management authority).
The earliest record included in the BPD is from 1855 in Dona Ana, New Mexico for a collection of hoary bats (Lasiurus cinereus, a normally solitary roosting species) at a roost (Bailey, 1931). The most recent records included in the database were for winter counts of gray bats in Arkansas in 2001 (M. Harvey, written commun., 2003). The majority of colony locations in the BPD were represented by single surveys (Fig. 6). Of the 6,044 roost locations, 72% (4,368) were visited just once. Only 14% of roost locations (831) had more than two distinct annual surveys during the same season of year and even fewer were visited for more than three years (562). The longest time series available was 33 years of visits (from 1937 to 1999) to the hibernating colony of Indiana bats at Bat Cave, Carter Caves State Park, Kentucky (Welter and Sollberger, 1939; Hall, 1962; Hardin, 1967; Hardin
Fig. 4Fig. 4Fig. 4Fig. 4Fig. 4. Number of observations at bat colony locations by state for the USGS Bat Population Database. This figure does not include states with less than 20 observations (Alaska, Connecticut, Hawaii, Maine, Mississippi, Nebraska, North Dakota, Rhode Island, South Carolina, or Wisconsin). Territories were also not included in this figure.
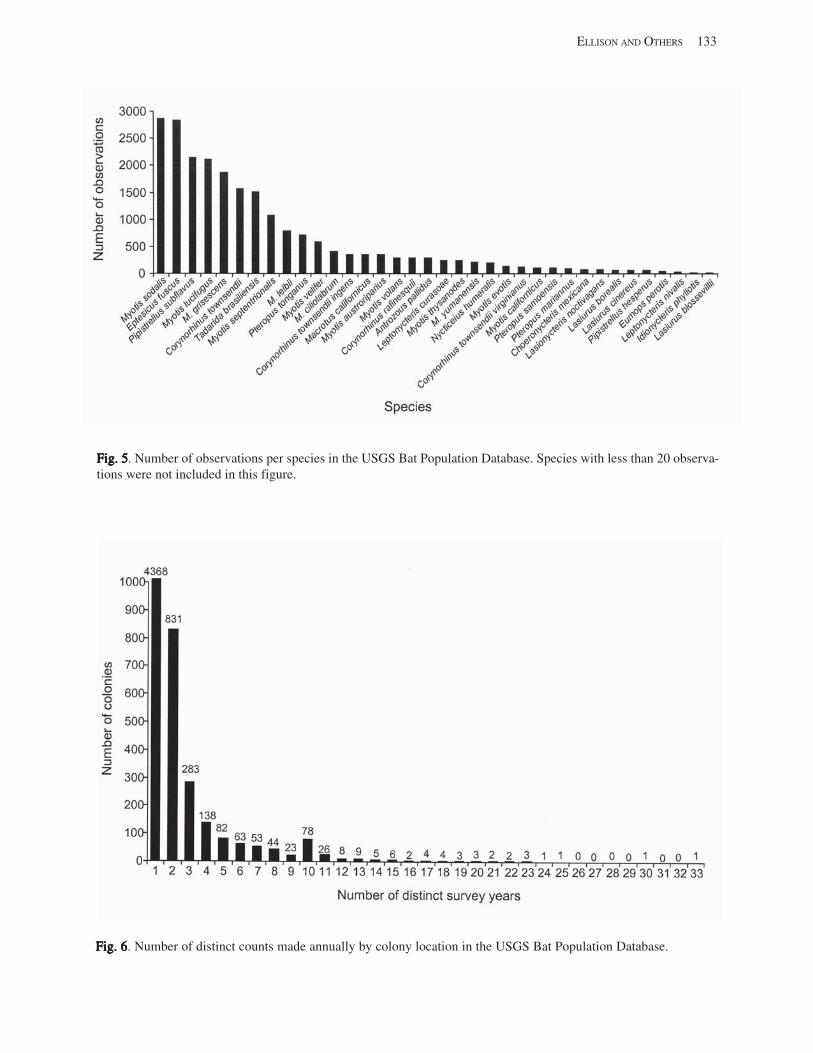
ELLISON AND OTHERS 133
Fig. 5Fig. 5Fig. 5Fig. 5Fig. 5. Number of observations per species in the USGS Bat Population Database. Species with less than 20 observations were not included in this figure.
Fig. 6Fig. 6Fig. 6Fig. 6Fig. 6. Number of distinct counts made annually by colony location in the USGS Bat Population Database.
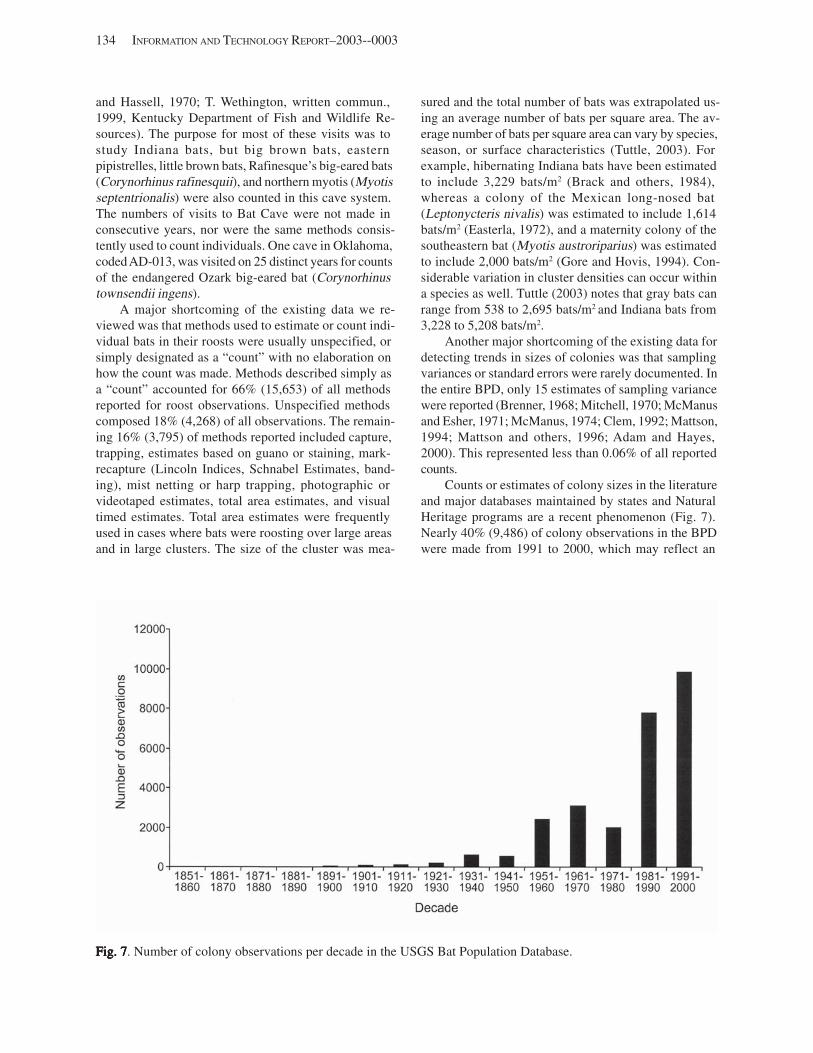
134 INFORMATION AND TECHNOLOGY REPORT–2003--0003
and Hassell, 1970; T. Wethington, written commun., 1999, Kentucky Department of Fish and Wildlife Resources). The purpose for most of these visits was to study Indiana bats, but big brown bats, eastern pipistrelles, little brown bats, Rafinesque’s big-eared bats (Corynorhinus rafinesquii), and northern myotis (Myotis septentrionalis) were also counted in this cave system. The numbers of visits to Bat Cave were not made in consecutive years, nor were the same methods consistently used to count individuals. One cave in Oklahoma, coded AD-013, was visited on 25 distinct years for counts of the endangered Ozark big-eared bat (Corynorhinus townsendii ingens).
A major shortcoming of the existing data we reviewed was that methods used to estimate or count individual bats in their roosts were usually unspecified, or simply designated as a “count” with no elaboration on how the count was made. Methods described simply as a “count” accounted for 66% (15,653) of all methods reported for roost observations. Unspecified methods composed 18% (4,268) of all observations. The remaining 16% (3,795) of methods reported included capture, trapping, estimates based on guano or staining, mark-recapture (Lincoln Indices, Schnabel Estimates, banding), mist netting or harp trapping, photographic or videotaped estimates, total area estimates, and visual timed estimates. Total area estimates were frequently used in cases where bats were roosting over large areas and in large clusters. The size of the cluster was mea
sured and the total number of bats was extrapolated using an average number of bats per square area. The average number of bats per square area can vary by species, season, or surface characteristics (Tuttle, 2003). For example, hibernating Indiana bats have been estimated to include 3,229 bats/m2 (Brack and others, 1984), whereas a colony of the Mexican long-nosed bat (Leptonycteris nivalis) was estimated to include 1,614 bats/m2 (Easterla, 1972), and a maternity colony of the southeastern bat (Myotis austroriparius) was estimated to include 2,000 bats/m2 (Gore and Hovis, 1994). Considerable variation in cluster densities can occur within a species as well. Tuttle (2003) notes that gray bats can range from 538 to 2,695 bats/m2 and Indiana bats from 3,228 to 5,208 bats/m2.
Another major shortcoming of the existing data for detecting trends in sizes of colonies was that sampling variances or standard errors were rarely documented. In the entire BPD, only 15 estimates of sampling variance were reported (Brenner, 1968; Mitchell, 1970; McManus and Esher, 1971; McManus, 1974; Clem, 1992; Mattson, 1994; Mattson and others, 1996; Adam and Hayes, 2000). This represented less than 0.06% of all reported counts.
Counts or estimates of colony sizes in the literature and major databases maintained by states and Natural Heritage programs are a recent phenomenon (Fig. 7). Nearly 40% (9,486) of colony observations in the BPD were made from 1991 to 2000, which may reflect an
Fig. 7Fig. 7Fig. 7Fig. 7Fig. 7. Number of colony observations per decade in the USGS Bat Population Database.
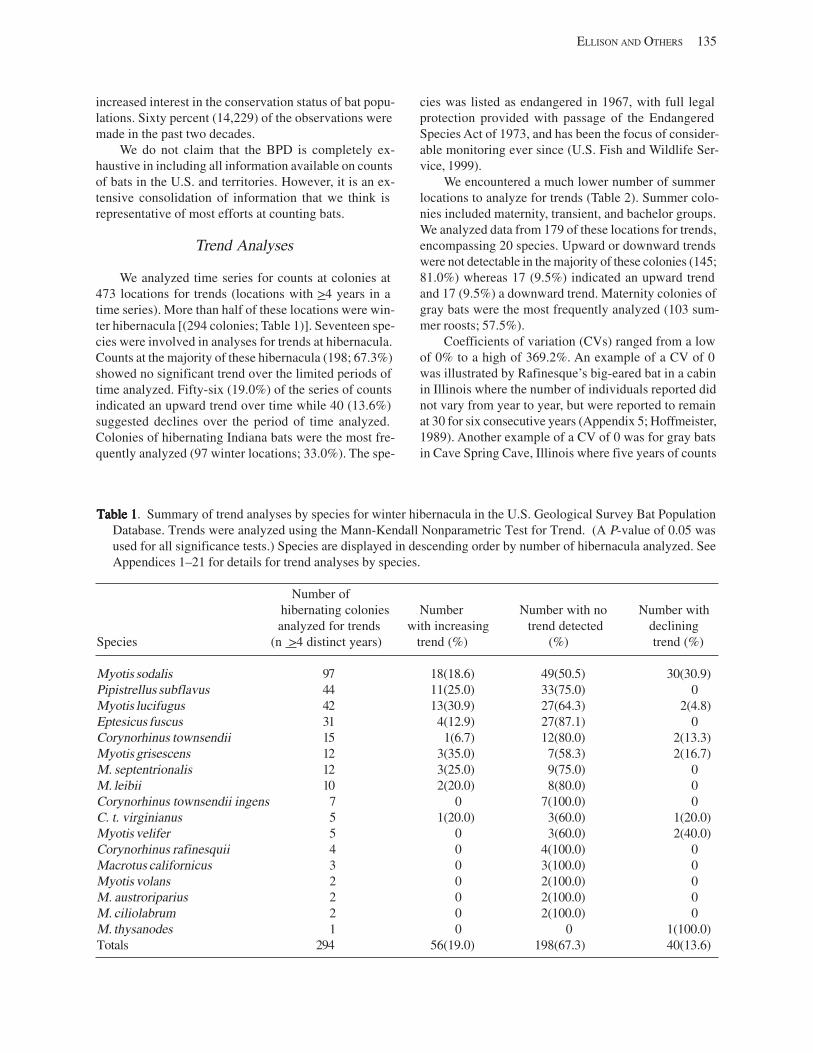
ELLISON AND OTHERS 135
increased interest in the conservation status of bat populations. Sixty percent (14,229) of the observations were made in the past two decades.
We do not claim that the BPD is completely exhaustive in including all information available on counts of bats in the U.S. and territories. However, it is an extensive consolidation of information that we think is representative of most efforts at counting bats.
Trend Analyses
We analyzed time series for counts at colonies at 473 locations for trends (locations with >4 years in a time series). More than half of these locations were winter hibernacula [(294 colonies; Table 1)]. Seventeen species were involved in analyses for trends at hibernacula. Counts at the majority of these hibernacula (198; 67.3%) showed no significant trend over the limited periods of time analyzed. Fifty-six (19.0%) of the series of counts indicated an upward trend over time while 40 (13.6%) suggested declines over the period of time analyzed. Colonies of hibernating Indiana bats were the most frequently analyzed (97 winter locations; 33.0%). The spe
cies was listed as endangered in 1967, with full legal protection provided with passage of the Endangered Species Act of 1973, and has been the focus of considerable monitoring ever since (U.S. Fish and Wildlife Service, 1999).
We encountered a much lower number of summer locations to analyze for trends (Table 2). Summer colonies included maternity, transient, and bachelor groups. We analyzed data from 179 of these locations for trends, encompassing 20 species. Upward or downward trends were not detectable in the majority of these colonies (145; 81.0%) whereas 17 (9.5%) indicated an upward trend and 17 (9.5%) a downward trend. Maternity colonies of gray bats were the most frequently analyzed (103 summer roosts; 57.5%).
Coefficients of variation (CVs) ranged from a low of 0% to a high of 369.2%. An example of a CV of 0 was illustrated by Rafinesque’s big-eared bat in a cabin in Illinois where the number of individuals reported did not vary from year to year, but were reported to remain at 30 for six consecutive years (Appendix 5; Hoffmeister, 1989). Another example of a CV of 0 was for gray bats in Cave Spring Cave, Illinois where five years of counts
Table 1Table 1Table 1Table 1Table 1. Summary of trend analyses by species for winter hibernacula in the U.S. Geological Survey Bat Population Database. Trends were analyzed using the Mann-Kendall Nonparametric Test for Trend. (A P-value of 0.05 was used for all significance tests.) Species are displayed in descending order by number of hibernacula analyzed. See Appendices 1–21 for details for trend analyses by species.
Number of hibernating colonies Number Number with no Number with analyzed for trends with increasing trend detected declining
Species (n >4 distinct years) trend (%) (%) trend (%)
Myotis sodalis 97 18(18.6) 49(50.5) 30(30.9) Pipistrellus subflavus 44 11(25.0) 33(75.0) 0 Myotis lucifugus 42 13(30.9) 27(64.3) 2(4.8) Eptesicus fuscus 31 4(12.9) 27(87.1) 0 Corynorhinus townsendii 15 1(6.7) 12(80.0) 2(13.3) Myotis grisescens 12 3(35.0) 7(58.3) 2(16.7) M. septentrionalis 12 3(25.0) 9(75.0) 0 M. leibii 10 2(20.0) 8(80.0) 0 Corynorhinus townsendii ingens 7 0 7(100.0) 0 C. t. virginianus 5 1(20.0) 3(60.0) 1(20.0) Myotis velifer 5 0 3(60.0) 2(40.0) Corynorhinus rafinesquii 4 0 4(100.0) 0 Macrotus californicus 3 0 3(100.0) 0 Myotis volans 2 0 2(100.0) 0 M. austroriparius 2 0 2(100.0) 0 M. ciliolabrum 2 0 2(100.0) 0 M. thysanodes 1 0 0 1(100.0) Totals 294 56(19.0) 198(67.3) 40(13.6)
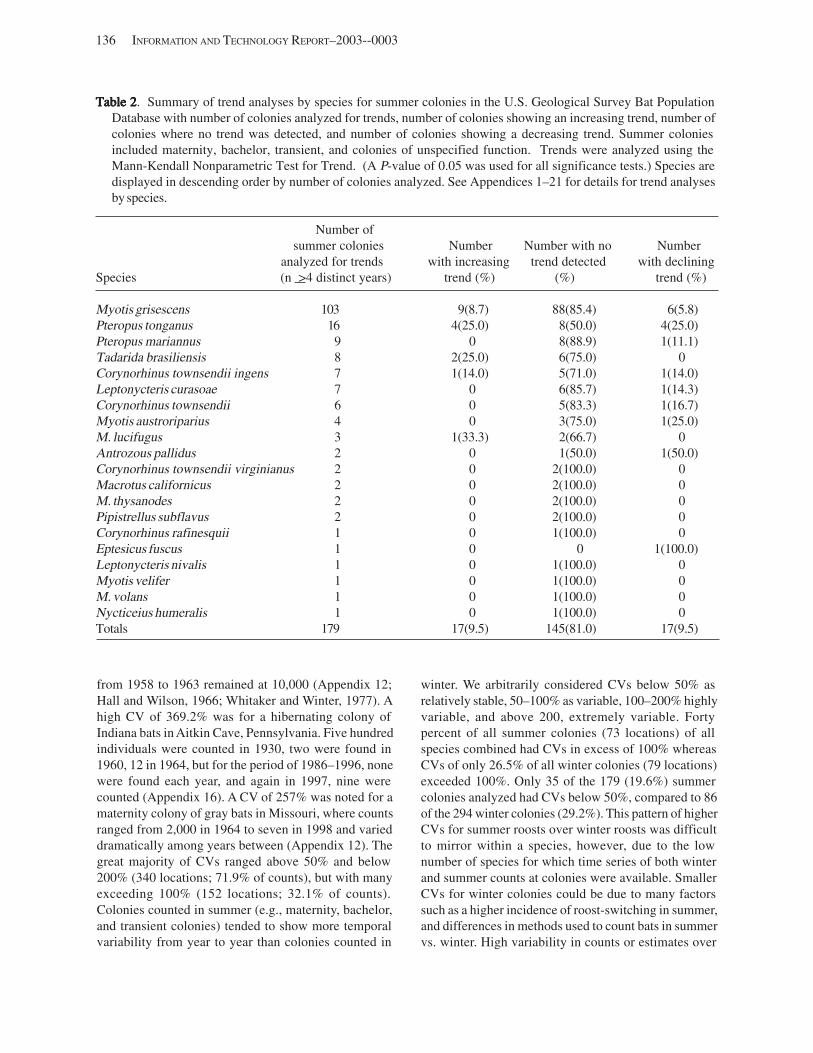
136 INFORMATION AND TECHNOLOGY REPORT–2003--0003
Table 2Table 2Table 2Table 2Table 2. Summary of trend analyses by species for summer colonies in the U.S. Geological Survey Bat Population Database with number of colonies analyzed for trends, number of colonies showing an increasing trend, number of colonies where no trend was detected, and number of colonies showing a decreasing trend. Summer colonies included maternity, bachelor, transient, and colonies of unspecified function. Trends were analyzed using the Mann-Kendall Nonparametric Test for Trend. (A P-value of 0.05 was used for all significance tests.) Species are displayed in descending order by number of colonies analyzed. See Appendices 1–21 for details for trend analyses by species.
Number of summer colonies Number Number with no Number
analyzed for trends with increasing trend detected with declining Species (n >4 distinct years) trend (%) (%) trend (%)
Myotis grisescens 103 9(8.7) 88(85.4) 6(5.8) Pteropus tonganus 16 4(25.0) 8(50.0) 4(25.0) Pteropus mariannus 9 0 8(88.9) 1(11.1) Tadarida brasiliensis 8 2(25.0) 6(75.0) 0 Corynorhinus townsendii ingens 7 1(14.0) 5(71.0) 1(14.0) Leptonycteris curasoae 7 0 6(85.7) 1(14.3) Corynorhinus townsendii 6 0 5(83.3) 1(16.7) Myotis austroriparius 4 0 3(75.0) 1(25.0) M. lucifugus 3 1(33.3) 2(66.7) 0 Antrozous pallidus 2 0 1(50.0) 1(50.0) Corynorhinus townsendii virginianus 2 0 2(100.0) 0 Macrotus californicus 2 0 2(100.0) 0 M. thysanodes 2 0 2(100.0) 0 Pipistrellus subflavus 2 0 2(100.0) 0 Corynorhinus rafinesquii 1 0 1(100.0) 0 Eptesicus fuscus 1 0 0 1(100.0) Leptonycteris nivalis 1 0 1(100.0) 0 Myotis velifer 1 0 1(100.0) 0 M. volans 1 0 1(100.0) 0 Nycticeius humeralis 1 0 1(100.0) 0 Totals 179 17(9.5) 145(81.0) 17(9.5)
from 1958 to 1963 remained at 10,000 (Appendix 12; Hall and Wilson, 1966; Whitaker and Winter, 1977). A high CV of 369.2% was for a hibernating colony of Indiana bats in Aitkin Cave, Pennsylvania. Five hundred individuals were counted in 1930, two were found in 1960, 12 in 1964, but for the period of 1986–1996, none were found each year, and again in 1997, nine were counted (Appendix 16). A CV of 257% was noted for a maternity colony of gray bats in Missouri, where counts ranged from 2,000 in 1964 to seven in 1998 and varied dramatically among years between (Appendix 12). The great majority of CVs ranged above 50% and below 200% (340 locations; 71.9% of counts), but with many exceeding 100% (152 locations; 32.1% of counts). Colonies counted in summer (e.g., maternity, bachelor, and transient colonies) tended to show more temporal variability from year to year than colonies counted in
winter. We arbitrarily considered CVs below 50% as relatively stable, 50–100% as variable, 100–200% highly variable, and above 200, extremely variable. Forty percent of all summer colonies (73 locations) of all species combined had CVs in excess of 100% whereas CVs of only 26.5% of all winter colonies (79 locations) exceeded 100%. Only 35 of the 179 (19.6%) summer colonies analyzed had CVs below 50%, compared to 86 of the 294 winter colonies (29.2%). This pattern of higher CVs for summer roosts over winter roosts was difficult to mirror within a species, however, due to the low number of species for which time series of both winter and summer counts at colonies were available. Smaller CVs for winter colonies could be due to many factors such as a higher incidence of roost-switching in summer, and differences in methods used to count bats in summer vs. winter. High variability in counts or estimates over
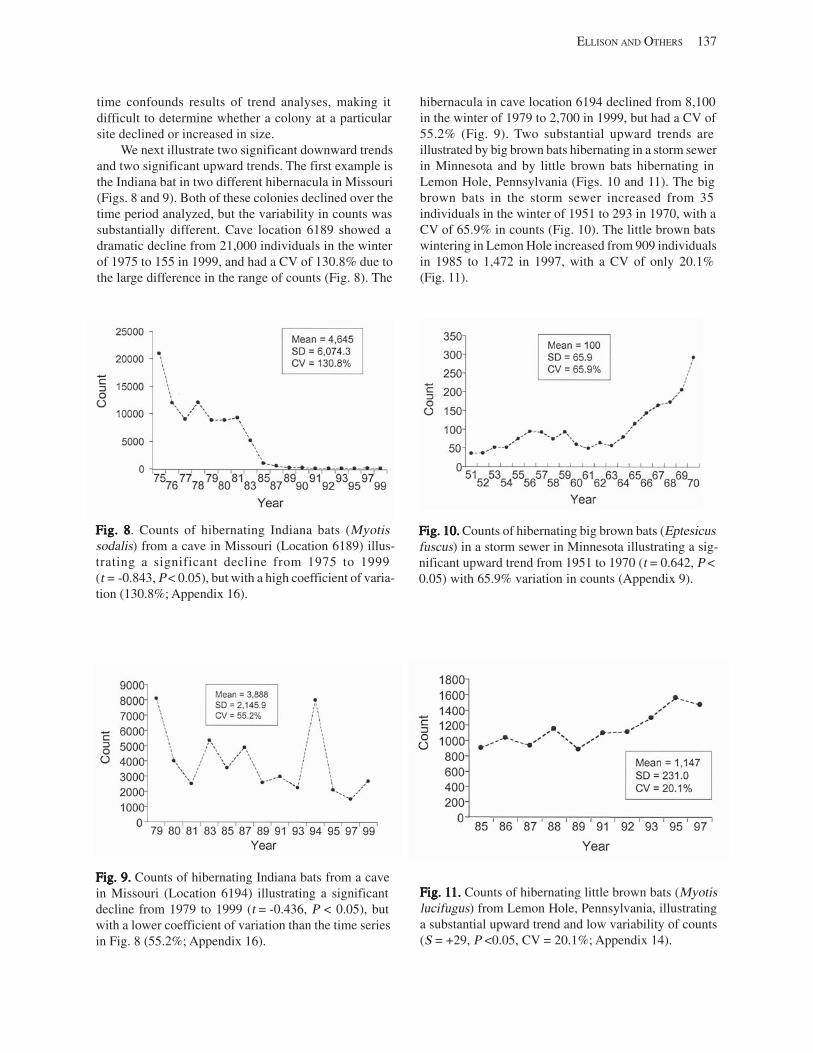
time confounds results of trend analyses, making it difficult to determine whether a colony at a particular site declined or increased in size.
We next illustrate two significant downward trends and two significant upward trends. The first example is the Indiana bat in two different hibernacula in Missouri (Figs. 8 and 9). Both of these colonies declined over the time period analyzed, but the variability in counts was substantially different. Cave location 6189 showed a dramatic decline from 21,000 individuals in the winter of 1975 to 155 in 1999, and had a CV of 130.8% due to the large difference in the range of counts (Fig. 8). The
Fig. 8Fig. 8Fig. 8Fig. 8Fig. 8. Counts of hibernating Indiana bats (Myotis sodalis) from a cave in Missouri (Location 6189) illustrating a significant decline from 1975 to 1999 (t = -0.843, P < 0.05), but with a high coefficient of variation (130.8%; Appendix 16).
Fig. 9.Fig. 9.Fig. 9.Fig. 9.Fig. 9. Counts of hibernating Indiana bats from a cave in Missouri (Location 6194) illustrating a significant decline from 1979 to 1999 (t = -0.436, P < 0.05), but with a lower coefficient of variation than the time series in Fig. 8 (55.2%; Appendix 16).
ELLISON AND OTHERS 137
hibernacula in cave location 6194 declined from 8,100 in the winter of 1979 to 2,700 in 1999, but had a CV of 55.2% (Fig. 9). Two substantial upward trends are illustrated by big brown bats hibernating in a storm sewer in Minnesota and by little brown bats hibernating in Lemon Hole, Pennsylvania (Figs. 10 and 11). The big brown bats in the storm sewer increased from 35 individuals in the winter of 1951 to 293 in 1970, with a CV of 65.9% in counts (Fig. 10). The little brown bats wintering in Lemon Hole increased from 909 individuals in 1985 to 1,472 in 1997, with a CV of only 20.1% (Fig. 11).
Fig. 10.Fig. 10.Fig. 10.Fig. 10.Fig. 10. Counts of hibernating big brown bats (Eptesicus fuscus) in a storm sewer in Minnesota illustrating a significant upward trend from 1951 to 1970 (t = 0.642, P < 0.05) with 65.9% variation in counts (Appendix 9).
Fig. 1Fig. 1Fig. 1Fig. 1Fig. 11.1.1.1.1. Counts of hibernating little brown bats (Myotis lucifugus) from Lemon Hole, Pennsylvania, illustrating a substantial upward trend and low variability of counts (S = +29, P <0.05, CV = 20.1%; Appendix 14).
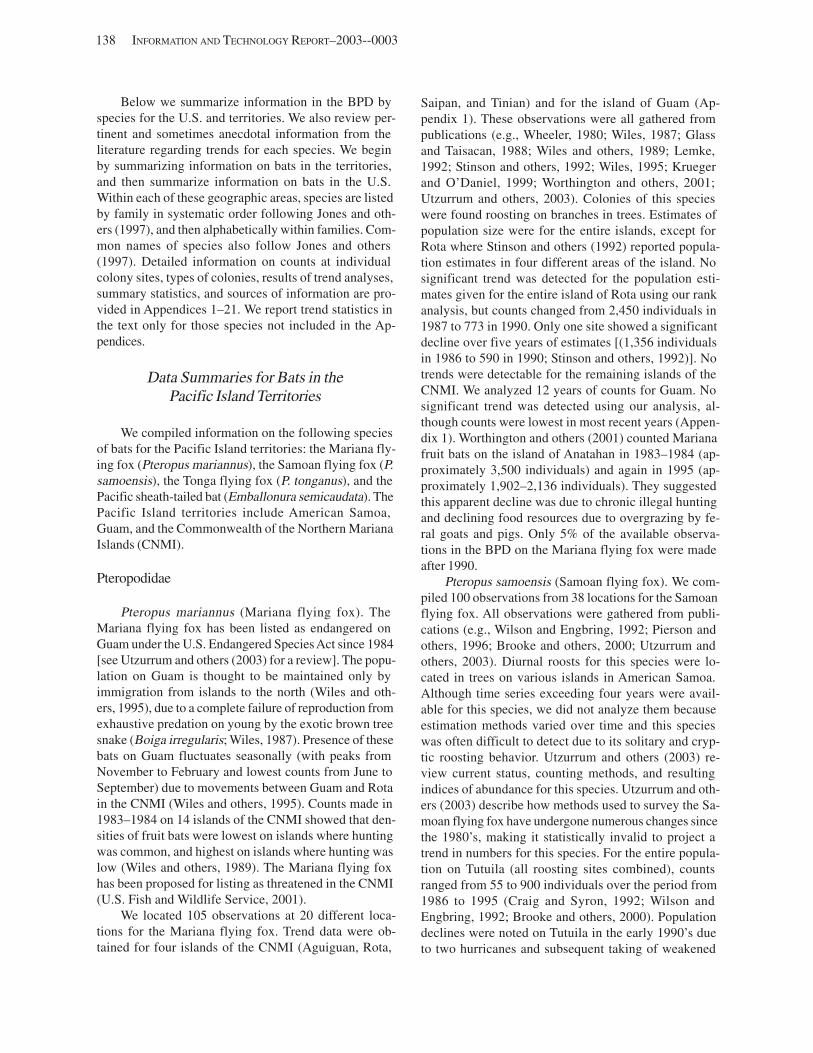
138 INFORMATION AND TECHNOLOGY REPORT–2003--0003
Below we summarize information in the BPD by species for the U.S. and territories. We also review pertinent and sometimes anecdotal information from the literature regarding trends for each species. We begin by summarizing information on bats in the territories, and then summarize information on bats in the U.S. Within each of these geographic areas, species are listed by family in systematic order following Jones and others (1997), and then alphabetically within families. Common names of species also follow Jones and others (1997). Detailed information on counts at individual colony sites, types of colonies, results of trend analyses, summary statistics, and sources of information are provided in Appendices 1–21. We report trend statistics in the text only for those species not included in the Appendices.
Data Summaries for Bats in the Pacific Island Territories
We compiled information on the following species of bats for the Pacific Island territories: the Mariana flying fox (Pteropus mariannus), the Samoan flying fox (P. samoensis), the Tonga flying fox (P. tonganus), and the Pacific sheath-tailed bat (Emballonura semicaudata). The Pacific Island territories include American Samoa, Guam, and the Commonwealth of the Northern Mariana Islands (CNMI).
Pteropodidae
Pteropus mariannus (Mariana flying fox). The Mariana flying fox has been listed as endangered on Guam under the U.S. Endangered Species Act since 1984 [see Utzurrum and others (2003) for a review]. The population on Guam is thought to be maintained only by immigration from islands to the north (Wiles and others, 1995), due to a complete failure of reproduction from exhaustive predation on young by the exotic brown tree snake (Boiga irregularis; Wiles, 1987). Presence of these bats on Guam fluctuates seasonally (with peaks from November to February and lowest counts from June to September) due to movements between Guam and Rota in the CNMI (Wiles and others, 1995). Counts made in 1983–1984 on 14 islands of the CNMI showed that densities of fruit bats were lowest on islands where hunting was common, and highest on islands where hunting was low (Wiles and others, 1989). The Mariana flying fox has been proposed for listing as threatened in the CNMI (U.S. Fish and Wildlife Service, 2001).
We located 105 observations at 20 different locations for the Mariana flying fox. Trend data were obtained for four islands of the CNMI (Aguiguan, Rota,
Saipan, and Tinian) and for the island of Guam (Appendix 1). These observations were all gathered from publications (e.g., Wheeler, 1980; Wiles, 1987; Glass and Taisacan, 1988; Wiles and others, 1989; Lemke, 1992; Stinson and others, 1992; Wiles, 1995; Krueger and O’Daniel, 1999; Worthington and others, 2001; Utzurrum and others, 2003). Colonies of this species were found roosting on branches in trees. Estimates of population size were for the entire islands, except for Rota where Stinson and others (1992) reported population estimates in four different areas of the island. No significant trend was detected for the population estimates given for the entire island of Rota using our rank analysis, but counts changed from 2,450 individuals in 1987 to 773 in 1990. Only one site showed a significant decline over five years of estimates [(1,356 individuals in 1986 to 590 in 1990; Stinson and others, 1992)]. No trends were detectable for the remaining islands of the CNMI. We analyzed 12 years of counts for Guam. No significant trend was detected using our analysis, although counts were lowest in most recent years (Appendix 1). Worthington and others (2001) counted Mariana fruit bats on the island of Anatahan in 1983–1984 (approximately 3,500 individuals) and again in 1995 (approximately 1,902–2,136 individuals). They suggested this apparent decline was due to chronic illegal hunting and declining food resources due to overgrazing by feral goats and pigs. Only 5% of the available observations in the BPD on the Mariana flying fox were made after 1990.
Pteropus samoensis (Samoan flying fox). We compiled 100 observations from 38 locations for the Samoan flying fox. All observations were gathered from publications (e.g., Wilson and Engbring, 1992; Pierson and others, 1996; Brooke and others, 2000; Utzurrum and others, 2003). Diurnal roosts for this species were located in trees on various islands in American Samoa. Although time series exceeding four years were available for this species, we did not analyze them because estimation methods varied over time and this species was often difficult to detect due to its solitary and cryptic roosting behavior. Utzurrum and others (2003) review current status, counting methods, and resulting indices of abundance for this species. Utzurrum and others (2003) describe how methods used to survey the Samoan flying fox have undergone numerous changes since the 1980’s, making it statistically invalid to project a trend in numbers for this species. For the entire population on Tutuila (all roosting sites combined), counts ranged from 55 to 900 individuals over the period from 1986 to 1995 (Craig and Syron, 1992; Wilson and Engbring, 1992; Brooke and others, 2000). Population declines were noted on Tutuila in the early 1990’s due to two hurricanes and subsequent taking of weakened
and exposed bats by hunters (Craig and others, 1994; Pierson and others, 1996). The population size for Tutuila since 1995 has been thought to remain at about 900 (Brooke and others, 2000). Counts on other islands in American Samoa were considerably smaller, ranging from one to eight individuals. Data for the Samoan flying fox compiled in the BPD were mostly before 1990 (85% of the observations).
Pteropus tonganus (Tonga flying fox). Data available about the Tonga flying fox were more comprehensive than those for other Pacific Island species of bats. We compiled 716 observations from 90 locations. We were able to analyze more trends at colonies of this species than any other species in the Pacific Islands. Most of the observations we obtained for the Tonga flying fox were collected after 1990 (459; 64.1%), possibly reflecting the increased conservation interest in this species within the last decade. All observations were obtained from publications (e.g., Wilson and Engbring, 1992; Pierson and others, 1996; Brooke and others, 2000; Utzurrum and others, 2003). The data were from colonies roosting in branches and foliage of trees located on Tutuila Island, American Samoa. Tutuila is the largest of the four islands of American Samoa with resident flying foxes. We analyzed 16 time series for this species: one for the entire island from 1987 to 2000, and 15 from different roosting locations around the island (Appendix 2). There were no significant trends for these bats on the entire island from 1987 to 2000, although a high of 12,750 was counted in 1987, a minimum of 1,700 in 1992, and 6,366 in 2000 (Utzurrum and others, 2003). The minimum in 1992 was attributed to mortality from two hurricanes, Cyclones Ofa in 1990 and Val in 1991, and overhunting (Craig and others, 1994; Pierson and others, 1996; Grant and others, 1997). Trend analyses for the separate locations around the island support the findings of the island-wide analysis: no trend was found in six, four showed an upward trend, and five exhibited a downward trend over the time periods reported (Appendix 2). These isolated locations around the island of Tutuila showed more instability in population estimates (CVs exceeded 100% for all sites except at Puaneva Point). This large variation reflects both the difficulty in counting this species and frequent movements of bats among sites.
Emballonuridae
Emballonura semicaudata (Pacific or Polynesian sheath-tailed bat). Insufficient count data were available from colonies of the Pacific sheath-tailed bat to conduct trend analyses. This is the only insectivorous bat known from Guam, the CNMI, and American Samoa. Colonies are typically found in caves. There were no time series
ELLISON AND OTHERS 139
of counts available for analysis, but extensive searches have suggested that it has been extinct on Guam since 1972 (Lemke, 1986; Wiles and others, 1995). It is also extinct on Rota in the CNMI (U.S. Fish and Wildlife Service, 2001). Roosting bats were detected at six of 78 caves on Aguiguan in 1995 and colonies ranged in size from 2–64 individuals, but at that time these bats were considered extinct elsewhere in the CNMI (Worthington and Taisacan, 1996; Wiles and Worthington, 2002). The number on Aguiguan may have been reduced to about only 10 bats by 2001 (U.S. Fish and Wildlife Service, 2001). Amerson and others (1982) estimated that some 11,000 sheath-tailed bats were in American Samoa in 1975–1976, but the methods used to obtain this estimate are unknown (Grant and others, 1994). Knowles (1988) documented seeing 100 bats in 1988 and hearing another 100. By 1993, populations on American Samoa may have been reduced to as few as four individuals due to habitat damage from three cyclones (Grant and others, 1994; U.S. Fish and Wildlife Service, 2001).
Data Summaries for Bats in the Caribbean Territories
The U.S. territories in the Caribbean Islands include Puerto Rico and the U.S. Virgin Islands. There are 13 species of bats from these islands: the Jamaican fruit-eating bat (Artibeus jamaicensis), the Antillean fruit-eating bat (Brachyphylla cavernarum), big brown bat, the buffy flower bat (Erophylla sezekorni = bombifrons), red bat (Lasiurus borealis), Pallas’ free-tailed bat (Molossus molossus), Puerto Rican long-tongued bat (Monophyllus redmani), Blainville’s ghost-faced bat (Mormoops blainvillii), greater bulldog bat (Noctilio leporinus), Parnell’s moustached bat (Pteronotus parnellii), sooty moustached bat (P. quadridens), red fig-eating bat (Stenoderma rufum), and Brazilian free-tailed bat (Tadarida brasiliensis) (Koopman, 1989). We summarize information gathered for the following nine species: the Jamaican fruit-eating bat, the Antillean fruit-eating bat, the buffy flower bat, the Puerto Rican long-tongued bat, Blainville’s ghost-faced bat, Parnell’s moustached bat, the sooty moustached bat, the red fig-eating bat, and the Brazilian free-tailed bat. We were unable to obtain adequate data on the remaining four species found in the U.S. Caribbean Islands.
Mormoophidae
Mormoops blainvillii (Blainville’s ghost-faced bat). Insufficient data were available to conduct trend analyses for Blainville’s ghost-faced bat. Information was available for this species from only two caves in Puerto
140 INFORMATION AND TECHNOLOGY REPORT–2003--0003
Rico. Jones and others (2001) captured 60 individuals at Culebrones Cave before Hurricane Georges in September of 1998 and 182 individuals after the disturbance. Rodriguez-Duran and Lewis (1987) used photographic techniques to estimate 43,400 Blainville’s ghost-faced bats roosting in Cucaracha Cave. This species was also found roosting in seven other caves in Puerto Rico by Rodriguez-Duran (1998).
Pteronotus parnellii (Parnell’s moustached bat). Insufficient data were available to investigate trends of Parnell’s moustached bat, but some information exists from a few caves in Puerto Rico. Jones and others (2001) found no bats of this species using Culebrones Cave before Hurricane Georges, but found one individual after the disturbance. Rodriguez-Duran (1998) found this species roosting in five other caves in Puerto Rico, but no estimates of population size were available.
Pteronotus quadridens (sooty moustached bat). Insufficient data were available to investigate trends for the sooty moustached bat. Jones and others (2001) captured 31 individuals at Culebrones Cave in Puerto Rico before Hurricane Georges in September 1998, and 109 individuals after the hurricane. Rodriguez-Duran and Lewis (1985) used photographic techniques to estimate 123,900 + 21,800 individuals roosting in Cucaracha Cave on Puerto Rico in October 1981. In 1987, these same authors reported 141,000 bats at this cave (Rodriguez-Duran and Lewis, 1987). Rodriguez-Duran (1998) also found this species roosting in four other caves in Puerto Rico, but no estimates of population size were available.
Phyllostomidae
Artibeus jamaicensis (Jamaican fruit-eating bat). The Jamaican fruit-eating bat has a wide geographic distribution in tropical and subtropical America and comprises at least 60% of the total bat fauna of Puerto Rico (Willig and Bauman, 1984). Rodriguez-Duran (1998) found Jamaican fruit-eating bats roosting in 18 of the 27 caves he surveyed in Puerto Rico, but no estimation of colony sizes were available to analyze for trends. Information was collected using mist net captures per net-hour for Jamaican fruit-eating bats on Puerto Rico for three years prior to Hurricane Hugo, September 1989, and three years after (Gannon and Willig, 1994). Although no colony size estimates were available, captures using mist nets, which may or may not reflect population changes, declined to near zero immediately following the hurricane, remained low for almost two years, and recovered to the pre-hurricane levels in the third year. Rodriguez-Duran and Vazquez (2001) studied a colony of the Jamaican fruit-eating bat roosting in Convento Cave on Puerto Rico before and after Hurricane
Georges, which occurred in September 1998. There was a reduction in the relative number of bats netted after the hurricane, although no population estimates were made.
Brachyphylla cavernarum (Antillean fruit-eating bat). There were no time series of counts available to analyze for the Antillean fruit-eating bat in either Puerto Rico or the Virgin Islands. This species was found roosting in seven caves in Puerto Rico by Rodriguez-Duran (1998), but no estimates of colony sizes were made. Nellis and Ehle (1977) mentioned the existence of several roosts of this species on the island of St. Croix, Virgin Islands. A colony of about 5,000 was found roosting in a well; a colony of about 50–100 individuals was found roosting in a sea cliff; and another small colony was found in a warehouse. No dates were associated with these colony size estimates. Although no trend data were available for this species, past information suggests that excessive mortality due to intentional gassing occurred at some locations (Bond and Seaman, 1958).
Erophylla sezekorni (buffy flower bat). We compiled colony size information on the buffy flower bat gathered by others from several caves in Puerto Rico. There were not enough data to conduct trend analyses for this species. There is little other information available from the literature that relates to trends in populations of this species in the Caribbean territories. Jones and others (2001) compared the number of bats captured in mist nets at Culebrones Cave on Puerto Rico 10 months after Hurricane Georges in September 1998 to numbers captured 35 months prior to the disturbance. Before the hurricane, 3,643 buffy flower bats were captured, representing 94.6% of the captures of all species roosting in the cave. After the hurricane, there was only one individual present (Jones and others, 2001). Rodriguez-Duran (1998) found the buffy flower bat roosting in four other caves in Puerto Rico, but these caves were visited only to determine presence of species, not to estimate colony sizes.
Monophyllus redmani (Puerto Rican long-tongued bat). We have only three records in the BPD for the Puerto Rican long-tongued bat. This is insufficient for analysis of trends. In related studies, Rodriguez-Duran and Lewis (1987) visited a colony in Cucaracha Cave in Puerto Rico in April 1983. They estimated 544,000 individuals roosting in this cave using photographic techniques. Jones and others (2001) captured 114 individuals at Culebrones Cave before Hurricane Georges in 1998, but captured only seven after the hurricane. This species was also found roosting in 12 other caves in Puerto Rico by Rodriguez-Duran (1998), but no estimates of colony sizes were made. Information was collected using mist net captures per net-hour for the Puerto Rican long-tongued bat for three years prior to Hurricane Hugo, September
1989, and three years after (Gannon and Willig, 1994). Capture rates for this species remained relatively stable before and after Hurricane Hugo, with a slight increase soon after the hurricane.
Stenoderma rufum (red fig-eating bat). The red fig-eating bat roosts in foliage in the forest canopy and does not form social groups or show fidelity to roost locations (M.R. Gannon, 1991; Gannon and Willig, 1994). Thus, there were no time series or counts available to analyze for this species. Information was collected using mist net captures per net-hour for red fig-eating bats on Puerto Rico for three years prior to and after Hurricane Hugo in September 1989 (Gannon and Willig, 1994). Capture rates of this species declined gradually after the impact of the hurricane, reaching the lowest level in 1991, and have remained at levels far below those prior to the disturbance from the hurricane.
Molossidae
Tadarida brasiliensis (Brazilian free-tailed bat). No trend data were available to analyze for the Brazilian free-tailed bat in the Caribbean Islands. Whitaker and Rodriguez-Duran (1999) reported a colony of from 200– 300 Brazilian free-tailed bats roosting in an abandoned train tunnel in northwestern Puerto Rico. They report that this colony has been roosting in this tunnel since its abandonment by the railroad some 40 years ago.
Data Summaries for Bats in the United States
Mormoopidae
The ghost-faced bat (Mormoops megalophylla) is the only species of the family Mormoopidae found in the continental U.S. We compiled a total of 18 observations from nine distinct locations for the ghost-faced bat, all from Texas prior to 1990. The majority of observations (16; 89%) were from cave roosts (Constantine, 1958b; Raun and Baker, 1958; Reddell, 1967), one from a house (Mearns, 1900), and one from a railroad tunnel (Davis, 1960). These low numbers of available observations may reflect the marginal range of this species in the U.S. and the infrequency of encountering this species. There were no trend data available for this species.
Phyllostomidae
The BPD includes counts for the following members of the family Phyllostomidae, or leaf-nosed bats, from the U.S.: Mexican long-tongued bat (Choeronycteris mexicana); hairy-legged vampire (Diphylla ecaudata);
ELLISON AND OTHERS 141
southern long-nosed bat (Leptonycteris curasoae); Mexican long-nosed bat (L. nivalis); and California leaf-nosed bat (Macrotus californicus).
Choeronycteris mexicana (Mexican long-tongued bat). We compiled 82 observations at 42 locations for the Mexican long-tongued bat. Twenty-nine percent of these observations (24) were made after 1990. Observations were collected from Arizona and New Mexico, with the majority (61; 74%) from Arizona. One specimen was collected from a garage in Texas in 1970 (Chapman and Chapman, 1990), and roosts of this species were reported from San Diego, California, but these represent marginal occurrences (Olson, 1947; Huey, 1954). This species’ northern range is southernmost Arizona and New Mexico, where it is only a summer resident (Arroyo-Cabrales and others, 1987). Mexican long-tongued bats were reported to roost in a number of structures including bridges, buildings, caves, crevices, mines, rock shelters, and tunnels. Almost 37% of the records (30) are from small colonies in caves or rock shelters and 25% (20) from colonies in mines. Counts ranged from a minimum of one to a maximum of 176. Many roosts were described as “day roosts” (20; 25%), or as unspecified (52; 63%). Arizona Game and Fish Department’s Heritage Database provided 57% of all observations (47) in the BPD for this species (S. Schwartz, written commun., 2000); the remaining 43% (35) were obtained from publications. More than 70% of the observations (58) were made before 1990.
There were no data available for colonies of Mexican long-tongued bats with sufficient time series to analyze for trends. Cryan and Bogan (2003) visited 23 of the 48 localities from which this species had been reported in the past in Arizona and New Mexico. They found this species present at 17 of these historically known sites.
Diphylla ecaudata (hairy-legged vampire). No colony size data were available for the hairy-legged vampire bat. This species is not thought to be resident in the U.S., as it is known only by a single female specimen collected in 1967 in an abandoned railroad tunnel in southern Texas (Reddell, 1968). The hairy-legged vampire is solitary and does not aggregate in large groups.
Leptonycteris curasoae (southern long-nosed bat). We compiled records of 237 observations at 44 locations for the southern long-nosed bat. These observations were from Arizona and New Mexico, with more than 98% (232) of the counts from colonies in Arizona. The northern range of this species is southernmost Arizona and New Mexico (Fleming and others, 2003). This species was reported roosting in a variety of structures including bridges, buildings, caves, crevices, and mines. More than 40% (103) of all counts were from cave roosts and approximately 48% (114) were from mines. Counts
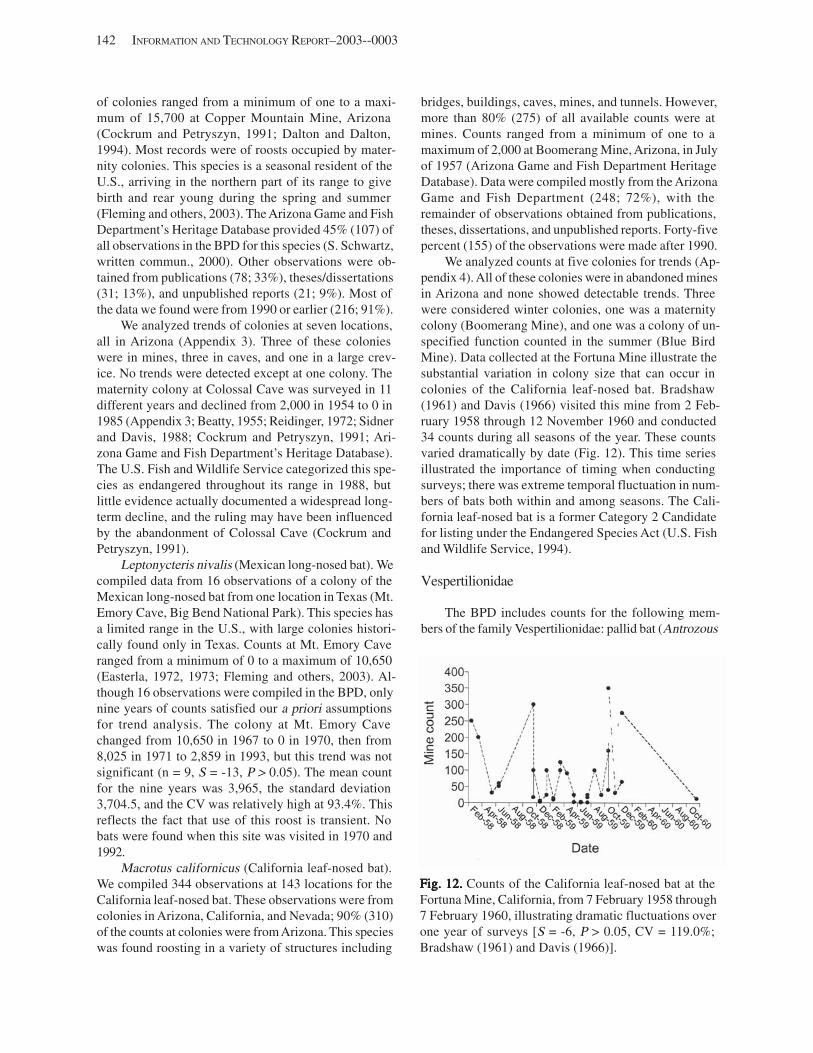
142 INFORMATION AND TECHNOLOGY REPORT–2003--0003
of colonies ranged from a minimum of one to a maximum of 15,700 at Copper Mountain Mine, Arizona (Cockrum and Petryszyn, 1991; Dalton and Dalton, 1994). Most records were of roosts occupied by maternity colonies. This species is a seasonal resident of the U.S., arriving in the northern part of its range to give birth and rear young during the spring and summer (Fleming and others, 2003). The Arizona Game and Fish Department’s Heritage Database provided 45% (107) of all observations in the BPD for this species (S. Schwartz, written commun., 2000). Other observations were obtained from publications (78; 33%), theses/dissertations (31; 13%), and unpublished reports (21; 9%). Most of the data we found were from 1990 or earlier (216; 91%).
We analyzed trends of colonies at seven locations, all in Arizona (Appendix 3). Three of these colonies were in mines, three in caves, and one in a large crevice. No trends were detected except at one colony. The maternity colony at Colossal Cave was surveyed in 11 different years and declined from 2,000 in 1954 to 0 in 1985 (Appendix 3; Beatty, 1955; Reidinger, 1972; Sidner and Davis, 1988; Cockrum and Petryszyn, 1991; Arizona Game and Fish Department’s Heritage Database). The U.S. Fish and Wildlife Service categorized this species as endangered throughout its range in 1988, but little evidence actually documented a widespread long-term decline, and the ruling may have been influenced by the abandonment of Colossal Cave (Cockrum and Petryszyn, 1991).
Leptonycteris nivalis (Mexican long-nosed bat). We compiled data from 16 observations of a colony of the Mexican long-nosed bat from one location in Texas (Mt. Emory Cave, Big Bend National Park). This species has a limited range in the U.S., with large colonies historically found only in Texas. Counts at Mt. Emory Cave ranged from a minimum of 0 to a maximum of 10,650 (Easterla, 1972, 1973; Fleming and others, 2003). Although 16 observations were compiled in the BPD, only nine years of counts satisfied our a priori assumptions for trend analysis. The colony at Mt. Emory Cave changed from 10,650 in 1967 to 0 in 1970, then from 8,025 in 1971 to 2,859 in 1993, but this trend was not significant (n = 9, S = -13, P > 0.05). The mean count for the nine years was 3,965, the standard deviation 3,704.5, and the CV was relatively high at 93.4%. This reflects the fact that use of this roost is transient. No bats were found when this site was visited in 1970 and 1992.
Macrotus californicus (California leaf-nosed bat). We compiled 344 observations at 143 locations for the California leaf-nosed bat. These observations were from colonies in Arizona, California, and Nevada; 90% (310) of the counts at colonies were from Arizona. This species was found roosting in a variety of structures including
bridges, buildings, caves, mines, and tunnels. However, more than 80% (275) of all available counts were at mines. Counts ranged from a minimum of one to a maximum of 2,000 at Boomerang Mine, Arizona, in July of 1957 (Arizona Game and Fish Department Heritage Database). Data were compiled mostly from the Arizona Game and Fish Department (248; 72%), with the remainder of observations obtained from publications, theses, dissertations, and unpublished reports. Forty-five percent (155) of the observations were made after 1990.
We analyzed counts at five colonies for trends (Appendix 4). All of these colonies were in abandoned mines in Arizona and none showed detectable trends. Three were considered winter colonies, one was a maternity colony (Boomerang Mine), and one was a colony of unspecified function counted in the summer (Blue Bird Mine). Data collected at the Fortuna Mine illustrate the substantial variation in colony size that can occur in colonies of the California leaf-nosed bat. Bradshaw (1961) and Davis (1966) visited this mine from 2 February 1958 through 12 November 1960 and conducted 34 counts during all seasons of the year. These counts varied dramatically by date (Fig. 12). This time series illustrated the importance of timing when conducting surveys; there was extreme temporal fluctuation in numbers of bats both within and among seasons. The California leaf-nosed bat is a former Category 2 Candidate for listing under the Endangered Species Act (U.S. Fish and Wildlife Service, 1994).
Vespertilionidae
The BPD includes counts for the following members of the family Vespertilionidae: pallid bat (Antrozous
Fig. 12.Fig. 12.Fig. 12.Fig. 12.Fig. 12. Counts of the California leaf-nosed bat at the Fortuna Mine, California, from 7 February 1958 through 7 February 1960, illustrating dramatic fluctuations over one year of surveys [S = -6, P > 0.05, CV = 119.0%; Bradshaw (1961) and Davis (1966)].
pallidus); Rafinesque’s big-eared bat; Townsend’s big-eared bat; Ozark big-eared bat; Virginia big-eared bat (Corynorhinus townsendii virginianus); big brown bat; spotted bat (Euderma maculatum); Allen’s big-eared bat (Idionycteris phyllotis); silver-haired bat (Lasionycteris noctivagans); Lasiurus spp.; southwestern myotis (Myotis auriculus); southeastern myotis; California myotis (M. californicus); western small-footed myotis (M. ciliolabrum); long-eared myotis (M. evotis); gray bat; Keen’s myotis (M. keenii); eastern small-footed bat; little brown bat; northern myotis; Indiana bat; fringed myotis (M. thysanodes); cave myotis (M. velifer); long-legged myotis (M. volans); Yuma myotis (M. yumanensis); evening bat (Nycticeius humeralis); western pipistrelle (Pipistrellus hesperus); and eastern pipistrelle.
Antrozous pallidus (pallid bat). We compiled 292 observations from 133 pallid bat roosts. These observations were collected from 11 western states: 34% (99) from Arizona, 18% (52) from Oregon, 12% (35) from California, and 10% (29) from New Mexico. The remaining data were from colonies in Colorado, Kansas, Nevada, Oklahoma, Texas, Utah, and Wyoming. This species roosted in a variety of structures including bridges (99; 34%), buildings (73; 25%), caves (38; 13%), crevices (20; 7%), mines (23; 8%), cliffs (18; 6%), and trees (9; 3%). Most colonies reported were of an unspecified type (175; 60%), but maternity colonies were defined in 26% (76) of the cases and night roosts in 14% (41). Data were compiled mostly from publications, theses or dissertations, and unpublished reports [(245; 84%; e.g., Beck and Rudd, 1960; Herreid, 1961; Davis, 1966; Reidinger, 1972; Vaughan and O’Shea, 1976; Ellinwood, 1978)]. Additional data were provided by the Arizona Game and Fish Department (S. Schwartz, written commun., 2000), Bats in American Bridges Program (B. Keeley, written commun., 1999, Bat Conservation International), Colorado Division of Wildlife (K. Navo, written commun., 2000), National Park Service (C. Baldino, written commun., 1999), Oregon Natural Heritage Program (T. Campos, written commun., 1999), and Wyoming Game and Fish Department (B. Luce, written commun., 1999). Most of these data (228; 78%) were collected before 1990.
Only two summer colonies provided time series of sufficient length to analyze for trends. A bridge roost in Arizona declined significantly from 80 individuals in 1957 to 0 in 1970 [(n = 5, S = -9, P < 0.05, CV = 176.5%; Reidinger, 1972)]. O’Shea and Vaughan (1999) reported an apparent decline in a colony of pallid bats using crevices in cliffs in the Verde Valley of Arizona concurrent with an increase in human activity at the site. They reported 63 on 29 June 1972, 64 on 24 May 1976, 40 on 3 June 1977, and 0 on 1 July 1997, but this change was
ELLISON AND OTHERS 143
not statistically significant using the nonparametric trend analysis (n = 4, S = -4, P > 0.05, CV = 71.8%).
Corynorhinus rafinesquii (Rafinesque’s big-eared bat). We compiled 290 observations from 148 locations for Rafinesque’s big-eared bat. These observations were from 14 southeastern states. The majority of records were from Kentucky (159; 55%), North Carolina (20; 7%), Florida (14; 5%), and Arkansas (12; 4%). Most counts were made at caves (165; 57%), but this species was also found roosting in mines (35; 12%), buildings (46; 16%), bridges (12; 4%), cisterns (6; 2%), tunnels (6; 2%), and trees (2; <1%). More than half of all counts for this species were from colonies in hibernacula (150; 52%). Maternity colonies constituted 12% (35) of the observations. Data in publications accounted for 54% (157) of the count information (e.g., Hoffmeister, 1989; Meade, 1992; Hurst, 1997; Hurst and Lacki, 1999), and the Kentucky Department of Fish and Wildlife Resources provided 31% (90 observations; T. Wethington, written commun., 1999). Nearly half of the observations we compiled were made after 1990 (140; 48%).
We analyzed counts from four hibernacula in Kentucky and one summer colony of unspecified function in Illinois (Appendix 5). None of these colonies showed statistically significant increases or decreases. Counts at a cabin in Illinois remained at 30 individuals from 1977 to 1982 (Hoffmeister, 1989). The largest hibernating colony analyzed for trends was the Donahue Rockshelter in Kentucky. There were 11 years of counts available and the colony ranged in size from 34 individuals in 1987 to a high of 134 in 1984, with a CV of 38.1%. Rafinesque’s big-eared bat is a former Category 2 Candidate for listing under the Endangered Species Act (U.S. Fish and Wildlife Service, 1994). The largest colony of this species is in a hibernaculum in North Carolina (R. Currie, written commun., 2003). Up to 1,700 individuals roost at this site and it is monitored every 2–3 years, but counts through time were not available for our analysis. Recent research suggests that this species roosts in hollow trees in bottomland hardwood forests more frequently than previously realized (Clark, 2003).
Corynorhinus townsendii (Townsend’s big-eared bat). There are four subspecies of Townsend’s big-eared bat in the U.S.: C. t. townsendii and C. t. pallescens in the western U.S., and the Ozark big-eared bat and the Virginia big-eared bat in the central and eastern U.S. (Handley, 1959). Information on the latter two subspecies is provided separately. The two western subspecies are usually not distinguished during field observations and we refer to them in this summary analysis simply as Townsend’s big-eared bat. We compiled 1,575 counts of colonies at 615 unique locations, 21 of which had time series >4 years. Three locations had time series exceeding
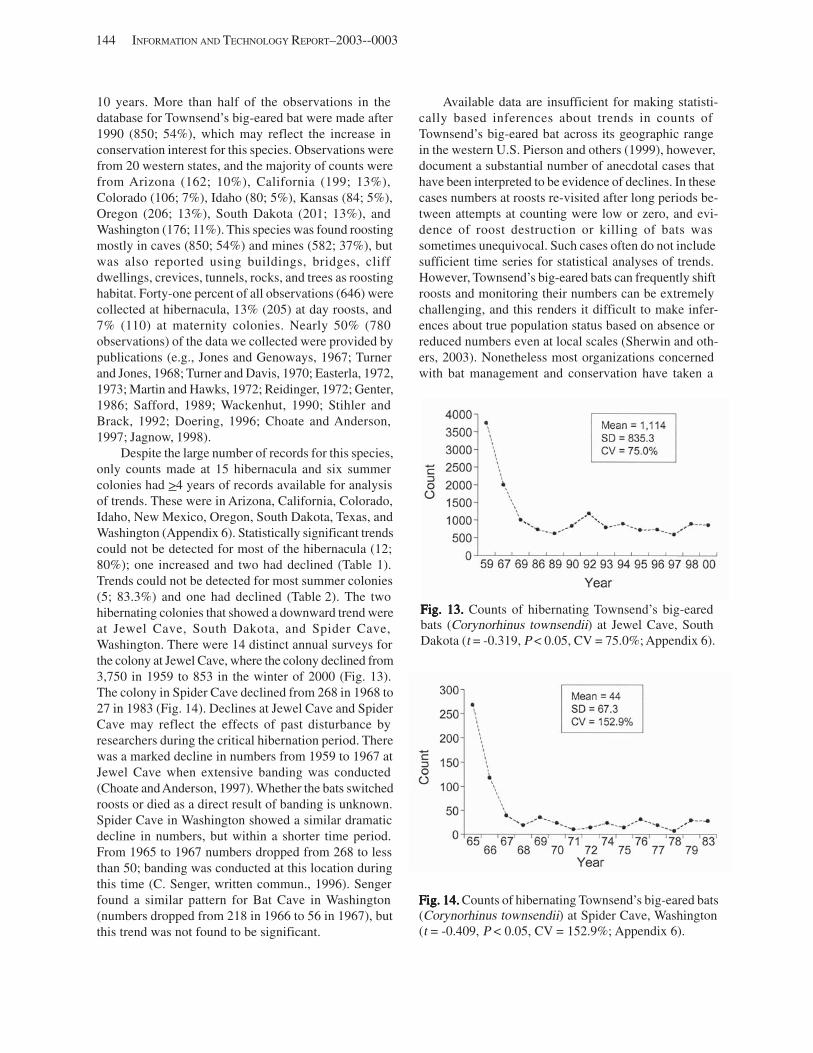
144 INFORMATION AND TECHNOLOGY REPORT–2003--0003
10 years. More than half of the observations in the database for Townsend’s big-eared bat were made after 1990 (850; 54%), which may reflect the increase in conservation interest for this species. Observations were from 20 western states, and the majority of counts were from Arizona (162; 10%), California (199; 13%), Colorado (106; 7%), Idaho (80; 5%), Kansas (84; 5%), Oregon (206; 13%), South Dakota (201; 13%), and Washington (176; 11%). This species was found roosting mostly in caves (850; 54%) and mines (582; 37%), but was also reported using buildings, bridges, cliff dwellings, crevices, tunnels, rocks, and trees as roosting habitat. Forty-one percent of all observations (646) were collected at hibernacula, 13% (205) at day roosts, and 7% (110) at maternity colonies. Nearly 50% (780 observations) of the data we collected were provided by publications (e.g., Jones and Genoways, 1967; Turner and Jones, 1968; Turner and Davis, 1970; Easterla, 1972, 1973; Martin and Hawks, 1972; Reidinger, 1972; Genter, 1986; Safford, 1989; Wackenhut, 1990; Stihler and Brack, 1992; Doering, 1996; Choate and Anderson, 1997; Jagnow, 1998).
Despite the large number of records for this species, only counts made at 15 hibernacula and six summer colonies had >4 years of records available for analysis of trends. These were in Arizona, California, Colorado, Idaho, New Mexico, Oregon, South Dakota, Texas, and Washington (Appendix 6). Statistically significant trends could not be detected for most of the hibernacula (12; 80%); one increased and two had declined (Table 1). Trends could not be detected for most summer colonies (5; 83.3%) and one had declined (Table 2). The two hibernating colonies that showed a downward trend were at Jewel Cave, South Dakota, and Spider Cave, Washington. There were 14 distinct annual surveys for the colony at Jewel Cave, where the colony declined from 3,750 in 1959 to 853 in the winter of 2000 (Fig. 13). The colony in Spider Cave declined from 268 in 1968 to 27 in 1983 (Fig. 14). Declines at Jewel Cave and Spider Cave may reflect the effects of past disturbance by researchers during the critical hibernation period. There was a marked decline in numbers from 1959 to 1967 at Jewel Cave when extensive banding was conducted (Choate and Anderson, 1997). Whether the bats switched roosts or died as a direct result of banding is unknown. Spider Cave in Washington showed a similar dramatic decline in numbers, but within a shorter time period. From 1965 to 1967 numbers dropped from 268 to less than 50; banding was conducted at this location during this time (C. Senger, written commun., 1996). Senger found a similar pattern for Bat Cave in Washington (numbers dropped from 218 in 1966 to 56 in 1967), but this trend was not found to be significant.
Available data are insufficient for making statistically based inferences about trends in counts of Townsend’s big-eared bat across its geographic range in the western U.S. Pierson and others (1999), however, document a substantial number of anecdotal cases that have been interpreted to be evidence of declines. In these cases numbers at roosts re-visited after long periods between attempts at counting were low or zero, and evidence of roost destruction or killing of bats was sometimes unequivocal. Such cases often do not include sufficient time series for statistical analyses of trends. However, Townsend’s big-eared bats can frequently shift roosts and monitoring their numbers can be extremely challenging, and this renders it difficult to make inferences about true population status based on absence or reduced numbers even at local scales (Sherwin and others, 2003). Nonetheless most organizations concerned with bat management and conservation have taken a
Fig. 13.Fig. 13.Fig. 13.Fig. 13.Fig. 13. Counts of hibernating Townsend’s big-eared bats (Corynorhinus townsendii) at Jewel Cave, South Dakota (t = -0.319, P < 0.05, CV = 75.0%; Appendix 6).
Fig. 14.Fig. 14.Fig. 14.Fig. 14.Fig. 14. Counts of hibernating Townsend’s big-eared bats (Corynorhinus townsendii) at Spider Cave, Washington (t = -0.409, P < 0.05, CV = 152.9%; Appendix 6).
precautionary approach based on the accumulation of anecdotal case accounts and are concerned about the status of this species. We summarize some of these accounts below, bearing in mind that documentation of declines may be more likely to appear in the literature than reports noting stable or even increasing trends. Townsend’s big-eared bat was considered a Category 2 Candidate for listing under the Endangered Species Act prior to elimination of this category (U.S. Fish and Wildlife Service, 1994). The Bureau of Land Management and U.S. Forest Service also categorized this bat as Sensitive or a Species of Concern in most areas, and it was also given special status by wildlife management agencies in most western states (Pierson and others, 1999).
California provides a number of examples of anecdotal accounts indicating likely declines in Townsend’s big-eared bat. Pierson and Rainey (1998a) accumulated case histories that indicated a 52% loss in the total number of maternity colonies, a 45% decline in the number of available roosts, a 54% decline in the total number of individual bats, and a 33% decrease in the average size of remaining colonies over the past 40 years (Pierson and others, 1999). Among specific cases from California, Pearson and others (1952) studied a maternity colony of 140 females and a hibernaculum of 65 in 1949–1950 in northern California. In 1987–1988, these two colonies numbered about 70 and 26, respectively. Another maternity colony numbering about 200 bats in the 1960’s in a separate area in the same region consisted of about 150 in 1987 (Pierson and others, 1991). Four hibernation sites in California studied by Pearson and others (1952) that housed a total of 470 bats held just 59 individuals in the late 1980’s and early 1990’s (Pierson and Rainey, 1998a). In coastal California only seven small colonies were known for Townsend’s big-eared bat in 1989 (Pierson, 1989).
Similar contrasts between past and present abundance of Townsend’s big-eared bat were documented from specific sites in other western states (Pierson and others, 1999). Major downward shifts were noted at sites in Oregon and Washington. Intensive surveys over large areas in Nevada revealed only two sites with small maternity groups. In Colorado, a hibernaculum with over 500 in 1968 was reduced to just a few bats, and only four maternity sites were known to be active in the state in recent years, with the largest numbering about 80 females. Four colonies in hibernacula in Idaho also had lower numbers since 1987. One recently discovered hibernaculum in New Mexico that housed more than 10,000 individuals in 1992 had been vandalized by fire the same winter, with hundreds of carcasses evident and thousands presumed dead. In Arizona, two historically known colonies in caves had disappeared, and another
ELLISON AND OTHERS 145
with historical estimates of several hundred adult females dropped to less than 100, although the species is currently known at numerous sites in the state (Pierson and others, 1999). O’Shea and Vaughan (1999) reported an increase in abundance from 1972 to 1997 at one site in Arizona occupied by a small colony of breeding individuals, but suggested that the 1997 numbers remained below those presumed present in 1931. Although results of most of these visits to sites resurveyed after long intervals have led to conclusions of widespread declines in Townsend’s big-eared bat in the west, recent research cautions that apparent absence can be an artifact of survey effort (Sherwin and others, 2003). In the Great Basin of Nevada and Utah, this species may show high fidelity to roosts in caves or mines where these roosting situations are few in numbers. However, in other areas within this region where potential roosts are more abundant, individuals and colonies may frequently switch roost sites. Nine or more visits by researchers may be required before surveys have a 90% probability of revealing roosting bats, depending on the area and type of colony (Sherwin and others, 2003).
Corynorhinus townsendii ingens (Ozark big-eared bat). The Ozark big-eared bat is categorized as endangered under the U.S. Endangered Species Act. Its distribution is restricted to limestone areas in Arkansas, Oklahoma, and Missouri. This isolated distribution is thought to be a relict of post-Pleistocene climates (Humphrey and Kunz, 1976). We compiled 354 observations at 56 distinct localities from three states, with 72% (255) of the observations from Oklahoma; 16% (57) from Arkansas; and 12% (42) from Missouri. All records were from caves. Most records were compiled from publications and unpublished agency reports (329; 93%; e.g., Harvey and others, 1981; Grigsby and Puckette, 1982; Harvey, 1989; Clark and others, 1997a,b). The Missouri Natural Heritage Program provided 7% (25) of the records (J. Sternburg, written commun., 1999). Thirty-seven percent of the observations (131) were made after 1990.
We analyzed data from seven hibernating colonies and seven summer (five maternity and two bachelor) colonies for trends, in Arkansas, Oklahoma, and Missouri (Appendix 7). No significant trends were detectable for counts at hibernating colonies. One summer colony decreased significantly, whereas one increased. The colony that showed evidence of a decline was a bachelor colony roosting in Marble Falls Cave, Arkansas. This colony declined from 100 individuals in 1978 to 0 in 1988. Marble Falls Cave also serves as a hibernaculum during the winter. The counts from 1978 to 1987 ranged from 145 individuals to 420, with no detectable trend over time. The colony that showed evidence of an
146 INFORMATION AND TECHNOLOGY REPORT–2003--0003
increasing trend was a maternity colony in a cave coded AD-010 in Oklahoma. This colony increased from a count of 15 in 1981 to 314 in 1995 during 15 consecutive years of surveys (Clark and others, 1997a,b). This cave also serves as a hibernaculum in the winter, but in 1994 only one individual was counted.
The largest reported winter aggregation of Ozark big-eared bats was 485 counted in November 1989 at a cave coded AD-003 in Oklahoma (Clark and others, 1997b). Earlier, Sealander and Heidt (1990) suggested that the population size of this subspecies was about 500, with about half of these found in Arkansas where they were known from one maternity cave and one hibernaculum cave. More recently, however, it has been suggested that there may be 1,600 bats in Oklahoma, and 260– 700 in Arkansas, but none in Missouri (Harvey, 1992; U.S. Fish and Wildlife Service, 1992; Clark and others, 1997a). The number of adult females in Oklahoma using maternity sites from 1987 to 1995 fluctuated from 852 to 515, with lower numbers in the most recent half of this period (Clark and others, 1997a). Counts in winter at the four known hibernacula in eastern Oklahoma were about 40% of the counts during summer, suggesting local movements to hibernacula in Arkansas. This species can be difficult to count during winter surveys because of frequent movements of these bats among hibernacula (Clark and others, 1997a). A revised recovery plan was created for this species in 1995 (U.S. Fish and Wildlife Service, 1995).
Corynorhinus townsendii virginianus (Virginia big- eared bat). We compiled 117 observations at 31 localities for the Virginia big-eared bat. These observations were from four southeastern states. This subspecies occurs in West Virginia, Virginia, Kentucky, and North Carolina, a distribution that is also considered a relict of post-Pleistocene climates (Humphrey and Kunz, 1976). The majority of observations were gathered from Kentucky (91; 78%). North Carolina provided 16% (19) of the observations, 5% (6) were from West Virginia, and one (<1%) was from Virginia. The vast majority of counts were from caves (105; 90%), but counts were also available from roosts in mines, rocks, and tunnels. Half of the colonies counted were in hibernacula (58; 50%), 20% (23) were maternity colonies, and 15% (18) were bachelor colonies. The Kentucky Department of Fish and Wildlife Resources provided half of all observations [(58; 50%); T. Wethington, written commun., 1999], the North Carolina Natural Heritage Program provided 16% (19; H. LeGrand, written commun., 1999), and 35% (41) were extracted from publications and theses or dissertations (e.g., Rippy and Harvey, 1965; Adam, 1992; Meade, 1992; Lacki and others, 1993, 1994). More than half of the surveys we compiled for C. t. virginianus (75; 64.1%) were conducted after
1990, which may reflect increased concern about the population status for this subspecies.
We analyzed counts from five hibernating colonies (three in Kentucky and two in North Carolina) and two summer colonies, both in Kentucky (Appendix 8). An upward trend was detected at the Stillhouse Cave hibernaculum in Kentucky. The number of individuals at this site increased from 1,487 in 1980 to 5,105 in 1999 (T. Wethington, written commun., 1999). This cave also harbors a maternity colony in the summer that ranges in size from 810 to 3,068 females. No trends were detected in the other two hibernating colonies in Kentucky. Cranberry Iron Mine in North Carolina declined significantly from 10 individuals in 1992 to two in 1997 (H. LeGrand, written commun., 1999).
Virginia big-eared bats were designated endangered under the U.S. Endangered Species Act in 1979 due to their small population size, limited distribution, and vulnerability to human disturbance (U.S. Fish and Wildlife Service, 1979). A recovery plan has been completed (Bagley, 1984). The Virginia big-eared bat population was thought to have numbered about 13,500 bats 10 years ago (U.S. Fish and Wildlife Service, 1992).
Eptesicus fuscus (big brown bat). We compiled 2,838 observations at 1,745 localities for colonies of the big brown bat. Observations were found for 44 states, more than any other species with records in the BPD. Almost 35% (993) of the records were established after 1990. Big brown bats also showed the most variety in roosting structures (25 different kinds of structures, including buildings, caves, mines, trees, storm sewers, dams, bridges, and tunnels). Forty-two percent of all records (1,192) were from caves, 35% (993) from buildings, and 13% (369) from mines. Although this species is found throughout the U.S., more than half of the observations were collected in Indiana, Kentucky, and Pennsylvania (1,891 observations). More than 50% of all counts (1,459) were conducted at hibernating colonies and 21% at maternity colonies (593). Data for this species were found in almost every kind of source pursued. Data summarized from publications, theses or dissertations, and unpublished reports represented more than 33% of the observations (1,206) for this widely distributed species (e.g., Mohr, 1932b; Goehring, 1954, 1958, 1972; Hall and Brenner, 1968; Reidinger, 1972; Brack, 1983; Brack and others, 1984,1991).
We analyzed data from 31 hibernating colonies and one summer colony of unspecified function for trends. These sites were in Arizona, Indiana, Kentucky, Minnesota, and Pennsylvania (Appendix 9). The majority of counts at hibernating colonies (27; 87.1%) showed no detectable trends; four (12.9%) indicated an upward trend (Table 1). A storm sewer in Minnesota, which served as a hibernaculum for big brown bats,
yielded 20 distinct years of counts for analysis (see Fig. 10). In 1951, 35 individuals were found wintering in the sewer and by 1970 there were 293 individuals (Goehring, 1954, 1958, 1972). This upward trend was significant (Appendix 9). The one summer colony analyzed for trends was from a bridge in Arizona where the colony declined from 60 individuals in 1962 to 0 in 1969. Although the big brown bat is one of the most common building-dwelling bats, there were no maternity or bachelor colonies roosting in buildings with sufficient time series available in the literature to analyze for trends.
Euderma maculatum (spotted bat). We compiled 15 observations from 14 different localities for the spotted bat. Most of these observations were collections of single individuals, thus, there were no time series of counts at colonies of this species available to analyze for trends. The data compiled were mostly before 1990 (12; 80%). The largest number of individuals roosting together was found at Crocodile Cave, Utah, where Hardy (1941) reported collecting four hibernating individuals in 1930. Spotted bats were reported roosting in buildings, caves, rock crevices, and cliffs. This species tends to be highly labile in use of roosts, making trends difficult to determine (Watkins, 1977). Spotted bats were once considered rare because from 1891 to 1965, only 35 specimens were reported in the literature (Watkins, 1977). As of 1985, 73 specimens were reported (Best, 1988). The increased use of acoustic surveys as a field method for determining spotted bat presence has provided evidence that this species is more widespread and abundant than previously thought (Pierson and Rainey, 1998c). The spotted bat is a former Category 2 candidate for listing under the Endangered Species Act (U.S. Fish and Wildlife Service, 1994).
Idionycteris phyllotis (Allen’s big-eared bat). We compiled 22 observations from 11 localities in Arizona for Allen’s big-eared bat. This species was found roosting in buildings, caves, mines, and trees. Group sizes ranged from single individuals up to 97 from a maternity colony in a mine tunnel (Cockrum, 1964). Rabe and others (1998) found reproductive females of this species roosting in ponderosa pine snags in the Coconino National Forest, northern Arizona. Half of the observations in the BPD were obtained from publications (e.g., Commissaris, 1961; Cockrum, 1964) and the other half from the Arizona Game and Fish Department’s Heritage Database (S. Schwartz, written commun., 2000). There were no time series of counts available to analyze for trends. The Allen’s big-eared bat is a former Category 2 candidate for listing under the Endangered Species Act (U.S. Fish and Wildlife Service, 1994).
Lasionycteris noctivagans (silver-haired bat). We compiled 68 observations at 61 localities for the silver- haired bat. There were no counts at colonies for this
ELLISON AND OTHERS 147
species available to analyze for trends. Thirty-two percent of these observations (22) were made after 1990. Silver-haired bats are migratory, roost in trees, and little is known of their population status (Mattson, 1994; Mattson and others, 1996). Frequent switching among roosts in trees, their migratory movements, and lack of research contribute to this absence of information (Campbell and others, 1996; Cryan, 2003).
Lasiurus. We compiled records for the following eight species of lasiurines: western red bat (Lasiurus blossevillii), eastern red bat, hoary bat, Hawaiian hoary bat (L. cinereus semotus), southern yellow bat (L. ega), northern yellow bat (L. intermedius), Seminole bat (L. seminolus), and western yellow bat (L. xanthinus). No time series were available to analyze for this group of bats, most of the existing information was from before 1990, and most observations were of single individuals. The majority of observations were for the eastern red bat, with 66 total records and 27 roost sites. We compiled 21 observations at 16 roost locations for the western red bat. This species was found roosting in foliage in trees (71.4% of the observations), a mine, cave, a log cabin, and an abandoned house. We compiled 61 observations at 49 different locations for the hoary bat. This species was also found roosting mostly in trees, but incidental collections were made of this bat in buildings, caves, bridges, and mines. There were only three observations collected for the Hawaiian hoary bat, and all were bats using foliage in trees. The Hawaiian hoary bat is the only native terrestrial mammal known from the Hawaiian Archipelago. It was listed as endangered in 1970 (U.S. Fish and Wildlife Service, 1970). Historic and current data on abundance of this subspecies are not available (U.S. Fish and Wildlife Service, 1998). Three observations were gathered for the southern yellow bat, and all three observations were of individuals roosting in trees in Texas (Spencer and others, 1988). We compiled nine observations from eight locations for the northern yellow bat, two observations at two tree locations for the Seminole bat, and six observations at three tree roosts for the western yellow bat. These low numbers of observations illustrated the lack of information in the literature on monitoring of tree and foliage-roosting species. Carter and others (2003) provide an overview of information related to historical abundance of bats in this group. Past observations of large numbers of migrating red bats visible in flight during daylight hours and notable concentrations of hoary bats in migration suggest possible reductions in abundance (Carter and others, 2003).
Myotis auriculus (southwestern myotis). We compiled information from seven colonies of the southwestern myotis in Arizona and New Mexico. Six of the colonies were located in Arizona: three in mines and
148 INFORMATION AND TECHNOLOGY REPORT–2003--0003
one each in a tunnel, cave, and snag. The only record from New Mexico in the BPD was from a cave. Most colonies were not specified as to type (6; 86%), the roost in the snag housed a maternity colony and was located on the Coconino National Forest in northern Arizona (Arizona Game and Fish Department Heritage Database). The Arizona Game and Fish Department provided most of the limited number of observations for this species (S. Schwartz, written commun., 2000). There were insufficient time series available to analyze for trends in this species.
Myotis austroriparius (southeastern myotis). We compiled 344 observations at 108 locations for the southeastern myotis. These observations were made in 13 southeastern states. The majority was from Florida (239; 70%), and more than 73% of all observations were from caves (253 observations), 16% (55) from buildings, 4% (15) from bridges, 4% (15) from culverts, and about 1% (5) from mines. One-third of the counts (115) were at maternity colonies, 14% (51) at hibernacula, 11% (36) at unspecified day roosts, 2% (7) at bachelor colonies, and the remaining 38% (132) were of unspecified colonies. The majority of colony data for this species was obtained from publications (274; 80%), with 9% (30) from the Florida Natural Areas Inventory. Only 25% (86) of the total observations for this species were made after 1990.
We analyzed counts from six colonies for trends (Appendix 10). Two of these colonies were unspecified summer colonies, two were maternity colonies in Florida, and two were from hibernacula (one in Indiana and one in Kentucky). All of these colonies were located in caves and counts in the time series ranged in size from 0 to 170,000 (Sweet Gum Cave, Florida). Counts at the two hibernacula and the three summer colonies showed no detectable trend. One maternity colony indicated a downward trend. Sweet Gum Cave, Florida declined from 170,000 in 1936 (using an unspecified method of counting individuals) to 0 in 1991. The longest time series was for Old Indian Cave, Florida, with nine distinct years of counts in the summer. Counts at this cave varied dramatically from year to year ranging from two in 1981 to 10,437 in 1989 (CV of 120.7%).
Although we analyzed only six colonies for trends and most of these colonies showed no consistent trend, there has been an accumulation of anecdotal accounts that have suggested cause for concern about the status of the southeastern myotis. Barbour and Davis (1969) suggested that the population in the lower Ohio River Valley was much more rare than in the past and possibly was close to extinction. This bat is considered uncommon or rare in the northernmost states within its range (Barbour and Davis, 1974; Hoffmeister, 1989;
Sealander and Heidt, 1990). Mumford and Whitaker (1982) reported an apparent decline in wintering colonies in Indiana since 1949. In the Ouachita Mountains in Arkansas, one colony in a mine drift was inundated by an impoundment, and a second colony in an abandoned mine containing 150 hibernating individuals declined to just a few individuals by 1986, probably due to disturbance (Saugey and others, 1988).
This species is considered to be most abundant in Florida, where colonies occur in the panhandle and the north-central peninsular regions of the state (Gore and Hovis, 1994). The accuracy of population estimates for this species in Florida is uncertain and little is known of seasonal movements among caves, which Humphrey and Gore (1992) cautioned precludes evaluation of trends from the scanty data available. Despite this lack of knowledge and uncertainty in estimates, there have been several published accounts suggesting declines in this species in Florida. For instance, one colony of 2,500 reported in a cave by Rice (1957) was gone in the early 1990’s, a second of 90,000 remained at about the same number, and a third consisting of 30,000 bats was on a site scheduled for development of a housing project (Humphrey and Gore, 1992). Three caves in the Florida panhandle that had previously supported bats, including a colony of 11,000 at one site in the 1950’s, were completely devoid of bats by the early 1990’s (Humphrey and Gore, 1992). Another cave in the Florida panhandle with a maternity colony documented to be 15,000 in 1970 had fewer than 200 in 1981 (Wenner, 1984). These downward shifts prompted an intensive statewide survey for maternity colonies in 1991–1992 (Gore and Hovis, 1994). Caves with maximum colony size estimates in the past (adults prior to parturition only) noted at various times from 1936–1982 totaled 377,000 bats; in 1991– 1992 a maximum of about 165,000 were estimated at these same sites (Gore and Hovis, 1994). These numbers suggest lower colony sizes, but are not directly comparable because it is unknown how many of the earlier sites were continuously or simultaneously occupied, how many undiscovered populations existed in the recent past, how much movement occurred among sites, and how methods of estimation may have differed. Most of the maternity colonies visited in 1991 or 1992 showed evidence of successful production of young, particularly in the panhandle, but just three of six caves in the peninsula occupied by females in spring 1992 had evidence of volant young by summer. The other three showed signs of disturbance and abandonment. The only known maternity colony in Alabama, reported to contain about 8,000 bats in 1990, was reported as being “extremely vulnerable to destruction” because of high use of the cave by people, disturbance, and vandalism
(Best and others, 1992). Another summer colony at a different cave was previously described as the largest in Alabama, but had been extirpated by the mid-1980s due to disturbance and vandalism. The southeastern myotis was previously a Category 2 Candidate for listing under the Endangered Species Act (U.S. Fish and Wildlife Service, 1994).
In contrast to the situation described above for populations of the southeastern myotis that roost in caves, Clark (2003) provided evidence that this species also commonly roosts in hollow trees in bottomland swamps and forests. This suggests that colonies in these habitats may be more abundant than previously realized.
Myotis californicus (California myotis). We compiled 105 observations from 88 locations for the California myotis. These counts were compiled from 10 western states. The majority of observations were from Arizona (26; 25%), California (29; 28%), Colorado (10; 9%), and Nevada (19; 18%). This species was reported from mines (48; 45%), buildings (25; 25%), caves (10; 10%), and bridges (4; 4%). The remainder was reported from crevices, shrubs, the ground, cacti, rocks, signs, trees, and tunnels. Most colonies were not specified as to type (53; 51%). Unspecified day roosts (14; 14%), hibernacula (15; 14%), maternity (6; 6%), and night roosts (14; 14%) were also reported. Sixty-seven percent of the colony data (70 observations) we analyzed were from publications, theses or dissertations, and unpublished reports (e.g., Dalquest and Ramage, 1946; Krutzsch, 1954; Cockrum, 1964; Easterla, 1973; Hasenyager, 1980; Perkins and others, 1990). We obtained 17% (18) of the total observations for this species from the Arizona Game and Fish Department (S. Schwartz, written commun., 2000), 10% (10) from the Colorado Division of Wildlife (K. Navo, written commun., 2000), and 4% (4) from the National Park Service (C. Baldino, written commun., 1999). Thirty-seven percent of the observations (39) were made after 1990. There were insufficient time series available to analyze for trends in this species. The California myotis is a former Category 2 Candidate for listing under the Endangered Species Act (U.S. Fish and Wildlife Service, 1994).
Myotis ciliolabrum (western small-footed myotis). We compiled 401 observations from 182 locations and 16 western states for the western small-footed myotis. Thirty percent of available observations (120) were from South Dakota, 26% (103) from Wyoming, 17% (69) from Colorado, and 8% (34) from Idaho. Half the observations (201) were from mines and 41% (167) from caves. Bridges, buildings, crevices, rocks, and tunnels were also reported as roosts of this species. Counts for hibernating colonies comprised nearly half of all the observations
ELLISON AND OTHERS 149
(182; 45%), with the remaining observations from bachelor groups, unspecified day roosts, maternity colonies, and night roosts. Fifty-three percent of counts at colonies (215) of the western small-footed myotis were obtained from publications (e.g., Turner and Jones, 1968; Martin and Hawks, 1972; Turner, 1974; Worthington, 1992; Choate and Anderson, 1997; Jagnow, 1998), 21% (83) from the Black Hills National Forest Database (B. Phillips, written commun., 1999), 15% (59) from the Colorado Division of Wildlife (K. Navo, written commun., 2000), and 7% (27) from the Wyoming Game and Fish Department (B. Luce, written commun., 1999). Nearly 70% (280) of the observations were made after 1990.
We analyzed data from two hibernating colonies for trends (Appendix 11). The two colonies were Torgac Cave, New Mexico, and Jewel Cave, South Dakota. Data from both of these colonies demonstrated no trend. Torgac Cave’s counts ranged from 0 to 111 individuals and Jewel Cave ranged from four to 20 individuals. Jagnow (1998) reported an increase in the number of western small-footed bats found hibernating in Torgac Cave, but the number of years in the time series was too small for our analysis. We are unaware of other published information pertinent to the status of this species. The western small-footed myotis is a former Category 2 candidate for listing under the Endangered Species Act (U.S. Fish and Wildlife Service, 1994).
Myotis evotis (long-eared myotis). We compiled 137 observations at 110 colony locations and 12 western states for the long-eared myotis, with the majority of observations obtained from Colorado (41; 30%), Montana (14; 10%), and Oregon (24; 18%). The species roosted in several different types of structures including 40% (55) in caves, 37% (51) in mines, 8% (11) in buildings, 7% (9) in bridges, 1% (2) in rocks, and the remainder in snags, stumps, and trees. Most colonies were of an unspecified type (79; 58%). Unspecified day roosts (19; 14%), hibernacula (19; 14%), maternity (8; 6%), and night roosts (11; 8%) were also reported. Thirty-two percent of the colony data (47 observations) we gathered were from publications and unpublished reports (e.g., Senger and others, 1974; Swenson and Shanks, 1979; Marcot, 1984; Perkins and others, 1990; Worthington and Ross, 1990; Priday and Luce, 1996). We obtained 28% of our observations (39) from the Colorado Division of Wildlife, 7% (10) from private individuals (C. Senger, written commun., 1996), 9% (13) from the Oregon Natural Heritage Program, and 7% (10) from the Wyoming Game and Fish Department. There were insufficient data available to analyze for trends in counts for this species. This species had 67% (92) of its observations collected after 1990. The long-eared myotis
150 INFORMATION AND TECHNOLOGY REPORT–2003--0003
is a former Category 2 candidate for listing under the Endangered Species Act (U.S. Fish and Wildlife Service, 1994).
Myotis grisescens (gray bat). We compiled 1,879 observations of gray bats gathered from 334 roost locations in 14 south-central and southeastern states. The majority of observations were collected from Missouri (735; 39%), Arkansas (377; 20%), Alabama (273; 15%), and Kentucky (194; 10%). Gray bat colonies were found in a variety of structures including bridges, buildings, caves, culverts, dams, mines, and sewers. However, more than 96% (1,807) of all counts were conducted at caves. Forty-six percent of these were maternity colonies (866), 16% (301) transient roosts, 10% (196) hibernacula, and 5% (101) bachelor colonies. Thirty percent of the observations (564) were made after 1990. The Alabama Natural Heritage Program provided 11% (207) of the observations (T. Manasco, written commun., 1999), the Missouri Natural Heritage Program 31% (587 observations; J. Sternburg, written commun., 1999), and the Indiana Natural Heritage Program 1% (9 observations; R. Hellmich, written commun., 1999). Publications, theses or dissertations, unpublished reports (937; 50%), and the Kentucky Department of Fish and Wildlife Resources [(122; 6%); T. Wethington, written commun., 1999)] provided the remainder of our information.
Gray bats form large aggregations of females and young in the summer. Counts have reached nearly half a million in single caves (485,400 for Sauta Cave, Alabama, Alabama Natural Heritage Program). We analyzed information from counts at 103 summer colonies and from 12 hibernacula. These colonies were in Alabama, Arkansas, Florida, Illinois, Kansas, Kentucky, Missouri, and Tennessee (Appendix 12). The vast majority of these colonies were in caves (105; 99%) with the notable exception of a maternity colony using a storm sewer in Kansas. The majority of the data from summer colonies showed no trend (88; 85.4%), nine indicated an upward trend, and six indicated a downward trend (Table 2). The six summer colonies that showed significant declining trends were Hollyberry Cave, Alabama; Big Creek Cave, Optimus Cave, and Shirley Bat Cave, Arkansas; and two caves in Missouri (Locations 6102 and 6067). Counts at Hollyberry Cave declined from 20,000 in 1986 to 0 in 1997. Counts at Big Creek Cave declined from 18,000 individuals in 1980 to 1,680 in 1988. Optimus Cave, a transient roost surveyed for 10 distinct summers, declined from 7,000 in 1977 to 0 in 1988. Shirley Bat Cave, a bachelor colony, had nine years of counts, and declined from 10,200 in 1977 to 2,020 in 1988. An unnamed cave (coded 6102) was home to a maternity colony that had seven years of
counts and declined from 2,000 in 1964 to 0 in 1998. Cave location 6067 housed a maternity colony of 50,000 in 1964, but only 400 were counted in 1989. The longest time series available for this species was 19 years of counts at Cave Springs Cave in Alabama. This colony increased from 20,000 in the summer of 1978 to 47,500 in 1997 (Alabama Natural Heritage Program; Harvey, 1989; Harvey and others, 1981).
No trends were detected for 7 of the 12 hibernating colonies of gray bats (58.3%); three showed an upward trend (25.0%), and two a downward trend (16.7%; Table 1). Few data are available for gray bat hibernation sites because of their sensitivity to disturbance (R. Currie, written commun., 2003). The two hibernacula that declined were for Bonanza Cave, Arkansas and Marvel Cave, Missouri. Bonanza Cave declined from 250,000 in 1979 to 55,000 in 2001 and this decline was attributed to disturbance (M. Harvey, written commun., 2003). The number counted at Marvel Cave declined from 14,500 in 1935 to 2,527 in 1976.
The gray bat was listed as endangered in 1976 (U.S. Fish and Wildlife Service, 1976), and a recovery plan was created in 1982 (U.S. Fish and Wildlife Service, 1982). Tuttle (2003) reviews the problems and unique issues associated with estimating population size of hibernating bats, including the gray bat. Gray bats have been contaminated and killed by pesticide poisoning through the food chain (Clark and others, 1978b, 1983a,b, 1988). However, their populations have been most affected by disturbance and vandalism to colonies in caves. They are reported to be highly selective in their use of particular caves, utilizing only very small proportions of available caves and a limited number of sites (Tuttle, 1979, 1986). This makes them very vulnerable to human activities because they are highly aggregated. Reduced numbers of gray bats at 20 caves in Kentucky from an estimated past summer abundance of over 500,000 to just 61,000 by 1979 was attributed to frequency and intensity of disturbance (Rabinowitz and Tuttle, 1980), as was a reduction in gray bats at summer roosts in Alabama and Tennessee from a likely 1.2 million in the recent past to 294,000 by 1976 (Tuttle, 1979). Analysis of survival based on banding studies was consistent with declines in counts at some sites (Stevenson and Tuttle, 1981). Deliberate destruction of entire colonies from misguided fears about the degree of threat from rabies has also occurred (Tuttle, 1979).
Gray bat numbers are thought to have rebounded in recent years because of intensive recovery efforts initiated by the U.S. Fish and Wildlife Service and many others (R. Currie, written commun., 2003). At the time the Recovery Plan was written, the gray bat population
was thought to be about 1,575,000 across its range. In 2002, the population was thought to be 2,678,137, up 61.5% from the time the plan was written.
Myotis keenii (Keen’s myotis). We found no information for colonies of Keen’s myotis, a species with a very limited range in the Pacific Northwest. Until 1979, the northern long-eared myotis was considered a subspecies of Keen’s myotis, but discovery of differences in distribution and morphology were used to justify recognizing the two taxa as distinct species (van Zyll de Jong, 1979).
Myotis leibii (eastern small-footed myotis). We compiled 785 observations from 502 locations from 16 states for the eastern small-footed myotis. More than 71% of all observations (561) were collected from Pennsylvania, 17% (133) from New York, and 3% (19) from Arkansas. This species was found roosting in seven different types of structures (boulders, buildings, caves, culverts, mines, and tunnels). Seventy-one percent of all observations were made in caves (558), 22% (176) in mines, and 4% (33) in tunnels. More than 90% (710) of all counts were conducted at hibernacula. Forty-four percent of the observations (345) were made after 1990. The majority of counts for this species were obtained from the Pennsylvania Game Commission’s Winter Bat Hibernacula Survey [(526; 67%); J. Hart, written commun., 2000], 14% (107) from publications (e.g., Mohr, 1932a,b, 1933a; Tuttle, 1964; Krutzsch, 1966; Martin and others, 1966; McDaniel and others, 1982;), and 16% (123) from New York’s Division of Wildlife Winter Bat Survey (A. Hicks, written commun., 2000).
Ten colonies of hibernating eastern small-footed myotis in Pennsylvania were analyzed for trends (Appendix 13). Two of these colonies were in mines and eight in caves. Colonies of this species tended to be small, with time series ranging in size from 0 to a maximum of 46. Trends could not be detected for the majority of these colonies (8; 80%), and two (20%) were found to have increased (Table 1). The eastern small-footed myotis is a former Category 2 candidate for listing under the Endangered Species Act (U.S. Fish and Wildlife Service, 1994).
Myotis lucifugus (little brown bat). We compiled 2,117 observations from 1,244 colony locations from 42 states for the widely distributed little brown bat. Thirty percent of all observations were collected from Pennsylvania (615), 17% (369) from Indiana, 10% (209) from Kentucky, 5% (104) from Massachusetts, and 9% (185) from New York. This species was found roosting in 18 different kinds of roosting structures, with 55% (1,169) of all observations from caves. Little brown bats also used mines (326; 15%) and buildings (448; 21%).
ELLISON AND OTHERS 151
More than 60% (1,280) of all counts were conducted at hibernacula and 12% (255) at maternity colonies. Thirty- nine percent of the observations (826) were made after 1990. Forty-two percent of colony data (877 observations) for this species were obtained from publications, theses or dissertations, and unpublished reports (e.g., Bailey, 1933; Welter and Sollberger, 1939; Hall and others, 1957; Humphrey and Cope, 1963; Brack, 1983; Brack and others, 1984, 1991; Gates and others, 1984; Whitaker and Rissler, 1992a,b); 25% (529) from the Pennsylvania Game Commission’s Winter Bat Hibernacula Survey (J. Hart, written commun., 2000); 7% (154) from the Kentucky Department of Fish and Wildlife Resources (T. Wethington, written commun., 1999); 7% (151) from D. Scott Reynold’s survey of building-roosting little brown bats (1999); and 6% (123) from the New York Division of Wildlife Winter Bat Survey (A. Hicks, written commun., 1999).
We analyzed counts from 45 colonies for trends (Appendix 14). These colonies were in Indiana, Kentucky, Massachusetts, Maryland, New Hampshire, Pennsylvania, South Dakota, Vermont, and West Virginia. Thirty-eight of these colonies were hibernacula in caves; three were hibernacula in mines, three were maternity colonies in buildings, and one was a maternity colony in an unspecified roost structure, most likely a building (Humphrey and Cope, 1963). The majority of counts made at hibernacula showed no detectable trend (27; 64.3%), 13 (30.9%) had increased, and two (4.8%) had declined (Table 1). The two colonies that declined were Ray’s Cave, Indiana, and Haine’s Gap, Pennsylvania. Ray’s Cave’s colony size declined from 3,380 in 1987 to 351 in 1993 (R. Hellmich, written commun., 1999; Brack, 1983; Brack and others, 1984, 1991). Haine’s Gap had a colony size of 87 in 1985, but dropped to 52 in 1993 (J. Hart, written commun., 2000). One summer colony in a building in Massachusetts showed an upward trend from 350 in 1994 to 520 in 1997 (D. Reynolds, written commun., 1999). The other summer colonies showed no trends. The longest time series available for the little brown bat was from Aitkin Cave, Pennsylvania. Thirteen years of counts were available at Aitkin Cave, beginning in 1932 when 406 bats were counted by Mohr (1932b) and ending in 1997 when 1,653 were counted during the Pennsylvania Game Commission’s Winter Bat Hibernacula Survey (J. Hart, written commun., 2000).
Myotis septentrionalis (northern myotis). We compiled 1,077 observations for the northern myotis from 736 locations from 31 states. More than 51% of all observations (553) were collected from Pennsylvania; 12% (129) from New York; 11% (115) from Indiana;
152 INFORMATION AND TECHNOLOGY REPORT–2003--0003
6% (62) from Kentucky; and 5% (50) from South Dakota. Colonies of this species were found roosting in seven different types of structures (buildings, caves, culverts, mines, sewers, trees, and tunnels) with 70% (757) of all observations in caves and 24% (254) in mines. More than 80% (862) of all counts were conducted at hibernacula. Forty-two percent of the observations (452) were made after 1990. Information on counts of colonies was obtained from the Pennsylvania Game Commission’s Winter Bat Hibernacula Survey [(529; 49%); J. Hart, written commun., 2000)]; 27% (290) from publications, theses or dissertations, and unpublished reports (Bures, 1948; Hall and Brenner, 1968; Cope and Humphrey, 1972; Brack, 1983; Brack and others, 1984; Whitaker and Rissler, 1992a; Cryan and others, 2001); 11% (123) from New York’s Division of Wildlife Winter Bat Survey (A. Hicks, written commun., 2000); 5% (50) from the Kentucky Department of Fish and Wildlife Resources (T. Wethington, written commun., 1999); and 3% (33) from the Black Hills National Forest Database (B. Phillips, written commun., 1999).
We analyzed data from 12 colonies for trends (Appendix 15). These were all wintering colonies in hibernacula in Maryland and Pennsylvania. Four of these colonies were in mines and eight in caves. No trend was detectable in the majority of these colonies (9; 75%). Three colonies (25%) increased over the time period analyzed (Table 1). The three colonies found to have increased were Lemon Hole, Ruth Cave, and Sharer Cave, all in Pennsylvania. Counts at these hibernacula were all low, however, ranging from 0 to a maximum count of 93 (Sharer Cave, Pennsylvania). Lemon Hole increased from one individual in 1985 to six in 1997. Numbers at Ruth Cave increased from two in 1985 to 52 in 1995. Sharer Cave increased from 0 in 1985 to 28 in 1997, but the coefficient of variation was relatively high (134.5%). Aitkin Cave provided the longest series of counts for this species, with 13 years of counts beginning in 1964 with a count of 10 individuals (Hall and Brenner, 1968) and ending in 1997 with 36 bats (J. Hart, written commun., 2000). However, no trend could be detected at this site.
The northern long-eared myotis was considered a subspecies of Keen’s myotis until 1979, but differences in distribution and morphology were used to justify recognizing the two taxa as distinct species (van Zyll de Jong, 1979).
Myotis sodalis (Indiana bat). We compiled 2,867 observations for the Indiana bat at 920 colony locations from 24 eastern states. Oklahoma was the western-most state with observations of this species. Most observations were from Indiana (418; 15%), Kentucky (960; 33%), New York (186; 6%), and Pennsylvania (557; 19%). This species was found roosting in a variety of
structures including bridges, buildings, caves, culverts, mines, trees, and tunnels. More than 86% of all counts (2,480) were conducted at caves and 90% (2,600) were from hibernacula. Indiana bats roost in the winter in large aggregations, with colonies often on the order of magnitude of 100,000 individuals. Twenty-eight percent of the observations (803) were made after 1990. Natural Heritage Programs (Alabama, Indiana, Kentucky, Missouri, and North Carolina) provided 28% (803) of all observations. Twenty-five percent of the observations were obtained from the New York Division of Wildlife Winter Bat Survey [(180; 6%); A. Hicks, written commun., 2000] and the Pennsylvania Game Commission’s Winter Bat Hibernacula Survey [(528; 19%); J. Hart, written commun., 2000]. The remaining observations were obtained from publications (559; 19%), theses or dissertations (668; 23%), and unpublished reports (109; 4%). We compiled more observations for the Indiana bat than for any other species of bat. The Indiana bat also had the most colonies with >10 years of surveys of any species (30 sites had >10 years of surveys).
We analyzed 97 wintering colonies in hibernacula for trends (Appendix 16). These were at sites in Alabama, Arkansas, Illinois, Indiana, Kentucky, New York, Pennsylvania, and West Virginia. All of these colonies roosted in caves or mines. Trends were not detectable for about half (49; 50.5%), 18 increased (18.6%), and 30 (30.9%) declined (Table 1). Notable colonies that indicated significant declines using nonparametric trend analyses included Bat Wing Cave and Twin Domes Cave, Indiana; Bat Cave and Coach Cave, Kentucky; and Bat Cave, Missouri. Bat Wing Cave’s colony size declined from 50,000 in 1977 to 7,400 in 1997. Twin Domes Cave’s colony size declined from 100,000 individuals in 1975 to 67,100 in 1997. Bat Cave in Carter County, Kentucky, had a colony size of Indiana bats estimated at 90,000 in 1937 and 100,000 in 1956, but declined to 25,100 in 1999. Coach Cave’s colony declined from 100,000 in 1957 to 33 in 1999, and Bat Cave, Missouri, declined from 100,000 in 1958 to 4,275 in 1987.
The two longest time series available to analyze for trends for the Indiana bat was at Ray’s Cave in Indiana and Bat Cave, Carter County, Kentucky, both with 23 distinct years of surveys. Numbers of Indiana bats at Ray’s Cave increased from 1,500 in 1956 to more than 51,000 in 1997. This was a significant increase (Appendix 16). The winter colony roosting in Bat Cave, Kentucky declined significantly from 90,000 in 1937 to just over 25,000 in 1999. Another example of a notable, significant increase in counts was at Wyandotte Cave, which can be attributed to changes in cave gating which enhanced temperature conditions in the hibernaculum (Richter and others, 1993).
ELLISON AND OTHERS 153
The Indiana bat was listed as endangered in 1967, with full legal protection provided with passage of the Endangered Species Act of 1973 (U.S. Fish and Wildlife Service, 1999). Based on censuses conducted at hibernacula, the total population size of the Indiana bat across its entire range was thought to be about 353,000 bats during the 1995–1997 survey years. This is less than half of the total population size of 808,505 thought to exist in 1960 (U.S. Fish and Wildlife Service, 1999). In 2001, the total known population size for this species was thought to be 380,000 (Clawson, 2002). Clawson (2002) reviews the history and current status of the Indiana bat. A number of papers in the recent symposium volume edited by Kurta and Kennedy (2002) summarize current issues in research and management for this species.
Myotis thysanodes (fringed myotis). We obtained 235 observations from 127 colony locations of the fringed myotis. These observations were from 10 western states, with 26% (61) in Arizona, 24% (56) in South Dakota, 15% (35) in New Mexico, 9% (22) in Oregon, 8% (20) in Colorado, 7% (16) in Wyoming, and 6% (14) in California. The remaining few observations were in Nevada, Texas, and Utah. Almost half of the observations were from caves (120; 46%), with an additional 23% (55) from mines, 14% (34) from buildings, 6% (14) from bridges, and 3% (6) from trees. Twenty-one percent of counts (50) were at unspecified day roosts, 14% (33) at maternity roosts, 10% (24) at night roosts, 1% (3) at bachelor roosts, and 38% (102) of unspecified colony type. More than half of the observations were made after 1990 (120; 51%). Forty-two percent of the observations (109) were obtained from publications, theses or dissertations, and unpublished reports (e.g., Cockrum and Ordway, 1959; Davis, 1966; Martin and Hawks, 1972; Worthington, 1992; Choate and Anderson, 1997; Cryan and others, 2001), 20% (47) from the Arizona Game and Fish Department’s Heritage Database (S. Schwartz, written commun., 2000), 13% (31) from the Black Hills National Forest Database (B. Phillips, written commun., 1999), 6% (13) from the Colorado Division of Wildlife (K. Navo, written commun., 2000), 8% (18) from the Oregon Natural Heritage Program (T. Campos, written commun., 1999), and 5% (11) from P. Cryan (written commun., 1998).
We analyzed three colonies for trends (Appendix 17). These three colonies were all located in caves and ranged in size from a minimum of two individuals to a maximum of 121 at Christopher Mountain Cave, Arizona. The colonies in Arizona were summer roosts of unspecified function and showed no trend, whereas numbers counted at the hibernaculum at Jewel Cave, South Dakota decreased significantly from 10 individuals in 1969 to two in 1992. We are unaware
of any published literature pertinent to the status of this species, although it was considered a Category 2 Candidate for listing under the Endangered Species Act prior to elimination of this category (U.S. Fish and Wildlife Service, 1994).
Myotis velifer (cave myotis). We obtained 585 observations from 195 colony locations for the cave myotis. Observations were from seven western states with 32% (186) in Arizona, 29% (171) in Kansas, 28% (166) in Texas, 5% (31) in Oklahoma, and the remaining few observations in California, Nevada, and New Mexico. More than 50% of all observations (297) were from caves, 24% (152) from mines, 12% (67) from bridges, and 9% (52) from buildings. Bird nests, crevices, shrubs, and tunnels were also reported as roosts by this species. Twenty-seven percent of the observations (158) were made after 1990. Nearly a quarter of the observations were from hibernacula (140; 24%). Maternity colonies and unspecified day roosts were the remaining colony types reported. Sixty percent of the data for this species were obtained from publications (344; e.g., Blair, 1954; Tinkle and Milstead, 1960; Tinkle and Patterson, 1965; Dunnigan and Fitch, 1967; Adams, 1995; Jagnowm, 1998). Seventeen percent of the observations (98) were from theses or dissertations, 16% (93) from the Arizona Game and Fish Department’s Heritage Database (S. Schwartz, written commun., 2000), and 8% (48) from the Bats in American Bridges Project (B. Keeley, written commun., 1999, Bat Conservation International).
Only one summer colony and five wintering colonies in hibernacula met criteria for analysis of trends (Appendix 18). All of these colonies were located in caves and time series for these locations ranged in size from 0 to 3,778. The single summer colony (Colossal Cave, Arizona) and three of the hibernacula showed no significant trend (Tables 1 and 2). Counts at two of the wintering colonies in hibernacula declined in the late 1950’s to early 1960’s. Panther Cave, Texas, declined from 1,190 in 1958 to 37 in 1961. Walkup Cave in Texas declined significantly from 3,798 in 1958 to 174 in 1962. We found little information in the literature relevant to trends in colony size in this species. O’Shea and Vaughan (1999) reported abandonment of a roost by a colony of about 5,000 in central Arizona. The cave myotis is a former Category 2 Candidate for listing under the Endangered Species Act (U.S. Fish and Wildlife Service, 1994).
Myotis volans (long-legged myotis). We compiled 290 observations from 186 locations for colonies of the long-legged myotis. Observations were compiled from 13 western states. Most observations were from Colorado (66; 23%), Oregon (33; 11%), South Dakota (62; 21%), Washington (42; 14%), and Wyoming (39; 14%). More than 50% of all observations (153) were from caves
154 INFORMATION AND TECHNOLOGY REPORT–2003--0003
with 25% (73) from mines, 11% (33) from buildings, and 8% (23) from bridges. Crevices in cliffs, rocks, and trees were also documented as roosts used by this species. The majority of colonies (211; 78%) were unspecified as to whether they were maternity, bachelor, or hibernating groups. Nearly 50% of observations (144) were obtained from publications (e.g., Martin and Hawks, 1972; Senger and others, 1974; Turner 1974; Choate and Anderson, 1977; Cryan and others, 2001). The Colorado Division of Wildlife provided 20% of the observations (59 observations; K. Navo, written commun., 2000); the Black Hills National Forest Database provided 12% (35 observations; B. Phillips, written commun., 1999); and the remaining observations were from the Arizona Game and Fish Department [(5; 2%); S. Schwartz, written commun., 2000]; C. Senger [(10; 3%); written comm., 1997)]; the Oregon Natural Heritage Program [(16; 5%); T. Campos, written commun., 1999]; P. Cryan [(11; 4%); written commun., 1998]; and the Wyoming Game and Fish Department [(10; 3%); B. Luce, written commun., 1999]. Nearly 60% of all observations (170) were collected after 1990.
We analyzed counts at one summer colony and two hibernating colonies for trends (Appendix 19). All of these colonies were located in caves and ranged in size from a minimum of one individual to a maximum of 50 at Jewel Cave, South Dakota in the winter of 1969. We found no significant trends for any of these colonies. We are unaware of any published literature pertinent to the status of this bat, although it was considered a Category 2 Candidate for listing under the Endangered Species Act prior to elimination of this category (U.S. Fish and Wildlife Service, 1994).
Myotis yumanensis (Yuma myotis). We compiled 213 observations from 123 locations for colonies of the Yuma myotis. These observations were obtained from 12 western states, with 13% (29) from Arizona, 27% (57) from California, and 35% (74) from Oregon. Colonies of this species occupied several different roosting structures, with almost 50% of reported locations (97) in buildings, 29% (62) in bridges, 8% (18) in caves, 2% (4) in crevices, 7% (14) in mines, 2% (5) in trees, and less than 1% in dams (1) and tunnels (2). Most colonies were unspecified day roosts (84; 40%), maternity colonies (50; 24%), or of unspecified type (58; 27%), with some classified as hibernacula (11; 5%), and night roosts (9; 4%). More than 70% of the counts (151) we obtained were from publications and theses or dissertations (e.g., Dice, 1919; Dalquest, 1947; Commissaris, 1959; Constantine, 1961; Easterla, 1966; Reidinger, 1972; Senger and others, 1974). We obtained 14% of the observations (29) from the Oregon Natural Heritage Program (T. Campos, written commun., 1999), 7% (14) from the Arizona Game and Fish Department’s Heri
tage Database (S. Schwartz, written commun., 2000), 4% (8) from the Bats in American Bridges Program (B. Keeley, written commun., 1999, Bat Conservation International), and C. Senger [(10; 5%); written commun., 1996]. There were no colonies at which >4 years of counts were available to analyze for trends for this species. We are unaware of any published literature pertinent to the status of this species, although it was considered a Category 2 Candidate for listing under the Endangered Species Act prior to elimination of this category (U.S. Fish and Wildlife Service, 1994).
Nycticeius humeralis (evening bat). We compiled 193 observations from 94 locations for colonies of the evening bat. Observations were compiled for 15 states, with 29% (56) from Missouri, 24% (47) from Indiana, 19% (36) from Iowa, 13% (25) from Florida, and the remainder from Alabama, Arkansas, Georgia, Illinois, Kentucky, Louisiana, Michigan, Mississippi, North Carolina, Oklahoma, and Texas. The majority of observations we obtained were from roosts in buildings (130; 67%), but reports included counts at roosts in trees (39; 20%), bridges (10; 5%), and caves (3; 2%). Most colonies counted were maternity groups (158; 82%). Data were assembled primarily from publications, theses or dissertations, and unpublished reports (181; 94%), but information was also provided by the Bats in American Bridges Project [(6; 3%); B. Keeley, written commun., 1999, Bat Conservation International], the Indiana Natural Heritage Program [(3; 2%); R. Hellmich, written commun., 1999], and J.O. Whitaker [(1; <1%); written comm., 1998]. Only one maternity colony had a time series of sufficient length to analyze for trends (Whitaker and Gummer, 1988; Clem, 1992, 1993; Whitaker and Clem, 1992). This colony was located in a church in Indiana. The colony showed no detectable trend (n = 5, S = -6, P > 0.05) over five years from 1987 to 1992, and averaged 295 + 135 bats (CV = 51.0%).
Pipistrellus hesperus (western pipistrelle). We compiled 56 observations from 48 locations for the western pipistrelle. Observations were from Arizona (10; 18%), California (8; 15%), Colorado (2; 4%), Nevada (12; 22%), New Mexico (14; 26%), Texas (3; 6%) and Utah (4; 7%). This species was found roosting in a variety of structures including bridges, buildings, caves, crevices, desert shrubs, garages, mines, rocks, and tunnels. Colonies of this species were usually small with maxima of 11–12 found roosting together in summer (Stager, 1943; Koford and Koford, 1948; Cross 1965). Only 14% of the total observations (8) were made after 1990. About 90% of our observations (49) were gathered from publications (e.g., von Bloeker, 1932; Hardy, 1949; Cross, 1965; Hirshfeld and others, 1977), but single observations were provided by the Arizona Game and Fish Department’s Heritage Database Management System
(S. Schwartz, written commun., 2000), the Bats and American Bridges Project (B. Keeley, written commun., 1999, Bat Conservation International), the Colorado Division of Wildlife (K. Navo, written commun., 2000), and the National Park Service (C. Baldino, written commun., 1999). There were no time series available to analyze for this species.
Pipistrellus subflavus (eastern pipistrelle). We compiled 2,136 observations from 1,044 locations of colonies of the eastern pipistrelle. Observations were compiled from 33 eastern states. Thirty-four percent of all counts (723) were from Kentucky, 26% (557) from Pennsylvania, and 12% (246) from Indiana. More than 83% of all counts (1,793) were made at hibernacula. Counts for this species were mostly from caves (1,688; 80%), 13% (289) were from mines, 4% (77) were in buildings, and 2% (52) were in tunnels. Fifty-five percent of the counts (1,194) were obtained from publications, theses or dissertations, and unpublished reports (e.g., Mohr, 1932a, 1945; Davis, 1957, 1959, 1966; Brack, 1983; Brack and others, 1984, 1991; Gates and others, 1984; Saugey and others, 1988; Whitaker, 1998; Best and others, 1992; Whitaker and Rissler, 1992a,b); 25% (529) from the Pennsylvania Game Commission’s Winter Bat Hibernacula Survey (J. Hart, written commun., 2000); 6% (123) from the New York Division of Wildlife Winter Bat Survey (A. Hicks, written commun., 2000); and 10% (221) from the Kentucky Department of Fish and Wildlife Resources (T. Wethington, written commun., 1999).
We conducted trend analyses on counts from 44 hibernacula and two summer colonies in Alabama, Arkansas, Indiana, Kentucky, Maryland, New York, Pennsylvania, and West Virginia (Appendix 20). Most of the counts in hibernacula showed no detectable trend over the time period analyzed (33; 75%), 11 (25%) showed an upward trend, and none showed a declining trend. The two summer colonies also showed no detectable trend over the time period analyzed. The largest hibernating numbers were in two caves in West Virginia. Each of these caves housed an average of 1,000 individuals over the five years surveyed.
Molossidae
The BPD includes counts for the following members of the family Molossidae: Wagner’s mastiff bat (Eumops glaucinus); greater western mastiff bat (E. perotis); Underwood’s mastiff bat (E. underwoodi); velvety free-tailed bat; pocketed free-tailed bat (Nyctinomops femorosaccus); big free-tailed bat (N. macrotis); and Brazilian free-tailed bat.
Eumops glaucinus (Wagner’s mastiff bat). In the U.S., Wagner’s mastiff bat is found only in southern
ELLISON AND OTHERS 155
Florida, where it roosts in hollow trees and in tile roofs (Belwood, 1992). It was designated a Category 1 candidate for listing under the Endangered Species Act in 1994 (U.S. Fish and Wildlife Service, 1994), but was removed in 1996 (U.S. Fish and Wildlife Service, 1996). We compiled data from three counts at three different localities for this species, none of which were suitable for analysis of trends. A maternity colony of eight individuals was found roosting in a pine tree, which was subsequently felled (K. Marois, written commun., 1999, Florida Natural Areas Inventory; Belwood, 1981). The other two observations were of single individuals found roosting in buildings, but those individuals were subsequently collected (Belwood, 1981; Schwartz, 1952).
Eumops perotis (greater western mastiff bat). We compiled 49 counts at 28 different localities for the greater western mastiff bat. Observations we gathered were from Arizona (13; 26.5%), California (25; 51.0%), and Texas (11; 22.5%). This species was found roosting in buildings (17; 34.7%), caves (11; 22.4%), and crevices (21; 42.9%). Eighty-eight percent of the observations (43) were obtained from publications (e.g., Howell, 1920; Dalquest, 1946; Vaughan, 1959; Cockrum, 1960; Cox, 1965; Ohlendorf, 1972), and the Arizona Game and Fish Department provided 12% (6) of the observations.
There were no series of counts available for analysis of trends in this species. However, in the early 1990’s Pierson and Rainey (1998b) visited historically known roosting areas and likely sites throughout California and confirmed that this species still occurs in many regions in California. They also added additional distributional records. Few colonies were observed directly, but all colonies counted were small (less than 100 individuals). Possible switching among alternate roost sites and the capability of individuals to forage over great distances make estimation of colony sizes difficult. These bats were confirmed to occur near a site in the Coast Range in San Benito County, California, where a colony was also known to exist in 1940 (Dalquest, 1946), but the crevice utilized at that time had since eroded away (Pierson and Rainey, 1998b). A roost on the Kern River in the Sierra Nevada occupied by about 100 bats in August 1948 was occupied by up to 75 bats in 1992. About seven new roosts with colonies of up to 60 bats were also located near Fresno and Jamestown. Greater mastiff bats were also detected in the central Sierra Nevada, where two roosts with evidence of breeding colonies were found. Despite recent concern for populations in southern California, Pierson and Rainey (1998b) reported that greater western mastiff bats still occur in western Riverside and San Diego counties. The locations of three small colonies (10–12 bats), one of which was active in the 1940’s, were rediscovered in the 1990’s. A fourth site where Vaughan (1959) had described an active colony
156 INFORMATION AND TECHNOLOGY REPORT–2003--0003
no longer had evidence of bats because it was in an area that had since become a housing subdivision. The greater western mastiff bat is a former Category 2 Candidate for listing under the Endangered Species Act (U.S. Fish and Wildlife Service, 1994).
Eumops underwoodi (Underwood’s mastiff bat). We have no information in the database for Underwood’s mastiff bat, and to our knowledge no breeding colonies of this bat have been discovered in the U.S. This species is only known from capture records in extreme southern Arizona (Hoffmeister, 1986; Petryszyn and others, 1997). It is a former Category 2 Candidate for listing under the Endangered Species Act (U.S. Fish and Wildlife Service, 1994).
Molossus molossus (velvety free-tailed bat). We compiled data from four observations for the velvety free-tailed bat. In 1994, three colonies of this species were found roosting in buildings on three separate islands in the Florida Keys (Frank, 1997). This was the first documented occurrence of colonies of the velvety free-tailed bat in the U.S. Colony sizes for these three roosts in buildings ranged from 70 to 268 individuals based on emergence counts. There were no time series of colony sizes available for this species.
Nyctinomops femorosaccus (pocketed free-tailed bat). We compiled five observations of colonies of the pocketed free-tailed bat from the literature. These colonies were located in California and Arizona (Gould, 1959; Krutzsch, 1944a,b,c). This species was found roosting in crevices in southern California by Krutzsch (1944a,b,c), and in a building on the campus of the University of Arizona, Tucson by Gould (1959). Only two of the five observations reported a population size estimate for the colonies. A crevice roost in southern California contained 55 bats in March 1940 (Krutzsch, 1944a). The building roost at the University of Arizona was estimated to have 60 individuals (Gould, 1959). The pocketed free-tailed bat has a limited range in the U.S. and its current population status is unknown. There were no time series available to analyze for trends in counts for this species.
Nyctinomops macrotis (big free-tailed bat). We compiled 75 observations of the big free-tailed bat, 14 of which were observations of colonies. The remaining 61 observations were gathered from mist-netting records. This species was found roosting in buildings, caves, and crevices in California, Kansas, New Mexico, and Texas. There were no time series available to analyze for this species.
Big free-tailed bats are colonial and presumably migratory. They aggregate into maternity colonies of moderate numbers, but locations of breeding colonies in the U.S. are poorly known. One colony of an estimated 150 females was discovered in a horizontal crevice in a
cliff in Big Bend National Park in 1937 (Borell, 1939). A colony of unknown size was reported to still be present at the site in 1958, thought by Davis and Schmidly (1994) to be the only known nursery colony of this species in the U.S. However, this colony was not located again in attempts after 1958 (Schmidly, 1991). A nursery colony was also suspected to exist in Guadalupe Mountains National Park in Texas based on the presence of nine reproductive females netted over water in 1968 and 1970 (LaVal, 1973), but subsequent surveys could not confirm the existence of a resident colony (Genoways and others, 1979). Constantine (1961) described the existence of two small colonies in New Mexico. Recent research has revealed several breeding colonies numbering from about 40 to several hundred each in crevices in steep cliff faces in the Jemez Mountains of New Mexico (Bogan and others, 1997). Based on records of occurrence of reproductive females, breeding colonies are also likely to occur in parts of Arizona, California, Nevada, and Utah. The big free-tailed bat is a former Category 2 Candidate for listing under the Endangered Species Act (U.S. Fish and Wildlife Service, 1994).
Tadarida brasiliensis (Brazilian free-tailed bat). We compiled 1,530 counts from 228 locations of colonies of the Brazilian free-tailed bat. These records were collected from 18 states. Most records were from Arizona (289; 19%), New Mexico (454; 30%), Oklahoma (166; 11%), and Texas (343; 23%). This species was reported roosting in several different types of structures, including bridges (324; 21%), buildings (218; 14%), caves (792; 52%), and mines (141; 9%). Brazilian free-tailed bats have also been documented roosting in crevices, dams, sedges, shrubs, trees, and tunnels. Most colonies counted were either maternity (598; 40%) or unspecified day roosts (850; 57%). Ninety-two percent of the data (1,398 observations) were obtained from publications (e.g., Bailey, 1931; Allison, 1937; Constantine, 1957, 1958; Cockrum, 1969, 1970; Reidinger, 1972; Meacham, 1974; Altenbach and others, 1975; Reidinger and Cockrum, 1978; Svoboda and Choate, 1987; Freeman and Wunder, 1988; Thies and Gregory, 1994; Thies and others, 1996); 2% (34) from the Arizona Game and Fish Department (S. Schwartz, written commun., 2000), 4% (70) from the Bats in American Bridges Project (B. Keeley, written commun., 1999, Bat Conservation International); and <1% (9) from the Colorado Division of Wildlife (K. Navo, written commun., 2000). Estimates were made using different methods ranging from exit counts, extrapolations from roosting densities, mark-recapture, and other indices of abundance (see review by McCracken, 2003).
We analyzed counts from eight summer colonies of this species for trends (Appendix 21). Of these eight colonies, the largest was Eagle Creek Cave, Arizona.
Gross estimates of colony size ranged from about 75 million individuals in the summer of 1964 to 30,000 in 1969 (Cockrum, 1970; Reidinger, 1972). None of the colonies analyzed for trends showed significant declines using our rank analysis, despite such well-known examples of major losses in bats at Eagle Creek Cave in Arizona and Carlsbad Caverns, New Mexico (see McCracken, 2003). Two of the colonies analyzed showed an increasing trend: the Orient Mine, Colorado, and a bat house in Florida. The Orient Mine, Colorado, home to a bachelor colony of Brazilian free-tailed bats, increased in size from 9,000 individuals in 1967 to 107,240 individuals in 1983. The University of Florida, Gainesville, built a large bat house in 1991 and then excluded Brazilian free-tailed bats (T. b. cynocephala) from buildings around campus. Bats began to use the bat house in 1993 and from September 1995 to September 2001, the colony increased from 8,000 to about 100,000 individuals (K. Glover, written commun., 2002).
Brazilian free-tailed bats have not been considered for special federal conservation status, although concern exists that a large population be maintained because of their agricultural and ecological importance (see review by McCracken, 2003). The International Convention on Migratory Species of Wild Animals (the Bonn Convention of 1979) lists this species in its Appendix 1. However, the U.S. and Mexico (which share a migratory population of the subspecies T. brasiliensis mexicana) are not parties to this agreement. The Programa para la Conservacion de los Murcielagos Migratorios de Mexico and Estados Unidos (PCMM) was established in 1994 by Bat Conservation International and American and Mexican biologists and authorities in response to observations of declines in several large colonies in both the U.S. and Mexico (Walker, 1995). In some areas declines or loss of colonies were linked to food-chain poisoning by pesticides (Geluso and others, 1976; Clark, 2001), vandalism and disturbance (McCracken, 2003). The Brazilian free-tailed bat can be very adaptable in roosting habits, however, and large colonies have formed in buildings, bridges, and other artificial structures that have become commonplace on the landscape with advancing human settlement.
ConclusionsConclusionsConclusionsConclusionsConclusions
This compilation and analysis of the available data on counts of bats revealed several important issues that need to be considered when estimating population sizes of bats and designing long-term monitoring programs. We believe our synthesis reinforces other reports in this volume by underscoring how imperative it is to improve methods for counting bats. The information we compiled
ELLISON AND OTHERS 157
reflects enormous levels of effort by biologists throughout the nation (sometimes with significant potential for loss of human life) that have been aimed at enumerating bats. Many of the counts extracted from the less recent literature were made incidental to other purposes. However, the intention behind some of the more recent efforts was to detect trends in population sizes of bats, so that management interventions can be made before dramatic declines occur. Nonetheless, most of the data that are available are not suitable for the parametric approaches, such as regression, that are more suitably used to detect trends. To be useful, such techniques require knowledge of variance in the size estimates (see below; Thompson and others, 1998). The nature of the available data on bat populations [much of which can be considered index data gathered through convenience sampling, see Anderson (2001)] required us to rely on nonparametric analyses that do not require exact estimates of colony size but simply direction of change between successive estimates (Thompson and others, 1998). Our analyses also focused on colonies of bats at unique roost sites, not necessarily populations. Trends at specific roosts may or may not reflect population trends. In most cases it is unknown what the potential sampling frame is that such sites may be drawn from, and over what spatial scales inferences about trends at single roosts can be extended (see also Working Group Reports, this volume; Sauer, 2003). Furthermore, because interest in monitoring bat populations is primarily a recent phenomenon, very few sites have multiple time series of counts over long periods and thus many of the nonparametric tests for trends we carried out had as few as four years of counts. Colonies at many sites exhibited wide differences in counts within a time series, with high CVs across years (the great majority exceeding 50% and many over 100%; see Appendices). The resulting lack of statistical power to detect trends in population size is disconcerting, particularly in light of the known cases of biologically significant losses in bat populations (see other reports in this volume). Nonparametric methods, for example, might not detect exponential declines that also include frequent random variation. This may be the case with certain large colonies of bats (e.g., some Mexican free-tailed bat colonies in the southwestern U.S.; Appendix 21) where very large early counts seem to have dropped precipitously but then exhibited more random-like variation thereafter.
Elsewhere in this volume, working group reports and case studies by others make numerous recommendations for improving estimates of sizes of bat colonies. In addition to improving counts by attempting to follow their specific recommendations for sampling, estimation, and enumeration, our examination of the available data pointed out a general need for basic
158 INFORMATION AND TECHNOLOGY REPORT–2003--0003
improvements in several related areas. Almost none of the counts included estimates of sampling-based variation (such as standard errors or other estimates of variance for counts within years using formal methods such as capture-recapture procedures) or replicate counting. Less than 0.06% of all counts had an associated standard error of the estimate, and less than half documented even a simple range of colony sizes. Process-based variation in counts (true fluctuations in numbers present such as changes due to environmental factors, switching among roosts, variations in activity patterns, or changes in vital rates) is typically not estimated.
Development and employment of standards for survey methods and techniques are needed for monitoring sizes of bat populations. Methods of estimating population sizes employed by the sources of the data we compiled varied dramatically, often depending on type of colony. For instance, most summer or maternity colonies were “exit counts” whereas most surveys conducted at hibernacula were “counts” or “censuses” within a roost [but without strong documentation that these met criteria for true censuses; see Tuttle (2003) for descriptions of techniques]. Many variations of these generalized methods appear in the literature.
In our review, we found several examples that illustrate the importance of decisions regarding timing of surveys for monitoring. The California leaf-nosed bat at the Fortuna Mine was one example of the fluctuation in counts that can occur within a single year (Fig. 12). Without an understanding of variance in counts, single surveys conducted at such a site could lead to widely divergent conclusions depending on conditions on the date selected for sampling. Data collected on the southern long-nosed bat illustrated another example of the importance of survey timing. Reports of disappearances of this species appeared to be the result of not “looking in the right places at the right times” (Cockrum and Petryszyn, 1991). Many species of bats differ considerably in fidelity to roosts, and some switch roosts frequently depending on the time of year (Lewis 1995). Low fidelity to roosts can also contribute to the high variability in counts over time evident in some of the data we have compiled. Alternative approaches, such as developing means to estimate density over meaningful areas of suitable habitat, may be more useful for monitoring populations of bats that consist of colonies that frequently move among roosts.
Other issues that came to light in our examination of available data about bat populations include length of available time series, incomplete documentation of efforts, and lack of adequate data for many species of bats. Future monitoring programs must aim to be long-term. Most available data on colonies of bats do not yet
provide enough data in a time series to attempt to derive information on population trends. The majority of reports (Fig. 6) were one-time visits and many of the colonies we analyzed for trends had counts for only four years of surveys. It is unlikely that definitive conclusions can be made regarding population trends with small numbers of data points, especially in colonies where large fluctuations may occur in numbers among years. Many of the reports we reviewed lacked careful and consistent documentation of methods of counting, dates of counting, locations, kinds of colonies, and other critical details of surveys. Incomplete documentation in the literature sometimes hampered our ability to make accurate assessments of the available data. We recommend that authors should be more precise in documenting roost or colony functions (“summer colony” or “day roost” is much less useful than “maternity colony” or “bachelor roost”). We also recommend providing more accurate dates in methods sections of publications (e.g., “23 August 1972” is much more informative than “late summer”), and including more detail on methods used to estimate the size of a colony of bats (e.g., “we counted 49 bats emerging” is much more useful than “a colony of about 40–60 bats was present”). More detailed descriptions of roost locations would also be helpful (by perhaps designating a management authority as a repository for precise details of sensitive locations). Consistent application of site names, or identifying alternate names for the same sites is also important in documentation of surveys for long-term monitoring. The ability to determine trends is compromised in cases where this is not available. Editors of publications and reports of importance for monitoring populations of bats should allow authors to be more detailed in their descriptions of survey methods and thus allow future replication and interpretation.
There are notable exceptions where survey efforts for bats in the U.S. follow standard protocols and are well documented. These include some of the regular surveys of endangered bats in caves [e.g., efforts directed at gray bats and Indiana bats; but see details in Tuttle (2003); Clawson (2002)]. One of the most extensive databases is the Pennsylvania Game Commission’s Winter Bat Hibernacula Survey (J. Hart, written commun., 2000). This project, in effect since 1985, specifically searches for seven species in about 200 different caves, mines, and sinkholes in Pennsylvania every winter or every other winter. The Pennsylvania project uses consistent methods and conducts surveys for bats during the same time of year, and probably has a greater likelihood of detecting trends. However, sampling error for these assumed “censuses” is usually not provided. Specific suggestions for improving
methods of counting bats will differ by the species and specific location (see Working Group reports in this volume).
Most of the available data with time series of counts >4 years are restricted to a few species of bats, particularly those that are accessible in winter hibernacula. There were only eight out of about 60 species of bats in the U.S. and territories for which 10 or more time series of > 4 counts in hibernacula were available, and only two species for which more than 10 such time series were available for counts during the summer season (Tables 1 and 2). Although two endangered species top the lists of these efforts, much less information is available for other endangered species of bats, and the efforts aimed at monitoring those species of bats that are not accessible in caves or mines in winter are very inadequate. There are also special problems even among species that can be found in hibernacula. For example, counts ranged from 1–111 (with CV’s up to 270%) for the western small-footed myotis and the eastern small-footed myotis, species that are scattered in small numbers in hibernacula where other species may gather in large aggregations (Appendices 11 and 13). The dispersed pattern and low numbers make such species susceptible to errors in sampling. Levels of effort need to be increased for monitoring these and other species that roost in very small numbers or are more dispersed across the landscape (see also Working Group reports and case studies in this volume).
Despite the limitations of existing information revealed by this synthesis, the resulting database (http:// www.fort.usgs.gov/products/data/bpd/bpd.asp) is a potentially useful resource. The BPD may provide a basic framework for planning future surveys, particularly at local or regional levels or for selected species, and is a consolidated source of historical information and bibliographic records. Our compilation and analysis of the data should encourage greater focus on improving methods and documentation for future efforts. We also hope that the BPD can be used for additional purposes, such as analyses designed to test hypotheses about the macroecology, life history, and biogeographical patterns of colonial bats.
This compilation and synthesis of existing data revealed just how little is known about recent trends in populations of bats of the U.S. and territories. The quality of data we compiled precludes the ability to make any blanket statements about the status of U.S. bat populations in general. Although we documented locations of colonies where significant declines had occurred for particular species, there often were significant upward trends for that species in other locations. Fundamentally, sampling and estimation
ELLISON AND OTHERS 159
designs and data collection methods need to be improved, and more species need to be monitored for longer time periods at greater numbers of well-chosen locations in order to be able to determine significant declines or upward trends on large scales. The paper by Sauer (2003) and the Working Group reports in this volume discuss the need for rigor in designing surveys for monitoring, including issues regarding sampling frames. The inability to determine population trends in many species and colonies of bats based on available data should certainly not be used as justification to avoid active management for conservation. Precipitous changes and unfavorable conditions will be apparent at local scales, and will continue to require swift attention. However, if the goals of monitoring programs are to detect more subtle changes in populations on large scales before the catastrophic losses of the past are repeated, or to demonstrate incremental improvements in response to management actions, major improvements to estimating and monitoring population sizes of bats are needed.
AcknowledgmentsAcknowledgmentsAcknowledgmentsAcknowledgmentsAcknowledgments
We thank the following people for their invaluable help gathering bat population information from publications and incorporating it into the Bat Population Database: J. Crosby, P. Cryan, S. Jojola-Elverum, L. Stone, and K. Castle. Numerous individuals and organizations contributed their hard-earned data to this project. We wish to thank the following people who provided information to us: C. Baldino (National Park Service, California); T. Campos (Oregon Natural Heritage Program, Oregon); P. Cryan (USGS, New Mexico); M. Curtin (National Park Service, South Dakota); K. Duttenhefner (North Dakota Natural Heritage Program, North Dakota); K. Glover (University of Florida, Florida); J. Hart (Pennsylvania); R. Hellmich (Indiana Natural Heritage Data Center, Indiana); A. Hicks (New York Fish and Wildlife Department, New York); D. Ingram (National Park Service, Maryland); J. Kanter (New Hampshire Fish and Game Department, New Hampshire); B. Keeley (Bat Conservation International, Texas); A.J. Kuenzi (Montana Tech University, Montana, provided data from Nevada); H. LeGrand (North Carolina Natural Heritage Program, North Carolina); B. Luce (Wyoming Game and Fish Department, Wyoming); M. Ludlow (Florida Caverns State Park, Florida); T. Manasco (Alabama Natural Heritage Program, Alabama); K. Marois (Florida Natural Areas Inventory, Florida); M. Miller (Montana Natural Heritage Program, Montana); K. Morris (Maine Natural Heritage Program, Maine); K. Navo (Colorado Division
160 INFORMATION AND TECHNOLOGY REPORT–2003--0003
of Wildlife, Colorado); B. Phillips (USFS, Black Hills National Forest, South Dakota); D. Reynolds (Northeast Ecological Services); S. Schwartz (Arizona Game and Fish Department, Arizona); C. Senger (Washington); J. Sternburg (Missouri Department of Conservation, Missouri); T. Wethington (Kentucky Department of Fish and Wildlife Resources, Kentucky); and J. Whitaker (Indiana State University, Indiana). We would also like to thank P. Cryan and J. Crosby for checking the entire Bat Population Database for errors made during data compilation and entry. A special thanks also goes to B. Cade and P. Mielke, Jr. for their nonparametric statistical advice. R. Clawson, R. Currie, A. Rodriguez-Duran, R. Sherwin, and G. Wiles provided useful comments on a previous draft of this paper.
References CitedReferences CitedReferences CitedReferences CitedReferences Cited
Adam, M.D., 1992, Movements, habitat selection, and population status of the endangered Virginia big-eared bat, Plecotus townsendii virginianus, in Daniel Boone National Forest, Kentucky: M.S. thesis, University of Kentucky, Lexington, 106 p.
Adam, M.D., and Hayes, J.P., 2000, Use of bridges as night roosts by bats in the Oregon Coast range: Journal of Mammalogy, vol. 81, p. 402–407.
Adams, S.P., 1995, Status of bats in the Gypsum Hills of south-central Kansas: M.S. thesis, Fort Hayes State University, Kansas, 39 p.
Allison, V.C., 1937, Evening bat flight from Carlsbad Caverns: Journal of Mammalogy, vol. 18, p. 80–82.
Altenbach, J.S., Geluso, K.G., and Wilson, D.E., 1975, Population size of Tadarida brasiliensis at Carlsbad Caverns in 1973, in Genoways, H.H. and Baker, R.J., eds. Biological investigations in the Guadalupe Mountains National Park, National Park Service proceedings and transactions, Series Number 4: Proceedings of a symposium held at Texas Tech University, Lubbock, April 4–5, 1975, p. 341–348.
Amerson, A.B., Jr., Whistler, W.A., and Schwaner, T.D., 1982, Wildlife and wildlife habitat of American Samoa, II, accounts of flora and fauna: U.S. Fish and Wildlife Service, Washington, D.C.
Anderson, D.R., 2001, The need to get the basics right in wildlife field studies: Wildlife Society Bulletin, vol. 29, p. 1294–1297.
Anthony, E.L.P., and Kunz, T.H., 1977, Feeding strategies of the little brown bat, Myotis lucifugus, in southern New Hampshire: Ecology, vol. 58, p. 775–786.
Anthony, E.L.P., Stack, M.H., and Kunz, T.H., 1981, Night roosting and the nocturnal time budget of the little brown bat, Myotis lucifugus: Effects of
reproductive status, prey density, and environmental conditions: Oecologia, vol. 51, p. 151–156.
Arroyo-Cabrales, J., Hollander, R.R., and Jones, J.K., Jr., 1987, Choeronycteris mexicana: Mammalian Species, vol. 29, no. 1, p. 1–5.
Bagley, F.M., 1984, Recovery plan for the Ozark big-eared bat and the Virginia big-eared bat: Unpublished report to the U.S. Fish and Wildlife Service, Region 3, Twin Cities, Minn, 55 p.
Bailey, V., 1931, Mammals of New Mexico: North American Fauna, vol. 53, p. 1–412.
Bailey, V., 1933, Cave life of Kentucky: American Midland Naturalist, vol. 14, p. 386–635.
Barbour, R.W., and Davis, W.H., 1969, Bats of America: Lexington, The University Press of Kentucky, 286 p.
Barbour, R.W., and Davis, W.H., 1974. Mammals of Kentucky: Lexington, The University Press of Kentucky, 322 p.
Beatty, L.D., 1955, Autecology of the long-nose bat, Leptonycteris nivalis (Saussure). M.S. thesis: University of Arizona, Tucson, 48 p.
Beck, A., and Rudd, R.L., 1960, Nursery colonies of the pallid bat: Journal of Mammalogy, vol. 41, p. 266–267.
Belwood, J.J., 1981, Wagner’s mastiff bat, Eumops glaucinus floridanus, (Molossidae) in southwestern Florida: Journal of Mammalogy, vol. 62, p. 411–413.
Belwood, J.J., 1992, Florida mastiff bat, in Humphrey, S.R., ed., Rare and endangered biota of Florida, vol. 1, Mammals: Gainesville, University Press of Florida, p. 216–223.
Best, T.L., 1988, Morphologic variation in the spotted bat Euderma maculatum: The American Midland Naturalist, vol. 119, p. 244–252.
Best, T.L., Carey, S.D., Caesar, K.G., and Henry, T.H., 1992, Distribution and abundance of bats (Mammalia: Chiroptera) in coastal plain caves of southern Alabama: National Speleological Society Bulletin, vol. 54, p. 61–65.
Blair, W.F., 1954, Mammals of the Mesquite Plains Biotic District in Texas and Oklahoma, and speciation in the central grasslands: Texas Journal of Science, vol. 3, p. 235–264.
Bogan, M.A., O’Shea, T.J. Cryan, P.M., Ditto, A.M., Schaedla, W.H., Valdez, E.W., Castle, K.T., and Ellison, L.E., 1997, A study of bat populations at Los Alamos National Laboratory and Bandelier National Monument, Jemez Mountains, New Mexico: FY95– 97 report to Los Alamos National Laboratory and Bandelier National Monument, 76 p. + Appendices.
Bond, R.M., and Seaman, G.A., 1958, Notes on a colony of Brachyphylla cavernarum: Journal of Mammalogy, vol. 39, p. 50–151.
Borell, A.E., 1939, A colony of rare free-tailed bats: Journal of Mammalogy, vol. 20, p. 65–68.
Brack, V.W., Jr., 1983, The nonhibernating ecology of bats in Indiana with emphasis on the endangered Indiana bat, Myotis sodalis, Ph.D. dissertation: Purdue University, West Lafayette, Indiana, 279 p.
Brack, V., Jr., Wilkinson, A.M., and Mumford, R.E., 1984, Hibernacula of the endangered Indiana bat in Indiana: Proceedings of the Indiana Academy of Science, vol. 93, p. 463–468.
Brack, V., Jr., Tyrell, K., and Dunlap, K., 1991, A 1990– 1991 winter cave census for the Indiana bat (Myotis sodalis) in non-Priority I hibernacula in Indiana, unpublished report to: Indiana Department of Natural Resources, Division of Fish and Wildlife Nongame and Endangered Wildlife Program, Indianapolis, Indiana, 53 p.
Bradshaw, G.V.R., 1961, Natural history study of the California leaf-nosed bats (Macrotus californicus), Ph.D. dissertation: University of Arizona, Tucson, 89 p.
Brenner, F.J., 1968, A three-year study of two breeding colonies of the big brown bat, Eptesicus fuscus: Journal of Mammalogy, vol. 49, p. 775–778.
Brooke, A.P., Solek, C., and Tualaulelei, A., 2000, Roosting behavior of colonial and solitary flying foxes in American Samoa (Chiroptera: Pteropodidae): Biotropica, vol. 32, p. 338–350.
Bures, J.A., 1948, Mammals of a limited area in Maryland: Maryland Naturalist, vol. 18, p. 59– 72.
Campbell, L.A., Hallett, J.G., and O’Connell, M.A., 1996, Conservation of bats in managed forests, Use of roosts by Lasionycteris noctivagans: Journal of Mammalogy, vol. 77, p. 976– 984.
Carter, T.C., Menzel, M.A., and Saugey, D.A., 2003, Population trends of solitary foliage-roosting bats, in O’Shea, T.J. and Bogan, M.A., eds., Monitoring trends in bat populations of the United States and territories: problems and prospects: U.S. Geological Survey, Information and Technology Report, USGS/ BRD/ITR--2003–0003, p. 41–47.
Chapman, S.S., and Chapman, B.R., 1990, Bats from the coastal region of southern Texas: Texas Journal of Science, vol. 42, p. 13–22.
Choate, J.R., and Anderson, J.M., 1997, Bats of Jewel Cave National Monument, South Dakota: The Prairie Naturalist, vol. 29, p. 39–47.
Choate, J.R., and Decher, J., 1996, Critical habitat of the gray bat, Myotis grisescens, in Kansas, in Genoways, H.H. and Baker, R.J., eds., Contributions in mammalogy, a memorial volume honoring Dr. J. Knox Jones: The Museum of Texas Tech University, Lubbock, p. 209–216.
Clark, B.K., Clark, B.S., and Leslie, Jr., D.M., 1997a, Seasonal variation in use of caves by the endangered Ozark big-eared bat (Corynorhinus townsendii
ELLISON AND OTHERS 161
ingens) in Oklahoma: American Midland Naturalist, vol. 137, p. 388–392.
Clark, B.S., Puckette, W.L., Clark, B.K., and Leslie, Jr., D.M., 1997b, Status of the Ozark big-eared bat (Corynorhinus townsendii ingens) in Oklahoma, 1957 to 1995: Southwestern Naturalist, vol. 42, p. 20–24.
Clark, D.R., Jr., 2001, DDT and the decline of free-tailed bats (Tadarida brasiliensis) at Carlsbad Cavern, New Mexico: Archives of Environmental Contamination and Toxicology, vol. 40, p. 537–543.
Clark, Jr., D.R., Clawson, R.L., and Stafford, C.J., 1983, Gray bats killed by dieldrin at two additional Missouri caves, Aquatic macroinvertebrates found dead: Bulletin of Environmental Contamination and Toxicology, vol. 30, p. 214–218.
Clark, D.R., Jr., LaVal, R.K., and Swineford, D.M., 1978. Dieldrin-induced mortality in an endangered species, the gray bat (Myotis grisescens): Science, vol. 199, p. 1357–1359.
Clark, Jr., D.R., Bagley, F.M., and Johnson, W.W., 1988, Northern Alabama colonies of the endangered gray bat Myotis grisescens: organochlorine contamination and mortality: Biological Conservation, vol. 43, p. 213–225.
Clark, Jr., D.R., Bunck, C.M., Cromartie, E., and LaVal, R.K., 1983b, Year and age effects on residues of dieldrin and heptachlor in dead gray bats, Franklin County, Missouri, 1976, 1977, and 1978: Environmental Toxicology and Chemistry, vol. 2, p. 387–393.
Clark, M.K., 2003, Survey and monitoring of rare bats in bottomland hardwood forests, in O’Shea, T.J. and Bogan, M.A., eds., Monitoring trends in bat populations of the United States and territories: problems and prospects: U.S. Geological Survey, Information and Technology Report, USGS/BRD/ITR--2003– 0003, p. 79–90.
Clawson, R.L., 2002, The history and current status of the endangered Indiana bat, in Kurta, A. and Kennedy, J., eds., the Indiana bat: Biology and management of an endangered species: Bat Conservation International, Austin, Texas, p. 2–8.
Clem, P.D., 1992, Seasonal population variation and emergence patterns in the evening bat, Nycticeius humeralis, at a west-central Indiana colony: Proceedings of the Indiana Academy of Science, vol. 101, p. 33–44.
Clem, P.D., 1993, Foraging patterns and the use of temporary roosts in female evening bats, Nycticeius humeralis, at an Indiana maternity colony: Proceedings of the Indiana Academy of Science, vol. 102, p. 201–206.
Cockrum, E.L., 1960, Distribution, habitat and habits of the mastiff bat, Eumops perotis, in North America: Journal of Arizona Academy of Science, vol. 1, p. 79–84.
162 INFORMATION AND TECHNOLOGY REPORT–2003--0003
Cockrum, E.L., 1964, Additional records of the Mexican big-eared bat, Plecotus phyllotis (Allen) from Arizona: Journal of Mammalogy, vol. 45, p. 472–474.
Cockrum, E.L., 1969, Insecticides and Arizona bat populations: Journal of Arizona Academy of Science, vol. 5, p. 198.
Cockrum, E.L., 1970, Commentary: insecticides and guano bats: Ecology, vol. 51, p. 761–762.
Cockrum, E.L., and Ordway, E., 1959, Bats of the Chiricahua Mountains, Cochise County, Arizona, American Museum Novitates: American Museum of Natural History, 35 p.
Cockrum, E.L., and Petryszyn, Y., 1991, The long-nosed bat, Leptonycteris: an endangered species in the southwest?: Occasional Papers, The Museum Texas Tech University, vol. 142, 32 p.
Commissaris, L.R., 1959, Notes on the Yuma myotis in New Mexico: Journal of Mammalogy, vol. 40, p. 441– 442.
Commissaris, L.R., 1961, The Mexican big-eared bat in Arizona: Journal of Mammalogy, vol. 42, p. 61– 65.
Constantine, D.G., 1957, Color variation and molt in Tadarida brasiliensis and Myotis velifer: Journal of Mammalogy, vol. 38, p. 461–466.
Constantine, D.G., 1958a, Tadarida femorosacca and Tadarida molossa at Carlsbad Caverns, New Mexico: Journal of Mammalogy, vol. 39, p. 293.
Constantine, D.G., 1958b, Bleaching of hair pigment in bats by the atmosphere in caves: Journal of Mammalogy, vol. 39, p. 513–520.
Constantine, D.G., 1961, Locality records and notes on western bats: Journal of Mammalogy, vol. 42, p. 404– 405.
Constantine, D.G., 1961, Spotted bat and big free-tailed bat in northern New Mexico: Southwestern Naturalist, vol. 6, p. 92–97.
Constantine, D.G., 1967, Activity patterns of the Mexican free-tailed bat: University of New Mexico Publications in Zoology, vol. 7, p. 1–79.
Cope, J.B., and Humphrey, S.R., 1972, Reproduction of the bats Myotis keenii and Pipistrellus subflavus in Indiana: Bat Research News, vol. 13, p. 9–10.
Cox, T.J., 1965, Behavior of the mastiff bat: Journal of Mammalogy, vol. 46, p. 687–688.
Craig, P., and Syron, W., 1992, Fruit bats in American Samoa, their status and future, in Wilson, D.E. and Graham, G.L., eds., Pacific flying foxes, Proceedings of an International Conservation Conference: U.S. Fish and Wildlife Service Biological Report 90, p. 145–149.
Craig, P., Trail, P., and Morrell, T.E., 1994, The decline of fruit bats in American Samoa due to hurricanes
and overhunting: Biological Conservation, vol. 69, p. 261–266.
Cross, S., 1965, Roosting habits of Pipistrellus hesperus: Journal of Mammalogy, vol. 46, pp. 270–279.
Cryan, P.M., 2003, Seasonal distribution of migratory tree bats (Lasiurus and Lasionycteris): Journal of Mammalogy, vol. 84, p. 579–593.
Cryan, P.M., and Bogan, M.A., 2003, Recurrence of the Mexican long-tongued bat (Choeronycteris mexicana) at historical sites in Arizona and New Mexico: Western North American Naturalist, vol. 63, p. 314–319.
Cryan, P., Bogan, M.A., and Yanega, G.M., 2001, Roosting habits of four bat species in the Black Hills of South Dakota: Acta Chiropterologica, vol. 3, p. 43–52.
Dalquest, W.W., 1946, The daytime retreat of a California mastiff bat: Journal of Mammalogy, vol. 27, p. 86–88.
Dalquest, W.W., 1947, Notes on the natural history of the bat, Myotis yumanensis, in California, with a description of a new race: American Midland Naturalist, vol. 38, p. 224–247.
Dalquest, W.W., and Ramage, M.C., 1946, Notes on the long-legged bat (Myotis volans) at Old Fort Tejon and vicinity, California: Journal of Mammalogy, vol. 27, p. 60–63.
Dalton, V.M., and Dalton, D.C., 1994, Census protocol for the long-nosed bat (Leptonycteris curasoae) at Copper Mountain Mine, unpublished report submitted to Organ Pipe Cactus National Monument, Contract Order 1443PX866092081, 20 p.
Davis, R., 1966, Homing performance and homing ability in bats: Ecological Monographs, vol. 36, p. 201–237.
Davis, W.B., 1960, The mammals of Texas: Game and Fish Commission, Bulletin No. 41, Austin, 252 p.
Davis, W.B., and Schmidly, D.J., 1994, The mammals of Texas: Austin, Texas Parks and Wildlife Press, 338 p.
Davis, W.H., 1957, Population dynamics and taxonomy of the bat Pipistrellus subflavus, Ph.D. dissertation: University of Illinois, Urbana. 87 p.
Davis, W.H., 1959, Disproportionate sex ratios in hibernating bats: Journal of Mammalogy, vol. 40, p. 16–19.
Davis, W.H., 1966, Population dynamics of the bat Pipistrellus subflavus: Journal of Mammalogy, vol. 47, p. 383–396.
Dellinger, S.C., and Black, J.D., 1940, Notes on Arkansas mammals: Journal of Mammalogy, vol. 21, p. 187–191.
Dice, L.R., 1919, The mammals of southeastern Washington: Journal of Mammalogy, vol. 1, p. 10–21.
Doering, R.W., 1996, Thermal implications of roost site selection in hibernating Plecotus townsendii, M.S. thesis: Idaho State University, Pocatello, 110 p.
Dunnigan, P.B., and Fitch, J.H., 1967, Seasonal movements and population fluctuations of the cave bat (Myotis velifer) in south-central Kansas: Transactions of the Kansas Academy of Science, vol. 70, p. 210– 218.
Easterla, D.A., 1966, Yuma myotis and fringed myotis in southern Utah: Journal of Mammalogy, vol. 47, p. 350–351.
Easterla, D.A., 1972, Status of Leptonycteris nivalis (Phyllostomatidae) in Big Bend National Park, Texas: Southwestern Naturalist, vol. 17, p. 287–292.
Easterla, D.A., 1973, Ecology of the 18 species of Chiroptera at Big Bend National Park, Texas: Northwest Missouri State University Studies, vol. 34, p. 1– 165.
Elder, W.H., and Gunier, W.J., 1981, Dynamics of a gray bat population (Myotis grisescens) in Missouri: American Midland Naturalist, vol. 105, p. 193–195.
Ellinwood, S.R., 1978, A survey of bats in southeast Colorado, M.S. thesis: University of Northern Colorado, Greeley, 77 p.
Fleming, T.H., Tibbitts, T., Petryszyn, Y., and Dalton, V., 2003, Current status of pollinating bats in the southwestern North America, in O’Shea, T.J. and Bogan, M.A., eds., Monitoring trends in bat populations of the United States and territories: problems and prospects: U.S. Geological Survey, Information and Technology Report, USGS/BRD/ITR--2003– 0003, p. 63–68.
Frank, P.A., 1997, First record of Molossus molossus tropidorhynchus Gray (1839) from the United States: Journal of Mammalogy, vol. 78, p. 103–105.
Freeman, J., and Wunder, L., 1988, Observations at a colony of the Brazilian free-tailed bat (Tadarida brasiliensis) in southern Colorado: Southwestern Naturalist, vol. 33, p. 102–104.
Gannon, M.R., 1991, Foraging ecology, reproductive biology, and systematics of the red fig-eating bat (Stenoderma rufum) in the Tabonuco Rain Forest of Puerto Rico, Ph.D. thesis: Texas Tech University, Lubbock, 189 p.
Gannon, M.R., and Willig, M.R., 1994, The effects of Hurricane Hugo on bats of the Luquillo Experimental Forest of Puerto Rico: Biotropica, vol. 26, p. 320– 331.
Gardner, J.E., Garner, J.D., and Hofmann, J.E., 1990, 1989 and 1990 investigations of Myotis sodalis (Indiana bat) distribution, habitat use, and status in Illinois, combined progress reports: Illinois Natural History Survey, 19 p.
Gates, J.E., Feldhamer, G.A., Griffith, L.A., and Raesly, R.L., 1984, Status of cave-dwelling bats in Maryland,
ELLISON AND OTHERS 163
importance of marginal habitats: Wildlife Society Bulletin, vol. 12, p. 162–169.
Geluso, K.N., Altenbach, J.S., and Wilson, D.E., 1976, Bat mortality, pesticide poisoning and migratory stress: Science, 194, p. 184–186.
Genoways, H.H., Baker, R.J., and Cornely, J.E., 1979, Mammals of the Guadalupe Mountains National Park, Texas, in Genoways, H.H. and Baker, R.J., eds., Biological investigations in the Guadalupe Mountains National Park, Texas, National Park Service: Proceedings and Transactions Series, vol. 4, p. 271–332.
Genter, D.L., 1986, Wintering bats of the upper Snake River plain, occurrence in lava-tube caves: Great Basin Naturalist, vol. 46, p. 241–244.
Gifford, C.E., and Griffin, D., 1960, Notes on homing and migration behavior of bats: Ecology, vol. 41, p. 378–381.
Glass, P.O., and Taisacan, E., 1988, Marianas fruit bat surveys and research, in Division of Fish and Wildlife, Five-year Progress Report (Fiscal Years 1983– 1987): Pittman-Robertson Federal Aid in Wildlife Restoration Program, Saipan, Commonwealth of the Northern Mariana Islands, p. 1–22.
Goehring, H.H., 1954, Pipistrellus subflavus obscurus, Myotis keenii, and Eptesicus fuscus fuscus hibernating in a storm sewer in central Minnesota: Journal of Mammalogy, vol. 35, p. 434–435.
Goehring, H.H., 1958, A six year study of big brown bat survival: Proceedings of the Minnesota Academy of Science, vol. 26, p. 222–224.
Goehring, H.H., 1972, Twenty-year study of Eptesicus fuscus in Minnesota: Journal of Mammalogy, vol. 53, p. 201–207.
Gore, J.A., and Hovis, J.A., 1994, Southeastern myotis maternity cave survey, Florida Game and Fresh Water Fish Commission Nongame Wildlife Program Final Performance Report: Florida Game and Fresh Water Fish Commission Nongame Wildlife Program, 33 p.
Gould, P.J., 1959, Emergence time of Tadarida in relation to light intensity: Journal of Mammalogy, 42, p. 405–407.
Grant, G.S., Banack, S.A., and Trail, P., 1994, Decline of the sheath-tailed bat Emballonura semicaudata (Chiroptera: Emballonuridae) on American Samoa: Micronesia, vol. 27, p. 133–137.
Grant, G.S., Craig, P., and Trail, P., 1997, Cyclone-induced shift in foraging behavior in flying foxes in American Samoa: Biotropica, vol. 29, p. 224–228.
Griffin, D.R., 1940, Notes on the life histories of New England cave bats: Journal of Mammalogy, vol. 21, p. 181–187.
164 INFORMATION AND TECHNOLOGY REPORT–2003--0003
Grigsby, E.M., and Puckette, W.L., 1982, A study of three species of endangered bats occurring in Oklahoma: U.S. Fish and Wildlife Contract Number 14-16-000281-202, 99 p.
Hall, J.S., 1962, A life history and taxonomic study of the Indiana bat, Myotis sodalis: Reading Public Museum and Art Gallery Bulletin, vol. 12, p. 1–68.
Hall, J.S., and Blewett, C., 1964, Bat remains in owl pellets from Missouri: Journal of Mammalogy, vol. 45, p. 303–304.
Hall, J.S., and Brenner, F.J., 1968, Summer netting of bats at a cave in Pennsylvania: Journal of Mammalogy, vol. 49, p. 779–781.
Hall, J.S., and Wilson, N., 1966, Seasonal populations and movements of gray bats in the Kentucky area: American Midland Naturalist, vol. 75, p. 317–324.
Hall, J.S., Cloutier, R.L., and Griffin, D.R., 1957, Longevity records and notes on tooth wear of bats: Journal of Mammalogy, vol. 38, p. 407–409.
Handley, C.O., Jr., 1959, A revision of American bats of the genera Euderma and Plecotus: Proceedings of the U.S. National Museum, vol. 110, p. 95–246.
Hardin, J.W., 1967, Waking periods and movement of Myotis sodalis during the hibernation season: M.S. thesis, University of Kentucky, Lexington, 31 p.
Hardin, J.W., and Hassell, M.D., 1970, Observations on waking periods and movements of Myotis sodalis during hibernation: Journal of Mammalogy, vol. 51, p. 829–831.
Hardy, R., 1941, Some notes on Utah bats: Journal of Mammalogy, vol. 22, p. 289–295.
Hardy, R., 1949, Notes on mammals from Arizona, Nevada, and Utah: Journal of Mammalogy, vol. 30, p. 434–435.
Harvey, M.J., 1979, Distribution, status, and ecology of endangered bats of Buffalo National River, Arkansas: Proceedings of the 2nd Conference on Scientific Research in National Parks, vol. 2, p. 76–84.
Harvey, M.J., 1989, Endangered bats of Arkansas, monitoring populations and status at major hibernacula and summer caves (1984–1989): Final report to the Arkansas Game and Fish Commission, Project Number W-56-R, 52 p.
Harvey, M.J., 1992, Bats of the eastern United States: Arkansas Game and Fish Commission, Little Rock, 45 p.
Harvey, M.J., Cassidy, J.J., and O’Hagan, G.G., 1981, Endangered bats of Arkansas, distribution, status, ecology, and management, Report to the Arkansas Game and Fish Commission: U.S. Forest Service, Ozark National Forest, National Park Service, Buffalo National River, 137+ p.
Hasenyager, R.N., 1980, Bats of Utah: Utah State Division of Wildlife Resources, Publication Number 8015, 109 p.
Hassell, M.D., 1963, A study of homing in the Indiana bat, Myotis sodalis: Transactions of the Kentucky Academy of Science, vol. 24, p. 1–4.
Hays, H.A., and Bingman, D.C., 1964, A colony of gray bats in southeastern Kansas: Journal of Mammalogy, vol. 45, p. 150.
Hays, H.A., Barker, J.L., Grigsby, E.M., and Kunz, T.H., 1983, A report on the gray myotis (Myotis grisescens) in the storm sewers of Pittsburgh, Kansas: Bat Research News, vol. 24, p. 22–23.
Henry, T.H., 1998, Results of population surveys of the gray bat (Myotis grisescens) at selected caves in the Tennessee River Valley during 1997 and 1998 with results of additional project related surveys in the TVA Power Service Area: TVA Regional Natural Heritage Program Monitoring Report #001, Norris, TN, 35 p.
Herreid, C.F., 1961, Notes on the pallid bat in Texas: Southwestern Naturalist, vol. 6, p. 13–20.
Hirshfeld, J.R., Nelson, Z.C., and Bradley, W.G., 1977, Night roosting behavior in four species of desert bats: Southwestern Naturalist, vol. 22, p. 427–433.
Hoffmeister, D.F., 1986, Mammals of Arizona: University of Arizona Press, Tucson, 602 p.
Hoffmeister, D.F., 1989., Mammals of Illinois: Museum of Natural History, University of Illinois, Chicago, 339 p.
Howell, A.B., 1920,. Contributions to the life-history of the California mastiff bat: Journal of Mammalogy, vol. 1, p. 111–117.
Huey, L., 1954, Choeronycteris mexicana from southern California and Baja California, Mexico: Journal of Mammalogy, vol. 35, p. 436.
Humphrey, S., 1978, Status, winter habitat, and management of the endangered Indiana bat, Myotis sodalis: Florida Scientist, vol. 41, p. 65–76.
Humphrey, S., and Cope, J.B., 1963, Movements of Myotis lucifugus lucifugus from a colony in Boone County, Indiana: Proceedings of the Indiana Academy of Science, vol. 73, p. 268–271.
Humphrey, S.R., and Gore, J.A., 1992, Southeastern brown bat, in Humphrey, S.R., ed., Rare and endangered biota of Florida, vol. 1, mammals: University Press of Florida, Gainesville, p. 335–342.
Humphrey, S.R., and Kunz, T.H., 1976, Ecology of a Pleistocene relict, the western big-eared bat (Plecotus townsendii), in the southern Great Plains: Journal of Mammalogy, vol. 57, p. 470–494.
Hurst, T.E., 1997, Foraging area, habitat use, population estimates and food habits of Rafinesque’s big
ELLISON AND OTHERS 165
eared bat in southeastern Kentucky, M.S. thesis: University of Kentucky, Lexington, 112 p.
Hurst, T.E., and Lacki, M.J., 1999, Roost selection, population size, and habitat use by a colony of Rafinesque’s big-eared bats (Corynorhinus rafinesquii): American Midland Naturalist, vol. 142, p. 363–371.
Jagnow, D.H., 1998, Bat usage and cave management of Torgac Cave, New Mexico: Journal of Cave and Karst Studies, vol. 60, p. 33–38.
Jennings, W. L., and Layne, J.N., 1957, Myotis sodalis in Florida: Journal of Mammalogy, vol. 38, p. 259.
Jones, C., Hoffmann, R.S., Rice, D.W., Baker, R.J., Engstrom, M.D., Bradley, R.D., Schmidly, D.J., and Jones, C.A., 1997, Revised checklist of North American mammals north of Mexico: Occasional Papers, Museum of Texas Tech University, vol. 173, p. 1–19.
Jones, J.K., Jr., and Genoways, H.H., 1967, Annotated checklist of bats from South Dakota: Transactions of the Kansas Academy of Science, vol. 70, p. 184–196.
Jones, K.E., Barlow, K.E., Vaughan, N., Rodriguez-Duran, A., and Gannon, M. R., 2001, Short-term impacts of extreme environmental disturbance on the bats of Puerto Rico: Animal Conservation, vol. 4, p. 59–66.
Kendall, M., and Gibbons, J.D., 1990, Rank correlation methods, fifth edition, New York, New York, Oxford University Press, 260 p.
Kirkpatrick, C.M., and Conaway, C.H., 1948, Some notes on Indiana mammals: American Midland Naturalist, vol. 39, p. 128–136.
Knowles, W.C., 1988, The status of the wildlife and wildlife habitats in American Samoa, annual report: Department of Marine and Wildlife Resources, American Samoa.
Koford, C.B., and Koford, M.R., 1948, Breeding colonies of bats, Pipistrellus hesperus and Myotis subulatus melanorhinus: Journal of Mammalogy, vol. 29, p. 417–418.
Koopman, K.F., 1989, A review and analysis of the bats of the West Indies, in Woods, C.A., ed., Biogeography of the West Indies, Past, present, and future: Gainesville, Fla, Sandhill Crane Press, Inc., p. 635–644.
Krueger, S., and O’Daniel, D., 1999, Observations of Mariana fruit bats on Tinian: Micronesia, vol. 31, p. 367–371.
Krutzsch, P.H., 1944a, Notes on the little known pocketed bat: Journal of Mammalogy, vol. 25, p. 201.
Krutzsch, P.H., 1944b, California lyre snake feeding on the pocketed bat: Journal of Mammalogy, vol. 25, p. 410–411.
Krutzsch, P.H., 1944c, Fourth record of the pocketed bat in California: Journal of Mammalogy, vol. 25, p. 413–414.
Krutzsch, P.H., 1954, Notes on the habits of the bat, Myotis californicus: Journal of Mammalogy, vol. 35, p. 539–545.
Krutzsch, P.H., 1966, Remarks on silver-haired and Leib’s bats in eastern United States: Journal of Mammalogy, vol. 47, p. 121.
Kunz, T.H., and Anthony, E.L.P., 1996, Variation in the timing of nightly emergence behavior in the little brown bat, Myotis lucifugus (Chiroptera: Vespertilionidae), in Genoways, H.H. and Baker, R.J., eds., Contributions in mammalogy, A memorial volume honoring Dr. J. Knox Jones: The Museum of Texas Tech University, Lubbock, p. 225–235.
Kurta, A., and Kennedy, J., eds., 2002, The Indiana bat, biology and management of an endangered species: Bat Conservation International, Austin, Texas.
Lacki, M. J., 1994, Metal concentrations in guano from a gray bat summer roost: Transactions of the Kentucky Academy of Science, vol. 55, p. 124–126.
Lacki, M.J., Adam, M.D., and Shoemaker, L.G., 1993, Characteristics of feeding roosts of Virginia big-eared bats in Daniel Boone National Forest: Journal of Wildlife Management, vol. 57, p. 539–543.
Lacki, M.J., Adam, M.D., and Shoemaker, L.G., 1994, Observations on seasonal cycle, population patterns and roost selection in summer colonies of Plecotus townsendii virginianus in Kentucky, American Midland Naturalist, vol. 131, p. 34–42.
LaVal, R.K., 1973, Occurrence, ecological distribution, and relative abundance of bats in McKittrick Canyon, Culberson County, Texas: Southwestern Naturalist, vol. 17, p. 357–364.
Lemke, T.O., 1986, Distribution and status of the sheath-tailed bat (Emballonura semicaudata) in the Mariana Islands: Journal of Mammalogy, vol. 67, p. 743–746.
Lemke, T.O., 1992, History of fruit bat use, research, and protection in the Northern Mariana Islands, in Wilson, D.E., and Graham, G.L., eds., Pacific flying foxes: Proceedings of an International Conservation Conference, U.S. Fish and Wildlife Service Biological Report 90, p. 135–141.
Lewis, S.E., 1995, Roost fidelity of bats, a review: Journal of Mammalogy, vol. 76, p. 481–496.
MacGregor, J.R., and Westerman, A.G., 1982, Observations on an active maternity site for the gray bat in Jessamine County, Kentucky: Transactions of the Kentucky Academy of Science, vol. 43, p. 136–137.
Marcot, B.G., 1984, Winter use of some northwestern California caves by western big-eared bats and long-eared myotis: Murrelet, vol. 35, p. 45.
Martin, R.A., and Hawks, B.G., 1972, Hibernating bats of the Black Hills of South Dakota, I. Distribution
166 INFORMATION AND TECHNOLOGY REPORT–2003--0003
and habitat selection: Bulletin of the New Jersey Academy of Sciences, vol. 17, p. 24–30.
Martin, R.L., Pawluk, J.T., and Clancy, T.B., 1966, Observations on hibernation of Myotis subulatus: Journal of Mammalogy, vol. 47, p. 348–349.
Mattson, T.A., 1994, The distribution of bats and the roosting ecology of the silver-haired bat (Lasionycteris noctivagans) in the Black Hills of South Dakota: M.S. thesis, University of Wyoming, Laramie, 60 p.
Mattson, T.A., Buskirk, S.W., and Stanton, N.L., 1996, Roost sites of the silver-haired bat (Lasionycteris noctivagans) in the Black Hills, South Dakota: Great Basin Naturalist, vol. 56, p. 247–253.
McCracken, G.F., 2003, Estimates of population sizes in summer colonies of Brazilian free-tailed bats (Tadarida brasiliensis), in O’Shea, T.J. and Bogan, M.A., eds., Monitoring trends in bat populations of the United States and territories: problems and prospects: U.S. Geological Survey, Information and Technology Report, USGS/BRD/ITR--2003–0003, p. 21–30.
McDaniel, V.R., Harvey, M.J., Tumlison, R., and Paige, K.N., 1982, Status of the small-footed bat, Myotis leibii leibii, in the southern Ozarks: Arkansas Academy of Science Proceedings, vol. 36, p. 92–94.
McManus, J.J., 1974, Activity and thermal preference of the little brown bat, Myotis lucifugus, during hibernation: Journal of Mammalogy, vol. 55, p. 844–846.
McManus, J.J., and Esher, R.J., 1971, Notes on the biology of the little brown bat, Myotis lucifugus, hibernating in New Jersey: Bulletin of the New Jersey Academy of Sciences, vol. 16, p. 19–24.
Meacham, J., 1974, A Colorado colony of Tadarida brasiliensis: Bat Research News, vol. 14, p. 8.
Meade, L., 1992, New distributional records for selected species of Kentucky mammals: Transactions of the Kentucky Academy of Science, vol. 53, p. 127–132.
Mearns, E.A., 1900, On the occurrence of a bat of the genus Mormoops in the United States: Proceedings of the Biological Society of Washington, vol. 13, p. 166.
Mitchell, R.W., 1970, Total number and density estimates of some species of cavernicoles inhabiting Fern Cave, Texas: Annals of Speleology, vol. 25, p. 73–90.
Mohr, C.E., 1932a, Myotis subulatus leibii and Myotis sodalis in Pennsylvania: Journal of Mammalogy, vol. 13, p. 160–161.
Mohr, C.E., 1932b, The seasonal distribution of bats in Pennsylvania: Proceedings of the Pennsylvania Academy of Science, vol. 6, p. 189–194.
Mohr, C.E., 1933a, Pennsylvania bats of the genus Myotis: Proceedings of the Pennsylvania Academy of Science, vol. 7, p. 39–43.
Mohr, C.E., 1933b, Observations on the young of cave-dwelling bats: Journal of Mammalogy, vol. 14, p. 49– 53.
Mohr, C.E., 1945, Sex ratios of bats in Pennsylvania: Proceedings of the Pennsylvania Academy of Science, vol. 19, p. 65–69.
Mumford, R.E., 1969, Distribution of the mammals of Indiana: Indiana Academy of Science, Indianapolis, 114 p.
Mumford, R.E., and Whitaker, Jr., J.O., 1975, Seasonal activity of bats at an Indiana cave: Proceedings of the Indiana Academy of Science, vol. 84, p. 500–507.
Mumford, R.E., and Whitaker, Jr., J.O., 1982, Mammals of Indiana: Bloomington, Indiana University Press, 537 p.
Myers, R.F., 1964a, Ecology of three species of myotine bats in the Ozark Plateau: Ph.D. dissertation, University of Missouri, Columbia, 209 p.
Myers, R.F., 1964b, Myotis grisescens from eastern Kansas: Journal of Mammalogy, vol. 45, p. 650.
Nellis, D.W., and Ehle, C.P., 1977, Observations on the behavior of Brachyphylla cavernarum (Chiroptera) in the Virgin Islands: Mammalia, vol. 41, p. 403–409.
Ohlendorf, H.M., 1972, Observations on a colony of Eumops perotis (Molossidae): Southwestern Naturalist, vol. 17, p. 297–300.
Olson, A.C., Jr. 1947. First record of Choeronycteris mexicana in California: Journal of Mammalogy, vol. 28, p. 183–184.
O’Shea, T.J., and Vaughan, T.A., 1999, Population changes in bats from central Arizona, 1972 and 1997: Southwestern Naturalist, vol. 44, p. 495–500.
Pearson, O.P., Koford, M.R., and Pearson, A.K., 1952, Reproduction of the lump-nosed bat (Corynorhinus rafinesquii) in California: Journal of Mammalogy, vol. 33, p. 273–320.
Perkins, J.M., Barss, J.M., and Peterson, J., 1990, Winter records of bats in Oregon and Washington: Northwestern Naturalist, vol. 71, p. 59–62.
Petryszyn, Y., Russ, S., and Pate, A., 1997, Mastiff bat use of Quitobaquito Pond, Organ Pipe Cactus National Monument, Arizona, abstract: Twenty-seventh annual North American Symposium on Bat Research, Tucson, Arizona.
Pierson, E.D., 1989, Help for Townsend’s big-eared bat in California: Bats, vol. 7, p. 5–8.
Pierson, E.D., and Rainey, W.E., 1998a, Distribution, status, and management of Townsend’s big-eared bat (Corynorhinus townsendii) in California, final report, Contract FG7129, BMCP Technical Report 96-7 (updated may 1998): California Department of Fish and Game, Bird and Mammal Conservation Program, Sacramento, 34 p.
Pierson, E.D., and Rainey, W.E., 1998b, Distribution, habitat associations, status, and survey methodologies for three molossid bat species (Eumops perotis, Nyctinomops femorosaccus, Nyctinomops macrotis) and the Vespertilionid (Euderma maculatum), final report, Contract FG2328WM: California Department of Fish and Game, Bird and Mammal Conservation Program, Sacramento, 61 p.
Pierson, E.D., and Rainey, W.E., 1998c, Distribution of the spotted bat, Euderma maculatum, in California: Journal of Mammalogy, vol. 79, p. 1296–1305.
Pierson, E.D., Rainey, W.E., and Koontz, D.M., 1991, Bats and mines, experimental mitigation for Townsend’s big-eared bat at the McLaughlin Mine in California, in Issues and technology in the management of impacted wildlife: Proceedings, Thorne Ecological Institute, Snowmass, Colorado, April 8– 10, 1991, p. 31–42.
Pierson, E.D., Elmqvist, T., Rainey, W.E., and Cox, P.A., 1996, Effects of tropical cyclonic storms on flying fox populations on the South Pacific Islands of Samoa: Conservation Biology, vol. 10, p. 438–451.
Pierson, E.D., Wackenhut, M.C., Altenbach, J.S., Bradley, P., Call, P., Genter, D.L., Harris, C.E., Keller, B.L., Lengus, B., Lewis, L., Luce, B., Navo, K.W., Perkins, J.M., Smith, S., and Welch, L., 1999, Species conservation assessment and strategy for Townsend’s big-eared bat (Corynorhinus townsendii townsendii and Corynorhinus townsendii pallescens): Idaho Conservation Effort, Idaho Department of Fish and Game, Boise, 68 p.
Priday, J., and Luce, B., 1996, Inventory of bats and bat habitat associated with caves and mines in Wyoming – completion report, in Endangered and nongame bird and mammal investigations - annual completion report: Nongame Program, Wyoming Game and Fish Department, Cheyenne, p. 67–116.
Rabe, M.J., Morrell, T.E., Green, H., deVos, Jr., J.C., and Miller, C.R., 1998, Characteristics of ponderosa pine snag roosts used by reproductive bats in northern Arizona: Journal of Wildlife Management, vol. 62, p. 612–621.
Rabinowitz, A., and Tuttle, M.D., 1980, Status of summer colonies of the endangered gray bat in Kentucky: Journal of Wildlife Management, 44, p. 955–960.
Raun, G.G., and Baker, J.K., 1958, Some observations of Texas cave bats: Southwestern Naturalist, vol. 3, p. 102–106.
Reddell, J.R., ed., 1967, The caves of Medina County: Texas Speleological Survey, vol. 3, p. 1–58.
Reddell, J.R., 1968, The hairy-legged vampire, Diphylla ecaudata, in Texas: Journal of Mammalogy, vol. 49, p. 769.
ELLISON AND OTHERS 167
Reidinger, R.F., Jr., 1972, Factors influencing Arizona bat population levels, Ph.D. dissertation: University of Arizona, Tucson, 172 p.
Reidinger, R.F., and Cockrum, E.L., 1978, Organochlorine residues in free-tailed bats Tadarida brasiliensis) at Eagle Creek Cave, Greenlee County, Arizona, in Olembo, R.J., Castelino, J.B., Mutere, K.A., eds.: Proceedings of the Fourth International Bat Research Conference, Kenya Literature Bureau, Nairobi, p. 85– 96.
Rice, D.W., 1955a, Life history and ecology of Myotis austroriparius: M.S. thesis, University of Florida, Gainesville, 74 p.
Rice, D.W., 1955b, Myotis keenii in Florida: Journal of Mammalogy, vol. 36, p. 567.
Rice, D.W., 1957, Life history and ecology of Myotis austroriparius in Florida: Journal of Mammalogy, vol. 38, p. 15–32.
Richter, A.R., Seerley, D.A., Cope, J.B., and Keith, J.H., 1978, A newly discovered concentration of hibernating Indiana bats, Myotis sodalis, in southern Indiana: Journal of Mammalogy, vol. 59, p. 191.
Richter, A.R., Humphrey, S.R., Cope, J.B., and Brack, Jr., V., 1993, Modified cave entrances, thermal effect on body mass and resulting decline of endangered Indiana bats (Myotis sodalis): Conservation Biology, vol. 7, p. 407–415.
Rippy, C.L., and Harvey, M.J., 1965, Notes on Plecotus townsendii virginianus in Kentucky: Journal of Mammalogy, vol. 46, p. 499.
Rodriguez-Duran, A., 1998, Nonrandom aggregations and distribution of cave-dwelling bats in Puerto Rico: Journal of Mammalogy, vol. 79, p. 141–146.
Rodriguez-Duran, A., and Lewis, A.R., 1985, Seasonal predation by merlins on sooty mustached bats in western Puerto Rico: Biotropica, vol. 17, p. 71–74.
Rodriguez-Duran, A., and Lewis, A.R., 1987, Patterns of population size, diet, and activity time for a multispecies assemblage of bats at a cave in Puerto Rico: Caribbean Journal of Science, vol. 23, p. 352– 360.
Rodriguez-Duran, A., and Vazquez, R., 2001, The bat Artibeus jamaicensis in Puerto Rico (West Indies), seasonality of diet, activity, and effect of a hurricane, Acta Chiropterologica, vol. 3, p. 53–61.
Safford, M., 1989, Bat population study Fort Stanton Cave: National Speleological Society Bulletin, vol. 51, p. 42–46.
SAS software, Version 8.02 of the SAS System for Windows. Copyright 1999–2001: SAS Institute Inc., Cary, North Carolina, USA.
Sauer, J.R., 2003, A critical look at national monitoring programs for birds and other wildlife species, in
168 INFORMATION AND TECHNOLOGY REPORT–2003--0003
O’Shea, T.J. and Bogan, M.A., eds., Monitoring trends in bat populations of the United States and territories: problems and prospects: U.S. Geological Survey, Information and Technology Report, USGS/ BRD/ITR--2003–0003, 264 p.
Saugey, D.A., 1978, Reproductive biology of the gray bat, Myotis grisescens, in northcentral Arkansas: M.S. thesis, Arkansas State University, Jonesboro, 93 p.
Saugey, D.A., Heidt, G.A., and Heath, D.R., 1988, Utilization of abandoned mine drifts and fracture caves by bats and salamanders, unique subterranean habitat in the Ouachita Mountains, in Szaro, R.C., Severson, K.E., and Patton, D.R., tech. coord., management of amphibians, reptiles, and small mammals in North America, Proceedings of the symposium, July 19–21, Flagstaff, Arizona: U.S. Department of Agriculture, Forest Service, Rocky Mountain Forest and Range Experiment Station, Fort Collins, Colorado, p. 64–71.
Schmidly, D.J., 1991, The bats of Texas: Texas A&M University Press, College Station, 188 p.
Schwartz, A., 1952, The land mammals of southern Florida and the upper Florida Keys, Ph.D. dissertation, University of Michigan, Ann Harbor, 180 p.
Sealander, J.A., and Heidt, G.A., 1990, Arkansas mammals, their natural history, classification, and distribution: University of Arkansas Press, Fayetteville, 308 p.
Sealander, J.A., and Young, H., 1955, Preliminary observations on the cave bats of Arkansas: Proceedings of the Arkansas Academy of Science, vol. 7, p. 21–31.
Senger, C., Senger, R., Senger, D., and Senger, S., 1974, Winter records of myotid bats in western Washington: Murrelet, vol. 55, p. 13–14.
Sherwin, R.E., Gannon, W.L., and Altenbach, J.S., 2003, Managing complex systems simply: understanding inherent variation in the use of roosts by Townsend’s big-eared bat: Wildlife Society Bulletin, vol. 31, p. 62–72.
Sidner, R., and Davis, R., 1988, Records of nectar-feeding bats in Arizona: Southwestern Naturalist, vol. 33, p. 493–495.
Spencer, S.G., Coucair, P.C., and Chapman, B.R., 1988, Northward expansion of the range of the southern yellow bat, Lasiurus ega, in Texas: Southwestern Naturalist, vol. 33, p. 493.
Stager, K.E., 1943, Notes on the roosting place of Pipistrellus hesperus: Journal of Mammalogy, vol. 24, p. 266–267.
Stevenson, D. E., and Tuttle, M. D., 1981, Survivorship in the endangered gray bat (Myotis grisescens): Journal of Mammalogy, vol. 62, p. 244–257.
Stihler, C.W., and Brack, Jr., V., 1992, A survey of hibernating bats in Hellhole Cave, Pendleton County,
West Virg.: Proceedings of the West Virginia Academy of Science, vol. 64, p. 97–103.
Stinson, D.W., Glass, P.O., and Taisacan, E.M., 1992, Declines and trade in fruit bats on Saipan, Tinian, Aguijan, and Rota, in Wilson, D.E. and Graham, G.L., eds, Pacific flying foxes: Proceedings of an International Conservation Conference, U.S. Fish and Wildlife Service Biological Report 90, p. 61–67.
Svoboda, P.L., 1984, Natural history and geographic relationships of the Brazilian free-tailed bat in the San Luis Valley of Colorado: M.S. thesis, Fort Hays State University, Kansas, 75 p.
Svoboda, P.L., and Choate, J.R., 1987, Natural history of the Brazilian free-tailed bat in the San Luis Valley of Colorado: Journal of Mammalogy, vol. 68, p. 224–234.
Swenson, J.E., and Shanks, Jr., G.F., 1979, Noteworthy records of bats from northeastern Montana: Journal of Mammalogy, 60, p. 650–652.
Thies, M., and Gregory, D., 1994, Residues of lead, cadmium, and arsenic in livers of Mexican free-tailed bats: Bulletin of Environmental Contamination and Toxicology, vol. 52, p. 641–648.
Thies, M.L., Thies, K., and McBee, K., 1996, Organochlorine pesticide accumulation and genotoxicity in Mexican free-tailed bats from Oklahoma and New Mexico: Archives of Environmental Contamination and Toxicology, vol. 30, p. 178–187.
Thompson, W.L., White, G.C., and Gowan, C., 1998, Monitoring vertebrate populations: San Diego, California, Academic Press, 365 p.
Tinkle, D.W., and Patterson, I.G., 1965, A study of hibernating populations of Myotis velifer in northwestern Texas: Journal of Mammalogy, vol. 46, p. 612–633.
Tinkle, D.W., and Milstead, W.W., 1960, Sex ratios and population density in hibernating Myotis: American Midland Naturalist, vol. 63, p. 327–334.
Turner, R.W., 1974, Mammals of the Black Hills of South Dakota and Wyoming: University of Kansas Museum of Natural History, Miscellaneous Publication, vol. 60, p. 1–178.
Turner, R.W., and Davis, W.H., 1970, Bats from the Black Hills of South Dakota: Transactions of the Kansas Academy of Science, vol. 72, p. 360–364.
Turner, R.W., and Jones, J.K., 1968, Additional notes on bats from western South Dakota: Southwestern Naturalist, vol. 13, p. 444–448.
Tuttle, M.D., 1964, Myotis subulatus in Tennessee: Journal of Mammalogy, vol. 45, p. 148–149.
Tuttle, M.D., 1979, Status, causes of decline, and management of endangered gray bats: Journal of Wildlife Management, vol. 43, p. 1–17.
Tuttle, M.D., 1986, Endangered gray bat benefits from protection, Bats, vol. 4, p. 1–3.
Tuttle, M.D., 2003, Estimating population sizes of hibernating bats in caves and mines, in O’Shea, T.J. and Bogan, M.A., eds., Monitoring trends in bat populations of the United States and territories: problems and prospects: U.S. Geological Survey, Information and Technology Report, USGS/BRD/ ITR--2003–0003, p. 31–39.
Ubelaker, J.E., 1966, Parasites of the gray bat, Myotis grisescens, in Kansas: American Midland Naturalist, vol. 75, p. 199–204.
U.S. Fish and Wildlife Service, 1970, Conservation of endangered species and other fish or wildlife: Federal Register, vol. 35, p. 16047–16048.
U.S. Fish and Wildlife Service, 1976, Determination that two species of butterflies are threatened species and two species of mammals are endangered species: Federal Register, vol. 41, p. 17736–17740.
U.S. Fish and Wildlife Service, 1979, Listing of Virginia and Ozark big-eared bats as endangered species and critical habitat determination: Federal Register, vol. 44, p. 69206–69208.
U.S. Fish and Wildlife Service, 1982, Gray bat recovery plan: Region 3, U.S. Fish and Wildlife Service, Bethesda, Maryland.
U.S. Fish and Wildlife Service, 1992, Endangered and threatened species of the southeastern United States (the red book): Region 4, U.S. Fish and Wildlife Service, Atlanta, Georgia.
U.S. Fish and Wildlife Service, 1994, Endangered and threatened wildlife and plants, animal candidate review for listing as endangered or threatened species; proposed rule: Federal Register, vol. 59, p. 58982–59028.
U.S. Fish and Wildlife Service, 1995, Ozark big-eared bat (Plecotus townsendii ingens [Handley]) revised recovery plan: Tulsa, Oklahoma, 51 p.
U.S. Fish and Wildlife Service, 1996, 50 CFR Part 17, Endangered and threatened species, notice of reclassification of 96 candidate taxa: Federal Register, vol. 61, p. 7457–7463.
U.S. Fish and Wildlife Service, 1998, Recovery plan for the Hawaiian hoary bat: U.S. Fish and Wildlife Service, Portland, Oregon, 50 p.
U.S. Fish and Wildlife Service, 1999, Agency draft Indiana bat (Myotis sodalis) revised recovery plan: Fort Snelling, Minnesota, 53 p.
U.S. Fish and Wildlife Service, 2001, 50 CFR Part 17, Endangered and threatened wildlife and plants, a review of plant and animal species that are candidates or proposed for listing as endangered or threatened, annual notice of findings on recycled petitions, and annual description of progress on listing actions: Federal Register, vol. 66, p. 54808–54832.
Utzurrum, R.C.B., Wiles, G.J., Brooke, A.P., and Worthington, D.J., 2003, Count methods and
ELLISON AND OTHERS 169
population trends in Pacific island flying foxes, in O’Shea, T.J. and Bogan, M.A., eds., Monitoring trends in bat populations of the United States and territories: problems and prospects: U.S. Geological Survey, Information and Technology Report, USGS/ BRD/ITR--2003–0003, p. 49–61.
van Zyll de Jong, C.G., 1979, Distribution and systematic relationships of long-eared Myotis in western Canada: Canadian Journal of Zoology, vol. 57, p. 987–994.
Vaughan, T.A., 1959, Functional morphology of three bats, Eumops, Myotis, Macrotus: University of Kansas Publications Museum of Natural History, vol. 12, p. 1–153.
Vaughan, T.A., and O’Shea, T.J., 1976, Roosting ecology of the pallid bat, Antrozous pallidus: Journal of Mammalogy, vol. 57, p. 19–42.
von Bloeker, J.C., 1932, The roosting place of Pipistrellus hesperus: Journal of Mammalogy, vol. 13, p. 273.
Wackenhut, M.C., 1990, Bat species overwintering in lava-tube caves in Lincoln, Gooding, Blaine, Bingham, and Butte Counties, Idaho with special reference to annual return of banded Plecotus townsendii: M.S. thesis, Idaho State University, Pocatello, 64 p.
Walker, S., 1995, Mexico-U.S. partnership makes gains for migratory bats: Bats, vol. 13, p. 3–5.
Watkins, L.C., 1977, Euderma maculatum: Mammalian Species, vol. 77, p. 1–4.
Welter, W.A., and Sollberger, D.E., 1939, Notes on the mammals of Rowan and adjacent counties in eastern Kentucky: Journal of Mammalogy, vol. 20, p. 77–81.
Wenner, A.S., 1984, Current status and management of gray bat caves in Jackson County, Florida: Florida Field Naturalist, vol. 12, p. 1–6.
Wheeler, M.E., 1980, The status of the Mariana fruit bat on Saipan, Tinian, and Rota: Elepaio, vol. 40, p. 109–113.
Whitaker, J.O., Jr., 1998, Life history and roost switching in six summer colonies of eastern pipistrelles in buildings: Journal of Mammalogy, vol. 79, p. 651–659.
Whitaker, J.O., Jr., and Clem, P., 1992, Food of the evening bat Nycticeius humeralis from Indiana: American Midland Naturalist, vol. 127, p. 211–214.
Whitaker, J.O., Jr., and Gammon, J.R., 1988, Endangered and threatened vertebrate animals of Indiana: their distribution and abundance: The Indiana Academy of Science, Indianapolis, 122 p.
Whitaker, J.O., Jr., and Gummer, S.L., 1988, Bat colonies in Indiana, with emphasis on the evening bat, Nycticeius humeralis: Proceedings of the Indiana Academy of Science, vol. 98, p. 595–598.
Whitaker, J.O., and Rissler, L.J., 1992a, Seasonal activity of bats at Copperhead Cave: Proceedings of the Indiana Academy of Science, vol. 101, p. 127–134.
170 INFORMATION AND TECHNOLOGY REPORT–2003--0003
Whitaker, J.O., Jr., and Rissler, L.J., 1992b, Winter activity of bats at a mine entrance in Vermillion County, Indiana: American Midland Naturalist, vol. 127, p. 52–59.
Whitaker, J.O., Jr., and Rodriguez-Duran, A., 1999, Seasonal variation in the diet of Mexican free-tailed bats, Tadarida brasiliensis antillularum (Miller) from a colony in Puerto Rico: Caribbean Journal of Science, vol. 35, p. 23–28.
Whitaker, J.O., Jr., and Winter, F.A., 1977, Bats of the caves and mines of the Shawnee National Forest, southern Illinois: Transactions of the Illinois Academy of Science, vol. 70, p. 301–313.
White, D.H., and Seginak, J.T., 1987, Cave gate design for use in protecting endangered bats: Wildlife Society Bulletin, vol. 15, p. 445–449.
Wiles, G.J., 1987, The status of fruit bats on Guam: Pacific Science, vol. 41, p. 148–157.
Wiles, G.J., 1995, Natural history, biology, and habitat protection for the Mariana fruit bat, in Division of Aquatic and Wildlife Resources annual report (Fiscal Year 1995): Guam Department of Agriculture, Mangilao, p. 91–97.
Wiles, G.J., and Worthington, D.J., 2002, A population assessment of Pacific sheat-tailed bats (Emballonura semicaudata) on Aguiguan, Mariana Islands, unpublished report prepared for the U.S. Fish and Wildlife Service Pacific Islands Office, Ecological Services, Honolulu, Hawaii.
Wiles, G.J., Lemke, T.O., and Payne, N.H., 1989, Population estimates of fruit bats (Pteropus mariannus) in the Mariana Islands: Conservation Biology, vol. 3, p. 66–76.
Wiles, G.J., Aguon, C.F., Davis, G.W., 1995, The status and distribution of endangered animals and plants in northern Guam: Micronesia, vol. 28, p. 31–49.
Willig, M.R., and Bauman, A., 1984, Notes on bats from the Luquillo Mountains of Puerto Rico: CEER-T194:1-12, Center for Energy and Environmental Research, University of Puerto Rico.
Wilson, D.E., and Engbring, J., 1992, The flying foxes Pteropus samoensis and Pteropus tonganus, status in Fiji and Samoa, in Wilson, D.E., and Graham, G.L., eds., Pacific flying foxes: Proceedings of an International Conservation Conference, U.S. Fish and Wildlife Biological Report 90, p. 74–101.
Worthington, D.W., 1992, Methods and results of a census of bats in Jewel Cave on December 16, 1992, unpublished report to Jewel Cave National Monument: U.S. Fish and Wildlife Service, National Ecology Research Center, Fort Collins, Colorado, 3 p.
Worthington, D.W., and Ross, H.N., 1990, Abundance and distribution of bats in the Pryor Mountains of south-central Montana, unpublished report from the Montana Natural Heritage Program: Bureau of Land Management, Billings Resource Area, 20 p.
Worthington, D.W., and Taisacan, E.M., 1996, Fruit bat research, in Annual report Fiscal Year 1995, Federal Aid in Wildlife Restoration Program, Commonwealth of the Northern Mariana Islands: Division of Fish and Wildlife, Report W-1-R-1-11, p. 6–16.
Worthington, D.W., Marshall, A.P., Wiles, G.J., and Kessler, C.C., 2001, Abundance and management of Mariana fruit bats and feral ungulates on Anatahan, Mariana Islands: Pacific Conservation Biology, vol. 7, p. 134–142.
Zar, J.H., 1984, Biostatistical analysis (2nd ed.), Englewood Cliffs, New Jersey, Prentice Hall, 718 p.

–21–21–21–21Appendices 1Appendices 1Appendices 1Appendices 1Appendices 1 –21. Results of analyses for trends in counts of bats at colony sites. For each table in these appendices, colonies are ordered alphabetically by state or territory and then by site name. S, an approximation of Kendall’s tau, is reported for colonies with <10 distinct years of counts and a t is reported for trends with >10 years of counts (Kendall and Gibbons, 1990; Thompson and others, 1998). For the “Trend” column, a “ND” indicates no trend detected, a “+” indicates an upward trend was detected, and a “-” indicates a downward trend was detected. SD is the standard deviation of the counts and CV is the coefficient of variation expressed as a percentage.
171
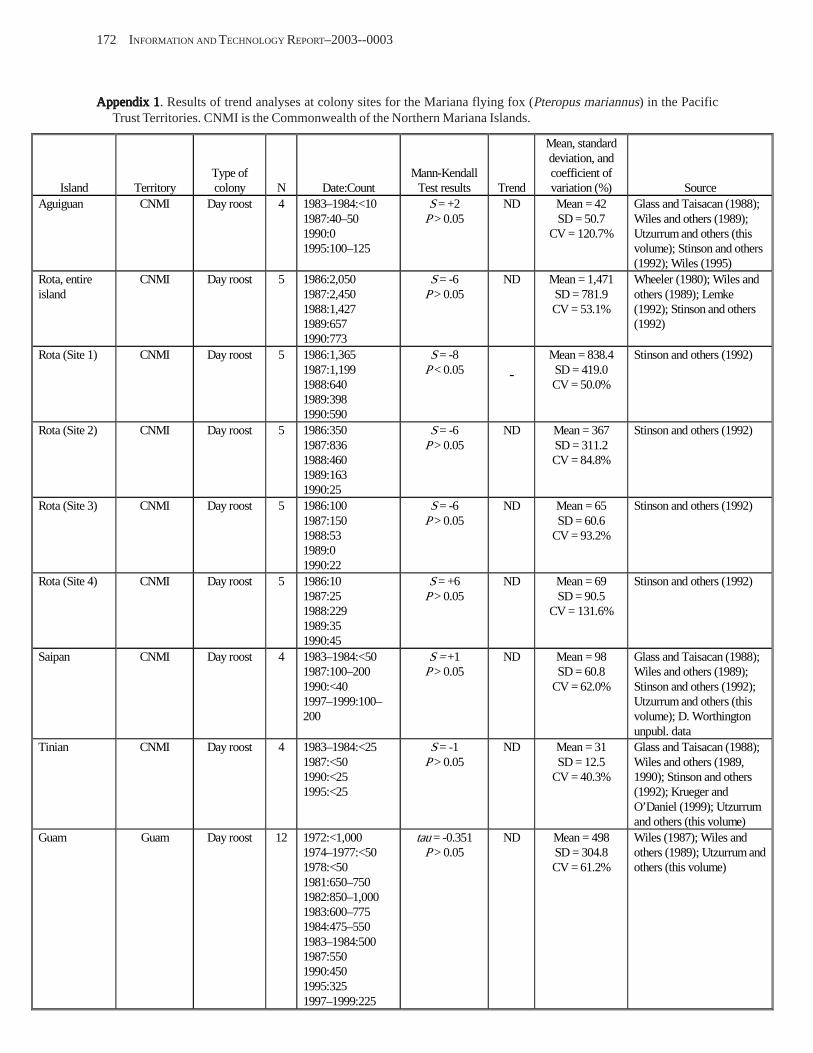
172 INFORMATION AND TECHNOLOGY REPORT–2003--0003
Appendix 1Appendix 1Appendix 1Appendix 1Appendix 1. Results of trend analyses at colony sites for the Mariana flying fox (Pteropus mariannus) in the Pacific Trust Territories. CNMI is the Commonwealth of the Northern Mariana Islands.
Mean, standard deviation, and
Island Territory Type of colony N Date:Count
Mann-Kendall Test results Trend
coefficient of variation (%) Source
Aguiguan CNMI Day roost 4 1983–1984:<10 1987:40–50 1990:0 1995:100–125
S = +2 P > 0.05
ND Mean = 42 SD = 50.7
CV = 120.7%
Glass and Taisacan (1988); Wiles and others (1989); Utzurrum and others (this volume); Stinson and others (1992); Wiles (1995)
Rota, entire island
CNMI Day roost 5 1986:2,050 1987:2,450 1988:1,427 1989:657 1990:773
S = -6 P > 0.05
ND Mean = 1,471 SD = 781.9 CV = 53.1%
Wheeler (1980); Wiles and others (1989); Lemke (1992); Stinson and others (1992)
Rota (Site 1) CNMI Day roost 5 1986:1,365 1987:1,199 1988:640 1989:398 1990:590
S = -8 P < 0.05 -
Mean = 838.4 SD = 419.0 CV = 50.0%
Stinson and others (1992)
Rota (Site 2) CNMI Day roost 5 1986:350 1987:836 1988:460 1989:163 1990:25
S = -6 P > 0.05
ND Mean = 367 SD = 311.2 CV = 84.8%
Stinson and others (1992)
Rota (Site 3) CNMI Day roost 5 1986:100 1987:150 1988:53 1989:0 1990:22
S = -6 P > 0.05
ND Mean = 65 SD = 60.6
CV = 93.2%
Stinson and others (1992)
Rota (Site 4) CNMI Day roost 5 1986:10 1987:25 1988:229 1989:35 1990:45
S = +6 P > 0.05
ND Mean = 69 SD = 90.5
CV = 131.6%
Stinson and others (1992)
Saipan CNMI Day roost 4 1983–1984:<50 1987:100–200 1990:<40 1997–1999:100– 200
S = +1 P > 0.05
ND Mean = 98 SD = 60.8
CV = 62.0%
Glass and Taisacan (1988); Wiles and others (1989); Stinson and others (1992); Utzurrum and others (this volume); D. Worthington unpubl. data
Tinian CNMI Day roost 4 1983–1984:<25 1987:<50 1990:<25 1995:<25
S = -1 P > 0.05
ND Mean = 31 SD = 12.5
CV = 40.3%
Glass and Taisacan (1988); Wiles and others (1989, 1990); Stinson and others (1992); Krueger and O’Daniel (1999); Utzurrum and others (this volume)
Guam Guam Day roost 12 1972:<1,000 1974–1977:<50 1978:<50 1981:650–750 1982:850–1,000 1983:600–775 1984:475–550 1983–1984:500 1987:550 1990:450 1995:325 1997–1999:225
tau = -0.351 P > 0.05
ND Mean = 498 SD = 304.8 CV = 61.2%
Wiles (1987); Wiles and others (1989); Utzurrum and others (this volume)
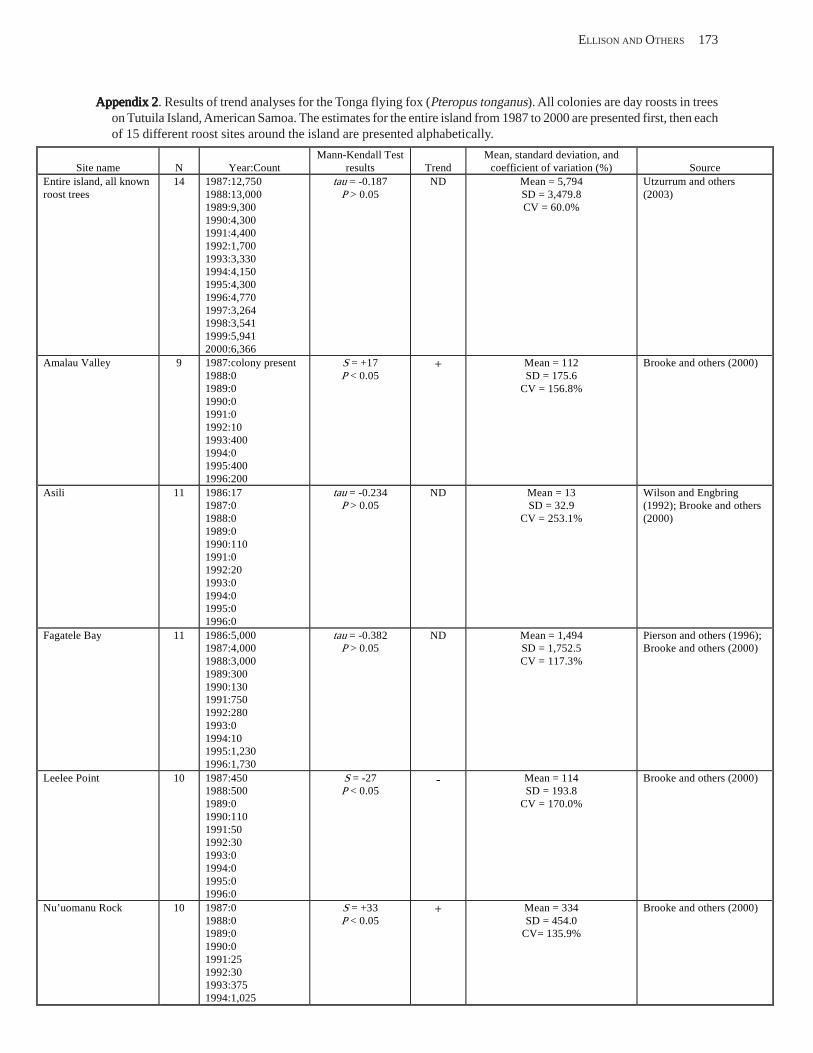
ELLISON AND OTHERS 173
Appendix 2Appendix 2Appendix 2Appendix 2Appendix 2. Results of trend analyses for the Tonga flying fox (Pteropus tonganus). All colonies are day roosts in trees on Tutuila Island, American Samoa. The estimates for the entire island from 1987 to 2000 are presented first, then each of 15 different roost sites around the island are presented alphabetically.
Site name N Year:Count Mann-Kendall Test
results Trend Mean, standard deviation, and
coefficient of variation (%) Source Entire island, all known 14 1987:12,750 tau = -0.187 ND Mean = 5,794 Utzurrum and others roost trees 1988:13,000
1989:9,300 P > 0.05 SD = 3,479.8
CV = 60.0% (2003)
1990:4,300 1991:4,400 1992:1,700 1993:3,330 1994:4,150 1995:4,300 1996:4,770 1997:3,264 1998:3,541 1999:5,941 2000:6,366
Amalau Valley 9 1987:colony present 1988:0 1989:0 1990:0 1991:0 1992:10 1993:400 1994:0 1995:400 1996:200
S = +17 P < 0.05
+ Mean = 112 SD = 175.6
CV = 156.8%
Brooke and others (2000)
Asili 11 1986:17 1987:0 1988:0 1989:0 1990:110 1991:0 1992:20 1993:0 1994:0 1995:0 1996:0
tau = -0.234 P > 0.05
ND Mean = 13 SD = 32.9
CV = 253.1%
Wilson and Engbring (1992); Brooke and others (2000)
Fagatele Bay 11 1986:5,000 1987:4,000 1988:3,000 1989:300 1990:130 1991:750 1992:280 1993:0 1994:10 1995:1,230 1996:1,730
tau = -0.382 P > 0.05
ND Mean = 1,494 SD = 1,752.5 CV = 117.3%
Pierson and others (1996); Brooke and others (2000)
Leelee Point 10 1987:450 1988:500 1989:0 1990:110 1991:50 1992:30 1993:0 1994:0 1995:0 1996:0
S = -27 P < 0.05
- Mean = 114 SD = 193.8
CV = 170.0%
Brooke and others (2000)
Nu’uomanu Rock 10 1987:0 1988:0 1989:0 1990:0 1991:25 1992:30 1993:375 1994:1,025
S = +33 P < 0.05
+ Mean = 334 SD = 454.0
CV= 135.9%
Brooke and others (2000)
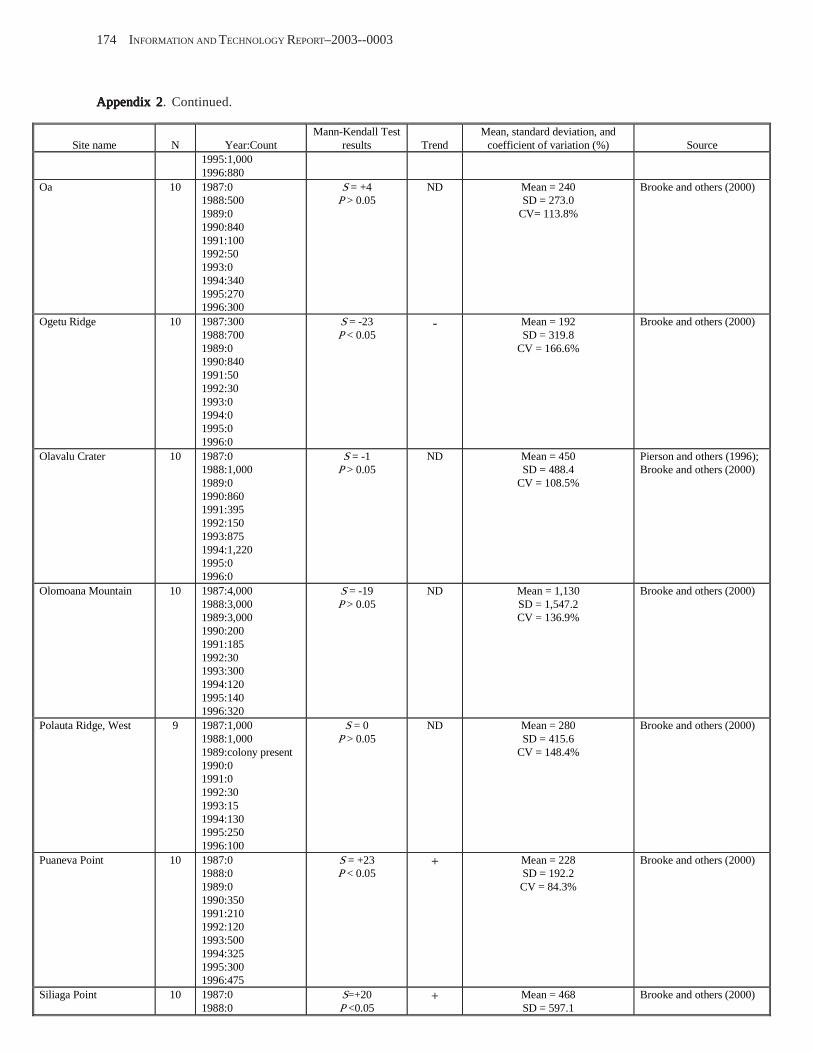
174 INFORMATION AND TECHNOLOGY REPORT–2003--0003
Appendix 2Appendix 2Appendix 2Appendix 2Appendix 2. Continued.
Site name N Year:Count Mann-Kendall Test
results Trend Mean, standard deviation, and
coefficient of variation (%) Source 1995:1,000 1996:880
Oa 10 1987:0 1988:500 1989:0 1990:840 1991:100 1992:50 1993:0 1994:340 1995:270 1996:300
S = +4 P > 0.05
ND Mean = 240 SD = 273.0
CV= 113.8%
Brooke and others (2000)
Ogetu Ridge 10 1987:300 1988:700 1989:0 1990:840 1991:50 1992:30 1993:0 1994:0 1995:0 1996:0
S = -23 P < 0.05
- Mean = 192 SD = 319.8
CV = 166.6%
Brooke and others (2000)
Olavalu Crater 10 1987:0 1988:1,000 1989:0 1990:860 1991:395 1992:150 1993:875 1994:1,220 1995:0 1996:0
S = -1 P > 0.05
ND Mean = 450 SD = 488.4
CV = 108.5%
Pierson and others (1996); Brooke and others (2000)
Olomoana Mountain 10 1987:4,000 1988:3,000 1989:3,000 1990:200 1991:185 1992:30 1993:300 1994:120 1995:140 1996:320
S = -19 P > 0.05
ND Mean = 1,130 SD = 1,547.2 CV = 136.9%
Brooke and others (2000)
Polauta Ridge, West 9 1987:1,000 1988:1,000 1989:colony present 1990:0 1991:0 1992:30 1993:15 1994:130 1995:250 1996:100
S = 0 P > 0.05
ND Mean = 280 SD = 415.6
CV = 148.4%
Brooke and others (2000)
Puaneva Point 10 1987:0 1988:0 1989:0 1990:350 1991:210 1992:120 1993:500 1994:325 1995:300 1996:475
S = +23 P < 0.05
+ Mean = 228 SD = 192.2 CV = 84.3%
Brooke and others (2000)
Siliaga Point 10 1987:0 1988:0
S=+20 P <0.05
+ Mean = 468 SD = 597.1
Brooke and others (2000)
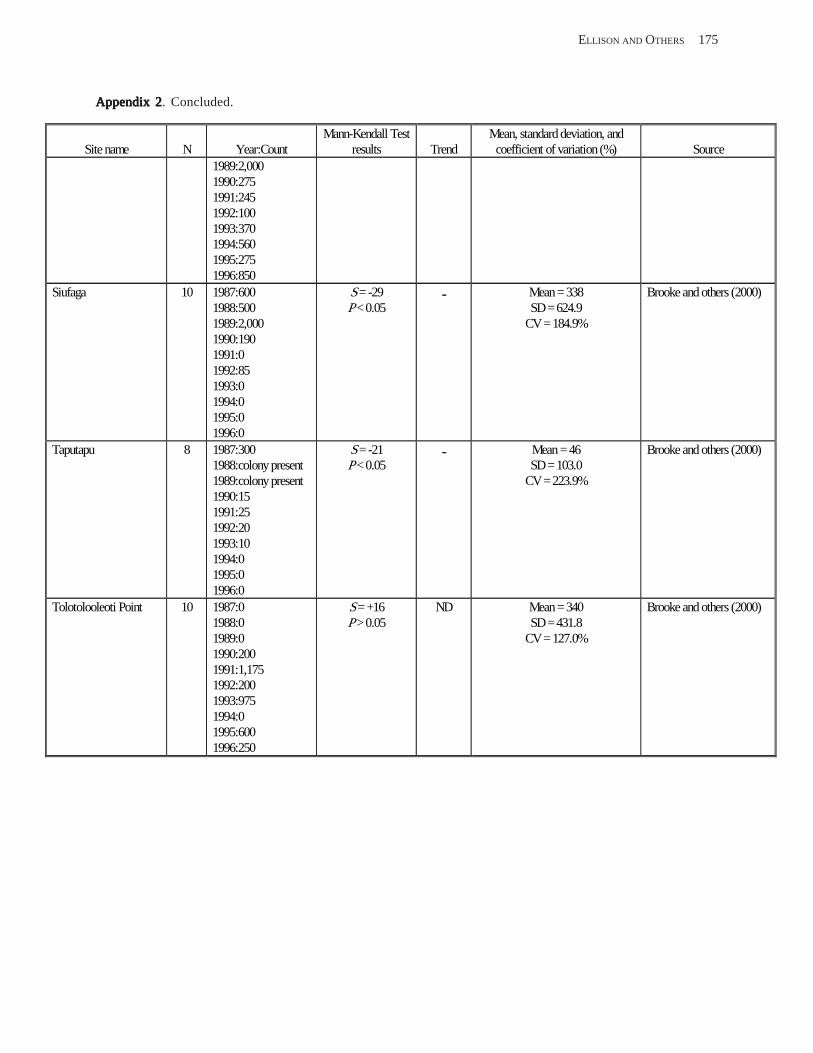
ELLISON AND OTHERS 175
Appendix 2Appendix 2Appendix 2Appendix 2Appendix 2. Concluded.
Site name N Year:Count Mann-Kendall Test
results Trend Mean, standard deviation, and coefficient of variation (%) Source
1989:2,000 1990:275 1991:245 1992:100 1993:370 1994:560 1995:275 1996:850
Siufaga 10 1987:600 1988:500 1989:2,000 1990:190 1991:0 1992:85 1993:0 1994:0 1995:0 1996:0
S = -29 P < 0.05
- Mean = 338 SD = 624.9
CV = 184.9%
Brooke and others (2000)
Taputapu 8 1987:300 1988:colony present 1989:colony present 1990:15 1991:25 1992:20 1993:10 1994:0 1995:0 1996:0
S = -21 P < 0.05
- Mean = 46 SD = 103.0
CV = 223.9%
Brooke and others (2000)
Tolotolooleoti Point 10 1987:0 1988:0 1989:0 1990:200 1991:1,175 1992:200 1993:975 1994:0 1995:600 1996:250
S = +16 P > 0.05
ND Mean = 340 SD = 431.8
CV = 127.0%
Brooke and others (2000)
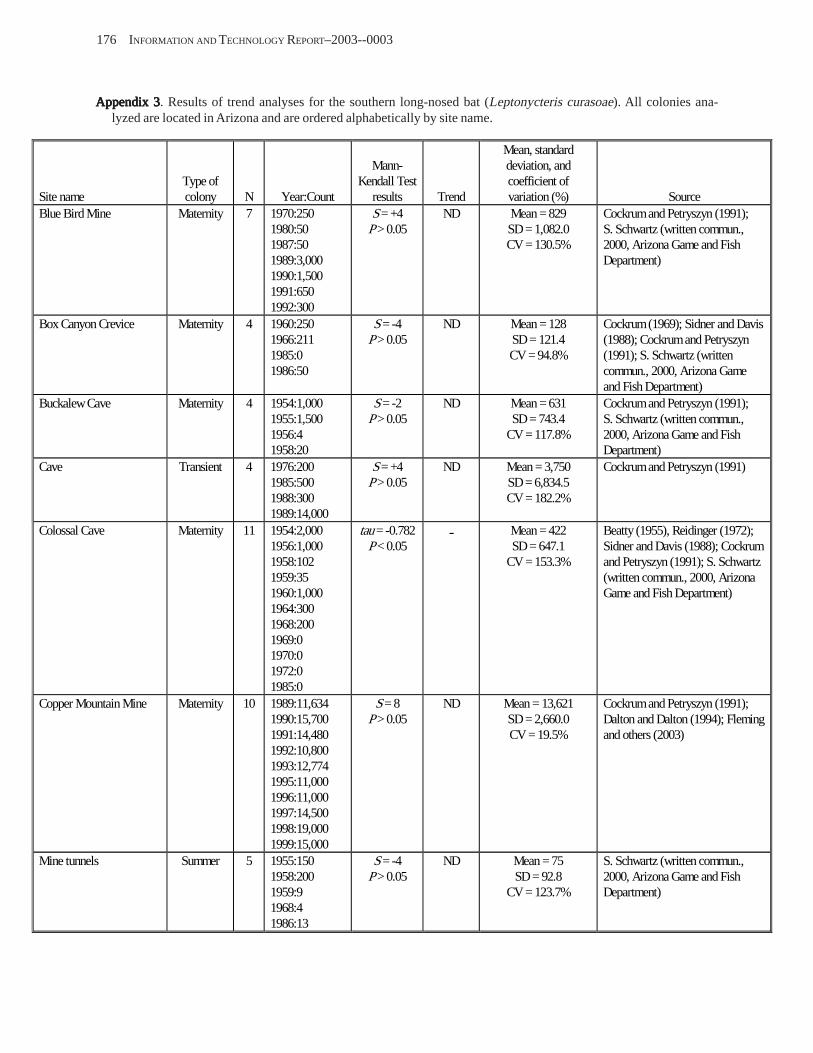
176 INFORMATION AND TECHNOLOGY REPORT–2003--0003
Appendix 3Appendix 3Appendix 3Appendix 3Appendix 3. Results of trend analyses for the southern long-nosed bat (Leptonycteris curasoae). All colonies ana-lyzed are located in Arizona and are ordered alphabetically by site name.
Mean, standard Mann- deviation, and
Site name Type of colony N Year:Count
Kendall Test results Trend
coefficient of variation (%) Source
Blue Bird Mine Maternity 7 1970:250 1980:50 1987:50 1989:3,000 1990:1,500 1991:650 1992:300
S = +4 P > 0.05
ND Mean = 829 SD = 1,082.0 CV = 130.5%
Cockrum and Petryszyn (1991); S. Schwartz (written commun., 2000, Arizona Game and Fish Department)
Box Canyon Crevice Maternity 4 1960:250 1966:211 1985:0 1986:50
S = -4 P > 0.05
ND Mean = 128 SD = 121.4 CV = 94.8%
Cockrum (1969); Sidner and Davis (1988); Cockrum and Petryszyn (1991); S. Schwartz (written commun., 2000, Arizona Game and Fish Department)
Buckalew Cave Maternity 4 1954:1,000 1955:1,500 1956:4 1958:20
S = -2 P > 0.05
ND Mean = 631 SD = 743.4
CV = 117.8%
Cockrum and Petryszyn (1991); S. Schwartz (written commun., 2000, Arizona Game and Fish Department)
Cave Transient 4 1976:200 1985:500 1988:300 1989:14,000
S = +4 P > 0.05
ND Mean = 3,750 SD = 6,834.5 CV = 182.2%
Cockrum and Petryszyn (1991)
Colossal Cave Maternity 11 1954:2,000 1956:1,000 1958:102 1959:35 1960:1,000 1964:300 1968:200 1969:0 1970:0 1972:0 1985:0
tau = -0.782 P < 0.05
- Mean = 422 SD = 647.1
CV = 153.3%
Beatty (1955), Reidinger (1972); Sidner and Davis (1988); Cockrum and Petryszyn (1991); S. Schwartz (written commun., 2000, Arizona Game and Fish Department)
Copper Mountain Mine Maternity 10 1989:11,634 1990:15,700 1991:14,480 1992:10,800 1993:12,774 1995:11,000 1996:11,000 1997:14,500 1998:19,000 1999:15,000
S = 8 P > 0.05
ND Mean = 13,621 SD = 2,660.0 CV = 19.5%
Cockrum and Petryszyn (1991); Dalton and Dalton (1994); Fleming and others (2003)
Mine tunnels Summer 5 1955:150 1958:200 1959:9 1968:4 1986:13
S = -4 P > 0.05
ND Mean = 75 SD = 92.8
CV = 123.7%
S. Schwartz (written commun., 2000, Arizona Game and Fish Department)

ELLISON AND OTHERS 177
Appendix 4Appendix 4Appendix 4Appendix 4Appendix 4. Results of trend analyses for the California leaf-nosed bat (Macrotus californicus). All colonies are located in Arizona and are ordered alphabetically by site name.
Mean, standard deviation, Type of Mann-Kendall and coefficient of
Site name colony N Year:Count Test rsults Trend variation (%) Source Blue Bird Mine Summer 6 1970:150
1975:150 1989:200 1990:52 1991:650 1992:350
S = +6 P > 0.05
ND Mean = 259 SD = 215.0 CV = 83.0%
S. Schwartz (written commun., 2000, Arizona Game and Fish Department)
Boomerang Mine Maternity 4 1957:2,000 1958:250 1970:2,000 1983:100
S = -3 P > 0.05
ND Mean = 1088 SD = 1055.4 CV = 97.0%
S. Schwartz (written commun., 2000, Arizona Game and Fish Department)
Fortuna Mine Winter 5 1941:1,100 1958:250 1959:100 1960:275 1988:62
S = -6 P > 0.05
ND Mean = 357 SD = 425.2
CV = 119.0%
Bradshaw (1961), S. Schwartz (written commun., 2000, Arizona Game and Fish Department)
Great Central Mine #8 Winter 6 1972:489 1977:2 1992:153 1993:5 1995:300 1996:400
S = +3 P > 0.05
ND Mean = 225 SD = 204.6 CV = 90.9%
S. Schwartz (written commun., 2000, Arizona Game and Fish Department)
War Eagle Mine Winter 4 1993:726 1994:16 1995:535 1996:278
S = -2 P > 0.05
ND Mean = 389 SD = 308.9 CV = 79.4%
S. Schwartz (written commun., 2000, Arizona Game and Fish Department)
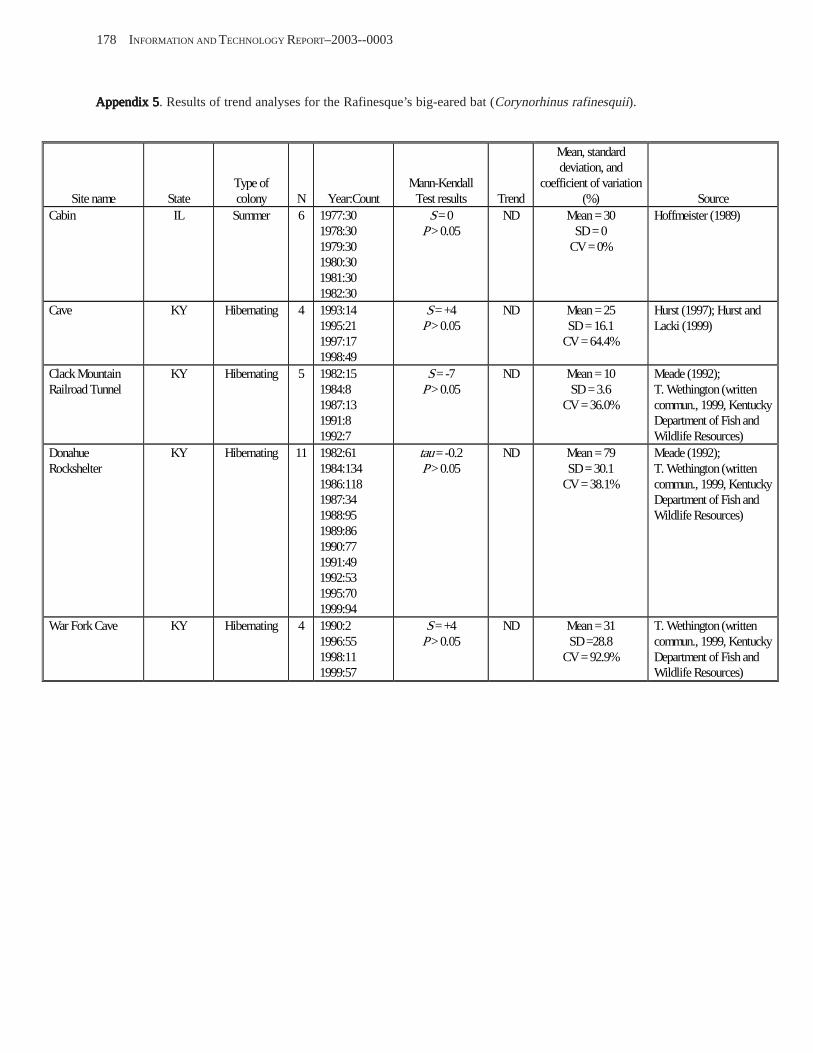
178 INFORMATION AND TECHNOLOGY REPORT–2003--0003
Appendix 5Appendix 5Appendix 5Appendix 5Appendix 5. Results of trend analyses for the Rafinesque’s big-eared bat (Corynorhinus rafinesquii).
Mean, standard deviation, and
Site name State Type of colony N Year:Count
Mann-Kendall Test results Trend
coefficient of variation (%) Source
Cabin IL Summer 6 1977:30 1978:30 1979:30 1980:30 1981:30 1982:30
S = 0 P > 0.05
ND Mean = 30 SD = 0
CV = 0%
Hoffmeister (1989)
Cave KY Hibernating 4 1993:14 1995:21 1997:17 1998:49
S = +4 P > 0.05
ND Mean = 25 SD = 16.1
CV = 64.4%
Hurst (1997); Hurst and Lacki (1999)
Clack Mountain Railroad Tunnel
KY Hibernating 5 1982:15 1984:8 1987:13 1991:8 1992:7
S = -7 P > 0.05
ND Mean = 10 SD = 3.6
CV = 36.0%
Meade (1992); T. Wethington (written commun., 1999, Kentucky Department of Fish and Wildlife Resources)
Donahue Rockshelter
KY Hibernating 11 1982:61 1984:134 1986:118 1987:34 1988:95 1989:86 1990:77 1991:49 1992:53 1995:70 1999:94
tau = -0.2 P > 0.05
ND Mean = 79 SD = 30.1
CV = 38.1%
Meade (1992); T. Wethington (written commun., 1999, Kentucky Department of Fish and Wildlife Resources)
War Fork Cave KY Hibernating 4 1990:2 1996:55 1998:11 1999:57
S = +4 P > 0.05
ND Mean = 31 SD =28.8
CV = 92.9%
T. Wethington (written commun., 1999, Kentucky Department of Fish and Wildlife Resources)
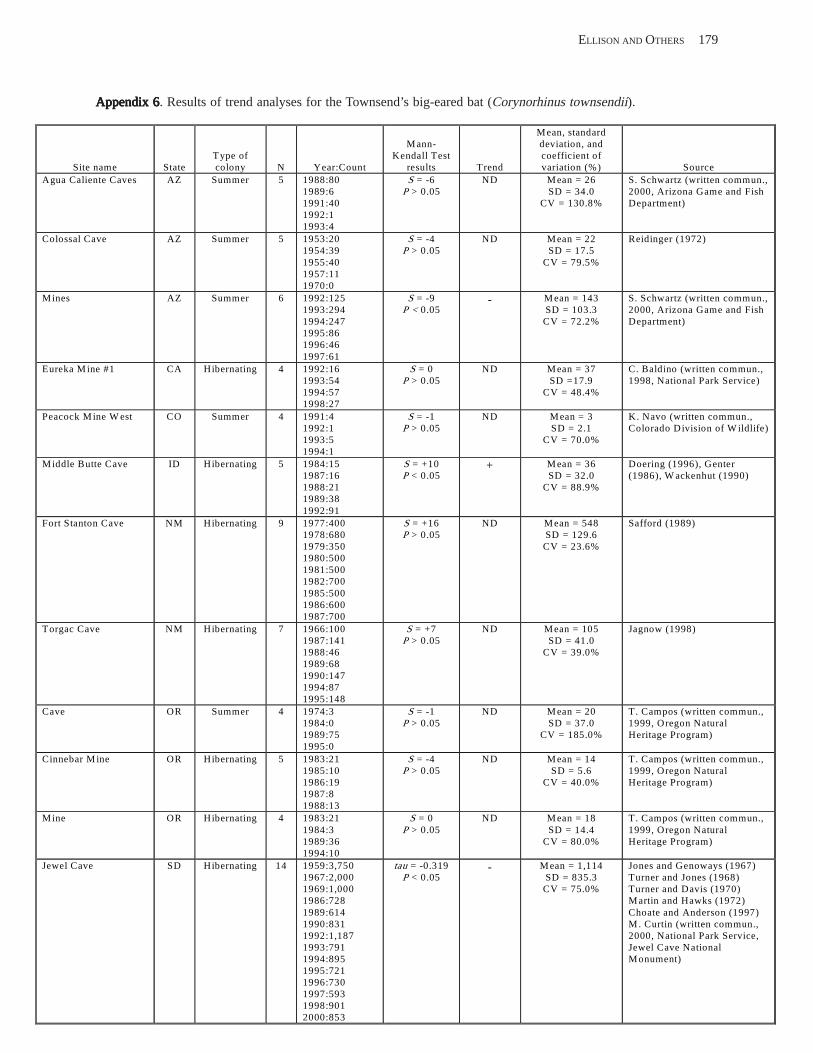
ELLISON AND OTHERS 179
Appendix 6Appendix 6Appendix 6Appendix 6Appendix 6. Results of trend analyses for the Townsend’s big-eared bat (Corynorhinus townsendii).
Site name State Type of colony N Year:Count
M ann-Kendall Test
results Trend
M ean, standard deviation, and coefficient of variation (%) Source
Agua Caliente Caves AZ Summer 5 1988:80 1989:6 1991:40 1992:1 1993:4
S = -6 P > 0.05
ND M ean = 26 SD = 34.0
CV = 130.8%
S. Schwartz (written commun., 2000, Arizona Game and Fish Department)
Colossal Cave AZ Summer 5 1953:20 1954:39 1955:40 1957:11 1970:0
S = -4 P > 0.05
ND M ean = 22 SD = 17.5
CV = 79.5%
Reidinger (1972)
M ines AZ Summer 6 1992:125 1993:294 1994:247 1995:86 1996:46 1997:61
S = -9 P < 0.05
- M ean = 143 SD = 103.3
CV = 72.2%
S. Schwartz (written commun., 2000, Arizona Game and Fish Department)
Eureka M ine #1 CA Hibernating 4 1992:16 1993:54 1994:57 1998:27
S = 0 P > 0.05
ND M ean = 37 SD =17.9
CV = 48.4%
C. Baldino (written commun., 1998, National Park Service)
Peacock M ine W est CO Summer 4 1991:4 1992:1 1993:5 1994:1
S = -1 P > 0.05
ND M ean = 3 SD = 2.1
CV = 70.0%
K. Navo (written commun., Colorado Division of W ildlife)
M iddle Butte Cave ID Hibernating 5 1984:15 1987:16 1988:21 1989:38 1992:91
S = +10 P < 0.05
+ M ean = 36 SD = 32.0
CV = 88.9%
Doering (1996), Genter (1986), W ackenhut (1990)
Fort Stanton Cave NM Hibernating 9 1977:400 1978:680 1979:350 1980:500 1981:500 1982:700 1985:500 1986:600 1987:700
S = +16 P > 0.05
ND M ean = 548 SD = 129.6
CV = 23.6%
Safford (1989)
Torgac Cave NM Hibernating 7 1966:100 1987:141 1988:46 1989:68 1990:147 1994:87 1995:148
S = +7 P > 0.05
ND M ean = 105 SD = 41.0
CV = 39.0%
Jagnow (1998)
Cave OR Summer 4 1974:3 1984:0 1989:75 1995:0
S = -1 P > 0.05
ND M ean = 20 SD = 37.0
CV = 185.0%
T. Campos (written commun., 1999, Oregon Natural Heritage Program)
Cinnebar M ine OR Hibernating 5 1983:21 1985:10 1986:19 1987:8 1988:13
S = -4 P > 0.05
ND M ean = 14 SD = 5.6
CV = 40.0%
T. Campos (written commun., 1999, Oregon Natural Heritage Program)
M ine OR Hibernating 4 1983:21 1984:3 1989:36 1994:10
S = 0 P > 0.05
ND M ean = 18 SD = 14.4
CV = 80.0%
T. Campos (written commun., 1999, Oregon Natural Heritage Program)
Jewel Cave SD Hibernating 14 1959:3,750 1967:2,000 1969:1,000 1986:728 1989:614 1990:831 1992:1,187 1993:791 1994:895 1995:721 1996:730 1997:593 1998:901 2000:853
tau = -0.319 P < 0.05
- M ean = 1,114 SD = 835.3
CV = 75.0%
Jones and Genoways (1967) Turner and Jones (1968) Turner and Davis (1970) M artin and Hawks (1972) Choate and Anderson (1997) M . Curtin (written commun., 2000, National Park Service, Jewel Cave National M onument)
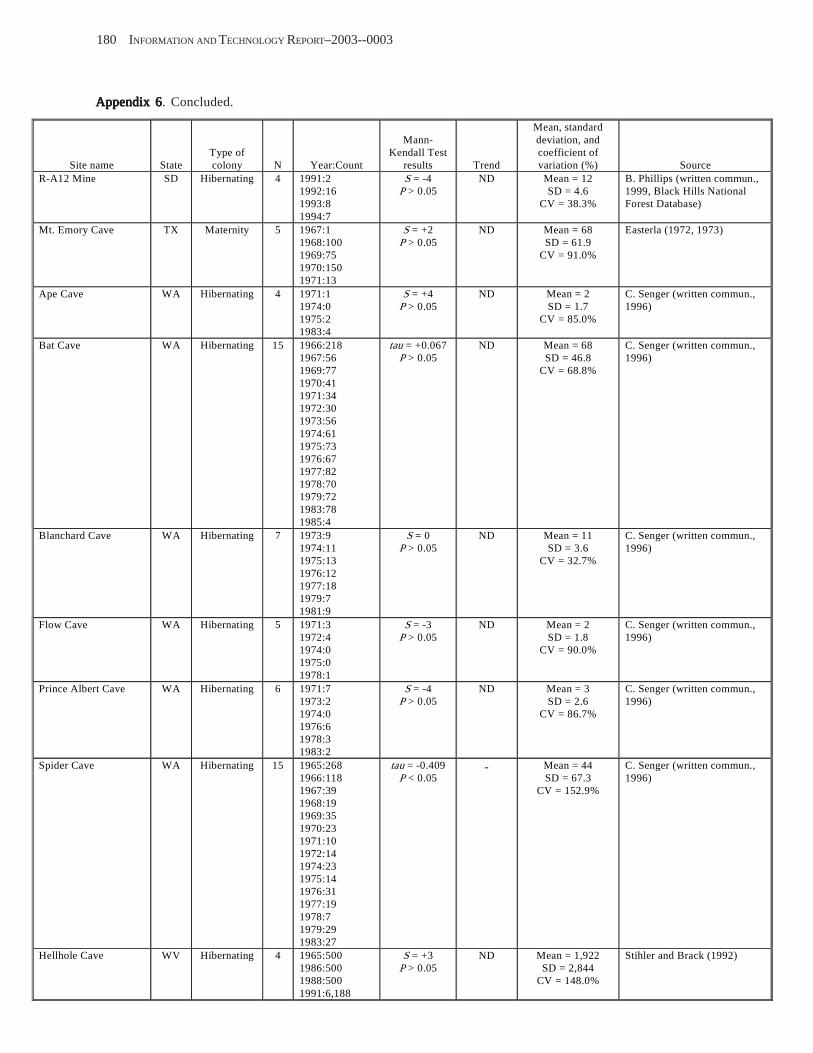
180 INFORMATION AND TECHNOLOGY REPORT–2003--0003
Appendix 6Appendix 6Appendix 6Appendix 6Appendix 6. Concluded.
Site name State Type of colony N Year:Count
Mann-Kendall Test
results Trend
Mean, standard deviation, and coefficient of variation (%) Source
R-A12 Mine SD Hibernating 4 1991:2 1992:16 1993:8 1994:7
S = -4 P > 0.05
ND Mean = 12 SD = 4.6
CV = 38.3%
B. Phillips (written commun., 1999, Black Hills National Forest Database)
Mt. Emory Cave TX Maternity 5 1967:1 1968:100 1969:75 1970:150 1971:13
S = +2 P > 0.05
ND Mean = 68 SD = 61.9
CV = 91.0%
Easterla (1972, 1973)
Ape Cave WA Hibernating 4 1971:1 1974:0 1975:2 1983:4
S = +4 P > 0.05
ND Mean = 2 SD = 1.7
CV = 85.0%
C. Senger (written commun., 1996)
Bat Cave WA Hibernating 15 1966:218 1967:56 1969:77 1970:41 1971:34 1972:30 1973:56 1974:61 1975:73 1976:67 1977:82 1978:70 1979:72 1983:78 1985:4
tau = +0.067 P > 0.05
ND Mean = 68 SD = 46.8
CV = 68.8%
C. Senger (written commun., 1996)
Blanchard Cave WA Hibernating 7 1973:9 1974:11 1975:13 1976:12 1977:18 1979:7 1981:9
S = 0 P > 0.05
ND Mean = 11 SD = 3.6
CV = 32.7%
C. Senger (written commun., 1996)
Flow Cave WA Hibernating 5 1971:3 1972:4 1974:0 1975:0 1978:1
S = -3 P > 0.05
ND Mean = 2 SD = 1.8
CV = 90.0%
C. Senger (written commun., 1996)
Prince Albert Cave WA Hibernating 6 1971:7 1973:2 1974:0 1976:6 1978:3 1983:2
S = -4 P > 0.05
ND Mean = 3 SD = 2.6
CV = 86.7%
C. Senger (written commun., 1996)
Spider Cave WA Hibernating 15 1965:268 1966:118 1967:39 1968:19 1969:35 1970:23 1971:10 1972:14 1974:23 1975:14 1976:31 1977:19 1978:7 1979:29 1983:27
tau = -0.409 P < 0.05
- Mean = 44 SD = 67.3
CV = 152.9%
C. Senger (written commun., 1996)
Hellhole Cave WV Hibernating 4 1965:500 1986:500 1988:500 1991:6,188
S = +3 P > 0.05
ND Mean = 1,922 SD = 2,844
CV = 148.0%
Stihler and Brack (1992)
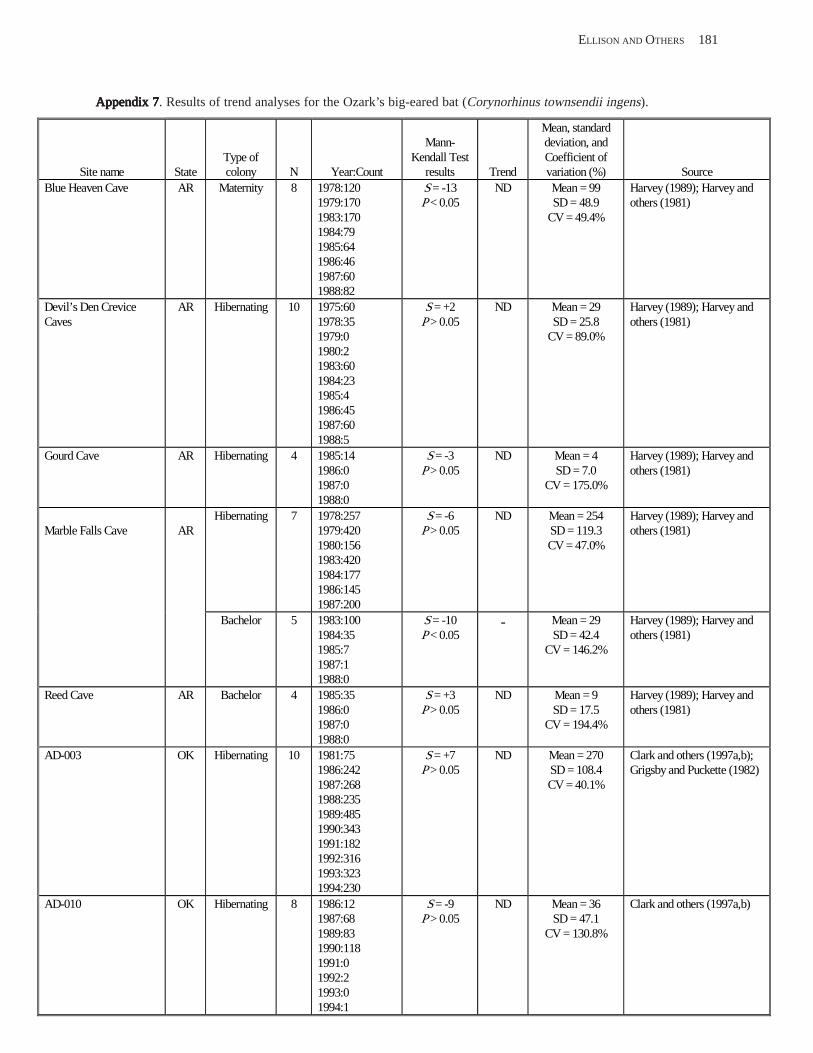
ELLISON AND OTHERS 181
Appendix 7Appendix 7Appendix 7Appendix 7Appendix 7. Results of trend analyses for the Ozark’s big-eared bat (Corynorhinus townsendii ingens).
Mean, standard Mann- deviation, and
Site name State Type of colony N Year:Count
Kendall Test results Trend
Coefficient of variation (%) Source
Blue Heaven Cave AR Maternity 8 1978:120 1979:170 1983:170 1984:79 1985:64 1986:46 1987:60 1988:82
S = -13 P < 0.05
ND Mean = 99 SD = 48.9
CV = 49.4%
Harvey (1989); Harvey and others (1981)
Devil’s Den Crevice Caves
AR Hibernating 10 1975:60 1978:35 1979:0 1980:2 1983:60 1984:23 1985:4 1986:45 1987:60 1988:5
S = +2 P > 0.05
ND Mean = 29 SD = 25.8
CV = 89.0%
Harvey (1989); Harvey and others (1981)
Gourd Cave AR Hibernating 4 1985:14 1986:0 1987:0 1988:0
S = -3 P > 0.05
ND Mean = 4 SD = 7.0
CV = 175.0%
Harvey (1989); Harvey and others (1981)
Marble Falls Cave AR Hibernating 7 1978:257
1979:420 1980:156 1983:420 1984:177 1986:145 1987:200
S = -6 P > 0.05
ND Mean = 254 SD = 119.3 CV = 47.0%
Harvey (1989); Harvey and others (1981)
Bachelor 5 1983:100 1984:35 1985:7 1987:1 1988:0
S = -10 P < 0.05
- Mean = 29 SD = 42.4
CV = 146.2%
Harvey (1989); Harvey and others (1981)
Reed Cave AR Bachelor 4 1985:35 1986:0 1987:0 1988:0
S = +3 P > 0.05
ND Mean = 9 SD = 17.5
CV = 194.4%
Harvey (1989); Harvey and others (1981)
AD-003 OK Hibernating 10 1981:75 1986:242 1987:268 1988:235 1989:485 1990:343 1991:182 1992:316 1993:323 1994:230
S = +7 P > 0.05
ND Mean = 270 SD = 108.4 CV = 40.1%
Clark and others (1997a,b); Grigsby and Puckette (1982)
AD-010 OK Hibernating 8 1986:12 1987:68 1989:83 1990:118 1991:0 1992:2 1993:0 1994:1
S = -9 P > 0.05
ND Mean = 36 SD = 47.1
CV = 130.8%
Clark and others (1997a,b)

182 INFORMATION AND TECHNOLOGY REPORT–2003--0003
Appendix 7Appendix 7Appendix 7Appendix 7Appendix 7. Concluded.
Mean, standard Mann- deviation, and
Site name State Type of colony N Year:Count
Kendall Test results Trend
Coefficient of variation (%) Source
AD-010 OK Maternity 15 1981:15 1982:97 1983:152 1984:165 1985:153 1986:262 1987:220 1988:226 1989:239 1990:274 1991:220 1992:231 1993:190 1994:275 1995:314
tau = +0.638 P < 0.05
+ Mean = 202 SD = 76.8
CV = 38.0%
Clark and others (1997a,b)
AD-013 OK Maternity 11 1984:81 1985:66 1986:103 1987:109 1988:110 1989:148 1990:137 1991:65 1992:50 1993:44 1994:50
tau = -0.273 P > 0.05
ND Mean = 88 SD = 36.1
CV = 41.0%
Clark and others (1997a,b)
AD-017/018 OK Maternity 13 1983:63 1984:49 1985:64 1986:76 1987:125 1988:75 1989:175 1990:132 1991:107 1992:119 1993:105 1994:71 1995:96
tau = +0.256 P > 0.05
ND Mean = 97 SD = 35.2
CV = 36.3%
Clark and others (1997a,b)
AD-125 OK Maternity 9 1987:260
1988:169 1989:276 1990:309 1991:262 1992:127 1993:42 1994:157 1995:75
S = -16 P > 0.05
ND Mean = 186 SD = 95.0
CV = 51.1%
Clark and others (1997a,b)
Hibernating 4 1987:247 1991:1 1993:12 1994:0
S = -4 P > 0.05
ND Mean = 65 SD = 121.4
CV = 186.8%
Clark and others (1997a,b)
Cave MO Hibernating 5 1957:4 1981:0 1987:0 1988:0 1999:0
S = -4 P > 0.05
ND Mean = 1 SD = 1.8
CV = 180.0%
J. Sternburg (written commun., 1999, Missouri Natural Heritage Database)
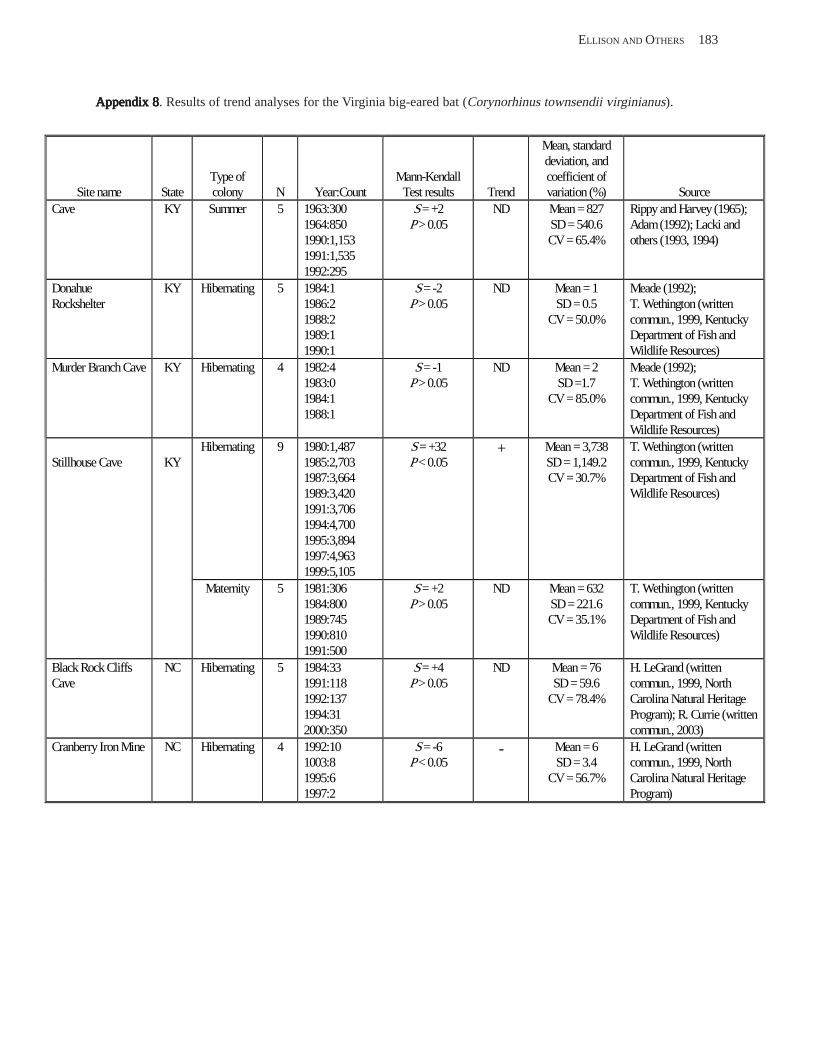
ELLISON AND OTHERS 183
Appendix 8Appendix 8Appendix 8Appendix 8Appendix 8. Results of trend analyses for the Virginia big-eared bat (Corynorhinus townsendii virginianus).
Mean, standard deviation, and
Site name State Type of colony N Year:Count
Mann-Kendall Test results Trend
coefficient of variation (%) Source
Cave KY Summer 5 1963:300 1964:850 1990:1,153 1991:1,535 1992:295
S = +2 P > 0.05
ND Mean = 827 SD = 540.6 CV = 65.4%
Rippy and Harvey (1965); Adam (1992); Lacki and others (1993, 1994)
Donahue Rockshelter
KY Hibernating 5 1984:1 1986:2 1988:2 1989:1 1990:1
S = -2 P > 0.05
ND Mean = 1 SD = 0.5
CV = 50.0%
Meade (1992); T. Wethington (written commun., 1999, Kentucky Department of Fish and Wildlife Resources)
Murder Branch Cave KY Hibernating 4 1982:4 1983:0 1984:1 1988:1
S = -1 P > 0.05
ND Mean = 2 SD =1.7
CV = 85.0%
Meade (1992); T. Wethington (written commun., 1999, Kentucky Department of Fish and Wildlife Resources)
Stillhouse Cave KY Hibernating 9 1980:1,487
1985:2,703 1987:3,664 1989:3,420 1991:3,706 1994:4,700 1995:3,894 1997:4,963 1999:5,105
S = +32 P < 0.05
+ Mean = 3,738 SD = 1,149.2 CV = 30.7%
T. Wethington (written commun., 1999, Kentucky Department of Fish and Wildlife Resources)
Maternity 5 1981:306 1984:800 1989:745 1990:810 1991:500
S = +2 P > 0.05
ND Mean = 632 SD = 221.6 CV = 35.1%
T. Wethington (written commun., 1999, Kentucky Department of Fish and Wildlife Resources)
Black Rock Cliffs Cave
NC Hibernating 5 1984:33 1991:118 1992:137 1994:31 2000:350
S = +4 P > 0.05
ND Mean = 76 SD = 59.6
CV = 78.4%
H. LeGrand (written commun., 1999, North Carolina Natural Heritage Program); R. Currie (written commun., 2003)
Cranberry Iron Mine NC Hibernating 4 1992:10 1003:8 1995:6 1997:2
S = -6 P < 0.05
- Mean = 6 SD = 3.4
CV = 56.7%
H. LeGrand (written commun., 1999, North Carolina Natural Heritage Program)
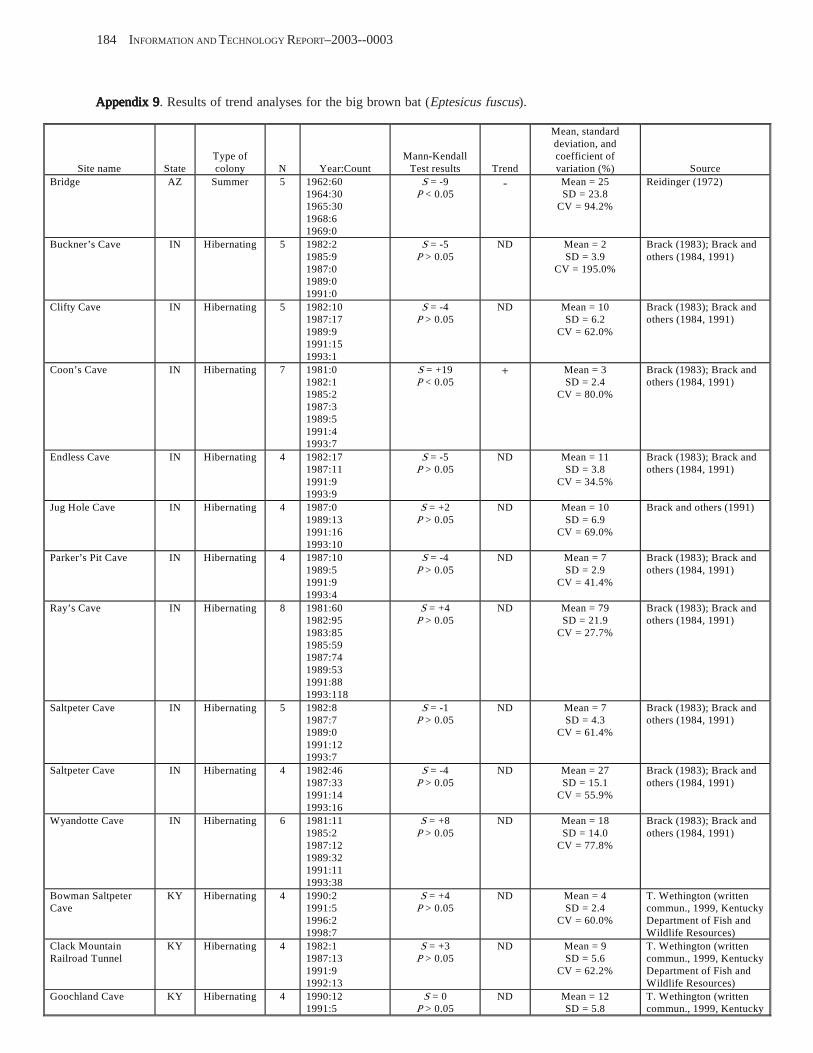
184 INFORMATION AND TECHNOLOGY REPORT–2003--0003
Appendix 9Appendix 9Appendix 9Appendix 9Appendix 9. Results of trend analyses for the big brown bat (Eptesicus fuscus).
Mean, standard deviation, and
Site name State Type of colony N Year:Count
Mann-Kendall Test results Trend
coefficient of variation (%) Source
Bridge AZ Summer 5 1962:60 1964:30 1965:30 1968:6 1969:0
S = -9 P < 0.05
- Mean = 25 SD = 23.8
CV = 94.2%
Reidinger (1972)
Buckner’s Cave IN Hibernating 5 1982:2 1985:9 1987:0 1989:0 1991:0
S = -5 P > 0.05
ND Mean = 2 SD = 3.9
CV = 195.0%
Brack (1983); Brack and others (1984, 1991)
Clifty Cave IN Hibernating 5 1982:10 1987:17 1989:9 1991:15 1993:1
S = -4 P > 0.05
ND Mean = 10 SD = 6.2
CV = 62.0%
Brack (1983); Brack and others (1984, 1991)
Coon’s Cave IN Hibernating 7 1981:0 1982:1 1985:2 1987:3 1989:5 1991:4 1993:7
S = +19 P < 0.05
+ Mean = 3 SD = 2.4
CV = 80.0%
Brack (1983); Brack and others (1984, 1991)
Endless Cave IN Hibernating 4 1982:17 1987:11 1991:9 1993:9
S = -5 P > 0.05
ND Mean = 11 SD = 3.8
CV = 34.5%
Brack (1983); Brack and others (1984, 1991)
Jug Hole Cave IN Hibernating 4 1987:0 1989:13 1991:16 1993:10
S = +2 P > 0.05
ND Mean = 10 SD = 6.9
CV = 69.0%
Brack and others (1991)
Parker’s Pit Cave IN Hibernating 4 1987:10 1989:5 1991:9 1993:4
S = -4 P > 0.05
ND Mean = 7 SD = 2.9
CV = 41.4%
Brack (1983); Brack and others (1984, 1991)
Ray’s Cave IN Hibernating 8 1981:60 1982:95 1983:85 1985:59 1987:74 1989:53 1991:88 1993:118
S = +4 P > 0.05
ND Mean = 79 SD = 21.9
CV = 27.7%
Brack (1983); Brack and others (1984, 1991)
Saltpeter Cave IN Hibernating 5 1982:8 1987:7 1989:0 1991:12 1993:7
S = -1 P > 0.05
ND Mean = 7 SD = 4.3
CV = 61.4%
Brack (1983); Brack and others (1984, 1991)
Saltpeter Cave IN Hibernating 4 1982:46 1987:33 1991:14 1993:16
S = -4 P > 0.05
ND Mean = 27 SD = 15.1
CV = 55.9%
Brack (1983); Brack and others (1984, 1991)
Wyandotte Cave IN Hibernating 6 1981:11 1985:2 1987:12 1989:32 1991:11 1993:38
S = +8 P > 0.05
ND Mean = 18 SD = 14.0
CV = 77.8%
Brack (1983); Brack and others (1984, 1991)
Bowman Saltpeter Cave
KY Hibernating 4 1990:2 1991:5 1996:2 1998:7
S = +4 P > 0.05
ND Mean = 4 SD = 2.4
CV = 60.0%
T. Wethington (written commun., 1999, Kentucky Department of Fish and Wildlife Resources)
Clack Mountain Railroad Tunnel
KY Hibernating 4 1982:1 1987:13 1991:9 1992:13
S = +3 P > 0.05
ND Mean = 9 SD = 5.6
CV = 62.2%
T. Wethington (written commun., 1999, Kentucky Department of Fish and Wildlife Resources)
Goochland Cave KY Hibernating 4 1990:12 1991:5
S = 0 P > 0.05
ND Mean = 12 SD = 5.8
T. Wethington (written commun., 1999, Kentucky
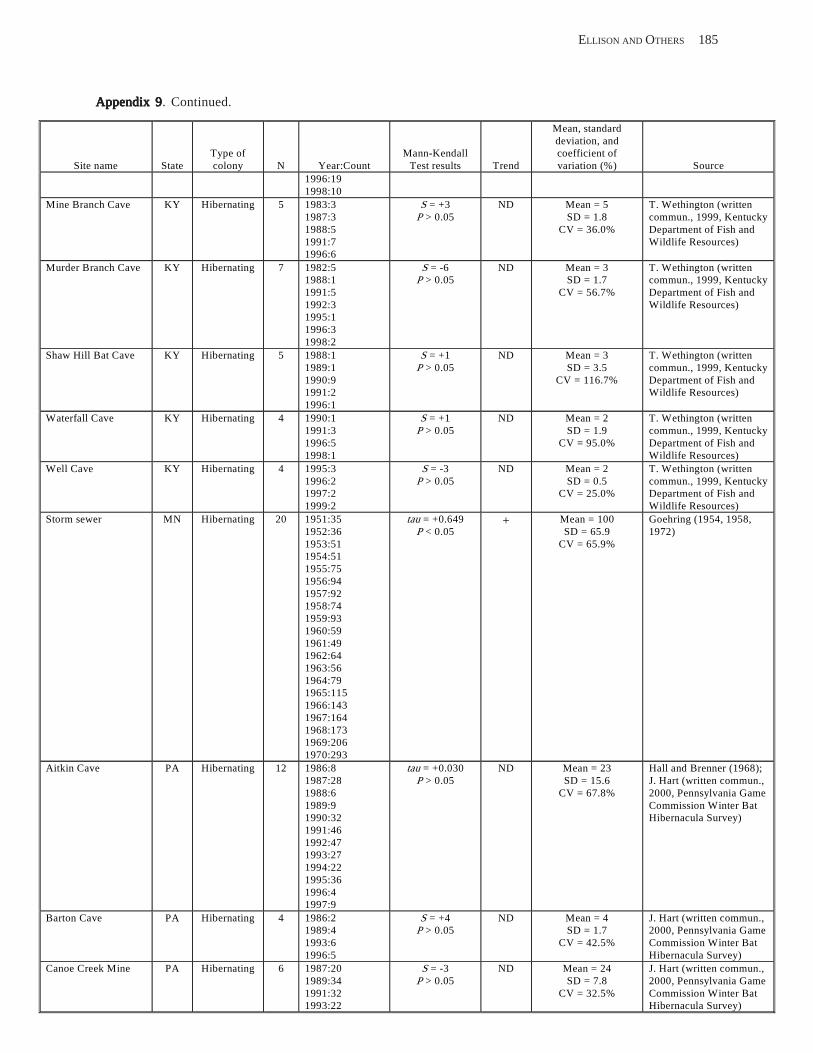
ELLISON AND OTHERS 185
Appendix 9Appendix 9Appendix 9Appendix 9Appendix 9. Continued.
Mean, standard deviation, and
Site name State Type of colony N Year:Count
Mann-Kendall Test results Trend
coefficient of variation (%) Source
1996:19 1998:10
Mine Branch Cave KY Hibernating 5 1983:3 1987:3 1988:5 1991:7 1996:6
S = +3 P > 0.05
ND Mean = 5 SD = 1.8
CV = 36.0%
T. Wethington (written commun., 1999, Kentucky Department of Fish and Wildlife Resources)
Murder Branch Cave KY Hibernating 7 1982:5 1988:1 1991:5 1992:3 1995:1 1996:3 1998:2
S = -6 P > 0.05
ND Mean = 3 SD = 1.7
CV = 56.7%
T. Wethington (written commun., 1999, Kentucky Department of Fish and Wildlife Resources)
Shaw Hill Bat Cave KY Hibernating 5 1988:1 1989:1 1990:9 1991:2 1996:1
S = +1 P > 0.05
ND Mean = 3 SD = 3.5
CV = 116.7%
T. Wethington (written commun., 1999, Kentucky Department of Fish and Wildlife Resources)
Waterfall Cave KY Hibernating 4 1990:1 1991:3 1996:5 1998:1
S = +1 P > 0.05
ND Mean = 2 SD = 1.9
CV = 95.0%
T. Wethington (written commun., 1999, Kentucky Department of Fish and Wildlife Resources)
Well Cave KY Hibernating 4 1995:3 1996:2 1997:2 1999:2
S = -3 P > 0.05
ND Mean = 2 SD = 0.5
CV = 25.0%
T. Wethington (written commun., 1999, Kentucky Department of Fish and Wildlife Resources)
Storm sewer MN Hibernating 20 1951:35 1952:36 1953:51 1954:51 1955:75 1956:94 1957:92 1958:74 1959:93 1960:59 1961:49 1962:64 1963:56 1964:79 1965:115 1966:143 1967:164 1968:173 1969:206 1970:293
tau = +0.649 P < 0.05
+ Mean = 100 SD = 65.9
CV = 65.9%
Goehring (1954, 1958, 1972)
Aitkin Cave PA Hibernating 12 1986:8 1987:28 1988:6 1989:9 1990:32 1991:46 1992:47 1993:27 1994:22 1995:36 1996:4 1997:9
tau = +0.030 P > 0.05
ND Mean = 23 SD = 15.6
CV = 67.8%
Hall and Brenner (1968); J. Hart (written commun., 2000, Pennsylvania Game Commission Winter Bat Hibernacula Survey)
Barton Cave PA Hibernating 4 1986:2 1989:4 1993:6 1996:5
S = +4 P > 0.05
ND Mean = 4 SD = 1.7
CV = 42.5%
J. Hart (written commun., 2000, Pennsylvania Game Commission Winter Bat Hibernacula Survey)
Canoe Creek Mine PA Hibernating 6 1987:20 1989:34 1991:32 1993:22
S = -3 P > 0.05
ND Mean = 24 SD = 7.8
CV = 32.5%
J. Hart (written commun., 2000, Pennsylvania Game Commission Winter Bat Hibernacula Survey)
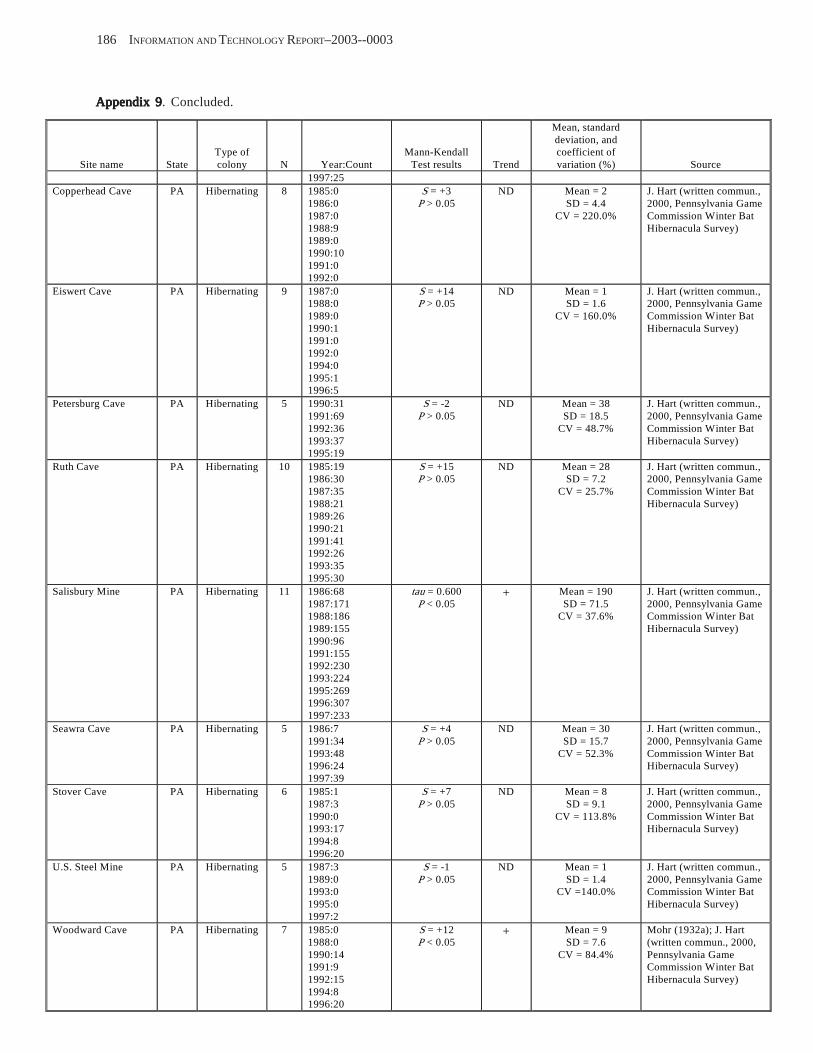
186 INFORMATION AND TECHNOLOGY REPORT–2003--0003
Appendix 9Appendix 9Appendix 9Appendix 9Appendix 9. Concluded.
Mean, standard deviation, and
Site name State Type of colony N Year:Count
Mann-Kendall Test results Trend
coefficient of variation (%) Source
1997:25 Copperhead Cave PA Hibernating 8 1985:0
1986:0 1987:0 1988:9 1989:0 1990:10 1991:0 1992:0
S = +3 P > 0.05
ND Mean = 2 SD = 4.4
CV = 220.0%
J. Hart (written commun., 2000, Pennsylvania Game Commission Winter Bat Hibernacula Survey)
Eiswert Cave PA Hibernating 9 1987:0 1988:0 1989:0 1990:1 1991:0 1992:0 1994:0 1995:1 1996:5
S = +14 P > 0.05
ND Mean = 1 SD = 1.6
CV = 160.0%
J. Hart (written commun., 2000, Pennsylvania Game Commission Winter Bat Hibernacula Survey)
Petersburg Cave PA Hibernating 5 1990:31 1991:69 1992:36 1993:37 1995:19
S = -2 P > 0.05
ND Mean = 38 SD = 18.5
CV = 48.7%
J. Hart (written commun., 2000, Pennsylvania Game Commission Winter Bat Hibernacula Survey)
Ruth Cave PA Hibernating 10 1985:19 1986:30 1987:35 1988:21 1989:26 1990:21 1991:41 1992:26 1993:35 1995:30
S = +15 P > 0.05
ND Mean = 28 SD = 7.2
CV = 25.7%
J. Hart (written commun., 2000, Pennsylvania Game Commission Winter Bat Hibernacula Survey)
Salisbury Mine PA Hibernating 11 1986:68 1987:171 1988:186 1989:155 1990:96 1991:155 1992:230 1993:224 1995:269 1996:307 1997:233
tau = 0.600 P < 0.05
+ Mean = 190 SD = 71.5
CV = 37.6%
J. Hart (written commun., 2000, Pennsylvania Game Commission Winter Bat Hibernacula Survey)
Seawra Cave PA Hibernating 5 1986:7 1991:34 1993:48 1996:24 1997:39
S = +4 P > 0.05
ND Mean = 30 SD = 15.7
CV = 52.3%
J. Hart (written commun., 2000, Pennsylvania Game Commission Winter Bat Hibernacula Survey)
Stover Cave PA Hibernating 6 1985:1 1987:3 1990:0 1993:17 1994:8 1996:20
S = +7 P > 0.05
ND Mean = 8 SD = 9.1
CV = 113.8%
J. Hart (written commun., 2000, Pennsylvania Game Commission Winter Bat Hibernacula Survey)
U.S. Steel Mine PA Hibernating 5 1987:3 1989:0 1993:0 1995:0 1997:2
S = -1 P > 0.05
ND Mean = 1 SD = 1.4
CV =140.0%
J. Hart (written commun., 2000, Pennsylvania Game Commission Winter Bat Hibernacula Survey)
Woodward Cave PA Hibernating 7 1985:0 1988:0 1990:14 1991:9 1992:15 1994:8 1996:20
S = +12 P < 0.05
+ Mean = 9 SD = 7.6
CV = 84.4%
Mohr (1932a); J. Hart (written commun., 2000, Pennsylvania Game Commission Winter Bat Hibernacula Survey)
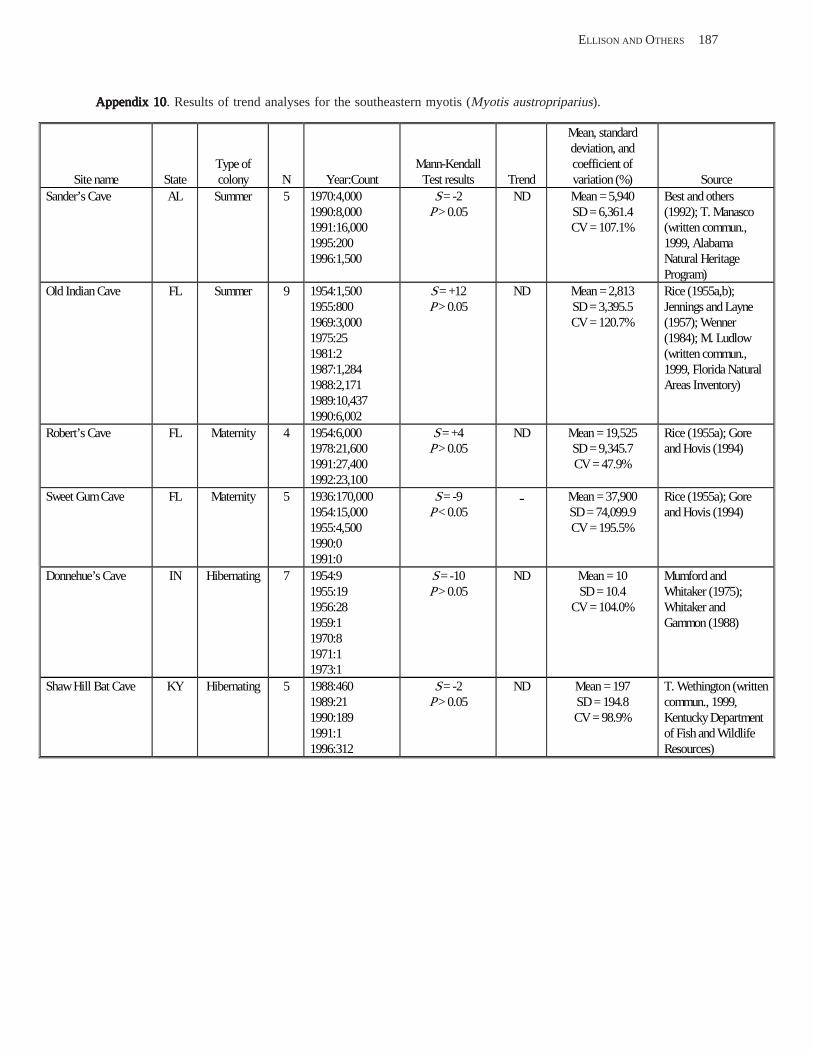
ELLISON AND OTHERS 187
Appendix 10Appendix 10Appendix 10Appendix 10Appendix 10. Results of trend analyses for the southeastern myotis (Myotis austropriparius).
Mean, standard deviation, and
Site name State Type of colony N Year:Count
Mann-Kendall Test results Trend
coefficient of variation (%) Source
Sander’s Cave AL Summer 5 1970:4,000 S = -2 ND Mean = 5,940 Best and others 1990:8,000 1991:16,000 1995:200
P > 0.05 SD = 6,361.4 CV = 107.1%
(1992); T. Manasco (written commun., 1999, Alabama
1996:1,500 Natural Heritage Program)
Old Indian Cave FL Summer 9 1954:1,500 1955:800 1969:3,000 1975:25 1981:2 1987:1,284 1988:2,171 1989:10,437 1990:6,002
S = +12 P > 0.05
ND Mean = 2,813 SD = 3,395.5 CV = 120.7%
Rice (1955a,b); Jennings and Layne (1957); Wenner (1984); M. Ludlow (written commun., 1999, Florida Natural Areas Inventory)
Robert’s Cave FL Maternity 4 1954:6,000 1978:21,600 1991:27,400 1992:23,100
S = +4 P > 0.05
ND Mean = 19,525 SD = 9,345.7 CV = 47.9%
Rice (1955a); Gore and Hovis (1994)
Sweet Gum Cave FL Maternity 5 1936:170,000 1954:15,000 1955:4,500 1990:0 1991:0
S = -9 P < 0.05
- Mean = 37,900 SD = 74,099.9 CV = 195.5%
Rice (1955a); Gore and Hovis (1994)
Donnehue’s Cave IN Hibernating 7 1954:9 1955:19 1956:28 1959:1 1970:8 1971:1 1973:1
S = -10 P > 0.05
ND Mean = 10 SD = 10.4
CV = 104.0%
Mumford and Whitaker (1975); Whitaker and Gammon (1988)
ShawHill Bat Cave KY Hibernating 5 1988:460 1989:21 1990:189 1991:1 1996:312
S = -2 P > 0.05
ND Mean = 197 SD = 194.8 CV = 98.9%
T. Wethington (written commun., 1999, Kentucky Department of Fish and Wildlife Resources)

188 INFORMATION AND TECHNOLOGY REPORT–2003--0003
Appendix 11Appendix 11Appendix 11Appendix 11Appendix 11. Results of trend analyses for the western small-footed myotis (Myotis ciliolabrum).
Mean, standard deviation, and
Site name State Type of colony N Year:Count
Mann-Kendall Test results Trend
coefficient of variation (%) Source
Torgac Cave NM Hibernating 7 1966:10 1987:30 1988:7 1989:0 1990:26 1994:111 1995:108
S = +7 P > 0.05
ND Mean = 42 SD= 47.5
CV = 113.1%
Jagnow(1998)
Jewel Cave SD Hibernating 5 1967:4 1969:20 1986:6 1990:17 1992:4
S = -1 P > 0.05
ND Mean = 10 SD = 7.7
CV = 77.0%
Turner and Jones (1968); Martin and Hawks (1972);Turner (1974); Worthington (1992); Choate and Anderson (1997); M. Curtin (written commun., 2000, National Park Service, Jewel Cave National Monument)
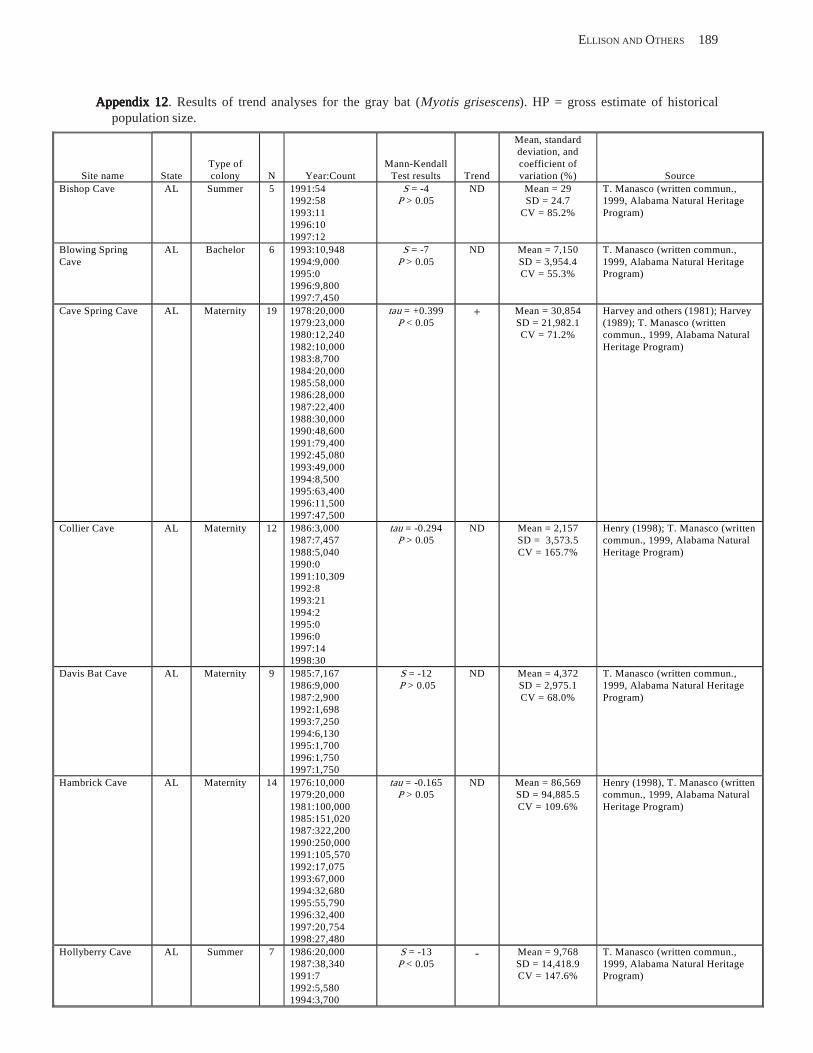
ELLISON AND OTHERS 189
Appendix 12Appendix 12Appendix 12Appendix 12Appendix 12. Results of trend analyses for the gray bat (Myotis grisescens). HP = gross estimate of historical population size.
Site name State Type of colony N Year:Count
Mann-Kendall Test results Trend
Mean, standard deviation, and coefficient of variation (%) Source
Bishop Cave AL Summer 5 1991:54 1992:58 1993:11 1996:10 1997:12
S = -4 P > 0.05
ND Mean = 29 SD = 24.7
CV = 85.2%
T. Manasco (written commun., 1999, Alabama Natural Heritage Program)
Blowing Spring Cave
AL Bachelor 6 1993:10,948 1994:9,000 1995:0 1996:9,800 1997:7,450
S = -7 P > 0.05
ND Mean = 7,150 SD = 3,954.4 CV = 55.3%
T. Manasco (written commun., 1999, Alabama Natural Heritage Program)
Cave Spring Cave AL Maternity 19 1978:20,000 1979:23,000 1980:12,240 1982:10,000 1983:8,700 1984:20,000 1985:58,000 1986:28,000 1987:22,400 1988:30,000 1990:48,600 1991:79,400 1992:45,080 1993:49,000 1994:8,500 1995:63,400 1996:11,500 1997:47,500
tau = +0.399 P < 0.05
+ Mean = 30,854 SD = 21,982.1 CV = 71.2%
Harvey and others (1981); Harvey (1989); T. Manasco (written commun., 1999, Alabama Natural Heritage Program)
Collier Cave AL Maternity 12 1986:3,000 1987:7,457 1988:5,040 1990:0 1991:10,309 1992:8 1993:21 1994:2 1995:0 1996:0 1997:14 1998:30
tau = -0.294 P > 0.05
ND Mean = 2,157 SD = 3,573.5 CV = 165.7%
Henry (1998); T. Manasco (written commun., 1999, Alabama Natural Heritage Program)
Davis Bat Cave AL Maternity 9 1985:7,167 1986:9,000 1987:2,900 1992:1,698 1993:7,250 1994:6,130 1995:1,700 1996:1,750 1997:1,750
S = -12 P > 0.05
ND Mean = 4,372 SD = 2,975.1 CV = 68.0%
T. Manasco (written commun., 1999, Alabama Natural Heritage Program)
Hambrick Cave AL Maternity 14 1976:10,000 1979:20,000 1981:100,000 1985:151,020 1987:322,200 1990:250,000 1991:105,570 1992:17,075 1993:67,000 1994:32,680 1995:55,790 1996:32,400 1997:20,754 1998:27,480
tau = -0.165 P > 0.05
ND Mean = 86,569 SD = 94,885.5 CV = 109.6%
Henry (1998), T. Manasco (written commun., 1999, Alabama Natural Heritage Program)
Hollyberry Cave AL Summer 7 1986:20,000 1987:38,340 1991:7 1992:5,580 1994:3,700
S = -13 P < 0.05
- Mean = 9,768 SD = 14,418.9 CV = 147.6%
T. Manasco (written commun., 1999, Alabama Natural Heritage Program)

190 INFORMATION AND TECHNOLOGY REPORT–2003--0003
Appendix 12.Appendix 12.Appendix 12.Appendix 12.Appendix 12. Continued.
Site name State Type of colony N Year:Count
Mann-Kendall Test results Trend
Mean, standard deviation, and coefficient of variation (%) Source
1995:750 1997:0
Indian Cave AL Maternity 11 1976:6,500 1979:4,568 1985:5,430 1987:3,070 1991:4,076 1992:4,838 1993:5,578 1994:4,072 1995:13,590 1996:12,500 1997:1,415
tau = -0.020 P > 0.05
ND Mean = 5,967 SD = 3,755.3 CV = 62.9%
T. Manasco (written commun., 1999, Alabama Natural Heritage Program)
King’s School Cave AL Bachelor 7 1991:1,600 1992:0 1993:34 1994:200 1995:189 1996:784 1997:93
S = +1 P > 0.05
ND Mean = 414 SD = 585.8
CV = 141.5%
T. Manasco (written commun., 1999, Alabama Natural Heritage Program)
McKinney Cave AL Summer 4 1993:25 1994:11 1995:13 1997:3
S = -4 P > 0.05
ND Mean = 13 SD = 9.1
CV = 70.0%
T. Manasco (written commun., 1999, Alabama Natural Heritage Program)
Old Blowing Cave AL Summer 4 1992:1,750 1993:4,214 1996:1,850 1997:1,190
S = -2 P > 0.05
ND Mean = 2,251 SD = 1,340.5 CV = 59.6%
T. Manasco (written commun., 1999, Alabama Natural Heritage Program)
Sauta Cave AL Maternity 17 1976:126,000 1979:285,000 1980:268,500 1981:256,080 1982:360,000 1983:274,000 1984:360,000 1985:485,400 1989:350,000 1990:324,600 1991:173,288 1992:105,370 1993:174,500 1994:116,600 1995:126,500 1996:220,000 1997:187,500
tau = -0.235 P > 0.05
ND Mean = 246,667 SD = 106,917.8
CV = 43.3%
White and Seginak (1987); T. Manasco (written commun., 1999, Alabama Natural Heritage Program)
Bennett Cave AR Transient 6 1979:2,500 1983:2,500 1984:0 1985:8 1986:170 1987:0
S = -7 P > 0.05
ND Mean = 863 SD = 1,269.7 CV = 147.1%
Harvey and others (1981); Harvey (1989)
Big Creek Cave AR Maternity 8 1980:18,000 1981:18,000 1983:18,000 1984:5,500 1985:0 1986:15,460 1987:2,250 1988:1,680
S = -17 P < 0.05
- Mean = 9,895 SD = 8,169.2 CV = 82.6%
Harvey and others (1981); Harvey (1989)
Blagg Cave AR Maternity 8 1975:3,000 1977:3,600 1979:3,000 1983:13,000 1984:1,000 1985:3,360 1986:1,350 1988:2,520
S = -7 P > 0.05
ND Mean = 3,854 SD = 3,809.9 CV = 98.9%
Saugey (1978); Harvey and others (1981); Harvey (1989)

ELLISON AND OTHERS 191
Appendix 12.Appendix 12.Appendix 12.Appendix 12.Appendix 12. Continued.
Site name State Type of colony N Year:Count
Mann-Kendall Test results Trend
Mean, standard deviation, and coefficient of variation (%) Source
Blanchard Springs Caverns
AR Hibernating 18 1979:150 1983:7,000 1985:33 1986:55 1987:188 1988:520 1989:6,200 1990:8,000 1991:10,000 1992:18,000 1993:20,000 1994:58,600 1996:65,000 1997:71,000 1998:65,000 1999:85,000 2000:81,900 2001:147,850
tau = +0.869 P < 0.05
+ Mean = 35,805 SD = 42,437.9 CV = 118.5%
Harvey and others (1981); Harvey (1989); M. Harvey (written commun., 2003)
AR Bachelor 13 1978:18,000 1983:18,000 1984:10,000 1985:1,000 1986:8,000 1987:7,000 1988:7,000 1996:4,250 1997:20,400 1998:3,060 1999:6,500 2000:20,600 2001:17,000
tau = -0.103 P > 0.05
ND Mean = 10,831 SD = 6,982.2 CV = 64.5%
Harvey and others (1981); Harvey (1989); M. Harvey (written commun., 2003)
Bonanza Cave AR Hibernating 7 1979:250,000 1983:250,000 1985:250,000 1988:250,000 1996:243,000 2000:150,000 2001:55,000
S = -15 P < 0.05
- Mean = 206,857 SD = 76,425.2 CV = 36.9%
Henry (1998); M. Harvey (written commun., 2003)
Bone Cave AR Maternity 10 1975:15,000 1979:17,000 1980:36,000 1981:18,000 1983:52,000 1984:15,000 1985:5,000 1986:156,000 1987:37,220 1988:46,500
S = +14 P > 0.05
ND Mean = 39,772 SD = 43,657.1 CV = 109.8%
Sealander and Young (1955); Harvey and others (1981); Harvey (1989)
Brewer Cave AR Transient 5 1979:2,200 1983:2,200 1984:0 1985:670 1986:80
S = -5 P > 0.05
ND Mean = 1,030 SD = 1,099.0 CV = 106.7%
Harvey and others (1981); Harvey (1989)
Cave Mountain Cave
AR Hibernating 13 1976:300 1979:40 1980:700 1983:700 1984:125 1986:240 1988:205 1996:108,000 1997:54,500 1998:70,000 1999:200,000 2000:172,500 2001:234,850
S = +0.632 P < 0.05
+ Mean = 64,782 SD = 86,549.9 CV = 133.6%
Harvey and others (1981); Harvey (1989); M. Harvey (written commun., 2003)
Cave River Cave AR Maternity 9 1977:10,200 1979:7,700
S = -11 P > 0.05
ND Mean = 13,730 SD = 9,407.6
Harvey and others (1981); Harvey (1989)
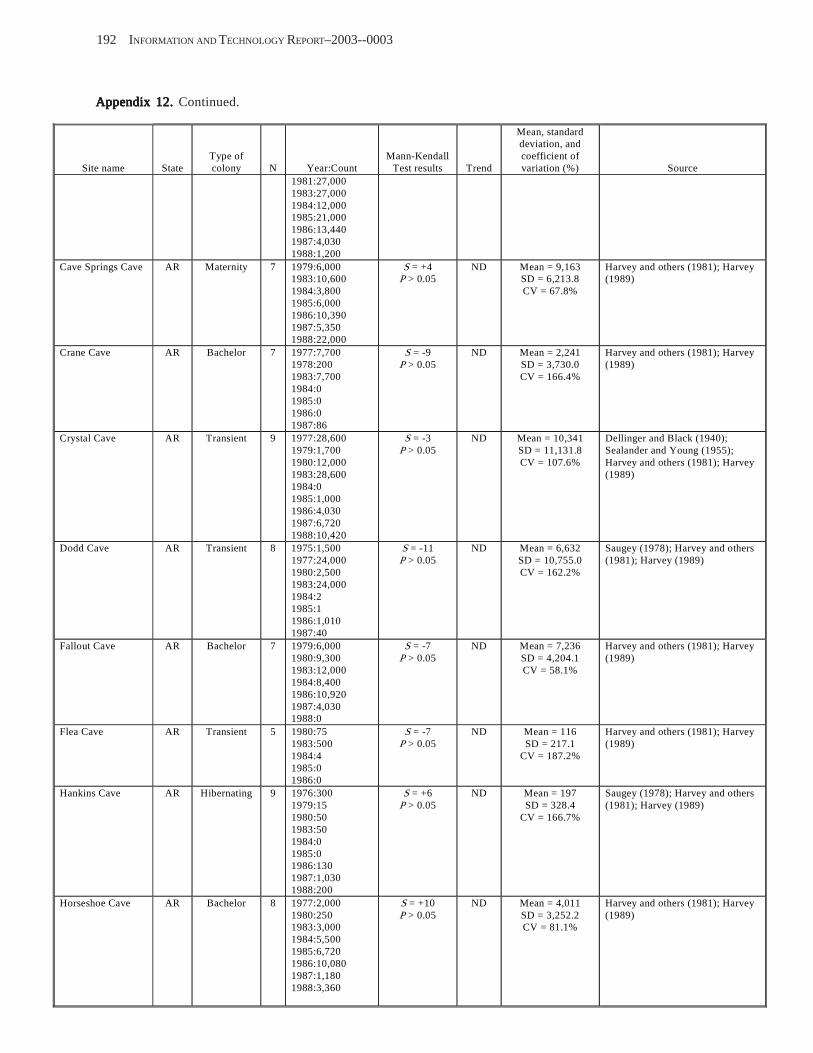
192 INFORMATION AND TECHNOLOGY REPORT–2003--0003
Appendix 12.Appendix 12.Appendix 12.Appendix 12.Appendix 12. Continued.
Site name State Type of colony N Year:Count
Mann-Kendall Test results Trend
Mean, standard deviation, and coefficient of variation (%) Source
1981:27,000 1983:27,000 1984:12,000 1985:21,000 1986:13,440 1987:4,030 1988:1,200
Cave Springs Cave AR Maternity 7 1979:6,000 1983:10,600 1984:3,800 1985:6,000 1986:10,390 1987:5,350 1988:22,000
S = +4 P > 0.05
ND Mean = 9,163 SD = 6,213.8 CV = 67.8%
Harvey and others (1981); Harvey (1989)
Crane Cave AR Bachelor 7 1977:7,700 1978:200 1983:7,700 1984:0 1985:0 1986:0 1987:86
S = -9 P > 0.05
ND Mean = 2,241 SD = 3,730.0 CV = 166.4%
Harvey and others (1981); Harvey (1989)
Crystal Cave AR Transient 9 1977:28,600 1979:1,700 1980:12,000 1983:28,600 1984:0 1985:1,000 1986:4,030 1987:6,720 1988:10,420
S = -3 P > 0.05
ND Mean = 10,341 SD = 11,131.8 CV = 107.6%
Dellinger and Black (1940); Sealander and Young (1955); Harvey and others (1981); Harvey (1989)
Dodd Cave AR Transient 8 1975:1,500 1977:24,000 1980:2,500 1983:24,000 1984:2 1985:1 1986:1,010 1987:40
S = -11 P > 0.05
ND Mean = 6,632 SD = 10,755.0 CV = 162.2%
Saugey (1978); Harvey and others (1981); Harvey (1989)
Fallout Cave AR Bachelor 7 1979:6,000 1980:9,300 1983:12,000 1984:8,400 1986:10,920 1987:4,030 1988:0
S = -7 P > 0.05
ND Mean = 7,236 SD = 4,204.1 CV = 58.1%
Harvey and others (1981); Harvey (1989)
Flea Cave AR Transient 5 1980:75 1983:500 1984:4 1985:0 1986:0
S = -7 P > 0.05
ND Mean = 116 SD = 217.1
CV = 187.2%
Harvey and others (1981); Harvey (1989)
Hankins Cave AR Hibernating 9 1976:300 1979:15 1980:50 1983:50 1984:0 1985:0 1986:130 1987:1,030 1988:200
S = +6 P > 0.05
ND Mean = 197 SD = 328.4
CV = 166.7%
Saugey (1978); Harvey and others (1981); Harvey (1989)
Horseshoe Cave AR Bachelor 8 1977:2,000 1980:250 1983:3,000 1984:5,500 1985:6,720 1986:10,080 1987:1,180 1988:3,360
S = +10 P > 0.05
ND Mean = 4,011 SD = 3,252.2 CV = 81.1%
Harvey and others (1981); Harvey (1989)
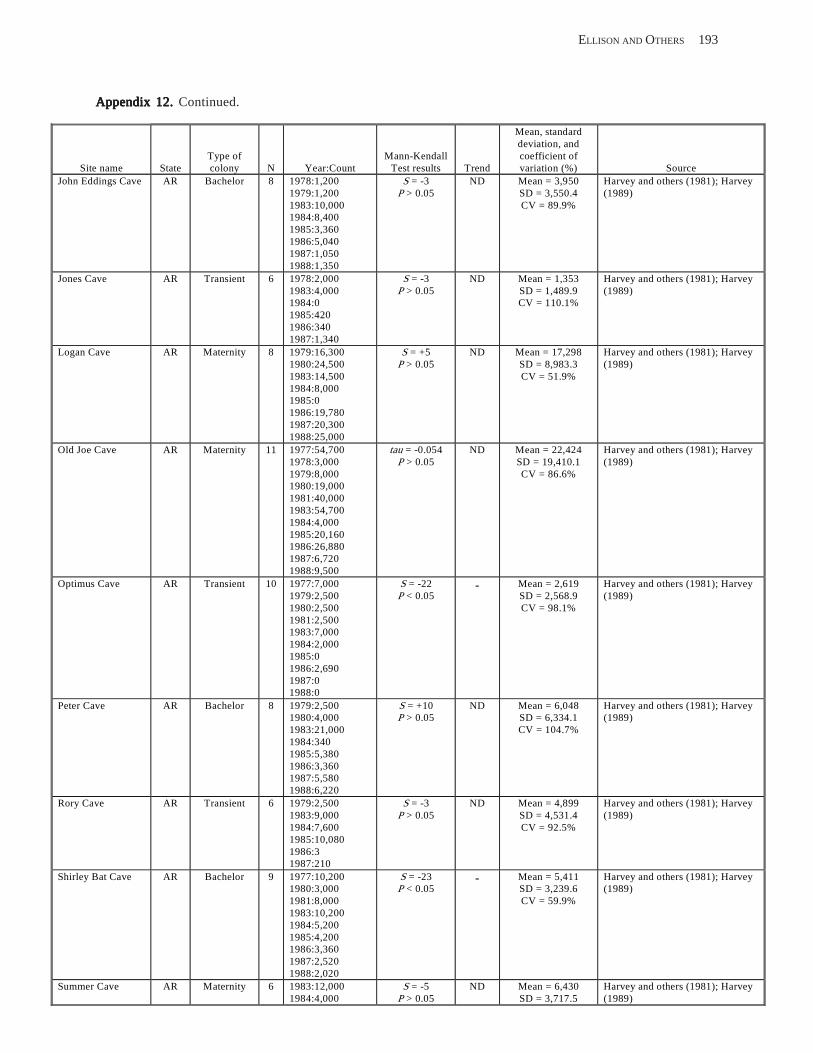
ELLISON AND OTHERS 193
Appendix 12.Appendix 12.Appendix 12.Appendix 12.Appendix 12. Continued.
Site name State Type of colony N Year:Count
Mann-Kendall Test results Trend
Mean, standard deviation, and coefficient of variation (%) Source
John Eddings Cave AR Bachelor 8 1978:1,200 1979:1,200 1983:10,000 1984:8,400 1985:3,360 1986:5,040 1987:1,050 1988:1,350
S = -3 P > 0.05
ND Mean = 3,950 SD = 3,550.4 CV = 89.9%
Harvey and others (1981); Harvey (1989)
Jones Cave AR Transient 6 1978:2,000 1983:4,000 1984:0 1985:420 1986:340 1987:1,340
S = -3 P > 0.05
ND Mean = 1,353 SD = 1,489.9 CV = 110.1%
Harvey and others (1981); Harvey (1989)
Logan Cave AR Maternity 8 1979:16,300 1980:24,500 1983:14,500 1984:8,000 1985:0 1986:19,780 1987:20,300 1988:25,000
S = +5 P > 0.05
ND Mean = 17,298 SD = 8,983.3 CV = 51.9%
Harvey and others (1981); Harvey (1989)
Old Joe Cave AR Maternity 11 1977:54,700 1978:3,000 1979:8,000 1980:19,000 1981:40,000 1983:54,700 1984:4,000 1985:20,160 1986:26,880 1987:6,720 1988:9,500
tau = -0.054 P > 0.05
ND Mean = 22,424 SD = 19,410.1 CV = 86.6%
Harvey and others (1981); Harvey (1989)
Optimus Cave AR Transient 10 1977:7,000 1979:2,500 1980:2,500 1981:2,500 1983:7,000 1984:2,000 1985:0 1986:2,690 1987:0 1988:0
S = -22 P < 0.05
- Mean = 2,619 SD = 2,568.9 CV = 98.1%
Harvey and others (1981); Harvey (1989)
Peter Cave AR Bachelor 8 1979:2,500 1980:4,000 1983:21,000 1984:340 1985:5,380 1986:3,360 1987:5,580 1988:6,220
S = +10 P > 0.05
ND Mean = 6,048 SD = 6,334.1 CV = 104.7%
Harvey and others (1981); Harvey (1989)
Rory Cave AR Transient 6 1979:2,500 1983:9,000 1984:7,600 1985:10,080 1986:3 1987:210
S = -3 P > 0.05
ND Mean = 4,899 SD = 4,531.4 CV = 92.5%
Harvey and others (1981); Harvey (1989)
Shirley Bat Cave AR Bachelor 9 1977:10,200 1980:3,000 1981:8,000 1983:10,200 1984:5,200 1985:4,200 1986:3,360 1987:2,520 1988:2,020
S = -23 P < 0.05
- Mean = 5,411 SD = 3,239.6 CV = 59.9%
Harvey and others (1981); Harvey (1989)
Summer Cave AR Maternity 6 1983:12,000 1984:4,000
S = -5 P > 0.05
ND Mean = 6,430 SD = 3,717.5
Harvey and others (1981); Harvey (1989)
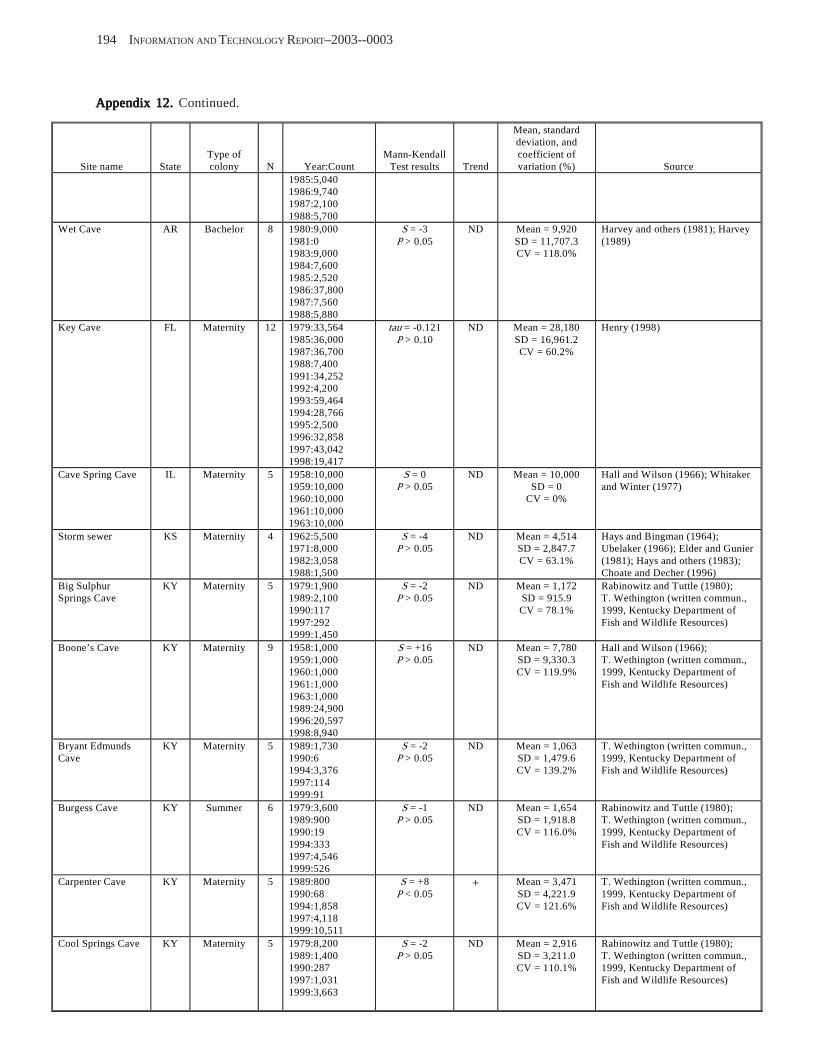
194 INFORMATION AND TECHNOLOGY REPORT–2003--0003
Appendix 12.Appendix 12.Appendix 12.Appendix 12.Appendix 12. Continued.
Site name State Type of colony N Year:Count
Mann-Kendall Test results Trend
Mean, standard deviation, and coefficient of variation (%) Source
1985:5,040 1986:9,740 1987:2,100 1988:5,700
Wet Cave AR Bachelor 8 1980:9,000 1981:0 1983:9,000 1984:7,600 1985:2,520 1986:37,800 1987:7,560 1988:5,880
S = -3 P > 0.05
ND Mean = 9,920 SD = 11,707.3 CV = 118.0%
Harvey and others (1981); Harvey (1989)
Key Cave FL Maternity 12 1979:33,564 1985:36,000 1987:36,700 1988:7,400 1991:34,252 1992:4,200 1993:59,464 1994:28,766 1995:2,500 1996:32,858 1997:43,042 1998:19,417
tau = -0.121 P > 0.10
ND Mean = 28,180 SD = 16,961.2 CV = 60.2%
Henry (1998)
Cave Spring Cave IL Maternity 5 1958:10,000 1959:10,000 1960:10,000 1961:10,000 1963:10,000
S = 0 P > 0.05
ND Mean = 10,000 SD = 0
CV = 0%
Hall and Wilson (1966); Whitaker and Winter (1977)
Storm sewer KS Maternity 4 1962:5,500 1971:8,000 1982:3,058 1988:1,500
S = -4 P > 0.05
ND Mean = 4,514 SD = 2,847.7 CV = 63.1%
Hays and Bingman (1964); Ubelaker (1966); Elder and Gunier (1981); Hays and others (1983); Choate and Decher (1996)
Big Sulphur Springs Cave
KY Maternity 5 1979:1,900 1989:2,100 1990:117 1997:292 1999:1,450
S = -2 P > 0.05
ND Mean = 1,172 SD = 915.9 CV = 78.1%
Rabinowitz and Tuttle (1980); T. Wethington (written commun., 1999, Kentucky Department of Fish and Wildlife Resources)
Boone’s Cave KY Maternity 9 1958:1,000 1959:1,000 1960:1,000 1961:1,000 1963:1,000 1989:24,900 1996:20,597 1998:8,940
S = +16 P > 0.05
ND Mean = 7,780 SD = 9,330.3 CV = 119.9%
Hall and Wilson (1966); T. Wethington (written commun., 1999, Kentucky Department of Fish and Wildlife Resources)
Bryant Edmunds Cave
KY Maternity 5 1989:1,730 1990:6 1994:3,376 1997:114 1999:91
S = -2 P > 0.05
ND Mean = 1,063 SD = 1,479.6 CV = 139.2%
T. Wethington (written commun., 1999, Kentucky Department of Fish and Wildlife Resources)
Burgess Cave KY Summer 6 1979:3,600 1989:900 1990:19 1994:333 1997:4,546 1999:526
S = -1 P > 0.05
ND Mean = 1,654 SD = 1,918.8 CV = 116.0%
Rabinowitz and Tuttle (1980); T. Wethington (written commun., 1999, Kentucky Department of Fish and Wildlife Resources)
Carpenter Cave KY Maternity 5 1989:800 1990:68 1994:1,858 1997:4,118 1999:10,511
S = +8 P < 0.05
+ Mean = 3,471 SD = 4,221.9 CV = 121.6%
T. Wethington (written commun., 1999, Kentucky Department of Fish and Wildlife Resources)
Cool Springs Cave KY Maternity 5 1979:8,200 1989:1,400 1990:287 1997:1,031 1999:3,663
S = -2 P > 0.05
ND Mean = 2,916 SD = 3,211.0 CV = 110.1%
Rabinowitz and Tuttle (1980); T. Wethington (written commun., 1999, Kentucky Department of Fish and Wildlife Resources)
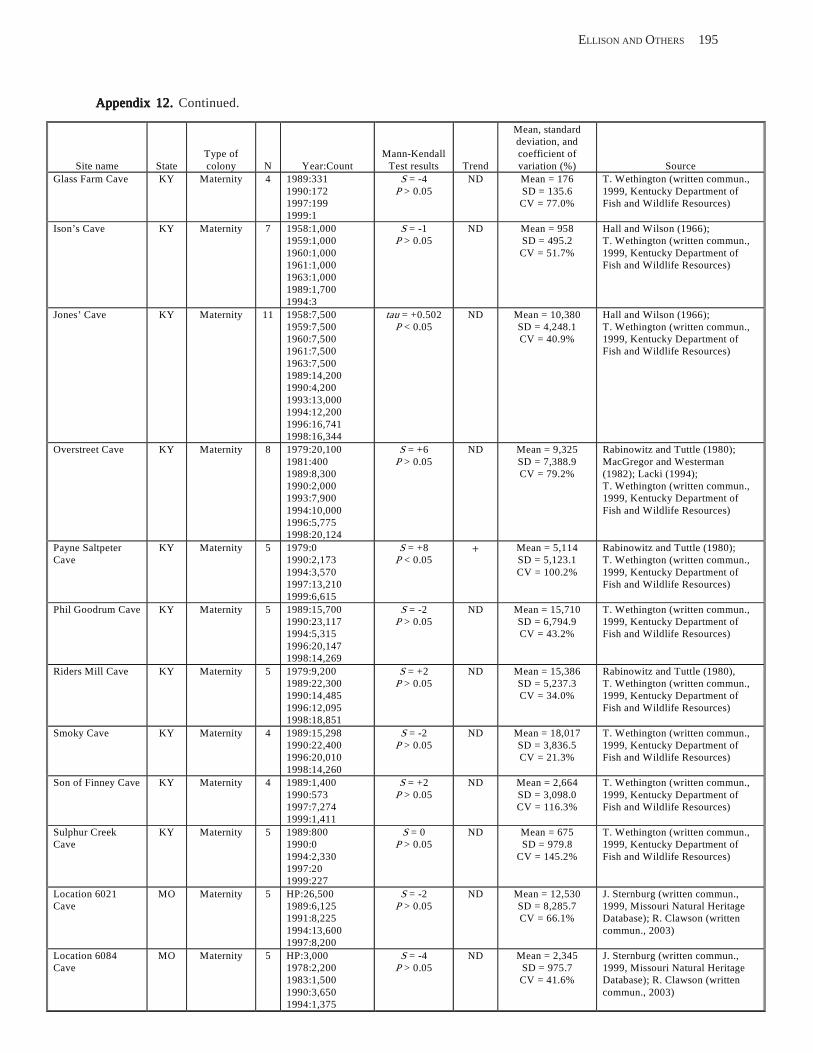
ELLISON AND OTHERS 195
Appendix 12.Appendix 12.Appendix 12.Appendix 12.Appendix 12. Continued.
Mean, standard deviation, and
Site name State Type of colony N Year:Count
Mann-Kendall Test results Trend
coefficient of variation (%) Source
Glass Farm Cave KY Maternity 4 1989:331 1990:172 1997:199 1999:1
S = -4 P > 0.05
ND Mean = 176 SD = 135.6 CV = 77.0%
T. Wethington (written commun., 1999, Kentucky Department of Fish and Wildlife Resources)
Ison’s Cave KY Maternity 7 1958:1,000 1959:1,000 1960:1,000 1961:1,000 1963:1,000 1989:1,700 1994:3
S = -1 P > 0.05
ND Mean = 958 SD = 495.2 CV = 51.7%
Hall and Wilson (1966); T. Wethington (written commun., 1999, Kentucky Department of Fish and Wildlife Resources)
Jones’ Cave KY Maternity 11 1958:7,500 1959:7,500 1960:7,500 1961:7,500 1963:7,500 1989:14,200 1990:4,200 1993:13,000 1994:12,200 1996:16,741 1998:16,344
tau = +0.502 P < 0.05
ND Mean = 10,380 SD = 4,248.1 CV = 40.9%
Hall and Wilson (1966); T. Wethington (written commun., 1999, Kentucky Department of Fish and Wildlife Resources)
Overstreet Cave KY Maternity 8 1979:20,100 1981:400 1989:8,300 1990:2,000 1993:7,900 1994:10,000 1996:5,775 1998:20,124
S = +6 P > 0.05
ND Mean = 9,325 SD = 7,388.9 CV = 79.2%
Rabinowitz and Tuttle (1980); MacGregor and Westerman (1982); Lacki (1994); T. Wethington (written commun., 1999, Kentucky Department of Fish and Wildlife Resources)
Payne Saltpeter Cave
KY Maternity 5 1979:0 1990:2,173 1994:3,570 1997:13,210 1999:6,615
S = +8 P < 0.05
+ Mean = 5,114 SD = 5,123.1 CV = 100.2%
Rabinowitz and Tuttle (1980); T. Wethington (written commun., 1999, Kentucky Department of Fish and Wildlife Resources)
Phil Goodrum Cave KY Maternity 5 1989:15,700 1990:23,117 1994:5,315 1996:20,147 1998:14,269
S = -2 P > 0.05
ND Mean = 15,710 SD = 6,794.9 CV = 43.2%
T. Wethington (written commun., 1999, Kentucky Department of Fish and Wildlife Resources)
Riders Mill Cave KY Maternity 5 1979:9,200 1989:22,300 1990:14,485 1996:12,095 1998:18,851
S = +2 P > 0.05
ND Mean = 15,386 SD = 5,237.3 CV = 34.0%
Rabinowitz and Tuttle (1980), T. Wethington (written commun., 1999, Kentucky Department of Fish and Wildlife Resources)
Smoky Cave KY Maternity 4 1989:15,298 1990:22,400 1996:20,010 1998:14,260
S = -2 P > 0.05
ND Mean = 18,017 SD = 3,836.5 CV = 21.3%
T. Wethington (written commun., 1999, Kentucky Department of Fish and Wildlife Resources)
Son of Finney Cave KY Maternity 4 1989:1,400 1990:573 1997:7,274 1999:1,411
S = +2 P > 0.05
ND Mean = 2,664 SD = 3,098.0 CV = 116.3%
T. Wethington (written commun., 1999, Kentucky Department of Fish and Wildlife Resources)
Sulphur Creek Cave
KY Maternity 5 1989:800 1990:0 1994:2,330 1997:20 1999:227
S = 0 P > 0.05
ND Mean = 675 SD = 979.8
CV = 145.2%
T. Wethington (written commun., 1999, Kentucky Department of Fish and Wildlife Resources)
Location 6021 Cave
MO Maternity 5 HP:26,500 1989:6,125 1991:8,225 1994:13,600 1997:8,200
S = -2 P > 0.05
ND Mean = 12,530 SD = 8,285.7 CV = 66.1%
J. Sternburg (written commun., 1999, Missouri Natural Heritage Database); R. Clawson (written commun., 2003)
Location 6084 Cave
MO Maternity 5 HP:3,000 1978:2,200 1983:1,500 1990:3,650 1994:1,375
S = -4 P > 0.05
ND Mean = 2,345 SD = 975.7 CV = 41.6%
J. Sternburg (written commun., 1999, Missouri Natural Heritage Database); R. Clawson (written commun., 2003)
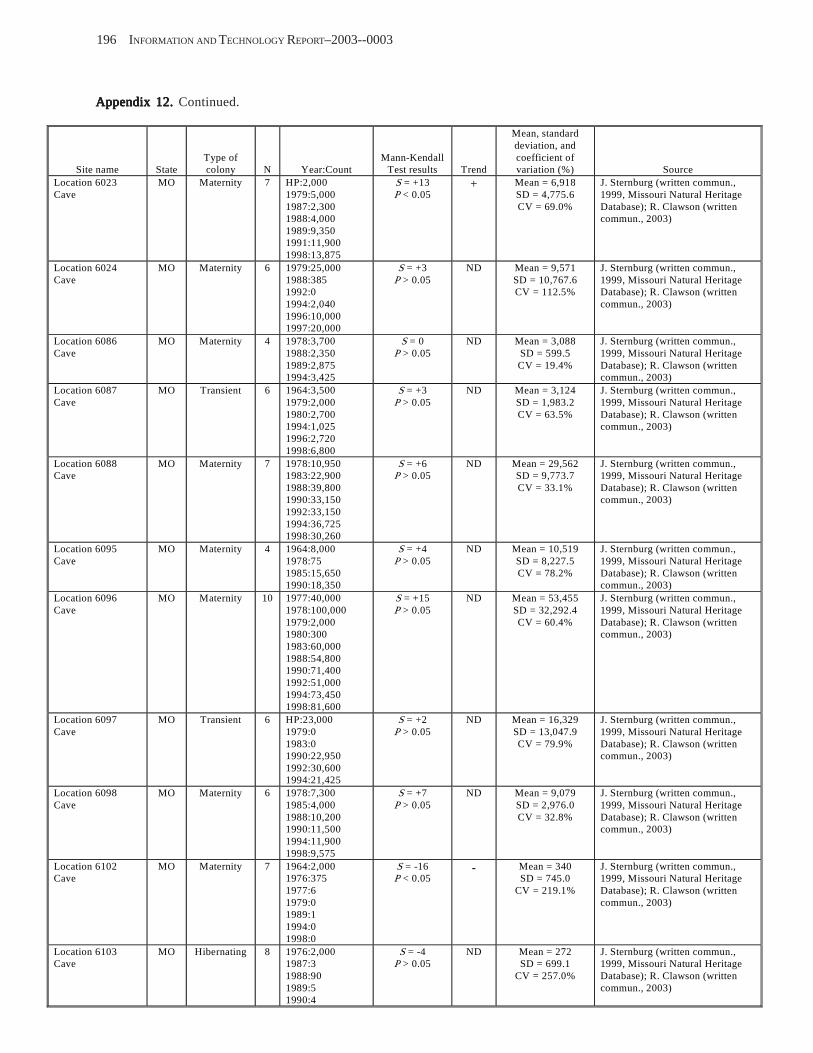
196 INFORMATION AND TECHNOLOGY REPORT–2003--0003
Appendix 12.Appendix 12.Appendix 12.Appendix 12.Appendix 12. Continued.
Site name State Type of colony N Year:Count
Mann-Kendall Test results Trend
Mean, standard deviation, and coefficient of variation (%) Source
Location 6023 Cave
MO Maternity 7 HP:2,000 1979:5,000 1987:2,300 1988:4,000 1989:9,350 1991:11,900 1998:13,875
S = +13 P < 0.05
+ Mean = 6,918 SD = 4,775.6 CV = 69.0%
J. Sternburg (written commun., 1999, Missouri Natural Heritage Database); R. Clawson (written commun., 2003)
Location 6024 Cave
MO Maternity 6 1979:25,000 1988:385 1992:0 1994:2,040 1996:10,000 1997:20,000
S = +3 P > 0.05
ND Mean = 9,571 SD = 10,767.6 CV = 112.5%
J. Sternburg (written commun., 1999, Missouri Natural Heritage Database); R. Clawson (written commun., 2003)
Location 6086 Cave
MO Maternity 4 1978:3,700 1988:2,350 1989:2,875 1994:3,425
S = 0 P > 0.05
ND Mean = 3,088 SD = 599.5 CV = 19.4%
J. Sternburg (written commun., 1999, Missouri Natural Heritage Database); R. Clawson (written commun., 2003)
Location 6087 Cave
MO Transient 6 1964:3,500 1979:2,000 1980:2,700 1994:1,025 1996:2,720 1998:6,800
S = +3 P > 0.05
ND Mean = 3,124 SD = 1,983.2 CV = 63.5%
J. Sternburg (written commun., 1999, Missouri Natural Heritage Database); R. Clawson (written commun., 2003)
Location 6088 Cave
MO Maternity 7 1978:10,950 1983:22,900 1988:39,800 1990:33,150 1992:33,150 1994:36,725 1998:30,260
S = +6 P > 0.05
ND Mean = 29,562 SD = 9,773.7 CV = 33.1%
J. Sternburg (written commun., 1999, Missouri Natural Heritage Database); R. Clawson (written commun., 2003)
Location 6095 Cave
MO Maternity 4 1964:8,000 1978:75 1985:15,650 1990:18,350
S = +4 P > 0.05
ND Mean = 10,519 SD = 8,227.5 CV = 78.2%
J. Sternburg (written commun., 1999, Missouri Natural Heritage Database); R. Clawson (written commun., 2003)
Location 6096 Cave
MO Maternity 10 1977:40,000 1978:100,000 1979:2,000 1980:300 1983:60,000 1988:54,800 1990:71,400 1992:51,000 1994:73,450 1998:81,600
S = +15 P > 0.05
ND Mean = 53,455 SD = 32,292.4 CV = 60.4%
J. Sternburg (written commun., 1999, Missouri Natural Heritage Database); R. Clawson (written commun., 2003)
Location 6097 Cave
MO Transient 6 HP:23,000 1979:0 1983:0 1990:22,950 1992:30,600 1994:21,425
S = +2 P > 0.05
ND Mean = 16,329 SD = 13,047.9 CV = 79.9%
J. Sternburg (written commun., 1999, Missouri Natural Heritage Database); R. Clawson (written commun., 2003)
Location 6098 Cave
MO Maternity 6 1978:7,300 1985:4,000 1988:10,200 1990:11,500 1994:11,900 1998:9,575
S = +7 P > 0.05
ND Mean = 9,079 SD = 2,976.0 CV = 32.8%
J. Sternburg (written commun., 1999, Missouri Natural Heritage Database); R. Clawson (written commun., 2003)
Location 6102 Cave
MO Maternity 7 1964:2,000 1976:375 1977:6 1979:0 1989:1 1994:0 1998:0
S = -16 P < 0.05
- Mean = 340 SD = 745.0
CV = 219.1%
J. Sternburg (written commun., 1999, Missouri Natural Heritage Database); R. Clawson (written commun., 2003)
Location 6103 Cave
MO Hibernating 8 1976:2,000 1987:3 1988:90 1989:5 1990:4
S = -4 P > 0.05
ND Mean = 272 SD = 699.1
CV = 257.0%
J. Sternburg (written commun., 1999, Missouri Natural Heritage Database); R. Clawson (written commun., 2003)
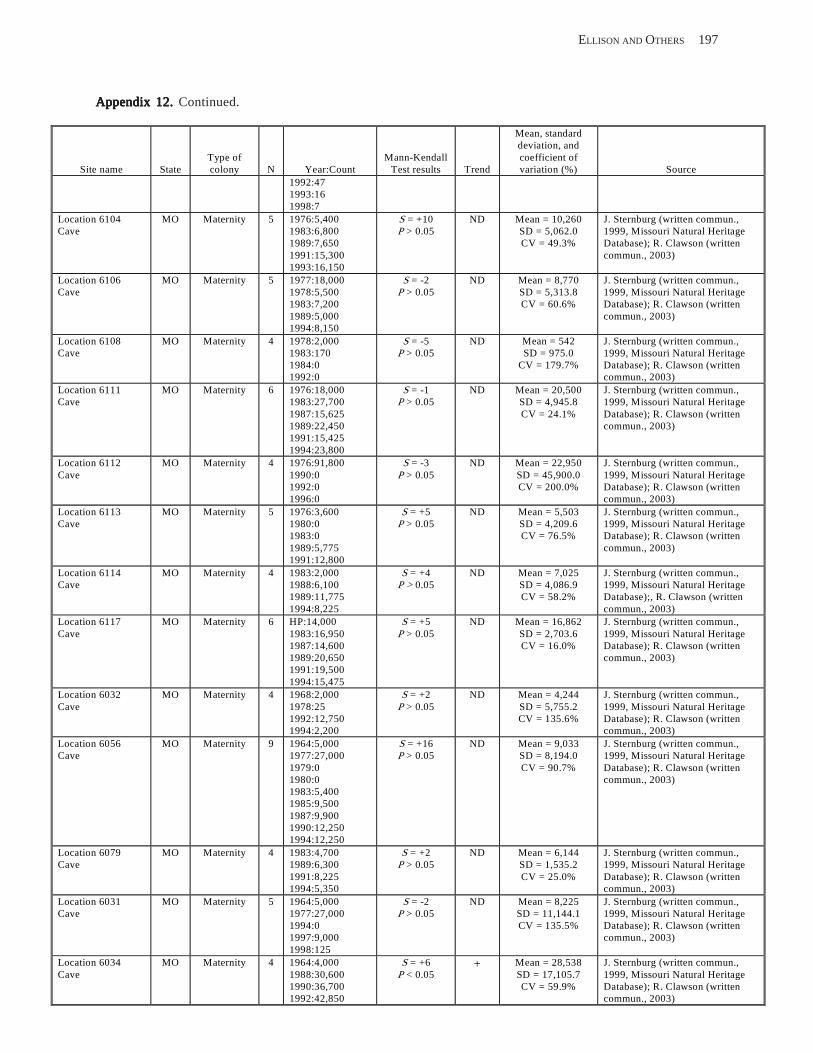
ELLISON AND OTHERS 197
Appendix 12.Appendix 12.Appendix 12.Appendix 12.Appendix 12. Continued.
Site name State Type of colony N Year:Count
Mann-Kendall Test results Trend
Mean, standard deviation, and coefficient of variation (%) Source
1992:47 1993:16 1998:7
Location 6104 Cave
MO Maternity 5 1976:5,400 1983:6,800 1989:7,650 1991:15,300 1993:16,150
S = +10 P > 0.05
ND Mean = 10,260 SD = 5,062.0 CV = 49.3%
J. Sternburg (written commun., 1999, Missouri Natural Heritage Database); R. Clawson (written commun., 2003)
Location 6106 Cave
MO Maternity 5 1977:18,000 1978:5,500 1983:7,200 1989:5,000 1994:8,150
S = -2 P > 0.05
ND Mean = 8,770 SD = 5,313.8 CV = 60.6%
J. Sternburg (written commun., 1999, Missouri Natural Heritage Database); R. Clawson (written commun., 2003)
Location 6108 Cave
MO Maternity 4 1978:2,000 1983:170 1984:0 1992:0
S = -5 P > 0.05
ND Mean = 542 SD = 975.0
CV = 179.7%
J. Sternburg (written commun., 1999, Missouri Natural Heritage Database); R. Clawson (written commun., 2003)
Location 6111 Cave
MO Maternity 6 1976:18,000 1983:27,700 1987:15,625 1989:22,450 1991:15,425 1994:23,800
S = -1 P > 0.05
ND Mean = 20,500 SD = 4,945.8 CV = 24.1%
J. Sternburg (written commun., 1999, Missouri Natural Heritage Database); R. Clawson (written commun., 2003)
Location 6112 Cave
MO Maternity 4 1976:91,800 1990:0 1992:0 1996:0
S = -3 P > 0.05
ND Mean = 22,950 SD = 45,900.0 CV = 200.0%
J. Sternburg (written commun., 1999, Missouri Natural Heritage Database); R. Clawson (written commun., 2003)
Location 6113 Cave
MO Maternity 5 1976:3,600 1980:0 1983:0 1989:5,775 1991:12,800
S = +5 P > 0.05
ND Mean = 5,503 SD = 4,209.6 CV = 76.5%
J. Sternburg (written commun., 1999, Missouri Natural Heritage Database); R. Clawson (written commun., 2003)
Location 6114 Cave
MO Maternity 4 1983:2,000 1988:6,100 1989:11,775 1994:8,225
S = +4 P > 0.05
ND Mean = 7,025 SD = 4,086.9 CV = 58.2%
J. Sternburg (written commun., 1999, Missouri Natural Heritage Database);, R. Clawson (written commun., 2003)
Location 6117 Cave
MO Maternity 6 HP:14,000 1983:16,950 1987:14,600 1989:20,650 1991:19,500 1994:15,475
S = +5 P > 0.05
ND Mean = 16,862 SD = 2,703.6 CV = 16.0%
J. Sternburg (written commun., 1999, Missouri Natural Heritage Database); R. Clawson (written commun., 2003)
Location 6032 Cave
MO Maternity 4 1968:2,000 1978:25 1992:12,750 1994:2,200
S = +2 P > 0.05
ND Mean = 4,244 SD = 5,755.2 CV = 135.6%
J. Sternburg (written commun., 1999, Missouri Natural Heritage Database); R. Clawson (written commun., 2003)
Location 6056 Cave
MO Maternity 9 1964:5,000 1977:27,000 1979:0 1980:0 1983:5,400 1985:9,500 1987:9,900 1990:12,250 1994:12,250
S = +16 P > 0.05
ND Mean = 9,033 SD = 8,194.0 CV = 90.7%
J. Sternburg (written commun., 1999, Missouri Natural Heritage Database); R. Clawson (written commun., 2003)
Location 6079 Cave
MO Maternity 4 1983:4,700 1989:6,300 1991:8,225 1994:5,350
S = +2 P > 0.05
ND Mean = 6,144 SD = 1,535.2 CV = 25.0%
J. Sternburg (written commun., 1999, Missouri Natural Heritage Database); R. Clawson (written commun., 2003)
Location 6031 Cave
MO Maternity 5 1964:5,000 1977:27,000 1994:0 1997:9,000 1998:125
S = -2 P > 0.05
ND Mean = 8,225 SD = 11,144.1 CV = 135.5%
J. Sternburg (written commun., 1999, Missouri Natural Heritage Database); R. Clawson (written commun., 2003)
Location 6034 Cave
MO Maternity 4 1964:4,000 1988:30,600 1990:36,700 1992:42,850
S = +6 P < 0.05
+ Mean = 28,538 SD = 17,105.7 CV = 59.9%
J. Sternburg (written commun., 1999, Missouri Natural Heritage Database); R. Clawson (written commun., 2003)
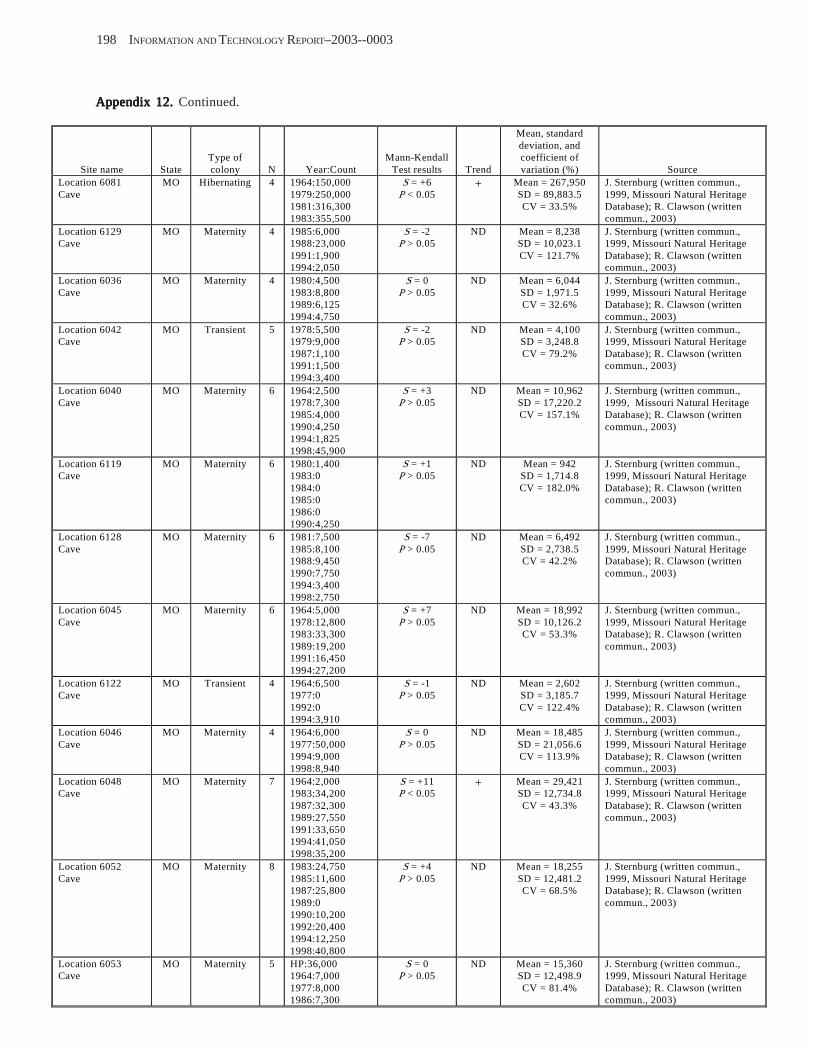
198 INFORMATION AND TECHNOLOGY REPORT–2003--0003
Appendix 12.Appendix 12.Appendix 12.Appendix 12.Appendix 12. Continued.
Site name State Type of colony N Year:Count
Mann-Kendall Test results Trend
Mean, standard deviation, and coefficient of variation (%) Source
Location 6081 Cave
MO Hibernating 4 1964:150,000 1979:250,000 1981:316,300 1983:355,500
S = +6 P < 0.05
+ Mean = 267,950 SD = 89,883.5 CV = 33.5%
J. Sternburg (written commun., 1999, Missouri Natural Heritage Database); R. Clawson (written commun., 2003)
Location 6129 Cave
MO Maternity 4 1985:6,000 1988:23,000 1991:1,900 1994:2,050
S = -2 P > 0.05
ND Mean = 8,238 SD = 10,023.1 CV = 121.7%
J. Sternburg (written commun., 1999, Missouri Natural Heritage Database); R. Clawson (written commun., 2003)
Location 6036 Cave
MO Maternity 4 1980:4,500 1983:8,800 1989:6,125 1994:4,750
S = 0 P > 0.05
ND Mean = 6,044 SD = 1,971.5 CV = 32.6%
J. Sternburg (written commun., 1999, Missouri Natural Heritage Database); R. Clawson (written commun., 2003)
Location 6042 Cave
MO Transient 5 1978:5,500 1979:9,000 1987:1,100 1991:1,500 1994:3,400
S = -2 P > 0.05
ND Mean = 4,100 SD = 3,248.8 CV = 79.2%
J. Sternburg (written commun., 1999, Missouri Natural Heritage Database); R. Clawson (written commun., 2003)
Location 6040 Cave
MO Maternity 6 1964:2,500 1978:7,300 1985:4,000 1990:4,250 1994:1,825 1998:45,900
S = +3 P > 0.05
ND Mean = 10,962 SD = 17,220.2 CV = 157.1%
J. Sternburg (written commun., 1999, Missouri Natural Heritage Database); R. Clawson (written commun., 2003)
Location 6119 Cave
MO Maternity 6 1980:1,400 1983:0 1984:0 1985:0 1986:0 1990:4,250
S = +1 P > 0.05
ND Mean = 942 SD = 1,714.8 CV = 182.0%
J. Sternburg (written commun., 1999, Missouri Natural Heritage Database); R. Clawson (written commun., 2003)
Location 6128 Cave
MO Maternity 6 1981:7,500 1985:8,100 1988:9,450 1990:7,750 1994:3,400 1998:2,750
S = -7 P > 0.05
ND Mean = 6,492 SD = 2,738.5 CV = 42.2%
J. Sternburg (written commun., 1999, Missouri Natural Heritage Database); R. Clawson (written commun., 2003)
Location 6045 Cave
MO Maternity 6 1964:5,000 1978:12,800 1983:33,300 1989:19,200 1991:16,450 1994:27,200
S = +7 P > 0.05
ND Mean = 18,992 SD = 10,126.2 CV = 53.3%
J. Sternburg (written commun., 1999, Missouri Natural Heritage Database); R. Clawson (written commun., 2003)
Location 6122 Cave
MO Transient 4 1964:6,500 1977:0 1992:0 1994:3,910
S = -1 P > 0.05
ND Mean = 2,602 SD = 3,185.7 CV = 122.4%
J. Sternburg (written commun., 1999, Missouri Natural Heritage Database); R. Clawson (written commun., 2003)
Location 6046 Cave
MO Maternity 4 1964:6,000 1977:50,000 1994:9,000 1998:8,940
S = 0 P > 0.05
ND Mean = 18,485 SD = 21,056.6 CV = 113.9%
J. Sternburg (written commun., 1999, Missouri Natural Heritage Database); R. Clawson (written commun., 2003)
Location 6048 Cave
MO Maternity 7 1964:2,000 1983:34,200 1987:32,300 1989:27,550 1991:33,650 1994:41,050 1998:35,200
S = +11 P < 0.05
+ Mean = 29,421 SD = 12,734.8 CV = 43.3%
J. Sternburg (written commun., 1999, Missouri Natural Heritage Database); R. Clawson (written commun., 2003)
Location 6052 Cave
MO Maternity 8 1983:24,750 1985:11,600 1987:25,800 1989:0 1990:10,200 1992:20,400 1994:12,250 1998:40,800
S = +4 P > 0.05
ND Mean = 18,255 SD = 12,481.2 CV = 68.5%
J. Sternburg (written commun., 1999, Missouri Natural Heritage Database); R. Clawson (written commun., 2003)
Location 6053 Cave
MO Maternity 5 HP:36,000 1964:7,000 1977:8,000 1986:7,300
S = 0 P > 0.05
ND Mean = 15,360 SD = 12,498.9 CV = 81.4%
J. Sternburg (written commun., 1999, Missouri Natural Heritage Database); R. Clawson (written commun., 2003)
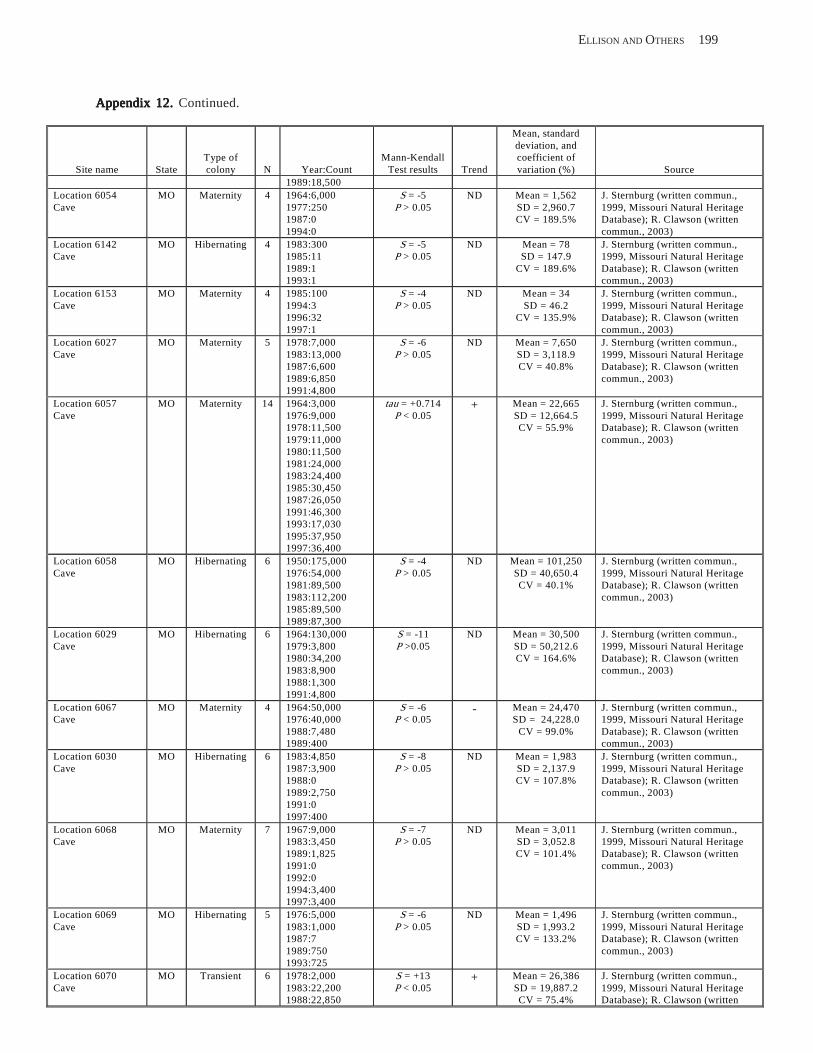
ELLISON AND OTHERS 199
Appendix 12.Appendix 12.Appendix 12.Appendix 12.Appendix 12. Continued.
Site name State Type of colony N Year:Count
Mann-Kendall Test results Trend
Mean, standard deviation, and coefficient of variation (%) Source
1989:18,500 Location 6054 Cave
MO Maternity 4 1964:6,000 1977:250 1987:0 1994:0
S = -5 P > 0.05
ND Mean = 1,562 SD = 2,960.7 CV = 189.5%
J. Sternburg (written commun., 1999, Missouri Natural Heritage Database); R. Clawson (written commun., 2003)
Location 6142 Cave
MO Hibernating 4 1983:300 1985:11 1989:1 1993:1
S = -5 P > 0.05
ND Mean = 78 SD = 147.9
CV = 189.6%
J. Sternburg (written commun., 1999, Missouri Natural Heritage Database); R. Clawson (written commun., 2003)
Location 6153 Cave
MO Maternity 4 1985:100 1994:3 1996:32 1997:1
S = -4 P > 0.05
ND Mean = 34 SD = 46.2
CV = 135.9%
J. Sternburg (written commun., 1999, Missouri Natural Heritage Database); R. Clawson (written commun., 2003)
Location 6027 Cave
MO Maternity 5 1978:7,000 1983:13,000 1987:6,600 1989:6,850 1991:4,800
S = -6 P > 0.05
ND Mean = 7,650 SD = 3,118.9 CV = 40.8%
J. Sternburg (written commun., 1999, Missouri Natural Heritage Database); R. Clawson (written commun., 2003)
Location 6057 Cave
MO Maternity 14 1964:3,000 1976:9,000 1978:11,500 1979:11,000 1980:11,500 1981:24,000 1983:24,400 1985:30,450 1987:26,050 1991:46,300 1993:17,030 1995:37,950 1997:36,400
tau = +0.714 P < 0.05
+ Mean = 22,665 SD = 12,664.5 CV = 55.9%
J. Sternburg (written commun., 1999, Missouri Natural Heritage Database); R. Clawson (written commun., 2003)
Location 6058 Cave
MO Hibernating 6 1950:175,000 1976:54,000 1981:89,500 1983:112,200 1985:89,500 1989:87,300
S = -4 P > 0.05
ND Mean = 101,250 SD = 40,650.4 CV = 40.1%
J. Sternburg (written commun., 1999, Missouri Natural Heritage Database); R. Clawson (written commun., 2003)
Location 6029 Cave
MO Hibernating 6 1964:130,000 1979:3,800 1980:34,200 1983:8,900 1988:1,300 1991:4,800
S = -11 P >0.05
ND Mean = 30,500 SD = 50,212.6 CV = 164.6%
J. Sternburg (written commun., 1999, Missouri Natural Heritage Database); R. Clawson (written commun., 2003)
Location 6067 Cave
MO Maternity 4 1964:50,000 1976:40,000 1988:7,480 1989:400
S = -6 P < 0.05
- Mean = 24,470 SD = 24,228.0
CV = 99.0%
J. Sternburg (written commun., 1999, Missouri Natural Heritage Database); R. Clawson (written commun., 2003)
Location 6030 Cave
MO Hibernating 6 1983:4,850 1987:3,900 1988:0 1989:2,750 1991:0 1997:400
S = -8 P > 0.05
ND Mean = 1,983 SD = 2,137.9 CV = 107.8%
J. Sternburg (written commun., 1999, Missouri Natural Heritage Database); R. Clawson (written commun., 2003)
Location 6068 Cave
MO Maternity 7 1967:9,000 1983:3,450 1989:1,825 1991:0 1992:0 1994:3,400 1997:3,400
S = -7 P > 0.05
ND Mean = 3,011 SD = 3,052.8 CV = 101.4%
J. Sternburg (written commun., 1999, Missouri Natural Heritage Database); R. Clawson (written commun., 2003)
Location 6069 Cave
MO Hibernating 5 1976:5,000 1983:1,000 1987:7 1989:750 1993:725
S = -6 P > 0.05
ND Mean = 1,496 SD = 1,993.2 CV = 133.2%
J. Sternburg (written commun., 1999, Missouri Natural Heritage Database); R. Clawson (written commun., 2003)
Location 6070 Cave
MO Transient 6 1978:2,000 1983:22,200 1988:22,850
S = +13 P < 0.05
+ Mean = 26,386 SD = 19,887.2 CV = 75.4%
J. Sternburg (written commun., 1999, Missouri Natural Heritage Database); R. Clawson (written

200 INFORMATION AND TECHNOLOGY REPORT–2003--0003
Appendix 12.Appendix 12.Appendix 12.Appendix 12.Appendix 12. Concluded.
Mean, standard deviation, and
Site name State Type of colony N Year:Count
Mann-Kendall Test results Trend
coefficient of variation (%) Source
1989:30,150 1991:51,775 1994:51,175
Marvel Cave MO Hibernating 10 1935:14,500 1948:20,000 1968:6,077 1969:12,550 1970:141 1972:2,437 1973:1,930 1974:1,188 1975:1,997 1976:2,527
S = -19 P < 0.05
- Mean = 6,335 SD = 6,870.8 CV = 108.5%
J. Sternburg (written commun., 1999, Missouri Natural Heritage Database); R. Clawson (written commun., 2003)
Blythe Ferry Cave TN Summer 5 1992:65 1995:50 1996:46 1997:110 1998:38
S = -4 P > 0.05
ND Mean = 62 SD = 28.7
CV = 46.3%
J. Sternburg (written commun., 1999, Missouri Natural Heritage Database); R. Clawson (written commun., 2003)
Gallatin Fossil Plant Cave
TN Maternity 5 1988:5,000 1994:8,670 1996:14,644 1997:4,096 1998:6,890
S = 0 P > 0.05
ND Mean = 7,860 SD = 4,182.3 CV = 53.2%
J. Sternburg (written commun., 1999, Missouri Natural Heritage Database); R. Clawson (written commun., 2003)
Nickajack Cave TN Maternity 9 1976:35,000 1981:110,000 1991:20,500 1992:72,370 1994:66,500 1995:117,540 1996:81,568 1997:63,440 1998:34,215
S = -3 P > 0.05
ND Mean = 66,792 SD = 33,387.9 CV = 50.0%
J. Sternburg (written commun., 1999, Missouri Natural Heritage Database); R. Clawson (written commun., 2003)
Norris Dam Cave TN Summer 9 1976:4,000 1981:140 1989:50 1991:266 1992:162 1994:330 1995:388 1997:342 1998:54
S = +1 P > 0.05
ND Mean = 637 SD = 1,267.3 CV = 199.0%
J. Sternburg (written commun., 1999, Missouri Natural Heritage Database), R. Clawson (written commun., 2003)

ELLISON AND OTHERS 201
Appendix 13Appendix 13Appendix 13Appendix 13Appendix 13. Results of trend analyses for the eastern small-footed myotis (Myotis leibii).
Mean, standard Mann- deviation, and
Site name State Type of colony N Year:Count
Kendall Test results Trend
coefficient of variation (%) Source
Aitkin Cave PA Hibernating 12 1986:10 1987:9 1988:11 1989:12 1990:15 1991:16 1992:22 1993:18 1994:22 1995:31 1996:6 1997:19
tau = 0.485 P < 0.05
+ Mean = 16 SD = 17.0
CV = 106.2%
J. Hart (written commun., 2000, Pennsylvania Game Commission Winter Bat Hibernacula Survey)
Canoe Creek Mine PA Hibernating 6 1987:12 1989:21 1991:37 1993:17 1995:14 1997:9
S = -5 P > 0.05
ND Mean = 18 SD = 10.0
CV = 55.6%
J. Hart (written commun., 2000, Pennsylvania Game Commission Winter Bat Hibernacula Survey)
Eiswert Cave PA Hibernating 9 1987:29 1988:8 1989:16 1990:12 1991:10 1992:10 1994:14 1995:15 1996:20
S = +5 P > 0.05
ND Mean = 15 SD = 6.4
CV = 42.7%
J. Hart (written commun., 2000, Pennsylvania Game Commission Winter Bat Hibernacula Survey)
Petersburg Cave PA Hibernating 5 1990:17 1991:46 1992:20 1993:46 1995:18
S = +1 P < 0.05
ND Mean = 29 SD = 15.2
CV = 52.4%
J. Hart (written commun., 2000, Pennsylvania Game Commission Winter Bat Hibernacula Survey)
Ruth Cave PA Hibernating 10 1985:0 1986:1 1987:1 1988:3 1989:1 1990:0 1991:4 1992:0 1993:2 1995:5
S = +14 P > 0.05
ND Mean = 2 SD = 1.8
CV = 90.0%
J. Hart (written commun., 2000, Pennsylvania Game Commission Winter Bat Hibernacula Survey)
Salisbury Mine PA Hibernating 11 1986:3 1987:4 1988:4 1989:7 1990:0 1991:2 1992:6 1993:7
tau = +0.366 P > 0.05
ND Mean = 4 SD = 2.4
CV = 60.0%
J. Hart (written commun., 2000, Pennsylvania Game Commission Winter Bat Hibernacula Survey)

202 INFORMATION AND TECHNOLOGY REPORT–2003--0003
Appendix 13Appendix 13Appendix 13Appendix 13Appendix 13. Concluded.
Mean, standard Mann- deviation, and
Site name State Type of colony N Year:Count
Kendall Test results Trend
coefficient of variation (%) Source
1995:3 1996:5 1997:8
Seawra Cave PA Hibernating 5 1986:0 1991:1 1993:0 1996:1 1997:3
S = +6 P > 0.05
ND Mean = 1 SD = 1.2
CV = 120.0%
J. Hart (written commun., 2000, Pennsylvania Game Commission Winter Bat Hibernacula Survey)
Sharer Cave PA Hibernating 11 1985:0 1986:0 1987:1 1988:0 1989:0 1990:0 1991:0 1992:0 1993:9 1995:0 1997:0
tau = +0.031 P > 0.05
ND Mean = 1 SD = 2.7
CV = 270.0%
J. Hart (written commun., 2000, Pennsylvania Game Commission Winter Bat Hibernacula Survey)
Stover Cave PA Hibernating 8 1932:6 1933:12 1985:1 1987:0 1990:0 1993:3 1994:19 1997:12
S = +4 P > 0.05
ND Mean = 7 SD = 7.0
CV = 100.0%
Mohr (1933a); J. Hart (written commun., 2000, Pennsylvania Game Commission Winter Bat Hibernacula Survey)
Woodward Cave PA Hibernating 7 1985:0 1988:0 1990:1 1991:4 1992:6 1994:5 1996:10
S = +18 P < 0.05
+ Mean = 4 SD = 3.7
CV = 92.5%
J. Hart (written commun., 2000, Pennsylvania Game Commission Winter Bat Hibernacula Survey)
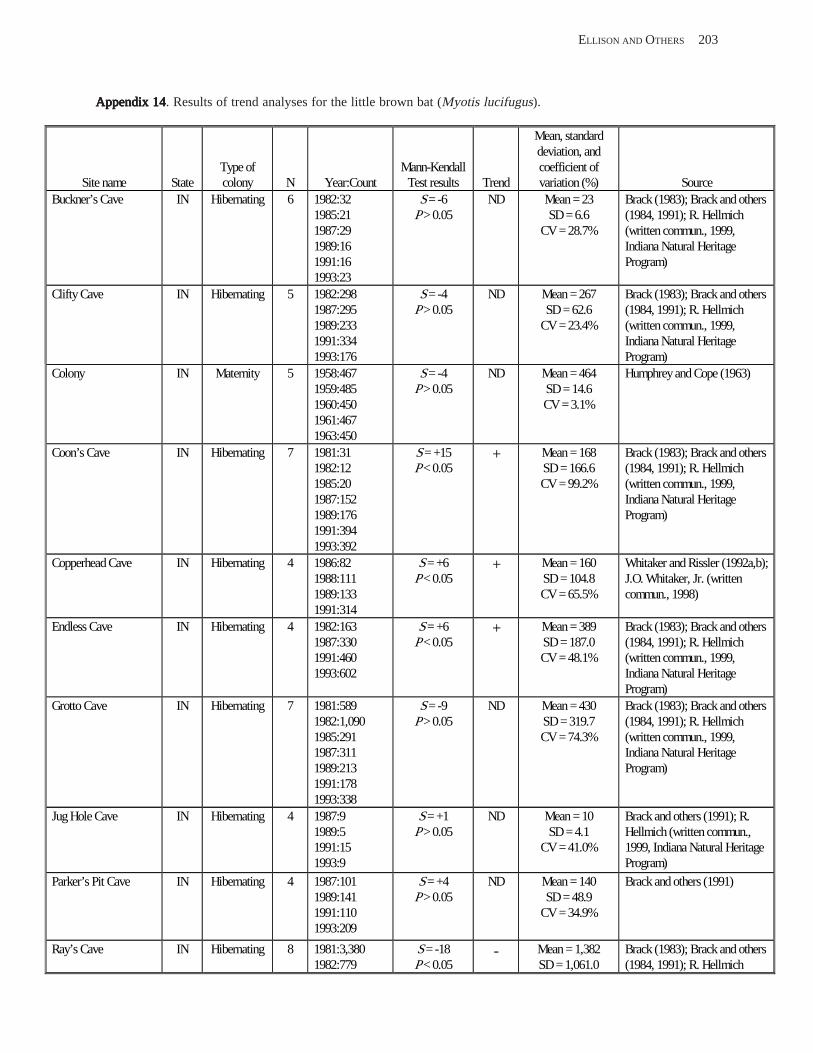
ELLISON AND OTHERS 203
Appendix 14Appendix 14Appendix 14Appendix 14Appendix 14. Results of trend analyses for the little brown bat (Myotis lucifugus).
Mean, standard deviation, and
Site name State Type of colony N Year:Count
Mann-Kendall Test results Trend
coefficient of variation (%) Source
Buckner’s Cave IN Hibernating 6 1982:32 1985:21 1987:29 1989:16 1991:16 1993:23
S = -6 P > 0.05
ND Mean = 23 SD = 6.6
CV = 28.7%
Brack (1983); Brack and others (1984, 1991); R. Hellmich (written commun., 1999, Indiana Natural Heritage Program)
Clifty Cave IN Hibernating 5 1982:298 1987:295 1989:233 1991:334 1993:176
S = -4 P > 0.05
ND Mean = 267 SD = 62.6
CV = 23.4%
Brack (1983); Brack and others (1984, 1991); R. Hellmich (written commun., 1999, Indiana Natural Heritage Program)
Colony IN Maternity 5 1958:467 1959:485 1960:450 1961:467 1963:450
S = -4 P > 0.05
ND Mean = 464 SD = 14.6 CV = 3.1%
Humphrey and Cope (1963)
Coon’s Cave IN Hibernating 7 1981:31 1982:12 1985:20 1987:152 1989:176 1991:394 1993:392
S = +15 P < 0.05
+ Mean = 168 SD = 166.6 CV = 99.2%
Brack (1983); Brack and others (1984, 1991); R. Hellmich (written commun., 1999, Indiana Natural Heritage Program)
Copperhead Cave IN Hibernating 4 1986:82 1988:111 1989:133 1991:314
S = +6 P < 0.05
+ Mean = 160 SD = 104.8 CV = 65.5%
Whitaker and Rissler (1992a,b); J.O. Whitaker, Jr. (written commun., 1998)
Endless Cave IN Hibernating 4 1982:163 1987:330 1991:460 1993:602
S = +6 P < 0.05
+ Mean = 389 SD = 187.0 CV = 48.1%
Brack (1983); Brack and others (1984, 1991); R. Hellmich (written commun., 1999, Indiana Natural Heritage Program)
Grotto Cave IN Hibernating 7 1981:589 1982:1,090 1985:291 1987:311 1989:213 1991:178 1993:338
S = -9 P > 0.05
ND Mean = 430 SD = 319.7 CV = 74.3%
Brack (1983); Brack and others (1984, 1991); R. Hellmich (written commun., 1999, Indiana Natural Heritage Program)
Jug Hole Cave IN Hibernating 4 1987:9 1989:5 1991:15 1993:9
S = +1 P > 0.05
ND Mean = 10 SD = 4.1
CV = 41.0%
Brack and others (1991); R. Hellmich (written commun., 1999, Indiana Natural Heritage Program)
Parker’s Pit Cave IN Hibernating 4 1987:101 1989:141 1991:110 1993:209
S = +4 P > 0.05
ND Mean = 140 SD = 48.9
CV = 34.9%
Brack and others (1991)
Ray’s Cave IN Hibernating 8 1981:3,380 1982:779
S = -18 P < 0.05
- Mean = 1,382 SD = 1,061.0
Brack (1983); Brack and others (1984, 1991); R. Hellmich

204 INFORMATION AND TECHNOLOGY REPORT–2003--0003
Appendix 14Appendix 14Appendix 14Appendix 14Appendix 14. Continued.
Mean, standard deviation, and
Site name State Type of colony N Year:Count
Mann-Kendall Test results Trend
coefficient of variation (%) Source
1983:1,834 1985:1,044 1987:2,395 1989:671 1991:600 1993:351
Saltpeter Cave IN Hibernating 5 1982:114 1987:198 1989:28 1991:154 1993:76
S = -2 P > 0.05
ND Mean = 114 SD = 66.1
CV = 58.0%
Brack (1983); Brack and others (1984, 1991); R. Hellmich (written commun., 1999, Indiana Natural Heritage Program)
Saltpeter Cave IN Hibernating 4 1982:19 1987:0 1991:68 1993:79
S = +4 P > 0.05
ND Mean = 42 SD = 38.0
CV = 90.5%
Brack (1983); Brack and others (1984, 1991); R. Hellmich (written commun., 1999, Indiana Natural Heritage Program)
Wildcat Cave IN Hibernating 4 1982:332 1987:520 1991:310 1993:314
S = -2 P > 0.05
ND Mean = 369 SD = 101.1 CV = 27.4%
Brack (1983); Brack and others (1984, 1991); R. Hellmich (written commun., 1999, Indiana Natural Heritage Program)
Wyandotte Cave IN Hibernating 6 1981:6 1985:21 1987:272 1989:8 1991:15 1993:12
S = +1 P > 0.05
ND Mean = 56 SD = 106.1
CV = 189.5%
Brack (1983); Brack and others (1984, 1991); R. Hellmich (written commun., 1999, Indiana Natural Heritage Program)
Bat Cave KY Hibernating 4 1937:5,000 1991:300 1997:121 1999:145
S = -4 P > 0.05
ND Mean = 1,392 SD = 2,407.0 CV = 172.9%
Welter and Sollberger (1939); T. Wethington (written commun., 1999, Kentucky Department of Fish and Wildlife Resources)
Bowman Saltpeter KY Hibernating 4 1990:119 S = -3 ND Mean = 114 T. Wethington (written Cave 1991:119 P > 0.05 SD = 9.3 commun., 1999, Kentucky
1996:100 1998:118
CV = 8.2% Department of Fish and Wildlife Resources)
Dixon Cave KY Hibernating 4 1929:500 1991:50 1997:30 1999:85
S = -2 P > 0.05
ND Mean = 166 SD = 223.6
CV = 134.7%
Bailey (1933); T. Wethington (written commun., 1999, Kentucky Department of Fish and Wildlife Resources)
Donahue Rockshelter KY Hibernating 6 1984:2 1986:1 1987:1 1988:1 1989:1 1991:1
S = -1 P > 0.05
ND Mean = 1 SD = 0.4
CV = 40.0%
T. Wethington (written commun., 1999, Kentucky Department of Fish and Wildlife Resources)
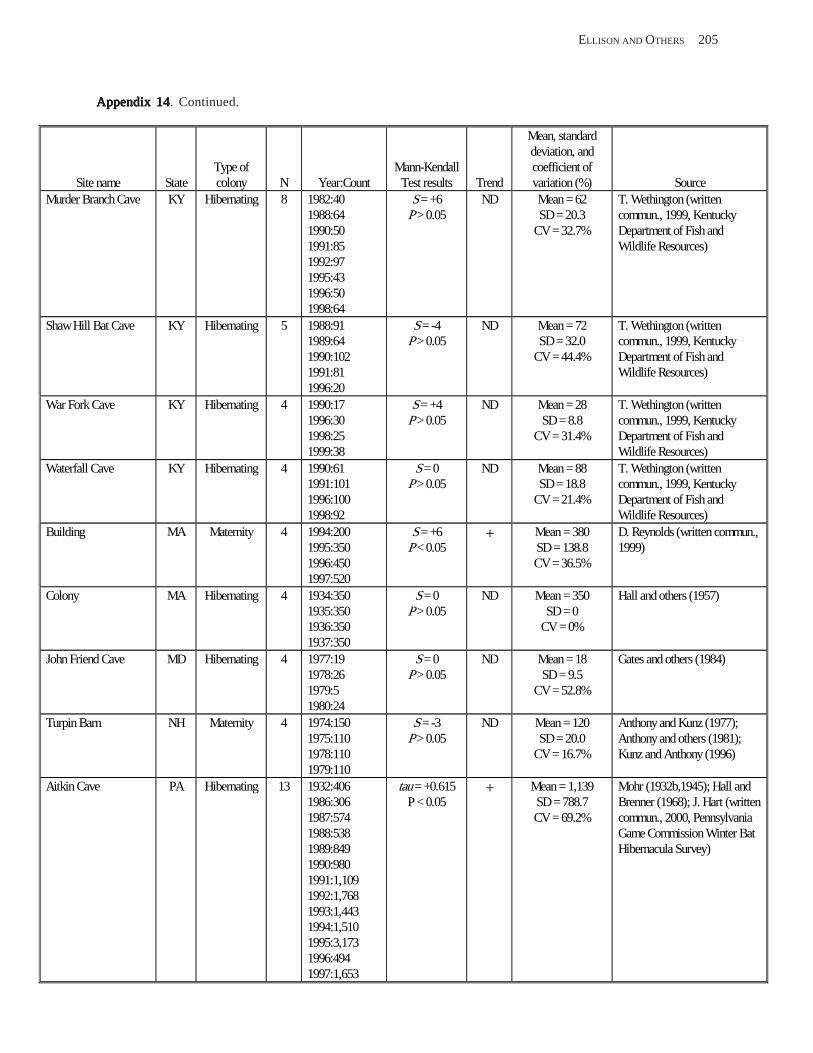
ELLISON AND OTHERS 205
Appendix 14Appendix 14Appendix 14Appendix 14Appendix 14. Continued.
Mean, standard deviation, and
Site name State Type of colony N Year:Count
Mann-Kendall Test results Trend
coefficient of variation (%) Source
Murder Branch Cave KY Hibernating 8 1982:40 1988:64 1990:50 1991:85 1992:97 1995:43 1996:50 1998:64
S = +6 P > 0.05
ND Mean = 62 SD = 20.3
CV = 32.7%
T. Wethington (written commun., 1999, Kentucky Department of Fish and Wildlife Resources)
Shaw Hill Bat Cave KY Hibernating 5 1988:91 1989:64 1990:102 1991:81 1996:20
S = -4 P > 0.05
ND Mean = 72 SD = 32.0
CV = 44.4%
T. Wethington (written commun., 1999, Kentucky Department of Fish and Wildlife Resources)
War Fork Cave KY Hibernating 4 1990:17 1996:30 1998:25 1999:38
S = +4 P > 0.05
ND Mean = 28 SD = 8.8
CV = 31.4%
T. Wethington (written commun., 1999, Kentucky Department of Fish and Wildlife Resources)
Waterfall Cave KY Hibernating 4 1990:61 1991:101 1996:100 1998:92
S = 0 P > 0.05
ND Mean = 88 SD = 18.8
CV = 21.4%
T. Wethington (written commun., 1999, Kentucky Department of Fish and Wildlife Resources)
Building MA Maternity 4 1994:200 1995:350 1996:450 1997:520
S = +6 P < 0.05
+ Mean = 380 SD = 138.8 CV = 36.5%
D. Reynolds (written commun., 1999)
Colony MA Hibernating 4 1934:350 1935:350 1936:350 1937:350
S = 0 P > 0.05
ND Mean = 350 SD = 0
CV = 0%
Hall and others (1957)
John Friend Cave MD Hibernating 4 1977:19 1978:26 1979:5 1980:24
S = 0 P > 0.05
ND Mean = 18 SD = 9.5
CV = 52.8%
Gates and others (1984)
Turpin Barn NH Maternity 4 1974:150 1975:110 1978:110 1979:110
S = -3 P > 0.05
ND Mean = 120 SD = 20.0
CV = 16.7%
Anthony and Kunz (1977); Anthony and others (1981); Kunz and Anthony (1996)
Aitkin Cave PA Hibernating 13 1932:406 1986:306 1987:574 1988:538
tau = +0.615 P < 0.05
+ Mean = 1,139 SD = 788.7 CV = 69.2%
Mohr (1932b,1945); Hall and Brenner (1968); J. Hart (written commun., 2000, Pennsylvania Game Commission Winter Bat
1989:849 1990:980
Hibernacula Survey)
1991:1,109 1992:1,768 1993:1,443 1994:1,510 1995:3,173 1996:494 1997:1,653

206 INFORMATION AND TECHNOLOGY REPORT–2003--0003
Appendix 14Appendix 14Appendix 14Appendix 14Appendix 14. Continued.
Mean, standard deviation, and
Site name State Type of colony N Year:Count
Mann-Kendall Test results Trend
coefficient of variation (%) Source
Barton Cave PA Hibernating 5 1986:28 1989:84 1993:115 1996:157
S = +6 P < 0.05
+ Mean = 96 SD = 54.3
CV = 56.6%
J. Hart (written commun., 2000, Pennsylvania Game Commission Winter Bat Hibernacula Survey)
Canoe Creek Mine PA Hibernating 6 1987:3,256 1989:6,155 1991:10,875 1993:13,502 1995:12,839 1997:13,180
S = +11 P < 0.05
+ Mean = 9,968 SD = 4,277.0 CV = 42.9%
J. Hart (written commun., 2000, Pennsylvania Game Commission Winter Bat Hibernacula Survey)
Copperhead Cave PA Hibernating 8 1985:1,585 1986:802 1987:647 1988:654 1989:1,007 1990:1,084 1991:1,244 1992:1,395
S = +10 P > 0.05
ND Mean = 1,052 SD = 343.6 CV = 32.7%
J. Hart (written commun., 2000, Pennsylvania Game Commission Winter Bat Hibernacula Survey)
Eiswert Cave PA Hibernating 9 1987:96 1988:59 1989:112 1990:104 1991:160 1992:174 1994:147 1995:182 1996:187
S = +28 P < 0.05
+ Mean = 136 SD = 44.7
CV = 32.9%
J. Hart (written commun., 2000, Pennsylvania Game Commission Winter Bat Hibernacula Survey)
Haine’s Gap PA Hibernating 4 1985:87 1986:80 1990:59
S = -6 P < 0.05
- Mean = 70 SD = 16.7
CV = 23.8%
J. Hart (written commun., 2000, Pennsylvania Game Commission Winter Bat
1993:52 Hibernacula Survey) Lemon Hole PA Hibernating 10 1985:909
1986:1,038 1987:937 1988:1,160 1989:889 1991:1,101 1992:1,111 1993:1,298 1995:1,558 1997:1,472
S = +29 P < 0.05
+ Mean = 1,147 SD = 231.0 CV = 20.1%
J. Hart (written commun., 2000, Pennsylvania Game Commission Winter Bat Hibernacula Survey)
Petersburg Cave PA Hibernating 5 1990:0 1991:2 1992:0 1993:1 1995:1
S = +2 P > 0.05
ND Mean = 1 SD = 0.8
CV = 80.0%
J. Hart (written commun., 2000, Pennsylvania Game Commission Winter Bat Hibernacula Survey)
Ruth Cave PA Hibernating 10 1985:48 1986:131 1987:157 1988:204
S = +41 P < 0.05
+ Mean = 238 SD = 120.6 CV = 50.7%
J. Hart (written commun., 2000, Pennsylvania Game Commission Winter Bat Hibernacula Survey)

ELLISON AND OTHERS 207
Appendix 14Appendix 14Appendix 14Appendix 14Appendix 14. Continued.
Mean, standard deviation, and
Site name State Type of colony N Year:Count
Mann-Kendall Test results Trend
coefficient of variation (%) Source
1989:197 1990:256 1991:248 1992:308 1993:365 1995:467
Salisbury Mine PA Hibernating 11 1986:206 1987:431 1988:426 1989:518 1990:487 1991:659 1992:735 1993:1,096 1995:1,758 1996:973 1997:950
tau = 0.745 P < 0.05
+ Mean = 706 SD = 432.8 CV = 61.3%
J. Hart (written commun., 2000, Pennsylvania Game Commission Winter Bat Hibernacula Survey)
Seawra Cave PA Hibernating 5 1986:102 1991:747 1993:1,262 1996:1,903 1997:1,544
S = +8 P < 0.05
+ Mean = 1,112 SD = 705.0 CV = 63.4%
Hall and Brenner (1968); J. Hart (written commun., 2000, Pennsylvania Game Commission Winter Bat Hibernacula Survey)
Sharer Cave PA Hibernating 11 1985:234 1986:184 1987:215 1988:457 1989:767 1990:729 1991:645 1992:756 1993:196 1995:863 1997:477
tau = 0.345 P > 0.05
ND Mean = 502 SD = 262.4 CV = 52.3%
J. Hart (written commun., 2000, Pennsylvania Game Commission Winter Bat Hibernacula Survey)
Stover Cave PA Hibernating 6 1985:0 1987:1 1990:0 1993:0 1994:0 1997:1
S = +2 P > 0.05
ND Mean = 0.3 SD = 0.5
CV = 166.7%
J. Hart (written commun., 2000, Pennsylvania Game Commission Winter Bat Hibernacula Survey)
U.S. Steel Mine PA Hibernating 5 1987:1,024 1989:2,008 1993:2,234 1995:5,074 1997:5,963
S = +10 P < 0.05
+ Mean = 3,261 SD = 2,134.0 CV = 65.4%
J. Hart (written commun., 2000, Pennsylvania Game Commission Winter Bat Hibernacula Survey)
Woodward Cave PA Hibernating 13 1931:100 1938:238 1939:57 1940:39 1941:12 1948:10
tau = +0.564 P < 0.05
+ Mean = 905 SD = 833.9 CV = 92.1%
Mohr (1932b); J. Hart (written commun., 2000, Pennsylvania Game Commission Winter Bat Hibernacula Survey)
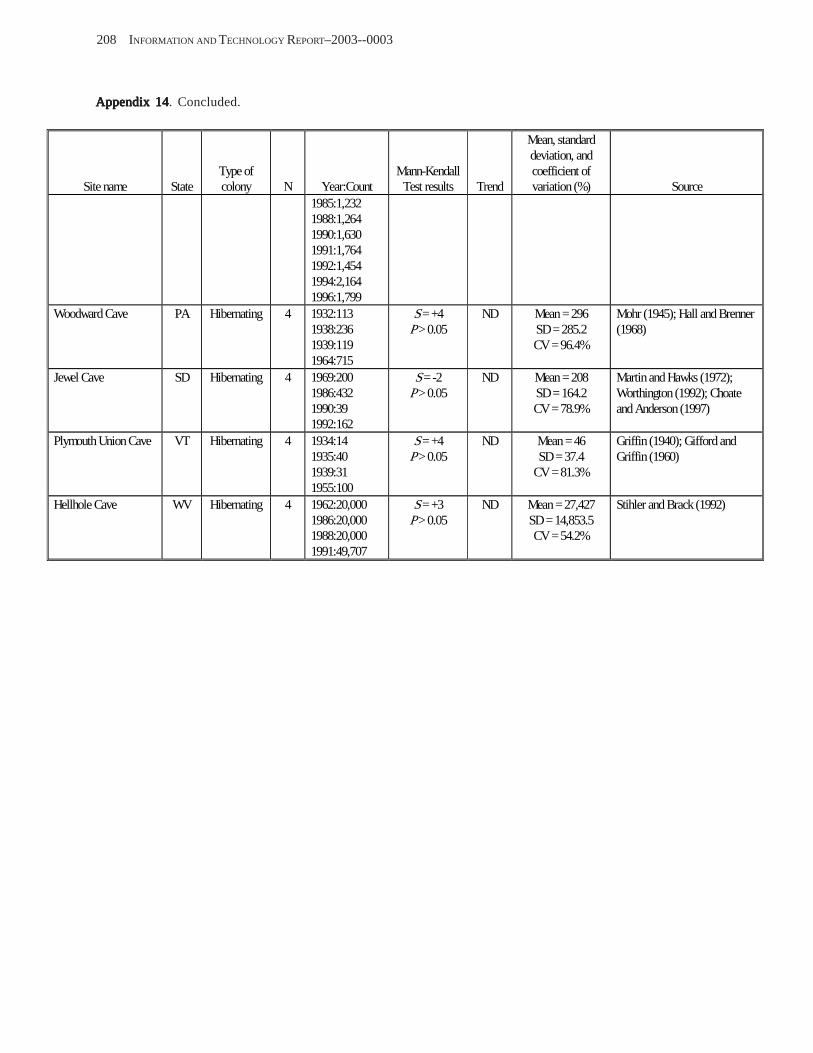
208 INFORMATION AND TECHNOLOGY REPORT–2003--0003
Appendix 14Appendix 14Appendix 14Appendix 14Appendix 14. Concluded.
Mean, standard deviation, and
Site name State Type of colony N Year:Count
Mann-Kendall Test results Trend
coefficient of variation (%) Source
1985:1,232 1988:1,264 1990:1,630 1991:1,764 1992:1,454 1994:2,164 1996:1,799
Woodward Cave PA Hibernating 4 1932:113 1938:236 1939:119 1964:715
S = +4 P > 0.05
ND Mean = 296 SD = 285.2 CV = 96.4%
Mohr (1945); Hall and Brenner (1968)
Jewel Cave SD Hibernating 4 1969:200 1986:432 1990:39 1992:162
S = -2 P > 0.05
ND Mean = 208 SD = 164.2 CV = 78.9%
Martin and Hawks (1972); Worthington (1992); Choate and Anderson (1997)
Plymouth Union Cave VT Hibernating 4 1934:14 1935:40 1939:31 1955:100
S = +4 P > 0.05
ND Mean = 46 SD = 37.4
CV = 81.3%
Griffin (1940); Gifford and Griffin (1960)
Hellhole Cave WV Hibernating 4 1962:20,000 1986:20,000 1988:20,000 1991:49,707
S = +3 P > 0.05
ND Mean = 27,427 SD = 14,853.5 CV = 54.2%
Stihler and Brack (1992)
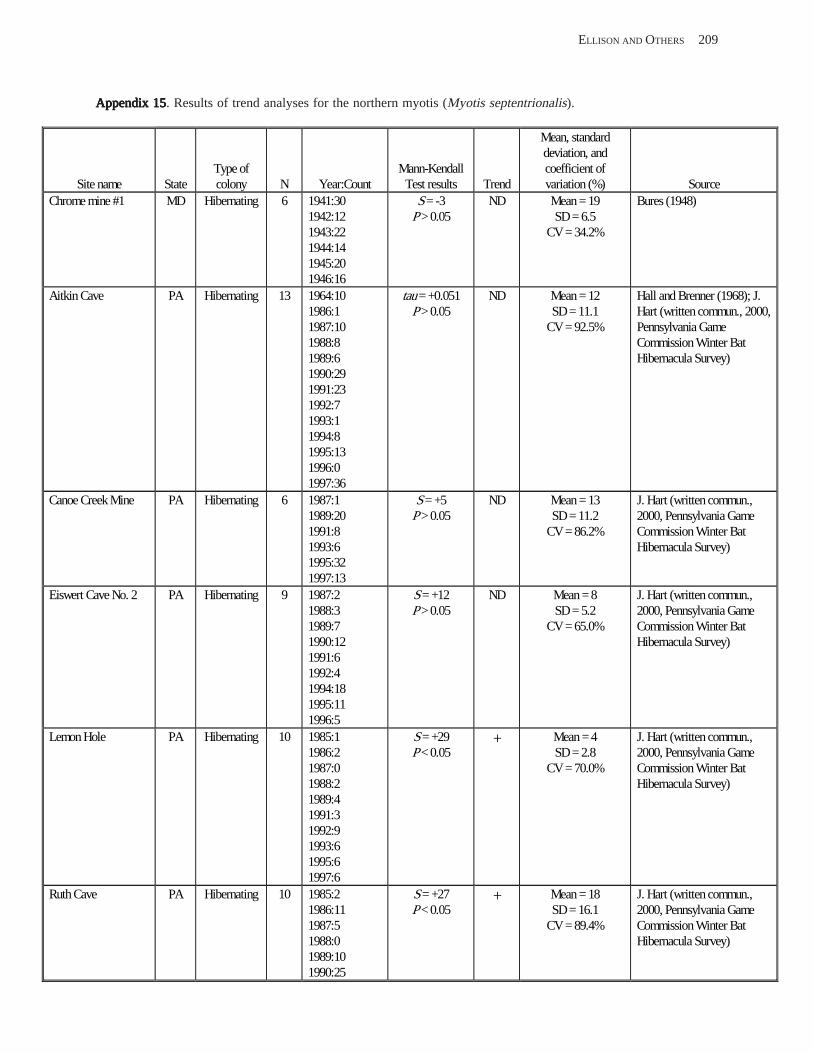
ELLISON AND OTHERS 209
Appendix 15Appendix 15Appendix 15Appendix 15Appendix 15. Results of trend analyses for the northern myotis (Myotis septentrionalis).
Mean, standard deviation, and
Site name State Type of colony N Year:Count
Mann-Kendall Test results Trend
coefficient of variation (%) Source
Chrome mine #1 MD Hibernating 6 1941:30 1942:12 1943:22 1944:14 1945:20 1946:16
S = -3 P > 0.05
ND Mean = 19 SD = 6.5
CV = 34.2%
Bures (1948)
Aitkin Cave PA Hibernating 13 1964:10 1986:1 1987:10 1988:8 1989:6 1990:29 1991:23 1992:7 1993:1 1994:8 1995:13 1996:0 1997:36
tau = +0.051 P > 0.05
ND Mean = 12 SD = 11.1
CV = 92.5%
Hall and Brenner (1968); J. Hart (written commun., 2000, Pennsylvania Game Commission Winter Bat Hibernacula Survey)
Canoe Creek Mine PA Hibernating 6 1987:1 1989:20 1991:8 1993:6 1995:32 1997:13
S = +5 P > 0.05
ND Mean = 13 SD = 11.2
CV = 86.2%
J. Hart (written commun., 2000, Pennsylvania Game Commission Winter Bat Hibernacula Survey)
Eiswert Cave No. 2 PA Hibernating 9 1987:2 1988:3 1989:7 1990:12 1991:6 1992:4 1994:18 1995:11 1996:5
S = +12 P > 0.05
ND Mean = 8 SD = 5.2
CV = 65.0%
J. Hart (written commun., 2000, Pennsylvania Game Commission Winter Bat Hibernacula Survey)
Lemon Hole PA Hibernating 10 1985:1 1986:2 1987:0 1988:2 1989:4 1991:3 1992:9 1993:6 1995:6 1997:6
S = +29 P < 0.05
+ Mean = 4 SD = 2.8
CV = 70.0%
J. Hart (written commun., 2000, Pennsylvania Game Commission Winter Bat Hibernacula Survey)
Ruth Cave PA Hibernating 10 1985:2 1986:11 1987:5 1988:0 1989:10 1990:25
S = +27 P < 0.05
+ Mean = 18 SD = 16.1
CV = 89.4%
J. Hart (written commun., 2000, Pennsylvania Game Commission Winter Bat Hibernacula Survey)
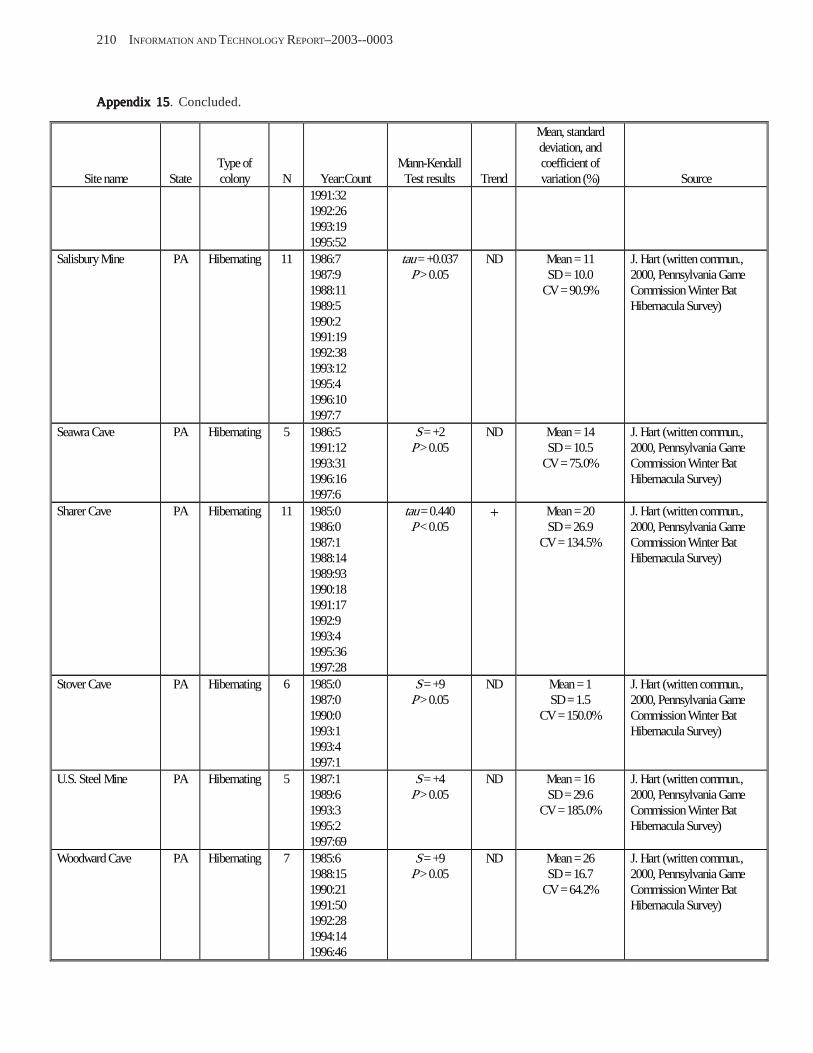
210 INFORMATION AND TECHNOLOGY REPORT–2003--0003
Appendix 15Appendix 15Appendix 15Appendix 15Appendix 15. Concluded.
Mean, standard deviation, and
Site name State Type of colony N Year:Count
Mann-Kendall Test results Trend
coefficient of variation (%) Source
1991:32 1992:26 1993:19 1995:52
Salisbury Mine PA Hibernating 11 1986:7 1987:9 1988:11 1989:5 1990:2 1991:19 1992:38 1993:12 1995:4 1996:10 1997:7
tau = +0.037 P > 0.05
ND Mean = 11 SD = 10.0
CV = 90.9%
J. Hart (written commun., 2000, Pennsylvania Game Commission Winter Bat Hibernacula Survey)
Seawra Cave PA Hibernating 5 1986:5 1991:12 1993:31 1996:16 1997:6
S = +2 P > 0.05
ND Mean = 14 SD = 10.5
CV = 75.0%
J. Hart (written commun., 2000, Pennsylvania Game Commission Winter Bat Hibernacula Survey)
Sharer Cave PA Hibernating 11 1985:0 1986:0 1987:1 1988:14 1989:93 1990:18 1991:17 1992:9 1993:4 1995:36 1997:28
tau = 0.440 P < 0.05
+ Mean = 20 SD = 26.9
CV = 134.5%
J. Hart (written commun., 2000, Pennsylvania Game Commission Winter Bat Hibernacula Survey)
Stover Cave PA Hibernating 6 1985:0 1987:0 1990:0 1993:1 1993:4 1997:1
S = +9 P > 0.05
ND Mean = 1 SD = 1.5
CV = 150.0%
J. Hart (written commun., 2000, Pennsylvania Game Commission Winter Bat Hibernacula Survey)
U.S. Steel Mine PA Hibernating 5 1987:1 1989:6 1993:3 1995:2 1997:69
S = +4 P > 0.05
ND Mean = 16 SD = 29.6
CV = 185.0%
J. Hart (written commun., 2000, Pennsylvania Game Commission Winter Bat Hibernacula Survey)
Woodward Cave PA Hibernating 7 1985:6 1988:15 1990:21 1991:50 1992:28 1994:14 1996:46
S = +9 P > 0.05
ND Mean = 26 SD = 16.7
CV = 64.2%
J. Hart (written commun., 2000, Pennsylvania Game Commission Winter Bat Hibernacula Survey)
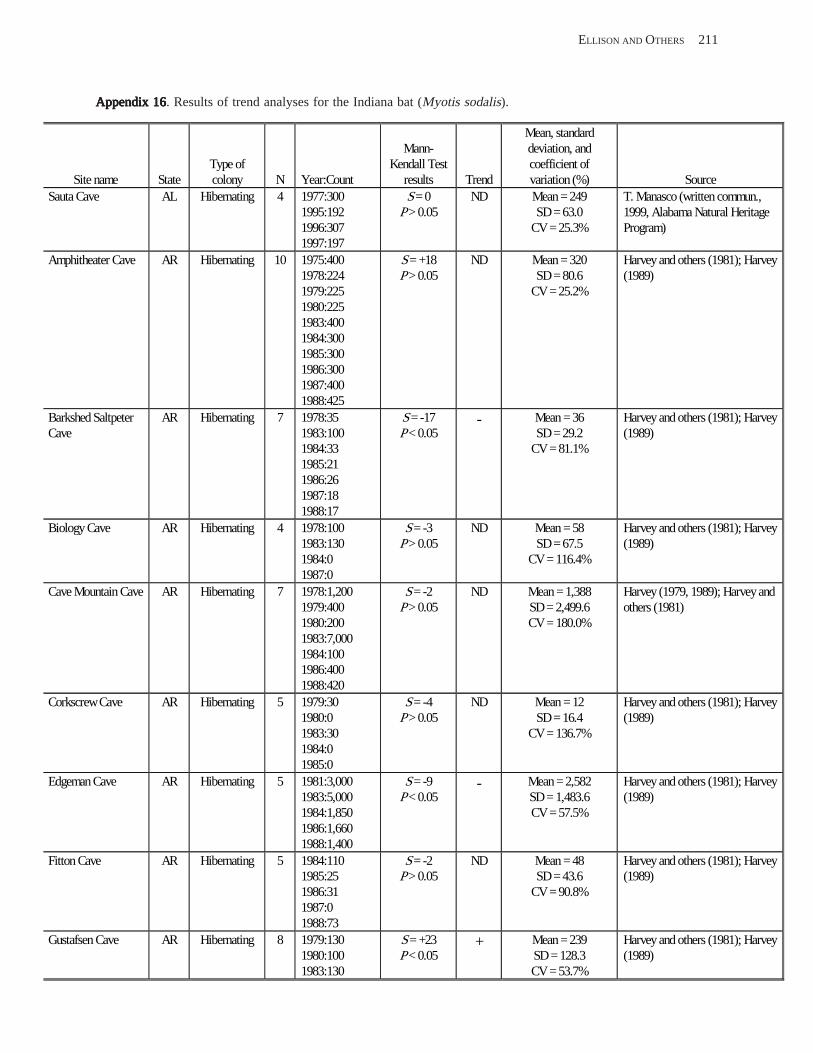
ELLISON AND OTHERS 211
Appendix 16Appendix 16Appendix 16Appendix 16Appendix 16. Results of trend analyses for the Indiana bat (Myotis sodalis).
Mean, standard Mann- deviation, and
Site name State Type of colony N Year:Count
Kendall Test results Trend
coefficient of variation (%) Source
Sauta Cave AL Hibernating 4 1977:300 1995:192 1996:307 1997:197
S = 0 P > 0.05
ND Mean = 249 SD = 63.0
CV = 25.3%
T. Manasco (written commun., 1999, Alabama Natural Heritage Program)
Amphitheater Cave AR Hibernating 10 1975:400 1978:224 1979:225 1980:225 1983:400 1984:300 1985:300 1986:300 1987:400 1988:425
S = +18 P > 0.05
ND Mean = 320 SD = 80.6
CV = 25.2%
Harvey and others (1981); Harvey (1989)
Barkshed Saltpeter Cave
AR Hibernating 7 1978:35 1983:100 1984:33 1985:21 1986:26 1987:18 1988:17
S = -17 P < 0.05
- Mean = 36 SD = 29.2
CV = 81.1%
Harvey and others (1981); Harvey (1989)
Biology Cave AR Hibernating 4 1978:100 1983:130 1984:0 1987:0
S = -3 P > 0.05
ND Mean = 58 SD = 67.5
CV = 116.4%
Harvey and others (1981); Harvey (1989)
Cave Mountain Cave AR Hibernating 7 1978:1,200 1979:400 1980:200 1983:7,000 1984:100 1986:400 1988:420
S = -2 P > 0.05
ND Mean = 1,388 SD = 2,499.6 CV = 180.0%
Harvey (1979, 1989); Harvey and others (1981)
Corkscrew Cave AR Hibernating 5 1979:30 1980:0 1983:30 1984:0 1985:0
S = -4 P > 0.05
ND Mean = 12 SD = 16.4
CV = 136.7%
Harvey and others (1981); Harvey (1989)
Edgeman Cave AR Hibernating 5 1981:3,000 1983:5,000 1984:1,850 1986:1,660 1988:1,400
S = -9 P < 0.05
- Mean = 2,582 SD = 1,483.6 CV = 57.5%
Harvey and others (1981); Harvey (1989)
Fitton Cave AR Hibernating 5 1984:110 1985:25 1986:31 1987:0 1988:73
S = -2 P > 0.05
ND Mean = 48 SD = 43.6
CV = 90.8%
Harvey and others (1981); Harvey (1989)
Gustafsen Cave AR Hibernating 8 1979:130 1980:100 1983:130
S = +23 P < 0.05
+ Mean = 239 SD = 128.3 CV = 53.7%
Harvey and others (1981); Harvey (1989)
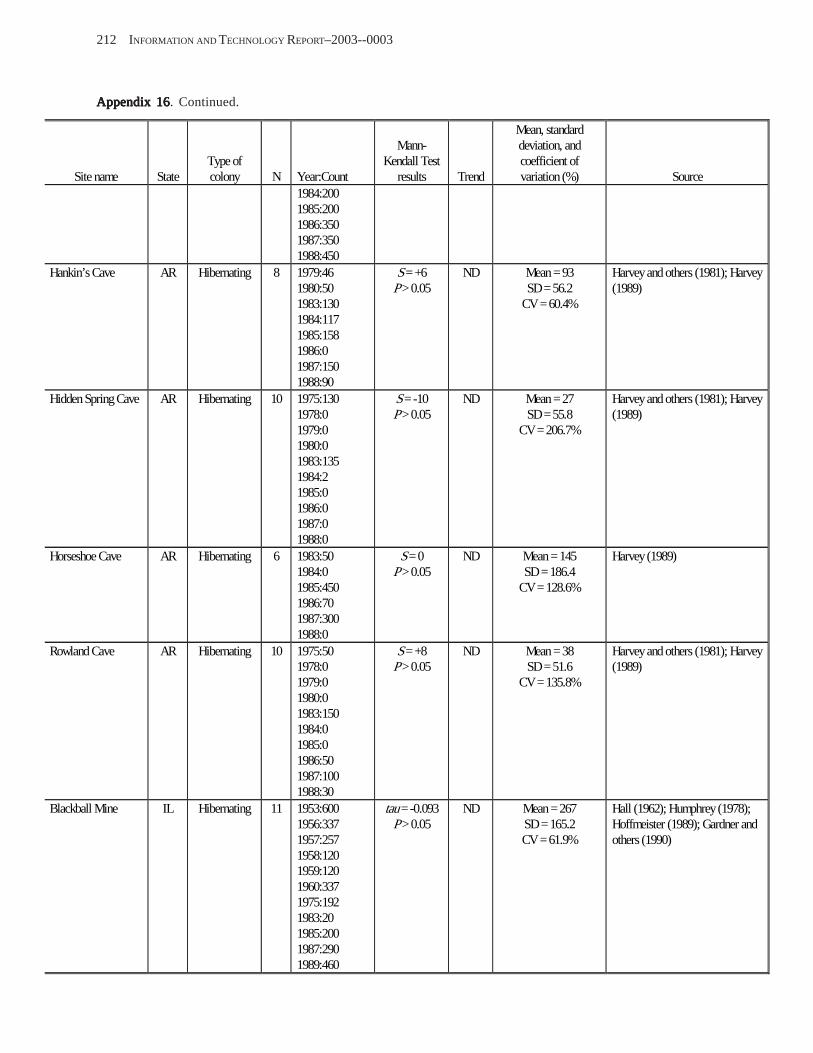
212 INFORMATION AND TECHNOLOGY REPORT–2003--0003
Appendix 16Appendix 16Appendix 16Appendix 16Appendix 16. Continued.
Mean, standard Mann- deviation, and
Site name State Type of colony N Year:Count
Kendall Test results Trend
coefficient of variation (%) Source
1984:200 1985:200 1986:350 1987:350 1988:450
Hankin’s Cave AR Hibernating 8 1979:46 1980:50 1983:130 1984:117 1985:158 1986:0 1987:150 1988:90
S = +6 P > 0.05
ND Mean = 93 SD = 56.2
CV = 60.4%
Harvey and others (1981); Harvey (1989)
Hidden Spring Cave AR Hibernating 10 1975:130 1978:0 1979:0 1980:0 1983:135 1984:2 1985:0 1986:0 1987:0 1988:0
S = -10 P > 0.05
ND Mean = 27 SD = 55.8
CV = 206.7%
Harvey and others (1981); Harvey (1989)
Horseshoe Cave AR Hibernating 6 1983:50 1984:0 1985:450 1986:70 1987:300 1988:0
S = 0 P > 0.05
ND Mean = 145 SD = 186.4
CV = 128.6%
Harvey (1989)
Rowland Cave AR Hibernating 10 1975:50 1978:0 1979:0 1980:0 1983:150 1984:0 1985:0 1986:50 1987:100 1988:30
S = +8 P > 0.05
ND Mean = 38 SD = 51.6
CV = 135.8%
Harvey and others (1981); Harvey (1989)
Blackball Mine IL Hibernating 11 1953:600 1956:337 1957:257 1958:120 1959:120 1960:337 1975:192 1983:20 1985:200 1987:290 1989:460
tau = -0.093 P > 0.05
ND Mean = 267 SD = 165.2 CV = 61.9%
Hall (1962); Humphrey (1978); Hoffmeister (1989); Gardner and others (1990)
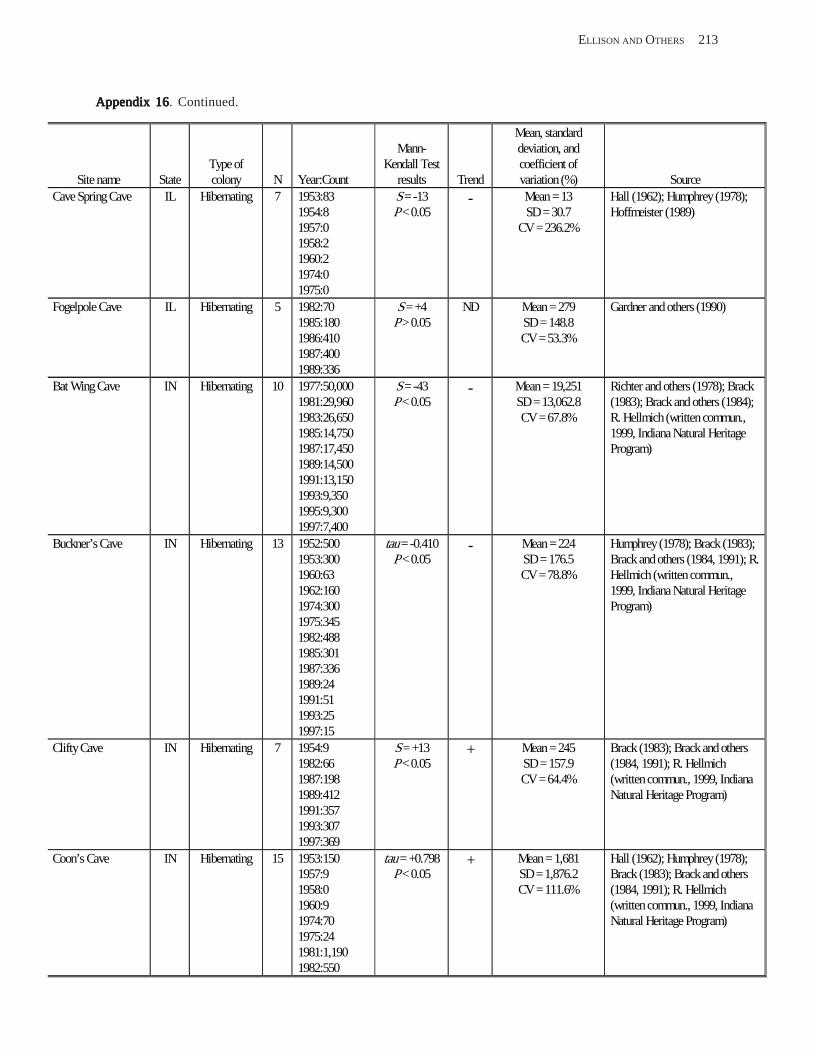
ELLISON AND OTHERS 213
Appendix 16Appendix 16Appendix 16Appendix 16Appendix 16. Continued.
Mean, standard Mann- deviation, and
Site name State Type of colony N Year:Count
Kendall Test results Trend
coefficient of variation (%) Source
Cave Spring Cave IL Hibernating 7 1953:83 1954:8 1957:0 1958:2 1960:2 1974:0 1975:0
S = -13 P < 0.05
- Mean = 13 SD = 30.7
CV = 236.2%
Hall (1962); Humphrey (1978); Hoffmeister (1989)
Fogelpole Cave IL Hibernating 5 1982:70 1985:180 1986:410 1987:400 1989:336
S = +4 P > 0.05
ND Mean = 279 SD = 148.8 CV = 53.3%
Gardner and others (1990)
Bat Wing Cave IN Hibernating 10 1977:50,000 1981:29,960 1983:26,650 1985:14,750 1987:17,450 1989:14,500 1991:13,150 1993:9,350 1995:9,300 1997:7,400
S = -43 P < 0.05
- Mean = 19,251 SD = 13,062.8 CV = 67.8%
Richter and others (1978); Brack (1983); Brack and others (1984); R. Hellmich (written commun., 1999, Indiana Natural Heritage Program)
Buckner’s Cave IN Hibernating 13 1952:500 1953:300 1960:63 1962:160 1974:300 1975:345 1982:488 1985:301 1987:336 1989:24 1991:51 1993:25 1997:15
tau = -0.410 P < 0.05
- Mean = 224 SD = 176.5 CV = 78.8%
Humphrey (1978); Brack (1983); Brack and others (1984, 1991); R. Hellmich (written commun., 1999, Indiana Natural Heritage Program)
Clifty Cave IN Hibernating 7 1954:9 1982:66 1987:198 1989:412 1991:357 1993:307 1997:369
S = +13 P < 0.05
+ Mean = 245 SD = 157.9 CV = 64.4%
Brack (1983); Brack and others (1984, 1991); R. Hellmich (written commun., 1999, Indiana Natural Heritage Program)
Coon’s Cave IN Hibernating 15 1953:150 1957:9 1958:0 1960:9 1974:70 1975:24 1981:1,190 1982:550
tau = +0.798 P < 0.05
+ Mean = 1,681 SD = 1,876.2 CV = 111.6%
Hall (1962); Humphrey (1978); Brack (1983); Brack and others (1984, 1991); R. Hellmich (written commun., 1999, Indiana Natural Heritage Program)

214 INFORMATION AND TECHNOLOGY REPORT–2003--0003
Appendix 16Appendix 16Appendix 16Appendix 16Appendix 16. Continued.
Mean, standard Mann- deviation, and
Site name State Type of colony N Year:Count
Kendall Test results Trend
coefficient of variation (%) Source
Cave Location 6188
MO Hibernating 11 1980:3,900 1981:1,800 1983:1,600 1985:500 1987:40 1989:35 1991:450 1993:625 1995:450 1997:195 1999:175
tau = -0.550 P < 0.05
- Mean = 888 SD = 1,159.7 CV = 130.6%
J. Sternburg (written commun., 1999, Missouri Natural Heritage Database); R. Clawson (written commun., 2003)
Cave Location 6192
MO Hibernating 13 1978:19,500 1979:19,500 1981:12,000 1983:11,150 1985:5,500 1987:4,900 1989:3,050 1991:2,700 1993:1,550 1995:750 1996:535 1997:600 1999:400
tau = -0.968 P < 0.05
- Mean = 6,318 SD = 6,979.2 CV = 110.5%
J. Sternburg (written commun., 1999, Missouri Natural Heritage Database); R. Clawson (written commun., 2003)
Cave Location 6193
MO Hibernating 13 1975:6,000 1978:10,000 1979:10,500 1981:5,800 1983:4,950 1985:2,000 1987:700 1989:475 1991:160 1993:80 1995:40 1997:15 1999:14
tau = -0.923 P < 0.05
- Mean = 3,133 SD = 3,889.2 CV = 124.1%
J. Sternburg (written commun., 1999, Missouri Natural Heritage Database); R. Clawson (written commun., 2003)
Cave Location 6211
MO Hibernating 4 1985:225 1994:95 1995:95 1996:37
S = -5 P > 0.05
ND Mean = 113 SD = 79.5
CV = 70.4%
J. Sternburg (written commun., 1999, Missouri Natural Heritage Database); R. Clawson (written commun., 2003)
Cave Location 6194
MO Hibernating 13 1979:8,100 1980:4,000 1981:2,500 1983:5,350 1985:3,550 1987:4,900 1989:2,600 1991:2,975 1993:2,250
t = -0.436 P < 0.05
- Mean = 3,888 SD = 2,145.9 CV = 55.2%
J. Sternburg (written commun., 1999, Missouri Natural Heritage Database); R. Clawson (written commun., 2003)
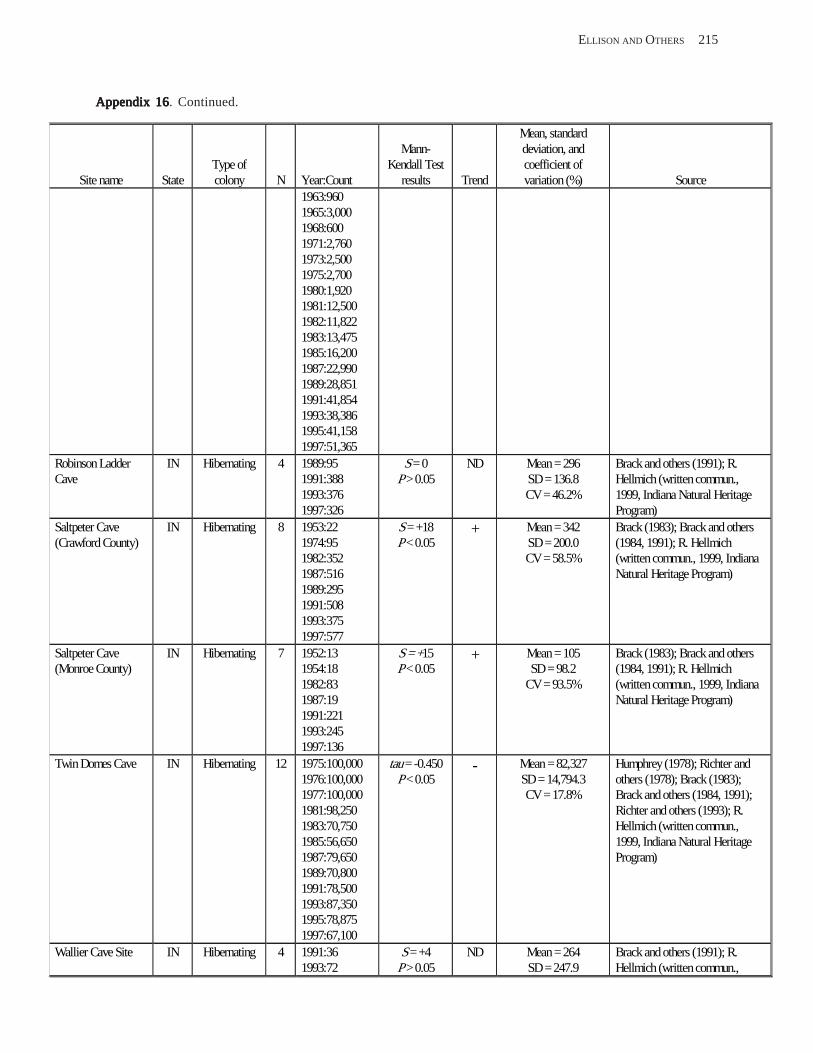
ELLISON AND OTHERS 215
Appendix 16Appendix 16Appendix 16Appendix 16Appendix 16. Continued.
Mean, standard Mann- deviation, and
Site name State Type of colony N Year:Count
Kendall Test results Trend
coefficient of variation (%) Source
1963:960 1965:3,000 1968:600 1971:2,760 1973:2,500 1975:2,700 1980:1,920 1981:12,500 1982:11,822 1983:13,475 1985:16,200 1987:22,990 1989:28,851 1991:41,854 1993:38,386 1995:41,158 1997:51,365
Robinson Ladder Cave
IN Hibernating 4 1989:95 1991:388 1993:376 1997:326
S = 0 P > 0.05
ND Mean = 296 SD = 136.8 CV = 46.2%
Brack and others (1991); R. Hellmich (written commun., 1999, Indiana Natural Heritage Program)
Saltpeter Cave (Crawford County)
IN Hibernating 8 1953:22 1974:95 1982:352 1987:516 1989:295 1991:508 1993:375 1997:577
S = +18 P < 0.05
+ Mean = 342 SD = 200.0 CV = 58.5%
Brack (1983); Brack and others (1984, 1991); R. Hellmich (written commun., 1999, Indiana Natural Heritage Program)
Saltpeter Cave (Monroe County)
IN Hibernating 7 1952:13 1954:18 1982:83 1987:19 1991:221 1993:245 1997:136
S = +15 P < 0.05
+ Mean = 105 SD = 98.2
CV = 93.5%
Brack (1983); Brack and others (1984, 1991); R. Hellmich (written commun., 1999, Indiana Natural Heritage Program)
Twin Domes Cave IN Hibernating 12 1975:100,000 1976:100,000 1977:100,000 1981:98,250 1983:70,750 1985:56,650 1987:79,650 1989:70,800 1991:78,500 1993:87,350 1995:78,875 1997:67,100
tau = -0.450 P < 0.05
- Mean = 82,327 SD = 14,794.3 CV = 17.8%
Humphrey (1978); Richter and others (1978); Brack (1983); Brack and others (1984, 1991); Richter and others (1993); R. Hellmich (written commun., 1999, Indiana Natural Heritage Program)
Wallier Cave Site IN Hibernating 4 1991:36 1993:72
S = +4 P > 0.05
ND Mean = 264 SD = 247.9
Brack and others (1991); R. Hellmich (written commun.,

216 INFORMATION AND TECHNOLOGY REPORT–2003--0003
Appendix 16Appendix 16Appendix 16Appendix 16Appendix 16. Continued.
Site name State Type of colony N Year:Count
Mann-Kendall Test
results Trend
Mean, standard deviation, and coefficient of variation (%) Source
1995:537 1997:409
Wildcat Cave IN Hibernating 6 1950:6 S = +9 ND Mean = 29 Brack (1983); Brack and others 1982:29 P > 0.05 SD = 23.5 (1984, 1991); R. Hellmich 1987:0 CV = 81.0% (written commun., 1999, Indiana 1991:31 Natural Heritage Program) 1993:61 1997:48
Wyandotte Cave IN Hibernating 19 1952:15,000 tau = +0.563 + Mean = 7,363 Kirkpatrick and Conaway (1948); 1956:2,000 P < 0.05 SD = 7,864.3 Hall (1962); Mumford (1969); 1960:1,944 CV = 106.8% Humphrey (1978); Brack (1983); 1962:2,000 Brack and others (1984, 1991); 1965:3,000 Whitaker and Gammon (1988); 1968:1,140 Richter and others (1993); R. 1970:1,000 Hellmich (written commun., 1974:1,900 1999, Indiana Natural Heritage 1975:1,460 Program) 1977:2,500 1981:2,152 1983:4,550 1985:4,627 1987:6,681 1989:10,344 1991:13,000 1993:17,304 1995:23,878 1997:25,424
Armine Branch Cave KY Hibernating 4 1980:225 S = -2 ND Mean = 230 T. Wethington (written commun., 1983:275 P > 0.05 SD = 41.7 1999, Kentucky Department of 1988:246 CV = 18.1% Fish and Wildlife Resources) 1989:176
Ash Cave KY Hibernating 6 1984:132 S = -15 - Mean = 77 T. Wethington (written commun., 1988:104 P < 0.05 SD = 38.1 1999, Kentucky Department of 1990:78 CV = 49.5% Fish and Wildlife Resources) 1991:73 1997:47 1999:26
Bat Cave (Carter KY Hibernating 23 1937:90,000 tau = -0.499 - Mean = 57,913 Welter and Sollberger (1939); County) 1956:100,000 P < 0.05 SD = 27,316.5 Hall (1962), Hassell (1963);
1959:100,000 CV = 47.2% Hardin (1967); Hardin and 1960:100,000 Hassell (1970); T. Wethington 1961:100,000 (written commun., 1999, 1962:100,000 Kentucky Department of Fish and 1965:90,000 Wildlife Resources) 1974:40,000 1975:40,000 1976:40,000 1981:51,500 1983:43,500 1984:45,300
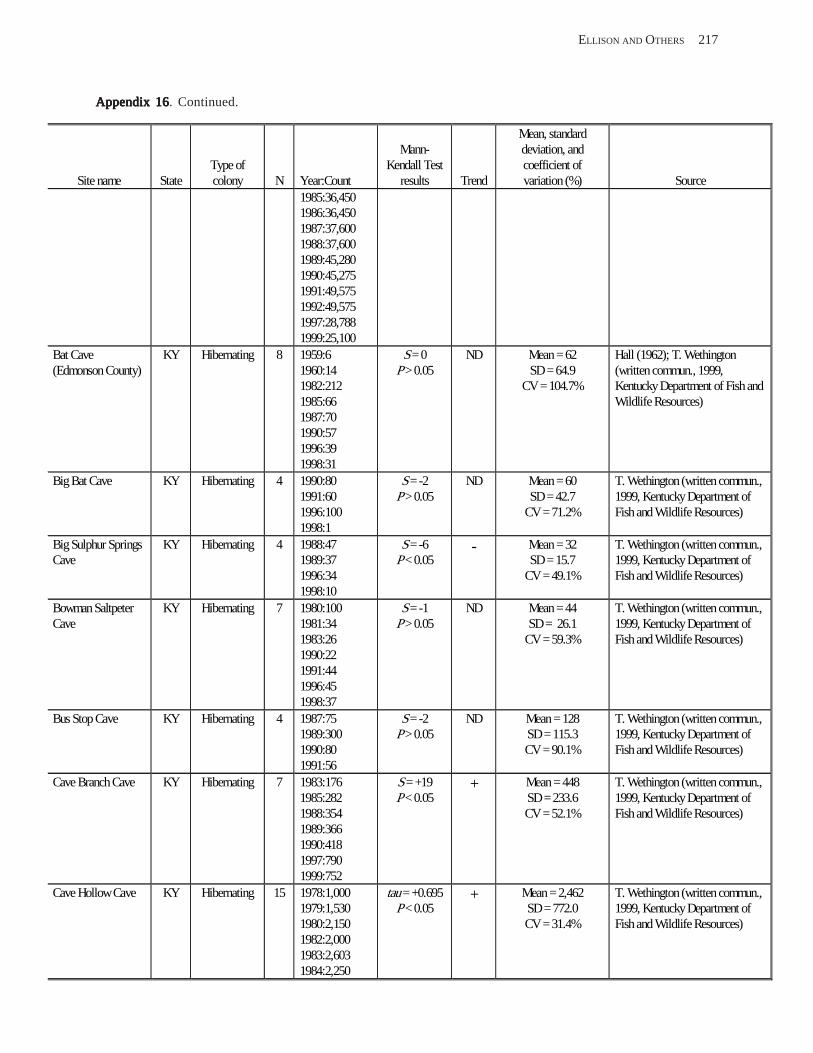
ELLISON AND OTHERS 217
Appendix 16Appendix 16Appendix 16Appendix 16Appendix 16. Continued.
Mean, standard Mann- deviation, and
Site name State Type of colony N Year:Count
Kendall Test results Trend
coefficient of variation (%) Source
1985:36,450 1986:36,450 1987:37,600 1988:37,600 1989:45,280 1990:45,275 1991:49,575 1992:49,575 1997:28,788 1999:25,100
Bat Cave (Edmonson County)
KY Hibernating 8 1959:6 1960:14 1982:212 1985:66 1987:70 1990:57 1996:39 1998:31
S = 0 P > 0.05
ND Mean = 62 SD = 64.9
CV = 104.7%
Hall (1962); T. Wethington (written commun., 1999, Kentucky Department of Fish and Wildlife Resources)
Big Bat Cave KY Hibernating 4 1990:80 1991:60 1996:100 1998:1
S = -2 P > 0.05
ND Mean = 60 SD = 42.7
CV = 71.2%
T. Wethington (written commun., 1999, Kentucky Department of Fish and Wildlife Resources)
Big Sulphur Springs Cave
KY Hibernating 4 1988:47 1989:37 1996:34 1998:10
S = -6 P < 0.05
- Mean = 32 SD = 15.7
CV = 49.1%
T. Wethington (written commun., 1999, Kentucky Department of Fish and Wildlife Resources)
Bowman Saltpeter Cave
KY Hibernating 7 1980:100 1981:34 1983:26 1990:22 1991:44 1996:45 1998:37
S = -1 P > 0.05
ND Mean = 44 SD = 26.1
CV = 59.3%
T. Wethington (written commun., 1999, Kentucky Department of Fish and Wildlife Resources)
Bus Stop Cave KY Hibernating 4 1987:75 1989:300 1990:80 1991:56
S = -2 P > 0.05
ND Mean = 128 SD = 115.3 CV = 90.1%
T. Wethington (written commun., 1999, Kentucky Department of Fish and Wildlife Resources)
Cave Branch Cave KY Hibernating 7 1983:176 1985:282 1988:354 1989:366 1990:418 1997:790 1999:752
S = +19 P < 0.05
+ Mean = 448 SD = 233.6 CV = 52.1%
T. Wethington (written commun., 1999, Kentucky Department of Fish and Wildlife Resources)
Cave Hollow Cave KY Hibernating 15 1978:1,000 1979:1,530 1980:2,150 1982:2,000 1983:2,603 1984:2,250
tau = +0.695 P < 0.05
+ Mean = 2,462 SD = 772.0 CV = 31.4%
T. Wethington (written commun., 1999, Kentucky Department of Fish and Wildlife Resources)

218 INFORMATION AND TECHNOLOGY REPORT–2003--0003
Appendix 16Appendix 16Appendix 16Appendix 16Appendix 16. Continued.
Mean, standard Mann- deviation, and
Site name State Type of colony N Year:Count
Kendall Test results Trend
coefficient of variation (%) Source
1985:1,812 1986:2,167 1987:2,609 1988:2,947 1989:3,485 1990:2,312 1991:2,753 1997:3,969 1998:3,340
Cave Hollow Pit KY Hibernating 6 1980:1 1982:1 1987:1 1988:3 1991:17 1997:3
S = +9 P > 0.05
ND Mean = 4 SD = 6.3
CV = 157.5%
T. Wethington (written commun., 1999, Kentucky Department of Fish and Wildlife Resources)
Cedar Post Cave KY Hibernating 6 1983:56 1990:113 1994:184 1997:132 1998:103 1999:95
S = -1 P > 0.05
ND Mean = 114 SD = 42.6
CV = 37.4%
T. Wethington (written commun., 1999, Kentucky Department of Fish and Wildlife Resources)
Coach Cave KY Hibernating 21 1957:100,000 1958:100,000 1959:100,000 1960:100,000 1961:100,000 1975:4,500 1976:4,500 1982:550 1983:600 1984:600 1985:424 1986:425 1987:250 1988:250 1989:50 1990:50 1991:48 1992:50 1993:27 1997:27 1999:33
tau = -0.899 P < 0.05
- Mean = 24,399 SD = 43,324.5 CV = 177.6%
Hall (1962); Humphrey (1978); T. Wethington (written commun., 1999, Kentucky Department of Fish and Wildlife Resources)
Colossal Cave KY Hibernating 14 1953:6,000 1956:1,000 1957:1,000 1958:2,000 1959:2,000 1960:3,000 1975:14 1982:349
tau = -0.411 P < 0.05
- Mean = 1,296 SD = 1,592.3 CV = 122.9%
Hall (1962); Humphrey (1978); T. Wethington (written commun., 1999, Kentucky Department of Fish and Wildlife Resources)

ELLISON AND OTHERS 219
Appendix 16Appendix 16Appendix 16Appendix 16Appendix 16. Continued.
Mean, standard Mann- deviation, and
Site name State Type of colony N Year:Count
Kendall Test results Trend
coefficient of variation (%) Source
1985:445 1987:498 1989:614 1991:556 1997:284 1999:387
Cool Springs Cave KY Hibernating 8 1981:400 1983:126 1984:241 1985:78 1988:346 1990:308 1996:189 1998:221
S = -4 P > 0.05
ND Mean = 239 SD = 109.3 CV = 45.7%
T. Wethington (written commun., 1999, Kentucky Department of Fish and Wildlife Resources)
Dixon Cave KY Hibernating 15 1956:2,500 1957:2,500 1958:2,500 1959:2,500 1960:2,500 1969:4,000 1975:3,600 1982:30,000 1983:30,000 1985:26,850 1987:16,550 1989:10,700 1991:9,150 1997:7,050 1999:5,575
tau = +0.382 P < 0.05
+ Mean = 10,398 SD = 10,392.8 CV = 99.9%
Bailey (1933); Mohr (1933b); Hall (1962); Humphrey (1978); T. Wethington (written commun., 1999, Kentucky Department of Fish and Wildlife Resources)
Goochland Cave KY Hibernating 9 1976:50 1981:136 1983:160 1987:65 1989:121 1990:134 1991:226 1996:253 1998:356
S = +24 P < 0.05
+ Mean = 167 SD = 96.8
CV = 58.0%
T. Wethington (written commun., 1999, Kentucky Department of Fish and Wildlife Resources)
Great Saltpeter Cave KY Hibernating 4 1964:10 1978:10 1981:0 1990:0
S = -4 P > 0.05
ND Mean = 5 SD = 5.8
CV = 116.0%
T. Wethington (written commun., 1999, Kentucky Department of Fish and Wildlife Resources)
Indian Cave KY Hibernating 6 1973:100 1986:21 1987:19 1988:19 1989:16 1990:17
S = -12 P < 0.05
- Mean = 32 SD = 33.4
CV = 104.4%
T. Wethington (written commun., 1999, Kentucky Department of Fish and Wildlife Resources)
Jesse James Cave KY Hibernating 8 1980:1,293 1983:700
S = -26 P < 0.05
- Mean = 308 SD = 461.1
T. Wethington (written commun., 1999, Kentucky Department of

220 INFORMATION AND TECHNOLOGY REPORT–2003--0003
Appendix 16Appendix 16Appendix 16Appendix 16Appendix 16. Continued.
Mean, standard Mann- deviation, and
Site name State Type of colony N Year:Count
Kendall Test results Trend
coefficient of variation (%) Source
1985:230 1987:160 1989:75 1991:1 1997:3 1999:0
Line Fork Cave KY Hibernating 5 1963:10,000 1982:8,379 1988:5,016 1991:3,297 1999:1,308
S = -10 P < 0.05
- Mean = 5,600 SD = 3,575.9 CV = 63.8%
T. Wethington (written commun., 1999, Kentucky Department of Fish and Wildlife Resources)
Little Amos Cave KY Hibernating 7 1983:1,160 1986:188 1988:440 1989:380 1995:1,972 1997:1,835 1999:114
S = -1 P > 0.05
ND Mean = 870 SD = 784.4 CV = 90.2%
T. Wethington (written commun., 1999, Kentucky Department of Fish and Wildlife Resources)
Long’s Cave KY Hibernating 14 1947:50,000 1956:1,200 1957:3,000 1958:2,000 1959:1,500 1960:1,500 1962:2,000 1975:7,600 1982:7,527 1985:3,717 1987:2,801 1988:2,646 1989:2,669 1991:1,249
tau = -0.056 P > 0.05
ND Mean = 6,386 SD = 12,721.0 CV = 199.2%
Hall (1962), Humphrey (1978) T. Wethington (written commun., 1999, Kentucky Department of Fish and Wildlife Resources)
Minton Hollow Cave KY Hibernating 4 1986:131 1987:26 1988:46 1990:54
S = 0 P > 0.05
ND Mean = 64 SD = 46.0
CV = 71.9%
T. Wethington (written commun., 1999, Kentucky Department of Fish and Wildlife Resources)
Murder Branch Cave KY Hibernating 5 1983:1 1988:2 1991:2 1992:4 1995:3
S = +7 P > 0.05
ND Mean = 2 SD = 1.1
CV = 55.0%
T. Wethington (written commun., 1999, Kentucky Department of Fish and Wildlife Resources)
Shaw Hill Bat Cave KY Hibernating 5 1988:183 1989:35 1990:25 1991:53 1996:34
S = -4 P > 0.05
ND Mean = 66 SD = 66.2
CV = 100.3%
T. Wethington (written commun., 1999, Kentucky Department of Fish and Wildlife Resources)
Smokehole Cave KY Hibernating 8 1976:1,000 1981:1,702 1983:1,882 1987:2,609
S = +6 P > 0.05
ND Mean = 1,788 SD = 519.8 CV = 29.1%
T. Wethington (written commun., 1999, Kentucky Department of Fish and Wildlife Resources)

ELLISON AND OTHERS 221
Appendix 16Appendix 16Appendix 16Appendix 16Appendix 16. Continued.
Mean, standard Mann- deviation, and
Site name State Type of colony N Year:Count
Kendall Test results Trend
coefficient of variation (%) Source
1989:1,468 1990:1,858 1996:1,417 1998:2,367
Stillhouse Cave KY Hibernating 11 1979:2,400 1980:1,488 1982:1,545 1983:1,864 1985:1,204 1987:1,047 1988:1,213 1991:1,238 1995:1,223 1997:679 1999:711
tau = -0.564 P < 0.05
- Mean = 1,328 SD = 493.7 CV = 37.2%
T. Wethington (written commun., 1999, Kentucky Department of Fish and Wildlife Resources)
Thornhill Cave KY Hibernating 4 1963:3,680 1986:82 1987:5 1998:1
S = -6 P < 0.05
- Mean = 942 SD = 1,825.7 CV = 193.8%
T. Wethington (written commun., 1999, Kentucky Department of Fish and Wildlife Resources)
War Fork Cave KY Hibernating 8 1971:300 1981:1,000 1983:446 1990:946 1994:809 1996:743 1998:662 1999:595
S = -4 P > 0.05
ND Mean = 688 SD = 239.0 CV = 34.7%
T. Wethington (written commun., 1999, Kentucky Department of Fish and Wildlife Resources)
Waterfall Cave KY Hibernating 7 1976:1,000 1981:980 1982:600 1990:1,138 1991:891 1996:963 1998:760
S = -7 P > 0.05
ND Mean = 904 SD = 176.3 CV = 19.5%
T. Wethington (written commun., 1999, Kentucky Department of Fish and Wildlife Resources)
Well Cave KY Hibernating 4 1995:699 1996:696 1997:596 1999:540
S = -6 P < 0.05
- Mean = 633 SD = 78.2
CV = 12.4%
T. Wethington (written commun., 1999, Kentucky Department of Fish and Wildlife Resources)
Wind Cave KY Hibernating 8 1981:251 1983:312 1986:245 1989:56 1990:94 1994:288 1996:491 1998:432
S = +8 P > 0.05
ND Mean = 271 SD = 148.8 CV = 54.9%
T. Wethington (written commun., 1999, Kentucky Department of Fish and Wildlife Resources)
Bat Cave (Shannon County)
MO Hibernating 9 1958:100,000 1959:100,000 1960:30,000 1975:40,000
S = -26 P < 0.05
- Mean = 38,225 SD = 37,545.4 CV = 98.2%
Hall (1962); Hall and Blewett (1964); Myers (1964a,b); J. Sternburg (written commun., 1999, Missouri Natural Heritage

222 INFORMATION AND TECHNOLOGY REPORT–2003--0003
Appendix 16Appendix 16Appendix 16Appendix 16Appendix 16. Continued.
Mean, standard Mann- deviation, and
Site name State Type of colony N Year:Count
Kendall Test results Trend
coefficient of variation (%) Source
1983:30,750 1985:30,450 1987:4,275 1989:4,275 1991:4,275
Cave Location 6177
MO Hibernating 4 1990:350 1992:250 1994:500 1996:650
S = +4 P > 0.05
ND Mean = 438 SD = 175.0 CV = 40.0%
J. Sternburg (written commun., 1999, Missouri Natural Heritage Database); R. Clawson (written commun., 2003)
Cave Location 6190
MO Hibernating 21 1955:600 1958:100 1960:600 1962:80 1981:5,350 1982:4,350 1983:3,250 1984:2,500 1985:2,250 1987:2,050 1988:2,500 1989:1,575 1991:1,257 1992:700 1993:700 1994:525 1995:325 1996:380 1997:260 1998:270 1999:155
tau = -0.933 P < 0.05
- Mean = 1,170 SD = 1,485.2 CV = 104.7%
Hall (1962); Humphrey (1978); Myers (1964a,b); J. Sternburg (written commun., 1999, Missouri Natural Heritage Database); R. Clawson (written commun., 2003)
Cave Location 6182
MO Hibernating 14 1982:1,100 1983:1,100 1984:750 1985:650 1987:525 1988:400 1989:400 1990:350 1991:300 1992:275 1993:225 1995:190 1997:95 1998:90
tau = -0.989 P < 0.05
- Mean = 461 SD = 330.6 CV = 71.7%
J. Sternburg (written commun., 1999, Missouri Natural Heritage Database); R. Clawson (written commun., 2003)
Cave Location 6189
MO Hibernating 18 1975:21,000 1976:12,000 1977:9,050 1978:12,050 1979:8,850 1980:9,300
tau = -0.843 P < 0.05
- Mean = 4,645 SD = 6,074.3 CV = 130.8%
J. Sternburg (written commun., 1999, Missouri Natural Heritage Database); R. Clawson (written commun., 2003)

ELLISON AND OTHERS 223
Appendix 16Appendix 16Appendix 16Appendix 16Appendix 16. Continued.
Mean, standard Mann- deviation, and
Site name State Type of colony N Year:Count
Kendall Test results Trend
coefficient of variation (%) Source
1981:5,200 1983:3,150 1985:1,050 1987:600 1989:250 1990:200 1991:160 1992:150 1993:125 1995:140 1997:175 1999:155
Cave Location 6208
MO Hibernating 4 1988:63 1990:1 1992:175 1998:79
S = +2 P > 0.05
ND Mean = 80 SD = 72.0
CV = 90.0%
J. Sternburg (written commun., 1999, Missouri Natural Heritage Database); R. Clawson (written commun., 2003)
Cave Location 6199
MO Hibernating 9 1957:250 1964:250 1978:60 1988:700 1990:0 1993:625 1995:400 1997:570 1999:500
S = +6 P > 0.05
ND Mean = 373 SD = 248.4 CV = 66.6%
J. Sternburg (written commun., 1999, Missouri Natural Heritage Database); R. Clawson (written commun., 2003)
Cave Location 6203
MO Hibernating 7 1984:400 1988:1,000 1991:900 1993:750 1995:775 1997:510 1999:450
S = -7 P > 0.05
ND Mean = 684 SD = 232.7 CV = 34.0%
J. Sternburg (written commun., 1999, Missouri Natural Heritage Database); R. Clawson (written commun., 2003)
Cave Location 6187
MO Hibernating 8 1954:600 1958:100 1960:600 1962:30 1987:575 1989:375 1993:100 1997:0
S = -14 P < 0.05
- Mean = 298 SD = 268.4 CV = 90.2%
Hall (1962); Humphrey (1978); Myers (1964a,b); J. Sternburg (written commun., 1999, Missouri Natural Heritage Database); R. Clawson (written commun., 2003)

224 INFORMATION AND TECHNOLOGY REPORT–2003--0003
Appendix 16Appendix 16Appendix 16Appendix 16Appendix 16. Continued.
Mean, standard Mann- deviation, and
Site name State Type of colony N Year:Count
Kendall Test results Trend
coefficient of variation (%) Source
Cave Location 6188
MO Hibernating 11 1980:3,900 1981:1,800 1983:1,600 1985:500 1987:40 1989:35 1991:450 1993:625 1995:450 1997:195 1999:175
tau = -0.550 P < 0.05
- Mean = 888 SD = 1,159.7 CV = 130.6%
J. Sternburg (written commun., 1999, Missouri Natural Heritage Database); R. Clawson (written commun., 2003)
Cave Location 6192
MO Hibernating 13 1978:19,500 1979:19,500 1981:12,000 1983:11,150 1985:5,500 1987:4,900 1989:3,050 1991:2,700 1993:1,550 1995:750 1996:535 1997:600 1999:400
tau = -0.968 P < 0.05
- Mean = 6,318 SD = 6,979.2 CV = 110.5%
J. Sternburg (written commun., 1999, Missouri Natural Heritage Database); R. Clawson (written commun., 2003)
Cave Location 6193
MO Hibernating 13 1975:6,000 1978:10,000 1979:10,500 1981:5,800 1983:4,950 1985:2,000 1987:700 1989:475 1991:160 1993:80 1995:40 1997:15 1999:14
tau = -0.923 P < 0.05
- Mean = 3,133 SD = 3,889.2 CV = 124.1%
J. Sternburg (written commun., 1999, Missouri Natural Heritage Database); R. Clawson (written commun., 2003)
Cave Location 6211
MO Hibernating 4 1985:225 1994:95 1995:95 1996:37
S = -5 P > 0.05
ND Mean = 113 SD = 79.5
CV = 70.4%
J. Sternburg (written commun., 1999, Missouri Natural Heritage Database); R. Clawson (written commun., 2003)
Cave Location 6194
MO Hibernating 13 1979:8,100 1980:4,000 1981:2,500 1983:5,350 1985:3,550 1987:4,900 1989:2,600 1991:2,975 1993:2,250
t = -0.436 P < 0.05
- Mean = 3,888 SD = 2,145.9 CV = 55.2%
J. Sternburg (written commun., 1999, Missouri Natural Heritage Database); R. Clawson (written commun., 2003)

ELLISON AND OTHERS 225
Appendix 16Appendix 16Appendix 16Appendix 16Appendix 16. Continued.
Mean, standard Mann- deviation, and
Site name State Type of colony N Year:Count
Kendall Test results Trend
coefficient of variation (%) Source
1994:8,000 1995:2,125 1997:1,500 1999:2,700
Cave Location 6202
MO Hibernating 4 1962:150 1987:50 1997:975 1999:1,660
S = +4 P > 0.05
ND Mean = 709 SD = 757.6
CV = 106.9%
J. Sternburg (written commun., 1999, Missouri Natural Heritage Database); R. Clawson (written commun., 2003)
Cave Location 6173
MO Hibernating 6 1981:2,250 1987:400 1988:250 1991:20 1992:0 1997:0
S = -13 P < 0.05
- Mean = 487 SD = 879.1
CV = 180.5%
J. Sternburg (written commun., 1999, Missouri Natural Heritage Database); R. Clawson (written commun., 2003)
Cave Location 6191
MO Hibernating 14 1979:2,950 1980:2,750 1981:2,800 1983:4,550 1985:3,400 1987:5,300 1989:5,150 1990:6,000 1991:6,225 1993:4,550 1995:3,600 1997:1,615 1998:1,400 1999:975
tau = -0.121 P > 0.05
ND Mean = 3,662 SD = 1,691.2 CV = 46.2%
J. Sternburg (written commun., 1999, Missouri Natural Heritage Database); R. Clawson (written commun., 2003)
Cave Location 6196
MO Hibernating 11 1975:81,800 1981:72,500 1983:85,700 1985:77,950 1987:60,650 1989:38,875 1991:32,125 1993:22,750 1995:13,850 1997:11,875 1999:9,100
tau = -0.891 P < 0.05
- Mean = 46,107 SD = 30,230.6 CV = 65.6%
J. Sternburg (written commun., 1999, Missouri Natural Heritage Database); R. Clawson (written commun., 2003)
Cave Location 6198
MO Hibernating 8 1975:125 1978:113 1986:12 1988:75 1993:6 1996:90 1997:45 1999:1
S = -16 P < 0.05
- Mean = 58 SD = 49.4
CV = 85.2%
J. Sternburg (written commun., 1999, Missouri Natural Heritage Database); R. Clawson (written commun., 2003)
Cave Location 6174
MO Hibernating 4 1978:500 1987:1 1988:0
S = -5 P > 0.05
ND Mean = 125 SD = 249.8
CV = 199.8%
J. Sternburg (written commun., 1999, Missouri Natural Heritage Database); R. Clawson (written
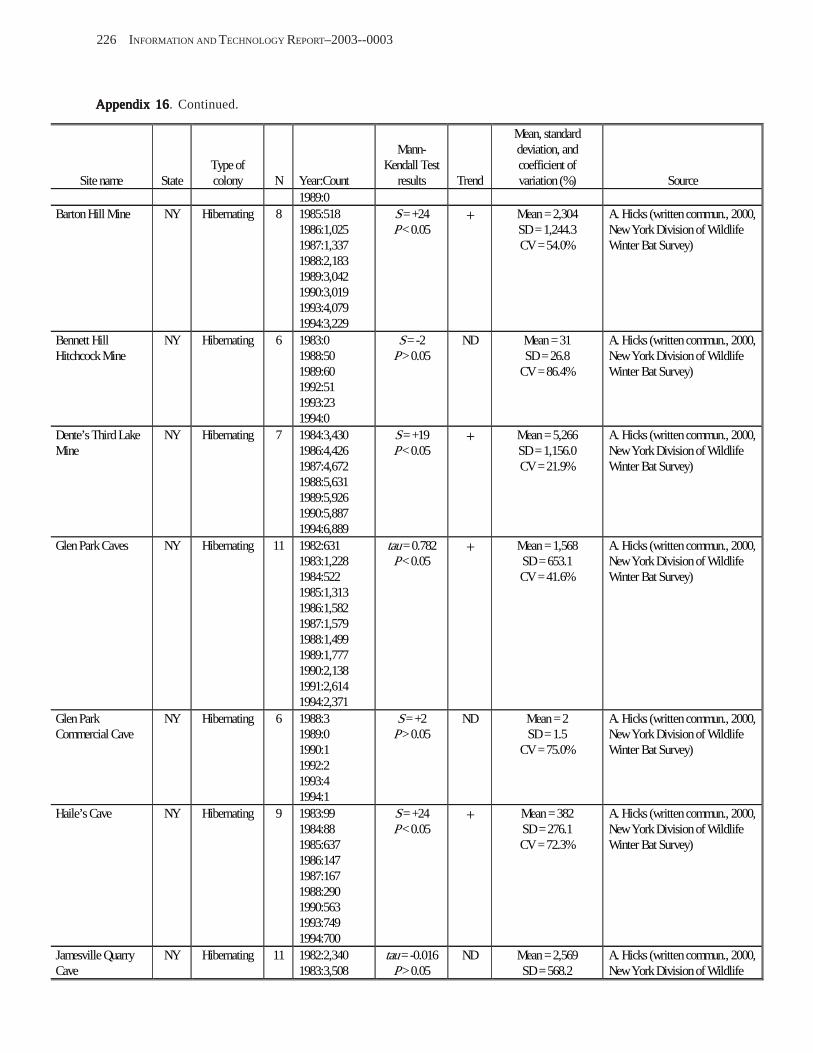
226 INFORMATION AND TECHNOLOGY REPORT–2003--0003
Appendix 16Appendix 16Appendix 16Appendix 16Appendix 16. Continued.
Mean, standard Mann- deviation, and
Site name State Type of colony N Year:Count
Kendall Test results Trend
coefficient of variation (%) Source
1989:0 Barton Hill Mine NY Hibernating 8 1985:518
1986:1,025 1987:1,337 1988:2,183 1989:3,042 1990:3,019 1993:4,079 1994:3,229
S = +24 P < 0.05
+ Mean = 2,304 SD = 1,244.3 CV = 54.0%
A. Hicks (written commun., 2000, NewYork Division of Wildlife Winter Bat Survey)
Bennett Hill Hitchcock Mine
NY Hibernating 6 1983:0 1988:50 1989:60 1992:51 1993:23 1994:0
S = -2 P > 0.05
ND Mean = 31 SD = 26.8
CV = 86.4%
A. Hicks (written commun., 2000, NewYork Division of Wildlife Winter Bat Survey)
Dente’s Third Lake Mine
NY Hibernating 7 1984:3,430 1986:4,426 1987:4,672 1988:5,631 1989:5,926 1990:5,887 1994:6,889
S = +19 P < 0.05
+ Mean = 5,266 SD = 1,156.0 CV = 21.9%
A. Hicks (written commun., 2000, NewYork Division of Wildlife Winter Bat Survey)
Glen Park Caves NY Hibernating 11 1982:631 1983:1,228 1984:522 1985:1,313 1986:1,582 1987:1,579 1988:1,499 1989:1,777 1990:2,138 1991:2,614 1994:2,371
tau = 0.782 P < 0.05
+ Mean = 1,568 SD = 653.1 CV = 41.6%
A. Hicks (written commun., 2000, NewYork Division of Wildlife Winter Bat Survey)
Glen Park Commercial Cave
NY Hibernating 6 1988:3 1989:0 1990:1 1992:2 1993:4 1994:1
S = +2 P > 0.05
ND Mean = 2 SD = 1.5
CV = 75.0%
A. Hicks (written commun., 2000, NewYork Division of Wildlife Winter Bat Survey)
Haile’s Cave NY Hibernating 9 1983:99 1984:88 1985:637 1986:147 1987:167 1988:290 1990:563 1993:749 1994:700
S = +24 P < 0.05
+ Mean = 382 SD = 276.1 CV = 72.3%
A. Hicks (written commun., 2000, NewYork Division of Wildlife Winter Bat Survey)
Jamesville Quarry Cave
NY Hibernating 11 1982:2,340 1983:3,508
tau = -0.016 P > 0.05
ND Mean = 2,569 SD = 568.2
A. Hicks (written commun., 2000, NewYork Division of Wildlife
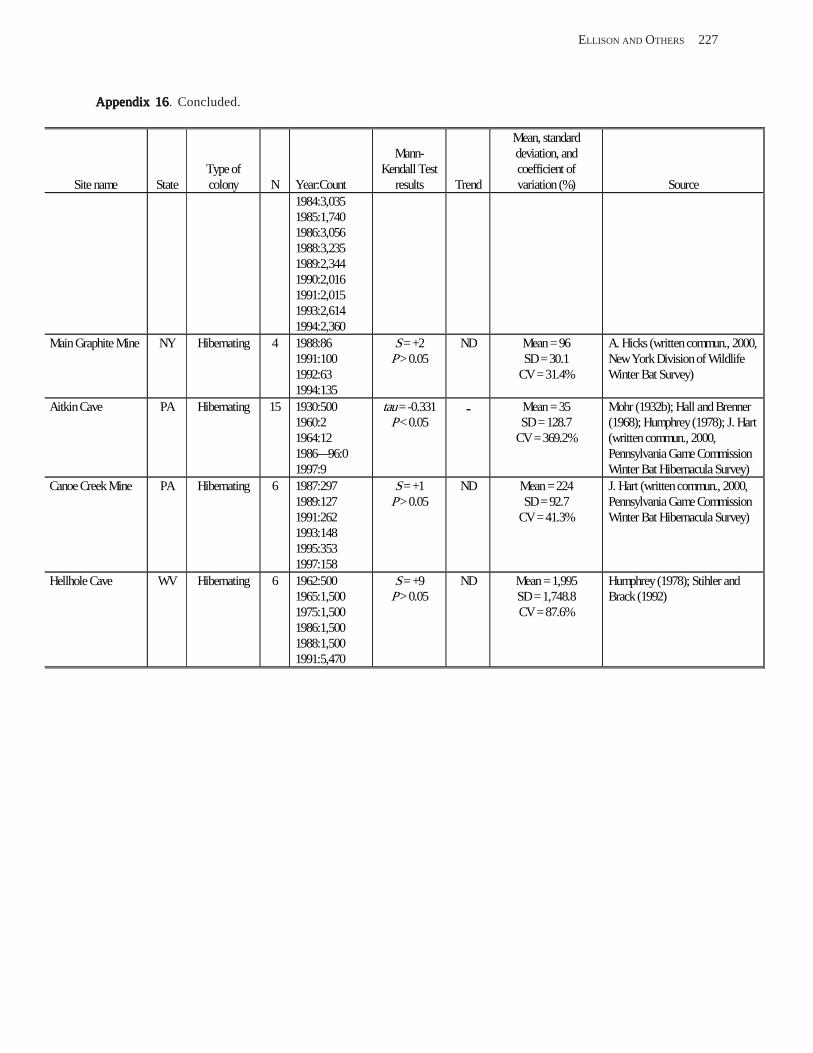
ELLISON AND OTHERS 227
Appendix 16Appendix 16Appendix 16Appendix 16Appendix 16. Concluded.
Mean, standard Mann- deviation, and
Site name State Type of colony N Year:Count
Kendall Test results Trend
coefficient of variation (%) Source
1984:3,035 1985:1,740 1986:3,056 1988:3,235 1989:2,344 1990:2,016 1991:2,015 1993:2,614 1994:2,360
Main Graphite Mine NY Hibernating 4 1988:86 1991:100 1992:63 1994:135
S = +2 P > 0.05
ND Mean = 96 SD = 30.1
CV = 31.4%
A. Hicks (written commun., 2000, NewYork Division of Wildlife Winter Bat Survey)
Aitkin Cave PA Hibernating 15 1930:500 1960:2 1964:12 1986—96:0 1997:9
tau = -0.331 P < 0.05
- Mean = 35 SD = 128.7
CV = 369.2%
Mohr (1932b); Hall and Brenner (1968); Humphrey (1978); J. Hart (written commun., 2000, Pennsylvania Game Commission Winter Bat Hibernacula Survey)
Canoe Creek Mine PA Hibernating 6 1987:297 1989:127 1991:262 1993:148 1995:353 1997:158
S = +1 P > 0.05
ND Mean = 224 SD = 92.7
CV = 41.3%
J. Hart (written commun., 2000, Pennsylvania Game Commission Winter Bat Hibernacula Survey)
Hellhole Cave WV Hibernating 6 1962:500 1965:1,500 1975:1,500 1986:1,500 1988:1,500 1991:5,470
S = +9 P > 0.05
ND Mean = 1,995 SD = 1,748.8 CV = 87.6%
Humphrey (1978); Stihler and Brack (1992)
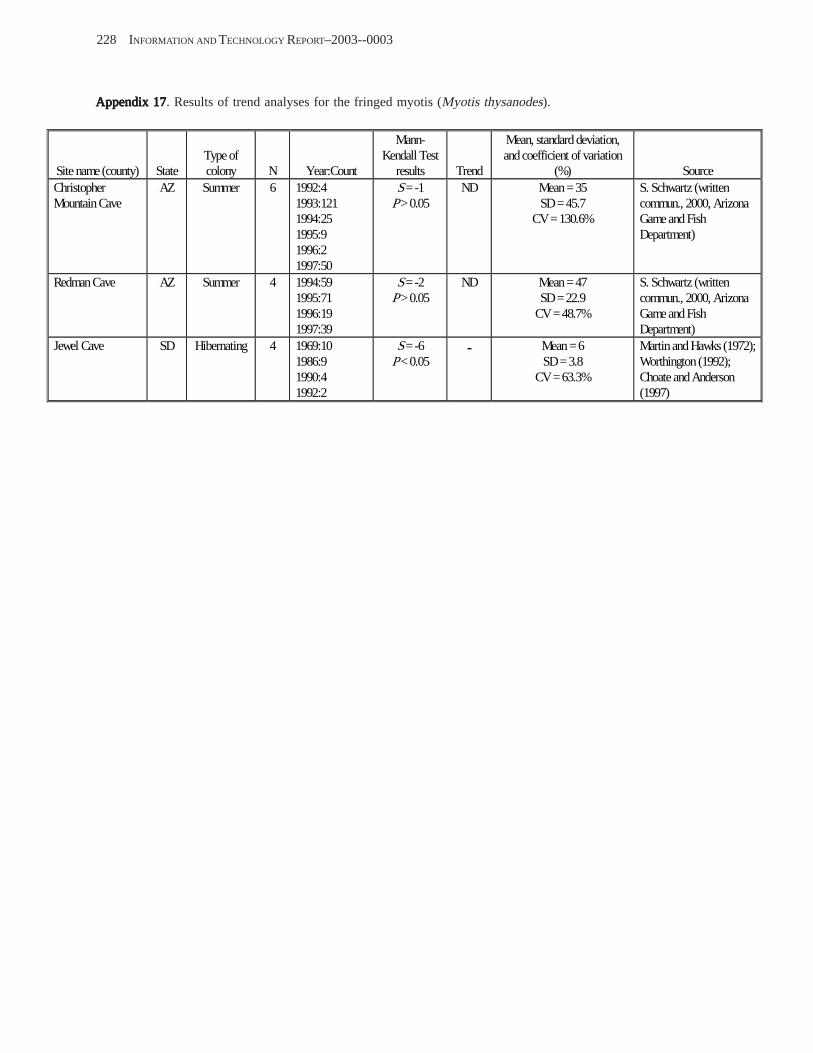
228 INFORMATION AND TECHNOLOGY REPORT–2003--0003
Appendix 17Appendix 17Appendix 17Appendix 17Appendix 17. Results of trend analyses for the fringed myotis (Myotis thysanodes).
Mann- Mean, standard deviation, Type of Kendall Test and coefficient of variation
Site name (county) State colony N Year:Count results Trend (%) Source Christopher Mountain Cave
AZ Summer 6 1992:4 1993:121 1994:25 1995:9 1996:2 1997:50
S = -1 P > 0.05
ND Mean = 35 SD= 45.7
CV= 130.6%
S. Schwartz (written commun., 2000, Arizona Game and Fish Department)
Redman Cave AZ Summer 4 1994:59 1995:71 1996:19 1997:39
S = -2 P > 0.05
ND Mean = 47 SD= 22.9
CV= 48.7%
S. Schwartz (written commun., 2000, Arizona Game and Fish Department)
Jewel Cave SD Hibernating 4 1969:10 1986:9 1990:4 1992:2
S = -6 P < 0.05
- Mean = 6 SD= 3.8
CV= 63.3%
Martin and Hawks (1972); Worthington (1992); Choate and Anderson (1997)
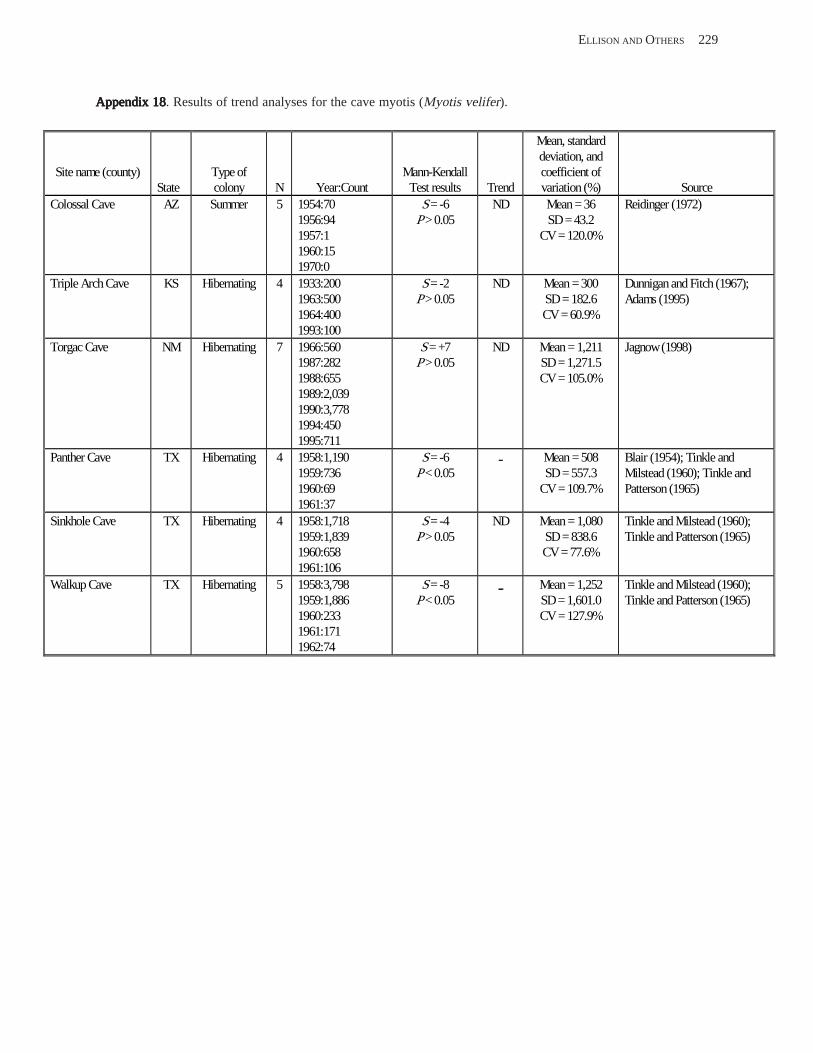
ELLISON AND OTHERS 229
Appendix 18Appendix 18Appendix 18Appendix 18Appendix 18. Results of trend analyses for the cave myotis (Myotis velifer).
Mean, standard deviation, and
Site name (county) State
Type of colony N Year:Count
Mann-Kendall Test results Trend
coefficient of variation (%) Source
Colossal Cave AZ Summer 5 1954:70 1956:94 1957:1 1960:15 1970:0
S = -6 P > 0.05
ND Mean = 36 SD = 43.2
CV = 120.0%
Reidinger (1972)
Triple Arch Cave KS Hibernating 4 1933:200 1963:500 1964:400 1993:100
S = -2 P > 0.05
ND Mean = 300 SD = 182.6 CV = 60.9%
Dunnigan and Fitch (1967); Adams (1995)
Torgac Cave NM Hibernating 7 1966:560 1987:282 1988:655 1989:2,039 1990:3,778 1994:450 1995:711
S = +7 P > 0.05
ND Mean = 1,211 SD = 1,271.5 CV = 105.0%
Jagnow (1998)
Panther Cave TX Hibernating 4 1958:1,190 1959:736 1960:69 1961:37
S = -6 P < 0.05
- Mean = 508 SD = 557.3
CV = 109.7%
Blair (1954); Tinkle and Milstead (1960); Tinkle and Patterson (1965)
Sinkhole Cave TX Hibernating 4 1958:1,718 1959:1,839 1960:658 1961:106
S = -4 P > 0.05
ND Mean = 1,080 SD = 838.6 CV = 77.6%
Tinkle and Milstead (1960); Tinkle and Patterson (1965)
Walkup Cave TX Hibernating 5 1958:3,798 1959:1,886 1960:233 1961:171 1962:74
S = -8 P < 0.05
- Mean = 1,252 SD = 1,601.0 CV = 127.9%
Tinkle and Milstead (1960); Tinkle and Patterson (1965)
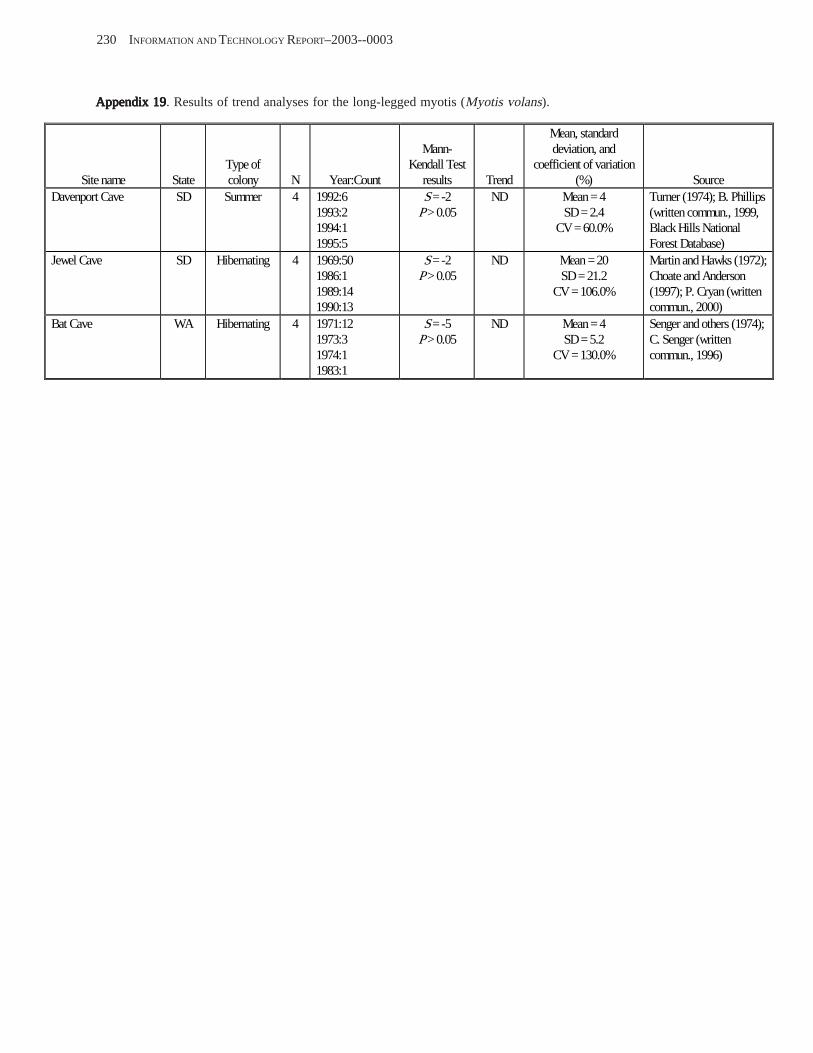
230 INFORMATION AND TECHNOLOGY REPORT–2003--0003
Appendix 19Appendix 19Appendix 19Appendix 19Appendix 19. Results of trend analyses for the long-legged myotis (Myotis volans).
Mean, standard Mann- deviation, and
Site name State Type of colony N Year:Count
Kendall Test results Trend
coefficient of variation (%) Source
Davenport Cave SD Summer 4 1992:6 1993:2 1994:1 1995:5
S = -2 P > 0.05
ND Mean = 4 SD = 2.4
CV= 60.0%
Turner (1974); B. Phillips (written commun., 1999, Black Hills National Forest Database)
Jewel Cave SD Hibernating 4 1969:50 1986:1 1989:14 1990:13
S = -2 P > 0.05
ND Mean = 20 SD = 21.2
CV = 106.0%
Martin and Hawks (1972); Choate and Anderson (1997); P. Cryan (written commun., 2000)
Bat Cave WA Hibernating 4 1971:12 1973:3 1974:1 1983:1
S = -5 P > 0.05
ND Mean = 4 SD = 5.2
CV = 130.0%
Senger and others (1974); C. Senger (written commun., 1996)
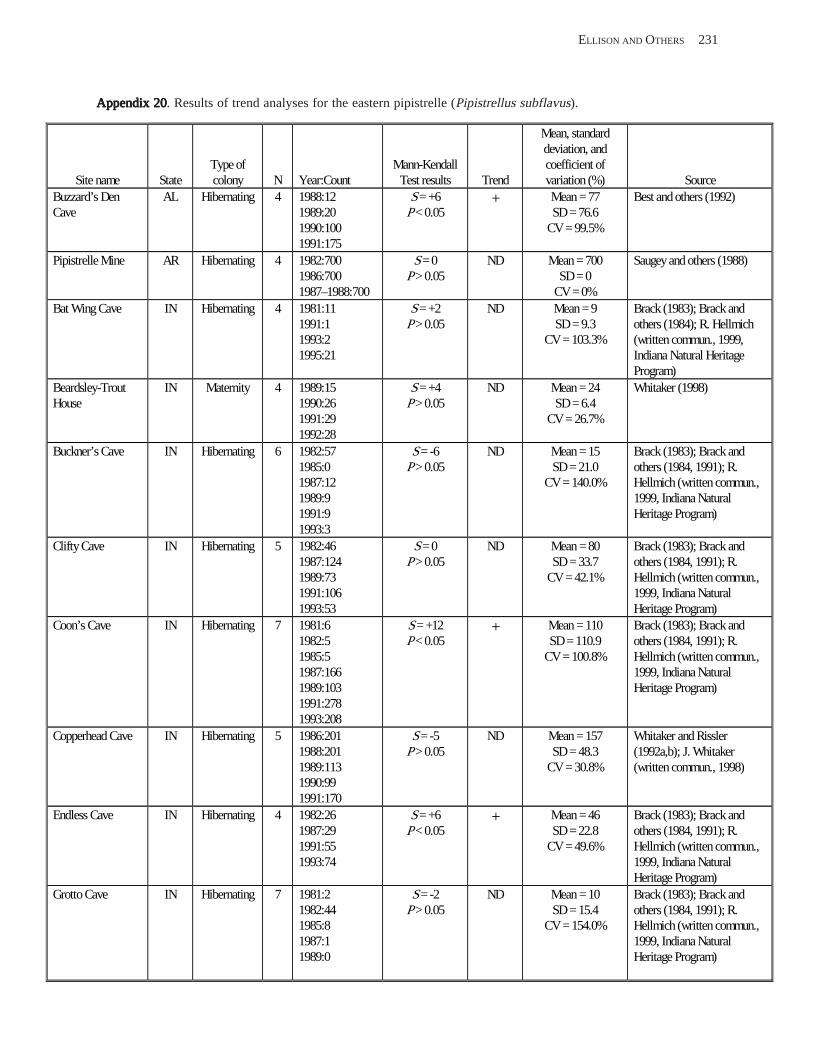
ELLISON AND OTHERS 231
Appendix 20Appendix 20Appendix 20Appendix 20Appendix 20. Results of trend analyses for the eastern pipistrelle (Pipistrellus subflavus).
Mean, standard deviation, and
Site name State Type of colony N Year:Count
Mann-Kendall Test results Trend
coefficient of variation (%) Source
Buzzard’s Den Cave
AL Hibernating 4 1988:12 1989:20 1990:100 1991:175
S = +6 P < 0.05
+ Mean = 77 SD = 76.6
CV = 99.5%
Best and others (1992)
Pipistrelle Mine AR Hibernating 4 1982:700 1986:700 1987–1988:700
S = 0 P > 0.05
ND Mean = 700 SD = 0
CV = 0%
Saugey and others (1988)
Bat Wing Cave IN Hibernating 4 1981:11 1991:1 1993:2 1995:21
S = +2 P > 0.05
ND Mean = 9 SD = 9.3
CV = 103.3%
Brack (1983); Brack and others (1984); R. Hellmich (written commun., 1999, Indiana Natural Heritage Program)
Beardsley-Trout House
IN Maternity 4 1989:15 1990:26 1991:29 1992:28
S = +4 P > 0.05
ND Mean = 24 SD = 6.4
CV = 26.7%
Whitaker (1998)
Buckner’s Cave IN Hibernating 6 1982:57 1985:0 1987:12 1989:9 1991:9 1993:3
S = -6 P > 0.05
ND Mean = 15 SD = 21.0
CV = 140.0%
Brack (1983); Brack and others (1984, 1991); R. Hellmich (written commun., 1999, Indiana Natural Heritage Program)
Clifty Cave IN Hibernating 5 1982:46 1987:124 1989:73 1991:106 1993:53
S = 0 P > 0.05
ND Mean = 80 SD = 33.7
CV = 42.1%
Brack (1983); Brack and others (1984, 1991); R. Hellmich (written commun., 1999, Indiana Natural Heritage Program)
Coon’s Cave IN Hibernating 7 1981:6 1982:5 1985:5 1987:166 1989:103 1991:278 1993:208
S = +12 P < 0.05
+ Mean = 110 SD = 110.9
CV = 100.8%
Brack (1983); Brack and others (1984, 1991); R. Hellmich (written commun., 1999, Indiana Natural Heritage Program)
Copperhead Cave IN Hibernating 5 1986:201 1988:201 1989:113 1990:99 1991:170
S = -5 P > 0.05
ND Mean = 157 SD = 48.3
CV = 30.8%
Whitaker and Rissler (1992a,b); J. Whitaker (written commun., 1998)
Endless Cave IN Hibernating 4 1982:26 1987:29 1991:55 1993:74
S = +6 P < 0.05
+ Mean = 46 SD = 22.8
CV = 49.6%
Brack (1983); Brack and others (1984, 1991); R. Hellmich (written commun., 1999, Indiana Natural Heritage Program)
Grotto Cave IN Hibernating 7 1981:2 1982:44 1985:8 1987:1 1989:0
S = -2 P > 0.05
ND Mean = 10 SD = 15.4
CV = 154.0%
Brack (1983); Brack and others (1984, 1991); R. Hellmich (written commun., 1999, Indiana Natural Heritage Program)
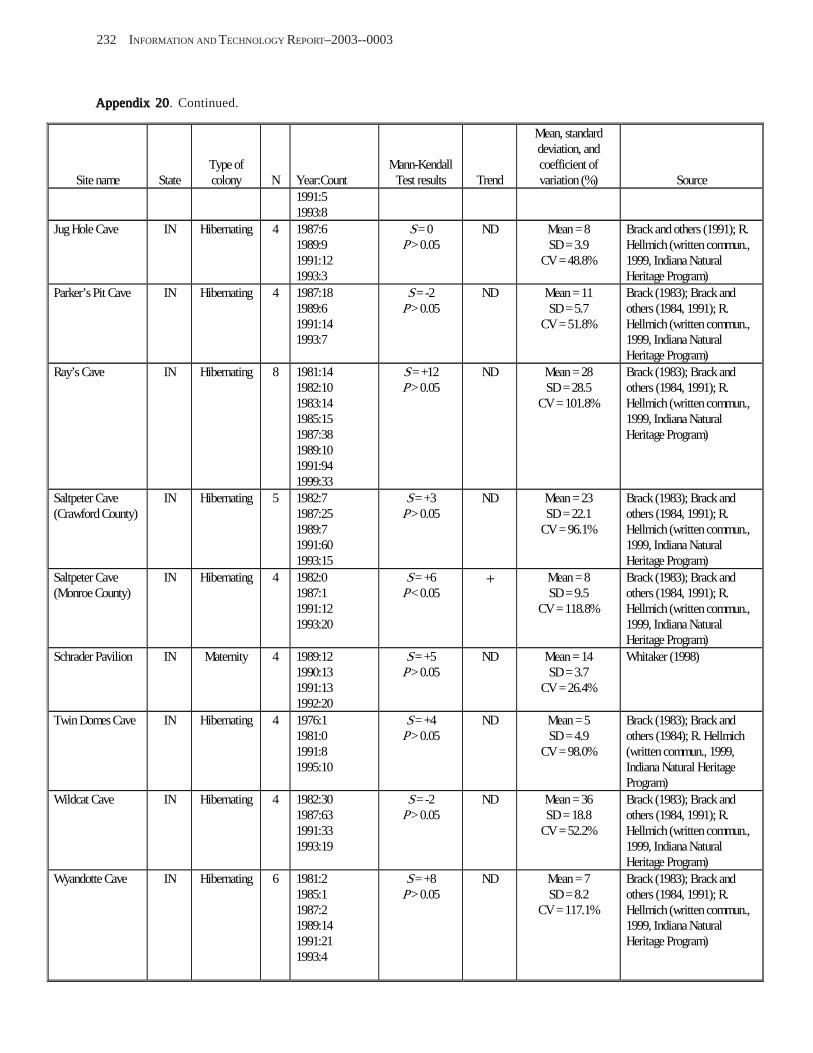
232 INFORMATION AND TECHNOLOGY REPORT–2003--0003
Appendix 20Appendix 20Appendix 20Appendix 20Appendix 20. Continued.
Mean, standard deviation, and
Site name State Type of colony N Year:Count
Mann-Kendall Test results Trend
coefficient of variation (%) Source
1991:5 1993:8
Jug Hole Cave IN Hibernating 4 1987:6 1989:9 1991:12 1993:3
S = 0 P > 0.05
ND Mean = 8 SD = 3.9
CV = 48.8%
Brack and others (1991); R. Hellmich (written commun., 1999, Indiana Natural Heritage Program)
Parker’s Pit Cave IN Hibernating 4 1987:18 1989:6 1991:14 1993:7
S = -2 P > 0.05
ND Mean = 11 SD = 5.7
CV = 51.8%
Brack (1983); Brack and others (1984, 1991); R. Hellmich (written commun., 1999, Indiana Natural Heritage Program)
Ray’s Cave IN Hibernating 8 1981:14 1982:10 1983:14 1985:15 1987:38 1989:10 1991:94 1999:33
S = +12 P > 0.05
ND Mean = 28 SD = 28.5
CV = 101.8%
Brack (1983); Brack and others (1984, 1991); R. Hellmich (written commun., 1999, Indiana Natural Heritage Program)
Saltpeter Cave (Crawford County)
IN Hibernating 5 1982:7 1987:25 1989:7 1991:60 1993:15
S = +3 P > 0.05
ND Mean = 23 SD = 22.1
CV = 96.1%
Brack (1983); Brack and others (1984, 1991); R. Hellmich (written commun., 1999, Indiana Natural Heritage Program)
Saltpeter Cave (Monroe County)
IN Hibernating 4 1982:0 1987:1 1991:12 1993:20
S = +6 P < 0.05
+ Mean = 8 SD = 9.5
CV = 118.8%
Brack (1983); Brack and others (1984, 1991); R. Hellmich (written commun., 1999, Indiana Natural Heritage Program)
Schrader Pavilion IN Maternity 4 1989:12 1990:13 1991:13 1992:20
S = +5 P > 0.05
ND Mean = 14 SD = 3.7
CV = 26.4%
Whitaker (1998)
Twin Domes Cave IN Hibernating 4 1976:1 1981:0 1991:8 1995:10
S = +4 P > 0.05
ND Mean = 5 SD = 4.9
CV = 98.0%
Brack (1983); Brack and others (1984); R. Hellmich (written commun., 1999, Indiana Natural Heritage Program)
Wildcat Cave IN Hibernating 4 1982:30 1987:63 1991:33 1993:19
S = -2 P > 0.05
ND Mean = 36 SD = 18.8
CV = 52.2%
Brack (1983); Brack and others (1984, 1991); R. Hellmich (written commun., 1999, Indiana Natural Heritage Program)
Wyandotte Cave IN Hibernating 6 1981:2 1985:1 1987:2 1989:14 1991:21 1993:4
S = +8 P > 0.05
ND Mean = 7 SD = 8.2
CV = 117.1%
Brack (1983); Brack and others (1984, 1991); R. Hellmich (written commun., 1999, Indiana Natural Heritage Program)
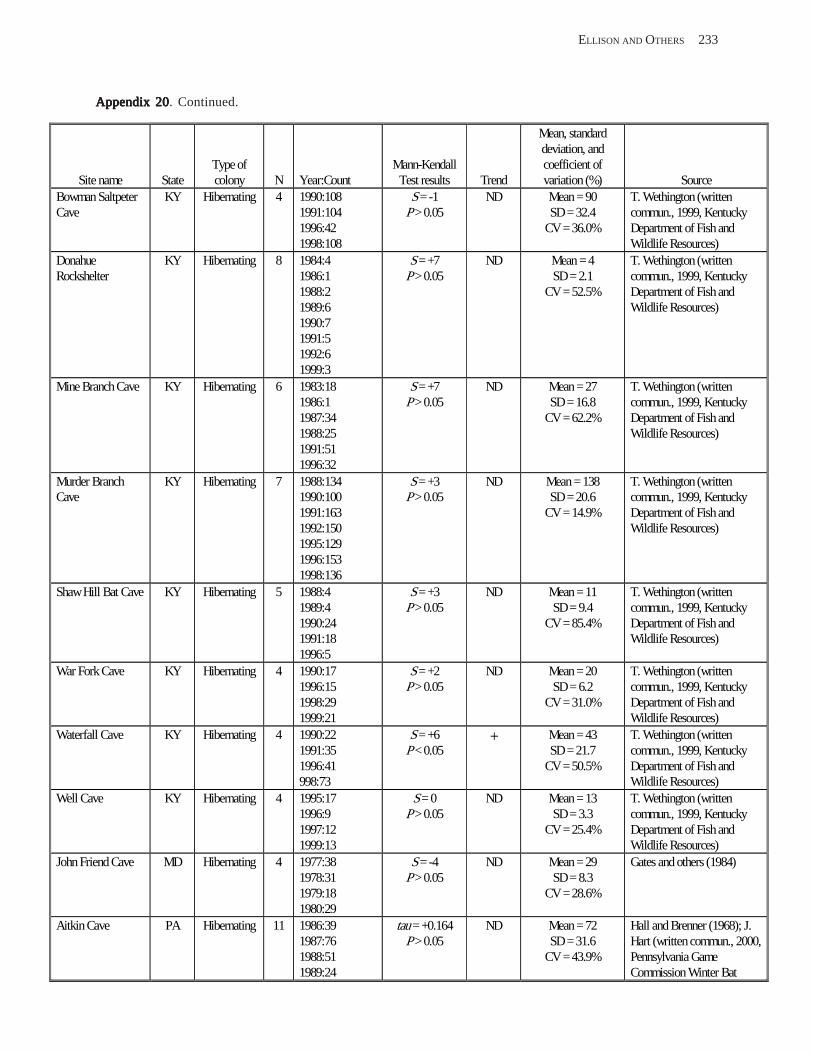
ELLISON AND OTHERS 233
Appendix 20Appendix 20Appendix 20Appendix 20Appendix 20. Continued.
Mean, standard deviation, and
Site name State Type of colony N Year:Count
Mann-Kendall Test results Trend
coefficient of variation (%) Source
Bowman Saltpeter Cave
KY Hibernating 4 1990:108 1991:104 1996:42 1998:108
S = -1 P > 0.05
ND Mean = 90 SD = 32.4
CV = 36.0%
T. Wethington (written commun., 1999, Kentucky Department of Fish and Wildlife Resources)
Donahue Rockshelter
KY Hibernating 8 1984:4 1986:1 1988:2 1989:6 1990:7 1991:5 1992:6 1999:3
S = +7 P > 0.05
ND Mean = 4 SD = 2.1
CV = 52.5%
T. Wethington (written commun., 1999, Kentucky Department of Fish and Wildlife Resources)
Mine Branch Cave KY Hibernating 6 1983:18 1986:1 1987:34 1988:25 1991:51 1996:32
S = +7 P > 0.05
ND Mean = 27 SD = 16.8
CV = 62.2%
T. Wethington (written commun., 1999, Kentucky Department of Fish and Wildlife Resources)
Murder Branch Cave
KY Hibernating 7 1988:134 1990:100 1991:163 1992:150 1995:129 1996:153 1998:136
S = +3 P > 0.05
ND Mean = 138 SD = 20.6
CV = 14.9%
T. Wethington (written commun., 1999, Kentucky Department of Fish and Wildlife Resources)
ShawHill Bat Cave KY Hibernating 5 1988:4 1989:4 1990:24 1991:18 1996:5
S = +3 P > 0.05
ND Mean = 11 SD = 9.4
CV = 85.4%
T. Wethington (written commun., 1999, Kentucky Department of Fish and Wildlife Resources)
War Fork Cave KY Hibernating 4 1990:17 1996:15 1998:29 1999:21
S = +2 P > 0.05
ND Mean = 20 SD = 6.2
CV = 31.0%
T. Wethington (written commun., 1999, Kentucky Department of Fish and Wildlife Resources)
Waterfall Cave KY Hibernating 4 1990:22 1991:35 1996:41 998:73
S = +6 P < 0.05
+ Mean = 43 SD = 21.7
CV = 50.5%
T. Wethington (written commun., 1999, Kentucky Department of Fish and Wildlife Resources)
Well Cave KY Hibernating 4 1995:17 1996:9 1997:12 1999:13
S = 0 P > 0.05
ND Mean = 13 SD = 3.3
CV = 25.4%
T. Wethington (written commun., 1999, Kentucky Department of Fish and Wildlife Resources)
John Friend Cave MD Hibernating 4 1977:38 1978:31 1979:18 1980:29
S = -4 P > 0.05
ND Mean = 29 SD = 8.3
CV = 28.6%
Gates and others (1984)
Aitkin Cave PA Hibernating 11 1986:39 1987:76 1988:51 1989:24
tau = +0.164 P > 0.05
ND Mean = 72 SD = 31.6
CV = 43.9%
Hall and Brenner (1968); J. Hart (written commun., 2000, Pennsylvania Game Commission Winter Bat
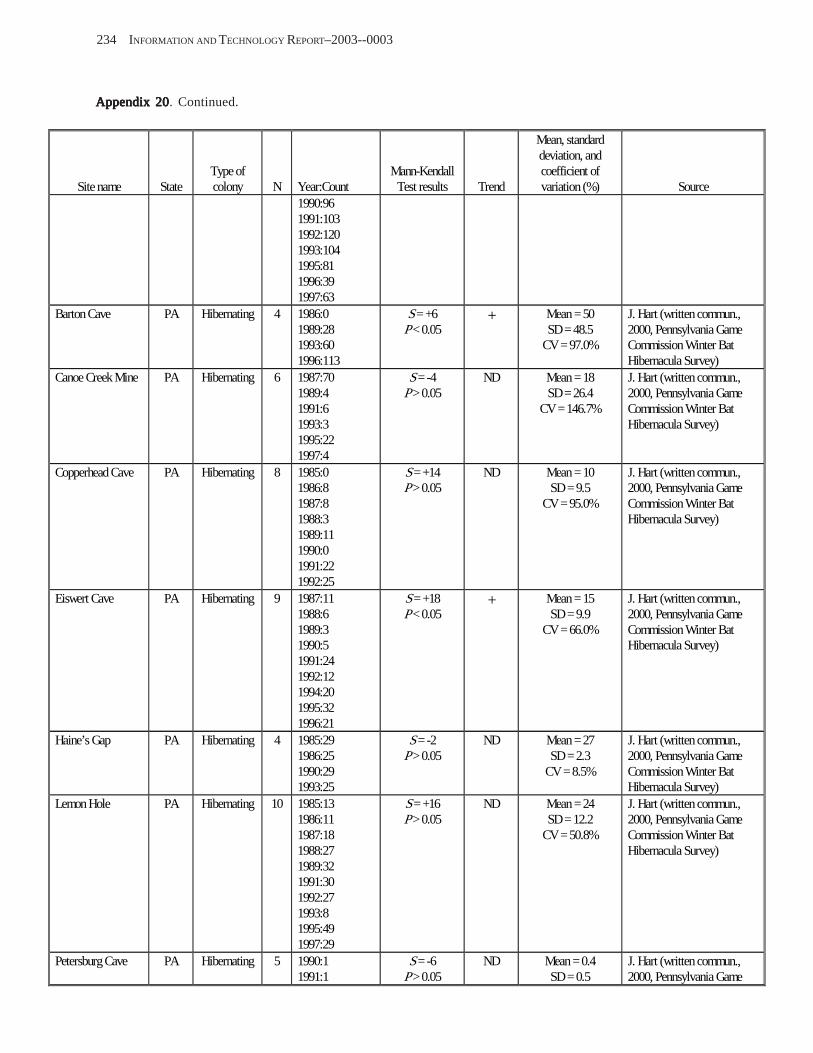
234 INFORMATION AND TECHNOLOGY REPORT–2003--0003
Appendix 20Appendix 20Appendix 20Appendix 20Appendix 20. Continued.
Mean, standard deviation, and
Site name State Type of colony N Year:Count
Mann-Kendall Test results Trend
coefficient of variation (%) Source
1990:96 1991:103 1992:120 1993:104 1995:81 1996:39 1997:63
Barton Cave PA Hibernating 4 1986:0 1989:28 1993:60 1996:113
S = +6 P < 0.05
+ Mean = 50 SD = 48.5
CV = 97.0%
J. Hart (written commun., 2000, Pennsylvania Game Commission Winter Bat Hibernacula Survey)
Canoe Creek Mine PA Hibernating 6 1987:70 1989:4 1991:6 1993:3 1995:22 1997:4
S = -4 P > 0.05
ND Mean = 18 SD = 26.4
CV = 146.7%
J. Hart (written commun., 2000, Pennsylvania Game Commission Winter Bat Hibernacula Survey)
Copperhead Cave PA Hibernating 8 1985:0 1986:8 1987:8 1988:3 1989:11 1990:0 1991:22 1992:25
S = +14 P > 0.05
ND Mean = 10 SD = 9.5
CV = 95.0%
J. Hart (written commun., 2000, Pennsylvania Game Commission Winter Bat Hibernacula Survey)
Eiswert Cave PA Hibernating 9 1987:11 1988:6 1989:3 1990:5 1991:24 1992:12 1994:20 1995:32 1996:21
S = +18 P < 0.05
+ Mean = 15 SD = 9.9
CV = 66.0%
J. Hart (written commun., 2000, Pennsylvania Game Commission Winter Bat Hibernacula Survey)
Haine’s Gap PA Hibernating 4 1985:29 1986:25 1990:29 1993:25
S = -2 P > 0.05
ND Mean = 27 SD = 2.3
CV = 8.5%
J. Hart (written commun., 2000, Pennsylvania Game Commission Winter Bat Hibernacula Survey)
Lemon Hole PA Hibernating 10 1985:13 1986:11 1987:18 1988:27 1989:32 1991:30 1992:27 1993:8 1995:49 1997:29
S = +16 P > 0.05
ND Mean = 24 SD = 12.2
CV = 50.8%
J. Hart (written commun., 2000, Pennsylvania Game Commission Winter Bat Hibernacula Survey)
Petersburg Cave PA Hibernating 5 1990:1 1991:1
S = -6 P > 0.05
ND Mean = 0.4 SD = 0.5
J. Hart (written commun., 2000, Pennsylvania Game
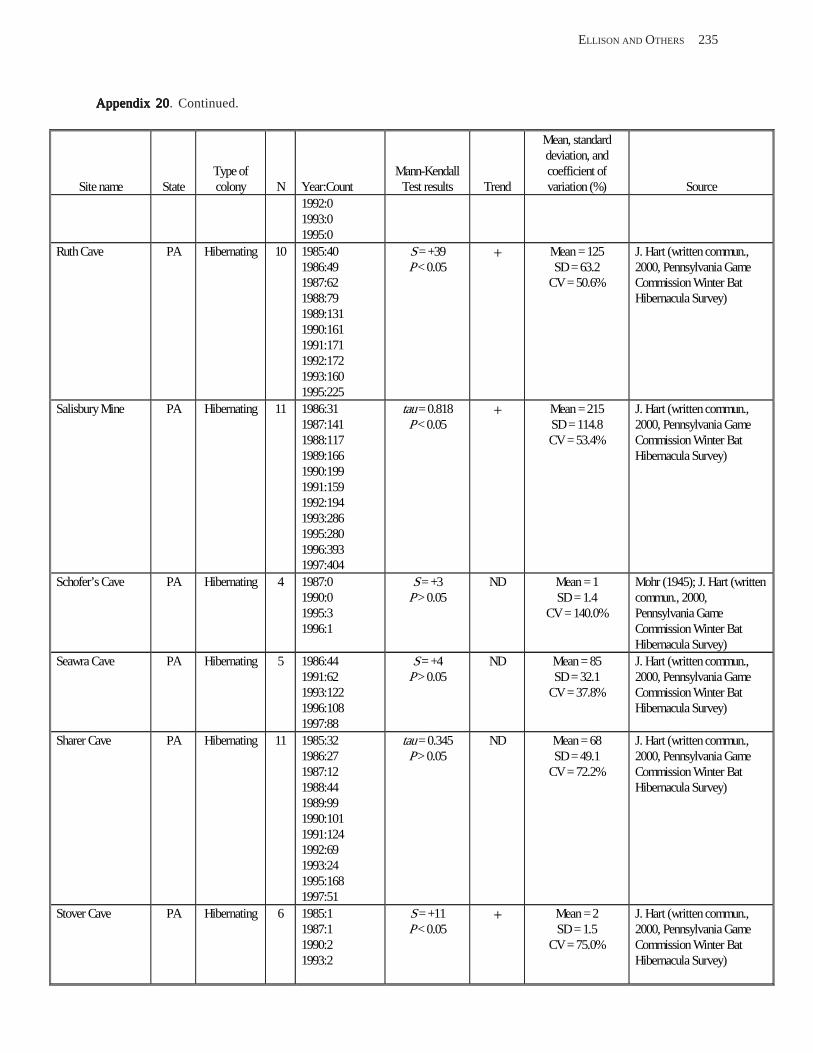
ELLISON AND OTHERS 235
Appendix 20Appendix 20Appendix 20Appendix 20Appendix 20. Continued.
Mean, standard deviation, and
Site name State Type of colony N Year:Count
Mann-Kendall Test results Trend
coefficient of variation (%) Source
1992:0 1993:0 1995:0
Ruth Cave PA Hibernating 10 1985:40 1986:49 1987:62 1988:79 1989:131 1990:161 1991:171 1992:172 1993:160 1995:225
S = +39 P < 0.05
+ Mean = 125 SD = 63.2
CV = 50.6%
J. Hart (written commun., 2000, Pennsylvania Game Commission Winter Bat Hibernacula Survey)
Salisbury Mine PA Hibernating 11 1986:31 1987:141 1988:117 1989:166 1990:199 1991:159 1992:194 1993:286 1995:280 1996:393 1997:404
tau = 0.818 P < 0.05
+ Mean = 215 SD = 114.8 CV = 53.4%
J. Hart (written commun., 2000, Pennsylvania Game Commission Winter Bat Hibernacula Survey)
Schofer’s Cave PA Hibernating 4 1987:0 1990:0 1995:3 1996:1
S = +3 P > 0.05
ND Mean = 1 SD = 1.4
CV = 140.0%
Mohr (1945); J. Hart (written commun., 2000, Pennsylvania Game Commission Winter Bat Hibernacula Survey)
Seawra Cave PA Hibernating 5 1986:44 1991:62 1993:122 1996:108 1997:88
S = +4 P > 0.05
ND Mean = 85 SD = 32.1
CV = 37.8%
J. Hart (written commun., 2000, Pennsylvania Game Commission Winter Bat Hibernacula Survey)
Sharer Cave PA Hibernating 11 1985:32 1986:27 1987:12 1988:44 1989:99 1990:101 1991:124 1992:69 1993:24 1995:168 1997:51
tau = 0.345 P > 0.05
ND Mean = 68 SD = 49.1
CV = 72.2%
J. Hart (written commun., 2000, Pennsylvania Game Commission Winter Bat Hibernacula Survey)
Stover Cave PA Hibernating 6 1985:1 1987:1 1990:2 1993:2
S = +11 P < 0.05
+ Mean = 2 SD = 1.5
CV = 75.0%
J. Hart (written commun., 2000, Pennsylvania Game Commission Winter Bat Hibernacula Survey)
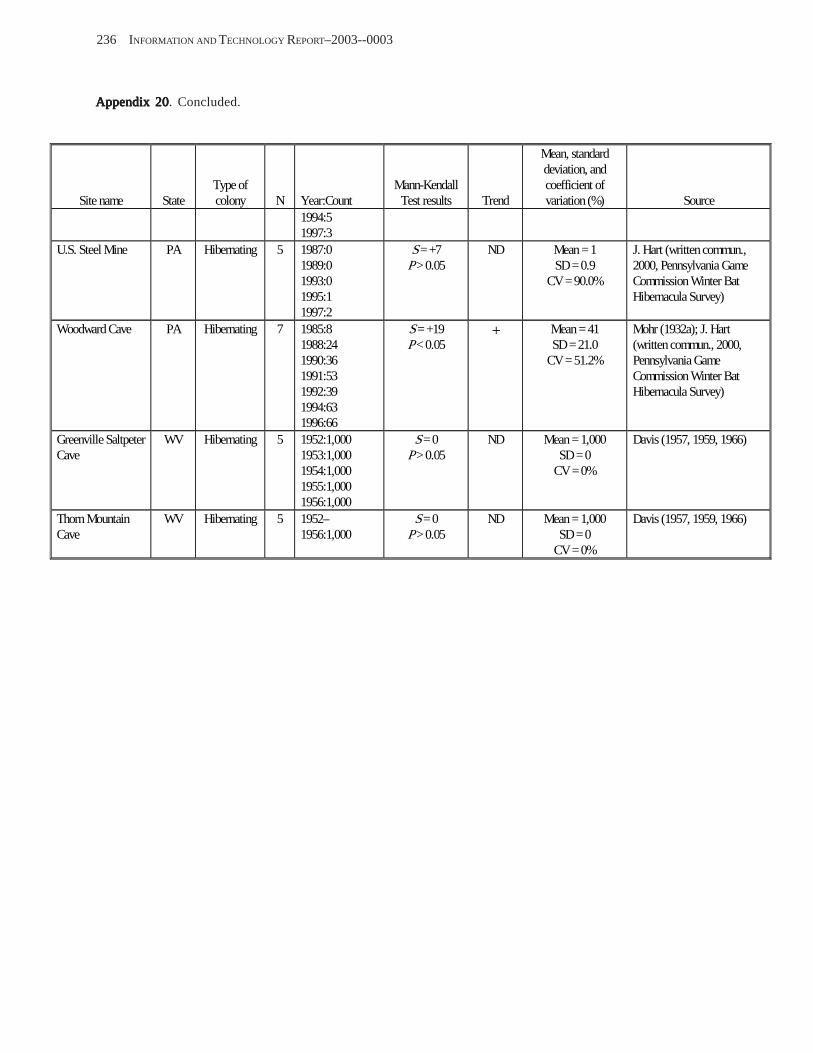
236 INFORMATION AND TECHNOLOGY REPORT–2003--0003
Appendix 20Appendix 20Appendix 20Appendix 20Appendix 20. Concluded.
Mean, standard deviation, and
Site name State Type of colony N Year:Count
Mann-Kendall Test results Trend
coefficient of variation (%) Source
1994:5 1997:3
U.S. Steel Mine PA Hibernating 5 1987:0 1989:0 1993:0 1995:1 1997:2
S = +7 P > 0.05
ND Mean = 1 SD = 0.9
CV = 90.0%
J. Hart (written commun., 2000, Pennsylvania Game Commission Winter Bat Hibernacula Survey)
Woodward Cave PA Hibernating 7 1985:8 1988:24 1990:36 1991:53 1992:39 1994:63 1996:66
S = +19 P < 0.05
+ Mean = 41 SD = 21.0
CV = 51.2%
Mohr (1932a); J. Hart (written commun., 2000, Pennsylvania Game Commission Winter Bat Hibernacula Survey)
Greenville Saltpeter Cave
WV Hibernating 5 1952:1,000 1953:1,000 1954:1,000 1955:1,000 1956:1,000
S = 0 P > 0.05
ND Mean = 1,000 SD = 0
CV = 0%
Davis (1957, 1959, 1966)
Thorn Mountain Cave
WV Hibernating 5 1952– 1956:1,000
S = 0 P > 0.05
ND Mean = 1,000 SD = 0
CV = 0%
Davis (1957, 1959, 1966)
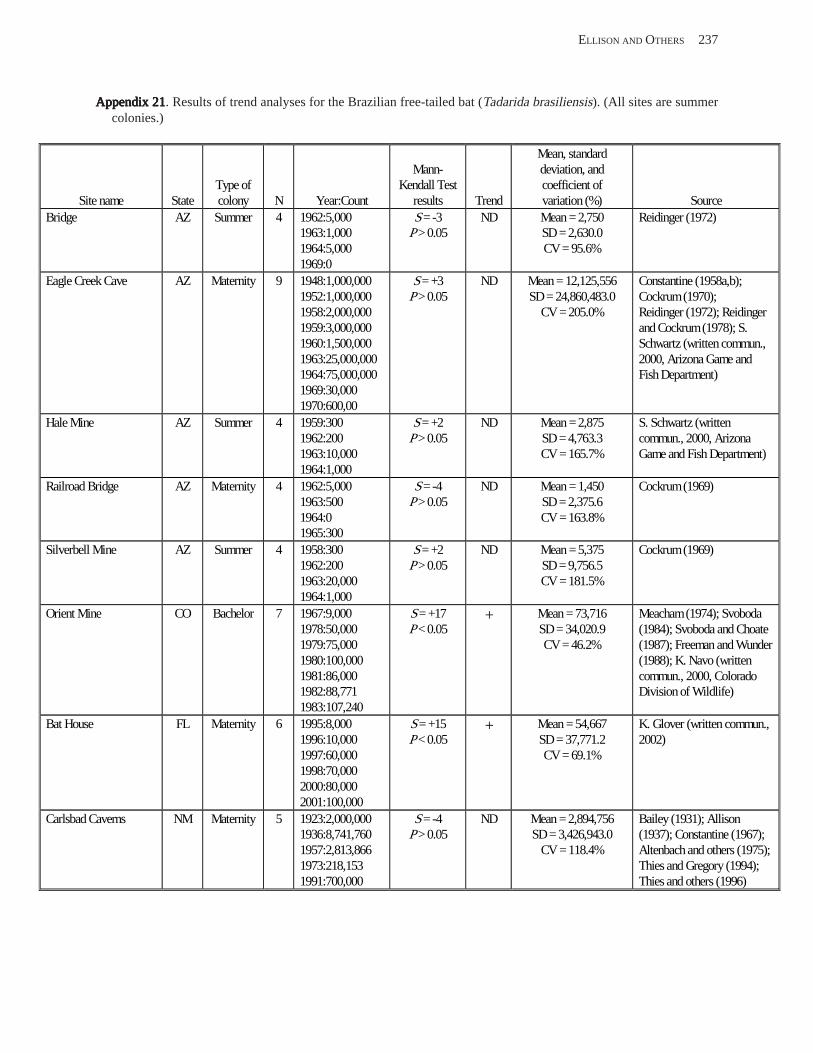
ELLISON AND OTHERS 237
Appendix 21Appendix 21Appendix 21Appendix 21Appendix 21. Results of trend analyses for the Brazilian free-tailed bat (Tadarida brasiliensis). (All sites are summer colonies.)
Mean, standard Mann- deviation, and
Site name State Type of colony N Year:Count
Kendall Test results Trend
coefficient of variation (%) Source
Bridge AZ Summer 4 1962:5,000 1963:1,000 1964:5,000 1969:0
S = -3 P > 0.05
ND Mean = 2,750 SD = 2,630.0 CV = 95.6%
Reidinger (1972)
Eagle Creek Cave AZ Maternity 9 1948:1,000,000 1952:1,000,000 1958:2,000,000 1959:3,000,000 1960:1,500,000 1963:25,000,000 1964:75,000,000 1969:30,000 1970:600,00
S = +3 P > 0.05
ND Mean = 12,125,556 SD = 24,860,483.0
CV = 205.0%
Constantine (1958a,b); Cockrum (1970); Reidinger (1972); Reidinger and Cockrum (1978); S. Schwartz (written commun., 2000, Arizona Game and Fish Department)
Hale Mine AZ Summer 4 1959:300 1962:200 1963:10,000 1964:1,000
S = +2 P > 0.05
ND Mean = 2,875 SD = 4,763.3 CV = 165.7%
S. Schwartz (written commun., 2000, Arizona Game and Fish Department)
Railroad Bridge AZ Maternity 4 1962:5,000 1963:500 1964:0 1965:300
S = -4 P > 0.05
ND Mean = 1,450 SD = 2,375.6 CV = 163.8%
Cockrum (1969)
Silverbell Mine AZ Summer 4 1958:300 1962:200 1963:20,000 1964:1,000
S = +2 P > 0.05
ND Mean = 5,375 SD = 9,756.5 CV = 181.5%
Cockrum (1969)
Orient Mine CO Bachelor 7 1967:9,000 1978:50,000 1979:75,000 1980:100,000 1981:86,000 1982:88,771 1983:107,240
S = +17 P < 0.05
+ Mean = 73,716 SD = 34,020.9 CV = 46.2%
Meacham (1974); Svoboda (1984); Svoboda and Choate (1987); Freeman and Wunder (1988); K. Navo (written commun., 2000, Colorado Division of Wildlife)
Bat House FL Maternity 6 1995:8,000 1996:10,000 1997:60,000 1998:70,000 2000:80,000 2001:100,000
S = +15 P < 0.05
+ Mean = 54,667 SD = 37,771.2 CV = 69.1%
K. Glover (written commun., 2002)
Carlsbad Caverns NM Maternity 5 1923:2,000,000 1936:8,741,760 1957:2,813,866 1973:218,153 1991:700,000
S = -4 P > 0.05
ND Mean = 2,894,756 SD = 3,426,943.0
CV = 118.4%
Bailey (1931); Allison (1937); Constantine (1967); Altenbach and others (1975); Thies and Gregory (1994); Thies and others (1996)


Part II.Part II.Part II.Part II.Part II. Report of theReport of theReport of theReport of theReport of the WWWWWorkshoporkshoporkshoporkshoporkshop
240 INFORMATION AND TECHNOLOGY REPORT–2003--0003
WWWWWorkshop Formatorkshop Formatorkshop Formatorkshop Formatorkshop Format
Prior to the workshop, participants submitted lists of important unresolved issues pertinent to monitoring bat populations in the United States (U.S.) and territories. Three main topic areas were defined and the issues listed within these topic areas. Participants also ranked their preferences for joining Working Groups corresponding to these topic areas. The topic areas were:
A. Analytical and methodological problems in assessing bat numbers and trends, their basis, and needed research and improvements in techniques
B. Categorizing U.S. bat species or species groups, and regions in terms of priorities for establishing population-trend monitoring programs based on conservation concerns, roosting habits, distributions, threats, and other factors
C. Existing information and programs to monitor bat population trends: utility and coverage of current efforts, and potential expansion in scale
At Estes Park each of the main Working Groups (A– C) met following the presentations, a panel discussion, and a seminar on capture-recapture models. The groups identified specific issues to discuss in greater detail, and subsequently developed recommendations and written statements on these issues. The issue statements were intended to provide: a succinct definition of the issue; a short description of what is known about the issue and what critical uncertainties surround the issue; and recommendations on how research, monitoring, or programmatic frameworks might best be designed to resolve these uncertainties. (Critical uncertainties were considered to be the facts, scientifically reliable data, research approaches, or programmatic means that need to be established in order to resolve specific issues related to monitoring bat populations in the U.S. and territories.)
Participants were encouraged to follow a format in Working Group reports that included the following sections: Issue Title, Issue Description and Rationale, Means to Resolve the Critical Uncertainties Surrounding the Issue, and Suggestions Regarding Existing Monitoring and Research Programs. The “Issue Description and Rationale” section explains why the issue is important, what is generally known about the issue, what in general needs to be determined to resolve the critical uncertainties surrounding the issue, and what the consequences will be if the issue is not addressed (e.g., how it will delay progress in science and policy, what the implications are for bat populations in the U.S. and territories). The section “Means to Resolve the Critical
Uncertainties Surrounding the Issue” recommends the kinds of observations, studies, experiments, or monitoring programs that are needed. The strengths, weaknesses, and feasibility of various approaches are identified as appropriate. A final section “Suggestions Regarding Existing Monitoring and Research Programs” is included when appropriate. This section provides recommendations for improvements to ongoing efforts that attempt to address the issue of monitoring U.S. bat populations. (Not all issue statements follow this format, depending on the judgment of the participants at the time the statements were initially developed.) Literature citations are combined in a single reference list after the Working Group C report. In the weeks following the workshop, drafts of the written statements were circulated among all workshop participants for final review and comment prior to posting on the worldwide web as an interim report.
Principal Conclusions andPrincipal Conclusions andPrincipal Conclusions andPrincipal Conclusions andPrincipal Conclusions and RecommendationsRecommendationsRecommendationsRecommendationsRecommendations
A number of conclusions and recommendations regarding monitoring of U.S. bat populations emerged at the workshop as a result of the presentations, panel discussions, and Working Group reports. In this section, the editors have attempted to highlight major aspects of these findings under five general headings. Greater detail on these topics is found in each Working Group report. This summary was circulated to each workshop participant for review and comment with the draft interim report. Conclusions and recommendations are not listed in any order of priority, because the workshop participants did not attempt to rank every issue considered. In general, the focus and objectives of this workshop (see above) emphasized providing general overviews of the state of the science in monitoring U.S. bat populations and stressed identification of critical gaps and important directions for future research and monitoring. Excellent descriptions of techniques currently employed widely in the study of bat populations are available in the volumes edited by Kunz (1988) and Wilson and others (1996).
The Natural History of Bats Poses Many Challenges to Population Monitoring
Bats pose many logistic challenges to population monitoring. They are a very heterogeneous group of mammals in terms of natural history and require the application of multiple approaches to monitoring. Some species are essentially solitary and roost cryptically in foliage, whereas others aggregate in the millions at
predictable locations. Many others occur in a range of intermediate situations. Bats are highly mobile, almost all are nocturnal, and they generally roost in inaccessible or concealed situations. Their annual cycles can include seasonal long-distance migrations, and some species form colonies of different size, sex and age compositions at different times of the year. They are also very susceptible to disturbance, which can reduce survival (particularly in hibernation). Some colonies switch roost locations every few days or less during warm months, and basic natural history, distribution, roosting preferences and colony locations are poorly known for many species.
Despite these problems, the Working Group reports provide a number of recommendations aimed at improving monitoring of populations of bats in four specific categories: colonial species; over-dispersed species (i.e., foliage-, cavity-, and crevice-roosting bats); Pacific Island fruit bats; and southwestern pollinators. Monitoring of colonial species can be improved by timing surveys to coincide with periods in the annual cycle when colony size is most stable and at a seasonal peak, as for example, conducting exit counts at maternity colonies during the week prior to parturition. Guidelines for making such exit counts are provided, including using multiple observers to assess observer variation, and using standard forms for recording data and ancillary information. Bats that roost in foliage, tree cavities, and rock crevices tend to roost in low densities or solitarily, and present additional monitoring challenges. Current estimates of relative abundance of over-dispersed species come primarily from mist net and echolocation detector index measures. However, these methods have no means for estimating detectability and thus provide data of limited value for assessing abundance. Surmounting problems in estimating numbers of these bats will require improvements in methodology. The three species of Pacific Island fruit bats pose very difficult challenges to population monitoring because of patterns of dispersion, rarity, and inaccessibility. The most pressing need for monitoring populations of these fruit bats is to improve methods of estimating detectability. This might best be developed by improving abilities to capture, mark, and resight these bats. Developing artificial lures through use of sound, scent, or food-based baits and experimenting with means of inducing self-marking merits exploration, as does using controlled hunts of fruit bats to recover marked individuals [other than those protected by the U.S. Endangered Species Act (ESA)]. In the interim, current methods should be continued, standardized, and include measures of logical covariates to abundance. Current monitoring of southwestern pollinators should also be continued, as methods under use are likely to reveal major trends or catastrophic changes. However, techniques for monitoring pollinators should
PART II 241
be standardized and improved with infrared videotaping and use of additional observers.
Major Improvements Are Needed in Methods of Estimating Numbers of Bats
With the possible exception of certain small colonies in which individual bats can be completely counted, attempts to estimate bat population trends in the U.S. and territories have relied heavily on the use of indices at local sites. The use of indices to estimate population size and trends in animals in general is inferior to more statistically defensible methods and can lead to incorrect inferences. New techniques must be explored and modern statistical designs applied in order to improve the scientific basis for conclusions about future bat population trends. Although the bat research community should strive to improve scientific methods of population estimation for future applications, we agree that changes in bat abundance documented by less direct methods, when accompanied by clear-cut causes, have provided strong evidence of past declines. Bat conservation efforts are well founded, and current monitoring approaches, although providing scientifically less rigorous information than desirable, have some merit for conservation if applied cautiously and conservatively. However, shortcomings of current methods must be fully acknowledged. The use of indices has serious flaws because most indices, including those using echolocation detectors, are affected by a host of variables other than actual trends in bat populations. These include environmental variables, observer variables, and variables related to the bats themselves, all of which can affect counts by altering detection probabilities in complex and largely unknown ways. Furthermore, these variables may also change with time, obscuring the ability to assess and understand the true trends in bat populations. Developing uniform standards for collecting index data can be useful, but aspects of many important variables affecting detection probabilities are unknown and cannot be standardized. This weakens the reliability of index values even when controllable factors are accounted for using standardized approaches.
New research is needed to develop means to replace currently used indices, particularly if bat population monitoring objectives include detecting declines before they become catastrophic. The Working Group reports provide a number of recommendations for improving techniques for estimating population trend and population parameters (e.g., survival, reproduction, dispersal, and movements). These include recommendations to assess the feasibility of applying
242 INFORMATION AND TECHNOLOGY REPORT–2003--0003
new theory in mark-recapture statistics to sampling designs, to develop new marking and resighting technology [such as Passive Integrated Transponder (PIT) tags and microtaggants], to incorporate double-sampling techniques and other means to calibrate indices, and to introduce replication and multiple observers in order to incorporate estimates of variance in exit counts or other counting situations. Developing applications of new technical equipment to assist in estimating numbers is also recommended. Such equipment may include video cameras with low light recording capability, infrared video cameras (reflectance-based imagery), computer methods for counting bats in these images, infrared cameras, and other remote sensing techniques. Attempts to use infrared or other new technology and multiple observers to calibrate indices based on detection of echolocation calls should be explored for estimating abundance of over-dispersed bats.
Objectives and Priorities of Bat Population Monitoring Need Careful Consideration
Model species for population monitoring programs should be carefully selected based on specified objectives and relevant spatial scales. Monitoring should be carried out using proven methodology that provides reliable information on population trends. Poorly designed or flawed monitoring programs could lead to unreliable results at the cost of disturbance or other potential harm to bat survival. Priority setting should consider species distributions, feeding strategies, roosting habits, population status, threats to the species, and feasibility of obtaining reliable data. Species with specialized roosting requirements and very limited numbers of suitable roosts are of high importance for monitoring for conservation of biodiversity. Species with feeding strategies of great economic or ecosystem importance may also be of high priority for monitoring. Although most monitoring has been limited to bats that are legally classified as endangered, monitoring programs may better benefit unlisted species by providing data needed to prevent such taxa from becoming listed in the future. Species with localized distributions may be more amenable and important for monitoring than species that occur across the continent, particularly considering sampling logistics, likely smaller population sizes, and greater ability of managers to recognize specific human activities with potential to impact populations. Conversely, a monitoring program for species that roost in moderate-to-large colonies may be quite successful because of the relative ease in detecting such roosts and the fewer sites that need to be monitored.
Monitoring Bat Populations on a Broad Scale Will Require Strong Commitment and Well-
Planned Sampling Designs
Changes in bat populations have ramifications for agricultural and forestry segments of the U.S. economy, ecosystem function, and conservation of national biological diversity. There is a need for status information on a wide range of U.S. species, and bat population monitoring programs on a national or other broad scale are clearly desirable. However, there is no unifying mandate or legislative foundation for a national bat conservation program. Bats in the U.S. cross international and state boundaries, and models for bat conservation exist in international agreements in Europe (Agreement on the Conservation of Bats in Europe, London, 1991), and in protective national legislation for other species in the U.S. (the Migratory Bird Treaty Act, and the Marine Mammal Protection Act). As in these other examples, population monitoring should be an important component of such mandates. Firmer foundations for bat conservation and monitoring are needed, including heightening public support through efforts such as a National Bat Awareness Week. Any resulting expansion in population monitoring efforts, however, must recognize the need for application of the most appropriate statistical sampling and hypothesis-testing approaches in order to provide scientifically meaningful results. This will require research on basic ecology and life history of some species of bats, breakthroughs in developing detectability functions for population estimation, and development of appropriate spatial sampling frames.
Information Exchange Among Bat Specialists Should be Enhanced
Existing efforts to monitor bat populations are not well linked. Methods and protocols may lack comparability, and the information gathered may not be used as effectively as possible in signaling the extent and magnitude of bat population problems needing conservation attention. A web-based clearinghouse should be developed to enhance information exchange about bat population monitoring. A voluntary clearinghouse could provide useful information directly, and also provide electronic links to existing sites maintained by others. As examples, information or links could include a directory of organizations and individuals, descriptions of sampling protocols, a simple metadata description of ongoing studies, a bibliography, the bat
population database under development by the U.S. Geological Survey, and echolocation call libraries. Given the potential value of renewed efforts at marking bats for population studies, a web-based clearinghouse that includes information on bat marking techniques, statistical approaches to marked animal sampling designs and data analysis, pertinent bibliographic references, directories of individuals and organizations marking bats, and metadata on tagging projects would also be of value.
WWWWWorking Grouporking Grouporking Grouporking Grouporking Group A.A.A.A.A. AnalyticalAnalyticalAnalyticalAnalyticalAnalytical and Methodological Problems inand Methodological Problems inand Methodological Problems inand Methodological Problems inand Methodological Problems in
Assessing Bat Numbers andAssessing Bat Numbers andAssessing Bat Numbers andAssessing Bat Numbers andAssessing Bat Numbers and TTTTTrends,rends,rends,rends,rends, Their Basis, and NeededTheir Basis, and NeededTheir Basis, and NeededTheir Basis, and NeededTheir Basis, and Needed
Research and ImprovementsResearch and ImprovementsResearch and ImprovementsResearch and ImprovementsResearch and Improvements ininininin TTTTTechniquesechniquesechniquesechniquesechniques
Working Group Members: Bob Berry, Mike Bogan, Anne Brooke, Tim Carter, Paul Cryan, Virginia Dalton, Ted Fleming, Jeff Gore, Michael Herder, John Hayes (Leader), Tom Kunz, Gary McCracken, Rodrigo Medellin, Alex Menzel, Mike Rabe (Rapporteur), Paul Racey, Ruth Utzurrum, Allyson Walsh, Gary Wiles, and Don Wilson
This Working Group divided into four subgroups to deal with the numerous issues under consideration. The four subgroup topics were: colonial bat species, over-dispersed bats, Pacific Island fruit bats, and southwestern pollinators. In addition, many of the issues that were considered by this group were directly related to topics that emerged from the panel discussion and a seminar on mark-recapture statistical procedures. This report also provides a summary of pertinent aspects of the panel discussion and seminar as a background to the subgroup reports, and a brief discussion of definitions and general monitoring requirements before presenting subgroup findings.
Panel DiscussionPanel DiscussionPanel DiscussionPanel DiscussionPanel Discussion
The Working Group acknowledged that the Monday afternoon Panel Discussion was directly relevant to the charge of the group. Panel members were: Don Wilson, moderator; David Anderson; Kenneth Burnham; Thomas Kunz; John Sauer; Allyson Walsh; and Gary C. White. Summarizing the entire discussion is beyond the scope of this report as there were many issues raised by participants and panel members. However, much of the discussion centered on the statistical reliability of current
PART II 243
bat research and monitoring programs. In that regard, two exchanges, paraphrased below, were deemed especially relevant although unanimity of opinion on these issues varied.
Question I: A considerable amount of historical data on bat populations is available. Are these data useful or do we need to establish new monitoring designs?
Response: Most historical data are indices of population parameters and not direct measures of the parameters of interest. For example, mist net captures are indices of abundance, but do not measure abundance directly. An index is a convolution of several things, and we are almost always unable to determine what the index means in terms of the parameter. An index is a combination of: (1) true abundance (this is what we are typically interested in); (2) observer effect; (3) environmental effects; and (4) animal behavior cues, i.e., cues that cause us to detect (or catch) one animal and not another. The last three effects interfere with our ability to provide the most scientifically defensible population estimates. By using an index, we assume that there is a direct, linear relationship between our index and the parameter of interest (e.g., population size). With an index, we assume that this relationship is invariant over time (which is not reasonable) and thus our index provides some kind of “relative abundance” information. Such indices may only be “numbers” rather than data that lend themselves to good science; we should not be using indices when other methods are available. We need to strive to upgrade to more robust techniques than are currently being used to monitor bat abundance.
Question II: It seems as if “robust techniques” are currently not applicable to monitoring studies of most, if not all, bats. Does this mean we shouldn’t even try to monitor bats?
Response: It may be necessary to shrink our current goals, and be careful to limit studies to those where we can be sure of collecting meaningful data. Clearly some species and problems may be beyond our reach at this time. However, there are new technologies that we should explore. It might be useful to start with the easier problems and species and build to the more complex problems and problematic species as we grow accustomed to new methods. For example, PIT tags and readers may offer alternative ways to mark bats. These marks allow unique identification of individuals. It may be possible to deploy an array of antennae on a number of portals (e.g., a bat gate) and it might then be possible to identify individual bats as they enter and exit the gate. These technologies are expensive now, but the price is likely to decrease in the future.
244 INFORMATION AND TECHNOLOGY REPORT–2003--0003
SeminarSeminarSeminarSeminarSeminar
The Working Group’s activities on Tuesday morning began with a seminar on capture-recapture methodology given by David Anderson, Ken Burnham, and Gary White. Highlights of that seminar are presented here. Currently available capture-recapture models are far more powerful than the simple Lincoln-Petersen index more familiar to bat researchers. The purpose of this presentation was to point out some of the strengths and flexibility of modern capture-recapture methods. These provide true population parameter estimation techniques.
The term capture-recapture can be misleading. Programs NOREMARK and MARK (written and maintained by Gary White and available at http:// www.cnr.colostate.edu/~gwhite/ without cost) include a number of models for examining these types of studies. Mark-resight approaches (where marked animals are resighted or re-detected rather than recaptured) are equivalent from a statistical point of view, as long as certain assumptions can be met:
(1) marked and unmarked animals have the same resighting probability;
(2) researchers must be able to correctly distinguish marked from unmarked animals; and
(3) depending on the statistical estimator, the researcher must be able to correctly identify individual marked animals.
The power of these methods is that they not only allow the researcher to enumerate populations with known precision, but they also enable the estimation of other population parameters. Depending on the particular model selected, these parameters include: differential mortality among individuals, differential mortality between sex and age classes, and differential detection probability among individual animals. All these are important attributes that we can and should attempt to estimate for bats.
If we can incorporate radio-tagged animals into the design, we can estimate how many animals are available for resighting. The addition of radio-tagged animals then provides a solution to the immigration- emigration problem. A typical field scenario would include the following steps: (1) mark animals; (2) resight population and distinguish marked from unmarked individuals; and (3) conduct multiple resightings.
An important point regarding marking and resighting is that the method used to capture animals and mark them should be different than the method used to resight them. With trap-shy animals, captured individuals will avoid being resighted if the same method is used. For example, if mist nets are used to capture bats and attach marks, mist nets are not appropriate for resighting animals
because previously caught animals will avoid nets and violate the assumptions of the model. Similarly, if bats are marked at a roost, the roost may not be the appropriate location for resightings.
Multi-strata models provide extensions of the above and allow the estimation of parameters at several locations as well as the interactions between the locations (for examples, see Hestbeck and others, 1991; Brownie and others, 1993). Multi-strata models also allow the incorporation of environmental covariates (e.g., temperature). If we consider strata to be separate roost locations in proximity to each other, then these models may be especially useful for bat populations where roost switching occurs and roost environments differ. These models allow independent estimates of survival and other parameters. We can also use multi-strata models to estimate probabilities of detection within each of the strata as well as the probabilities of detection for individuals in transition among strata. It seems reasonable to think that different bat colony locations might have different survival rates and detection probabilities. Multi-strata models may allow us to estimate important population parameters in these types of complex systems.
Following the presentation, there were a number of questions and statements from those attending regarding capture-recapture techniques and programs NOREMARK and MARK. Some of the more relevant questions and responses are paraphrased here; they are not direct quotes.
Question (Kunz): Can we use these methods to separate dispersal from mortality? In bats, we often do not know whether a marked bat has emigrated or died.
Response (White): A robust design model (a specific model of program MARK) can separate these two events. In order to do so however, the model requires population closure. To achieve this, short mark-resight times are necessary.
Question (Kunz): We have seen several models that were derived for use in other taxa (such as deer and elk). Do the unique life histories of bats suggest that other models could be specifically developed for them?
Response (White): Yes. New capture-recapture models are under development now. There is a list-server for program MARK and we give workshops every summer in June. We also teach a graduate-level course at Colorado State University for those who really want to understand capture-recapture models. Clearly not all of the data that are typically collected for bats will be useful for these models. However, some overlap between the data collected for bats and the data useful for parameter estimation does exist.
Question (Hayes): How can these techniques be applied to larger scales than single locations?
Response (White): This is mostly a sampling issue. First, select the sampling frame you are interested in (the
particular part of the landscape) and then select random samples (of roost sites) from within that frame.
Question (Kunz and Hayes): How precise do these estimates have to be? I expect we would obtain some pretty imprecise estimates from bats. What precision would be needed for long-term monitoring tools?
Response (Burnham): If the goal was to be able to detect a 5% change in a population over a 10-year period, the estimates would not have to be as precise as you might think. A SE of 20% of the mean measured over a 10year period would probably be able to show that degree of population change.
Question (Tuttle): We don’t know the long-term effects of PIT tags on bats. We need to test these effects before we embark on any massive pit-tagging projects.
Response (Kunz): I have used PIT tags in 7.1 g Myotis lucifugus without noticing any ill effects. The tags only weigh about 0.1 g and I have even injected them into pups with no problems so far (3 years). There is a small amount of migration of the tags from the injection site, but not much.
Definitions and MonitoringDefinitions and MonitoringDefinitions and MonitoringDefinitions and MonitoringDefinitions and Monitoring RequirementsRequirementsRequirementsRequirementsRequirements
The Working Group agreed to use standard definitions for “colony” and “population” during subsequent discussions to avoid ambiguity and clearly define sampling units. These definitions are:
Colony: A stable group of single species, which occupy a definable boundary at a particular time interval where population parameters can be defined.
Population: A group of individuals of the same species living in a particular area at a particular time.
Additionally, we agreed that objectives for any monitoring activity should include: (1) the estimation of population parameters through time that are adequate to detect trends significant to the long-term persistence of the species, subspecies, or population unit; and (2) monitoring should be able to determine changes in species distributions or population numbers.
In any bat monitoring plan, efforts should be made first to census the population (completely enumerate the population), and if that is not possible, estimate the population numbers using a robust, defensible technique. If neither a census nor an estimate is possible, an index to population size may have to be developed.
Recognizing that bats are a diverse group of organisms and that there are no overall solutions to the unique problems some groups present for population monitoring, the group divided into four smaller subgroups. These subgroups were comprised of members with particular expertise or interest in the bat categories
PART II 245
they considered. David Anderson, Gary White, John Sauer, or Ken Burnham assisted all groups in their deliberations. The four categories were: colonial species, solitary or “over-dispersed” species, Pacific Island fruit bats, and southwestern pollinators.
Subgroup Report: ColonialSubgroup Report: ColonialSubgroup Report: ColonialSubgroup Report: ColonialSubgroup Report: Colonial SpeciesSpeciesSpeciesSpeciesSpecies
Subgroup Members: Bob Berry, Jeff Gore, Michael Herder, Tom Kunz, Mike Rabe, and Paul Racey
Because some bats aggregate in colonies, various methods have been used to estimate the number of bats in a particular colony and develop estimates of the total population size. However, because bats are highly mobile, inhabit a variety of sites, and display a range of social structures, it is important that a colony be defined and that monitoring times be standardized to ensure that estimates are comparable. As defined, the term colony (a stable, single-species group of bats that occupies a definable area over a particular time interval and for which population parameters can be defined) is most readily applicable to large groups of bats at stable roost sites. However, colonies may also include small aggregations of bats that might use crevices, snags, trees, buildings, mines, or caves as roost habitat. We further suggest colonies be classified into three size classes: small = <200 individuals; medium = 200–9,999; or large = >10,000 individuals. This classification system, although somewhat arbitrary, was incorporated because colonies of different sizes pose unique challenges in developing suitable monitoring protocols.
Colonial Bat Species Subgroup Issue 1. Timing of Monitoring Surveys
Issue Description and Rationale
There is considerable variability in the opinions among researchers as to the best time for conducting colony monitoring. Ideally, colonies should be monitored when they are most stable in terms of numbers. While this is sometimes dictated by the physical attributes of the roost, moon phase, or sampling strategy, too often monitoring is scheduled mostly for convenience of the researcher or to maximize the number of counts within a particular season. Monitoring during particular life history events, such as parturition, lactation, or hibernation can cause disturbance or even mortality among the bat species being studied if not approached cautiously. Transient or roost-switching (Lewis, 1995) bats complicate the
246 INFORMATION AND TECHNOLOGY REPORT–2003--0003
estimation process by introducing an unknown rate of immigration or emigration. Fluctuation in the number of individuals causes great problems in gaining an accurate estimate of colony size. Monitoring during lactation may lead to erroneous assumptions, such as all bats exited the roost, or all bats counted at emergence were lactating females with non-volant young. As young become volant, adults may move to new roosts and form breeding aggregations. Counts made in hibernacula pose considerable disturbance to the bats being monitored and may reduce individual fitness or lead to mortality of the animals. Mortality caused by the monitoring technique compromises the reliability of the count and introduces dilemmas for the researchers. Additionally, as with other aspects of bat population monitoring, lack of consistency in timing between researchers in neighboring areas minimizes the reliability of intercolony comparisons.
Means to Resolve the Critical Uncertainties Surrounding the Issue
Monitoring for a particular species should be standardized with regard to the timing, location, methodology, and data collected. In order to minimize the effect on the counts of transient or roost-switching bats, monitoring should be conducted at a time when the colony size is most stable and most or all of the bats within the colony are exiting the roost. Monitoring at the roost eliminates the problems associated with attempting to assess population trends based on counts of commuting or foraging bats. Maternity roosts are typically stable and should be the highest priority for monitoring. We recommend that maternity colonies be surveyed in the first week before parturition in order to estimate colony size at its most stable point and greatest size. During this period, most of the bats within the colony should be exiting to forage and transient animals should have moved to other roosts. Counting at this time may require carefully conducted, pre-survey captures to determine the reproductive state of the females of the species, particularly in years where aberrant environmental conditions may alter the timing of reproductive events. Timing of these events may vary due to latitude, climate, or other factors and we encourage the building of predictive models (e.g., those from the U.K., A. Walsh, oral commun., 1999) that would help refine our understanding of the best time to survey.
Monitoring at hibernacula is generally not recommended due to the potential for disturbance to the animals. However, for some species, monitoring within hibernation sites may be the best or only reasonable
alternative in obtaining an accurate count with minimal bias. Where this is the case, we recommend monitoring each site once every 3 years.1 Hibernation counts are sometimes conducted more frequently in the U.K., but opinions vary on the degree of disturbance involved. A rotational system also may allow more sites to be surveyed. Care should be taken to complete the count as quickly and with as little disturbance as possible.
Colonial Bat Species Subgroup Issue 2. Estimation of Colony Size and Population Trends
Issue Description and Rationale
Determining trends in populations requires accurate assessments of colony sizes. Where the population comprises colonies dispersed over a wide area, a randomized sampling of colonies should be performed. Unfortunately, different species present different challenges for making accurate assessments. Even within a single species, colonies of different sizes or those in different locations may require different techniques or levels of effort. Biologists often select a survey method based more on what appears to be practical rather than on what would provide the most useful and accurate results. This can lead to estimates of colony size that are unreliable or have no estimate of error. Furthermore, these colony size estimates can prove useless or even harmful when used to detect population trends.
Means to Resolve the Critical Uncertainties Surrounding the Issue
Census. The preferred method for estimating colony size is a complete count or census and the best census method is to count bats as they exit the roost at night. Observers should arrive at least one hour before the normal exit time for the resident species. Noise and movement by observers should be minimized. Observers should be positioned where they can see the bats but are not likely to be detected by the bats, particularly not directly
1Editors note: Recommendations to conduct counts in hibernacula less often than every year are precautionary and intended to reduce possible disturbance effects from surveys on survival or reproduction of bats. Other sources recommend conducting counts in hibernacula every two years (Sheffield and others, 1992; U.S. Fish and Wildlife Service, 1999).
in the outflight path. At small to medium-sized colonies, bats should be counted until no individuals are seen for 15 minutes at any exit. Larger colonies may have a few bats exiting over a long period, yet staying at the roost may not be efficient. In these cases, it may be helpful to develop and test a depletion count technique that would allow observers to stop counts when less than a designated proportion of the colony is observed exiting over a 15-minute period (e.g., Tuttle and Taylor, 1994; Altenbach, 1995; Navo, 1995).
We recommend two or three separate counts if variation among nights is expected. Double-blind counts conducted by two independent observers would improve the reliability of the count and aid in assessing variation between observers. Following completion of the exit count, observers should refrain from entering the roost to count the number of bats remaining to minimize disturbance to remaining animals. We recommend that a standard form be developed and used by all monitoring crews. Forms should include information such as colony location (including coordinates determined by global positioning systems where useful), number and species of bats counted, number of entrances, moon phase, wind, date, humidity, number and names of observers, sunset, moonrise, noise level, identification technique, counting technique, how multiple exits were accounted for, and a drawing of roost exits if possible. Photographs should be taken outside the colony site if possible.
A variety of equipment can be used to census colonies (Rainey, 1995). Infrared thermal imaging, night-vision equipment, and infrared cameras (reflectance-based imagery) may be the only means of counting large colonies. A computer program that counts bats from the infrared imaging is being developed and testing of this program should be encouraged. For smaller colonies, the above equipment may be useful along with infrared counters, acoustic sensors (as a count starter, camera starter), clickers (tally counters), cameras, and lights with red filters.
Estimation. If direct counts of emerging bats are not practical, it may be possible to estimate colony size with capture-recapture techniques. Statistical models are available for determining population parameters and these should be carefully evaluated to determine which are most appropriate for each situation. The capture-recapture models make several assumptions that are often not easily met when working with colonial bats. Most models assume that marked and unmarked animals have the same resighting probability; this may be violated with any capture technique because bats quickly learn to avoid capture. Because of their small size and reliance on flight,
PART II 247
bats are also sensitive to many marking techniques and care must be taken that the marking technique does not cause increased mortality (including predation), significant behavioral changes, or abandonment of habitually used areas. All models also assume that marked animals can be correctly distinguished from unmarked animals. The small size, high mobility, and cryptic nature of bats means that marked animals are often difficult to detect. Conversely, wing bands can be so distinct that marked animals are more likely to be detected. Another problem is that bats can remove or deface bands and other external marks. Finally, depending on the estimation model used, it may be necessary to correctly identify individually marked animals and this can be a serious problem with bats. New techniques such as PIT tags and microtaggants should be explored for marking bats.
All marking techniques present special concerns and these concerns should be considered along with the advice of a biologist experienced with the species before a marking program is begun. In all cases, the need for and expected benefits of a marking program should be carefully considered relative to the potential harm to the bats (see also Working Group C Report, Issue 5, “Optimizing Information Obtained from Marked Bats”). Some concerns and problems are as follows:
• wing bands: can cause serious injury to some species, some species will not tolerate bands;
• necklaces: crevice or foliage roosting bats may snag necklace on projections;
• radios: short-lived, expensive, and due to weight and antenna they may cause behavioral changes;
• dyes, wing punches, freeze branding: potential for toxicity, short-lived, unknown long-term effect to bat health, research needed;
• PIT tags: need to focus bat flight through a relatively small space; unknown long-term effects to the bat, research needed; and
• microtaggants: short-lived, unknown toxicity, research needed.
Indices. Indices of colony size are inferior to census or estimation techniques. Therefore, they should be used only as a last resort and their limitations should be recognized. When possible, indices should be calibrated to population size as measured by a census. Indices are most likely to be useful in detecting dramatic changes in population size over long periods of time.
Widely dispersed colonies. It is important to note that censusing known colonies may give biased results, depending on the extent to which there are unknown
248 INFORMATION AND TECHNOLOGY REPORT–2003--0003
or undiscovered colonies. Monitoring of known colonies will allow colony extinctions to be recorded, but the formation of new colonies may go unrecorded if attempts are not made to find other significant roosts. Investigators will have to determine the extent to which this phenomenon may occur in their species and adjust sampling designs accordingly.
Colonial Bat Species Subgroup Issue 3. Roost-Switching Between Colonies
Issue Description and Rationale
Colonial bat species are known to switch from one roost to another. Roost switching may be for the purpose of predator avoidance, a response to predator encounters or disturbance by the researcher, or changes in internal roost conditions (e.g., temperature or parasite infestations). There has been growing information on roost switching in bats since the review by Lewis (1995), but more research is needed to improve understanding of this phenomenon and to properly account for it in population monitoring. Some species or individuals within a colony apparently engage in regular roost switching, although genetic and other studies in the U.K. and elsewhere indicate that females in maternity colonies are highly philopatric (A. Walsh, oral commun., 1999; Tuttle, 1976; Palmeirim and Rodrigues, 1995). Non-reproductive individuals within the colony may move to separate roosting sites, remain with the colony, or move between the two sites. As females complete lactation and prepare for breeding, they may move from maternity roosts to breeding sites. Migrating bats may join an existing stable colony for a brief period. Fluctuations in the number of individuals introduce substantial variation into counts and violate the assumption that the colony is a closed population.
Means to Resolve the Critical Uncertainties Surrounding the Issue
Transient and roost-switching animals are not considered in the definition of colony as it is applied here. While several of the program MARK capture-recapture models can be used to estimate colony size in an open system, it is preferable to use a census technique rather than an estimate. The preferred method for minimizing the effect of roost switching on colony counts is to conduct the monitoring survey when the colony is most stable. In many species this may occur during hibernation or approximately one week before or during parturition. (See also Issue 1 above.)
Colonial Bat Species Subgroup Issue 4. Developing a National Monitoring Program
(See Also Working Group C Report)
Issue Description and Rationale
Some researchers have proposed the development of a nationwide or continent-wide monitoring program to detect large-scale population trends in bats over time. A national program has been employed with relative success in the U.K. However, many North American bat species are widely distributed across the entire country. The scale of nationwide programs in the U.S. could be too large to be feasible if the purpose was to monitor all bat species throughout their ranges (see also Working Group B and C reports). Also, the life history characteristics of some species are either unknown or do not allow for any population census or population estimation to be made in any meaningful way. Nevertheless, some bats in the U.S. have relatively restricted distributions and have life history characteristics that make them likely candidates for a large scale, multi-year monitoring effort. Poorly designed or flawed monitoring programs should not be conducted. It is preferable to miss years or observations rather than conduct widespread, unreliable monitoring of bat roosts. Surveys may pose a possible disturbance to bat colonies. If the information from a survey is likely to be imprecise, then it would be better to not conduct surveys of that colony or perhaps to limit data to presence-absence information.
Means to Resolve the Critical Uncertainties Surrounding the Issue
Target bat species could be selected that have relatively small distributions in the U.S. and whose roosting habits and life histories suggest that such a monitoring plan would be possible (see also Working Group B report, “Prioritizing Monitoring Needs”). After selecting model species, the monitoring strategy could be designed using the following guidelines:
Stratification. All known roosts should be stratified by geographic region, land type, estimated colony size, and proximity to urban areas (see also Working Group C report, Issue 2, “Analytical Considerations for a National Bat Monitoring Program”). This stratification not only reduces the variation among roosts and allows for more precise estimates, but would also allow researchers to examine changes in population sizes among the strata. Roosts would then be selected from these known roosts
in a random fashion. Randomizing the sample could pose serious logistical problems but would strengthen the statistical inferences that could be made from any population changes. If random samples pose insurmountable problems, then a nonrandom selection could be chosen and still be useful. However, the inference from a nonrandom sample would be restricted to the sample that was being surveyed.
Sample size. A sample size of 25–30 roosts would likely be sufficient to document substantial changes in many populations over time but may depend on size of the sampling frame. Estimation of sample size requirements and power analysis should be integral to planning efforts (Gibbs, 1995; Eagle and others, 1999).
Timing of surveys. All roosts could be sampled once every 2 or 3 years rather than every year. Although there is a logistical advantage to yearly surveys (experienced crews remain intact), surveys could be staggered without serious loss of inferential power.
Subgroup Report: Over-Subgroup Report: Over-Subgroup Report: Over-Subgroup Report: Over-Subgroup Report: Over-Dispersed Bats: Foliage, CavityDispersed Bats: Foliage, CavityDispersed Bats: Foliage, CavityDispersed Bats: Foliage, CavityDispersed Bats: Foliage, Cavity,,,,,
and Crevice Roosting Batsand Crevice Roosting Batsand Crevice Roosting Batsand Crevice Roosting Batsand Crevice Roosting Bats
Subgroup Members: Tim Carter, John Hayes, Alex Menzel, and Allyson Walsh
Over-dispersed bats roost solitarily or in low densities, generally in foliage, cavities, or crevices. Characteristics of over-dispersed bats present unique problems with respect to monitoring and estimating population parameters. The roosting ecology of these species limits applicability of methods described for colonial species. Furthermore, the high vagility, low detectability, and low probability of recapture make it difficult to apply mark and recapture or resight methods for estimation of population parameters.
Over-Dispersed Bats Subgroup Issue 1. Estimation of Population Parameters
of Over-Dispersed Bats
Issue Description and Rationale
Estimating the density or survival of over-dispersed bats is necessary to monitor trends of these species.
PART II 249
Trends in densities could be used to monitor the effects of factors such as habitat manipulations and changes in climatic patterns on the health or spatial distribution of populations of over-dispersed bats. Currently, two methods (use of bat detectors and mist nets) are used to determine indices of abundance for these species in limited geographic areas. We currently have no understanding of detection probabilities (i.e., the probability of detecting an individual with a given technique under specified conditions) associated with each of these methods, and it may be impossible to standardize detection probabilities among researchers or studies and over time. Thus, it is not possible to determine the precision or accuracy of these indices. Without an understanding of accuracy and precision, it is difficult to determine if trends based on these indices reflect actual changes in population densities or changes in the detection probabilities. The inability to estimate detection probability greatly limits the usefulness of data collected using uncalibrated indices produced either by mist netting or bat detector surveys. To calibrate these indices, appropriate population parameters must be estimated. Currently, these population parameters can only be estimated using mark-resight techniques. To date, mark-resight techniques have not been developed or applied to estimate population parameters for any species of bat in this group.
Means to Resolve the Critical Uncertainties Surrounding the Issue
The uncertainty and problems associated with this issue are substantial and daunting. The problems revolve around uniquely marking and resighting animals. No methodologies have yet been developed or applied for marking and resighting or recapture of over-dispersed bats in an economical or logistically feasible manner. Problems associated with recapturing members of this group make utilization of unique marking techniques, like forearm-banding, inappropriate. Other techniques used to individually mark animals include radio-transmitters and PIT tags. Because of the high cost associated with radio-transmitters, their use for marking animals to estimate population parameters may not be economically feasible. The short distance required between the PIT tag scanner and the bat to detect the PIT tag limits their use for over-dispersed bats. Technological advances may alleviate many of these problems. Technological advances, including transponders and diode lights, may make marking and resighting large numbers of over-dispersed bats economically and logistically feasible.
250 INFORMATION AND TECHNOLOGY REPORT–2003--0003
Until problems surrounding estimation of population parameters are resolved, alteration of current methods to increase statistical rigor is desirable. Current limitations of indices may be reduced through the use of double sampling procedures (Thompson and others, 1998, p. 115), in which an inexpensive index is gathered in a large sample followed by expensive but more reliable measures on a smaller sample, results of which are used to calibrate the index. For bats, perhaps mark-resight or other enumeration techniques can be used to calibrate more expensively measured parameters (e.g., density) to more easily measured indices (e.g., habitat type, mist net captures, bat detector data).
We suggest two initiatives regarding existing monitoring and research programs. First and most importantly, it is essential that methodologies be developed to determine unbiased estimates of population parameters such as abundance, density, and survival of over-dispersed bats. Without such methodologies, it will never be possible to reliably monitor trends in populations of these species. These methodologies will likely involve new approaches for marking and resighting bats.
Second, once methodologies for mark-resight studies are established, evaluation and calibration of widely used methodologies and indices, such as catch per unit effort from mist netting or number of bat passes in echolocation monitoring studies, is necessary. Current methods employed for surveying or monitoring over-dispersed bats are primarily limited to mist net and bat detector surveys. Because detection probabilities associated with these methods are unknown, data currently collected using these techniques are of limited value. The precision of data currently collected should be evaluated. Provided data collected by these indices are positively and significantly correlated with the population parameters they are intended to estimate, their usefulness will be greatly increased through calibration.
Because of the expense and logistical difficulties currently associated with estimating the population parameters of over-dispersed bats, it is unlikely that indices currently used can be calibrated adequately by a single study or research team. Because data used in calibration will probably be collected in multiple studies by many individuals, the manner in which the mist netting and bat detector data are collected should be standardized to the degree possible. Following calibration of these indices, the usefulness of index data collected in the future will depend on the collection methods paralleling those used in the calibration studies.
Over-Dispersed Bats Subgroup Issue 2. Use of Echolocation-Monitoring to Determine Trends in Habitat Use
by Over-Dispersed Bats
Issue Description and Rationale
Bat detectors have become increasingly available over the past decade, and are used for long-term monitoring of bats. For example, nationwide monitoring programs in the U.K. (Walsh and Catto, 1999) and the Netherlands have incorporated use of bat detectors as one tool for monitoring bats. In the U.K., surveys using heterodyne bat detectors are conducted during the summer to complement counts at maternity colonies or hibernacula for five species of bats. Because of the difficulties in capturing over-dispersed bats in many environments, use of bat detectors to evaluate trends in bat populations would be a cost-efficient, non-invasive technology if crude indices based on echolocation detectors could be calibrated against actual numbers of bats.
A problem in using bat detectors is the inability to use echolocation-monitoring data to assess number of individuals using a site and hence measure absolute abundance. For example, it is not possible to distinguish between a single individual flying over a given site on 10 occasions, and 10 individuals each flying over the site once. Hayes (2000) identified and discussed assumptions inherent to use of bat detectors in echolocation-monitoring studies. Hayes concluded that it is unlikely that echolocation-monitoring data can be an effective tool for assessing population trends of bats because such data do not assess abundance directly. However, Hayes noted that under some situations, bat detectors might be appropriate for monitoring use of different habitats through time if care is taken to assure adequate spatial and temporal replication. Bat detectors also may play a valuable role in monitoring changes in species distributions for taxa that can be identified unambiguously based on echolocation calls.
Means to Resolve the Critical Uncertainties Surrounding the Issue
It is recommended that use of bat detectors in monitoring programs for over-dispersed bats be used only with recognition of the limitations restricting inference to changes in species distributions and use of habitats rather than changes in abundance. Studies using infrared video
recorders and at least two observers may be valuable in quantifying the relationship between numbers of bats and bat passes in different habitats.
Over-Dispersed Bats Subgroup Issue 3. Use of Mist Netting Surveys to Evaluate Trends
of Over-Dispersed Bats
Issue Description and Rationale
A large number of inventories and studies of bats using mist nets are conducted each year across the U.S. Some of these efforts, including surveys conducted on public and private lands, are specifically targeted at determining status of species. However, these surveys generally only provide meaningful information on the presence and distribution of species, and rarely if ever provide reliable information on abundance or density of populations. Many other mist netting efforts are targeted to achieve a variety of objectives such as capture of individuals for radio-telemetry or collection of fecal pellets for dietary analysis. Information on number of individuals captured and presence of species is incidental to the primary objective. A key problem with these data is a lack of consistency in approaches used to collect the data. Furthermore, there have been minimal efforts to date to evaluate large-scale patterns in numbers of captures of bats using these data.
Because of the inability to assess population parameters using mist netting data in the absence of recapture or resighting information (see Issue 1, this subgroup report), meaningful estimates of changes in population density based on data currently collected in mist netting surveys and studies are not possible. Changes in numbers of captures over time can result from changes in capture probabilities or from changes in abundance.
Means to Resolve the Critical Uncertainties Surrounding the Issue
Uncertainties concerning interpretation of mist netting data and the extent to which changes in numbers of captures reflect changes in abundance or changes in capture probabilities preclude use of these data for unbiased estimation of population trends. However, in the absence of improvements to current approaches, we suggest that methods for collecting and compiling data collected in mist netting studies and surveys might provide a valu-
PART II 251
able “early warning system” to monitor major trends in populations of over-dispersed bats. An early warning system using mist netting data would enable identification of probable changes in the distribution of species through time, and would provide evidence of potential dramatic changes in abundance of species. The rationale for the application of mist netting data as an early warning system relies on the principle that capture probabilities are not likely to change beyond certain bounds through time (assuming no significant changes in capture techniques). If capture success for a species changed through time, and if the magnitude of change exceeded the maximum rate expected given changes in capture probability, this would suggest a significant change in abundance. For example, if one assumed that a change in capture probability by a factor of 10 was highly unlikely, then any 10-fold change in number of bats captured would be unlikely to result from changes in capture probabilities alone, and would likely be the result of changes in abundance. In addition, mist netting data could be used directly to assess distribution of species and changes over time. If apparent changes in distribution or abundance of species were noted that were substantial enough to be of potential conservation concern, additional, more rigorous studies could be pursued.
Implementation of this approach would require two changes. First, standardization of mist netting methodologies is essential to provide data that are reasonably comparable among studies. Capture probabilities are a function of a variety of factors, some of which are under the control of surveyors, others are not. Controlling for as many of the factors known to influence capture probability as possible may increase the probability that changes in capture success reflect changes in abundance. Standardization of factors such as time nets are deployed, duration of deployment, and weather conditions during which netting is conducted will help control for some of this variation. [However, standardizing counting protocols alone does not satisfy constant proportionality assumptions inherent in use of indices (Thompson and others, 1998, p. 77).] In addition, recording data concerning the size of nets used, location of sites, habitat characteristics of the area, and ambient conditions (e.g., temperature) may provide useful covariates for future analyses. However, because all factors related to capture probabilities cannot be controlled or taken into account in future analyses (indeed some of the factors responsible for differences in capture success will probably not even be known), use of these data will only be valuable
252 INFORMATION AND TECHNOLOGY REPORT–2003--0003
to address coarse-scale changes of relatively large magnitude. Second, data collected from mist netting studies would need to be archived in an accessible format so that trends could be evaluated.
While we advocate the use of this approach as an early warning system, we offer three caveats. First, the lack of statistical rigor inherent to this approach should be recognized and managers should not misinterpret potential trends identified with this approach as actual trends. Second, only substantial trends will be apparent using this approach; important, but smaller trends will not be identifiable using this approach. Finally, use of this approach should not divert resources from development of more rigorous procedures for evaluation of actual trends.
Over-Dispersed Bats Subgroup Issue 4. Spatial Scale Considerations in
Monitoring Over-Dispersed Bats
Issue Description and Rationale
Determining the appropriate spatial scale for monitoring is a critical issue (see also Working Group C Report, Issue 2, “Analytical Considerations for a National Bat Monitoring Program”). Monitoring programs can be established to evaluate population trends at a number of spatial scales, from very small, localized populations (e.g., at a scale of several hectares) to regional trends (e.g., within states or regions of the country) or at very expansive spatial scales (e.g., nationally or across the entire distribution of the species). Real or apparent trends at very restrictive spatial scales could be an artifact of localized conditions or stochastic variation that is offset by counter-trends within other small populations. As a consequence, monitoring at very fine spatial resolutions is likely to be of value to managers only under limited situations. For over-dispersed bats, the appropriate scale to provide meaningful information for conservation or management of bats will generally be at the regional or higher spatial scales.
Means to Resolve the Critical Uncertainties Surrounding the Issue
Pending development of techniques to better estimate population parameters for this group of bats (see Issue 1, this subgroup), progress may be limited. However, methods to determine sampling protocols at different spatial scales are well developed in the statistical and sampling literature (e.g., Goodwin and Fahrig, 1998). If
feasible, sampling protocols based on stratified random sampling of large areas probably would be most appropriate for this group.
The resources required to implement even modest efforts for a well-developed, statistically rigorous, large-scale monitoring program for over-dispersed bats would be considerable. It is unlikely that technological advances in approaches to monitor bats will alter this in the foreseeable future. Compilation of data from existing mist netting, trapping, or bat detector studies may be an alternative to development of rigorous large-scale sampling for these species. However, the previously mentioned caveats concerning these methods should not be overlooked.
Over-Dispersed Bats Subgroup Issue 5. Alternatives to Monitoring
Issue Description and Rationale
Because of the difficulties noted above in monitoring populations of over-dispersed bats, current evaluation of population trends in these bats may require use of alternatives to monitoring. One valuable alternative approach is based on the premise that causal factors related to abundance, survival, or recruitment of bats could be identified. The extent to which those causal factors are expressed in some geographic area would reflect status and changes in population parameters through time. Studies of the response of bats to habitat structure or environmental perturbation conducted at appropriate spatial scales could serve as surrogates for monitoring. Applicability of data collected from these studies beyond the area studied should be tested to determine the limits of their applicability (e.g., spatial and temporal scale).
Means to Resolve the Critical Uncertainties Surrounding the Issue
Double sampling is a method that can be used to statistically calibrate surrogates (e.g., Thompson and others, 1998). This method uses mark-resight or other reliable enumeration techniques to calibrate expensively measured parameters (e.g., density) to those more easily measured (e.g., habitat type). Following development of appropriate methodologies, studies should involve the use of mark-resight techniques to obtain population densities in limited areas. Causal factors that may influence density should be identified and evaluated. Then extrapolation can be done across a limited area where similar factors occur. Although initial studies correlating
potential causal variables and population parameters will be costly and time consuming, measurement of the surrogate variable across the inference area should be relatively easy.
There are many examples of studies of relative use of different areas by bats. Because most of the methods do not account for detection probability, many of these approaches lack statistical rigor. We recommend that future studies attempt to evaluate population density, rather than an index of abundance, wherever possible. Furthermore, these programs should include double sampling methods to extrapolate results to wider spatial scales.
Subgroup Report:Subgroup Report:Subgroup Report:Subgroup Report:Subgroup Report: Assessment ofAssessment ofAssessment ofAssessment ofAssessment of Population Size andPopulation Size andPopulation Size andPopulation Size andPopulation Size and TTTTTrends inrends inrends inrends inrends in
Pacific Island Fruit BatsPacific Island Fruit BatsPacific Island Fruit BatsPacific Island Fruit BatsPacific Island Fruit Bats
Subgroup Members: Anne Brooke, Ruth Utzurrum, Gary Wiles, and Don Wilson
In the geographic areas under consideration, American Samoa, Guam, and the Commonwealth of the Northern Marianas, there are three species of fruit bats: Pteropus mariannus, P. samoensis, and P. tonganus. A review of census methodology and population trends for these three species appears in Utzurrum and others (2003). In general, these three species fit into two basic lifestyles: colonial and solitary.
Pteropus samoensis is solitary, with individual bats roosting alone in the canopy of the forest. Most animals spend at least part of their time foraging actively during the day, and their tendency to soar and ride thermals makes them visible to properly situated observers. For the past decade or so, relatively standardized counts of flying bats over given periods of time have been made at permanently located stations. The numbers generated by these counts are used as an index to the health of the population on the largest island in American Samoa.
Pteropus tonganus occurs in colonies ranging from dozens to thousands of bats. The colonies are relatively easy to detect, although hunting pressure in years past in American Samoa has driven the colonies to the most inaccessible parts of the islands. Once colonies are located, it is possible to census them by direct counts using binoculars and spotting scopes, but there is considerable variation in the counts, due to differential detectability of animals within a colony. It is also possible in some cases to make dispersal counts on colonies. These counts are also subject to some unknown amount of varia-
PART II 253
tion due to potential differential dispersal routes for the colonies. Some unknown (although probably small) percentage of the population also roosts solitarily and is well dispersed with regard to known colonies.
Pteropus mariannus has a lifestyle similar to that of P. tonganus. Most animals live in colonies that are relatively easy to detect. However, an unknown percentage (possibly somewhat higher than in P. tonganus) also lives solitarily at any given time. On Guam, a single remaining colony has been censused monthly by direct counts by the same individual for the past 15 years. These counts are reasonably reliable, and the population estimates for Guam are probably the most sound of all three species and all other areas. Counts on other islands in the Northern Marianas are less reliable, and have been conducted regularly only on a single island (Rota). Counts on these islands are done with combinations of direct colony counts, indirect departure counts, and counts of flying bats at widely dispersed observation stations. Some unknown colonies likely remain to be detected.
Pacific Island Fruit Bat Subgroup Issue 1. Difficulties in Censusing Pacific Island
Fruit Bats
Issue Description and Rationale
P. samoensis presents the most intractable problems among the three species. Its solitary roosting habits and dispersion through inaccessible forest in extremely rugged terrain makes censusing difficult. Different observers have performed the station counts over time and the techniques themselves have been modified slightly at different times. This makes even relative comparisons somewhat difficult to make. There is a need for a means to measure detectability, and for a means to extrapolate the findings from the areas surveyed to the entire population.
P. tonganus presents a different, but related set of problems. Probably not all roosts are currently known. Improved means to detect all roosts on a given island are needed. Counting individuals within a known roost is also difficult. There is a need for better methods of standardizing these counts, and of getting some measure of inter-observer differences. These problems apply equally to dispersal counts conducted at P. tonganus roosts.
The problems with P. mariannus are similar to those outlined for P. tonganus. We need to locate all of the colonies on a given island, especially in the Northern Marianas. Once located, the colonies need to be censused in a more standardized manner, allowing some indication of individual observer differences. In addition, some
254 INFORMATION AND TECHNOLOGY REPORT–2003--0003
improved technique for estimating the size of the population that occurs as solitary individuals is needed.
Means to Resolve the Critical Uncertainties Surrounding the Issue
We met with David Anderson and discussed a number of methodological approaches to censusing these species. Use of mark-recapture methods appears stymied at present by our current inability to reliably capture the animals for marking. In turn, distance techniques that rely on some measure of detectability seem precluded by logistical difficulties.
For all three species, the most pressing need is for a measure of detectability that would allow more accurate estimation of the total population from current counting techniques. We believe that research directed towards improving the census methodology in that direction should be pursued. Probably the most promising area is to devise a method of capturing the animals that would allow marking. If we had a marked proportion of animals in any of our study areas, it would allow us to begin the process of injecting more rigor into the statistical analysis of our count data.
Additionally, research into attracting animals using artificial lures might be profitable. Recordings of calls, or artificially generated call simulations, might allow bats to be attracted to sites where they could be counted or marked. Similarly, research directed at using scent stations based on actual food sources, or chemically enhanced stimuli, might be useful. If the bats could be attracted to some sort of bait station, it would greatly increase the chances of capturing and marking them. If bats can be attracted to chosen sites, we would also need additional research on methods of netting or trapping them. Methods of self-marking at such bait stations should also be explored.
We also recommend additional study into the possibility of controlled hunts in some areas or some islands. This might be especially useful if some method of marking animals is developed. Such hunts might increase involvement of the local people in conservation activities by allowing their participation in a worthwhile scientific endeavor, while at the same time enjoying traditional hunting activities that are currently denied.
Additional research into the feasibility of using aerial surveys and remote sensing information to detect colonies of both P. tonganus and P. mariannus would be useful. In the interim, the currently used census methods should be continued and every possible effort should be made to standardize them as much as possible. In addition, logical covariates of bat population densities also should be measured regularly, with a view towards explaining future trends.
Subgroup Report: ImprovingSubgroup Report: ImprovingSubgroup Report: ImprovingSubgroup Report: ImprovingSubgroup Report: Improving Assessment of Numbers andAssessment of Numbers andAssessment of Numbers andAssessment of Numbers andAssessment of Numbers and
TTTTTrends in Southwesternrends in Southwesternrends in Southwesternrends in Southwesternrends in Southwestern PollinatorsPollinatorsPollinatorsPollinatorsPollinators
Subgroup members: Mike Bogan, Paul Cryan, Virginia Dalton, Ted Fleming, and Rodrigo Medellin
Three species of nectarivorous bats seasonally occur in the southwestern U.S. (primarily Arizona and New Mexico); the greater part of their geographic range is in Mexico. During the spring and summer they migrate northward into the U.S. as flowering plants (columnar cacti and agaves), on which they depend for sustenance, begin to bloom. These three species play an important, but not clearly understood, role in southwestern ecosystems, primarily by providing pollination and seed-dispersal services. The three species are:
• Leptonycteris curasoae, Lesser Long-nosed Bat. Most of the major roosts are in Mexico. The species occurs seasonally in several large maternity roosts in southwestern Arizona and in smaller numbers in southeastern Arizona and southwestern New Mexico. The species is listed as endangered by the U.S. Fish and Wildlife Service (FWS).
• Leptonycteris nivalis, Greater Long-nosed Bat. Little is known of this species although it occurs in some large roosts in Mexico. In the U.S., it is known only from southwestern New Mexico in late summer and from one cave roost in Big Bend National Park in Texas. The species is listed as endangered by the FWS.
• Choeronycteris mexicana, Mexican Long-tongued Bat. This species ranges from Honduras northward into southern Arizona and New Mexico in the spring and summer. The species is a former FWS Category 2 Candidate Species and is now considered a “Species of Concern.”
Southwestern Pollinator Subgroup Issue 1. Relative Value of Current Efforts to Monitor
Leptonycteris curasoae
Issue Description and Rationale
Leptonycteris curasoae is listed as endangered in the U.S. and is of special concern in Mexico. Monitoring programs are currently in place in Mexico and are conducted by the Program for the Conservation of Migratory Bats (PCMM). Roost sites are visited once a month or every other month. During each visit, census data are
collected in a standardized fashion (data also are recorded for L. nivalis). The program hopes to detect both long-term declines and catastrophic events (e.g., vandalism, etc.). Despite the endangered status of L. curasoae, there is no coordinated monitoring program in the U.S. Efforts to monitor the species in the U.S. have been conducted by several individuals in a non-standardized fashion; monitoring in the U.S. is not coordinated with Mexican efforts. Current techniques involve counting bats in, or as they exit, their roosts.
Current efforts are based on two major assumptions. The first assumption is that there is an equal likelihood that bats will return to the same site year after year. The second assumption is that there is minimal movement of bats between roosts during the monitoring period. Based on our current knowledge of these species, we are confident that these assumptions are not seriously violated in current monitoring efforts and that such efforts are producing useful information on population trends in roosts.
Means to Resolve the Critical Uncertainties Surrounding the Issue
The subgroup agreed that current census efforts provide sufficient resolution to monitor major population trends and catastrophic events and should be continued. Additionally, the PCMM is a valuable conservation and education effort that should continue in Mexico. Nonetheless, current efforts are low resolution and should be improved. Deficiencies of the current system and ways to improve these efforts, including using a standardized monitoring approach throughout the range of the species, are discussed in the context of Issue 2.
Southwestern Pollinator Subgroup Issue 2. Standardizing Monitoring Techniques for
Leptonycteris curasoae
Issue Description and Rationale
An important problem is the absence of a standardized approach to counts of bats of this species over time and space. The following issues and possible solutions are important in attempting to develop a standardized counting protocol for L. curasoae and may also be useful for the other two species of pollinating bats in the U.S.
Means to Resolve Critical Uncertainties Surrounding the Issue
a. Methods of counting emerging bats. Comparisons of counts made from videotapes to real-time visual
PART II 255
observations suggest that videotaping the emergence provides the most reliable way to count (Dalton and Dalton, 1994). Two individuals should make all counts of videotaped emergences until counts converge. Video also has archival properties and digital images may be quantified with computer methodology that is in development. The subgroup recommended that a cascade of approaches be used with infrared videotaping preferred where and when equipment is available. In the absence of that equipment, internal or exit counts should be made by at least two or more observers. Using only a single observer is not recommended, as then no error estimate is possible.
b. Types of illumination used during exit counts. It is likely that both white light and red-filtered lights modify bat behavior. We recommend the following light types, in order of preference: (1) infrared, (2) red-filtered, and (3) white.
c. Length of emergence counts. Current efforts generally count through a period that is believed to approximate the major portion of the emergence, about two hours, and this seems adequate. It might be useful to obtain more precise data on length of emergences.
d. Covariates that should be recorded during exit counts. We recommend that the following covariates be recorded: time of day, length of time for emergence, presence and relative amount of nearby water, wind speed, temperature, other climatological factors, phenology of flowering plants important to bats, and other noteworthy items, including evidence of disturbance. These factors may be used as covariates to help explain variation in colony numbers.
e. Counting target species in roosts with multiple species. Multispecies roosts confound exit counts at many of the significant roosts of L. curasoae in Mexico. Suggested solutions include conducting an internal count first to determine the proportion of each species in the roost, then conducting the emergence count, and adjusting the number by proportion present (this should be tested for reliability and, ideally, two observers should estimate proportions and numbers). Videotaping and still photographs also may provide estimates of proportions of other species in the roost. Additional work is needed to further address this problem.
f. Minimum number of observers needed to make counts. This varies by site to some extent but as noted earlier, at least two individuals should count bats, whether on tape or during emergence. Those
256 INFORMATION AND TECHNOLOGY REPORT–2003--0003
in charge of monitoring roosts should attempt to get additional help when needed. In the U.S., this may be less of a problem because there are fewer roosts and a shorter season in which roosts must be monitored.
g. Standardized descriptions of roosting sites (caves, mines). We recommend that attempts be initiated to develop standardized descriptions for roosts of this species. Most important are descriptions of roost configuration (e.g., location, shape and size of main exit, number of exits, passages, length, etc.). A standardized protocol to describe these and related aspects of roosts may be useful. In Mexico, PCMM uses a speleologist to go to each cave that is monitored and provide cave maps with entrances and other details. In addition, qualitative descriptions of nearby vegetation, nearest available water, and selected microclimate variables should be included.
h. Ranking of roost sites in terms of biological or conservation importance. In Mexico, due to the number of roost sites and the fact that they cannot all be monitored in 1 year, roosts are ranked for monitoring purposes. Rankings are based on the number of bats present, status of species occupying the cave, species richness, proximity of the roost to threats (e.g., urban areas), and location of the roost in relation to migratory routes.
i. Standardized schedule for exit counts. Ken Burnham noted that if we are only trying to monitor long-term changes due to environmental degradation we do not need to monitor every year. If there is a need to check sites for catastrophic changes or vandalism this can still be done without conducting exit counts on every visit. This may allow more roosts to be covered in a given period (e.g., every 2 years).
j. Standardizing counts of bats inside caves or mines. In Mexico, the configuration of some caves limits the feasibility of emergence counts as observers or video equipment cannot be usefully located. Thus, internal counts are the only possible means of counting. We recommend that in such situations the counts be conducted by two observers (see also Altenbach, 1995), so that error estimates can be made.
k. Importance of transient roosts for monitoring. There are potentially important transient roosts in southeastern Arizona in early and late summer that are likely dependent on a localized food
resource. These bats may represent a presently unknown maternity colony in northeastern Sonora. Even though we are uncertain of the importance of some transient roosts, there was a consensus that exit counts should be conducted at these sites as well.
l. Disturbance of bats during monitoring activities. There was general agreement that bats may move due to disturbance but that such moves are temporary. Nonetheless, counts and other activities should be conducted with the least possible disturbance to the bats.
Southwestern Pollinator Subgroup Issue 3. Monitoring of Leptonycteris nivalis
Issue Description and Rationale
In Mexico, PCMM is trying to identify gaps in information pertaining to L. nivalis and will initiate further work in the future. In the U.S., the only known roost of L. nivalis is at Mount Emory Cave, Big Bend National Park, Texas; occasionally individuals have been captured in New Mexico.
Means to Resolve the Critical Uncertainties Surrounding the Issue
We recommend that the U.S. National Park Service initiate or allow routine monitoring of Mount Emory Cave, as well as searching the area around Mount Emory Cave, and perhaps adjacent areas, for additional caves that may be used by L. nivalis. Researchers in New Mexico and southeastern Arizona should be alert to the possibility that they may capture L. nivalis at times. Such instances should be recorded and forwarded to a central clearinghouse for information on the species.
Southwestern Pollinator Subgroup Issue 4. Monitoring of Choeronycteris mexicana
Issue Description and Rationale
We discussed monitoring needs of C. mexicana as a part of our activities. The U.S. Geological Survey (USGS) conducted a search for all historic roosts of this species in Arizona and New Mexico during summer 1999 (Cryan and Bogan, 2003). Site fidelity was high, occupancy rates were consistent with historic numbers, and young
PART II 257
frequently accompanied females. This species may be an example of an “over-dispersed” species, and comments elsewhere in this report may pertain as well (see Working Group A subgroup report, “Over-Dispersed Bats”).
Means to Resolve the Critical Uncertainties Surrounding the Issue
Given the generally favorable nature of the 1999 survey results (Cryan and Bogan, 2003) along with comments by K. Burnham on needed frequency of actual counts, we recommend that the survey be repeated every 2 to 3 years. Choeronycteris appears to be amenable to a recruitment and survivorship marking study because individuals are visible from outside the roost, they are found in manageable groups, and are relatively limited in distribution (patchy). There was a consensus that this would be worthwhile only as part of an in-depth, long-term research study of the biology of the species. Given the ability to make actual counts, marking of individuals is not needed for monitoring efforts.
Southwestern Pollinator Subgroup Issue 5. Continuation of Baseline Monitoring Efforts
Issue Description and Rationale
The subgroup agreed that efforts to establish baseline monitoring information and data for these three species should be continued. There was further consensus that this probably has to be done on a species-byspecies basis. There is not enough monitoring directed at L. nivalis, and the first attempt at a range-wide survey for C. mexicana in the U.S. was just completed (Cryan and Bogan, 2003). In addition, efforts should be continued to find new roosts, particularly in areas where there are gaps in the known current range.
Means to Resolve the Critical Uncertainties Surrounding the Issue
As noted earlier, with relatively long-lived species, such as bats, it is not necessary to monitor every year to pick up long-term trends in population. Given current budgets and resources available for monitoring, monitoring every 2 years could increase the number of roosts monitored over time, particularly in Mexico. However, annual counts are useful for picking up short-term changes, catastrophic events, and gathering data on covariate influence on population numbers.
Southwestern Pollinator Subgroup Issue 6. Sharing of Baseline and Monitoring Data
for the Three Species
Issue Description and Rationale
In the case of L. curasoae, we have two types of data: roost locality/characteristics and counts of bats at roosts. We agreed that precise locality data must be controlled and released only to qualified individuals. We also reached a consensus that we need a central repository for all data, but at this time could not agree on where that would be. In Mexico, the Comision Nacional Para El Conocimiento y Uso de la Biodiversidad (CONABIO)2
will fund projects to gather data. The data are the collector’s for 5 years after collection, but then become available to others, unless the collector specifically requests controlled access to data. Then the collector becomes the gatekeeper to data. PCMM posts metadata rather than specific data.
Means to Resolve the Critical Uncertainties Surrounding the Issue
Efforts should be continued to identify a central clearinghouse for information on the three species as well as to resolve differences about exactly what data should be stored and what should be released to various parties interested in the data.
Southwestern Pollinator Subgroup Issue 7. Funding for Monitoring and Research
Issue Description and Rationale
Funding for this group of unique pollinators seems relatively difficult to obtain, other than for specific research studies. Recovery plans have been written for the two endangered species of pollinating bats, but we were uncertain whether the plans are being implemented. Both plans contain fairly complete synopses of useful and important research and management activities that should be conducted as a part of the recovery of the two species.
2Editor’s note: CONABIO is an interministerial Mexican government commission established by Presidential decree March 16, 1992. The mission of CONABIO is to coordinate conservation and research efforts designed to preserve Mexico’s biological resources. For additional information see: http://www.conabio.gob.mx.
258 INFORMATION AND TECHNOLOGY REPORT–2003--0003
Means to Resolve the Critical Uncertainties Surrounding the Issue
Efforts should be initiated at federal and state levels to obtain funding for collecting baseline information on these species and for long-term population monitoring. Current interest in pollinators may provide a useful springboard for efforts to obtain such funding. Discussions on the status of recovery plans and the need to initiate greater levels of activity should be held with Department of the Interior agencies that have lands on which these species occur or that have mandated responsibilities under the ESA.
Southwestern Pollinator Subgroup Issue 8. Associated ResearchActivities
We discussed the potential of more sophisticated monitoring regimes (e.g., mark and recapture studies) for estimating population parameters. Ken Burnham noted that such approaches should best be reserved only for research purposes and should not be used for long-term monitoring given the geographic distribution of roosts and logistical difficulties of moving among roosts. Banding studies would help identify movement between colonies, provide information on site fidelity, and allow some inferences on natality and mortality. However, such studies would require thousands of marked individuals and intensive follow-up monitoring.
Several factors confound our ability to monitor these species. Migration, and our relative ignorance of it, makes decisions on sampling and sampling frames difficult. It might be possible to use a particular season of the year when the bats are most concentrated within their range and those sites could be sampled; however, this information is not currently available. If winter is the time of greatest concentration of L. curasoae, then it may be possible to count all 30 known wintering sites (estimated). If all sites cannot be visited within a short period, sampling priorities could be established (e.g., by using numbers of bats present), and then a sample of caves/roosts could be selected.
Indirect methods, such as monitoring bat visitation at flowers and feeders may offer promise in identifying areas of new or unknown roosts and times of arrival and departure. In addition, there may be some use for molecular tools in assessing historical, long-term population numbers but only for research purposes. Finally, there may be a potential role for non-specialists in these efforts, in Mexico to help define migration corridors, and in the U.S. to monitor bat use of hummingbird feeders.
WWWWWorking Group B. Categorizingorking Group B. Categorizingorking Group B. Categorizingorking Group B. Categorizingorking Group B. Categorizing U.S. Bat Species or SpeciesU.S. Bat Species or SpeciesU.S. Bat Species or SpeciesU.S. Bat Species or SpeciesU.S. Bat Species or Species
Groups, and Regions inGroups, and Regions inGroups, and Regions inGroups, and Regions inGroups, and Regions in TTTTTerms oferms oferms oferms oferms of Priorities for EstablishingPriorities for EstablishingPriorities for EstablishingPriorities for EstablishingPriorities for Establishing
Population-TPopulation-TPopulation-TPopulation-TPopulation-Trend Monitoringrend Monitoringrend Monitoringrend Monitoringrend Monitoring Programs Based on ConservationPrograms Based on ConservationPrograms Based on ConservationPrograms Based on ConservationPrograms Based on Conservation
Concerns, Roosting Habits,Concerns, Roosting Habits,Concerns, Roosting Habits,Concerns, Roosting Habits,Concerns, Roosting Habits, Distribution, Threats,Distribution, Threats,Distribution, Threats,Distribution, Threats,Distribution, Threats,
and Other Factorsand Other Factorsand Other Factorsand Other Factorsand Other Factors
Working Group Members: Pat Brown, Mary Kay Clark, Joe Kath (Leader), Allen Kurta (Rapporteur), Kirk Navo, David Saugey, Merlin Tuttle, Ernest Valdez, and Mike Wunder
Monitoring any population of animals generates a wealth of biological information, including increased knowledge of natural history, ecology, and behavior. Such information is potentially useful to wildlife managers and research biologists and can be of interest to the general public. In addition, data obtained by monitoring are essential for demonstrating demographic trends that are important to conservation.
Although it may be intrinsically desirable to monitor all species, such an undertaking may not be necessary or practical. Before beginning a monitoring program, one must establish the:
• goal of the monitoring program, • feasibility of the monitoring program, and • criteria to be used when deciding which species
or population to monitor.
In this paper, we focus on the latter two issues and examine various biological and non-biological factors to consider when deciding which group of bats to monitor. Our discussion touches on six broad categories of factors that are not mutually exclusive. These categories are: (1) distribution, (2) feeding strategy, (3) roosting habits, (4) population status, (5) threats, and (6) reality.
Distribution
Bats display an array of geographic distributions. Some, such as the hoary bat (Lasiurus cinereus), occur across the North American continent, whereas others, such as Wagner’s mastiff bat (Eumops glaucinus), are found only in small portions of a single state. Other species with limited distribution are restricted to oceanic islands (e.g., Samoan flying fox, Pteropus samoensis) or to
islands of uncommon habitat (e.g., Mexican long-tongued bat, Choeronycteris mexicana, in the Sonoran Desert). In general, taxa with localized distributions are more amenable to monitoring because of logistic considerations, and often are those species more in need of monitoring because of their presumed smaller population sizes. A related concern is the disjunct distribution of some taxa, such as the Virginia big-eared bat (Corynorhinus townsendii virginianus). Although the entire range may appear large, the individual, isolated populations may be highly vulnerable and, thus, more in need of monitoring.
The size of a species range is one consideration, but location of that range in relation to human activity may be equally important. Humans are capable of drastically altering the landscape, and bat populations occurring within areas undergoing rapid change are of particular concern. Large-scale changes, such as urban sprawl, rural development, habitat fragmentation, and artificial conversion of forest types may negatively impact bat populations by altering roosting and foraging habitat (Carter and others, 2003). For example, in the southeastern U.S., a rapidly expanding human population coupled with fragmentation and loss of bottomland hardwood forests (Carter and others, 2003; Clark, 2003) may signal a need for monitoring activities in that region.
Feeding Strategy
Bats in the U.S. and its territories have three broad feeding strategies: insectivory, nectarivory, and frugivory. Most species are insectivorous, but available data on specific dietary items vary considerably across species and season (e.g., Ross, 1961; Black, 1974; Whitaker, 1972, 1988, 1995). Even for those taxa that have been studied in greatest detail, dietary components generally have been identified only to the level of order and, occasionally, family. To better understand the role of bats in their ecosystems or their economic value to forestry or agriculture will require identification of prey to the level of genus and species. Detailed studies have shown the economic importance of at least two species of North American bats that prey on crop pests. The Mexican free-tailed bat (Tadarida brasiliensis) preys on corn earworm moths [Helicoverpa zea (McCracken and others, 1997)], and the big brown bat (Eptesicus fuscus) consumes large numbers of cucumber beetles (Diabrotica spp.), the larvae of which are the destructive corn rootworm (Whitaker, 1995). Because most bat communities in the U.S. are insectivorous and the diet of most species is so poorly understood, prioritizing monitoring needs based on diet does not seem reasonable for most parts of the country.
There are only three nectarivorous species (Leptonycteris curasoe, Leptonycteris nivalis, and
PART II 259
Choeronycteris mexicana) and one frugivorous species (Artibeus jamaicensis) that occur in the U.S., although several others are found in various Pacific and Caribbean territories (see also Working Group A, “Pacific Island Fruit Bats” and “Southwestern Pollinators: subgroup reports). Nectarivorous species are functionally important in their ecosystems because of their role in pollinating various plants. For example, the three species found in the U.S. are important pollinators of columnar cacti and paniculate agaves, even though they spend only a portion of the year in the southwestern part of the country (Fleming and others, 2003). Nectarivorous species often eat fruit and function as seed dispersers, in addition to their role as pollinators. Similarly, frugivores are functionally important, acting as seed dispersers and occasionally as pollinators for a variety of tropical plants. On some Pacific Islands, pteropodid bats are responsible for dispersing the seeds or pollinating the flowers of more than 50% of the species of native woody plants (Fujita and Tuttle, 1991; Banack, 1998). In areas where the ecological or economic importance of bats has been demonstrated, feeding strategy is one factor that might be considered when prioritizing monitoring needs.
Roosting Habits
Roosting habits of bats are highly varied, but in general, roosting sites can be categorized as either “natural” or “anthropogenic” (Pierson, 1998). Natural roosts include caves, rock crevices, and trees. Trees, in turn, provide roosting sites underneath loose bark, in cavities or crevices, or in the foliage. Anthropogenic roosts include buildings, bridges, and mines, among others. Some species of bats are roost specialists and are restricted to only one or few types of roosts; for example, gray bats (Myotis grisescens) roost only in caves throughout the year. Other species, in contrast, are generalists, using different roost types at any one time of the year (e.g., big brown bats use trees, bridges, and buildings in summer and caves, mines, and buildings in winter).
In the past, most monitoring efforts focused on roosts, and today, roosting habits are still factors to consider when deciding which species or population to monitor. A species that uses only one type of uncommon roost is predictable in time and space, potentially simplifying the monitoring task (e.g., California leaf-nosed bat, Macrotus californicus, in geothermally heated mines). In addition, dependency on an uncommon type of roost makes an extreme specialist more susceptible to population declines, thus making monitoring more critical. Species that rely on roosting sites that are common in the environment may be difficult to monitor, even if they
260 INFORMATION AND TECHNOLOGY REPORT–2003--0003
“specialize.” For example, hoary bats only roost in the foliage of trees, but potential roost trees often are abundant and widely dispersed across the landscape, making it difficult to locate, let alone monitor, populations of such a species (see also Working Group A, “Over- Dispersed Bats” subgroup report).
At least three aspects of roosting behavior--social grouping, movement among roosts, and intersexual differences--must also be considered when developing monitoring priorities. Some species (e.g., the lasiurines) are solitary, some form small colonies containing a few hundred individuals or less (e.g., Rafinesque’s big-eared bat, Corynorhinus rafinesquii), and others aggregate in the millions (e.g., Mexican free-tailed bat). A monitoring program may be more successful if based on a species that roosts in moderate-to-large colonies because of the relative ease in detecting such roosts and the fewer sites that need to be monitored. (See also Working Group A, “Colonial Bats” subgroup report.)
Some bats, particularly species that live in trees, tend to change roosts frequently (Lewis, 1995). Female Indiana bats (Myotis sodalis), for example, change roosts about every 3 days. A group of these bats may use more than 17 different trees in a single maternity season (Kurta and others, 1996). Such roost-switching behavior makes the monitoring task extremely difficult because of the unpredictability of the bats in space and time.
To complicate matters even further, males and females of many species often exhibit different roosting behaviors. Adult female little brown bats (Myotis lucifugus) typically roost in summer maternity colonies that contain more than 95% females, whereas adult males generally are solitary (Barbour and Davis, 1969). If the goal of the monitoring program is to analyze long-term trends for an entire population, then a monitoring procedure that focuses on only one sex may not yield the desired results.
Population Status
Bats as a group may rank as the most endangered land mammals in the U.S. (Tuttle, 1995), with eight species or subspecies classified as endangered and others classified as candidates for listing or considered species of concern. Today, population status (i.e., endangered, threatened, etc.) is often the first, and occasionally the only, consideration in prioritizing monitoring and conservation needs. Although convenient, the practice of solely relying on government-designated status to prioritize species for monitoring may not be justified. For example, the gray bat is classified as endangered by the
federal government, but it is well on its way to recovery (M.D. Tuttle, oral commun., 1999). Establishing a new monitoring program for this species, simply because it is endangered, may not be warranted. Other species, such as the Indiana bat, may be so imperiled (U.S. Fish and Wildlife Service, 1999) that immediate, direct measures are more likely to benefit the species than a long-term monitoring program that may not produce results for years. Finally, a monitoring program may better benefit unlisted species (e.g., small-footed bat, Myotis leibii, or red bat, Lasiurus borealis), providing data needed to prevent such taxa from being listed in the future.
Threats
More important than a government-designated status may be the actual threats to continued survival of a species or population. Potential threats to bats may be direct or indirect (Tuttle and Stevenson, 1982; Pierson, 1998). Direct destruction includes, among other things, hunting for food (Rainey, 1998; Utzurrum and others, 2003), extermination from building roosts (Cope and Hendricks, 1970), and wanton killing (Tuttle, 1995). Indirect destruction may not be as obvious as direct killing, but for many species, indirect threats potentially have greater impact. Many indirect threats are ecological in nature and relate to water, food, and roosts.
Mining operations indirectly kill bats that drink from leaching ponds containing cyanide (Clark, 1991; Clark and Hothem, 1991). Changes in water quality impact the prey of bats (Vaughan and others, 1996) and may partly explain decreased species diversity of bats in urban areas (Kurta and Teramino, 1992). Pesticides that enter the food chain result indirectly in death or decreased reproductive success (Clark, 1981, 1988), and many other chemicals, such as environmental estrogens (MacLachlan and Arnold, 1996), may have deleterious, but currently undiscovered, effects on bats. Food chains may be disrupted if foraging habitat is destroyed or modified, leading to a decline in bat populations (Brown and others, 1993, 1995). Reproductive success decreases after maternity colonies are excluded from buildings (Brigham and Fenton, 1986), and closure of abandoned mines indirectly causes decreased survival or reproductive success by eliminating maternity and hibernation sites (Tuttle and Taylor, 1994). Our purpose is not to list every possible source of mortality (Tuttle and Stevenson, 1982; Pierson, 1998) but to illustrate the different ways in which bats are affected by human activity. Species or populations with clearly defined threats may be more in need of monitoring programs than other groups.
Reality
The feasibility and eventual success of bat-monitoring programs depend on making sound biological choices, having appropriate statistical techniques (see Working Group A report; Sauer, 2003), and securing appropriate resources, such as personnel, equipment, and funds. Any monitoring program requires workers in the field and a program demanding a large number of highly skilled workers may be more difficult to implement than one designed to use volunteers with minimal training (Walsh and others, 2003). Similarly, technologically simple programs may be less expensive and easier to implement. On the other hand, some projects may have to wait development of technological innovations or new statistical methodology.
Most personnel and equipment problems may be overcome (at least in theory) by increased levels of funding, but in reality, budgets are rarely adequate. Funding for any monitoring program is influenced by economic factors, legal considerations, and public opinions. Projects with demonstrated effects on agriculture or forestry are more likely to be funded. Legal mandates, such as the Endangered Species Act and the National Environmental Policy Act, can bias which species is monitored and where. Public opinion can influence whether or not private organizations or government agencies will fund a particular program. A positive public attitude also may lead to a greater number of volunteers for a monitoring program, as well as increased donations to private or government agencies that ultimately may sponsor bat-monitoring programs (see Working Group C report, this volume). In contrast, negative attitudes, such as those fostered by some public health agencies (Tuttle, 1999), may affect the ability to obtain funds or volunteers for any monitoring program dealing with bats. Although, in a perfect world, science should direct priorities, practical considerations (funding, equipment, personnel) are unavoidable.
Concluding Comments
The decision as to which species or population to monitor is complex, and one must consider a range of biological and practical considerations. Unfortunately, there is no single set of guidelines that can be used with every bat community in every part of the country. Specific criteria used to prioritize species for monitoring will depend on the goals of the program, the species involved, and the scale of the program (national vs. local).
PART II 261
Monitoring programs are essential for effective conservation and management of bat populations, but the details of any program, including selection of species, must be tailored for each situation.
WWWWWorking Group C. Existingorking Group C. Existingorking Group C. Existingorking Group C. Existingorking Group C. Existing Information and ProgramsInformation and ProgramsInformation and ProgramsInformation and ProgramsInformation and Programs to Monitor Bat Populationto Monitor Bat Populationto Monitor Bat Populationto Monitor Bat Populationto Monitor Bat Population
TTTTTrends: Utility and Coverage ofrends: Utility and Coverage ofrends: Utility and Coverage ofrends: Utility and Coverage ofrends: Utility and Coverage of Current Efforts and PotentialCurrent Efforts and PotentialCurrent Efforts and PotentialCurrent Efforts and PotentialCurrent Efforts and Potential
Expansion in ScaleExpansion in ScaleExpansion in ScaleExpansion in ScaleExpansion in Scale
Working Group Members: Norita Chaney, Alice Chung-MacCoubrey, Rick Clawson, Laura Ellison (Rapporteur), Steve Fancy, Tom O’Shea (Leader), Paul Racey, John Sauer, and Allyson Walsh
Overview
Participants submitted a number of issues for consideration under this topic in advance of the workshop. These issues generally fell into four broad categories: organizational and implementation issues, design and analysis issues, programmatic and policy issues, and data management issues. Based on the presentations at the overall meeting and results of the panel discussion, we concluded that expanding use of existing information to estimate bat population trends on a broad scale presents difficult sampling and design challenges that could not be fully explored in the available time. The group instead focused on making recommendations on five issues that are important precursors to consideration of future expanded-scale bat monitoring programs. These issues include: (1) the current lack of organization of existing programs and information on monitoring bat populations in the U.S.; (2) necessary analytical considerations for monitoring bats on an expanded or national scale; (3) lack of a unifying mandate or legislative foundation for bat conservation; (4) promoting public awareness and gaining support for such a mandate (e.g., a National Bat Awareness Week); and (5) optimizing information obtained from marked bats (including existing efforts as well as future studies).
The Working Group recognized the importance of the limited existing information on bat population status, and the value of compiling and synthesizing this information on a national scale in efforts such as the U.S. Geological
262 INFORMATION AND TECHNOLOGY REPORT–2003--0003
Survey’s Bat Population Database. The group also recognized that although well-designed frameworks for using existing information to measure bat population trends with statistical accuracy and precision have been lacking, there are qualitative historical comparisons, index-based studies, and anecdotal but reliable accounts of declines that provide a strong imperative for bat conservation. Nonetheless, development of more objective and scientifically reliable methods of monitoring trends in bat populations remains an important goal for providing a national perspective on bat conservation needs and successes. The Working Group also recognized, however, that further advances in technology, statistical design, and funding support would be necessary to create an expanded or national bat monitoring program that can meet this goal.
A network of information flow will be important for stimulating and recognizing such necessary advances, and for communicating information that may be useful in identifying situations needing conservation attention. Thus, our first recommendation is the development of a web-based clearinghouse of information on bat conservation-related research. Because bat populations are of significance to agriculture and related segments of the U.S. economy and national biodiversity, monitoring bat populations is clearly desirable. Therefore, our second set of recommendations points out three areas of consideration necessary to establish a scientifically defensible bat population monitoring program: increasing basic ecological information on bats (especially rare species), developing means to estimate detectability at sample sites, and developing appropriate spatial sampling designs (see also Working Group A report, this volume). Monitoring bat population trends, however, has no specific national mandate. In a third issue statement, therefore, we call attention to the importance of bat populations in the U.S., the movements of bats across state and international boundaries, and the desirability of establishing formal provisions for bat conservation that can include population monitoring. We highlight legal steps already completed in this regard by other nations, and provide some initial suggestions regarding the U.S. One such step would be to establish a National Bat Awareness Week to help increase public support for bat conservation, as described in our fourth issue statement. Finally, because much valuable population information can be obtained through properly designed mark and recapture studies (see also Working Group A report, this volume), we provide specific recommendations on developing a clearinghouse approach to making technical information on this topic available, and on additional considerations for the design of needed research on marked bats. Our Working Group did not explore data management issues, one of the four broad categories of
issues submitted in advance by participants, because we felt it would be premature to do so pending further advances in the other areas we considered.
Working Group C Issue 1. Lack of Organization of Existing Programs
and Information
Issue Description and Rationale
Why is this issue important? Although the importance of bats to healthy ecosystems is not as well recognized by the general public as it is to scientists, declines in bat populations have been an important concern for resource managers and researchers. However, the breadth of the problem of declining bat populations is not scientifically well understood because current efforts to track declines include different methods and protocols that may lack compatibility and comparability. Considerable information already exists that can assist in identifying data gaps and conservation needs, but this information is stored in various locations. It is important that researchers and resource managers be aware of existing information and expertise on bat research and monitoring in order to use knowledge that has already been obtained. New funding is difficult to secure, and given that there is no legislative or other mandate for any group or agency to coordinate and fund a nationwide bat-monitoring program, it is important to make the most of existing information and to be effective in the use of available funds.
What is generally known about this issue? Considerable information related to abundance and distribution of bats exists. This information is scattered among numerous organizations in the form of databases and reports, as well as in scientific publications. This and related information such as directories of expertise and sources of local knowledge could be brought together through a clearinghouse (a central source for the organization and distribution of information related to bat populations).
What in general needs to be determined to resolve the critical uncertainties surrounding the issue? A clearinghouse should be developed that solicits and provides information from bat researchers, land management agencies, conservation organizations, and others. The information should provide a clear picture of what is known, who is doing the research, and where gaps exist. It should allow users the opportunity to interact and facilitate greater cooperation and collaboration among research scientists and resource managers.
What are the consequences if this issue is not addressed? General problems with declining bat populations at a landscape or regional scale may not be
identified and declines may occur from which it will take bats many years to recover, with consequent ecological and economic costs. Important data gaps may not be identified if this issue is not addressed, and there will be fewer opportunities for comparing data and adding spatial dimensions to monitoring programs. Interpretation of data (putting site-specific data into context) will be difficult with a lack of communication and information-sharing among various agencies and scientists. Funds may be expended needlessly in duplicating information or repeating mistakes made by others. Management agencies may not direct funding optimally if they are unaware of who the subject experts are and the level of existing information.
Means to Resolve the Critical Uncertainties Surrounding the Issue
A web-based clearinghouse should be developed to provide a mechanism for identifying existing information and key individuals and organizations involved in bat conservation and research. Provisions should be made to regularly update the information. The clearinghouse could include the following components:
Directory of organizations and individuals in bat conservation and research. This directory would include names, addresses, phone numbers, e-mail addresses, and a short description of the role or interest of various organizations and individuals, such as the regional bat working groups, bat recovery team members, and scientists involved in bat research. This directory would explain the purpose of each of the groups.
Metadata database. The clearinghouse would not contain raw data from various studies, but would give a description of data sets and various studies and management efforts that could be searched using keywords. For a particular data set (e.g., exit counts at a particular cave over a 9-year period), the entry in the database would include how the data were collected, the format of the data, where it is stored, and who to contact. The database could also describe current pertinent research projects by summarizing the study objectives, name, and contact information for the investigator, scheduled completion dates, and expected products.
Protocol database. The clearinghouse could provide electronic copies of existing sampling protocols being used for bats, including example data collection forms and recommendations for analyzing and presenting the data. Descriptions of state-of-the-art sampling and analytical methods could also be provided here.
Bat population database (BPD). The BPD that is being developed by the U.S. Geological Survey should be part of the clearinghouse.
PART II 263
Searchable bibliography. References on bats could be added to the database. The clearinghouse could also point to internet resources such as Cambridge Abstract Services, the Institute for Scientific Information, and several other indexing sources.
Band or PIT tag database. There is no centralized organization for assigning band numbers or PIT tag numbers used on bats, such as the service provided by the U.S. Fish and Wildlife Service for bird banding. The clearinghouse could be used to inform others about ongoing tagging projects and to facilitate exchange of information on marked bats (see Issue 5, this Working Group Report).
Bat sound recording database. A database linked to the clearinghouse could identify where reference collections and archived records of bat calls are stored.
Other links. Links to other databases and web sites that contain information pertinent to bat conservation and research (e.g., other agency monitoring programs, weather data, threatened and endangered species databases, Integrated Taxonomic Information System).
Suggestions Regarding Existing Monitoring and Research Programs
Existing monitoring and research programs should strive to identify their activities by participating in an informally linked, web-based clearinghouse. It may be possible to develop and fund portions of the clearinghouse through the U.S. Geological Survey’s National Biological Information Infrastructure (NBII). This program already serves similar databases for other natural resources, and the objectives of the clearinghouse fall within the mission of the NBII. Temporarily, the group at the Fort Collins Science Center (fomerly the Midcontinent Ecological Science Center) may be able to develop a simple prototype to start the clearinghouse on a limited scale. The Integrated Taxonomic Information System (ITIS), an interagency database that provides taxonomic standards for sharing information on species, may help with problems of nomenclature.
Working Group C Issue 2. Analytical Considerations for a National Bat
Monitoring Program
Issue Description and Rationale
Changes in bat populations have ramifications for agricultural and forestry segments of the U.S. economy, ecosystem function (including pollination of important vegetation in the American Southwest), and conservation of national biological diversity. Currently, attempts to
264 INFORMATION AND TECHNOLOGY REPORT–2003--0003
monitor bat populations are very fragmented, concentrate on just a few species that are endangered or threatened, or involve very local independent efforts. There is need for status information on a wider range of U.S. bat species. For example, in 1994 the U.S. Fish and Wildlife Service named 24 species or subspecies of bats as Category 2 Candidates for listing under the U.S. Endangered Species Act, based largely on an absence of population status and trend information (U.S. Fish and Wildlife Service, 1994). These taxa have subsequently been considered “species of concern” since the elimination of Category 2 classifications (U.S. Fish and Wildlife Service, 1996).
A need clearly exists for bat monitoring programs on a national scale. National level monitoring of bat populations could provide broader perspectives for conservation priorities, prevent duplication of effort, and promote standardized collection of data. Monitoring bat populations on a national scale would help identify bat population changes that may not be detected by scattered and uncoordinated local efforts. Conservation actions in response to local monitoring efforts may not otherwise occur fast enough to prevent significant widespread losses, whereas establishing that stability or growth in populations is occurring over broad areas may help change priorities when small, local declines are observed.
However, any such program must be properly designed to provide reliable, scientifically defensible information that is more spatially encompassing than results that have been obtained thus far (see also Working Group A, “Colonial Bat Species” subgroup report, Issue 4, this volume). There are three major considerations for developing surveys for monitoring bat population trends on a national scale:
• Needs for basic information on ecology and life history of rare species, and criteria for selecting species to be monitored (see also Working Group B report, this volume).
• Estimation of detectability at sample sites. In general, bat studies have not included estimation of detectability when estimating population attributes, but instead have used indices of abundance (see also Working Group A report, this volume). Indices do not provide the most reliable data because their accuracy in reflecting the underlying population trends is usually unknown.
• Spatial sampling. Studies of U.S. bats, in general, have not adequately sampled the entire population of a species. Instead, surveys typically occur at single (or few) sites and the results cannot be extrapolated to entire populations across a species range.
Why are these sampling issues important? Although a number of indices to bat abundance have been
proposed, few provide truly reliable information by incorporating methods of estimating detectability. Similar to initial reports of amphibian population changes several years ago, much of the bat population status information is anecdotal or based on counts or indices that may not reliably reflect the underlying populations. Much of the bat population data are also local, reflecting populations at individual sites without indications of how well these represent regional populations. Consequently, patterns of population change estimated from indices at local sites may not reflect what is truly occurring with the regional population. Because bats migrate, generally have widespread geographic distributions, and pose unique problems for population estimation, a statistically defensible survey must be developed before monitoring can be implemented on a national scale. These programs would have to provide information at geographic scales relevant to managers, such as individual sites, regions, and states.
What is generally known about these issues? In recent years, a variety of statistical methods have been developed for estimating wildlife abundance, density, survival, and other population parameters. Most of these developments have not yet been applied to bats. Capture-recapture methods in particular provide opportunities for estimation of colony-specific population size, survival, and other demographic parameters (see also Working Group A report, this volume). A number of existing techniques developed for abundance estimation such as distance or multiple observer methods might also allow estimation of bat detectability rates. Large scale surveys of other wildlife, such as the North American Breeding Bird Survey (BBS), provide an enormous amount of information regarding the virtues and flaws of nationwide programs. Documented deficiencies of these surveys should be avoided in implementation of new monitoring programs (Sauer, 2003). In particular, detectability should be estimated during the survey, sampling frame issues (such as potential biases in estimation associated with roadside counts) can be avoided, and statistical designs such as variable probability sampling or dual-frame sampling can be used to develop cost-effective sampling.
What needs to be determined to resolve the critical uncertainties surrounding the issues? Spatial sampling schemes need to be developed by exploring alternative designs, including dual-frame sampling and variable probability sampling. Often, these designs will allow complete coverage of important sites, but also provide unbiased estimates from the sampling of less important sites at lesser intensities. Development of appropriate designs will require elaboration of geographic information on sampling frames such as caves or other habitats that can be used to develop strata.
PART II 265
Appropriate population estimation methods are still poorly defined for bats. Development of these methods will require pilot studies over limited numbers of sites and areas to determine feasibility and obtain pilot data for design of regional scale surveys. Often, collection of ancillary data as covariates will be critical to allow assessment of correlates of changes in survival and population size. These covariates may be at the geographic scale (such as land-use data), or the local scale (such as roost temperature changes).
Surveys will require considerable planning and design based on an understanding of species life histories and other factors. GIS can be used in designing sampling frames and displaying results such as distribution data. Whenever possible, simplicity should be encouraged to allow maximum acceptance of results, and clarity of presentation should be encouraged while maintaining the ability to answer management questions in a statistically defensible manner.
What are the consequences if the issue is not addressed? Without development of these surveys, it will be impossible to estimate trends for populations of bats on a regional or national scale.
Means to Resolve the Critical Uncertainties Surrounding the Issue
Before a national-scale bat monitoring program can be developed, advances must be made in methods of enumerating population estimates of bats, beginning at local and colony scales, and these methods need to be applied in an appropriate sampling design. Working Group A has a number of recommendations involving research needs for improving estimation of population size and trend of bats. In addition, for many species of bats in the U.S. and territories, additional basic natural history and distribution information may be necessary for developing adequate monitoring designs and interpreting results of sampling.
Suggestions Regarding Existing Monitoring and Research Programs
Recognizing the absence of a structured national scheme, the group recommends that ongoing efforts should improve communication and coordination in order to detect broader scale conservation problems. Development of a worldwide web-based clearinghouse (as recommended under Issue 1 by this Working Group) should help in this regard, as should efforts to maintain and improve communication among endangered species coordinators and existing networks of informal state and regional bat Working Groups.
The following suggestions should also be explored to help resolve analytical and sampling issues involved with monitoring bat populations.
• Ongoing surveys/monitoring programs for bats should be evaluated to determine whether they can provide pilot data for regional surveys.
• A number of surveys exist that provide information on population change for bats. For example, Indiana bats are monitored every 2 years at certain key hibernacula in Missouri, Indiana, Kentucky, and Illinois. These surveys should be analyzed and critically evaluated. Methods that provide reliable information can be used as models for future survey development for similar species in similar regions. Coordinators of the surveys should be encouraged to publish results in peer-reviewed journals. Information from other programs that have developed well-planned sampling designs and protocols, such as those developed in the U.K. and The Netherlands, should also be evaluated.
• Detectability issues should be reviewed. Development of regional surveys that provide reliable data requires that new methods be developed and implemented to estimate detectability at sample sites. New technological tools (including electronic devices in developmental phases and bat detectors which are currently used only for obtaining index information) should be evaluated as sources of reliable population information. Infrared video recorders should be experimented with to visualize bats recorded by bat detectors. However, pending further developments in acoustic sampling, new sampling efforts should focus on direct estimation of numbers of bats rather than counting bat echolocation calls. Mist netting should also be evaluated as a source of reliable information on bat populations. Finally, although population estimation may not be feasible using count or index data such as these, species richness may be a useful parameter of interest that can be estimated using count statistics and modern sampling designs (Nichols and Conroy, 1996).
• Sampling frames that allow variable probability sampling of sites known to be of importance to bat populations of monitoring concern should be developed. GIS is useful in summarizing existing information (allowing display of maps of survey points) and should be used in designing sampling frames.
266 INFORMATION AND TECHNOLOGY REPORT–2003--0003
Working Group C Issue 3. Lack of a Unifying Mandate or Legislative Foundation for a
National Bat Conservation Program
Issue Description and Rationale
Why is the issue important? Bats are of tremendous economic importance to U.S. agriculture and forestry. They play important functional roles in ecosystems and are important components of our national biological diversity. Bats migrate across U.S. state and international boundaries. A national program and transboundary agreements among nations neighboring the U.S. are needed to appropriately manage for many U.S. species of bats.
What is generally known about the issue? Currently there is no formal legal mandate for bat conservation in the U.S. However, there are examples of conservation mandates in Europe and the U.S. that may be used as models and can provide lessons on which to draw. The European Bats Agreement (Agreement on the Conservation of Bats in Europe, London, 1991) under the auspices of the Convention on Migratory Species of Wild Animals, Bonn, 1979, has fostered monitoring of bat populations by some countries. (Although Appendix I to the Bonn Convention identifies the common U.S. migrant Tadarida brasiliensis among migratory mammals, the U.S., Mexico, and Canada are not among the 65 parties to this international agreement.) The European Union Habitats and Species Directive addresses both sites and species and also applies to bats. The European Bats Agreement was developed because bats whose ranges and migrations crossed national boundaries were known to be under threat. It was signed in 1999 and put in force to various degrees by 13 nations. The agreement raises consciousness regarding bat conservation and stipulates protection for bats, their roosts, and important feeding areas, but it does not mandate or fund population monitoring of bats. The various parties to the agreement instead carry out monitoring independently. As a result, there are different levels of activity in different countries. The U.K. has the most intense program, and has allocated £500,000 to their bat monitoring program over a 5-year period. This program uses volunteers to gather data (see Walsh and others, 2003). The existence of a cadre of volunteers was a significant factor in the decision of the Department of Environment, Transport, and the Regions to allocate this funding. After the initial 5-year funding period is concluded, the Statutory Nature Conservation Organizations (England, Scotland, Wales, and Northern Ireland) will continue partial funding; partners are being sought to augment these funds. The Netherlands also has an active bat monitoring program that started with an
atlas approach. Other European countries have small numbers of personnel devoted to bat monitoring.
The Convention on Biological Diversity (under the Rio Convention) provides that signatory countries obligate themselves to maintain biological diversity. With time this could provide some foundation for bat conservation in the U.S. The U.K., for example, has drafted species action plans under the auspices of this Convention and is seeking corporate sponsorship to underwrite the costs of the plans. The U.S. signed the Convention in 1993 but has not ratified it. Mexico and Canada have both signed and ratified the Convention.
In the U.S., there are two models of long-term wildlife monitoring at a national scale: the Breeding Bird Survey sponsored by the federal government, and the Christmas Bird Count conducted by the Audubon Society. In the U.K., the British Trust for Ornithology also has a volunteer network that carries out annual bird counts. In some schemes, the volunteers pay the Trust an annual fee and, in return, receive newsletters and reports. The British Mammal Society, consisting of both professionals and amateurs, also sponsors surveys.
What in general needs to be done to resolve the critical uncertainties? Greater consideration should be given to strengthening bat conservation efforts in the U.S. through formal legislation and treaties. Proposals for international conservation of some bat species as transboundary migrants should be supported through the joint U.S.-Mexico-Canada Commission on Environmental Cooperation. Programs should include a component earmarked for in-depth consideration of design and implementation of bat population monitoring.
Several domestic legislative acts and international agreements have elements that could be used as examples or models for drafting national bat conservation legislation. The U.S. Marine Mammal Protection Act of 1972 currently protects pinnipeds, cetaceans, sirenians, sea otters, marine otters, polar bears, and the ecosystems in which these species occur (Baur and others, 1999). Over the years, funding through this mandate has stimulated considerable research in the design and implementation of population monitoring methods for marine mammals. The Migratory Bird Treaty Act also could serve as a model. In the U.K., the Wildlife and Countryside Act protects all species of bats as well as their roosts. No other group receives this level of protection in the U.K. An important benefit of this Act was that it focused attention on two species of the horseshoe bat and resulted in censusing of their populations.
Two U.S. initiatives may indirectly provide initial steps towards a national bat monitoring program. Recent legislation and funding for the National Park Service is mandating a monitoring program for biological resources (which can include bats) on National Park Service
properties. The Environmental Protection Agency has “Star Grants” that can fund regional monitoring programs. These may be sources that could support design and development of pilot bat monitoring projects.
What are the consequences of not addressing the issue? Reductions in abundance of common species of bats will have economic consequences to agriculture, forestry, and perhaps public health (declines in bats as consumers of insect vectors of disease). Under the current lack of unified efforts and firm mandates, there is also a higher probability of losing rare species of bats before critical knowledge on basic ecology and population status can be gained, particularly in comparison to more common species. Rare species will likely need greater resources to monitor adequately, and thus are at greater risk of being lost before adequate population data can be acquired, given the existing level of resources available to devote to bat conservation. Loss of species or significant populations of bats on the public lands, or of those designated as having special conservation status by resource management agencies, will signal a failure in stewardship.
Means to Resolve the Critical Uncertainties Surrounding the Issue
The Working Group recommends that nongovernment organizations and other interested parties consider proposing bat conservation programs at a national level, either through support for new legislation and budget initiatives, or through new provisions in existing legislation. Support should also be given for international agreements and ratification of treaties that would include measures for bat conservation. Advantages of formal legislation would include recognition of the importance of bats as part of our national fauna and authorization of funding for bat conservation, aspects of which can involve well-designed programs to monitor bat populations. Professional and scientific societies should be encouraged to support such initiatives. The American Society of Mammalogists should be asked to consider a resolution calling for the development of legislation that would support national bat conservation and monitoring programs. Other professional societies (e.g., The Wildlife Society, the Society for Conservation Biology), museums, conservation groups, and similar organizations and institutions should also be invited to support such initiatives.
Suggestions Regarding Existing Monitoring and Research Programs
Current efforts to monitor bat populations and improve techniques for estimating bat population trends should
PART II 267
be continued and expanded. Ecological monitoring and research programs now concentrating on other biological resources should expand their focus to include bats. As examples: bat conservation on public lands should be a priority for public land management agencies at all levels; the National Science Foundation’s Long-Term Ecological Research sites should include components related to bat diversity, distribution, and abundance. Because the existence and distribution of many species of bats are closely tied to ambient temperatures, monitoring of bat populations and modeling bat population and distribution responses to temperature shifts should be proposed under various global change research programs.
Working Group C Issue 4. National Bat Awareness Week
Issue Description and Rationale
Suggestions have been made by workshop participants and others (e.g., Western Bat Working Group) about designing and implementing a National Bat Survey Week, and there are some ongoing local efforts in this regard. Considering the underlying unresolved analytical issues in measuring bat population trends, the results of such an effort may not at this time provide reliable information. The public and resource managers could easily misunderstand the intent of such activities with raised expectations that reliable bat population monitoring was taking place. However, the idea of a National Bat Awareness Week for conservation education is an excellent concept that would meet part of the underlying motivation for a National Bat Survey Week.
Means to Resolve the Critical Uncertainties
A National Bat Awareness Week could be designed as a period in which press releases about bats are issued, public education programs and lectures are scheduled, and groups are taken to the field by knowledgeable bat biologists. Events could range from group observations of colony emergences at well known sites where disturbance by observers is not of concern (e.g., Carlsbad Caverns National Park, the Congress Avenue Bridge in Austin, the University of Florida Bat House) to echolocation detector demonstrations at evening programs in parks and refuges, and lay groups accompanying bat biologists on netting trips. Such activities and the favorable media attention they would engender could help counter negative images of bats currently being portrayed through the media, and might promote public support for broader mandates for bat conservation.
268 INFORMATION AND TECHNOLOGY REPORT–2003--0003
Suggestions Regarding Existing Monitoring and Research Programs
A National Bat Awareness Week can be promoted as an informal collaboration among many groups, including conservation agencies, non-government organizations and many local groups, schools, libraries, museums, and volunteers. With media attention the amount of activity will likely increase substantially over the first few years. Successful examples elsewhere already exist, including European Bat Night and National Bat Week in England, coordinated by the Bat Conservation Trust. The North American Bat Conservation Partnership (a consortium of interested agencies, non-government organizations, and regional Working Groups) would be an appropriate umbrella under which such an effort could be initiated.
Working Group C Issue 5. Optimizing Information Obtained from Marked Bats
Issue Description and Rationale
In the past, U.S. bat banding efforts, many of which were large scale and involved many thousands of bats nationwide, were largely uncoordinated and occurred with minimal communication among bat researchers. Negative effects of bands and their application were also unknown at the onset of early bat banding activities. Although these studies obtained new and important natural history information about U.S. bats, including gross movement patterns and longevity estimates, they sometimes lacked specific objectives and sampling designs (in some cases, mass banding was conducted at certain sites without any subsequent sampling of the area for recaptures.) However, there is now a major subdiscipline in quantitative ecology that allows the more sophisticated estimation and modeling of animal population parameters based on well-designed mark-recapture statistical principles (e.g., Thompson and others, 1998; Burnham and Anderson, 1999). These new mark-recapture models have yet to be applied thoroughly in bat studies, but their implementation could lead to important new information critical to monitoring bat population trends (e.g., Entwistle and others, 2000).
Discretion and proper technique in the application of bands or tags must be used when designing and implementing mark-recapture studies of bats. Greater communication between bat researchers is also necessary because bats are highly mobile and likely to move in and out of any given study area. Improving the ability of re
searchers to identify marked bats and relay recapture information to the original marker can increase the potential for gaining information from marked bats. The degree to which such information has been gained from past banding efforts has been limited. For instance, the FWS served as a clearinghouse for bat banders for several decades. Although hundreds of thousands of bat bands were distributed to researchers over many years, minimal recaptures or recoveries were reported to the FWS (less than or about 1%). In addition, a moratorium was placed on the use of these aluminum bands on bats in the mid1970’s. Researchers had noticed alarming adverse effects of the bands on some bats and suspected that local population declines were caused by poorly timed banding efforts and band-related injuries. The potentially negative consequences of bands on survivorship and fecundity are reasons to promote discretion in marking bats and to stress proper technique in their application. With indiscriminate marking and lack of communication, the risk of harming individuals and populations is incurred without obtaining the full benefits of mark-recapture efforts based on new statistical theory (e.g., estimates of rates of movements, longevity, survival, effects of management practices and environmental covariates, etc.). Because of the tremendous scientific value of well-designed marked animal studies, we also recommend experimentation with alternative marking techniques, such as PIT tags, that may provide advantages over bands in their application.
Means to Resolve the Critical Uncertainties Surrounding the Issue
Web site clearinghouse on marking techniques and existing marked bat studies. A web site clearinghouse could serve as a centralized resource, providing information and references on proper bat marking techniques and a means for exchange of marking information. Potential information provided by this web site could include a list of contacts (researchers, manufacturers, etc.), a bibliography of related references (e.g., statistical analyses of mark-recapture data, application techniques, and relevant references from other taxa), and a review of mark-recapture practice and theory as they pertain to bats. This review would include information on mark-recapture principles, types of information that can be obtained, proper marking techniques, and the potentially negative impacts of tag/band misuse and poor project planning. A book in preparation tentatively titled, “A practical guide to marking bats” (edited by T.H. Kunz) is an example of the kind of reference that could be highlighted at such a site. This web site might also provide a forum for exchange of information on product performance, methods, recent advances
in statistical techniques, and other mark-recapture related issues.
A second function of this web site would be to serve as a repository for “metadata” on marking projects. From this site, researchers could access information on who has applied marks; where, when, how many, and what types of bands or tags were applied; and what species of bats were marked. (Primary data such as individual tag numbers and attributes of the tagged animals would not be included.) The material provided by this site would be based on the voluntary submission of information by researchers directly to the web site, and would perhaps include existing information in the U.S. Geological Survey’s Bat Population Database. Creating a centralized reference site for bat marking projects maximizes the exchange of information that can be gained from band and tag application. This may be particularly useful when different investigators make recoveries over long distances or time periods, and when different manufacturers of PIT tags or readers may be involved. The web site could assist bat biologists in avoiding use of duplicate band numbers (or colors) and PIT tag numbers and suggest ways of creating unique identifiers.
Needed research on mark-recapture of bats. A critical look at the effects of different banding and marking techniques is needed (see also Working Group A report, this volume). A study or multiple studies should be designed to investigate the specific effects of different marking techniques, such as PIT tags versus bands or other techniques, and how they impact traits critical to bat population dynamics such as survival and reproduction. This might first be conducted on species that are not as sensitive to disturbance as others and are more common and abundant (i.e., Myotis lucifugus or Eptesicus fuscus), and might be carried out in a local geographic area with a large network of roosts (i.e., caves, mines, or buildings). This mark-recapture study could also be designed to answer questions about movements, dispersal, environmental effects, management strategies, survival, population size and trend, etc., depending on the study area and other objectives. Determination of the applicability of current mark-recapture techniques to bats should be made in a scientific and repeatable manner.
Additional considerations. Other issues and questions remain regarding permanent marking of bats in the U.S. Should state and federal agencies be involved in acquiring marking information? Should the use and application of marks to bats be controlled or monitored? If so, by whom? Can useful information still be obtained from past bat banding records? Is this information worth the expense and effort required to track down or enter historic data (e.g., former USFWS bat banding files)?
PART II 269
Should efforts be made to standardize equipment (e.g., PIT tag readers)?
Suggestions Regarding Existing Monitoring and Research Programs
In summary, regarding the management of existing information and the implementation of programs involving marking of bats, we suggest: (1) a web site clearinghouse for mark-recapture information, and (2) further research focusing on the effects of marking techniques on bat populations. These would help enhance the understanding of bat population biology, thereby improving the ability to monitor bat populations and reduce ecological and economic costs associated with declines that might otherwise be poorly detected.
References Cited inReferences Cited inReferences Cited inReferences Cited inReferences Cited in WWWWWorking Group Reportsorking Group Reportsorking Group Reportsorking Group Reportsorking Group Reports
Altenbach, J.S., 1995, Entering mines to survey bats effectively and safely, in Riddle, B.R. ed., Inactive mines as bat habitat: Guidelines for research, survey, monitoring and mine management in Nevada: Proceedings from a Workshop, Reno, Nevada, 21–22, January, 1994, Biological Resources Research Center, University of Nevada, p. 57–61.
Banack, S.A., 1998, Diet selection and resource use by flying foxes (Genus Pteropus): Ecology, vol. 79, p. 1949–1967.
Barbour, R.W., and Davis, W.H., 1969, Bats of America: Lexington, Kentucky, University Press of Kentucky, 286 p.
Baur, D.C., Bean, M.J., and Gosliner, M.L., 1999, The laws governing marine mammal conservation in the United States, in Twiss, J.R., Jr., and Reeves, R.R., eds., Conservation and management of marine mammals: Washington, D.C., Smithsonian Institution Press, p. 48–86.
Black, H.L., 1974,Anorth temperate bat community: Structure and prey populations: Journal of Mammalogy, vol. 55, p. 138–157.
Brigham, R.M., and Fenton, M.B., 1986, The influence of roost closure on the roosting and foraging behaviour of Eptesicus fuscus (Chiroptera: Vespertilionidae): Canadian Journal of Zoology, vol. 64, p. 1128–1133.
Brown, P.E., Berry, R., and Brown, C., 1993, Foraging behavior of the California leaf-nosed bat, Macrotus californicus, as determined by radio-telemetry: Bat Research News, vol. 34, p. 104.
Brown, P.E., Berry, R., and Brown, C., 1995, The California leaf-nosed bat (Macrotus californicus) and American
270 INFORMATION AND TECHNOLOGY REPORT–2003--0003
Girl Mining Joint Venture--impacts and solutions, VI, Glenwood Springs, Colo, Proceedings: Issues and technology in the management of impacted wildlife, Thorne Ecological Institute, p. 54–56.
Brownie, C., Hines, J.E., Nichols, J.D., Pollock, K.H., and Hestbeck, J.B., 1993, Capture-recapture studies for multiple strata including non-Markovian transitions: Biometrics, vol. 49, p. 1173–1187.
Burnham, K.P., and Anderson, D.R., 1999, Model selection and inference: A practical information-theoretic approach: New York, NY, Springer-Verlag, 353 p.
Carter, T.C., Menzel, M.A., and Saugey, D., 2003, Population trends of foliage-roosting bats, in O’Shea, T.J. and Bogan, M.A., eds., Monitoring trends in bat populations of the United States and territories: problems and prospects: U.S. Geological Survey, Information and Technology Report, USGS/BRD/ITR--2003–0003, p. 41–47.
Clark, D.R., Jr., 1981, Bats and environmental contaminants: A review, U.S. Fish and Wildlife Service, Special Scientific Report, Wildlife, vol. 235, p. 1–27.
Clark, D.R., Jr., 1988, Environmental contaminants and the management of bat populations in the United States: U.S. Forest Service General Technical Report, vol. 166, p. 409–413.
Clark, D.R., Jr., 1991, Bats, cyanide, and gold mining: Bats, vol. 9, p. 17–18.
Clark, D.R., and Hothem, R.L., 1991, Mammal mortality at Arizona, California, and Nevada gold mines using cyanide extraction: California Fish and Game, vol. 77, p. 61– 69.
Clark, M.K., 2003, Survey and monitoring of rare bats in bottomland hardwood forests, in O’Shea, T.J. and Bogan, M.A., eds., Monitoring trends in bat populations of the United States and territories: problems and prospects: U.S. Geological Survey, Information and Technology Report, USGS/BRD/ITR--2003–0003, p. 79–90.
Cope, J.B., and Hendricks, D.R., 1970, Status of Myotis lucifugus in Indiana: Proceedings of the Indiana Academy of Science, vol. 79, p. 470–471.
Cryan, P.M., and Bogan, M.A., 2003, Recurrence of Mexican long-tongued bats (Choeronycteris mexicana) at historical sites in Arizona and New Mexico: Western North American Naturalist, vol. 63, p. 314–319.
Dalton, V.M., and Dalton, D.C., 1994, Census protocol for the long-nosed bat (Leptonycteris curasoae): Report to Organ Pipe Cactus National Monument, Contract 1443PX866092081, 20 p.
Eagle, P.C., Gibbs, J.P., and Droege, S., 1999, Power analysis of wildlife monitoring programs: Exploring the tradeoffs between survey design variables and sample size requirements. http://www.pwrc.usgs.gov/resshow/ droege3rs/sa/power.htm.
Entwistle, A.C., Racey, P.A., and Speakman, J.R., 2000, Social and population structure of a gleaning bat, Plecotus auritus: Journal of Zoology (London), vol. 252, p. 11–17.
Fleming, T.H., Tibbitts, T., Petryszyn, Y., and Dalton, V., 2003, Current status of pollinating bats in southwestern North America, in O’Shea, T.J. and Bogan, M.A., eds., Monitoring trends in bat populations of the United States and territories: problems and prospects: U.S. Geological Survey, Information and Technology Report, USGS/BRD/ITR--2003–0003, p. 63–68.
Fujita, M.S., and Tuttle, M.D., 1991, Flying foxes (Chiroptera: Pteropodidae): Threatened animals of key ecological and economical importance: Conservation Biology, vol. 5, p. 455–463.
Gibbs, J.P., 1995, Monitor user’s manual: Department of Biology, Yale University, New Haven, Conn.
Goodwin, B.J., and Fahrig, L., 1998, Spatial scaling and animal population dynamics, in Peterson, D.L. and Parker, V.T., eds., Ecological scale: Theory and applications, New York, Columbia University Press, p. 193–206.
Hayes, J.P., 2000, Assumptions and practical considerations in the design and interpretation of echolocation-monitoring studies, in Gannon, W.L., O’Farrell, M.J., and Bogdanowicz, W., eds., Echolocation detectors in field studies of bats: Acta Chiropterologica, vol. 2, p. 225–236.
Hestbeck, J.B., Nichols, J.D., and Malecki, R.A., 1991, Estimates of movement and site fidelity using mark-resight data of wintering Canada geese: Ecology, vol. 72, p. 523–533.
Kunz, T.H., ed., 1988, Ecological and behavioral methods for the study of bats: Washington, D.C., Smithsonian Institution Press, 533 p.
Kurta, A., and Teramino, J.A., 1992, Bat community structure in an urban park: Ecography, vol. 15, p. 257–261.
Kurta, A., Williams, K.J., and Mies, R., 1996, Ecological, behavioural, and thermal observations of a peripheral population of Indiana bats (Myotis sodalis), in Barclay, R.M.R. and Brigham, R.M., eds., Bats and forests symposium, October 19–21, 1995, Victoria, British Columbia, Canada: Research Branch, British Columbia, Ministry of Forests, Working Paper, No. 23, p. 102–117.
Lewis, S.E., 1995, Roost fidelity of bats: A review, Journal of Mammalogy, vol. 76, p. 481–496.
MacLachlan, J.A., and Arnold, S.F., 1996, Environmental estrogens: American Scientist, vol. 84, p. 452–461.
McCracken, G.F., Lee, Y.F., Westbrook, J.K., Balsley, B.B., and Jensen, M.L., 1997, High-altitude foraging by Mexican free-tailed bats: Vertical profiling using kites and hot air balloons: Bat Research News, vol. 38, p. 117.
Navo, K.W., 1995, Inactive mines as bat habitat: Guidelines for research, survey, monitoring, and mine management
PART II 271
in Nevada, in Riddle, B.R., ed., Guidelines for external surveys of mines for bat roosts: Proceedings from a workshop, Reno, Nevada, 21–22 January 1994, Biological Resources Research Center, University of Nevada, p. 49–54.
Nichols, J.D., and Conroy, M.J., 1996, Estimation of species richness, in Wilson, D.E., Cole, F.R., Nichols, J.D., Rudran, R., and Foster, M.S., eds., Measuring and monitoring biological diversity, Standard methods for mammals: Washington, D.C., Smithsonian Institution Press, p. 226-234.
Palmeirim, J.M., and Rodrigues, L., 1995, Dispersal and philopatry in colonial animals: The case of Miniopterus schreibersii: Symposia of the Zoological Society of London, vol. 67, p. 219–231.
Pierson, E.D., 1998, Tall trees, deep holes, and scarred landscapes, conservation biology of North American bats, in Kunz, T.H., and Racey, P.A., eds., Bat biology and conservation: Washington, D.C., Smithsonian Institution Press, p. 309–325.
Rainey, W.E., 1995, Tools for low-disturbance monitoring of bat activity, in Riddle, B.R., ed., Inactive mines as bat habitat, Guidelines for research, survey, monitoring and mine management in Nevada: Proceedings from a workshop, Reno, Nevada, 21–22 January, Biological Resources Research Center, University of Nevada, Reno, p. 62–71.
Rainey, W.E., 1998, Conservation of bats on remote Indo-Pacific islands, in Kunz, T.H., and Racey, P.A., eds., Bat biology and conservation: Smithsonian Institution Press, Washington, D.C., p. 326–341.
Ross, A., 1961, Notes on food habits of bats: Journal of Mammalogy, vol. 42, p. 66–71.
Sauer, J.R., 2003, A critical look at national monitoring programs for birds and other wildlife species, in O’Shea, T.J. and Bogan, M.A., eds., Monitoring trends in bat populations of the United States and territories: problems and prospects: U.S. Geological Survey, Information and Technology Report, USGS/BRD/ITR-- 2003–0003, p. 119–126.
Sheffield, S.R., Shaw, J.H., Heidt, G.A., and McClenaghan, L.R., 1992, Guidelines for the protection of bat roosts: Journal of Mammalogy, vol. 73, p. 707–710.
Thompson, W.L., White, G.C., and Gowan, C., 1998, Monitoring vertebrate populations: San Diego, Calif, Academic Press, 365 p.
Tuttle, M.D., 1976, Population ecology of the gray bat (Myotis grisescens): Philopatry, timing, and patterns of movement, weight loss during migration, and seasonal adaptive strategies: Occasional Papers of the Museum of Natural History, University of Kansas, vol. 54, p. 1–38.
Tuttle, M.D., 1995, Saving North America’s beleaguered bats: National Geographic, vol. 188, p. 36–57.
Tuttle, M.D., 1999, Rabies: Economics vs. public policy: Bats, vol. 17, p. 3–7.
Tuttle, M.D., and Stevenson, D., 1982, Growth and survival of bats, in Kunz, T.H., ed., Ecology of bats: New York, Plenum Press, p. 105–150.
Tuttle, M.D., and Taylor, D.A.R., 1994, Bats and mines: Bat Conservation International, Resource Publication vol. 2, p. 1–41.
U.S. Fish and Wildlife Service, 1994, 50 CFR Part 17: Endangered and threatened wildlife and plants; animal candidate review for listing as endangered or threatened species; proposed rule: Federal Register, vol. 59, no. 219, p. 58982–59028.
U.S. Fish and Wildlife Service, 1996, 50 CFR Part 17: Endangered and threatened species, plant and animal taxa; proposed rule: Federal Register, vol. 61, no. 40, p. 7595–7613.
U.S. Fish and Wildlife Service, 1999, Agency draft: Indiana bat (Myotis sodalis) revised recovery plan: U.S. Fish and Wildlife Service, Region 3, Fort Snelling, Minn, 53 p.
Utzurrum, R.C.B., Wiles, G.J., Brooke, A.P., and Worthington, D.J., 2003, Count methods and population trends in Pacific Island flying foxes, in O’Shea, T.J. and Bogan, M.A., eds., Monitoring trends in bat populations of the United States and territories: problems and prospects: U.S. Geological Survey, Information and Technology Report, USGS/BRD/ITR--2003– 0003, p. 49–61.
Vaughan, N., Jones, G., and Harris, S., 1996, Effects of sewage effluent on the activity of bats (Chiroptera: Vespertilionidae) foraging along rivers: Biological Conservation, vol. 78, p. 337–343.
Walsh, A.L., Catto, C.M.C., Huston, T.M., Langton, S., and Racey, P.A., 2003, The United Kingdom National Bat Monitoring Programme: turning conservation goals into tangible results, in O’Shea, T.J. and Bogan, M.A., eds., Monitoring trends in bat populations of the United States and territories: problems and prospects: U.S. Geological Survey, Information and Technology Report, USGS/BRD/ ITR--2003–0003, p. 103–118.
Whitaker, J.O., Jr., 1972, Food habits of bats from Indiana: Canadian Journal of Zoology, vol. 50, p. 877–883.
Whitaker, J.O., Jr., 1988, Food habits analysis of insectivorous bats, in Kunz, T.H. ed., Ecological and behavioral methods for the study of bats: Washington, D.C., Smithsonian Institution Press, p. 171–189.
Whitaker, J.O., Jr., 1995, Food of the big brown bat Eptesicus fuscus from maternity colonies in Indiana and Illinois: American Midland Naturalist, vol. 134, p. 346–360.
Wilson, D.E., Cole, F.R., Nichols, J.D., Rudran, R., and Foster, M.S., 1996, Measuring and monitoring biological diversity: Standard methods for mammals: Washington, D.C., Smithsonian Institution Press, 409 p.

272 INFORMATION AND TECHNOLOGY REPORT–2003--0003
WWWWWorkshop Participantsorkshop Participantsorkshop Participantsorkshop Participantsorkshop Participants
David R. Anderson Cooperative Fish & Wildlife Research Unit Colorado State University 201 Wagar Building Fort Collins, CO 80523-1484
Michele M. Banowetz U.S. Geological Survey Fort Collins Science Center 2150 Centre Ave., Bldg C Fort Collins, CO 80526-8118
Robert D. Berry Brown-Berry Biological Consulting 134 Wilkes Crest Road Bishop, CA 93514
Michael A. Bogan U.S. Geological Survey Fort Collins Science Center Biology Department University of New Mexico Albuquerque, NM 87131-0001
Anne P. Brooke Box 102 Newfields, NH 08356 (Present address: Guam National Wildlife Refuge, P.O. Box 8134, MOU-3 Dededo, GU 96929)
Patricia E. Brown UCLA/Brown-Berry Biological Consulting 134 Wilkes Crest Road Bishop, CA 93514
Kenneth P. Burnham Cooperative Fish & Wildlife Research Unit Colorado State University 201 Wagar Building Fort Collins, CO 80523-1484
Timothy C. Carter Department of Zoology Southern Illinois University Carbondale, IL 62901-6501
Norita A. Chaney U.S. Geological Survey Biological Resources Division 300 National Center, Room 1C215 12201 Sunrise Valley Drive Reston, VA20192
Alice L. Chung-MacCoubrey U.S. Forest Service Rocky Mountain Research Station 2205 Columbia SE Albuquerque, NM 87106-3222
Mary Kay Clark Curator of Mammals NC State Museum of Natural Science P.O.Box 29555 Raleigh, NC 27626
Richard L. Clawson Missouri Department of Conservation 1110 S. College Avenue Columbia, MO 65201
Paul M. Cryan U.S. Geological Survey Biology Department University of New Mexico Albuquerque, NM 87131-0001 ( Present address: U.S. Geological Survey Fort Collins Science Center 2150 Centre Ave., Bldg C Fort Collins, CO 80526-8118)
Virginia M. Dalton Department of Wildlife and Fisheries Science University of Arizona Tucson, AZ 85721
Laura E. Ellison U.S. Geological Survey Fort Collins Science Center 2150 Centre Ave., Bldg C Fort Collins, CO 80526-8118

PART II 273
Steven G. Fancy National Park Service National Inventory & Monitoring Program 1201 Oakridge Drive Fort Collins, CO 80525-4489
Theodore H. Fleming Department of Biology University of Miami Coral Gables, FL 33124
Jeffrey A. Gore Florida Fish and Wildlife Conservation Commission
3911 Highway 2321 Panama City, FL 32409
Leanne Hansen U.S. Geological Survey Biological Resources Division PO Box 25046 - MS 300 Denver CO 80225 (Present address: U.S. Geological Survey Fort Collins Science Center 2150 Centre Ave., Bldg C Fort Collins, CO 80526-8118
John P. Hayes Department of Forest Science Richardson Hall Corvallis, OR 97331-7501
Michael J. Herder USDI Bureau of Land Management 345 E. Riverside Drive St. George, UT 84790
Joseph A. Kath Illinois Department of Natural Resources Division of Natural Heritage 524 South Second St. Springfield, IL 62701-1787
Thomas H. Kunz Department of Biology Boston University 5 Cummington Street Boston, MA 02215
Allen Kurta Eastern Michigan University Department of Biology Ypsilanti, MI 48197
Gary F. McCracken University of Tennessee Dept. of Ecology & Evolutionary Biology 569 Dabney Hall Knoxville, TN 37996
Rodrigo A. Medellin Instituto de Ecologia UNAM Ap. Postal 70-275 04510 Mexico, D.F.
Michael A. Menzel Division of Forestry West Virginia University Morgantown WV 26506
Kirk W. Navo Colorado Division of Wildlife 0722 S. 1 E. Monte Vista, CO 81144
Thomas J. O’Shea U.S. Geological Survey Fort Collins Science Center 2150 Centre Ave., Bldg C Fort Collins, CO 80526-8118
Michael J. Rabe Arizona Game and Fish Department Game Branch 221 W. Greenway Phoenix AZ 85023
Paul A. Racey Department of Zoology University of Aberdeen Tillydrone Avenue Aberdeen AB24 2TZ
David A. Saugey U.S. Forest Service Jessieville Ranger Dist. PO Box 189 Jessieville, AR 71949
John R. Sauer U.S. Geological Survey Patuxent Wildlife Research Center 11510 American Holly Drive Laurel, MD 20708-4017

274 INFORMATION AND TECHNOLOGY REPORT–2003--0003
Merlin D. Tuttle Bat Conservation International P.O.Box 162603 Austin, TX 78716
Ruth C. B. Utzurrum Dept. of Marine and Wildlife Resources PO Box 3730 Pago Pago, AS 96799
Ernest W. Valdez U.S. Geological Survey Museum of Southwestern Biology University of New Mexico Albuquerque, NM 87131
Allyson L. Walsh The Bat Conservation Trust 15 Cloisters House 8 Battersea Park Road London SW8 4BG (Present address: The Lubee Foundation, Inc. 1309 N.W. 192nd Avenue Gainesville, FL 32609)
Gary C. White Department of Fishery and Wildlife Biology Colorado State University 211B Wagar Building Fort Collins, CO 80523
Gary J. Wiles 1692 Sunflower Lane, Apt. 19202 Tumwater, WA98512
Don E. Wilson Smithsonian Institution Division of Mammals, MRC-108 Washington, DC 20560
Michael B. Wunder Colorado Natural Heritage Program 254 General Services Building Colorado State University Fort Collins, CO 80523
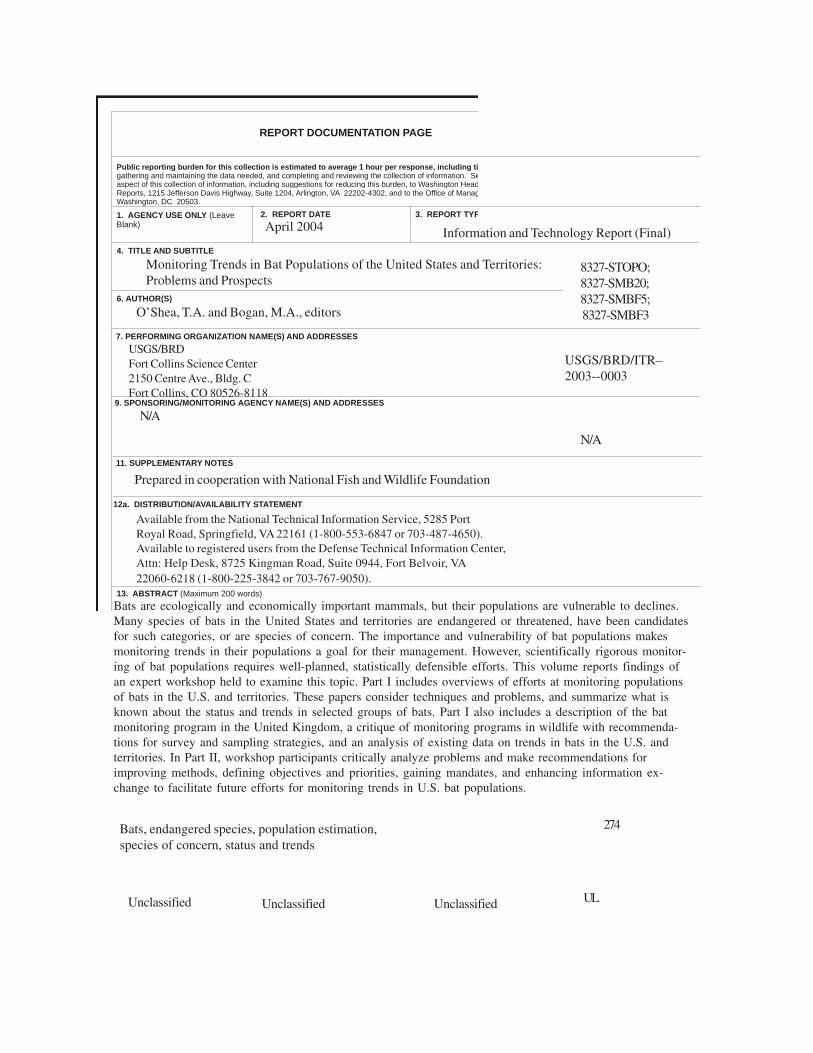
April 2004
REPORT DOCUMENTATION PAGE
2. REPORT DATE 3. REPORT TYP
Public reporting burden for this collection is estimated to average 1 hour per response, including tim gathering and maintaining the data needed, and completing and reviewing the collection of information. Se aspect of this collection of information, including suggestions for reducing this burden, to Washington Headq Reports, 1215 Jefferson Davis Highway, Suite 1204, Arlington, VA 22202-4302, and to the Office of Manage Washington, DC 20503.
1. AGENCY USE ONLY (Leave Blank)
4. TITLE AND SUBTITLE
6. AUTHOR(S)
7. PERFORMING ORGANIZATION NAME(S) AND ADDRESSES
9. SPONSORING/MONITORING AGENCY NAME(S) AND ADDRESSES
11. SUPPLEMENTARY NOTES
12a. DISTRIBUTION/AVAILABILITY STATEMENT
13. ABSTRACT (Maximum 200 words)
Information and Technology Report (Final)
O’Shea, T.A. and Bogan, M.A., editors
Available from the National Technical Information Service, 5285 Port Royal Road, Springfield, VA 22161 (1-800-553-6847 or 703-487-4650). Available to registered users from the Defense Technical Information Center, Attn: Help Desk, 8725 Kingman Road, Suite 0944, Fort Belvoir, VA 22060-6218 (1-800-225-3842 or 703-767-9050).
Monitoring Trends in Bat Populations of the United States and Territories: Problems and Prospects
N/A
Prepared in cooperation with National Fish and Wildlife Foundation
Bats are ecologically and economically important mammals, but their populations are vulnerable to declines.
USGS/BRD Fort Collins Science Center 2150 Centre Ave., Bldg. C Fort Collins, CO 80526-8118
8327-STOPO; 8327-SMB20; 8327-SMBF5; 8327-SMBF3
USGS/BRD/ITR– 2003--0003
N/A
Many species of bats in the United States and territories are endangered or threatened, have been candidates for such categories, or are species of concern. The importance and vulnerability of bat populations makes monitoring trends in their populations a goal for their management. However, scientifically rigorous monitoring of bat populations requires well-planned, statistically defensible efforts. This volume reports findings of an expert workshop held to examine this topic. Part I includes overviews of efforts at monitoring populations of bats in the U.S. and territories. These papers consider techniques and problems, and summarize what is known about the status and trends in selected groups of bats. Part I also includes a description of the bat monitoring program in the United Kingdom, a critique of monitoring programs in wildlife with recommendations for survey and sampling strategies, and an analysis of existing data on trends in bats in the U.S. and territories. In Part II, workshop participants critically analyze problems and make recommendations for improving methods, defining objectives and priorities, gaining mandates, and enhancing information exchange to facilitate future efforts for monitoring trends in U.S. bat populations.
274Bats, endangered species, population estimation, species of concern, status and trends
ULUnclassified Unclassified Unclassified

Fort Collins Science CenterFort Collins Science CenterFort Collins Science CenterFort Collins Science CenterFort Collins Science Center
Production Staff
Leader,Leader,Leader,Leader,Leader, InformationInformationInformationInformationInformation Management ServicesManagement ServicesManagement ServicesManagement ServicesManagement Services Jennifer Shoemaker
Desktop Publishing SpecialistDesktop Publishing SpecialistDesktop Publishing SpecialistDesktop Publishing SpecialistDesktop Publishing Specialist Dora E. Medellin
NOTE:NOTE:NOTE:NOTE:NOTE: Mention of trade names or commercial products does not constitute endorsement or recommendation for use by the U.S. Government.
U.S. Department of the InteriorU.S. Department of the InteriorU.S. Department of the InteriorU.S. Department of the InteriorU.S. Department of the Interior U.S. Geological SurveyU.S. Geological SurveyU.S. Geological SurveyU.S. Geological SurveyU.S. Geological Survey
As the Nation’s principal conservation agency, the Department of the Interior has responsibility for most of our nationally owned public lands and natural resources. This responsibility includes fostering the sound use of our lands and water resources; protecting our fish, wildlife, and biological diversity; preserving the environmental and cultural values of our national parks and historical places; and providing for the enjoyment of life through outdoor recreation. The Department assesses our energy and mineral resources and works to ensure that their development is in the best interests of all our people by encouraging stewardship and citizen participation in their care. The Department also has a major responsibility for American Indian reservation communities.