Embed Size (px)
Citation preview
U.S. International Trade CommissionPublication 4437 November 2013
Washington, DC 20436
Monosodium Glutamate from China and Indonesia
Investigation Nos. 701-TA-503-504 and 731-TA-1229-1230 (Preliminary)
U.S. International Trade Commission
COMMISSIONERS
Irving A. Williamson, Chairman Daniel R. Pearson Shara L. Aranoff Dean A. Pinkert
David S. Johanson Meredith M. Broadbent
Robert B. Koopman
Staff assigned
Address all communications to Secretary to the Commission
United States International Trade Commission Washington, DC 20436
Director, Office of Operations
Amy Sherman, Investigator Brian Allen, Industry Analyst Michele Breaux, Economist
Mary Klir, Accountant Jennifer Brinckhaus, Statistician
Darlene Holmes, Statistical Assistant Mary Jane Alves, Attorney
Elizabeth Haines, Supervisory Investigator
U.S. International Trade CommissionWashington, DC 20436
www.usitc.gov
Publication 4437 November 2013
Monosodium Glutamate from China and Indonesia
Investigation Nos. 701-TA-503-504 and 731-TA-1229-1230 (Preliminary)

CONTENTS Page
i
Determinations ............................................................................................................................... 1
Views of the Commission ............................................................................................................... 3
Part I: Introduction ................................................................................................................ I‐1
Background ................................................................................................................................ I‐1
Statutory criteria and organization of the report ..................................................................... I‐2
Statutory criteria ................................................................................................................... I‐2
Organization of report ........................................................................................................... I‐3
Market summary ....................................................................................................................... I‐3
Summary data and data sources ............................................................................................... I‐4
Previous and related investigations .......................................................................................... I‐4
Nature and extent of alleged subsidies and sales at LTFV ........................................................ I‐4
Alleged subsidies ................................................................................................................... I‐4
Alleged sales at LTFV ............................................................................................................. I‐6
The subject merchandise .......................................................................................................... I‐6
Commerce’s scope ................................................................................................................ I‐6
Tariff treatment ..................................................................................................................... I‐7
The product ............................................................................................................................... I‐8
Description and applications ................................................................................................. I‐8
Manufacturing processes ...................................................................................................... I‐9
Domestic like product issues ................................................................................................... I‐10
Physical characteristics and uses ......................................................................................... I‐10
Manufacturing facilities and production employees .......................................................... I‐11
Interchangeability ................................................................................................................ I‐11
Customer and producer perceptions .................................................................................. I‐12
Channels of distribution ...................................................................................................... I‐12
Price ..................................................................................................................................... I‐12
CONTENTS Page
ii
Part II: Conditions of competition in the U.S. market ............................................................ II‐1
U.S. market characteristics ....................................................................................................... II‐1
U.S. purchasers ......................................................................................................................... II‐1
Channels of distribution ........................................................................................................... II‐1
Geographic distribution ........................................................................................................... II‐2
Supply and demand considerations ......................................................................................... II‐3
U.S. supply ............................................................................................................................ II‐3
U.S. demand ......................................................................................................................... II‐5
Substitutability issues ............................................................................................................... II‐7
Lead times ............................................................................................................................ II‐7
Comparison of U.S.‐produced and imported MSG .............................................................. II‐7
Part III: U.S. producers’ production, shipments, and employment ....................................... III‐1
U.S. producer ........................................................................................................................... III‐1
U.S. production, capacity, and capacity utilization ................................................................. III‐1
AJINA’s U.S. shipments and exports ........................................................................................ III‐2
AJINA’s inventories .................................................................................................................. III‐2
U.S. producers’ imports ........................................................................................................... III‐3
U.S. employment, wages, and productivity ............................................................................ III‐3
Part IV: U.S. imports, apparent U.S. consumption, and market shares ................................ IV‐1
U.S. importers.......................................................................................................................... IV‐1
U.S. imports ............................................................................................................................. IV‐2
Negligibility .............................................................................................................................. IV‐4
Cumulation considerations ..................................................................................................... IV‐4
Geographical markets ......................................................................................................... IV‐4
Presence in the market ....................................................................................................... IV‐5
Apparent U.S. consumption .................................................................................................... IV‐6
U.S. market shares .................................................................................................................. IV‐6
Ratio of imports to U.S. production ........................................................................................ IV‐7
CONTENTS Page
iii
Part V: Pricing data ............................................................................................................... V‐1
Factors affecting prices ............................................................................................................ V‐1
Raw material costs ............................................................................................................... V‐1
U.S. inland transportation costs ........................................................................................... V‐2
Pricing practices ....................................................................................................................... V‐2
Pricing methods .................................................................................................................... V‐2
Sales terms and discounts .................................................................................................... V‐4
Price data .................................................................................................................................. V‐4
Price trends ........................................................................................................................... V‐9
Price comparisons ................................................................................................................ V‐9
Lost sales and lost revenue .................................................................................................... V‐10
Financial experience of THE U.S. producer .............................................................. VI‐1 Part VI:
Introduction ............................................................................................................................. VI‐1
Operations on MSG ................................................................................................................. VI‐1
Variance analysis ................................................................................................................. VI‐2
Capital expenditures, research and development expenses, and total assets ................... VI‐2
Capital and investment ........................................................................................................ VI‐3
Part VII: Threat considerations and information on nonsubject countries .......................... VII‐1
The industry in China .............................................................................................................. VII‐2
The industry in Indonesia ....................................................................................................... VII‐3
U.S. inventories of imported merchandise ............................................................................ VII‐4
U.S. importers’ outstanding orders ........................................................................................ VII‐5
Antidumping or countervailing duty orders in third‐country markets .................................. VII‐6
Information on nonsubject countries .................................................................................... VII‐6
CONTENTS Page
iv
Appendixes
A. Federal Register notices .................................................................................................... A‐1
B. Calendar of the public conference .................................................................................... B‐1
C. Summary data ................................................................................................................... C‐1
D. Nonsubject country price data .......................................................................................... D‐1
Note.—Information that would reveal confidential operations of individual concerns may not
be published and therefore has been deleted. Such deletions are indicated by asterisks.
UNITED STATES INTERNATIONAL TRADE COMMISSION Investigation Nos. 701‐TA‐503‐504 and 731‐TA‐1229‐1230 (Preliminary)
MONOSODIUM GLUTAMATE FROM CHINA AND INDONESIA
DETERMINATIONS
On the basis of the record1 developed in the subject investigations, the United States International Trade Commission (Commission) determines, pursuant to sections 703(a) and 733(a) of the Tariff Act of 1930 (19 U.S.C. '' 1671b(a) and 1673b(a)) (the Act), that there is a reasonable indication that an industry in the United States is materially injured by reason of imports from China and Indonesia of monosodium glutamate, provided for in subheading 2922.42.10 of the Harmonized Tariff Schedule of the United States, that are alleged to be sold in the United States at less than fair value (LTFV) and subsidized by the Governments of China and Indonesia.
COMMENCEMENT OF FINAL PHASE INVESTIGATIONS
Pursuant to section 207.18 of the Commission=s rules, the Commission also gives notice of the commencement of the final phase of its investigations. The Commission will issue a final phase notice of scheduling, which will be published in the Federal Register as provided in section 207.21 of the Commission=s rules, upon notice from the Department of Commerce (Commerce) of affirmative preliminary determinations in the investigations under sections 703(b) or 733(b) of the Act, or, if the preliminary determinations are negative, upon notice of affirmative final determinations in those investigations under sections 705(a) or 735(a) of the Act. Parties that filed entries of appearance in the preliminary phase of the investigations need not enter a separate appearance for the final phase of the investigations. Industrial users, and, if the merchandise under investigation is sold at the retail level, representative consumer organizations have the right to appear as parties in Commission antidumping and countervailing duty investigations. The Secretary will prepare a public service list containing the names and addresses of all persons, or their representatives, who are parties to the investigations.
BACKGROUND
On September 16, 2013, a petition was filed with the Commission and Commerce by Ajinomoto North America Inc. (“AJINA”), Itasca, Illinois, alleging that an industry in the United States is materially injured or threatened with material injury by reason of LTFV imports of monosodium glutamate from China and Indonesia that are subsidized by the Governments of China and Indonesia. Accordingly, effective September 16, 2013, the Commission instituted countervailing duty investigation Nos. 701‐TA‐503‐504 and antidumping duty investigation Nos. 731‐TA‐1229‐1230 (Preliminary).
1 The record is defined in sec. 207.2(f) of the Commission=s Rules of Practice and Procedure (19 CFR ' 207.2(f)).

2
Notice of the institution of the Commission=s investigations and of a public conference to be held in connection therewith was given by posting copies of the notice in the Office of the Secretary, U.S. International Trade Commission, Washington, DC, and by publishing the notice in the Federal Register of September 20, 2013 (78 FR 57881). The conference was held in Washington, DC, on October 23, 2013, and all persons who requested the opportunity were permitted to appear in person or by counsel.
3
Views of the Commission
Based on the record in the preliminary phase of these investigations, we find that there is a reasonable indication that an industry in the United States is materially injured by reason of imports of monosodium glutamate from China and Indonesia that are allegedly sold in the United States at less than fair value and that are allegedly subsidized by the Governments of China and Indonesia.
The Legal Standard for Preliminary Determinations I.
The legal standard for preliminary antidumping and countervailing duty determinations requires the Commission to determine, based upon the information available at the time of the preliminary determinations, whether there is a reasonable indication that a domestic industry is materially injured or threatened with material injury, or that the establishment of an industry is materially retarded, by reason of the allegedly unfairly traded imports.1 In applying this standard, the Commission weighs the evidence before it and determines whether “(1) the record as a whole contains clear and convincing evidence that there is no material injury or threat of such injury; and (2) no likelihood exists that contrary evidence will arise in a final investigation.”2
Background II.
Parties to the Investigation. On September 16, 2013, Ajinomoto North America, Inc. (“AJINA”), the only known U.S. producer of monosodium glutamate (“MSG”), filed antidumping and countervailing duty petitions.3 Petitioner appeared at the staff conference and submitted a postconference brief. No other firm participated in the staff conference.4 Two firms that are U.S. purchasers/industrial users of MSG appeared as parties to the investigations (Griffith
1 19 U.S.C. §§ 1671b(a), 1673b(a) (2000); see also American Lamb Co. v. United States, 785 F.2d 994,
1001‐04 (Fed. Cir. 1986); Aristech Chem. Corp. v. United States, 20 CIT 353, 354‐55 (1996). 2 American Lamb Co., 785 F.2d at 1001; see also Texas Crushed Stone Co. v. United States, 35 F.3d
1535, 1543 (Fed. Cir. 1994). 3 Confidential Report, Memorandum INV‐LL‐092 (Nov. 8, 2013), as modified by Memorandum INV‐LL‐
095 (Nov. 14, 2013), (“CR”) at I‐1, III‐1; Public Report, Monosodium Glutamate from China and Indonesia, Inv. Nos. 701‐TA‐503‐504 and 731‐TA‐1229‐1330 (Preliminary), USITC Pub. 4437 (Nov. 2013) (“PR”) at I‐1, III‐1. Due to a lapse of appropriations and the related shutdown of the Commission’s investigative activities between October 1 and October 16, 2013, the Commission tolled the deadlines in these investigations. See 78 Fed. Reg. 64011 (Oct. 25, 2013).
4 Counsel for interested parties CJ America, Inc. and PT. Cheil Jedang Indonesia (“C.J. Indonesia”) (respectively a U.S. importer and exporter of subject merchandise from Indonesia) entered an appearance and obtained administrative protective order (“APO”) access to the confidential record, but did not submit a brief.
4
Laboratories U.S.A., Inc. (“Griffith”) and Akzo Nobel Functional Chemicals LLC (“Akzo”)), but only Griffith submitted written arguments.5
Data Coverage. U.S. industry data are based on the questionnaire response of domestic
producer AJINA, which accounted for 100 percent of U.S. production of MSG in 2012.6 U.S. import data are based on official Commerce import statistics and questionnaire responses from 12 U.S. importers that are believed to have accounted for 49.5 percent of imports from China and virtually all imports from Indonesia in 2012.7 The Commission received responses to its questionnaires from three foreign producers/exporters accounting for at least *** percent of subject MSG production in Indonesia; none of the ten firms in China to which the Commission sent foreign producer/exporter questionnaires responded.8
Domestic Like Product III.
A. Legal Standard
In determining whether there is a reasonable indication that an industry in the United States is materially injured or threatened with material injury by reason of imports of the subject merchandise, the Commission first defines the “domestic like product” and the “industry.”9 Section 771(4)(A) of the Tariff Act of 1930, as amended (“the Tariff Act”), defines the relevant domestic industry as the “producers as a whole of a domestic like product, or those producers whose collective output of a domestic like product constitutes a major proportion of the total domestic production of the product.”10 In turn, the Tariff Act defines “domestic like product” as “a product which is like, or in the absence of like, most similar in characteristics and uses with, the article subject to an investigation.”11
The decision regarding the appropriate domestic like product(s) in an investigation is a factual determination, and the Commission has applied the statutory standard of “like” or “most similar in characteristics and uses” on a case‐by‐case basis.12 No single factor is
5 Non‐party Cargill Corn Milling North America, AJINA’s supplier of the main MSG raw material corn‐
derived glucose, submitted a written statement. 6 CR at I‐5; PR at I‐4. 7 CR at I‐5; PR at I‐4; Petitioner’s Postconf Br. at 18, Exhibit 1 at 3; Transcript of October 23, 2013 Staff
Conference (“Confer. Tr.”) at 37‐40 (McPhie, Henter, Naulty), 42‐44 (McPhie, Malashevich); Petitions, Vol. I at Exhibit I‐4, Exhibit I‐5.
8 CR at VII‐3 to VII‐4; PR at VII‐2 to VII‐3. 9 19 U.S.C. § 1677(4)(A). 10 19 U.S.C. § 1677(4)(A). 11 19 U.S.C. § 1677(10). 12 See, e.g., Cleo Inc. v. United States, 501 F.3d 1291, 1299 (Fed. Cir. 2007); NEC Corp. v. Department
of Commerce, 36 F. Supp. 2d 380, 383 (Ct. Int’l Trade 1998); Nippon Steel Corp. v. United States, 19 CIT 450, 455 (1995); Torrington Co. v. United States, 747 F. Supp. 744, 749 n.3 (Ct. Int’l Trade 1990), aff’d, 938 F.2d 1278 (Fed. Cir. 1991) (“every like product determination ‘must be made on the particular record at issue’ and the ‘unique facts of each case’”). The Commission generally considers a number of factors including the following: (1) physical characteristics and uses; (2) interchangeability; (3) channels (Continued…)
5
dispositive, and the Commission may consider other factors it deems relevant based on the facts of a particular investigation.13 The Commission looks for clear dividing lines among possible like products and disregards minor variations.14 Although the Commission must accept Commerce’s determination as to the scope of the imported merchandise that is subsidized and/or sold at less than fair value,15 the Commission determines what domestic product is like the imported articles Commerce has identified.16
B. Product Description and Party Arguments
In its notice of initiation, Commerce defined the imported merchandise within the scope of these investigations as MSG:
whether or not blended or in solution with other products. Specifically, MSG that has been blended or is in solution with other product(s) is included in this scope when the resulting mix contains 15% or more of MSG by dry weight. Products with which MSG may be blended include, but are not limited to, salts, sugars, starches, maltodextrins, and various seasonings. Further, MSG is included in these investigations regardless of physical form (including, but not limited to, substrates, solutions, dry powders of any particle size, or unfinished forms such as MSG slurry), end‐use application, or packaging. MSG has a molecular formula of C5H8NO4Na, a Chemical Abstract Service (‘‘CAS’’) registry number of 6106–04–3, and a Unique Ingredient Identifier (‘‘UNII’’) number of W81N5U6R6U.17
(…Continued) of distribution; (4) customer and producer perceptions of the products; (5) common manufacturing facilities, production processes, and production employees; and, where appropriate, (6) price. See Nippon, 19 CIT at 455 n.4; Timken Co. v. United States, 913 F. Supp. 580, 584 (Ct. Int’l Trade 1996).
13 See, e.g., S. Rep. No. 96‐249 at 90‐91 (1979). 14 See, e.g., Nippon, 19 CIT at 455; Torrington, 747 F. Supp. at 748‐49; see also S. Rep. No. 96‐249 at
90‐91 (Congress has indicated that the like product standard should not be interpreted in “such a narrow fashion as to permit minor differences in physical characteristics or uses to lead to the conclusion that the product and article are not ‘like’ each other, nor should the definition of ‘like product’ be interpreted in such a fashion as to prevent consideration of an industry adversely affected by the imports under consideration.”).
15 See, e.g., USEC, Inc. v. United States, 34 Fed. Appx. 725, 730 (Fed. Cir. 2002) (“The ITC may not modify the class or kind of imported merchandise examined by Commerce.”); Algoma Steel Corp. v. United States, 688 F. Supp. 639, 644 (Ct. Int’l Trade 1988), aff’d, 865 F.3d 240 (Fed. Cir.), cert. denied, 492 U.S. 919 (1989).
16 Hosiden Corp. v. Advanced Display Mfrs., 85 F.3d 1561, 1568 (Fed. Cir. 1996) (the Commission may find a single like product corresponding to several different classes or kinds defined by Commerce); Cleo, 501 F.3d at 1298 n.1 (“Commerce’s {scope} finding does not control the Commission’s {like product} determination.”); Torrington, 747 F. Supp. at 748‐52 (affirming the Commission’s determination defining six like products in investigations where Commerce found five classes or kinds).
17 Commerce explained that merchandise covered by the scope of these investigations is currently classified in United States Harmonized Tariff Schedule (“HTS”) subheading 2922.42.10.00 but may also enter under HTS subheadings 2922.42.50.00, 2103.90.72.00, 2103.90.74.00, 2103.90.78.00, (Continued…)
6
Petitioner asks the Commission to define the domestic like product to consist of MSG products corresponding to the scope of the investigations.18 No other party made any domestic like product arguments in these investigations.
C. Analysis and Conclusion
Based on the record,19 we define a single domestic like product consisting of MSG corresponding to the scope of the investigations.
Physical Characteristics and Uses. MSG is a highly stable, odorless sodium salt of the
amino acid glutamic acid and corresponds to the molecular formula of C5H8NO4Na in anhydrous form or C5H10NNaO5 in monohydrate form.20 MSG corresponds to the “meaty” taste of umami, which is the fifth of the basic tastes (the others being sweet, sour, salt, and bitter).21 Although MSG may be produced in various crystal sizes (e.g., regular, fine, and extra fine) and/or to specific standards, Petitioner reports that these variances do not change or alter MSG’s chemical structure or basic physical characteristics.22
Petitioner asserts that there are no substitutes for MSG. It reports that attempts to use yeast extracts, soy sauce, or other products to substitute for the umami taste have not succeeded because those products have a lower concentration of MSG, do not produce the same flavor, and are not as economical.23
MSG sold in the U.S. market must adhere to Food Chemicals Codex specifications when used in its primary application – for food uses by itself or in blends mainly as a flavor enhancer in “soups, broths, fish, meats, breading, seasonings, spice blends, vegetable juices, beverages, ready‐made goods, frozen meats, sauces, and dressings.”24 If used in pharmaceutical applications, MSG must meet U.S. Pharmacopeia standards.25 MSG may also be used as a
(…Continued) 2103.90.80.00, and 2103.90.90.91. It provided the tariff classifications, CAS registry number, and UNII number for convenience and customs purposes and clarified that the written description of the scope is dispositive. 78 Fed. Reg. 65269, 65272 (Oct. 31, 2013) (initiating countervailing duty investigations); 78 Fed. Reg. 65278, 65283 (Oct. 31, 2013) (initiating antidumping duty investigations); CR at I‐9 to I‐10; PR at I‐6 to I‐7.
18 Petitioner’s Postconf Br. at 3‐9; Petitions, Vol. I at 8‐10. 19 A majority of the information in the record regarding the domestic like product factors was
provided in the petitions or by Petitioner. 20 CR at I‐10 at n.10, I‐15; PR at I‐7 n.10, I‐11; Petitioner’s Postconf Br. at 4; Petitions, Vol. I at 5.
Glutamic acid, the most abundant amino acid, is naturally present in many protein‐containing foods, including meat, seafood, aged cheese, and mother’s milk. Confer. Tr. at 13.
21 Confer. Tr. at 12, 51 (Naulty); Petitions, Vol. I at Exhibit I.6.c. 22 CR at I‐15; PR at I‐11; Petitioner’s Postconf Br. at 5; Petitions, Vol. I at 10. 23 CR at I‐15; PR at I‐11; Confer. Tr. at 48 (Naulty). 24 Petitioner’s Postconf Br. at 5‐6; Confer. Tr. at 13, 20‐21 (Naulty); Petitions, Vol. I at 6, 10. In the
United States, AJINA markets its MSG in grocery stores as Accent.™ Confer. Tr. at 24 (Naulty). 25 Petitioner’s Postconf Br. at 5; Petitions, Vol. I at 6.
7
biodegradable “builder” ingredient in detergents or in other consumer products and industrial applications.26
Manufacturing Facilities, Production Processes, and Employees. Manufacturers use
three basic steps to produce MSG: fermentation, isolation, and purification (crystallization and finishing).27 First, producers ferment a carbohydrate or dextrose source (such as tapioca starch, sugar beet molasses, sugar cane molasses, or corn starch) in the presence of heat and oxygen in a culture medium that is designed to optimize specific bacteria (microorganisms of the genus Coryne Bacterium or Brevi Bacterium).28 For its U.S. facility, AJINA purchases corn‐derived glucose ***.29 The microorganisms consume the sugar and excrete glutamic acid.30 Second, in the isolation stage, manufacturers pasteurize the broth emanating from the fermentation stage to kill the bacteria, mechanically separate and convert the crystals from alpha to beta types, and wash the crystals to yield crude 1‐glutamic acid of about 90 percent purity.31 Third, in the purification and finishing stage, the crude 1‐glutamic acid is neutralized with sodium hydroxide, mixed with activated carbon to remove odors, filtered to remove the carbon, sterilized, filtered and concentrated, to yield purified 1‐glutamic acid of about 99 percent purity.32 The concentrated MSG is dried through a fluid‐bed drying system, sieved for size, and packed into the final packages or containers.33
Domestic producer AJINA uses dedicated facilities to manufacture MSG.34 It reports producing different forms or sizes of MSG in the same production facilities, using the same employees and processes, except that a different‐sized sieve is used to separate the various crystal sizes, sometimes even from the same production batch.35
Channels of Distribution. MSG is distributed to end users and distributors,
predominantly in bags, boxes, or fiber drums.36
26 Petitioner’s Postconf Br. at 5; Petitions, Vol. I at 6. 27 CR at I‐13; PR at I‐9 to I‐10; Petitions, Vol. I at 6‐8, Exhibit I‐7.A. 28 Other inputs at this stage are ammonia (to control acidity and as a source of nitrogen), phosphoric
acid, amino acids, various minerals, vitamins, mineral salts, other additives, and air‐supplied oxygen. CR at I‐13; PR at I‐9 to I‐10; Petitioner’s Postconf Br. at 4, 8; Petitions, Vol. I at 6‐7, Exhibit 1‐7.A.
29 Confer. Tr. at 14 (Naulty); Petitions, Vol. I at 7, Exhibit 1‐7.A. 30 Petitioner’s Postconf. Br. at 8; Confer. Tr. at 14 (Naulty); Petitions, Vol. 1 at 7, Exhibit 1‐7.A. 31 CR at I‐13; PR at I‐I‐10; Confer. Tr. at 14 (Naulty); Petitions, Vol. I at 7, Exhibit I‐7.A. 32 CR at I‐13; PR at I‐10; Petitioner’s Postconf. Br. at 8; Confer. Tr. at 14 (Naulty); Petitions, Vol. I at 7‐
8 (indicating that other inputs to this stage are steam, energy (natural gas), sodium from soda ash, sodium bicarbonate, sodium hydroxide (caustic soda), hydrochloric acid, activated carbon, and waste‐water treatment).
33 CR at I‐13; PR at I‐10; Confer. Tr. at 14‐15 (Naulty); Petitions, Vol. I at 7, Exhibit I‐7.A. 34 CR at I‐15, III‐3; PR at I‐11, III‐2. 35 CR at I‐15 to I‐16; PR at I‐11; Confer. Tr. at 34 (Malashevich); Petitioner’s Postconf Br. at 6, 8, 10,
14; Petitions, Vol. I at 6, 10. 36 CR at I‐17; PR at I‐12; CR/PR at Table II‐1; Petitioner’s Postconf Br. at 7; Petitions, Vol. I at 8, 10.
8
Interchangeability. Most MSG is used in food applications, with smaller volumes used in nonfood products such as detergents, cosmetics, and pharmaceuticals.37 Regardless of intended end use, Petitioner argues that all MSG made in the United States meets even the strict Food Chemical Codex specifications.38 According to Petitioner, MSG of differing crystal sizes is otherwise identical, although certain end users might prefer a particular crystal size for their applications.39
Producer and Customer Perceptions. Petitioner reports that producers and customers
perceive MSG to be a commodity because all domestically produced MSG has the same structure and imparts the same general qualities, particularly given that it all meet the highest purity specifications for food applications, regardless of intended use.40 Some purchasers prefer a particular MSG crystal size, depending on the intended end use.41
Price. According to Petitioner, purchasers generally do not differentiate MSG prices
according to form, packaging size, or market segment, although different packaging forms themselves involve different costs.42 According to the pricing data obtained in these investigations pertaining to three products, the price of fine MSG in a 50‐pound paper bag *** the price of regular MSG in a 50‐pound paper bag, and the price of regular MSG in a 50‐pound paper bag was *** as the price of regular MSG in a 100‐pound fiber drum.43
Conclusion. Certain users require MSG to be certified to meet requirements for use in
food or pharmaceutical applications or prefer a particular crystal size. Nonetheless, all MSG made in the United States meets even the strictest food‐grade standards and conforms to the same chemical formula and basic characteristics regardless of crystal size. All MSG is manufactured using the same facilities, employees, and processes, except that different sieves are used for different grain sizes. Prices ***. While there is not complete interchangeability among MSG of different sizes, there does not appear to be any clear line dividing them. Moreover, no party has asserted any contrary argument. Based on the record, for purposes of these preliminary determinations, we define a single domestic like product consisting of MSG corresponding to the scope of the investigations.
37 CR at I‐11; PR at I‐11. 38 CR at I‐16; PR at I‐11; Petitioner’s Postconf Br. at 6, 8; Petitions, Vol. I at 10. 39 CR at I‐16; PR at I‐11; Petitioner’s Postconf Br. at 5‐8; Petitions, Vol. I at 10. For example, the
granule size of MSG used in industrial applications is typically larger than that used for food products. Petitioner’s Postconf Br. at 5. According to Petitioner, larger crystals work when used in soups or other liquids, but topically applied fine crystals adhere better to tortilla chips and are less likely to end up on the bottom of the bag, and Chinese food service chefs typically choose a regular crystal. Confer. Tr. at 33‐34 (Naulty).
40 CR at I‐16; PR at I‐12; Petitioner’s Postconf Br. at 7‐8. 41 CR at I‐16; PR at I‐12; Petitioner’s Postconf Br. at 5‐8; Petitions, Vol. I at 10. 42 CR at I‐17 to I‐18; PR at I‐12; Petitioner’s Postconf Br. at 8, 14‐15; Petitions, Vol. I at 10, 18‐19. 43 Compare CR/PR at Table V‐3 (fine MSG in a 50‐pound paper bag), Table V‐4 (regular MSG in a 50‐
pound paper bag), Table V‐5 (regular MSG in a 100‐pound fiber drum).
9
Domestic Industry IV.
The domestic industry is defined as the domestic “producers as a whole of a domestic like product, or those producers whose collective output of a domestic like product constitutes a major proportion of the total domestic production of the product.”44 In defining the domestic industry, the Commission’s general practice has been to include in the industry producers of all domestic production of the like product, whether toll‐produced, captively consumed, or sold in the domestic merchant market.
We must determine whether any producer of the domestic like product should be excluded from the domestic industry pursuant to Section 771(4)(B) of the Tariff Act. This provision allows the Commission, if appropriate circumstances exist, to exclude from the domestic industry producers that are related to an exporter or importer of subject merchandise or which are themselves importers.45 Exclusion of such a producer is within the Commission’s discretion based upon the facts presented in each investigation.46
No party argued that any domestic producer is a related party, let alone that appropriate circumstances exist to exclude any firm from the domestic industry. The sole known domestic producer, AJINA, is indirectly related to one MSG producer in China and three MSG producers in Indonesia. We find that AJINA is not a related party. Specifically, AJINA is *** percent owned by Ajinomoto Co., Inc. of Tokyo, Japan, which in turn holds a 25 percent share in but does not control Shangdong Linwei Seasoning Co., Ltd, a joint venture that manufactures MSG in China. Ajinomoto controls PT Ajinomoto Indonesia and PT Ajinex International, and it owns a non‐controlling 50 percent share of PT Sasa Inti, all of which produce MSG in Indonesia. Nevertheless, none of its affiliates in China and Indonesia export MSG to the United States, so none are “exporters of the subject merchandise.”47 Moreover, AJINA did not report importing into the United States any MSG from China or Indonesia during the POI.48 Absent any indication that the third party controlling AJINA controls an “exporter or importer of the subject merchandise” or that AJINA itself imported subject merchandise, we do not find AJINA is a related party under the statute.
44 19 U.S.C. § 1677(4)(A). 45 See Torrington Co. v. United States, 790 F. Supp. 1161, 1168 (Ct. Int’l Trade 1992), aff’d without
opinion, 991 F.2d 809 (Fed. Cir. 1993); Sandvik AB v. United States, 721 F. Supp. 1322, 1331‐32 (Ct. Int’l Trade 1989), aff’d mem., 904 F.2d 46 (Fed. Cir. 1990); Empire Plow Co. v. United States, 675 F. Supp. 1348, 1352 (Ct. Int’l Trade 1987).
46 The primary factors the Commission has examined in deciding whether appropriate circumstances exist to exclude a related party include the following: (1) the percentage of domestic production attributable to the importing producer; (2) the reason the U.S. producer has decided to import the product subject to investigation, i.e., whether the firm benefits from the LTFV sales or subsidies or whether the firm must import in order to enable it to continue production and compete in the U.S. market; and (3) the position of the related producer vis‐à‐vis the rest of the industry, i.e., whether inclusion or exclusion of the related party will skew the data for the rest of the industry. See, e.g., Torrington Co. v. United States, 790 F. Supp. at 1168.
47 Petitions, Vol. I at 3 n.4; AJINA’s U.S. Producer’s Questionnaire, Answers to Questions I‐4, I‐5, I‐6. 48 CR at III‐1; PR at III‐1.
10
Thus, we define the domestic industry as all U.S. producers of the domestic like product, which in these investigations consists solely of AJINA.
Cumulation49 V.
For purposes of evaluating the volume and price effects for a determination of reasonable indication of material injury by reason of subject imports, section 771(7)(G)(i) of the Tariff Act requires the Commission to cumulate subject imports from all countries as to which petitions were filed and/or investigations self‐initiated by Commerce on the same day, if such imports compete with each other and with the domestic like product in the U.S. market. In assessing whether subject imports compete with each other and with the domestic like product, the Commission generally has considered four factors:
(1) the degree of fungibility between subject imports from different countries and between subject imports and the domestic like product, including consideration of specific customer requirements and other quality related questions;
(2) the presence of sales or offers to sell in the same geographic markets of subject imports from different countries and the domestic like product;
(3) the existence of common or similar channels of distribution for subject imports from different countries and the domestic like product; and
(4) whether the subject imports are simultaneously present in the market.50
While no single factor is necessarily determinative, and the list of factors is not exclusive, these factors are intended to provide the Commission with a framework for determining whether the subject imports compete with each other and with the domestic like product.51 Only a “reasonable overlap” of competition is required.52
49 Pursuant to Section 771(24) of the Tariff Act, imports from a subject country of merchandise
corresponding to a domestic like product that account for less than 3 percent of all such merchandise imported into the United States during the most recent 12 months for which data are available preceding the filing of the petitions shall be deemed negligible. In the case of countervailing duty investigations involving developing countries (as designated by the United States Trade Representative pursuant to 19 U.S.C. § 1677(36)), the statute indicates that the negligibility limit is 4 percent. 19 U.S.C. §§ 1671b(a), 1673b(a), 1677(24)(A)(i), 1677(24)(B); see also 15 C.F.R. § 2013.1 (developing countries for purposes of 19 U.S.C. § 1677(36)). Based on official Commerce import statistics for the period September 2012 through August 2013, subject imports from China were 73.6 percent of total MSG imports by quantity, and subject imports from Indonesia were 15.9 percent of total MSG imports by quantity. CR at IV‐5; PR at IV‐4. Thus, subject imports from China and Indonesia each exceed the three percent negligibility standard applicable to the countervailing duty investigation of imports from China and both antidumping duty investigations. Subject imports from Indonesia also exceed the four percent standard applicable to the countervailing duty investigation of imports from Indonesia.
50 See Certain Cast‐Iron Pipe Fittings from Brazil, the Republic of Korea, and Taiwan, Inv. Nos. 731‐TA‐278‐80 (Final), USITC Pub. 1845 (May 1986), aff’d, Fundicao Tupy, S.A. v. United States, 678 F. Supp. 898 (Ct. Int’l Trade), aff’d, 859 F.2d 915 (Fed. Cir. 1988).
51 See, e.g., Wieland Werke, AG v. United States, 718 F. Supp. 50 (Ct. Int’l Trade 1989).
11
In these investigations, only the Petitioner made any cumulation arguments. It argues that the Commission should cumulate subject imports from China and Indonesia.53 In considering whether to cumulate imports of subject merchandise from China and Indonesia, we find as an initial matter that Petitioner filed the antidumping and countervailing duty petitions with respect to both countries on the same day, September 16, 2013.54
Fungibility. Petitioner reports that producers in China, Indonesia, and the United States
produce MSG to the same standards (including the Food Chemicals Codex when sold as a food additive and the U.S. Pharmacopeia specifications when sold for pharmaceutical uses).55 The Commission collected pricing data on products of varying crystal sizes and packaging, and these data show that the domestic industry and producers in each of the subject countries sold overlapping products in the U.S. market.56 Additionally, with one exception, all responding importers and the U.S. producer reported that subject imports from China and Indonesia are at least sometimes interchangeable with one another and with the domestic like product.57 Most responding importers also reported that differences other than price among products from these three sources are only sometimes a factor, and the domestic producer and all but one of the other importers reported non‐price differences are never a factor.58 Thus, the current record indicates that MSG produced domestically and imported from China and Indonesia are generally fungible with one another.
(…Continued)
52 The Statement of Administrative Action (SAA) to the Uruguay Round Agreements Act (URAA), expressly states that “the new section will not affect current Commission practice under which the statutory requirement is satisfied if there is a reasonable overlap of competition.” H.R. Rep. No. 103‐316, Vol. I at 848 (1994) (citing Fundicao Tupy, 678 F. Supp. at 902); see Goss Graphic Sys., Inc. v. United States, 33 F. Supp. 2d 1082, 1087 (Ct. Int’l Trade 1998) (“cumulation does not require two products to be highly fungible”); Wieland Werke, AG, 718 F. Supp. at 52 (“Completely overlapping markets are not required.”).
53 Petitioner’s Postconf Br. at 4‐13, 14; Confer. Tr. at 10, 19‐20, 26, 35, 52‐53 (Naulty); Petitions, Vol. I at 5‐6, 8‐10, 13‐15, 18‐19.
54 CR at I‐1; PR at I‐1. None of the statutory exceptions to cumulation applies. 55 Petitioner’s Postconf Br. at 5‐6, 10, 14; Confer. Tr. at 19‐20 (Naulty), 26 (Malashevich); Petitions,
Vol. I at 5, 9‐10, 14, Exhibit I‐6.A‐C (containing product specifications for MSG made by AJINA, a producer in China, and an international trade association).
56 CR/PR at Table V‐3 to V‐5 (showing U.S. shipments of fine MSG in 50‐pound bags, regular MSG in 50‐pound bags, and regular MSG in fiber drums by the domestic industry and importers of subject merchandise from China and Indonesia); Confer. Tr. at 57‐58 (McPhie); Petitioner’s Postconf Br. at 8; Petitions, Vol. I at 18 (acknowledging that in Petitioner’s experience, MSG from China historically had larger crystals and a yellower hue, but reporting that purchasers were unaware of or indifferent to these variations).
57 CR/PR at Table II‐4. 58 CR/PR at Table II‐5.
12
Channels of Distribution. In the U.S. market, MSG is sold to end users and distributors.59 The current record shows at least some overlap in channels of distribution among the three sources, for sales to distributors.60
Geographic Overlap. The record indicates that the U.S. MSG market is nationwide and
that the domestic industry and importers of subject merchandise from both China and Indonesia sold MSG throughout the United States.61
Simultaneous Presence in Market. U.S. imports of MSG from China were present in the
U.S. market in every quarter of the POI, as were domestic shipments.62 Imports of MSG from Indonesia did not have any presence in the U.S. market at the beginning of the POI, but rapidly and steadily entered the market in sizeable volumes at the end of 2011. Subject imports from Indonesia then were present in the U.S. market in every quarter between October 2011 and June 2013.63 Therefore, MSG from all three sources was simultaneously present in the U.S. market for much of the POI and in every quarter since October 2011.
Conclusion. Because the antidumping and countervailing duty petitions were filed on
the same day and the current record shows a reasonable overlap of competition between and among the subject imports and the domestic like product, we cumulate subject imports from China and Indonesia for purposes of our analysis of whether there is a reasonable indication of material injury by reason of subject imports.64
Reasonable Indication of Material Injury by Reason of Subject Imports VI.
A. Legal Standard
In the preliminary phase of antidumping and countervailing duty investigations, the Commission determines whether there is a reasonable indication that an industry in the United States is materially injured or threatened with material injury by reason of the imports under investigation.65 In making this determination, the Commission must consider the volume of subject imports, their effect on prices of the domestic like product, and their impact on domestic producers of the domestic like product, but only in the context of U.S. production
59 CR/PR at Table II‐1. 60 The percentage of the domestic industry’s U.S. shipments to distributors ranged from *** to ***
percent, compared to 34.3 to 61.2 percent for importers of subject merchandise from China and *** percent for importers of subject merchandise from Indonesia. CR/PR at Table II‐1.
61 CR/PR at Table II‐2. 62 CR/PR at Table IV‐3 (imports from China), Tables V‐3 to V‐5 (domestic industry and imports from
China). 63 CR/PR at Table IV‐3. 64 We intend to revisit this issue in any final phase of these investigations, particularly the extent to
which products from different sources are sold in overlapping channels of distribution. 65 19 U.S.C. §§ 1671b(a), 1673b(a).
13
operations.66 The statute defines “material injury” as “harm which is not inconsequential, immaterial, or unimportant.”67 In assessing whether there is a reasonable indication that the domestic industry is materially injured by reason of subject imports, we consider all relevant economic factors that bear on the state of the industry in the United States.68 No single factor is dispositive, and all relevant factors are considered “within the context of the business cycle and conditions of competition that are distinctive to the affected industry.”69
Although the statute requires the Commission to determine whether there is a reasonable indication that the domestic industry is “materially injured by reason of” unfairly traded imports,70 it does not define the phrase “by reason of,” indicating that this aspect of the injury analysis is left to the Commission’s reasonable exercise of its discretion.71 In identifying a causal link, if any, between subject imports and material injury to the domestic industry, the Commission examines the facts of record that relate to the significance of the volume and price effects of the subject imports and any impact of those imports on the condition of the domestic industry. This evaluation under the “by reason of” standard must ensure that subject imports are more than a minimal or tangential cause of injury and that there is a sufficient causal, not merely a temporal, nexus between subject imports and material injury.72
In many investigations, there are other economic factors at work, some or all of which may also be having adverse effects on the domestic industry. Such economic factors might include nonsubject imports; changes in technology, demand, or consumer tastes; competition among domestic producers; or management decisions by domestic producers. The legislative history explains that the Commission must examine factors other than subject imports to ensure that it is not attributing injury from other factors to the subject imports, thereby inflating an otherwise tangential cause of injury into one that satisfies the statutory material
66 19 U.S.C. § 1677(7)(B). The Commission “may consider such other economic factors as are relevant
to the determination” but shall “identify each {such} factor ... {a}nd explain in full its relevance to the determination.” 19 U.S.C. § 1677(7)(B).
67 19 U.S.C. § 1677(7)(A). 68 19 U.S.C. § 1677(7)(C)(iii). 69 19 U.S.C. § 1677(7)(C)(iii). 70 19 U.S.C. §§ 1671b(a), 1673b(a). 71 Angus Chemical Co. v. United States, 140 F.3d 1478, 1484‐85 (Fed. Cir. 1998) (“{T}he statute does
not ‘compel the commissioners’ to employ {a particular methodology}.”), aff’g 944 F. Supp. 943, 951 (Ct. Int’l Trade 1996).
72 The Federal Circuit, in addressing the causation standard of the statute, has observed that “{a}s long as its effects are not merely incidental, tangential, or trivial, the foreign product sold at less than fair value meets the causation requirement.” Nippon Steel Corp. v. USITC, 345 F.3d 1379, 1384 (Fed. Cir. 2003). This was re‐affirmed in Mittal Steel Point Lisas Ltd. v. United States, 542 F.3d 867, 873 (Fed. Cir. 2008), in which the Federal Circuit, quoting Gerald Metals, Inc. v. United States, 132 F.3d 716, 722 (Fed. Cir. 1997), stated that “this court requires evidence in the record ‘to show that the harm occurred “by reason of” the LTFV imports, not by reason of a minimal or tangential contribution to material harm caused by LTFV goods.’” See also Nippon Steel Corp. v. United States, 458 F.3d 1345, 1357 (Fed. Cir. 2006); Taiwan Semiconductor Industry Ass’n v. USITC, 266 F.3d 1339, 1345 (Fed. Cir. 2001).
14
injury threshold.73 In performing its examination, however, the Commission need not isolate the injury caused by other factors from injury caused by unfairly traded imports.74 Nor does the “by reason of” standard require that unfairly traded imports be the “principal” cause of injury or contemplate that injury from unfairly traded imports be weighed against other factors, such as nonsubject imports, which may be contributing to overall injury to an industry.75 It is clear that the existence of injury caused by other factors does not compel a negative determination.76
Assessment of whether material injury to the domestic industry is “by reason of” subject imports “does not require the Commission to address the causation issue in any particular way” as long as “the injury to the domestic industry can reasonably be attributed to the subject imports” and the Commission “ensure{s} that it is not attributing injury from other sources to
73 SAA, H.R. Rep. 103‐316, Vol. I at 851‐52 (1994) (“{T}he Commission must examine other factors to
ensure that it is not attributing injury from other sources to the subject imports.”); S. Rep. 96‐249 at 75 (1979) (the Commission “will consider information which indicates that harm is caused by factors other than less‐than‐fair‐value imports.”); H.R. Rep. 96‐317 at 47 (1979) (“in examining the overall injury being experienced by a domestic industry, the ITC will take into account evidence presented to it which demonstrates that the harm attributed by the petitioner to the subsidized or dumped imports is attributable to such other factors;” those factors include “the volume and prices of nonsubsidized imports or imports sold at fair value, contraction in demand or changes in patterns of consumption, trade restrictive practices of and competition between the foreign and domestic producers, developments in technology and the export performance and productivity of the domestic industry”); accord Mittal, 542 F.3d at 877.
74 SAA at 851‐52 (“{T}he Commission need not isolate the injury caused by other factors from injury caused by unfair imports.”); Taiwan Semiconductor Industry Ass’n , 266 F.3d at 1345. (“{T}he Commission need not isolate the injury caused by other factors from injury caused by unfair imports ... . Rather, the Commission must examine other factors to ensure that it is not attributing injury from other sources to the subject imports.” (emphasis in original)); Asociacion de Productores de Salmon y Trucha de Chile AG v. United States, 180 F. Supp. 2d 1360, 1375 (Ct. Int’l Trade 2002) (“{t}he Commission is not required to isolate the effects of subject imports from other factors contributing to injury” or make “bright‐line distinctions” between the effects of subject imports and other causes.); see also Softwood Lumber from Canada, Inv. Nos. 701‐TA‐414 and 731‐TA‐928 (Remand), USITC Pub. 3658 at 100‐01 (Dec. 2003) (Commission recognized that “{i}f an alleged other factor is found not to have or threaten to have injurious effects to the domestic industry, i.e., it is not an ‘other causal factor,’ then there is nothing to further examine regarding attribution to injury”), citing Gerald Metals, 132 F.3d at 722 (the statute “does not suggest that an importer of LTFV goods can escape countervailing duties by finding some tangential or minor cause unrelated to the LTFV goods that contributed to the harmful effects on domestic market prices.”).
75 S. Rep. 96‐249 at 74‐75; H.R. Rep. 96‐317 at 47. 76 See Nippon, 345 F.3d at 1381 (“an affirmative material‐injury determination under the statute
requires no more than a substantial‐factor showing. That is, the ‘dumping’ need not be the sole or principal cause of injury.”).
15
the subject imports.”77 78 Indeed, the Federal Circuit has examined and affirmed various Commission methodologies and has disavowed “rigid adherence to a specific formula.”79
The Federal Circuit’s decisions in Gerald Metals, Bratsk, and Mittal all involved cases in which the relevant “other factor” was the presence in the market of significant volumes of price‐competitive nonsubject imports. The Commission interpreted the Federal Circuit’s guidance in Bratsk as requiring it to apply a particular additional methodology following its finding of material injury in cases involving commodity products and a significant market presence of price‐competitive nonsubject imports.80 The additional “replacement/benefit” test looked at whether nonsubject imports might have replaced subject imports without any benefit to the U.S. industry. The Commission applied that specific additional test in subsequent cases, including the Carbon and Certain Alloy Steel Wire Rod from Trinidad and Tobago determination that underlies the Mittal litigation.
Mittal clarifies that the Commission’s interpretation of Bratsk was too rigid and makes clear that the Federal Circuit does not require the Commission to apply an additional test nor any one specific methodology; instead, the court requires the Commission to have “evidence in the record ‘to show that the harm occurred ‘by reason of’ the LTFV imports,’” and requires that the Commission not attribute injury from nonsubject imports or other factors to subject
77 Mittal, 542 F.3d at 877‐78; see also id. at 873 (“While the Commission may not enter an affirmative
determination unless it finds that a domestic industry is materially injured ‘by reason of’ subject imports, the Commission is not required to follow a single methodology for making that determination ... {and has} broad discretion with respect to its choice of methodology.”) citing United States Steel Group v. United States, 96 F.3d 1352, 1362 (Fed. Cir. 1996) and S. Rep. 96‐249 at 75.
78 Commissioner Pinkert does not join this paragraph or the following three paragraphs. He points out that the Federal Circuit, in Bratsk, 444 F.3d 1369, and Mittal, held that the Commission is required, in certain circumstances when considering present material injury, to undertake a particular kind of analysis of nonsubject imports, albeit without reliance upon presumptions or rigid formulas. Mittal explains as follows:
What Bratsk held is that “where commodity products are at issue and fairly traded, price competitive, nonsubject imports are in the market,” the Commission would not fulfill its obligation to consider an important aspect of the problem if it failed to consider whether nonsubject or non‐LTFV imports would have replaced LTFV subject imports during the period of investigation without a continuing benefit to the domestic industry. 444 F.3d at 1369. Under those circumstances, Bratsk requires the Commission to consider whether replacement of the LTFV subject imports might have occurred during the period of investigation, and it requires the Commission to provide an explanation of its conclusion with respect to that factor.
542 F3.d at 878. 79 Nucor Corp. v. United States, 414 F.3d 1331, 1336, 1341 (Fed. Cir. 2005); see also Mittal, 542 F.3d
at 879 (“Bratsk did not read into the antidumping statute a Procrustean formula for determining whether a domestic injury was ‘by reason’ of subject imports.”).
80 Mittal, 542 F.3d at 875‐79.
16
imports.81 Accordingly, we do not consider ourselves required to apply the replacement/benefit test that was included in Commission opinions subsequent to Bratsk.
The progression of Gerald Metals, Bratsk, and Mittal clarifies that, in cases involving commodity products where price‐competitive nonsubject imports are a significant factor in the U.S. market, the Court will require the Commission to give full consideration, with adequate explanation, to non‐attribution issues when it performs its causation analysis.82
The question of whether the material injury threshold for subject imports is satisfied notwithstanding any injury from other factors is factual, subject to review under the substantial evidence standard.83 Congress has delegated this factual finding to the Commission because of the agency’s institutional expertise in resolving injury issues.84
B. Conditions of Competition and the Business Cycle
The following conditions of competition inform our analysis of whether there is a reasonable indication of material injury by reason of subject imports.
1. Demand Conditions
Demand for MSG is derived from the demand for the downstream products in which it is used.85 According to Petitioner, the U.S. market is comprised of four major segments: direct purchases by large‐scale food processors (such as ***) that account for about *** percent of the market; sales through distributors to the Chinese food service market; sales through other distributors; and sales to retail stores through distributors.86
According to Petitioner, the majority of MSG is sold pursuant to annual contracts to purchasers that often source MSG from multiple suppliers.87 It reports that the large‐scale industrial food processors are part of a concentrated universe of about 25 purchasers that
81 Mittal, 542 F.3d at 873 (quoting from Gerald Metals, 132 F.3d at 722), 875‐79 & n.2 (recognizing
the Commission’s alternative interpretation of Bratsk as a reminder to conduct a non‐attribution analysis).
82 To that end, after the Federal Circuit issued its decision in Bratsk, the Commission began to present published information or send out information requests in final phase investigations to producers in nonsubject countries that accounted for substantial shares of U.S. imports of subject merchandise (if, in fact, there were large nonsubject import suppliers). In order to provide a more complete record for the Commission’s causation analysis, these requests typically seek information on capacity, production, and shipments of the product under investigation in the major source countries that export to the United States. The Commission plans to continue utilizing published or requested information in final phase investigations in which there are substantial levels of nonsubject imports.
83 We provide in our respective discussions of volume, price effects, and impact a full analysis of other factors alleged to have caused any material injury experienced by the domestic industry.
84 Mittal, 542 F.3d at 873; Nippon, 458 F.3d at 1350, citing U.S. Steel, 96 F.3d at 1357; S. Rep. 96‐249 at 75 (“The determination of the ITC with respect to causation is ... complex and difficult, and is a matter for the judgment of the ITC.”).
85 CR at II‐9; PR at II‐6. 86 Confer. Tr. at 41‐42 (Naulty); Petitioner’s Postconf Br. at 7; Petitions, Vol. I at 8. 87 CR at I‐17; PR at I‐12; Petitioner’s Postconf Br. at 7; Petitions, Vol. I at 8.
17
typically negotiate annual contracts towards the end of each year for the following year.88 AJINA reports that sales to the Chinese food service market are somewhat more fragmented, although there are often master distributors that sell to lower tiers of distributors and ultimately to Chinese restaurants in the United States.89 For retail sales, Petitioner estimates there are two major and a few minor distributors that sell MSG packaged with other products to U.S. markets specializing in Chinese and Asian products.90
Most questionnaire respondents reported that U.S. demand for MSG increased over the POI.91 Questionnaire data indicate that MSG demand as measured by apparent U.S. consumption increased by *** percent by quantity between 2010 and 2012.92
2. Supply Conditions
During the POI, the U.S. market was supplied by the domestic industry, subject imports from China and Indonesia, and imports from nonsubject countries.93 The domestic industry supplied the largest share of the U.S. market during the POI (between *** and *** percent on an annual basis), followed by cumulated subject imports from China and Indonesia (*** to *** percent), and imports from nonsubject sources (*** to *** percent).94
AJINA, the sole domestic producer of MSG, dedicates its Eddyville, Iowa plant to producing MSG.95 Because MSG manufacturing involves high capital costs and uses living microorganisms in a continuous batch production process, AJINA operates its production facility 24 hours a day all year, apart from maintenance downtime.96
The record suggests that the MSG industry in China has *** capacity and production than ***.97 Indonesia ***.98 There are over 15 MSG producers in China.99 Petitioner estimates that two of these firms (Fufeng Group Ltd. and Meihua Holdings Group Co., Ltd.) possess massive MSG production capacity and currently account for “the great majority of” MSG exports from China.100 The record indicates only one producer in Indonesia that exports MSG
88 Confer. Tr. at 41 (Naulty). 89 Confer. Tr. at 41 (Naulty). 90 Confer. Tr. at 41‐42 (Naulty). 91 CR/PR at Table II‐3. 92 Apparent U.S. consumption was *** pounds in 2010, *** pounds in 2011, *** pounds in 2012, ***
pounds in January to June (“interim”) 2012, and *** pounds in interim 2013. CR/PR at Table IV‐4. 93 CR/PR at Table IV‐4. 94 CR/PR at Table IV‐5, Table C‐1. 95 Confer. Tr. at 14, 36 (Naulty); Petitions, Vol. I at 3. 96 Confer. Tr. at 14, 27, 36; Petitions, Vol. I at 19‐20. 97 CR/PR at Table VII‐5. 98 CR/PR at Table VII‐5. 99 CR at VII‐3; PR at VII‐2 to VII‐3. 100 Petitions, Vol. I at 11‐12, Exhibit I‐8.A, I‐9.A. Fufeng Group has several facilities and subsidiaries
producing MSG, including Shandong Fufeng Fermentation Co., Ltd., Baoji Fufeng Biotechnologies Co., Ltd., Hulunbeir Northeast Fufeng Biotechnologies Co., Ltd., Neimenggu Fufeng Biotechnologies Co., Ltd., and Xinjiang Fufeng Biotechnologies Co., Ltd. Petitions, Vol. I at 11 n.21, Exhibit I‐10.
18
to the United States, C.J. Indonesia.101 This firm reportedly is related to a former MSG producer in Korea that ceased exporting to the United States in 2008, stopped production in Korea, expanded production in Indonesia, and then rapidly returned to the U.S. market in the fourth quarter of 2011.102
Nonsubject imports supplied a smaller share of the U.S. market than either the domestic industry or cumulated subject imports.103 The record shows that the largest source of nonsubject imports during the POI was Brazil, which accounted for 78.9 percent of nonsubject imports in 2012, and that ***.104 Other sources of nonsubject imports included ***.105
3. Substitutability
Most market participants reported that subject imports from China and Indonesia are at least sometimes interchangeable with one another and with the domestic like product.106 They also reported that differences other than price among subject imports from China and Indonesia and the domestic like product are either sometimes or never a factor in sales of MSG.107 Petitioner reports that there are no “grades” or “flavors” of MSG, and that the different crystal sizes (e.g., regular, fine, and extra fine) are not differentiated by price.108 According to Petitioner, many of the large‐scale food producers have 3‐12 month qualification procedures, but the larger producers in China and Indonesia have met these requirements already, either with international affiliates (qualifying them to serve the U.S. market) or directly with the U.S. purchasers.109 Thus, the current record indicates that MSG imported from China and Indonesia is highly substitutable for the domestic like product and that competition in the U.S. market largely depends on price.110
4. Other Conditions
The primary raw material to produce MSG is the carbohydrate or dextrose source, which for AJINA is corn‐derived glucose, and which represents *** of the variable cost to produce MSG.111 AJINA’s other key raw materials include ***.112 Because the firm runs a continuous batch operation, it negotiates annual contracts for its raw materials but leaves a portion of its requirements open to purchase through spot sales.113
101 CR at VII‐4; PR at VII‐3. Petitioner’s Postconf Br. at 29; Petitions, Vol. I at 12, Exhibit I‐8.B, I‐9.B. 102 Confer. Tr. at 20 (Naulty). 103 CR/PR at Table IV‐5, Table C‐1. 104 CR at II‐8; PR at II‐5. 105 CR/PR at Table IV‐1. 106 CR/PR at Table II‐4. 107 CR/PR at Table II‐5. 108 CR at II‐1; PR at II‐1; Petitioner’s Postconf Br. at 14. 109 Petitions, Vol. I at 21. 110 CR at II‐11; PR at II‐7‐II‐8; CR/PR at Table II‐4, Table II‐5. 111 CR at V‐1; PR at V‐1; Petitioner’s Postconf Br. at Exhibit 1 at 5‐6; Petitions, Vol. I at 20. 112 Petitioner’s Postconf Br. at Exhibit 1 at 6. 113 Confer. Tr. at 49 (Naulty).
19
MSG is distributed to end users and distributors, predominantly in 50‐pound and 25‐kilogram bags and 100‐pound fiber drums or boxes, but also in bulk quantities up to one metric ton in “supersacks” or in small retail packs of 5‐ounce bags, 1‐pound bags, 3‐pound bags, or 1‐pound boxes.114 Petitioner reports that it competes against subject imports from China and Indonesia mostly for industrial sales to large‐scale food processors, secondarily for sales to the Chinese food service market, and to a lesser extent for sales to retail stores, although it does compete against Indonesia in the retail sector.115 Some firms reported importing MSG from both China and Indonesia and purchasing the domestically manufactured product.116
AJINA and most importers reported selling most of their product ***.117 We intend to gather more information about how MSG is sold in any final phase of these investigations.
C. Volume of Subject Imports
Section 771(7)(C)(i) of the Tariff Act provides that the “Commission shall consider whether the volume of imports of the merchandise, or any increase in that volume, either in absolute terms or relative to production or consumption in the United States, is significant.”118
Cumulated subject imports had a significant and increasing presence in the U.S. market during the POI. The volume of cumulated subject imports was 27.7 million pounds in 2010, 56.7 million pounds in 2011, and 66.0 million pounds in 2012.119
As explained above, demand as measured by apparent U.S. consumption rose *** percent from 2010 to 2012.120 The volume of cumulated subject imports of MSG rose at a much higher rate, increasing 138.7 percent from 2010 to 2012.121 Consequently, cumulated subject imports progressively increased their share of apparent U.S. consumption, by quantity, from *** percent in 2010 to *** percent in 2011 and *** percent in 2012, for an overall
114 CR at I‐17; PR at I‐12; Petitioner’s Postconf Br. at 7; Petitions, Vol. I at 8, 10. 115 Confer. Tr. at 42 (Naulty). 116 CR/PR at Table IV‐1 (showing overlap for importers ***). Furthermore, questionnaire responses
show that the domestic producer shares certain large customers with importers of subject merchandise, including ***, because customers often procure MSG from more than one source. Petitioner’s Postconf Br. at 11‐12; Petitions, Vol. I at 8; Importer Questionnaire Responses of *** at III‐20 (reporting sales to ***), *** at III‐20 (reporting sales to ***); Importer Questionnaire Response of *** at II‐5a, II‐5b (reporting imports from ***).
117 CR at V‐3 to V‐4; PR at V‐3; CR/PR at Table V‐2 (showing AJINA sold *** percent of its MSG through short‐term contracts and *** percent on the spot market, compared to *** percent through short‐term contracts and *** percent spot‐market sales for importers of subject merchandise from China and *** percent through short‐term contracts and *** percent spot‐market sales for importers of subject merchandise from Indonesia).
118 19 U.S.C. § 1677(7)(C)(i). 119 The volume of cumulated subject imports was 31.6 million pounds in interim 2012 and 30.9
million pounds in interim 2013. CR/PR at Table IV‐4. 120 CR/PR at Table IV‐4, Table C‐1. 121 Apparent consumption was *** percent lower in interim 2013 than in interim 2012, whereas the
volume of subject imports was only 2.2 percent lower in interim 2013 than in interim 2012. CR/PR at Table IV‐1, Table C‐1.
20
increase of *** percentage points.122 This gain in market share between 2010 and 2012 came at the domestic industry’s expense.123
Cumulated subject imports of MSG were also significant and increased significantly relative to domestic production over the POI.124
We find for purposes of the preliminary phase of these investigations that the cumulated volume of subject imports, and the increase in that volume, is significant both in absolute terms and relative to consumption and production in the United States.
D. Price Effects of the Subject Imports
Section 771(7)(C)(ii) of the Tariff Act provides that, in evaluating the price effects of subject imports, the Commission shall consider whether –
(I) there has been significant price underselling by the imported merchandise as compared with the price of domestic like products of the United States, and (II) the effect of imports of such merchandise otherwise depresses prices to a significant degree or prevents price increases, which otherwise would have occurred, to a significant degree.125
As we found above, there is a high degree of substitutability among subject imports from China and Indonesia and the domestic like product, and price is an important consideration in purchasing decisions.126 Thus, the current record suggests that competition in the U.S. market depends largely on price.127
122 Subject imports’ U.S. market share by quantity was *** percentage points higher in interim 2013
(*** percent) than in interim 2012 (*** percent). 123 The domestic industry’s market share by quantity decreased steadily from *** percent in 2010 to
*** percent in 2011 and *** percent in 2012, although its market share was *** percentage points higher in interim 2013 (*** percent) than in interim 2012 (*** percent). CR/PR at Table IV‐5, Table C‐1. The volume of nonsubject imports grew from a considerably smaller base of 1.8 million pounds in 2010 to 13.1 million pounds in 2012, and was 43.5 percent lower in interim 2013 (5.0 million pounds) than in interim 2012 (8.9 million pounds). Nonsubject imports’ share of apparent U.S. consumption, by quantity, increased *** percentage points from *** percent in 2010 to *** percent in 2012, but was *** percentage points lower in interim 2013 (*** percent) than in interim 2012 (*** percent). CR/PR at Table IV‐4, Table IV‐5, Table C‐1.
124 The volume of cumulated subject imports was equivalent to *** percent of U.S. production in 2010, *** percent in 2011, *** percent in 2012, *** percent in interim 2012, and *** percent in interim 2013. CR/PR at Table IV‐6.
125 19 U.S.C. § 1677(7)(C)(ii). 126 CR/PR at Table II‐4, Table II‐5. 127 As evidence of the greatly increased role that price has played in purchasing decisions in recent
years, Petitioner points to an increase in the number of customers employing “***.” Petitioner’s Postconf Br. at 15, Exhibit 1 at 6‐8. Relatedly, it reports that some purchasers now use reverse auctions, setting a price that they will require as a beginning bid, and seeking progressively lower prices from suppliers. Petitioner’s Postconf Br. at 15, Exhibit 1 at 4‐8, Exhibit 1.B, Exhibit 1.D; Confer. Tr. at 28 (Continued…)
21
The Commission obtained quarterly weighted‐average pricing data for three MSG products from the domestic producer and nine responding U.S. importers.128 According to these data, cumulated subject imports undersold the domestic like product in *** out of 59 possible quarterly comparisons and oversold it in the remaining *** comparisons.129 Subject imports’ margins of underselling ranged from *** to *** percent during the POI.130 Thus, we find that cumulated subject imports undersold the domestic like product to a significant degree.
In addition, there were a number of confirmed instances in which the domestic industry lost sales and revenue due to competition from subject imports.131 Three of ten responding purchasers reported shifting their purchases of MSG from the domestic industry to subject imports, and two of them reported that price was the reason for the shift.132 Indeed, as discussed above, cumulated subject imports increased market share at the expense of the domestic industry during the POI.133 In addition, four of seven responding purchasers reported that the domestic industry reduced its prices in order to compete with subject imports from China and Indonesia.134
We have also considered changes in U.S. and subject import prices over the POI. MSG price trends appear to be influenced, at least in part, by fluctuations in raw material costs, most notably the corn or other carbohydrate source that accounts for *** of the variable cost to produce MSG.135 Record data show that the domestic industry’s weighted average prices for all three pricing products increased overall between January 2010 and June 2013, although prices declined somewhat towards the end of this period.136 Based on the current record, we do not find that subject imports depressed prices to a significant degree.
(…Continued) (Malashevich), 51 (Naulty); Petitions, Vol. I at 26‐27. In any final phase of these investigations, we intend to further explore the role of these conditions of competition.
128 The pricing products include the following: (1) MSG fine, 50‐pound paper bag; (2) MSG regular, 50‐pound paper bag; and (3) MSG regular, in a 100‐pound fiber drum. The pricing data accounted for approximately *** percent of the domestic industry’s U.S. shipments of MSG, 85.8 percent of U.S. shipments of subject imports from China, and *** percent of U.S. shipments of subject imports from Indonesia. CR at V‐5 to V‐6; PR at V‐4 to V‐5. In any final phase of these investigations, we invite the parties in their comments on the draft questionnaires to address the suitability of these pricing products.
129 CR/PR at Table V‐7. 130 CR/PR at Table V‐7. 131 Thus far, purchasers have confirmed *** out of 21 lost sales allegations, valued at $***, and ***
out of 11 lost revenue allegations, valued at $***. CR/PR at Table V‐8, Table V‐9. 132 CR at V‐14; PR at V‐10. 133 CR/PR at Table IV‐5. 134 CR at V‐15; PR at V‐10. 135 Compare, e.g., CR/PR at Figure V‐1 (average monthly corn prices) with, e.g., CR/PR at Figures V‐2
to V‐4. 136 The domestic industry’s price for product 1 irregularly increased from $*** per pound in the first
quarter of 2010 to $*** per pound in the fourth quarter of 2011 and $*** per pound in the second quarter of 2013. CR/PR at Table V‐3. Its price for product 2 irregularly increased from $*** in the first (Continued…)
22
We have also examined whether subject imports have prevented price increases, that would have otherwise occurred, to a significant degree during the POI. As discussed above, apparent U.S. consumption increased *** percent from 2010 to 2012.137 During that time, the domestic industry’s unit net sales value also increased from $*** in 2010 to $*** in 2011 and $*** in 2012, representing an overall increase of *** percent.138 That increase, however, was insufficient to cover cost increases, as the domestic industry’s unit COGS increased at a greater rate, rising from $*** in 2010 to $*** in 2011 and $*** in 2012, for an overall increase of *** percent.139 As a result, the domestic industry’s COGS as a ratio to net sales increased steadily from *** percent in 2010 to *** percent in 2011 and *** in 2012.140 Consequently, we find that the domestic industry was unable to raise prices sufficiently to cover increasing costs at a time when the volume of cumulated subject imports was increasing at a significant rate, subject imports were predominantly underselling the domestic like product, and the domestic industry was losing market share to subject imports.141 Thus, for the purposes of our preliminary determinations, we find evidence that subject imports prevented price increases, that otherwise would have occurred, to a significant degree. 142
Given the importance of price in purchasing decisions and the existence of confirmed lost sales and revenue data, we find that the significant volume of cumulated subject imports increased substantially by underselling the domestic like product at significant margins. We also find for purposes of these preliminary determinations evidence that subject imports suppressed prices of the domestic like product to a significant degree.
(…Continued) quarter of 2010 to $*** in the third quarter of 2011 and $*** in the second quarter of 2013. CR/PR at Table V‐4. Its price for product 3 irregularly increased from $*** per pound in the first quarter to 2010 to $*** per pound in the fourth quarter of 2012 and $*** per pound in the second quarter of 2013. CR/PR at Table V‐5.
137 Apparent U.S. consumption in interim 2013 was *** percent lower than in interim 2012. CR/PR at Table IV‐5, Table C‐1.
138 The domestic industry’s unit net sales value was $*** in interim 2012 and $*** in interim 2013. CR/PR at Table VI‐1, Table C‐1.
139 Unit COGS were $*** in interim 2012 and $*** in interim 2013. CR/PR at Table VI‐1, Table C‐1. 140 The ratio of COGS to net sales was *** percent in interim 2012 and *** percent in interim 2013.
CR/PR at Table VI‐1, Table C‐1. 141 CR/PR at Table IV‐5, Table VI‐1, Table C‐1. 142 Industrial user and purchaser Griffith argues that during the POI, AJINA had been able to increase
its MSG prices when its corn prices increased, but because it had “cornered the market,” AJINA would not lower the prices it offered Griffith when corn prices fell. Griffith’s Written Statement at 4. Griffith further argues that negotiations of MSG prices ***. Id. at 5‐6. In any final phase of these investigations, we will further examine the relationship between raw material costs and any suppression of domestic MSG prices, as well as the ***.
23
E. Impact of the Subject Imports143
Section 771(7)(C)(iii) of the Tariff Act provides that the Commission, in examining the impact of the subject imports on the domestic industry, “shall evaluate all relevant economic factors which have a bearing on the state of the industry.” These factors include output, sales, inventories, capacity utilization, market share, employment, wages, productivity, profits, cash flow, return on investment, ability to raise capital, research and development, and factors affecting domestic prices. No single factor is dispositive and all relevant factors are considered “within the context of the business cycle and conditions of competition that are distinctive to the affected industry.”
During the POI, despite rising apparent U.S. consumption, many of the domestic industry’s indicators fell or did not improve at the same pace as apparent U.S. consumption.144 The domestic industry’s U.S. shipments steadily declined from *** pounds in 2010 to *** pounds in 2011 and *** pounds in 2012, representing an overall decline of *** percent, despite a *** percent increase in apparent U.S. consumption.145 Net sales by quantity and value fell by *** and *** percent, respectively.146 Consequently, as discussed above, the domestic industry’s share of the U.S. market declined from *** percent in 2010 to *** percent in 2012.147
The domestic industry’s production capacity *** between 2010 and 2012, but its production declined *** percent overall, from *** pounds in 2010 to *** pounds in 2011 and *** pounds in 2012.148 Consequently, its capacity utilization declined *** percentage points during that time, falling from *** percent in 2010 to *** percent in 2011, and *** percent in 2012.149 The domestic industry’s end‐of‐period inventories rose throughout the POI, both
143 In its notice initiating the antidumping duty investigations of MSG imports from China and
Indonesia, Commerce reported estimated antidumping duty margins of 72.59 percent for imports from China and 55.25 percent for imports from Indonesia. CR at I‐9; PR at I‐6.
144 As discussed above, apparent U.S. consumption increased *** percent between 2010 and 2012. CR/PR at Table IV‐5, Table C‐1.
145 The domestic industry’s U.S. shipments were *** pounds in interim 2012 and *** pounds in interim 2013. CR/PR at Table III‐2, Table C‐1.
146 In interim 2013, net sales by quantity were ***, whereas net sales by value were *** percent lower than in interim 2012. CR/PR at Table VI‐1, Table C‐1.
147 The domestic industry’s market share in interim 2013 (*** percent) was *** percentage points higher than in interim 2012 (*** percent). CR/PR at Table IV‐5, Table C‐1.
148 Capacity was *** pounds in interim 2012 and interim 2013. CR/PR at Table III‐1, Table C‐1. Production in interim 2013 (*** pounds) was *** percent higher than in interim 2012 (*** pounds). CR/PR at Table III‐1, Table C‐1.
149 Capacity utilization was *** percent in interim 2012 and *** percent in interim 2013. CR/PR at Table III‐1, Table C‐1. As discussed above, AJINA reported operating its plant at high levels 24 hours a day all year, apart from maintenance downtime, due to the high capital costs associated with MSG manufacturing and the need to use living microorganisms in a continuous batch production process. Thus, high levels of capacity utilization are not unexpected in this industry.
24
absolutely and as a share of domestic production and shipments.150 The number of production workers, hours worked, and wages paid grew, while productivity declined overall.151
Several key financial indicators declined. The domestic industry’s aggregate operating income declined from profits of $*** in 2010, $*** in 2011, and $*** in 2012, to an operating loss in interim 2013.152 The domestic industry’s ratio of operating income to net sales fell by *** percentage points from 2010 to 2012, with operating margins declining from *** percent in 2010 to *** percent in 2011 and *** percent in 2012.153 Although the domestic industry made capital expenditures and invested in research and development throughout the POI, AJINA reported that its inability to operate at full capacity limited the benefit of these investments.154
For purposes of these preliminary determinations, we find that the cumulated subject imports had a significant adverse impact on the domestic industry. As described above, even though apparent U.S. consumption was rising, significant and increasing volumes of low‐priced subject imports from China and Indonesia took market share from the domestic industry and caused it to lose sales and revenue. We have also found that subject imports suppressed the domestic industry’s prices to a significant degree. Unable to increase its prices to sufficiently cover rising costs or to operate at what it deems to be optimal capacity utilization levels, the domestic industry deteriorated from profitability in 2010 to operating losses by the end of the POI, and its end‐of‐period inventories mounted.
We have considered whether there are other factors that may have had an adverse impact on the domestic industry during the POI to ensure that we are not attributing any injury from other such factors to the subject imports. As discussed above, the largest source of nonsubject imports was Brazil, but these imports were smaller in magnitude than the volume of cumulated subject imports throughout the POI. ***. Nevertheless, nonsubject imports
150 End‐of‐period inventories were *** pounds in 2010, *** pounds in 2011, *** pounds in 2012, ***
pounds in interim 2012, and *** pounds in interim 2013. Expressed as a ratio to domestic production, they were *** percent in 2010, *** percent in 2012, *** percent in interim 2012, and *** percent in interim 2013, and as a ratio to the domestic industry’s total shipments, they were *** percent in 2010, *** percent in 2012, *** percent in interim 2012, and *** percent in interim 2013. CR/PR at Table III‐3, Table C‐1.
151 The number of production workers was *** in 2010, *** in 2011, *** in 2012, *** in interim 2012, and *** in interim 2013. The total hours worked were *** in 2010, *** in 2011, *** in 2012, *** in interim 2012, and *** in interim 2013. Wages paid were $*** in 2010, $*** in 2011, $*** in 2012, $*** in interim 2012, and $*** in interim 2013. Productivity per hour was *** pounds in 2010, *** pounds in 2011, *** pounds in 2012, *** pounds in interim 2012, and *** pounds in interim 2013. CR/PR at Table III‐5, Table C‐1.
152 The domestic industry’s aggregate operating income was $*** in interim 2012, but it had an aggregate operating loss of $*** in interim 2013. CR/PR at Table VI‐1, Table C‐1.
153 The domestic industry’s operating margin was *** percent in interim 2012 and negative *** percent in interim 2013. CR/PR at Table VI‐1, Table C‐1.
154 The domestic industry’s aggregate capital expenditures were $*** in 2010, $*** in 2011, $*** in 2012, $*** in interim 2012, and $*** in interim 2013. Its research and development expenditures were $*** in 2010, $*** in 2011, $*** in 2012, $*** in interim 2012, and $*** in interim 2013. CR/PR at Table VI‐3; Confer. Tr. at 16‐17 (Naulty); Petitions, Vol. I at 28.
25
increased market share between 2010 and 2012, increasing from *** percent in 2010 to *** percent in 2011 and *** percent in 2012.155 According to pricing data reported by one importer of MSG from the largest source of nonsubject imports (Brazil), nonsubject imports from Brazil ***.156 This is in contrast to subject imports, which we have found undersold the domestic like product in the majority of possible comparisons. Thus, the volume and price effects we have found to be caused by subject imports are distinguishable from any effects caused by nonsubject imports.157
Consequently, we conclude for purposes of these preliminary determinations that subject imports had a significant adverse impact on the domestic industry. In light of this, we find a reasonable indication that the domestic industry is materially injured by reason of cumulated subject imports.
Conclusion VII.
For the reasons stated above, we determine that there is a reasonable indication that an industry in the United States is materially injured by reason of subject imports of MSG from China and Indonesia that are allegedly sold in the United States at less‐than‐fair value and subsidized by the Governments of China and Indonesia.
155 Nonsubject imports’ share of the U.S. market was *** percent in interim 2012 and *** percent in
interim 2013. CR/PR at Table IV‐5, Table C‐1. In any final phase of these investigations, we intend to further investigate the role of nonsubject imports, including AJINA’s imports from nonsubject countries, as well as the reason for any increased volumes of nonsubject imports between 2010 and 2012.
156 CR at D‐3; PR at D‐3; compare CR/PR at Table V‐2 to V‐5 with CR/PR at Table D‐1. 157 Based on the available evidence in these preliminary investigations, Commissioner Pinkert finds
that nonsubject imports are price‐competitive and a significant factor in the U.S. market. Regardless of whether MSG is a commodity product for purposes of a Bratsk/Mittal Steel analysis, however, he finds that nonsubject imports would not have replaced subject imports without benefitting the domestic industry had subject imports exited the market, because any such replacement would likely have been at higher prices. Reported prices for imports from Brazil, the largest source of nonsubject imports, are generally higher than subject import prices, and the average unit values of nonsubject imports were consistently higher than those of the subject imports. CR at D‐3; PR at D‐3; CR/PR at Table IV‐2.

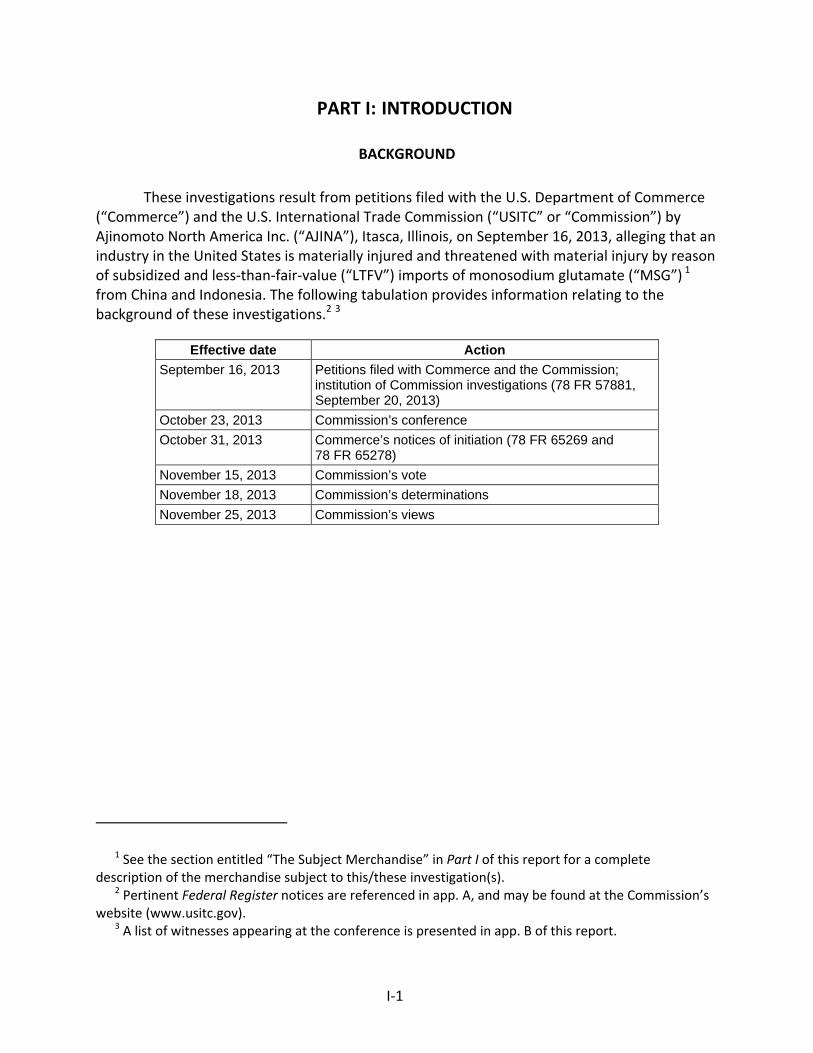
I‐1
PART I: INTRODUCTION
BACKGROUND
These investigations result from petitions filed with the U.S. Department of Commerce (“Commerce”) and the U.S. International Trade Commission (“USITC” or “Commission”) by Ajinomoto North America Inc. (“AJINA”), Itasca, Illinois, on September 16, 2013, alleging that an industry in the United States is materially injured and threatened with material injury by reason of subsidized and less‐than‐fair‐value (“LTFV”) imports of monosodium glutamate (“MSG”) 1 from China and Indonesia. The following tabulation provides information relating to the background of these investigations.2 3
Effective date Action September 16, 2013 Petitions filed with Commerce and the Commission;
institution of Commission investigations (78 FR 57881, September 20, 2013)
October 23, 2013 Commission’s conference October 31, 2013 Commerce’s notices of initiation (78 FR 65269 and
78 FR 65278) November 15, 2013 Commission’s vote November 18, 2013 Commission’s determinations November 25, 2013 Commission’s views
1 See the section entitled “The Subject Merchandise” in Part I of this report for a complete description of the merchandise subject to this/these investigation(s).
2 Pertinent Federal Register notices are referenced in app. A, and may be found at the Commission’s website (www.usitc.gov).
3 A list of witnesses appearing at the conference is presented in app. B of this report.
I‐2
STATUTORY CRITERIA AND ORGANIZATION OF THE REPORT
Statutory criteria
Section 771(7)(B) of the Tariff Act of 1930 (the “Act”) (19 U.S.C. § 1677(7)(B)) provides that in making its determinations of injury to an industry in the United States, the Commission‐‐
shall consider (I) the volume of imports of the subject merchandise, (II) the effect of imports of that merchandise on prices in the United States for domestic like products, and (III) the impact of imports of such merchandise on domestic producers of domestic like products, but only in the context of production operations within the United States; and. . . may consider such other economic factors as are relevant to the determination regarding whether there is material injury by reason of imports.
Section 771(7)(C) of the Act (19 U.S.C. § 1677(7)(C)) further provides that‐‐
In evaluating the volume of imports of merchandise, the Commission shall consider whether the volume of imports of the merchandise, or any increase in that volume, either in absolute terms or relative to production or consumption in the United States is significant. . . . In evaluating the effect of imports of such merchandise on prices, the Commission shall consider whether. . .(I) there has been significant price underselling by the imported merchandise as compared with the price of domestic like products of the United States, and (II) the effect of imports of such merchandise otherwise depresses prices to a significant degree or prevents price increases, which otherwise would have occurred, to a significant degree. . . . In examining the impact required to be considered under subparagraph (B)(i)(III), the Commission shall evaluate (within the context of the business cycle and conditions of competition that are distinctive to the affected industry) all relevant economic factors which have a bearing on the state of the industry in the United States, including, but not limited to . . . (I) actual and potential decline in output, sales, market share, profits, productivity, return on investments, and utilization of capacity, (II) factors affecting domestic prices, (III) actual and potential negative effects on cash flow, inventories, employment, wages, growth, ability to raise capital, and investment, (IV) actual and potential negative effects on the existing development and production efforts of the domestic industry, including efforts to develop a derivative or more advanced version of the
I‐3
domestic like product, and (V) in {an antidumping investigation}, the magnitude of the margin of dumping.
Organization of report
Part I of this report presents information on the subject merchandise, alleged subsidy/dumping margins, and domestic like product. Part II of this report presents information on conditions of competition and other relevant economic factors. Part III presents information on the condition of the U.S. industry, including data on capacity, production, shipments, inventories, and employment. Parts IV and V present the volume of subject imports and pricing of domestic and imported products, respectively. Part VI presents information on the financial experience of U.S. producers. Part VII presents the statutory requirements and information obtained for use in the Commission’s consideration of the question of threat of material injury as well as information regarding nonsubject countries.
MARKET SUMMARY
MSG is a food additive and mainly used as a flavor enhancer in soups, broths, fish, meats, breading, seasonings, spice blends, vegetable juices, beverages, ready‐made foods, frozen meals, sauces, and dressings. AJINA is the sole U.S. producer of MSG, while leading producers of MSG outside the United States include Fufeng Group and Meihua Group of China and P.T. Cheil Jedang Indonesia (“PT CJI”) of Indonesia. The leading U.S. importers of MSG from China are ***,4 while the leading importer of MSG from Indonesia is CJ America. *** is the leading importer of product from nonsubject countries (primarily ***). U.S. purchasers of MSG are primarily firms that use it as a flavor enhancer for food. The main market segments of purchasers are large‐scale food processors5 (including seasonings, who generally purchase directly from producers comprising the industrial food segment), the Chinese food service trade (who generally purchase through distributors), other distributors and retail stores (who also purchase through distributors); the industrial food segment constitutes the largest single market segment.
Apparent U.S. consumption of MSG totaled approximately *** pounds ($***) in 2012. AJINA’s U.S. shipments of MSG totaled *** pounds ($***) in 2012, and accounted for *** percent of apparent U.S. consumption by quantity and *** percent by value. U.S. imports from subject sources totaled 66.0 million pounds ($49.3 million) in 2012 and accounted for *** percent of apparent U.S. consumption by quantity and *** percent by value. U.S. imports from nonsubject sources totaled 13.1 million pounds ($11.4 million) in 2012 and accounted for *** percent of apparent U.S. consumption by quantity and *** percent by value.
4 ***. 5 Examples of such firms include ***.
I‐4
SUMMARY DATA AND DATA SOURCES
A summary of data collected in these investigations is presented in appendix C, table C‐1. U.S. industry data are based on the questionnaire response of AJINA that accounted for all U.S. production of MSG during the period of investigation. U.S. imports are based on official import data and on questionnaire responses from 12 U.S. importers that are believed to have accounted for 49.5 percent of imports from China and virtually all imports from Indonesia between January 2010 and June 2013.
PREVIOUS AND RELATED INVESTIGATIONS
The Commission conducted one previous antidumping investigation concerning MSG from Korea under the Antidumping Act of 1921. In Inquiry No. AA1921‐Inq.‐5, it found that an industry in the United States was being or was likely to be injured, or was prevented from being established, by reason of imports of MSG from Korea possibly sold at less than fair value.6
NATURE AND EXTENT OF ALLEGED SUBSIDIES AND SALES AT LTFV
Alleged subsidies
On October 31, 2013, Commerce published a notice in the Federal Register of the initiation of its countervailing duty investigations on MSG from China and Indonesia.7 Commerce initiated a CVD investigation of the following 49 alleged subsidy programs in China.
A. Preferential Loans and Interest Rates 1. Policy Loans
2. Loans to Uncreditworthy Enterprises 3. West Development Campaign 4. Tibet Region’s Favorable Interest Loans and Preferential Tax Treatments 5. Northeast Region Revitalization 12th Five‐Year Plan
B. Preferential Tax Programs 6. Transitional Enterprise Income Tax Preferential Policies 7. Preferential Income Tax Rate 8. Preferential Business Tax Rate 9. Income Tax Reduction for High and New Enterprises
6 Monosodium Glutamate from Korea, Negative Determination of “No Reasonable Indication of Injury” in Inquiry No. AA1921‐Inq.‐5 Under the Antidumping Act, 1921, as Amended, USITC Publication 778, June 1976.
7 Monosodium Glutamate From the People’s Republic of China and the Republic of Indonesia: Initiation of Countervailing Duty Investigations, 78 FR 65269, October 31, 2013.
I‐5
10. Transportation Tax Waivers 11. Preferential Income Tax Policies for Enterprises in the West Development Region 12. Preferential Income Tax Policies for Enterprises in Tibet 13. Preferential Income Tax Policies for Enterprises in Shandong Province 14. Preferential Income Tax Policies for Enterprises in Xinjiang Region 15. Preferential Income Tax Policies for Enterprises in the Inner Mongolia
Autonomous Region 16. Township Rural‐Area Benefits
C. Preferential Indirect Tax Programs: Value Added Tax (VAT) Reductions, Export Tax Rebates, and Import Tariff Eliminations Reduced VAT and Offsets for Encouraged Industries 17. VAT Reductions for Preferred Enterprises in Favored Industries that Export
Certain Products 18. VAT and Tariff Exemptions on Imported Equipment for Favored Industries
D. Provision of Inputs, Services, and Land for Less than Adequate Remuneration (LTAR) 19. Provision of Corn for LTAR 20. Provision of Electricity for LTAR 21. Provision of Land for LTAR
E. Grant Programs 22. Grants Promoting Rationalization 23. Grants for Relocation to the “Corn Belt” 24. Grants for Relocation to the “Coal Belt” 25. Grants for Modernization and New Equipment 26. The State Key Technology Project Fund 27. Grants Provided in Support of Agricultural Development Projects 28. Subsidies for Development of “China Famous Brands” 29. Special Fund for Energy Saving Technology Reform 30. Fund for Clean Production and Water Treatment 31. Grants for “Going Public” 32. Regional Grants – Xinjiang Region 33. Regional Grants – Shandong 34. Regional Grants – Inner Mongolia
F. Special Economic Zones 35. Langfang Economic and Technical Development Zone 36. Baoji High‐ and New‐Tech Industrial Development Zone 37. Hohhot Economic and Technical Development Zone 38. Jining High‐New Tech Industrial Development Zone 39. Chiping Economic Development Zone 40. Yongning Yanghe Industrial Park 41. Junan Economic Development Zone
G. Subsidies for Foreign Invested Enterprises (FIEs) 42. “Two Free, Three Half” Program 43. Reduced Income Tax Rates for FIEs Based on Location
I‐6
44. Preferential Direct Tax Treatment for Purchases of Domestically‐Made Equipment
45. VAT and Tariff Exemptions for FIEs and Certain Domestic Enterprises Using Imported Equipment in Encouraged Industries
46. VAT Refunds for FIEs on Purchases of Chinese‐made Equipment 47. Reduced Tax Rates for FIEs Recognized as High or New Technology Enterprises 48. Reduced Income Tax Rates for FIEs Engaged in R&D 49. Reduced Income Tax Rates for Export‐Oriented FIEs
Commerce initiated a CVD investigation of the following 10 alleged subsidy programs in Indonesia.
A. Preferential Tax Programs 1. Income Tax Reduction under Article 31E 2. Tax Programs Provided by Indonesia’s Capital Investment Coordinating Board
(BKPM); Tax Incentives for Investment in Priority Industries (5 programs) B. Preferential Treatment for Bonded Zone Locations (4 programs)
Alleged sales at LTFV
On October 31, 2013, Commerce published a notice in the Federal Register of the initiation of its antidumping duty investigations of MSG from China and Indonesia.8 Commerce has initiated antidumping duty investigations based on estimated dumping margins of 72.59 percent for product from China and 55.25 percent for product from Indonesia.
THE SUBJECT MERCHANDISE
Commerce’s scope
Commerce has defined the scope of this investigation as follows:9
The scope of these investigations covers monosodium glutamate (“MSG”), whether or not blended or in solution with other products. Specifically, MSG that has been blended or is in solution with other product(s) is included in this scope when the resulting mix contains 15% or more of MSG by dry weight. Products with which MSG may be blended include, but are not limited to, salts, sugars, starches, maltodextrins, and various
8 Monosodium Glutamate From the People’s Republic of China, and the Republic of Indonesia: Initiation of Antidumping Duty Investigations, 78 FR 65278, October 31, 2013.
9 Monosodium Glutamate From the People’s Republic of China and the Republic of Indonesia: Initiation of Countervailing Duty Investigations, 78 FR 65269, October 31, 2013.
I‐7
seasonings. Further, MSG is included in these investigations regardless of physical form (including, but not limited to, substrates, solutions, dry powders of any particle size, or unfinished forms such as MSG slurry), end‐use application, or packaging. MSG has a molecular formula of C5H8NO4Na, a Chemical Abstract Service (“CAS”) registry number of 6106‐04‐3, and a Unique Ingredient Identifier (“UNII”) number of W81N5U6R6U. Merchandise covered by the scope of these investigations is currently classified in the Harmonized Tariff Schedule (“HTS”) of the United States at subheading 2922.42.10.00.Merchandise subject to the investigations may also enter under HTS subheadings 2922.42.50.00, 2103.90.72.00, 2103.90.74.00, 2103.90.78.00, 2103.90.80.00, and 2103.90.90.91.The tariff classifications, CAS registry number, and UNII number are provided for convenience and customs purposes; however, the written description of the scope is dispositive.
Tariff treatment
Based upon the scope set forth by the Department of Commerce, information available to the Commission indicates that MSG imported as a separate chemically identified compound is classifiable in subheading 2922.42.10 of the HTS. The column‐1 general rate of duty is 6.5 percent ad valorem. The provisions from chapter 21 cited by Commerce apply to edible preparations, mixed condiments, or mixed seasonings that may contain MSG; it is possible that some trade‐marked MSG products sold for food use might be imported there.10 The general rates of duty for those provisions vary widely, and some of these products are subject to tariff‐rate quotas upon entry. Other salts of glutamic acid would be classifiable in subheading 2922.42.50, at a general duty rate of 3.7 percent ad valorem.
10 The petitioner is not aware of any subject MSG being imported under the provisions from chapter 21 of the HTS. They state that “the reason that those additional HTS items are added is based on the company's experience in the European Union where an order is in place and there have been a number of circumvention efforts using other HTS codes to get around paying the duties in Europe.” Conference transcript, p. 38 (McPhie).
I‐8
THE PRODUCT
Description and applications
MSG is a white crystalline substance11 used by itself or in blends worldwide primarily as a flavor enhancer in savory foods, such as meat and fish, soups and broths, certain juices and beverages, frozen and ready‐made foods, and sauces and dressings.12 It is used in comparatively smaller volumes in nonfood products, such as detergents, cosmetics, and pharmaceuticals.13
MSG is a salt of glutamic acid,14 which is an amino acid that is synthesized by the human body and naturally present in protein‐containing foods such as meat, vegetables, poultry, and milk (fig. I‐1).15 First produced commercially in 1909 by Ajinomoto Corporation of Japan (the parent company of the petitioner), MSG is the largest‐volume amino acid salt produced in the world.16
11 MSG is sold in varying crystal sizes and is highly stable, odorless, and soluble in water. It has a Chemical Abstract Service (CAS) registry number of 6106‐04‐03 and a Unique Ingredient Identifier (UNII) number of W81N5U6R6U. Petition Vol. 1, p. 5. This CAS number corresponds to the monohydrate form having a molecular formula of C5H10NNaO5, whereas the molecular formula in the petition corresponds to the anhydrous form.
12 Petition Vol. 1, p. 6. 13 Petition Vol. 1, p. 6 and Exhibit I‐6.B. “{N}eglible” volumes of MSG are used in animal feeds
worldwide. ***. 14 ***. 15 ***. The human body breaks down proteins into their constituent amino acids, including glutamic
acid. As protein is present in many foods, so is glutamic acid. The human body does not synthesize MSG. 16 ***.
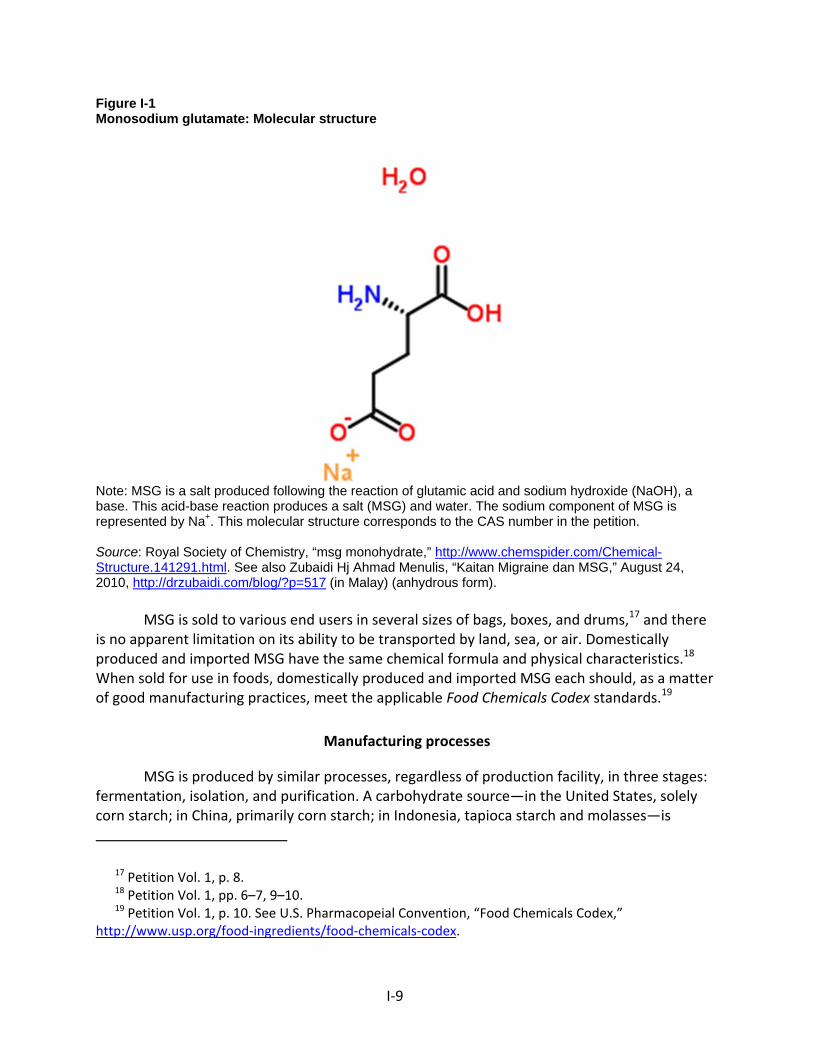
I‐9
Figure I-1 Monosodium glutamate: Molecular structure
Note: MSG is a salt produced following the reaction of glutamic acid and sodium hydroxide (NaOH), a base. This acid-base reaction produces a salt (MSG) and water. The sodium component of MSG is represented by Na+. This molecular structure corresponds to the CAS number in the petition. Source: Royal Society of Chemistry, “msg monohydrate,” http://www.chemspider.com/Chemical-Structure.141291.html. See also Zubaidi Hj Ahmad Menulis, “Kaitan Migraine dan MSG,” August 24, 2010, http://drzubaidi.com/blog/?p=517 (in Malay) (anhydrous form).
MSG is sold to various end users in several sizes of bags, boxes, and drums,17 and there
is no apparent limitation on its ability to be transported by land, sea, or air. Domestically produced and imported MSG have the same chemical formula and physical characteristics.18 When sold for use in foods, domestically produced and imported MSG each should, as a matter of good manufacturing practices, meet the applicable Food Chemicals Codex standards.19
Manufacturing processes
MSG is produced by similar processes, regardless of production facility, in three stages: fermentation, isolation, and purification. A carbohydrate source—in the United States, solely corn starch; in China, primarily corn starch; in Indonesia, tapioca starch and molasses—is
17 Petition Vol. 1, p. 8. 18 Petition Vol. 1, pp. 6–7, 9–10. 19 Petition Vol. 1, p. 10. See U.S. Pharmacopeial Convention, “Food Chemicals Codex,”
http://www.usp.org/food‐ingredients/food‐chemicals‐codex.
I‐10
fermented by use of Coryne Bacterium or Brevi Bacterium, nitrogen, oxygen, and various acids, minerals, and additives.20 After fermentation, the mixture is pasteurized and crystallized. The crystals are then processed into crude glutamic acid. This acid is neutralized with sodium hydroxide, filtered, sterilized, and concentrated. The concentrated MSG is dried, separated by particle size, and packed.21
DOMESTIC LIKE PRODUCT ISSUES
No issues with respect to domestic like product have been raised in these preliminary investigations. The petitioner contends there is a single domestic like product, coextensive with the scope of the investigation as defined by Commerce, which covers all MSG in all forms.22 It argues that all MSG shares the same chemical formula, regardless of crystal size, and most MSG meets even the strictest purity requirements for use in the food segment (its principal use), regardless of the segment in which it is used.23 Whereas some purchasers might prefer a particular particle size for specific applications and MSG should meet specific standards for sale for food or pharmaceutical uses, it argues that most MSG is interchangeable. All is made using the same production facilities, employees, and processes, except that different sieves are used to generate different sized granules.24 It argues that all MSG is sold through distributors or to end users, and that producers and customers generally perceive all MSG to be fit for use in all four major segments of the U.S. market.25 Petitioner contends that market participants do not differentiate prices by granular size or packaging but instead view MSG as a commodity product.26
The Commission’s decision regarding the appropriate domestic product(s) that are “like” the subject imported product is based on a number of factors including: (1) physical characteristics and uses; (2) common manufacturing facilities and production employees; (3) interchangeability; (4) customer and producer perceptions; (5) channels of distribution; and (6) price. Information regarding these factors is discussed below.
Physical characteristics and uses
As the most abundant amino acid, glutamate corresponds to the “meaty” taste of umami, which is the fifth of the basic tastes (the others being sweet, sour, salt, and bitter).27
20 Petition Vol. I, pp. 6–7. 21 Petition Vol. I, pp. 6–7; Addison Ault, “The Monosodium Glutamate Story: The Commercial
Production of MSG and Other Amino Acids,” Journal of Chemical Education 81, no. 3 (March 2004): 353. 22 AJINA’s postconference brief, p. 3. 23 AJINA’s postconference brief, pp. 4‐7; Petitions, Vol. I, pp. 9‐10. 24 AJINA’s postconference brief, pp. 5‐6, 8; Petitions, Vol. I, p. 9. 25 AJINA’s postconference brief, pp. 5‐8; Petitions, Vol. I, p. 9. 26 AJINA’s postconference brief, p. 8; Petitions, Vol. I, p. 9. 27 Conference transcript, p. 12 (Naulty).
I‐11
Glutamate is naturally present in many protein‐containing foods, including meat, seafood, aged cheese, and mother’s milk.28 MSG is the purest taste of umami.29 MSG is a highly stable, odorless sodium salt of the amino acid glutamic acid and corresponds to the molecular formula of C5H8NO4Na in anhydrous form or C5H10NNaO5 in monohydrate form.30
Although MSG may be produced in various crystal sizes (e.g., regular, fine, and extra fine) and/or to specific standards, Petitioner reports that these variances do not change or alter MSG’s chemical structure or basic physical characteristics.31
Petitioner asserts that there are no substitutes for MSG; it reports that attempts to use yeast extracts, soy sauce, or other products to substitute for the umami taste have not succeeded because those products have a lower concentration of the monosodium glutamate, do not produce the same flavor, and are not as economical.32
Manufacturing facilities and production employees
Domestic producer AJINA uses dedicated facilities to manufacture MSG. According to Petitioner, different forms or sizes of MSG are all produced in the same production facilities, using the same employees and processes, except that a different sized sieve is used to produce a different crystal size, sometimes even from the same production batch.33 Thus, it reports that the cost to produce different crystal sizes of MSG is the same.34
Interchangeability
Most MSG is used in food applications, and comparatively smaller volumes are used in nonfood products, such as detergents, cosmetics, and pharmaceuticals. Regardless of intended end use, Petitioner argues that all MSG made in the United States meets even the strict Food Chemical Codex specifications for sales in the food segment of the U.S. market.35 It contends that MSG of differing crystal sizes is otherwise identical, although certain end users might prefer a particular crystal size for their applications.36
28 Conference transcript, p. 13 (Naulty). 29 Conference transcript, p. 12 (Naulty). 30 AJINA’s postconference brief, p. 4; Petitions, Vol. I, p. 5. 31 AJINA’s postconference brief, p. 5; Petitions, Vol. I, p. 10. 32 Conference transcript, p. 48 (Naulty). 33 Conference transcript , p. 34 (Naulty); AJINA’s postconference brief, p. 6, and pp. 14‐15; Petitions,
Vol. I, p. 10. 34 Conference transcript, p. 50 (Naulty). 35 AJINA’s postconference brief, p. 6 and 8; Petitions, Vol. I, p. 10. 36 AJINA’s postconference brief, p. 6 and 8; Petitions, Vol. I, p. 10.
I‐12
Customer and producer perceptions
Because MSG is a commodity, Petitioner argues that producers and customers perceive all MSG to be the same product.37 Regardless of form, Petitioner reports that producers and customers find MSG is has the same structure and imparts the same general qualities when used, particularly given that most MSG is made to the highest purity specifications for use in food applications, regardless of intended use.38 Some purchasers prefer a particular size of the MSG granule, depending on the intended end use.39
Channels of distribution
MSG is distributed to both end users and distributors, predominantly in 50‐pound and 25‐kilogram bags and 100‐pound fiber drums or boxes, but may be sold in bulk quantities up to one metric ton “supersacks” or in small retail packs of 5‐ounce bags, 1‐pound bags, 3‐pound bags, or 1‐pound boxes.40 According to Petitioner, the majority of MSG is sold pursuant to annual contracts to purchasers that often source MSG from multiple suppliers.41 It reports that there are four general categories of customers: large‐scale food processors (such as *** that account for about *** percent of the market; distributors selling to the Chinese food service; other distributor sales; and distributors selling to retail stores.42
Price
According to Petitioner, customers perceive all MSG as a commodity, so all MSG competes primarily on the basis of price.43 It reports that purchasers generally do not differentiate MSG prices according to form, packaging size, or market segment, although different packaging forms themselves involve different costs.44
37 AJINA’s postconference brief, p. 7; Petitions, Vol. I, p. 10. 38 AJINA’s postconference brief, p.p 7‐8. 39 AJINA’s postconference brief, p. 5. 40 AJINA’s postconference brief, p. 7; Petitions, Vol. I, p. 8 and 10. 41 AJINA’s postconference brief, p. 7; Petitions, Vol. I, p. 8. 42 AJINA’s postconference brief, p. 7; Petitions, Vol. I, p. 8. 43 AJINA’s postconference brief, p. 8, 15; Petitions, Vol. I, pp. 18‐19. 44 AJINA’s postconference brief, p. 8 and 14; Petitions, Vol. I, p. 10 and 18.
II‐1
PART II: CONDITIONS OF COMPETITION IN THE U.S. MARKET
U.S. MARKET CHARACTERISTICS
The primary use of MSG is as a food additive, but it is also used in consumer products (such as in detergents) and industrial applications. According to Petitioner, “MSG used as a food additive must adhere to specifications set forth by the Food Chemicals Codex (FCC)(8th ed.) Similarly, MSG used in pharmaceutical products must satisfy the U.S. Pharmacopeia (“USP”) standards. All U.S. produced MSG meets both FCC and USP standards. Chinese and all Indonesian origin MSG also generally meets these specifications, although some MSG of lower purity is known to exist in China.”1 MSG is sold as a single commodity product with no differences in grades or flavors between domestic and foreign product. According to Petitioner, the “vast majority of MSG produced in the U.S. and in China and Indonesia meet the requirements for food safety,” there are no “grades” or “flavors” of MSG, and the range of different crystal sizes is not price‐differentiated.”2 In the petition, AJINA stated, “MSG is sold into four market segments ‐ large scale food processors, the Chinese food service trade, other distributors, and retail.”3
U.S. PURCHASERS
CHANNELS OF DISTRIBUTION
U.S. producers sold mainly to end users during the period of investigation (table II‐1). U.S. importers of Chinese product sold mainly to distributors in 2010 but sold more to end users in 2011 and 2012. U.S. importers of Indonesian product sold mostly to distributors in 2012. AJINA states that there “are four general categories of customers: (i) direct sales to large scale food processors, accounting for approximately *** percent of the market; (ii) sales to Chinese food service trade through distributors; (iii) sales through other distributors; and (iv) distributors for retail stores.”4 According to AJINA, there is customer concentration in the industrial large‐scale food processor segment—with an estimated 25 customers representing about 80 percent of the U.S. market. They add that the Chinese food service segment is a more fragmented, but is generally served by master distributors.5
1 Petitioner, postconference brief, p. 5. 2 Petitioner, postconference brief, p. 6 and 14. 3 Petition, p. 19. 4 Petitioner, postconference brief, p. 7 5 Conference transcript, p. 41 (Naulty). AJINA provided data indicating that ***. Petitioner,
postconference brief, Exhibit 1.B.
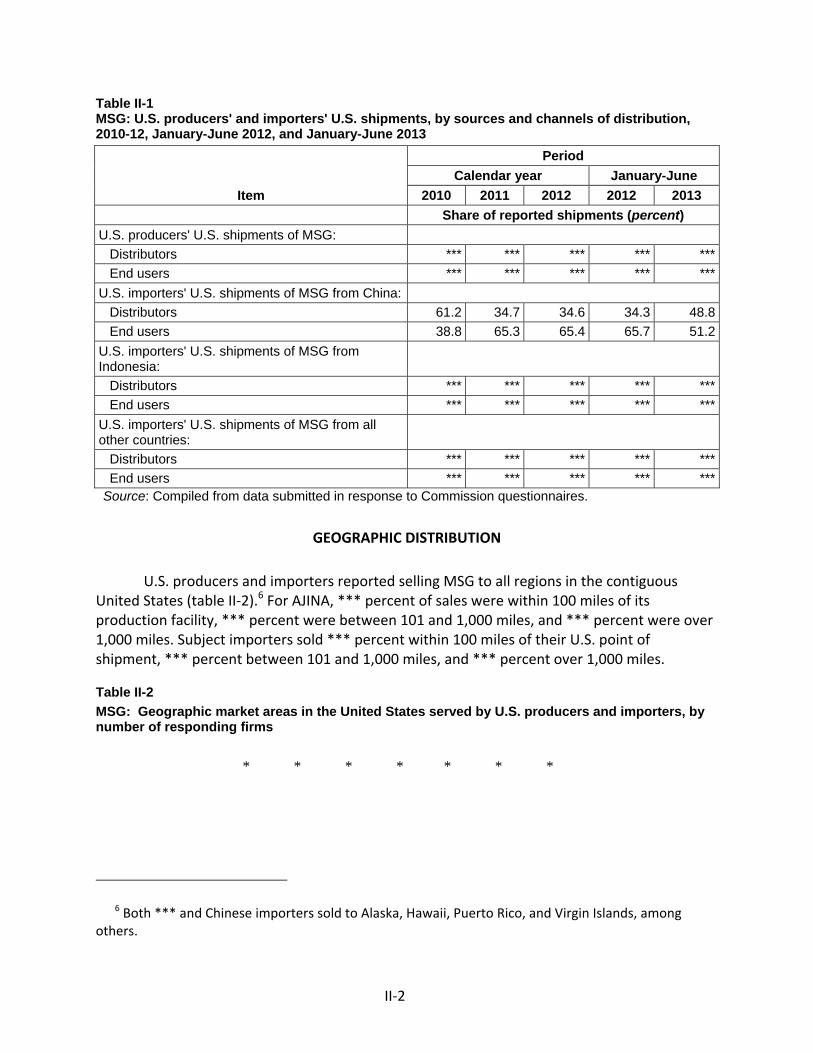
II‐2
Table II-1 MSG: U.S. producers' and importers' U.S. shipments, by sources and channels of distribution, 2010-12, January-June 2012, and January-June 2013
Item
Period Calendar year January-June
2010 2011 2012 2012 2013 Share of reported shipments (percent) U.S. producers' U.S. shipments of MSG: Distributors *** *** *** *** *** End users *** *** *** *** ***U.S. importers' U.S. shipments of MSG from China: Distributors 61.2 34.7 34.6 34.3 48.8 End users 38.8 65.3 65.4 65.7 51.2U.S. importers' U.S. shipments of MSG from Indonesia: Distributors *** *** *** *** *** End users *** *** *** *** ***U.S. importers' U.S. shipments of MSG from all other countries: Distributors *** *** *** *** *** End users *** *** *** *** *** Source: Compiled from data submitted in response to Commission questionnaires.
GEOGRAPHIC DISTRIBUTION
U.S. producers and importers reported selling MSG to all regions in the contiguous United States (table II‐2).6 For AJINA, *** percent of sales were within 100 miles of its production facility, *** percent were between 101 and 1,000 miles, and *** percent were over 1,000 miles. Subject importers sold *** percent within 100 miles of their U.S. point of shipment, *** percent between 101 and 1,000 miles, and *** percent over 1,000 miles.
Table II-2 MSG: Geographic market areas in the United States served by U.S. producers and importers, by number of responding firms
* * * * * * *
6 Both *** and Chinese importers sold to Alaska, Hawaii, Puerto Rico, and Virgin Islands, among others.
II‐3
SUPPLY AND DEMAND CONSIDERATIONS
U.S. supply
Domestic production
Based on available information, the U.S. producer of MSG has the ability to respond to changes in demand with small‐to‐moderate changes in the quantity of shipments of U.S.‐produced MSG to the U.S. market. The main contributing factors to the moderate degree of responsiveness of supply is an ability to switch shipments between alternate markets and some ability to use inventories to increase shipments; supply responsiveness is constrained by limited excess capacity.
Industry capacity
Domestic capacity utilization decreased every year from *** percent to *** percent during the period of investigation.7 This relatively high level of capacity utilization suggests that the U.S. producer may have limited capacity to increase production of MSG in response to an increase in relative prices.8
Alternative markets
The U.S. producer’s exports, as a percentage of total shipments, decreased over the POI. U.S. producers’ export shipments, as a percentage of total shipments, declined from *** percent in 2010 to *** percent in 2012 indicating that the U.S. producer may have some ability to shift product between the U.S. market and other markets in response to relative price changes. *** and *** serve as the top export destinations for AJINA, though it reported strong future demand in ***.
Inventory levels
The U.S. producer’s end‐of‐period inventories, as a percentage of total shipments, increased during the period of investigation from *** percent to *** percent. These inventory levels suggest that the U.S. producer may have some ability to respond to changes in demand with changes in the quantity shipped from inventories.
7 During the interim period, January‐June 2013, capacity utilization was at *** percent compared to *** percent during the 2012 interim period.
8 Petitioner stated that “Petitioner’s Iowa plant operates 24/7 all year round with limited ability to adjust production levels to meet changing cost and demand conditions apart from down time for maintenance.” Conference transcript, p. 27 (Malashevich).
II‐4
Production alternatives
AJINA reported that it *** switch production from MSG to other products.
Supply constraints
AJINA reported that ***.
Subject imports from China
The Commission did not receive any questionnaire responses from Chinese producers or exporters of MSG.9 According to petitioner, “from 2010 to 2012, total Chinese MSG unused production capacity grew by *** percent. The gap between Chinese MSG production capacity and actual production increased from about *** thousand pounds in 2010 to about *** thousand pounds in 2012.”10 In addition, imports of product from China increased by *** percent from 2010 to 2012.
Inventory levels
For importers of product from China, inventories as a share of U.S. shipments decreased from *** percent in 2010 to *** percent in 2012.
Subject imports from Indonesia
Based on available information, producers of MSG from Indonesia have the ability to respond to changes in demand with moderate changes in the quantity of shipments of MSG to the U.S. market. The main contributing factors to the degree of responsiveness of supply are high levels of exports to alternate markets and increasing levels of inventories. Dampening Indonesian producers’ responsiveness is the high level of capacity utilization.
Industry capacity
Indonesian capacity utilization decreased from *** percent to *** percent during the period of investigation. This relatively high level of capacity utilization suggests that Indonesian producers may have limited capacity to increase production in response to an increase in relative prices. According to petitioner, “Indonesia’s MSG industry is growing well beyond the increases in domestic demand, with production capacity and production *** from 2010 to 2012, reaching *** thousand pounds, which is *** apparent U.S. consumption.”11
9 Petitioners report knowing of no other sources for public information on Chinese producers. Petition, Volume II, p. 17.
10 Petitioner, postconference brief, p. 28‐29. 11 Petitioner, postconference brief, p. 29.
II‐5
Alternative markets
Indonesian producers reported exporting to the United States in 2011 and 2012. Indonesian exports to the United States, as a percentage of total shipments, increased from *** percent in 2011 to *** percent in 2012. Indonesian producers’ total export shipments, as a percentage of total shipments, increased from *** percent to *** percent indicating that Indonesian producers may have the ability to shift shipments between their home market and other markets in response to price changes.
Inventory levels
Indonesian producers’ end‐of‐period inventories, as a percentage of total shipments, increased during the period of investigation from *** percent to *** percent. These inventory levels suggest that Indonesian producers may have some ability to respond to changes in demand with changes in the quantity shipped from inventories.
Production alternatives
*** responding Indonesian producers stated that they could switch production from MSG to other products.
Supply constraints
Indonesian producers reported that ***.
Nonsubject imports
The largest source of nonsubject imports during 2010‐12 was Brazil, which accounted for 78.9 percent of nonsubject imports in 2012. Petitioners note that “The majority of non‐subject imports can be accounted for by AJINA’s own imports from its affiliates, ***, {and that} when the volume of non‐subject imports is adjusted to exclude the imports from AJINA’s affiliates (the pricing of which AJINA controls) the remaining nonsubject imports are commercially insignificant in relation to the very large and increasing volumes from China and Indonesia.”12
U.S. demand13
Based on available information, the overall demand for MSG is likely to experience small changes in response to changes in price. The main contributing factors to the small changes in U.S. demand for MSG are the lack of substitute products, the small cost share of product in
12 Petitioner, postconference brief, Exhibit 1, p. 4. 13 Petitioner estimated global MSG consumption to be 3 million metric tons. Conference transcript, p.
18 (Naulty).
II‐6
most of its end‐use products, and the maturity of the U.S. MSG market. In terms of demand, petitioner reported that it looks to food trends and activities in the food market and taste to assess U.S. demand trends.14
End uses
U.S. demand for MSG depends on the demand for U.S.‐produced downstream products. Reported end uses for MSG include processed foods, such as canned soups, ready‐made food, sauces, and dressings. AJINA and one responding importer reported that the cost share of MSG in the end use of a product did not exceed 1.0 percent of the total cost of the end use.15
Business cycles
AJINA and five of seven importers indicated that the market was *** to business cycles or conditions of competition. Two importing firms, ***, reported that MSG was subject to business cycles, citing increased demand for MSG as an input to food more commonly consumed during the colder months (September through January), such as soups.16
Apparent consumption
Apparent U.S. consumption of MSG increased by *** percent during 2010‐12.
Demand trends
Most firms reported an increase in U.S. demand for MSG since 2010 (table II‐3). U.S. producer AJINA reported that the ***. Importers *** reported a decrease in U.S. demand for MSG since 2010 and cited MSG’s negative health‐related reputation as a reason for the decrease. These firms expect demand to increase over the next two years.
Table II-3 MSG: Firms’ responses regarding U.S. demand, by number of responding firms
* * * * * * *
Substitute products
No responding firms reported substitute products for MSG.
14 Conference transcript, p. 51 (Naulty). 15 *** reported the resale of MSG as a possible end use and the cost share of MSG for this end use as
100.0 percent of the total cost of the end use. 16 *** also reported distinct conditions of competition for MSG and changes in business cycles or
conditions due to the openings of factories in China and Indonesia.
II‐7
SUBSTITUTABILITY ISSUES
The degree of substitution between domestic and imported MSG depends upon such factors as relative prices, quality (e.g., grade standards, reliability of supply, defect rates, etc.), and conditions of sale (e.g., price discounts/rebates, lead times between order and delivery dates, payment terms, product services, etc.). Based on available data, staff believes that there is high degree of substitutability between domestically produced MSG and MSG imported from China and Indonesia.
Lead times
AJINA and most importers reported selling MSG from inventories. AJINA reported that *** percent of its commercial shipments were from inventories, with lead times averaging *** days. The remaining *** percent of its commercial shipments were produced‐to‐order, with lead times averaging *** days. Importers of MSG from China and Indonesia reported that 83.5 percent of their commercial shipments were from inventories, with lead times averaging between 5‐7 days, and another 4.8 percent had lead times between *** days. Importers of MSG from China and Indonesia reported that 11.7 percent of importers’ U.S. commercial sales were produced‐to‐order, and had *** days lead time.
Comparison of U.S.‐produced and imported MSG
In order to determine whether U.S.‐produced MSG can generally be used in the same applications as imports from China and Indonesia, U.S. producers and importers were asked whether the products can “always,” “frequently,” “sometimes,” or “never” be used interchangeably. As shown in table II‐4, AJINA reported that domestically produced MSG is *** with subject and nonsubject product. Most importers reported that domestically produced MSG is frequently or sometimes interchangeable with subject and nonsubject product. Density, granulation, and customer loyalty were reported as factors affecting interchangeability. According to petitioner, “MSG is a commodity product, and imports from China and Indonesia are completely interchangeable with the domestic like product, meaning customer purchasing decisions are based largely on price.”17
Table II-4 MSG: Perceived interchangeability between MSG produced in the United States and in other countries, by country pairs
* * * * * * *
17 Petitioner, postconference brief, p. 1.
II‐8
In addition, producers and importers were asked to assess how often differences other than price were significant in sales of MSG from the United States, subject, or nonsubject countries.18 As seen in table II‐5, AJINA reported that factors other than price *** play an important role in purchasing. Most importers reported that factors other than price sometimes or never affect the sale of MSG. Petitioner also noted that “MSG is a rapidly commoditizing product that competes largely on the basis of price.”19
Table II-5 MSG: Significance of differences other than price between MSG produced in the United States and in other countries, by country pair
* * * * * * *
18 Also see discussion of reverse auctions and electronic bidding in Part V for additional information on the role of nonprice factors.
19 Conference transcript, p. 26 (Malashevich).
III‐1
PART III: U.S. PRODUCERS’ PRODUCTION, SHIPMENTS, AND EMPLOYMENT
The Commission analyzes a number of factors in making injury determinations (see 19 U.S.C. §§ 1677(7)(B) and 1677(7)(C)). Information on the subsidies was presented in Part I of this report and information on the volume and pricing of imports of the subject merchandise is presented in Part IV and Part V. Information on the other factors specified is presented in this section and/or Part VI and (except as noted) is based on the questionnaire response of AJINA that accounted for the all U.S. production of MSG during 2012.
U.S. PRODUCER
The petitioner, AJINA, is the only known U.S. producer of MSG, and its questionnaire response accounted for 100 percent of U.S. production of MSG during the period of investigation.1 AJINA is headquartered in Itasca, Illinois, and produces MSG at its plant in Eddyville, Iowa. AJINA’s parent company, Ajinomoto Company2 of Japan, discovered and patented MSG in 1909.3 In addition, as discussed in greater detail below, ***.
Producers were asked to report any changes in operations since January 2010. AJINA ***. AJINA invested in a research and development project targeted at reducing the variable cost of the MSG process. It invested millions of dollars in its Iowa facility to install this technology.4
U.S. PRODUCTION, CAPACITY, AND CAPACITY UTILIZATION
Table III‐1 and figure III‐1 present AJINA’s production, capacity, and capacity utilization. AJINA’s reported capacity *** between 2010 and 2012 and between the interim periods. Reported production decreased by *** percent between 2010 and 2012 and was *** percent higher between the interim periods.
1 AJINA has been the sole U.S. producer of MSG since the mid‐1990s. Conference transcript, pp. 58‐60 (Naulty, Barbour).
2 Ajinomoto holds ownership shares in companies that manufacture MSG in Brazil, France, Indonesia, Japan, Malaysia, Peru, Thailand, and Vietnam. Ajinomoto also indirectly holds a 25 percent share in, but does not control, Shangdong Linwei Seasoning Co., Ltd; a Chinese joint venture that manufactures MSG for the Chinese market. Ajinomoto controls two MSG production companies in Indonesia, PT Ajinomoto Indonesia (“Aji Indonesia”) and PT Ajinex International (“Ajinex”). It also owns a non‐controlling 50 percent share of PT Sasa Inti (“Sasa”). Petitioner states that none of these Chinese or Indonesian companies export MSG to the U.S. market. Petition, p. 3.
3 Petition, p. 3. 4 Conference transcript, pp. 16‐17 (Naulty).
III‐2
Table III-1 MSG: AJINA’S production, capacity, and capacity utilization, 2010-12, January-June 2012, and January-June 2013
* * * * * * * Figure III-1 MSG: AJINA’S production, capacity, and capacity utilization, 2010-12, January-June 2012, and January-June 2013
* * * * * * *
The Commission asked the domestic producer to report constraints on its capacity to produce MSG. AJINA stated that its production volume is constrained by the ***. AJINA does not produce other products using the same equipment, machinery, and production and related workers employed to produce MSG.5
AJINA’S U.S. SHIPMENTS AND EXPORTS
Table III‐2 presents AJINA’s U.S. shipments, export shipments, and total shipments. The quantity of AJINA’s U.S. shipments decreased from 2010 to 2012 by *** percent, and was *** percent higher in the interim periods. The value of AJINA’s U.S. shipments decreased as well from 2010 to 2012 by *** percent, and was *** percent lower in the interim periods. The unit values of U.S. shipments increased by *** percent from 2010 to 2012. AJINA reported exporting to ***. Export shipments as a share of total shipments based on quantity were *** percent in 2012, down from *** percent in 2010.
AJINA’S INVENTORIES
Table III‐3 presents AJINA’s end‐of‐period inventories and the ratio of these inventories to AJINA’s production, U.S. shipments, and total shipments over the period examined. AJINA’S inventories of MSG increased by *** percent from 2010 to 2012 and also were *** percent higher during the interim periods. Inventories relative to total shipments increased by *** percentage points from 2010 to 2012 and were *** percentage points higher during the interim periods. While MSG has an indefinite shelf life, it is best used within five years. Most producers try to make sure the product is not in inventory for longer than one year.6
5 Conference transcript, p. 36 (Naulty). 6 Conference transcript, pp. 32‐33(Barbour, Naulty).
III‐3
Table III-2 MSG: AJINA’S U.S. shipments, exports shipments, and total shipments, 2010-12, January-June 2012, and January-June 2013
* * * * * * *
Table III-3 MSG: AJINA’S inventories, 2010-12, January-June 2012, and January-June 2013
* * * * * * *
.
U.S. PRODUCERS’ IMPORTS
AJINA’S imports of MSG are presented in table III‐4. AJINA imported from ***. AJINA did ***.
Table III-4 MSG: AJINA’S U.S. production and imports, 2010-12, January-June 2012, and January-June 2013
* * * * * * *
U.S. EMPLOYMENT, WAGES, AND PRODUCTIVITY
Table III‐5 shows AJINA’S employment‐related data during the period examined. The level of production‐related workers (PRWs) increased by *** percent from 2010 to 2011 and was *** percent higher during the interim periods. Hours worked per PRW increased by *** percent from 2010 to 2012, while productivity *** between 2010 and 2012.
Table III-5 MSG: Average number of production and related workers, hours worked, wages paid to such employees, hourly wages, productivity, and unit labor costs, 2010-12, January-June 2012, and January-June 2013
* * * * * * *

IV‐1
PART IV: U.S. IMPORTS, APPARENT U.S. CONSUMPTION, AND MARKET SHARES
U.S. IMPORTERS
The Commission issued importer questionnaires to 24 firms believed to be importers of MSG, as well as to all U.S. producers of MSG.1 Questionnaire responses were received from 12 companies, representing 49.5 percent2 of total imports from China and virtually all3 imports from Indonesia between January 2010 and June 2013 under HTS subheading 2922.42.10. Table IV‐1 lists all responding U.S. importers of MSG from China, Indonesia, and other sources, their headquarters, and their shares of U.S. imports, in January 2010 through June 2013.
1 The Commission issued questionnaires to those firms identified in the petition, along with firms that, based on a review of data provided by U.S. Customs and Border Protection (“Customs”), may have accounted for more than *** percent of total imports under HTS subheading 2922.42.10 in 2010 through 2013.
2 Coverage was based on reported questionnaire import data of 83.4 million pounds in January 2010 to June 2013, versus official import data of 168.4 million pounds.
3 Coverage was based on reported questionnaire import data of *** pounds in January 2010 to June 2013, versus official import data of 12.9 million pounds. The petitioner believes that P.T. Cheil Jedang Indonesia is the only Indonesian producer that currently exports MSG to the United States. Petition, p. 12. In its questionnaire response, P.T. Cheil Jedang Indonesia ***.
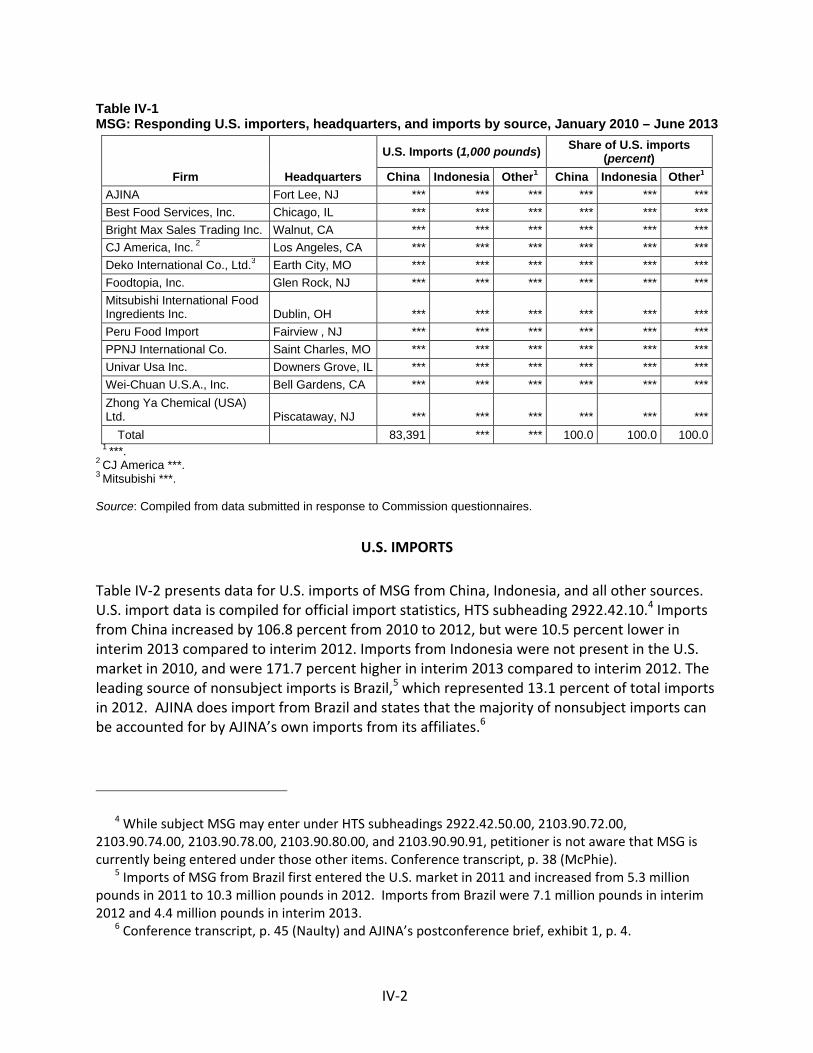
IV‐2
Table IV-1 MSG: Responding U.S. importers, headquarters, and imports by source, January 2010 – June 2013
Firm Headquarters
U.S. Imports (1,000 pounds) Share of U.S. imports (percent)
China Indonesia Other1 China Indonesia Other1
AJINA Fort Lee, NJ *** *** *** *** *** ***Best Food Services, Inc. Chicago, IL *** *** *** *** *** ***Bright Max Sales Trading Inc. Walnut, CA *** *** *** *** *** ***CJ America, Inc. 2 Los Angeles, CA *** *** *** *** *** ***Deko International Co., Ltd.3 Earth City, MO *** *** *** *** *** ***Foodtopia, Inc. Glen Rock, NJ *** *** *** *** *** ***Mitsubishi International Food Ingredients Inc. Dublin, OH *** *** *** *** *** ***Peru Food Import Fairview , NJ *** *** *** *** *** ***PPNJ International Co. Saint Charles, MO *** *** *** *** *** ***Univar Usa Inc. Downers Grove, IL *** *** *** *** *** ***Wei-Chuan U.S.A., Inc. Bell Gardens, CA *** *** *** *** *** ***Zhong Ya Chemical (USA) Ltd. Piscataway, NJ *** *** *** *** *** ***
Total 83,391 *** *** 100.0 100.0 100.0 1 ***. 2 CJ America ***. 3 Mitsubishi ***. Source: Compiled from data submitted in response to Commission questionnaires.
U.S. IMPORTS
Table IV‐2 presents data for U.S. imports of MSG from China, Indonesia, and all other sources. U.S. import data is compiled for official import statistics, HTS subheading 2922.42.10.4 Imports from China increased by 106.8 percent from 2010 to 2012, but were 10.5 percent lower in interim 2013 compared to interim 2012. Imports from Indonesia were not present in the U.S. market in 2010, and were 171.7 percent higher in interim 2013 compared to interim 2012. The leading source of nonsubject imports is Brazil,5 which represented 13.1 percent of total imports in 2012. AJINA does import from Brazil and states that the majority of nonsubject imports can be accounted for by AJINA’s own imports from its affiliates.6
4 While subject MSG may enter under HTS subheadings 2922.42.50.00, 2103.90.72.00, 2103.90.74.00, 2103.90.78.00, 2103.90.80.00, and 2103.90.90.91, petitioner is not aware that MSG is currently being entered under those other items. Conference transcript, p. 38 (McPhie).
5 Imports of MSG from Brazil first entered the U.S. market in 2011 and increased from 5.3 million pounds in 2011 to 10.3 million pounds in 2012. Imports from Brazil were 7.1 million pounds in interim 2012 and 4.4 million pounds in interim 2013.
6 Conference transcript, p. 45 (Naulty) and AJINA’s postconference brief, exhibit 1, p. 4.
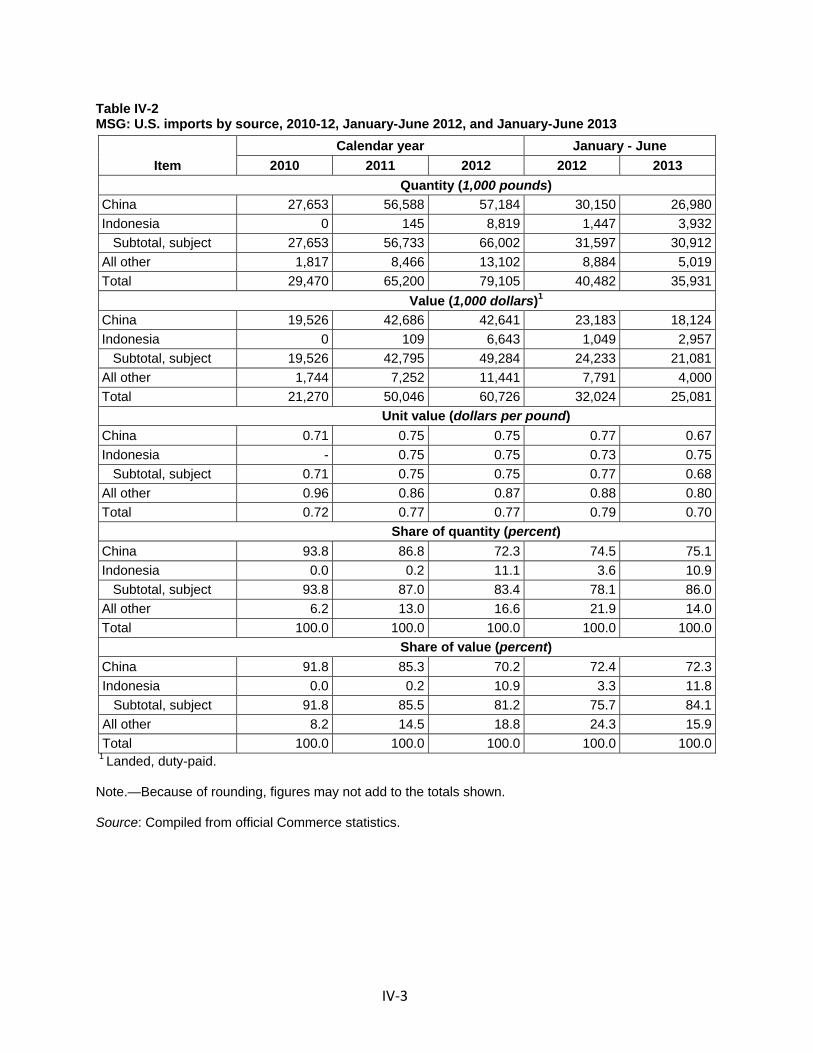
IV‐3
Table IV-2 MSG: U.S. imports by source, 2010-12, January-June 2012, and January-June 2013
Item Calendar year January - June
2010 2011 2012 2012 2013 Quantity (1,000 pounds) China 27,653 56,588 57,184 30,150 26,980Indonesia 0 145 8,819 1,447 3,932 Subtotal, subject 27,653 56,733 66,002 31,597 30,912All other 1,817 8,466 13,102 8,884 5,019Total 29,470 65,200 79,105 40,482 35,931 Value (1,000 dollars)1 China 19,526 42,686 42,641 23,183 18,124Indonesia 0 109 6,643 1,049 2,957 Subtotal, subject 19,526 42,795 49,284 24,233 21,081All other 1,744 7,252 11,441 7,791 4,000Total 21,270 50,046 60,726 32,024 25,081 Unit value (dollars per pound) China 0.71 0.75 0.75 0.77 0.67Indonesia - 0.75 0.75 0.73 0.75 Subtotal, subject 0.71 0.75 0.75 0.77 0.68All other 0.96 0.86 0.87 0.88 0.80Total 0.72 0.77 0.77 0.79 0.70 Share of quantity (percent) China 93.8 86.8 72.3 74.5 75.1Indonesia 0.0 0.2 11.1 3.6 10.9 Subtotal, subject 93.8 87.0 83.4 78.1 86.0All other 6.2 13.0 16.6 21.9 14.0Total 100.0 100.0 100.0 100.0 100.0 Share of value (percent) China 91.8 85.3 70.2 72.4 72.3Indonesia 0.0 0.2 10.9 3.3 11.8 Subtotal, subject 91.8 85.5 81.2 75.7 84.1All other 8.2 14.5 18.8 24.3 15.9Total 100.0 100.0 100.0 100.0 100.0
1 Landed, duty-paid. Note.—Because of rounding, figures may not add to the totals shown. Source: Compiled from official Commerce statistics.
IV‐4
NEGLIGIBILITY
The statute requires that an investigation be terminated without an injury determination if imports of the subject merchandise are found to be negligible.7 Negligible imports are generally defined in the Tariff Act of 1930, as amended, as imports from a country of merchandise corresponding to a domestic like product where such imports account for less than 3 percent of the volume of all such merchandise imported into the United States in the most recent 12‐month period for which data are available that precedes the filing of the petition or the initiation of the investigation. However, if there are imports of such merchandise from a number of countries subject to investigations initiated on the same day that individually account for less than 3 percent of the total volume of the subject merchandise, and if the imports from those countries collectively account for more than 7 percent of the volume of all such merchandise imported into the United States during the applicable 12‐month period, then imports from such countries are deemed not to be negligible.8 In the case of countervailing duty investigations involving developing countries (as designated by the United States Trade Representative pursuant to 19 U.S.C. § 1677(36)), the statute indicates that the negligibility limits are 4 percent and 9 percent, rather than 3 percent and 7 percent.9
Imports from China accounted for 73.6 percent of total imports of MSG by quantity from September 2012 to August 2013. Imports from Indonesia accounted for 15.9 percent of total imports of MSG by quantity from September 2012 to August 2013.
CUMULATION CONSIDERATIONS
In assessing whether imports should be cumulated, the Commission determines whether U.S. imports from the subject countries compete with each other and with the domestic like product and has generally considered four factors: (1) fungibility, (2) presence of sales or offers to sell in the same geographical markets, (3) common or similar channels of distribution, and (4) simultaneous presence in the market. Information concerning fungibility and channels of distribution are discussed in Part II of this report. Additional information concerning geographical markets, and simultaneous presence in the market is presented below.
Geographical markets
Both AJINA and U.S. importers reported shipping MSG throughout the United States.10 Imports of MSG from China entered through 27 different ports11 during the period for which
7 Sections 703(a)(1), 705(b)(1), 733(a)(1), and 735(b)(1) of the Act (19 U.S.C. §§ 1671b(a)(1), 1671d(b)(1), 1673b(a)(1), and 1673d(b)(1)).
8 Section 771 (24) of the Act (19 U.S.C § 1677(24)). 9 19 U.S.C. § 1677(24)(B). 10 See Part II, Table II‐2.
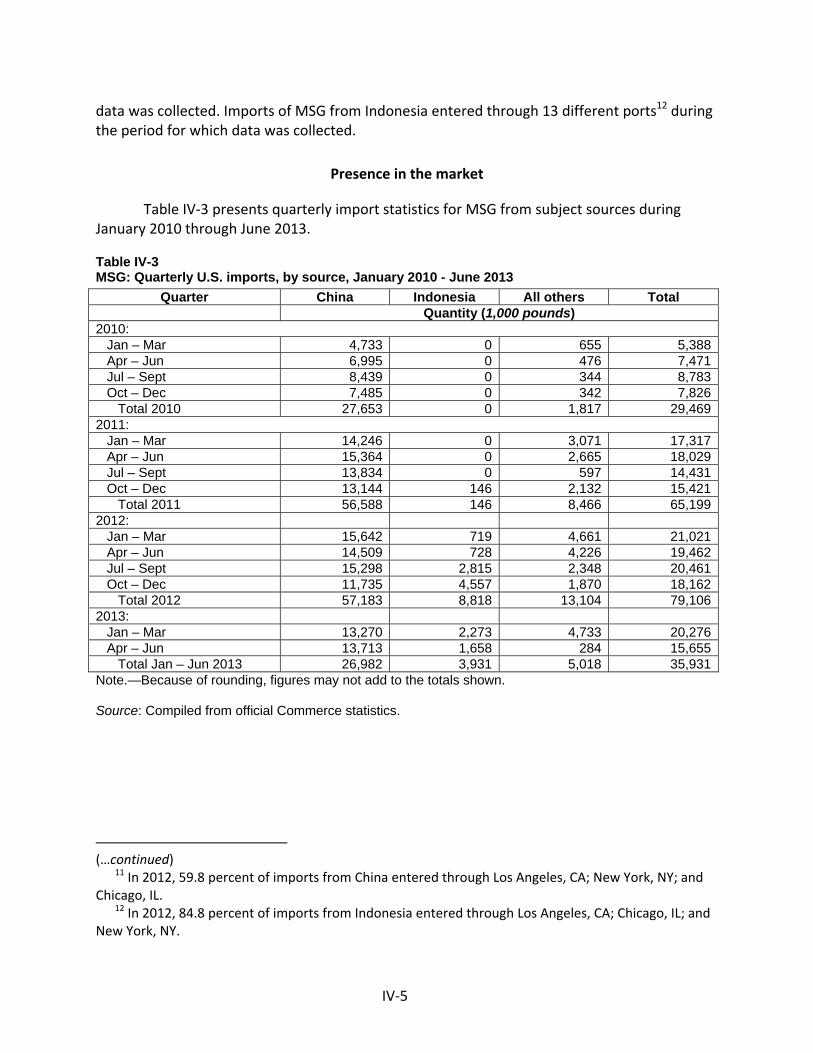
IV‐5
data was collected. Imports of MSG from Indonesia entered through 13 different ports12 during the period for which data was collected.
Presence in the market
Table IV‐3 presents quarterly import statistics for MSG from subject sources during January 2010 through June 2013.
Table IV-3 MSG: Quarterly U.S. imports, by source, January 2010 - June 2013
Quarter China Indonesia All others Total Quantity (1,000 pounds) 2010: Jan – Mar 4,733 0 655 5,388 Apr – Jun 6,995 0 476 7,471 Jul – Sept 8,439 0 344 8,783 Oct – Dec 7,485 0 342 7,826 Total 2010 27,653 0 1,817 29,4692011: Jan – Mar 14,246 0 3,071 17,317 Apr – Jun 15,364 0 2,665 18,029 Jul – Sept 13,834 0 597 14,431 Oct – Dec 13,144 146 2,132 15,421 Total 2011 56,588 146 8,466 65,1992012: Jan – Mar 15,642 719 4,661 21,021 Apr – Jun 14,509 728 4,226 19,462 Jul – Sept 15,298 2,815 2,348 20,461 Oct – Dec 11,735 4,557 1,870 18,162 Total 2012 57,183 8,818 13,104 79,1062013: Jan – Mar 13,270 2,273 4,733 20,276 Apr – Jun 13,713 1,658 284 15,655 Total Jan – Jun 2013 26,982 3,931 5,018 35,931Note.—Because of rounding, figures may not add to the totals shown. Source: Compiled from official Commerce statistics.
(…continued)
11 In 2012, 59.8 percent of imports from China entered through Los Angeles, CA; New York, NY; and Chicago, IL.
12 In 2012, 84.8 percent of imports from Indonesia entered through Los Angeles, CA; Chicago, IL; and New York, NY.
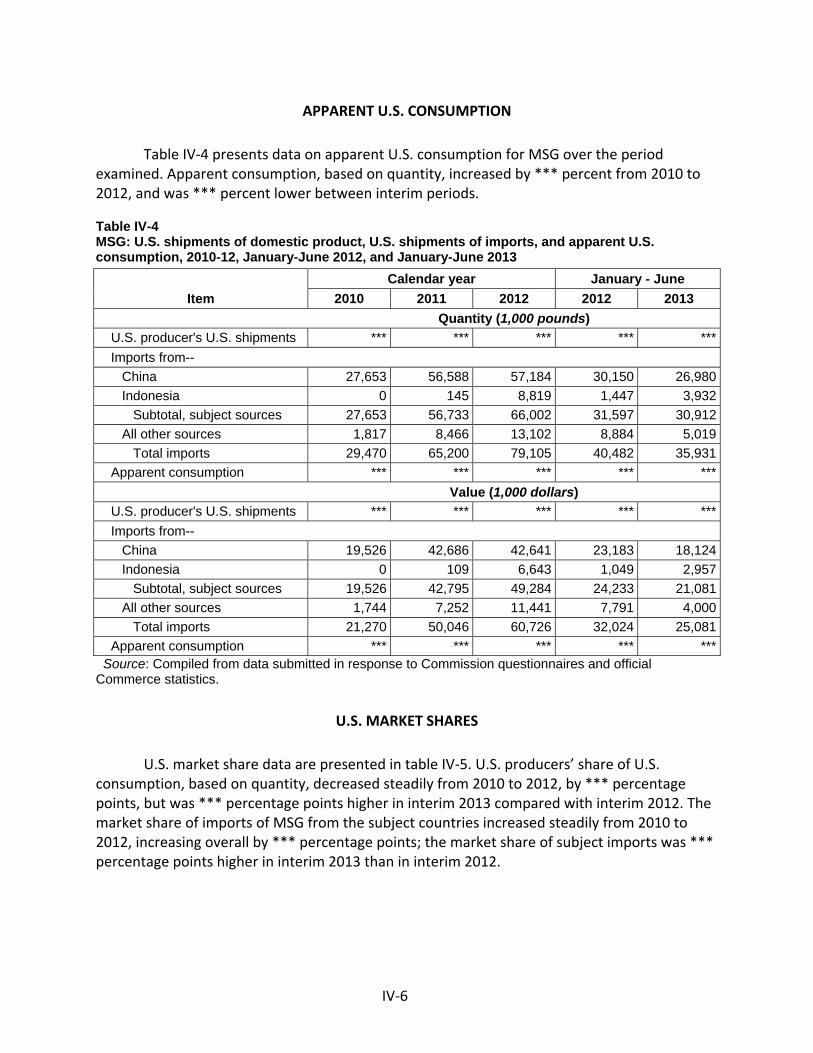
IV‐6
APPARENT U.S. CONSUMPTION
Table IV‐4 presents data on apparent U.S. consumption for MSG over the period examined. Apparent consumption, based on quantity, increased by *** percent from 2010 to 2012, and was *** percent lower between interim periods.
Table IV-4 MSG: U.S. shipments of domestic product, U.S. shipments of imports, and apparent U.S. consumption, 2010-12, January-June 2012, and January-June 2013
Item Calendar year January - June
2010 2011 2012 2012 2013 Quantity (1,000 pounds)
U.S. producer's U.S. shipments *** *** *** *** ***Imports from-- China 27,653 56,588 57,184 30,150 26,980 Indonesia 0 145 8,819 1,447 3,932 Subtotal, subject sources 27,653 56,733 66,002 31,597 30,912 All other sources 1,817 8,466 13,102 8,884 5,019 Total imports 29,470 65,200 79,105 40,482 35,931Apparent consumption *** *** *** *** ***
Value (1,000 dollars) U.S. producer's U.S. shipments *** *** *** *** ***Imports from-- China 19,526 42,686 42,641 23,183 18,124 Indonesia 0 109 6,643 1,049 2,957 Subtotal, subject sources 19,526 42,795 49,284 24,233 21,081 All other sources 1,744 7,252 11,441 7,791 4,000 Total imports 21,270 50,046 60,726 32,024 25,081Apparent consumption *** *** *** *** ***
Source: Compiled from data submitted in response to Commission questionnaires and official Commerce statistics.
U.S. MARKET SHARES
U.S. market share data are presented in table IV‐5. U.S. producers’ share of U.S. consumption, based on quantity, decreased steadily from 2010 to 2012, by *** percentage points, but was *** percentage points higher in interim 2013 compared with interim 2012. The market share of imports of MSG from the subject countries increased steadily from 2010 to 2012, increasing overall by *** percentage points; the market share of subject imports was *** percentage points higher in interim 2013 than in interim 2012.
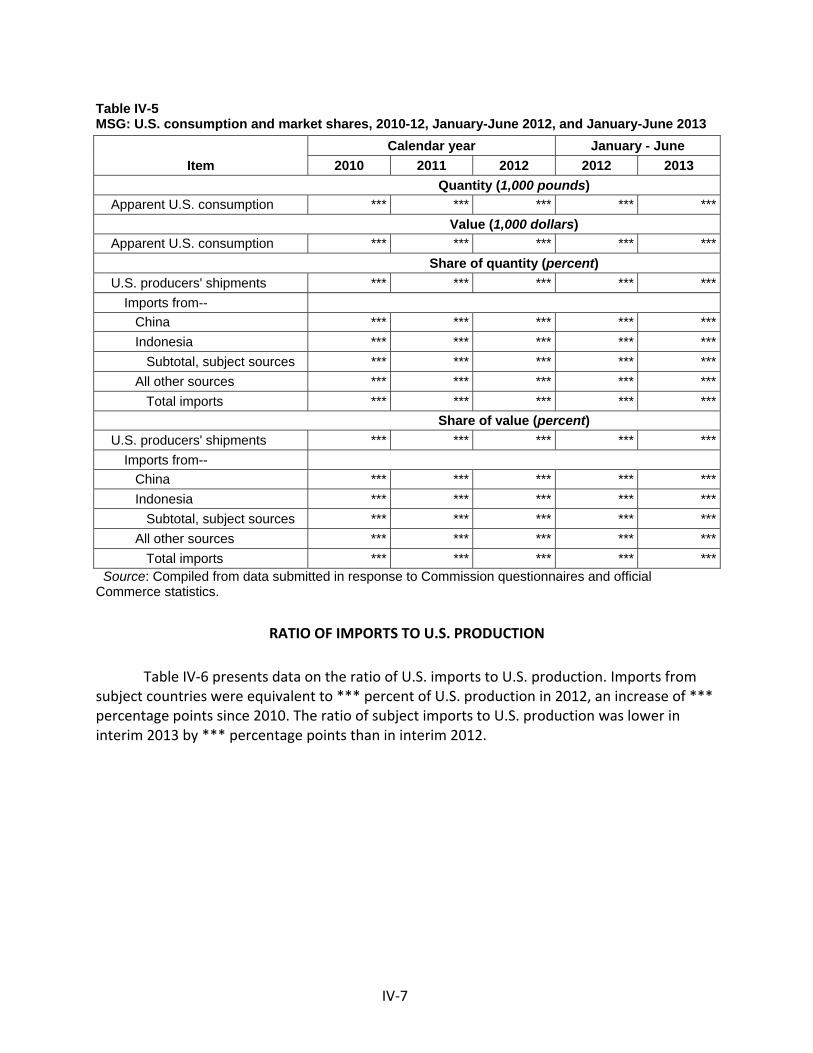
IV‐7
Table IV-5 MSG: U.S. consumption and market shares, 2010-12, January-June 2012, and January-June 2013
Item Calendar year January - June
2010 2011 2012 2012 2013 Quantity (1,000 pounds)
Apparent U.S. consumption *** *** *** *** *** Value (1,000 dollars)
Apparent U.S. consumption *** *** *** *** *** Share of quantity (percent)
U.S. producers' shipments *** *** *** *** ***Imports from-- China *** *** *** *** *** Indonesia *** *** *** *** *** Subtotal, subject sources *** *** *** *** *** All other sources *** *** *** *** *** Total imports *** *** *** *** ***
Share of value (percent) U.S. producers' shipments *** *** *** *** ***
Imports from-- China *** *** *** *** *** Indonesia *** *** *** *** *** Subtotal, subject sources *** *** *** *** *** All other sources *** *** *** *** *** Total imports *** *** *** *** ***
Source: Compiled from data submitted in response to Commission questionnaires and official Commerce statistics.
RATIO OF IMPORTS TO U.S. PRODUCTION
Table IV‐6 presents data on the ratio of U.S. imports to U.S. production. Imports from subject countries were equivalent to *** percent of U.S. production in 2012, an increase of *** percentage points since 2010. The ratio of subject imports to U.S. production was lower in interim 2013 by *** percentage points than in interim 2012.
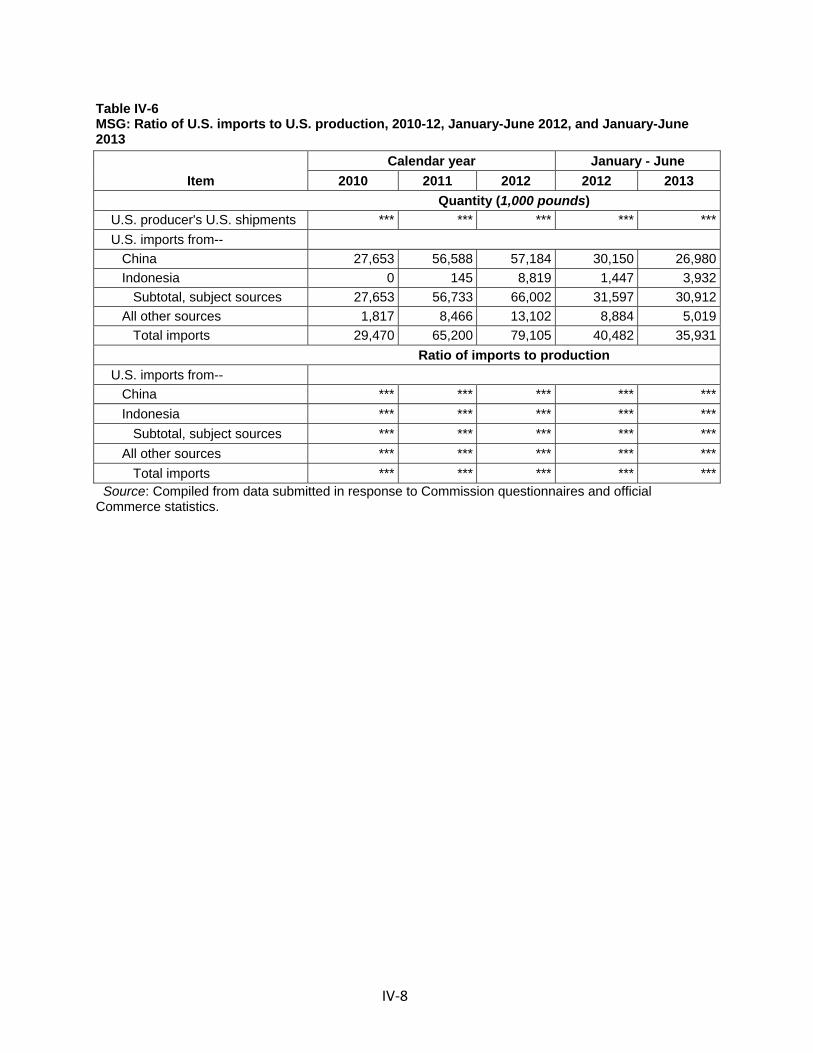
IV‐8
Table IV-6 MSG: Ratio of U.S. imports to U.S. production, 2010-12, January-June 2012, and January-June 2013
Item Calendar year January - June
2010 2011 2012 2012 2013 Quantity (1,000 pounds)
U.S. producer's U.S. shipments *** *** *** *** ***U.S. imports from-- China 27,653 56,588 57,184 30,150 26,980 Indonesia 0 145 8,819 1,447 3,932 Subtotal, subject sources 27,653 56,733 66,002 31,597 30,912 All other sources 1,817 8,466 13,102 8,884 5,019 Total imports 29,470 65,200 79,105 40,482 35,931
Ratio of imports to production U.S. imports from-- China *** *** *** *** *** Indonesia *** *** *** *** *** Subtotal, subject sources *** *** *** *** *** All other sources *** *** *** *** *** Total imports *** *** *** *** ***
Source: Compiled from data submitted in response to Commission questionnaires and official Commerce statistics.
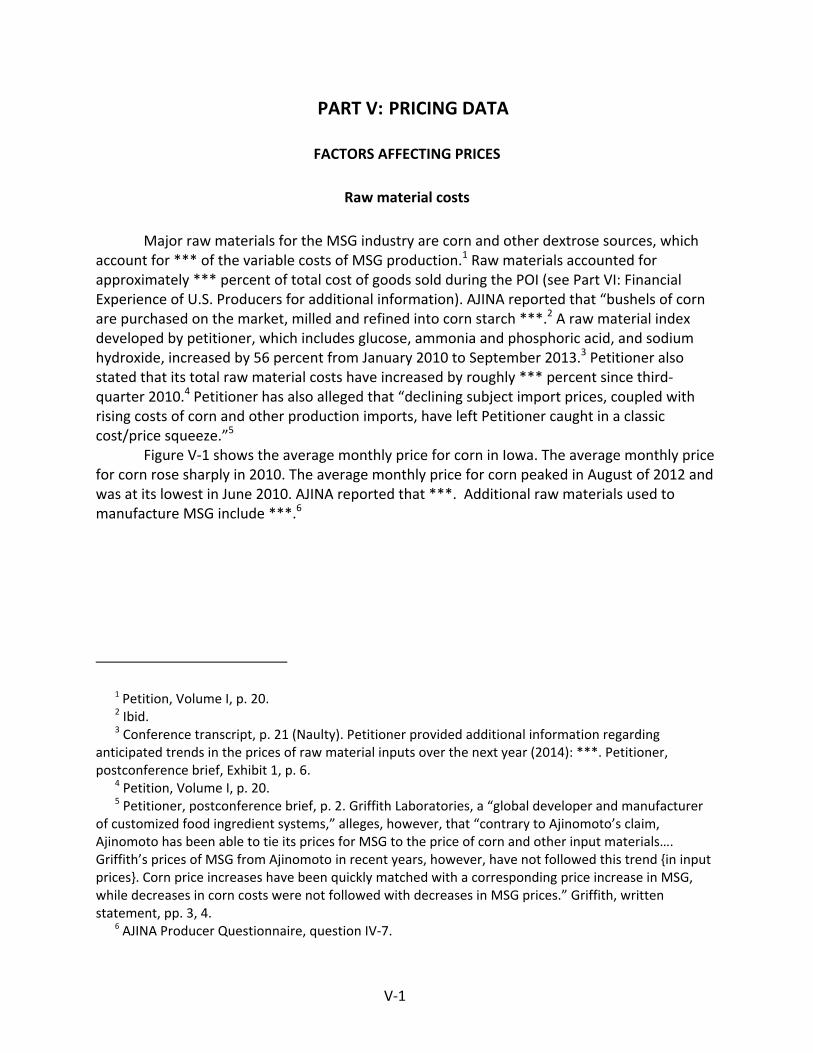
V‐1
PART V: PRICING DATA
FACTORS AFFECTING PRICES
Raw material costs
Major raw materials for the MSG industry are corn and other dextrose sources, which account for *** of the variable costs of MSG production.1 Raw materials accounted for approximately *** percent of total cost of goods sold during the POI (see Part VI: Financial Experience of U.S. Producers for additional information). AJINA reported that “bushels of corn are purchased on the market, milled and refined into corn starch ***.2 A raw material index developed by petitioner, which includes glucose, ammonia and phosphoric acid, and sodium hydroxide, increased by 56 percent from January 2010 to September 2013.3 Petitioner also stated that its total raw material costs have increased by roughly *** percent since third‐quarter 2010.4 Petitioner has also alleged that “declining subject import prices, coupled with rising costs of corn and other production imports, have left Petitioner caught in a classic cost/price squeeze.”5
Figure V‐1 shows the average monthly price for corn in Iowa. The average monthly price for corn rose sharply in 2010. The average monthly price for corn peaked in August of 2012 and was at its lowest in June 2010. AJINA reported that ***. Additional raw materials used to manufacture MSG include ***.6
1 Petition, Volume I, p. 20. 2 Ibid. 3 Conference transcript, p. 21 (Naulty). Petitioner provided additional information regarding
anticipated trends in the prices of raw material inputs over the next year (2014): ***. Petitioner, postconference brief, Exhibit 1, p. 6.
4 Petition, Volume I, p. 20. 5 Petitioner, postconference brief, p. 2. Griffith Laboratories, a “global developer and manufacturer
of customized food ingredient systems,” alleges, however, that “contrary to Ajinomoto’s claim, Ajinomoto has been able to tie its prices for MSG to the price of corn and other input materials…. Griffith’s prices of MSG from Ajinomoto in recent years, however, have not followed this trend {in input prices}. Corn price increases have been quickly matched with a corresponding price increase in MSG, while decreases in corn costs were not followed with decreases in MSG prices.” Griffith, written statement, pp. 3, 4.
6 AJINA Producer Questionnaire, question IV‐7.
V‐2
Figure V-1 Iowa Department of Agriculture-USDA Market News Interior Iowa Corn Prices: Average monthly prices for January 2010- June 2013
Source: Iowa Department of Agriculture-USDA Market News Interior Iowa Grain Prices, “Iowa Historic Grain Prices,” accessed on November 5, 2013, http://www.iowaagriculture.gov/agMarketing/historicGrainPrices.asp
U.S. inland transportation costs
AJINA and all responding importers reported that they typically arrange transportation to their customers. AJINA reported that its transportation costs were *** percent while importers reported costs of *** percent or less.
PRICING PRACTICES
Pricing methods
As presented in table V‐1, AJINA and importers sell primarily on a transaction‐by‐transaction negotiations and contracts basis, while four importers also reported using set price lists.
0.0
1.0
2.0
3.0
4.0
5.0
6.0
7.0
8.0
9.0
2010 2011 2012 2013
Dollar per Bushel
Average Monthly Price
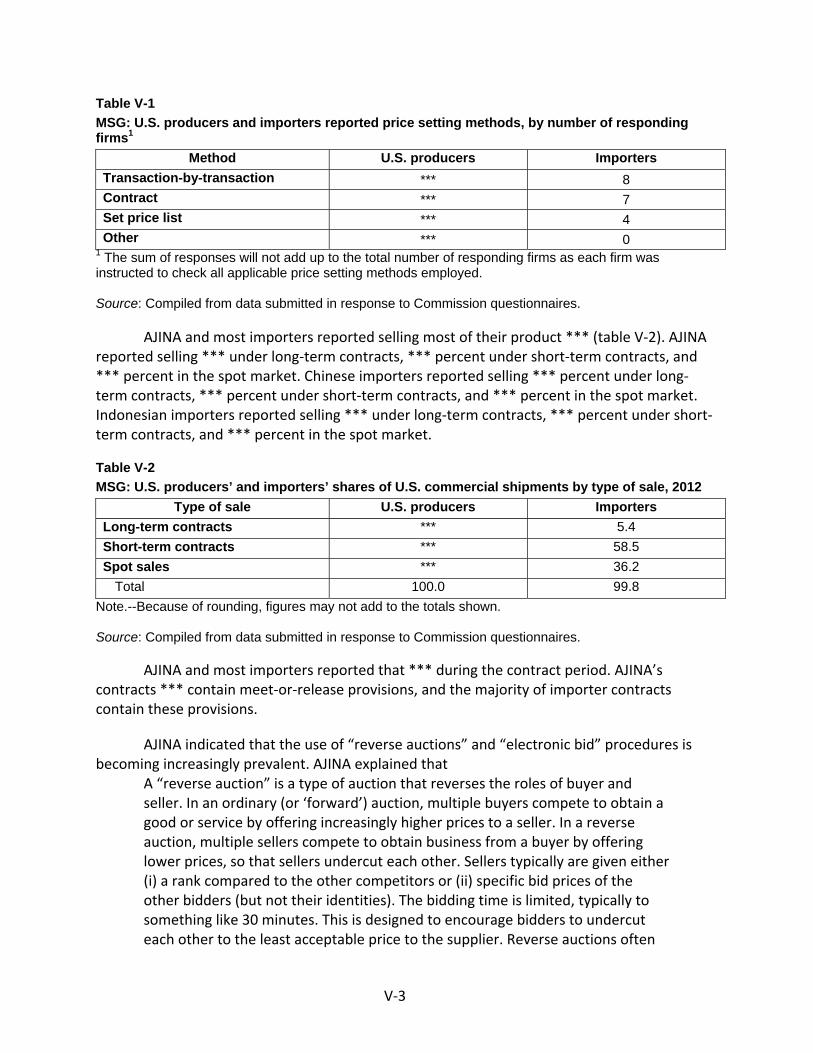
V‐3
Table V-1 MSG: U.S. producers and importers reported price setting methods, by number of responding firms1
Method U.S. producers Importers Transaction-by-transaction *** 8 Contract *** 7 Set price list *** 4 Other *** 0
1 The sum of responses will not add up to the total number of responding firms as each firm was instructed to check all applicable price setting methods employed. Source: Compiled from data submitted in response to Commission questionnaires.
AJINA and most importers reported selling most of their product *** (table V‐2). AJINA reported selling *** under long‐term contracts, *** percent under short‐term contracts, and *** percent in the spot market. Chinese importers reported selling *** percent under long‐term contracts, *** percent under short‐term contracts, and *** percent in the spot market. Indonesian importers reported selling *** under long‐term contracts, *** percent under short‐term contracts, and *** percent in the spot market.
Table V-2 MSG: U.S. producers’ and importers’ shares of U.S. commercial shipments by type of sale, 2012
Type of sale U.S. producers Importers Long-term contracts *** 5.4 Short-term contracts *** 58.5 Spot sales *** 36.2
Total 100.0 99.8 Note.--Because of rounding, figures may not add to the totals shown. Source: Compiled from data submitted in response to Commission questionnaires.
AJINA and most importers reported that *** during the contract period. AJINA’s contracts *** contain meet‐or‐release provisions, and the majority of importer contracts contain these provisions.
AJINA indicated that the use of “reverse auctions” and “electronic bid” procedures is becoming increasingly prevalent. AJINA explained that
A “reverse auction” is a type of auction that reverses the roles of buyer and seller. In an ordinary (or ‘forward’) auction, multiple buyers compete to obtain a good or service by offering increasingly higher prices to a seller. In a reverse auction, multiple sellers compete to obtain business from a buyer by offering lower prices, so that sellers undercut each other. Sellers typically are given either (i) a rank compared to the other competitors or (ii) specific bid prices of the other bidders (but not their identities). The bidding time is limited, typically to something like 30 minutes. This is designed to encourage bidders to undercut each other to the least acceptable price to the supplier. Reverse auctions often
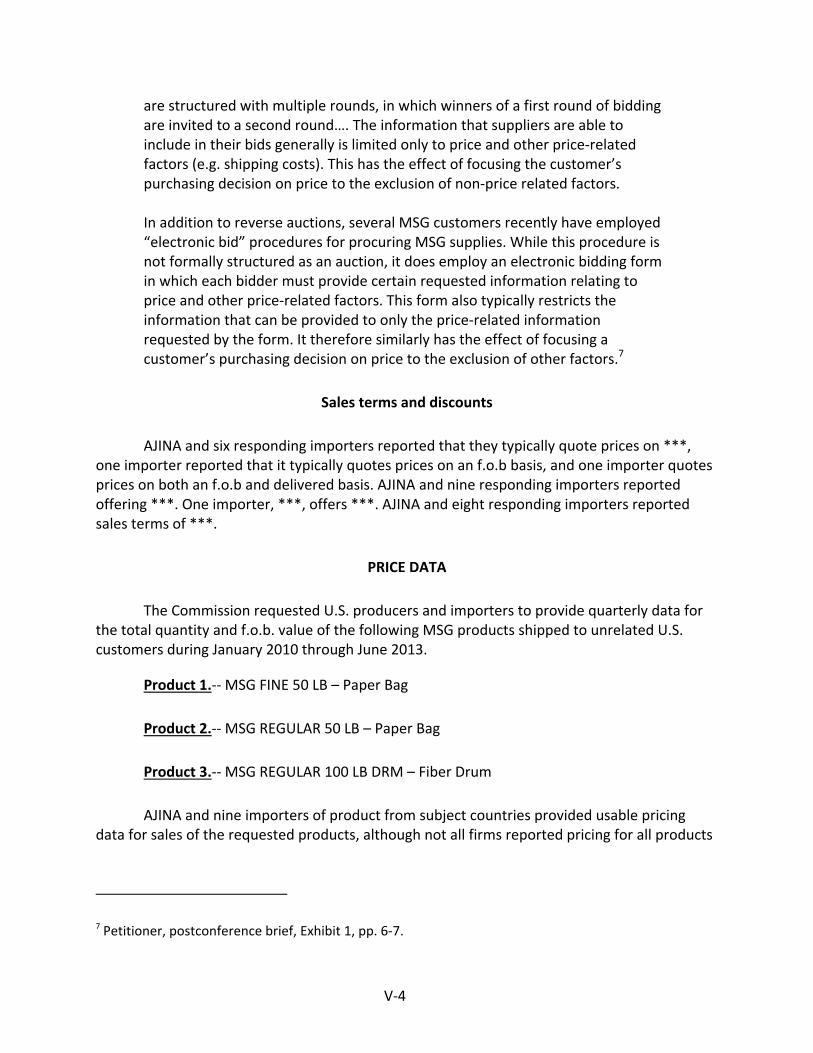
V‐4
are structured with multiple rounds, in which winners of a first round of bidding are invited to a second round…. The information that suppliers are able to include in their bids generally is limited only to price and other price‐related factors (e.g. shipping costs). This has the effect of focusing the customer’s purchasing decision on price to the exclusion of non‐price related factors. In addition to reverse auctions, several MSG customers recently have employed “electronic bid” procedures for procuring MSG supplies. While this procedure is not formally structured as an auction, it does employ an electronic bidding form in which each bidder must provide certain requested information relating to price and other price‐related factors. This form also typically restricts the information that can be provided to only the price‐related information requested by the form. It therefore similarly has the effect of focusing a customer’s purchasing decision on price to the exclusion of other factors.7
Sales terms and discounts
AJINA and six responding importers reported that they typically quote prices on ***, one importer reported that it typically quotes prices on an f.o.b basis, and one importer quotes prices on both an f.o.b and delivered basis. AJINA and nine responding importers reported offering ***. One importer, ***, offers ***. AJINA and eight responding importers reported sales terms of ***.
PRICE DATA
The Commission requested U.S. producers and importers to provide quarterly data for the total quantity and f.o.b. value of the following MSG products shipped to unrelated U.S. customers during January 2010 through June 2013.
Product 1.‐‐ MSG FINE 50 LB – Paper Bag
Product 2.‐‐ MSG REGULAR 50 LB – Paper Bag
Product 3.‐‐ MSG REGULAR 100 LB DRM – Fiber Drum
AJINA and nine importers of product from subject countries provided usable pricing data for sales of the requested products, although not all firms reported pricing for all products
7 Petitioner, postconference brief, Exhibit 1, pp. 6‐7.
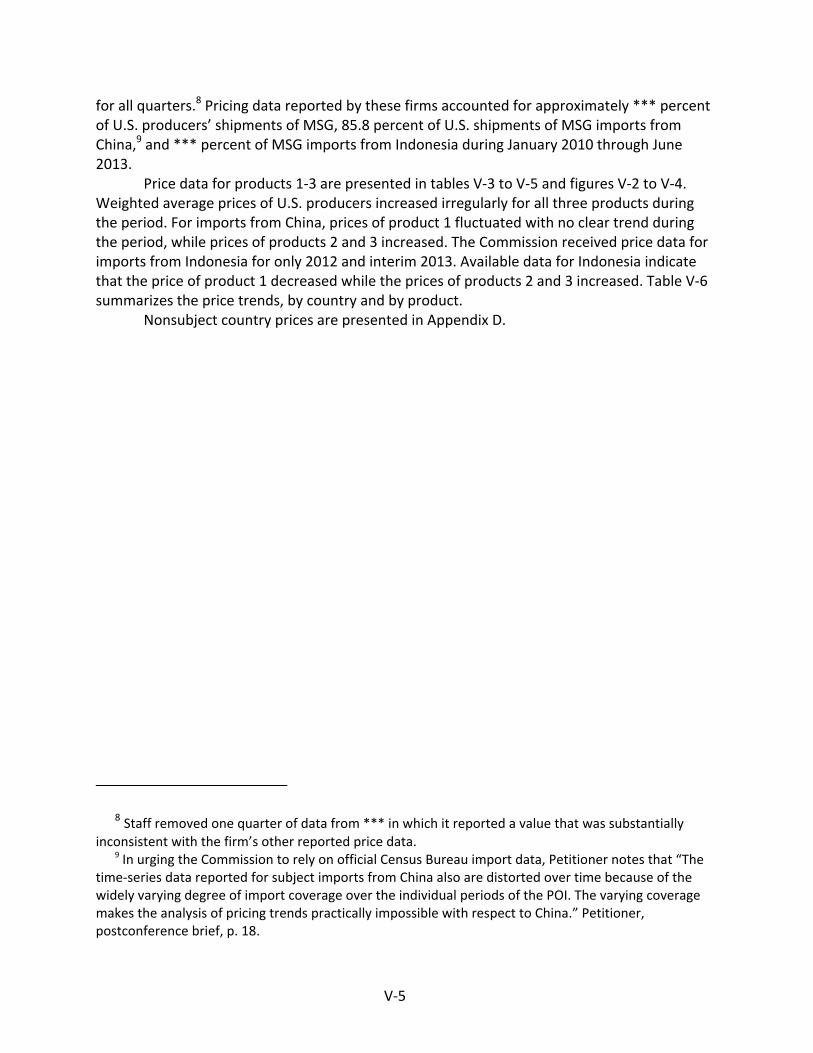
V‐5
for all quarters.8 Pricing data reported by these firms accounted for approximately *** percent of U.S. producers’ shipments of MSG, 85.8 percent of U.S. shipments of MSG imports from China,9 and *** percent of MSG imports from Indonesia during January 2010 through June 2013.
Price data for products 1‐3 are presented in tables V‐3 to V‐5 and figures V‐2 to V‐4. Weighted average prices of U.S. producers increased irregularly for all three products during the period. For imports from China, prices of product 1 fluctuated with no clear trend during the period, while prices of products 2 and 3 increased. The Commission received price data for imports from Indonesia for only 2012 and interim 2013. Available data for Indonesia indicate that the price of product 1 decreased while the prices of products 2 and 3 increased. Table V‐6 summarizes the price trends, by country and by product.
Nonsubject country prices are presented in Appendix D.
8 Staff removed one quarter of data from *** in which it reported a value that was substantially inconsistent with the firm’s other reported price data.
9 In urging the Commission to rely on official Census Bureau import data, Petitioner notes that “The time‐series data reported for subject imports from China also are distorted over time because of the widely varying degree of import coverage over the individual periods of the POI. The varying coverage makes the analysis of pricing trends practically impossible with respect to China.” Petitioner, postconference brief, p. 18.
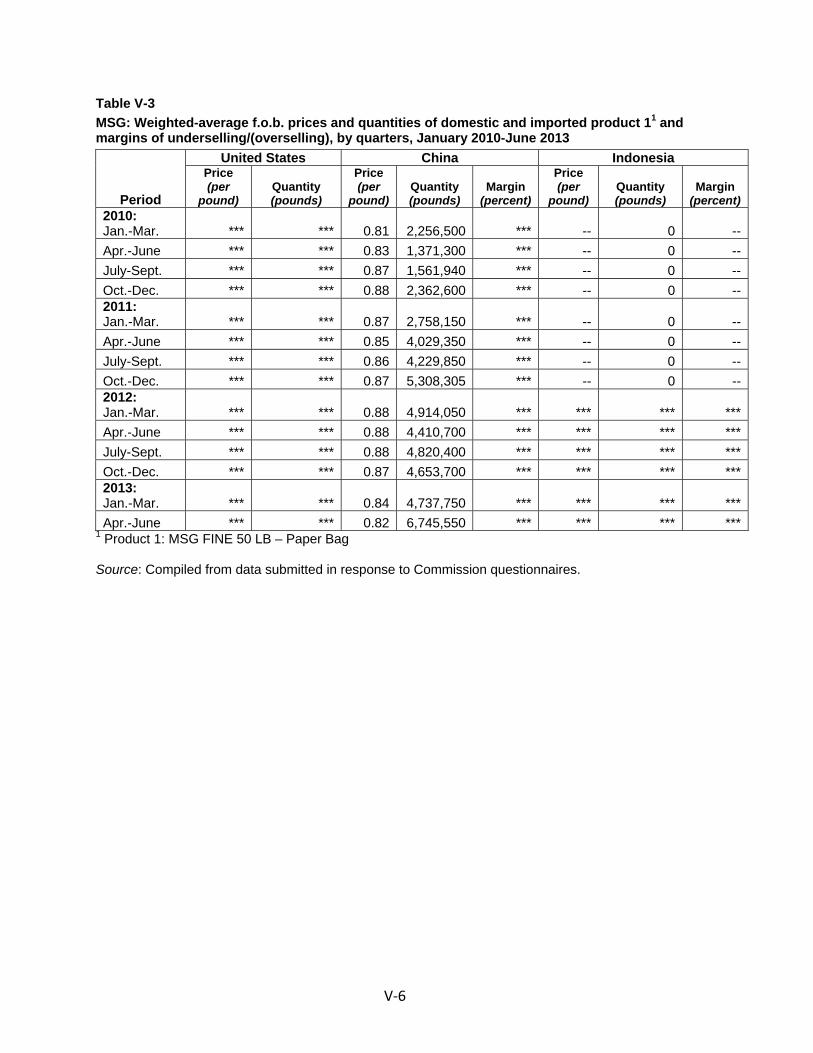
V‐6
Table V-3 MSG: Weighted-average f.o.b. prices and quantities of domestic and imported product 11 and margins of underselling/(overselling), by quarters, January 2010-June 2013
Period
United States China Indonesia Price (per
pound) Quantity (pounds)
Price(per
pound) Quantity (pounds)
Margin (percent)
Price (per
pound) Quantity (pounds)
Margin (percent)
2010: Jan.-Mar. *** *** 0.81 2,256,500 *** -- 0 --Apr.-June *** *** 0.83 1,371,300 *** -- 0 --July-Sept. *** *** 0.87 1,561,940 *** -- 0 --Oct.-Dec. *** *** 0.88 2,362,600 *** -- 0 --2011: Jan.-Mar. *** *** 0.87 2,758,150 *** -- 0 --Apr.-June *** *** 0.85 4,029,350 *** -- 0 --July-Sept. *** *** 0.86 4,229,850 *** -- 0 --Oct.-Dec. *** *** 0.87 5,308,305 *** -- 0 --2012: Jan.-Mar. *** *** 0.88 4,914,050 *** *** *** ***Apr.-June *** *** 0.88 4,410,700 *** *** *** ***July-Sept. *** *** 0.88 4,820,400 *** *** *** ***Oct.-Dec. *** *** 0.87 4,653,700 *** *** *** ***2013: Jan.-Mar. *** *** 0.84 4,737,750 *** *** *** ***Apr.-June *** *** 0.82 6,745,550 *** *** *** ***
1 Product 1: MSG FINE 50 LB – Paper Bag Source: Compiled from data submitted in response to Commission questionnaires.
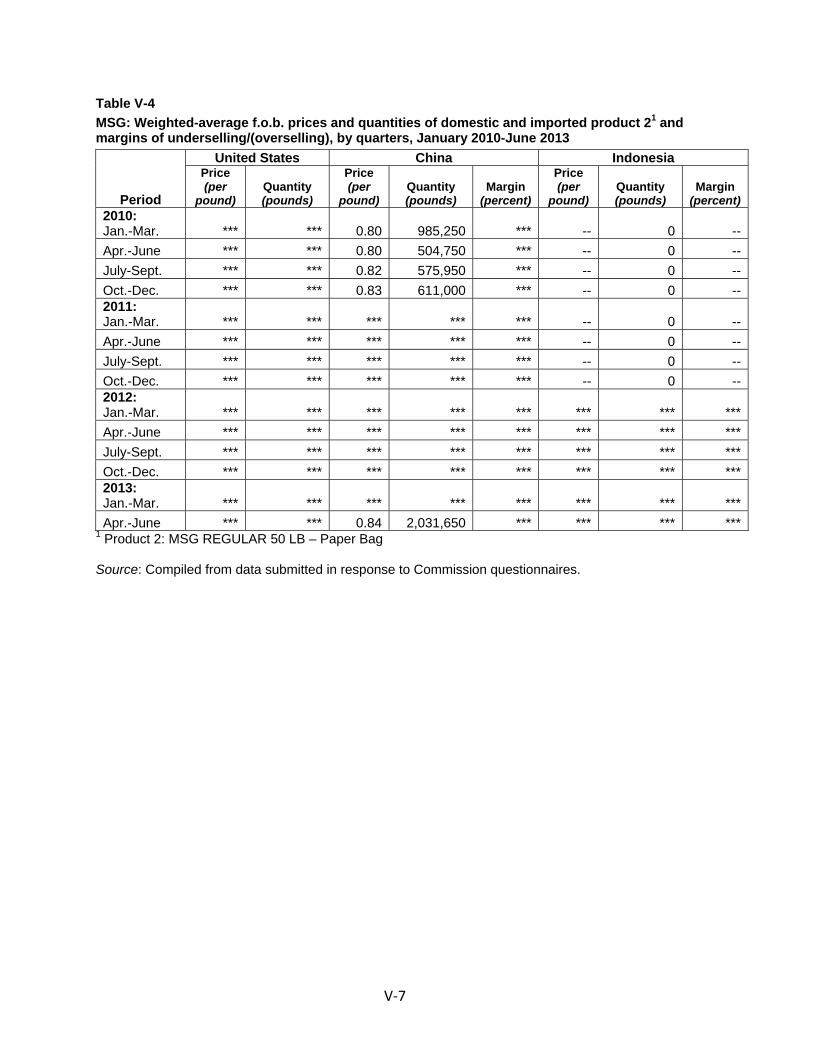
V‐7
Table V-4 MSG: Weighted-average f.o.b. prices and quantities of domestic and imported product 21 and margins of underselling/(overselling), by quarters, January 2010-June 2013
Period
United States China Indonesia Price (per
pound) Quantity (pounds)
Price(per
pound) Quantity (pounds)
Margin (percent)
Price (per
pound) Quantity (pounds)
Margin (percent)
2010: Jan.-Mar. *** *** 0.80 985,250 *** -- 0 --Apr.-June *** *** 0.80 504,750 *** -- 0 --July-Sept. *** *** 0.82 575,950 *** -- 0 --Oct.-Dec. *** *** 0.83 611,000 *** -- 0 --2011: Jan.-Mar. *** *** *** *** *** -- 0 --Apr.-June *** *** *** *** *** -- 0 --July-Sept. *** *** *** *** *** -- 0 --Oct.-Dec. *** *** *** *** *** -- 0 --2012: Jan.-Mar. *** *** *** *** *** *** *** ***Apr.-June *** *** *** *** *** *** *** ***July-Sept. *** *** *** *** *** *** *** ***Oct.-Dec. *** *** *** *** *** *** *** ***2013: Jan.-Mar. *** *** *** *** *** *** *** ***Apr.-June *** *** 0.84 2,031,650 *** *** *** ***
1 Product 2: MSG REGULAR 50 LB – Paper Bag Source: Compiled from data submitted in response to Commission questionnaires.

V‐8
Table V-5 MSG: Weighted-average f.o.b. prices and quantities of domestic and imported product 31 and margins of underselling/(overselling), by quarters, January 2010-June 2013
Period
United States China Indonesia Price (per
pound) Quantity (pounds)
Price(per
pound) Quantity (pounds)
Margin (percent)
Price (per
pound) Quantity (pounds)
Margin (percent)
2010: Jan.-Mar. *** *** 0.80 471,599 *** -- 0 --Apr.-June *** *** 0.82 417,175 *** -- 0 --July-Sept. *** *** *** *** *** -- 0 --Oct.-Dec. *** *** *** *** *** -- 0 --2011: Jan.-Mar. *** *** *** *** *** -- 0 --Apr.-June *** *** *** *** *** -- 0 --July-Sept. *** *** *** *** *** -- 0 --Oct.-Dec. *** *** *** *** *** -- 0 --2012: Jan.-Mar. *** *** *** *** *** -- 0 --Apr.-June *** *** *** *** *** *** *** ***July-Sept. *** *** *** *** *** *** *** ***Oct.-Dec. *** *** *** *** *** *** *** ***2013: Jan.-Mar. *** *** *** *** *** *** *** ***Apr.-June *** *** *** *** *** *** *** ***
1 Product 3: MSG REGULAR 100 LB DRM – Fiber Drum Source: Compiled from data submitted in response to Commission questionnaires.
V‐9
Figure V-2 MSG: Weighted-average prices and quantities of domestic and imported product 1, by quarters, January 2010-June 2013
* * * * * * * Figure V-3 MSG: Weighted-average prices and quantities of domestic and imported product 2, by quarters, January 2010-June 2013
* * * * * * * Figure V-4 MSG: Weighted-average prices and quantities of domestic and imported product 3, by quarters, January 2010-June 2013
* * * * * * *
Price trends
Table V-6 MSG: Summary of weighted-average f.o.b. prices for products 1-3 from the United States and China and Indonesia
* * * * * * *
Price comparisons
As shown in table V‐7, prices for MSG imported from China and Indonesia were below those for U.S.‐produced MSG in *** of 59 comparisons; margins of underselling ranged from *** to *** percent. In the remaining 12 instances, prices for MSG from China and Indonesia were between *** and *** percent above prices for the domestic product.
Table V-7 MSG: Instances of underselling/overselling and the range and average of margins, by country, January 2010-June2013
* * * * * * *
V‐10
LOST SALES AND LOST REVENUE
The Commission requested U.S. producers of MSG report any instances of lost sales or revenue they experienced due to competition from imports of MSG from China and Indonesia during the POI. AJINA reported that it ***. The 20 lost sales allegations totaled $*** and involved *** pounds of MSG and the 11 lost revenue allegations totaled $*** and involved *** pounds of MSG. Staff contacted or attempted to contact all purchasers and a summary of the information obtained follows.
Purchasers responding to the lost sales allegations also were asked whether they shifted their purchases of MSG from U.S. producers to suppliers of MSG from China and Indonesia since 2010. Three of the ten responding purchasers reported that they had shifted purchases of MSG from U.S. producers to subject imports since 2010 and seven answered that no shift had occurred; two of the purchasers that had shifted to imports reported that price was the reason for the shift, and one purchaser reported that the reason for switching was that it wanted a secondary source of supply so that it did not have to rely exclusively on the domestic producer for its MSG.
In addition, purchasers were asked whether the U.S. producer reduced its prices in order to compete with suppliers of MSG from China and Indonesia. Four of seven responding purchasers answered yes and three answered no. Three other purchasers reported that they did not have the information needed to answer the question.
Table V-8 MSG: U.S. producers’ lost sales allegations
* * * * * * *
Table V-9 MSG: U.S. producers’ lost revenue allegations
* * * * * * *
VI‐1
FINANCIAL EXPERIENCE OF THE U.S. PRODUCER Part VI:
INTRODUCTION
The sole U.S. producer, AJINA, provided usable financial data on its operations on MSG. These data are believed to account for all U.S. production of MSG during the period examined. ***.
OPERATIONS ON MSG
Income‐and‐loss data for the U.S. producer are presented in table VI‐1. The reported financial condition of the U.S. industry *** from 2010 to 2012, as well as between the comparable interim periods. The reported aggregate net sales quantity and value *** from 2010 to 2012. Collectively, the aggregate cost of goods sold (“COGS”) and selling, general, and administrative (“SG&A”) expenses *** during this time. As a result of the *** in operating costs and expenses as compared to revenue, aggregate operating income *** from an operating margin of *** percent in 2010 to *** percent in 2012. Between the comparable interim periods, net sales quantity ***, net sales value ***, and combined operating costs and expenses ***. The *** in operating costs and expenses coupled with the *** in revenue resulted in an operating margin of *** percent in January‐June 2013 as compared to *** percent in January‐June 2012.
Per‐pound raw material costs *** from 2010 to 2012, as well as between the comparable interim periods. Raw materials accounted for an average *** percent of total COGS for the reporting period, and had a notable impact on the increase or decrease in per‐pound COGS during this time. Per‐pound raw material costs *** from 2010 to 2012, and further *** between the comparable interim periods.
Also having a notable impact on the movement in overall COGS were other factory costs, which accounted for an average *** percent of total COGS for the reporting period. Per‐pound other factory costs *** from 2010 to 2012 as volume declined, and *** between the comparable interim periods.1 2
SG&A expenses accounted for an average *** percent of total operating costs during the period examined, and *** per pound from 2010 to 2012 as volume declined, and *** per pound between the comparable interim periods.3
1 ***. E‐mail correspondence from ***, October 28, 2013, and AJINA’s response to question III‐8 of the U.S. producers’ questionnaire.
2 Direct labor *** of AJINA’s reported COGS. A company official noted that the MSG fermentation process requires ***. E‐mail correspondence from *** of AJINA, October 31, 2013.
3 ***.
VI‐2
Table VI-1 MSG: Results of operations of U.S. producer AJINA, 2010-12, January-June 2012, and January-June 2013
* * * * * * *
Variance analysis
The variance analysis presented in table VI‐2 is based on the data in table VI‐1.4 The analysis shows that the decline in operating income from 2010 to 2012 is primarily attributable to a higher unfavorable net cost/expense variance despite a favorable price variance (that is, costs and expenses increased more than prices). In January‐June 2013 as compared to January‐June 2012, the analysis shows that the decrease in operating income is attributable to both unfavorable price and net cost/expense variances (that is, costs and expenses increased, and prices declined).
Table VI-2 MSG: Variance analysis on the operations of U.S. producer AJINA, 2010-12, and January-June 2012-13
* * * * * * *
Capital expenditures, research and development expenses, and total assets
The responding firm’s aggregate data on capital expenditures, research and development (“R&D”) expenses, and total assets are shown in table VI‐3. Aggregate capital expenditures *** from 2010 to 2012. In January‐June 2013, capital expenditures were *** than in January‐June 2012 but were *** than full year 2010. R&D expenses *** from 2010 to 2012, but were *** in January‐June 2013 as compared to January‐June 2012. Total assets also *** from 2010 to 2012. According to AJINA, ***.5 6
4 The Commission’s variance analysis is calculated in three parts: sales variance, cost of sales variance (COGS variance), and SG&A expense variance. Each part consists of a price variance (in the case of the sales variance) or a cost variance (in the case of the COGS and SG&A expense variance), and a volume variance. The sales or cost variance is calculated as the change in unit price or unit cost/expense times the new volume, while the volume variance is calculated as the change in volume times the old unit price or unit cost. Summarized at the bottom of the table, the price variance is from sales; the cost/expense variance is the sum of those items from COGS and SG&A variances, respectively, and the volume variance is the sum of the volume components of the net sales, COGS, and SG&A expense variances.
5 E‐mail correspondence from ***, October 28, 2013. See also Petitioner’s postconference brief, p. 25.
VI‐3
Table VI-3 MSG: Capital expenditures, R&D expenses, and total assets of U.S. producer AJINA, 2010-12, January-June 2012, and January-June 2013
* * * * * * *
Capital and investment
The Commission requested the U.S. producer of MSG to describe any current or anticipated negative effects of imports of MSG from China or Indonesia on its growth, investment, ability to raise capital, development and production efforts, or the scale of capital investments. Responses by the U.S. producer AJINA follow.
Effects of imports:
***. Anticipated effects of imports: ***.
(…continued)
6 Based on the reported data for operating income and total assets, the calculated return on investment during the period examined is *** percent (2010), *** percent (2011), and *** percent (2012).

VII‐1
PART VII: THREAT CONSIDERATIONS AND INFORMATION ON NONSUBJECT COUNTRIES
Section 771(7)(F)(i) of the Act (19 U.S.C. § 1677(7)(F)(i)) provides that—
In determining whether an industry in the United States is threatened with material injury by reason of imports (or sales for importation) of the subject merchandise, the Commission shall consider, among other relevant economic factors1‐‐ (I) if a countervailable subsidy is involved, such information as may
be presented to it by the administering authority as to the nature of the subsidy (particularly as to whether the countervailable subsidy is a subsidy described in Article 3 or 6.1 of the Subsidies Agreement), and whether imports of the subject merchandise are likely to increase,
(II) any existing unused production capacity or imminent, substantial increase in production capacity in the exporting country indicating the likelihood of substantially increased imports of the subject merchandise into the United States, taking into account the availability of other export markets to absorb any additional exports,
(III) a significant rate of increase of the volume or market penetration of imports of the subject merchandise indicating the likelihood of substantially increased imports,
(IV) whether imports of the subject merchandise are entering at prices that are likely to have a significant depressing or suppressing effect on domestic prices, and are likely to increase demand for further imports,
(V) inventories of the subject merchandise,
1 Section 771(7)(F)(ii) of the Act (19 U.S.C. § 1677(7)(F)(ii)) provides that “The Commission shall consider {these factors} . . . as a whole in making a determination of whether further dumped or subsidized imports are imminent and whether material injury by reason of imports would occur unless an order is issued or a suspension agreement is accepted under this title. The presence or absence of any factor which the Commission is required to consider . . . shall not necessarily give decisive guidance with respect to the determination. Such a determination may not be made on the basis of mere conjecture or supposition.”
VII‐2
(VI) the potential for product‐shifting if production facilities in the foreign country, which can be used to produce the subject merchandise, are currently being used to produce other products,
(VII) in any investigation under this title which involves imports of both a raw agricultural product (within the meaning of paragraph (4)(E)(iv)) and any product processed from such raw agricultural product, the likelihood that there will be increased imports, by reason of product shifting, if there is an affirmative determination by the Commission under section 705(b)(1) or 735(b)(1) with respect to either the raw agricultural product or the processed agricultural product (but not both),
(VIII) the actual and potential negative effects on the existing development and production efforts of the domestic industry, including efforts to develop a derivative or more advanced version of the domestic like product, and
(IX) any other demonstrable adverse trends that indicate the probability that there is likely to be material injury by reason of imports (or sale for importation) of the subject merchandise (whether or not it is actually being imported at the time).2
Information on the nature of the alleged subsidies was presented earlier in this report; information on the volume and pricing of imports of the subject merchandise is presented in Parts IV and V; and information on the effects of imports of the subject merchandise on U.S. producers’ existing development and production efforts is presented in Part VI. Information on inventories of the subject merchandise; foreign producers’ operations, including the potential for “product‐shifting;” any other threat indicators, if applicable; and any dumping in third‐country markets, follows. Also presented in this section of the report is information obtained for consideration by the Commission on nonsubject countries.
THE INDUSTRY IN CHINA
China is the world’s largest MSG producing country with an annual capacity of approximately *** thousand metric tons in 2009. China produced *** metric tons of MSG in 2009. There are over fifteen producers of MSG in China, including Hebei Meihua Monosodium
2 Section 771(7)(F)(iii) of the Act (19 U.S.C. § 1677(7)(F)(iii)) further provides that, in antidumping investigations, “. . . the Commission shall consider whether dumping in the markets of foreign countries (as evidenced by dumping findings or antidumping remedies in other WTO member markets against the same class or kind of merchandise manufactured or exported by the same party as under investigation) suggests a threat of material injury to the domestic industry.”
VII‐3
Glutamate Group Co., Ltd.; Henan Lianhua Monosodium Glutamate Co., Ltd.; Henan Lotus Gourmet Powder Inc.; Qilu Monosodium Glutamate Group Co., Ltd.; Shandong Fufeng Fermentation Co., Ltd. and Shandong Linghua Group Co., Ltd. In China, MSG is produced through fermentation processes, largely using corn or cassava starch.3
The Commission issued foreign producers’ or exporters’ questionnaires to ten firms believed to produce and/or export MSG from China.4 The Commission did not receive any questionnaire responses from Chinese firms.
THE INDUSTRY IN INDONESIA
Indonesia is the world’s second largest MSG producing country with an annual capacity of approximately *** metric tons in 2009. Indonesia produced *** metric tons of MSG in 2009.5
The Commission issued foreign producers’ or exporters’ questionnaires to four firms believed to produce and/or export MSG from Indonesia.6 Useable responses to the Commission’s questionnaire were received from three firms: PT Ajinex International (“PT Ajinex”) and PT Ajinomoto Indonesia (“PT Ajinomoto), both affiliates of AJINA, as well as P.T. Cheil Jedang Indonesia (“PT CJI”). PT Ajinex and PT Ajinomoto do not export to the United States.7 PT CJI estimates that its exports to the United States accounted for approximately *** percent of U.S. imports of MSG from Indonesia in 2012. According to estimates requested of the responding Indonesian producers, the production of MSG in Indonesia reported in this Part of the report accounts for at least *** percent8 of overall production of MSG in Indonesia. Table VII‐1 presents 2012 capacity, production, and export shipment data for the responding Indonesian firms.
3 ***. 4 These firms were identified through a review of information submitted in the petition and
contained in proprietary Customs records. 5 ***. 6 These firms were identified through a review of information submitted in the petition and
contained in proprietary Customs records. 7 Petition, p. 3. 8 ***.
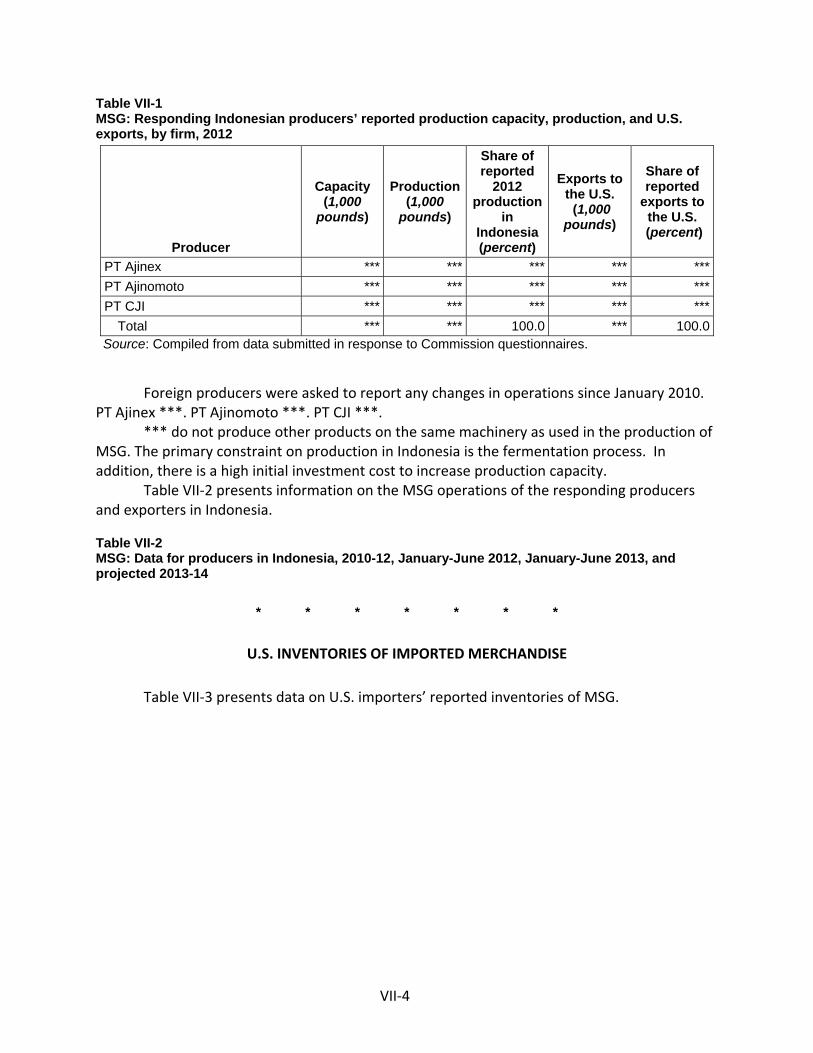
VII‐4
Table VII-1 MSG: Responding Indonesian producers’ reported production capacity, production, and U.S. exports, by firm, 2012
Producer
Capacity (1,000
pounds)
Production (1,000
pounds)
Share of reported
2012 production
in Indonesia (percent)
Exports to the U.S. (1,000
pounds)
Share of reported
exports to the U.S.
(percent)
PT Ajinex *** *** *** *** ***PT Ajinomoto *** *** *** *** ***PT CJI *** *** *** *** ***
Total *** *** 100.0 *** 100.0 Source: Compiled from data submitted in response to Commission questionnaires.
Foreign producers were asked to report any changes in operations since January 2010. PT Ajinex ***. PT Ajinomoto ***. PT CJI ***.
*** do not produce other products on the same machinery as used in the production of MSG. The primary constraint on production in Indonesia is the fermentation process. In addition, there is a high initial investment cost to increase production capacity.
Table VII‐2 presents information on the MSG operations of the responding producers and exporters in Indonesia.
Table VII-2 MSG: Data for producers in Indonesia, 2010-12, January-June 2012, January-June 2013, and projected 2013-14
* * * * * * *
U.S. INVENTORIES OF IMPORTED MERCHANDISE
Table VII‐3 presents data on U.S. importers’ reported inventories of MSG.
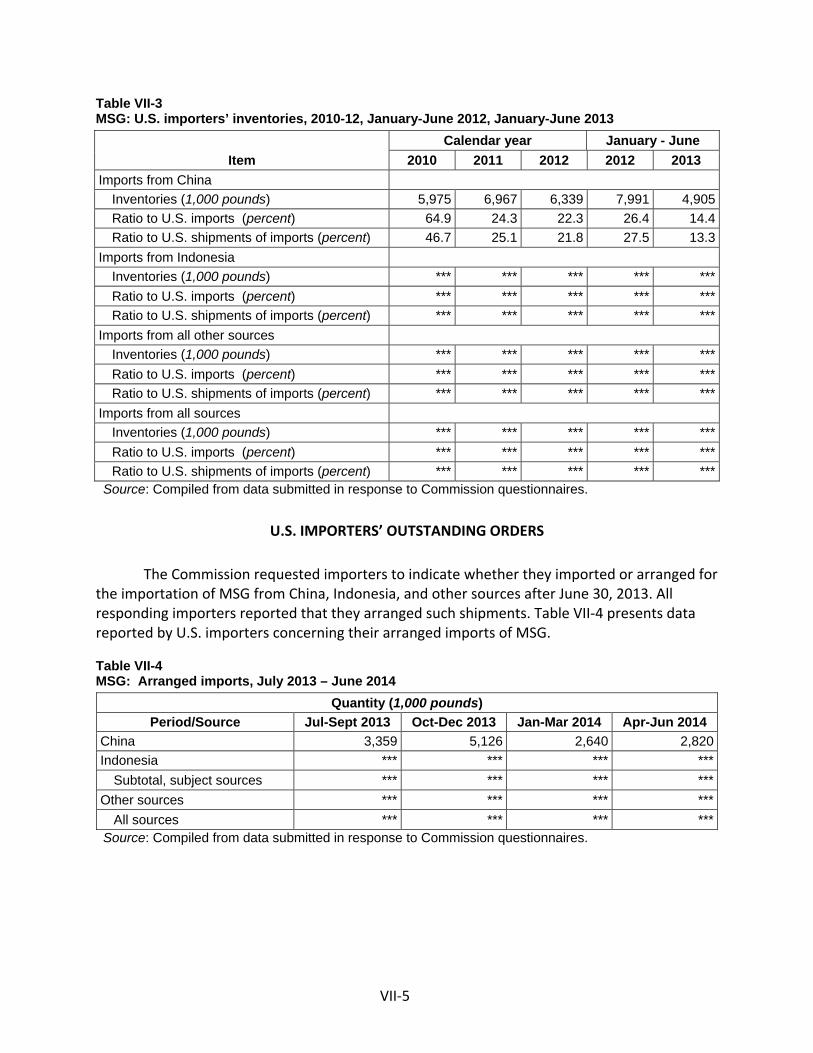
VII‐5
Table VII-3 MSG: U.S. importers’ inventories, 2010-12, January-June 2012, January-June 2013
Item Calendar year January - June
2010 2011 2012 2012 2013 Imports from China
Inventories (1,000 pounds) 5,975 6,967 6,339 7,991 4,905Ratio to U.S. imports (percent) 64.9 24.3 22.3 26.4 14.4Ratio to U.S. shipments of imports (percent) 46.7 25.1 21.8 27.5 13.3
Imports from Indonesia Inventories (1,000 pounds) *** *** *** *** ***Ratio to U.S. imports (percent) *** *** *** *** ***Ratio to U.S. shipments of imports (percent) *** *** *** *** ***
Imports from all other sources Inventories (1,000 pounds) *** *** *** *** ***Ratio to U.S. imports (percent) *** *** *** *** ***Ratio to U.S. shipments of imports (percent) *** *** *** *** ***
Imports from all sources Inventories (1,000 pounds) *** *** *** *** ***Ratio to U.S. imports (percent) *** *** *** *** ***Ratio to U.S. shipments of imports (percent) *** *** *** *** ***
Source: Compiled from data submitted in response to Commission questionnaires.
U.S. IMPORTERS’ OUTSTANDING ORDERS
The Commission requested importers to indicate whether they imported or arranged for the importation of MSG from China, Indonesia, and other sources after June 30, 2013. All responding importers reported that they arranged such shipments. Table VII‐4 presents data reported by U.S. importers concerning their arranged imports of MSG.
Table VII-4 MSG: Arranged imports, July 2013 – June 2014
Quantity (1,000 pounds) Period/Source Jul-Sept 2013 Oct-Dec 2013 Jan-Mar 2014 Apr-Jun 2014
China 3,359 5,126 2,640 2,820Indonesia *** *** *** ***
Subtotal, subject sources *** *** *** ***Other sources *** *** *** ***
All sources *** *** *** *** Source: Compiled from data submitted in response to Commission questionnaires.
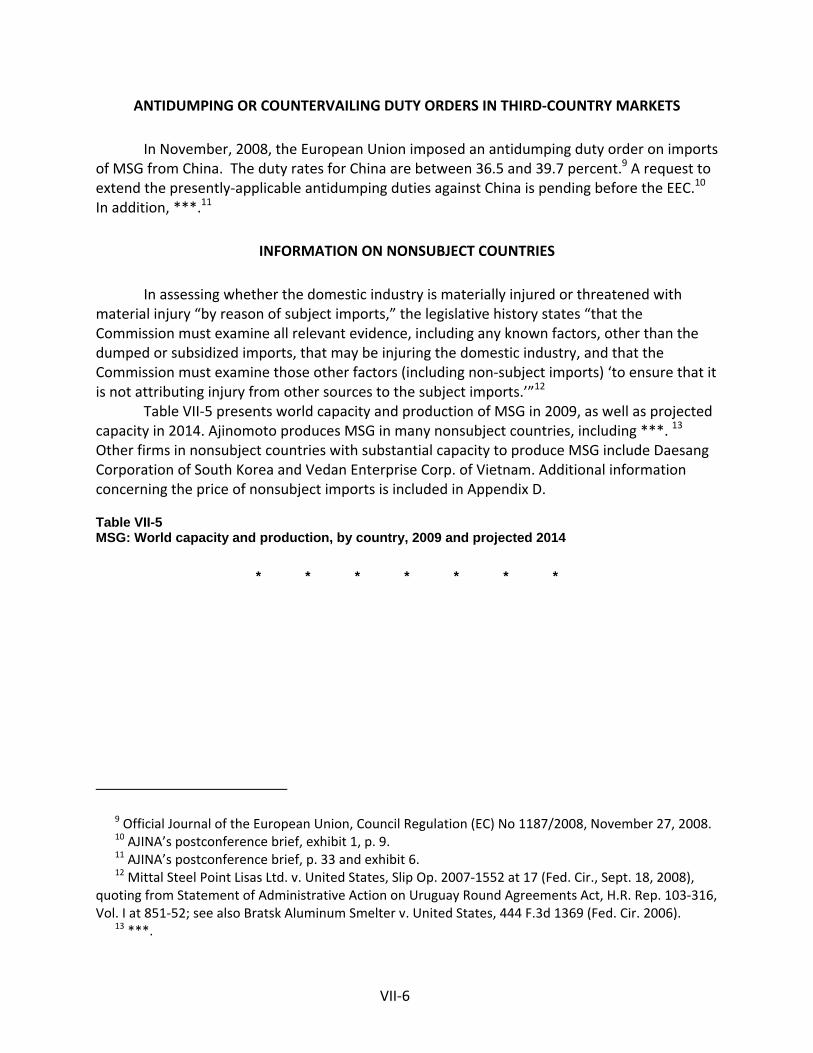
VII‐6
ANTIDUMPING OR COUNTERVAILING DUTY ORDERS IN THIRD‐COUNTRY MARKETS
In November, 2008, the European Union imposed an antidumping duty order on imports of MSG from China. The duty rates for China are between 36.5 and 39.7 percent.9 A request to extend the presently‐applicable antidumping duties against China is pending before the EEC.10 In addition, ***.11
INFORMATION ON NONSUBJECT COUNTRIES
In assessing whether the domestic industry is materially injured or threatened with material injury “by reason of subject imports,” the legislative history states “that the Commission must examine all relevant evidence, including any known factors, other than the dumped or subsidized imports, that may be injuring the domestic industry, and that the Commission must examine those other factors (including non‐subject imports) ‘to ensure that it is not attributing injury from other sources to the subject imports.’”12
Table VII‐5 presents world capacity and production of MSG in 2009, as well as projected capacity in 2014. Ajinomoto produces MSG in many nonsubject countries, including ***. 13 Other firms in nonsubject countries with substantial capacity to produce MSG include Daesang Corporation of South Korea and Vedan Enterprise Corp. of Vietnam. Additional information concerning the price of nonsubject imports is included in Appendix D.
Table VII-5 MSG: World capacity and production, by country, 2009 and projected 2014
* * * * * * *
9 Official Journal of the European Union, Council Regulation (EC) No 1187/2008, November 27, 2008. 10 AJINA’s postconference brief, exhibit 1, p. 9. 11 AJINA’s postconference brief, p. 33 and exhibit 6. 12 Mittal Steel Point Lisas Ltd. v. United States, Slip Op. 2007‐1552 at 17 (Fed. Cir., Sept. 18, 2008),
quoting from Statement of Administrative Action on Uruguay Round Agreements Act, H.R. Rep. 103‐316, Vol. I at 851‐52; see also Bratsk Aluminum Smelter v. United States, 444 F.3d 1369 (Fed. Cir. 2006).
13 ***.
A‐1
APPENDIX A
FEDERAL REGISTER NOTICES

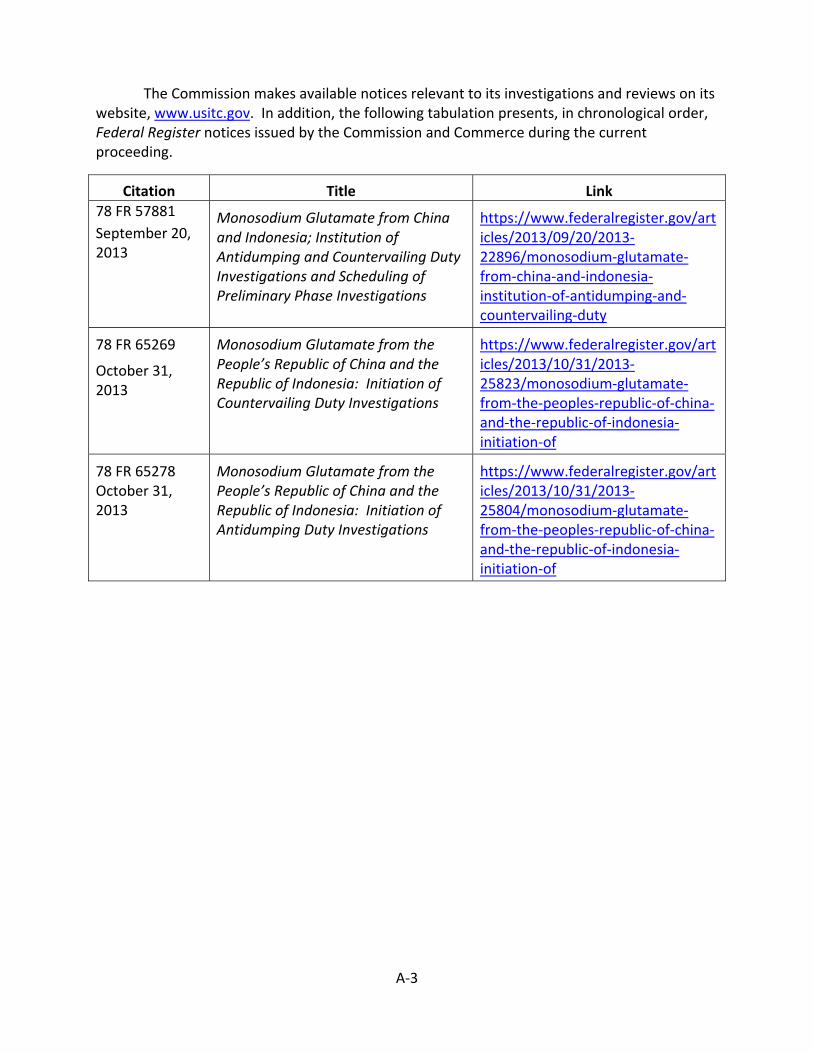
A‐3
The Commission makes available notices relevant to its investigations and reviews on its website, www.usitc.gov. In addition, the following tabulation presents, in chronological order, Federal Register notices issued by the Commission and Commerce during the current proceeding.
Citation Title Link
78 FR 57881
September 20, 2013
Monosodium Glutamate from China and Indonesia; Institution of Antidumping and Countervailing Duty Investigations and Scheduling of Preliminary Phase Investigations
https://www.federalregister.gov/articles/2013/09/20/2013‐22896/monosodium‐glutamate‐from‐china‐and‐indonesia‐institution‐of‐antidumping‐and‐countervailing‐duty
78 FR 65269
October 31, 2013
Monosodium Glutamate from the People’s Republic of China and the Republic of Indonesia: Initiation of Countervailing Duty Investigations
https://www.federalregister.gov/articles/2013/10/31/2013‐25823/monosodium‐glutamate‐from‐the‐peoples‐republic‐of‐china‐and‐the‐republic‐of‐indonesia‐initiation‐of
78 FR 65278 October 31, 2013
Monosodium Glutamate from the People’s Republic of China and the Republic of Indonesia: Initiation of Antidumping Duty Investigations
https://www.federalregister.gov/articles/2013/10/31/2013‐25804/monosodium‐glutamate‐from‐the‐peoples‐republic‐of‐china‐and‐the‐republic‐of‐indonesia‐initiation‐of


B‐1
APPENDIX B
CALENDAR OF THE PUBLIC STAFF CONFERENCE

B‐3
CALENDAR OF PUBLIC PRELIMINARY CONFERENCE
Subject: Monosodium Glutamate from China and Indonesia
Inv. Nos.: 701-TA-503-504 and 731-TA-1229-1230 (Preliminary)
Date and Time: October 23, 2013 - 9:30 a.m.
A session was held in connection with these preliminary investigations in the
Main Hearing Room (room 101), 500 E Street, S.W., Washington, DC.
OPENING REMARKS: Petitioner (Iain R. McPhie, Squire Sanders (US) LLP In Support of the Imposition of Antidumping and Countervailing Duty Orders:
Squire Sanders (US) LLP Washington, DC and Cleary Gottlieb Steen & Hamilton LLP Washington, DC on behalf of Ajinomoto North America, Inc. (“AJINA”) Brendan Naulty, Senior Vice President, AJINA
Kentaro Shimizu, Director of Savory and Specialty Ingredients, AJINA
Dave Barbour, Senior Consultant, AJINA
Bruce Malashevich, President, Economic Consulting Services
B‐4
In Support of the Imposition of Antidumping and Countervailing Duty Orders (continued):
Cara Groden, Economist, Economic Consulting Services
Iain R. McPhie ) Christine Sohar Henter ) – OF COUNSEL Sarah Sprinkle ) Michael Lazerwitz ) ) – OF COUNSEL Ryan Davis )
CLOSING REMARKS:
Petitioner (Iain R. McPhie, Squire Sanders (US) LLP)

C‐1
APPENDIX C
SUMMARY DATA

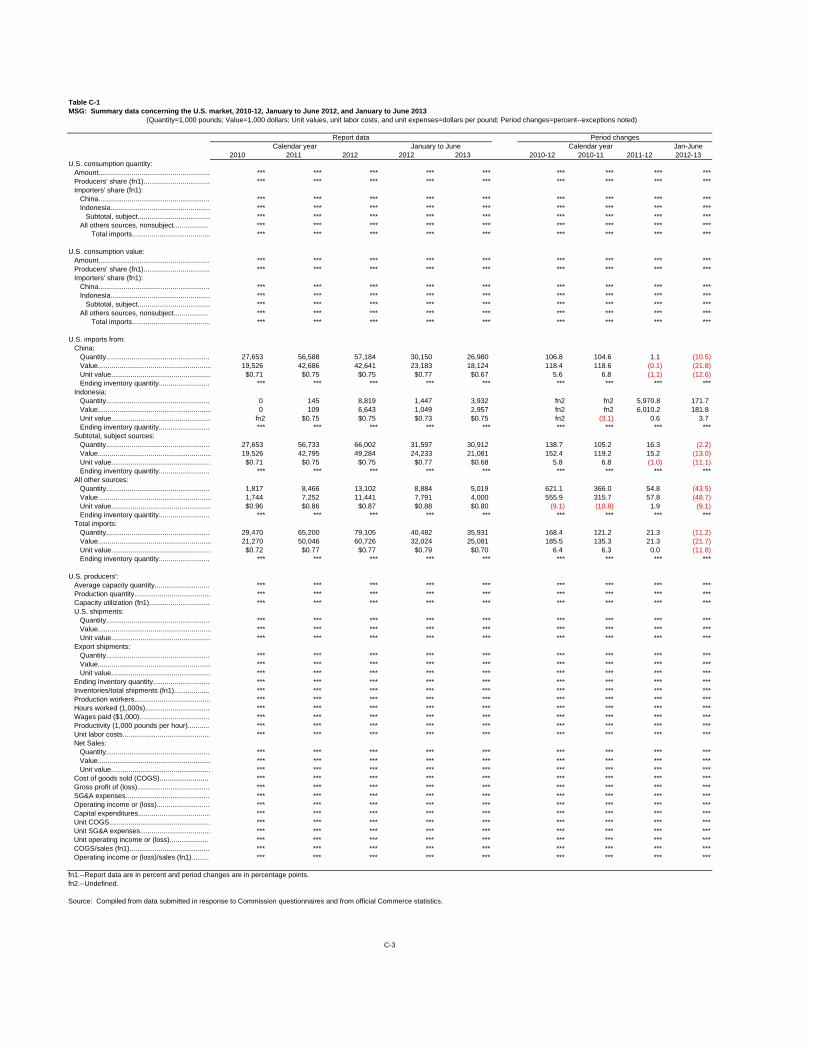
Table C-1MSG: Summary data concerning the U.S. market, 2010-12, January to June 2012, and January to June 2013
Jan-June2010 2011 2012 2012 2013 2010-12 2010-11 2011-12 2012-13
U.S. consumption quantity:Amount......................................................... *** *** *** *** *** *** *** *** ***Producers' share (fn1).................................. *** *** *** *** *** *** *** *** ***Importers' share (fn1):
China......................................................... *** *** *** *** *** *** *** *** ***Indonesia................................................... *** *** *** *** *** *** *** *** ***
Subtotal, subject..................................... *** *** *** *** *** *** *** *** ***All others sources, nonsubject.................. *** *** *** *** *** *** *** *** ***
Total imports........................................ *** *** *** *** *** *** *** *** ***
U.S. consumption value:Amount......................................................... *** *** *** *** *** *** *** *** ***Producers' share (fn1).................................. *** *** *** *** *** *** *** *** ***Importers' share (fn1):
China......................................................... *** *** *** *** *** *** *** *** ***Indonesia................................................... *** *** *** *** *** *** *** *** ***
Subtotal, subject..................................... *** *** *** *** *** *** *** *** ***All others sources, nonsubject.................. *** *** *** *** *** *** *** *** ***
Total imports........................................ *** *** *** *** *** *** *** *** ***
U.S. imports from:China: C D E F G
Quantity..................................................... 27,653 56,588 57,184 30,150 26,980 7 106.8 104.6 1.1 (10.5)Value.......................................................... 19,526 42,686 42,641 23,183 18,124 13 118.4 118.6 (0.1) (21.8)Unit value................................................... $0.71 $0.75 $0.75 $0.77 $0.67 19 5.6 6.8 (1.1) (12.6)Ending inventory quantity.......................... *** *** *** *** *** 200 *** *** *** ***
Indonesia:Quantity..................................................... 0 145 8,819 1,447 3,932 8 fn2 fn2 5,970.8 171.7Value.......................................................... 0 109 6,643 1,049 2,957 14 fn2 fn2 6,010.2 181.8Unit value................................................... fn2 $0.75 $0.75 $0.73 $0.75 20 fn2 (3.1) 0.6 3.7Ending inventory quantity.......................... *** *** *** *** *** 270 *** *** *** ***
Subtotal, subject sources:Quantity..................................................... 27,653 56,733 66,002 31,597 30,912 9 138.7 105.2 16.3 (2.2)Value.......................................................... 19,526 42,795 49,284 24,233 21,081 15 152.4 119.2 15.2 (13.0)Unit value................................................... $0.71 $0.75 $0.75 $0.77 $0.68 21 5.8 6.8 (1.0) (11.1)Ending inventory quantity.......................... *** *** *** *** *** 340 *** *** *** ***
All other sources:Quantity..................................................... 1,817 8,466 13,102 8,884 5,019 10 621.1 366.0 54.8 (43.5)Value.......................................................... 1,744 7,252 11,441 7,791 4,000 16 555.9 315.7 57.8 (48.7)Unit value................................................... $0.96 $0.86 $0.87 $0.88 $0.80 22 (9.1) (10.8) 1.9 (9.1)Ending inventory quantity.......................... *** *** *** *** *** 410 *** *** *** ***
Total imports:Quantity..................................................... 29,470 65,200 79,105 40,482 35,931 11 168.4 121.2 21.3 (11.2)Value.......................................................... 21,270 50,046 60,726 32,024 25,081 17 185.5 135.3 21.3 (21.7)Unit value................................................... $0.72 $0.77 $0.77 $0.79 $0.70 23 6.4 6.3 0.0 (11.8)Ending inventory quantity.......................... *** *** *** *** *** 480 *** *** *** ***
U.S. producers':Average capacity quantity............................ *** *** *** *** *** 189 *** *** *** ***Production quantity....................................... *** *** *** *** *** 191 *** *** *** ***Capacity utilization (fn1)............................... *** *** *** *** *** 207 *** *** *** ***U.S. shipments:
Quantity..................................................... *** *** *** *** *** 224 *** *** *** ***Value.......................................................... *** *** *** *** *** 225 *** *** *** ***Unit value................................................... *** *** *** *** *** 226 *** *** *** ***
Export shipments:Quantity..................................................... *** *** *** *** *** 198 *** *** *** ***Value.......................................................... *** *** *** *** *** 199 *** *** *** ***Unit value................................................... *** *** *** *** *** 215 *** *** *** ***
Ending inventory quantity............................. *** *** *** *** *** 239 *** *** *** ***Inventories/total shipments (fn1).................. *** *** *** *** *** 242 *** *** *** ***Production workers....................................... *** *** *** *** *** 203 *** *** *** ***Hours worked (1,000s)................................. *** *** *** *** *** 204 *** *** *** ***Wages paid ($1,000).................................... *** *** *** *** *** 205 *** *** *** ***Productivity (1,000 pounds per hour)........... *** *** *** *** *** 246 *** *** *** ***Unit labor costs............................................. *** *** *** *** *** 248 *** *** *** ***Net Sales:
Quantity..................................................... *** *** *** *** *** 420 *** *** *** ***Value.......................................................... *** *** *** *** *** 424 *** *** *** ***Unit value................................................... *** *** *** *** *** 455 *** *** *** ***
Cost of goods sold (COGS)......................... *** *** *** *** *** 428 *** *** *** ***Gross profit of (loss)..................................... *** *** *** *** *** 429 *** *** *** ***SG&A expenses........................................... *** *** *** *** *** 432 *** *** *** ***Operating income or (loss)........................... *** *** *** *** *** 433 *** *** *** ***Capital expenditures..................................... *** *** *** *** *** 552 *** *** *** ***Unit COGS.................................................... *** *** *** *** *** 457 *** *** *** ***Unit SG&A expenses.................................... *** *** *** *** *** 459 *** *** *** ***Unit operating income or (loss).................... *** *** *** *** *** 490 *** *** *** ***COGS/sales (fn1)......................................... *** *** *** *** *** 467 *** *** *** ***Operating income or (loss)/sales (fn1)......... *** *** *** *** *** 472 *** *** *** ***
fn1.--Report data are in percent and period changes are in percentage points.fn2.--Undefined.
Source: Compiled from data submitted in response to Commission questionnaires and from official Commerce statistics.
C-3
(Quantity=1,000 pounds; Value=1,000 dollars; Unit values, unit labor costs, and unit expenses=dollars per pound; Period changes=percent--exceptions noted)
Calendar year January to JuneReport data
Calendar yearPeriod changes

D‐1
APPENDIX D
NONSUBJECT COUNTRY PRICE DATA

D‐3
One importer reported price data for nonsubject country Brazil for products 1, 2, and 3. These price items and accompanying data are comparable to those presented in tables V‐3 to V‐5. Price and quantity data for Brazil are shown in table D‐1 and in figures D‐1 through D‐3 (with domestic and subject sources).
In comparing nonsubject country pricing data with U.S. producer pricing data, prices for product imported from Brazil were lower than prices for U.S.‐produced product in *** instances and higher in eight instances. In comparing nonsubject country pricing data with subject country pricing data, prices for product imported from Brazil were lower than prices for product imported from subject countries in *** instances and higher in *** instances. A summary of price comparisons is presented in table D‐2.
Table D-1 MSG: Weighted-average f.o.b. prices and quantities of imported products 11 22 and 33 from Brazil by quarters, January 2010-June 2013
* * * * * * *
Figure D-1 MSG: Weighted-average f.o.b. prices and quantities of domestic and imported product 11, by quarters, January 2010-June 2013
* * * * * * * Figure D-2 MSG: Weighted-average f.o.b. prices and quantities of domestic and imported product 21, by quarters, January 2010-June 2013
* * * * * * *
Figure D-3 MSG: Weighted-average f.o.b. prices and quantities of domestic and imported product 31, by quarters, January 2010-June 2013
* * * * * * * Table D-2 MSG: Summary of underselling/(overselling), by country, January 2010-June 2013
* * * * * * *
.