Embed Size (px)
Citation preview
1939-1374 (c) 2013 IEEE. Personal use is permitted, but republication/redistribution requires IEEE permission. Seehttp://www.ieee.org/publications_standards/publications/rights/index.html for more information.
This article has been accepted for publication in a future issue of this journal, but has not been fully edited. Content may change prior to final publication. Citation information: DOI10.1109/TSC.2014.2302810, IEEE Transactions on Services Computing
IEEE TRANSACTIONS ON SERVICE COMPUTING 1
Abstract—. This paper presents a novel monitoring
architecture addressed to the cloud provider and the cloud
consumers. This architecture offers a Monitoring Platform-as-
a-Service to each cloud consumer that allows to customize the
monitoring metrics. The cloud provider sees a complete
overview of the infrastructure whereas the cloud consumer
sees automatically her cloud resources and can define other
resources or services to be monitored. This is accomplished by
means of an adaptive distributed monitoring architecture
automatically deployed in the cloud infrastructure. This
architecture has been implemented and released under GPL
license to the community as “MonPaaS”, open source software
for integrating Nagios and OpenStack. An intensive empirical
evaluation of performance and scalability have been done
using a real deployment of a cloud computing infrastructure in
which more than 3700 VMs have been executed.
Index Terms— Cloud Computing, Monitoring Software,
Monitoring Virtual Infrastructures, Monitoring-as-a-Service,
I. INTRODUCTION
loud Computing is changing radically the way in
which hardware infrastructures are being utilized. The
open source cloud computing stacks for managing
private clouds infrastructures, i.e. Infrastructure-as-a-Service
(IaaS), like OpenStack1, Apache CloudStack
2, Snooze
3,
OpenNebula [1], and Eucalyptus [2] enables enterprises to
update the management plane of their datacentre in order to
optimize the usage of the computational resources according
to the constantly changing business requirements of their
organizations. On the other hand, public cloud computing
vendors like Amazon EC24 , Microsoft Azure
5 and Rackspace
6
enable cloud consumers to extend their infrastructure beyond
the physical boundaries of their hardware by renting third
party computational resources in a pay-as-you-go model
enabling the creation of an elastic infrastructure.
Despite of the well-known advantages of cloud computing
such as the important cost reduction in hardware acquisition
and the optimization in the usage of hardware resources, cloud
Jose M. Alcaraz Calero (Corresponding Author), University of the West of
Scotland, School of Computing, Paisley Campus, Paisley, Scotland PA1 2BE.
(e-mail: [email protected]). Juan Gutierrez Aguado, University of Valencia, Department of Computer
Science, Campus de Burjassot, Valencia, Spain 46100 (e-mail:
[email protected]) 1 OpenStack is available for download at http://www.openstack.org/ 2 Apache CloudStack is available for download at http://cloudstack.
apache.org/ 3 Snooke is available for download at http://snooze.inria.fr/ 4 Amazon EC2 is accessible at http://aws.amazon.com/es/ec2/ 5 Microsft Azure is accessible at http://www.windowsazure.com/ 6 Rackspace is accessible at http://www.rackspace.com/es/cloud/
compsuting also demands important challenges which have to
be seriously addressed in order to provide really attractive
solutions for the business market.
One of the main challenges associated to cloud computing
monitoring is the lack of information and control with regards
to the customization of the monitoring metrics that the cloud
customers have over the rented cloud resources. In private
clouds, the provider and the consumer of the cloud resources
are the same person and thus she has a complete control over
the physical hardware resources. She can easily install
monitoring software to gather information over the physical
and virtual infrastructures. However, the current monitoring
solutions do not fit well in the cloud computing scenario
where the resources, typically virtual machines (VMs), storage
disks and image disks, are usually virtualized. Virtualization
entails a new life cycle for the virtual resources as they are
constantly being created and destroyed which does not occur
in physical resources. The public cloud scenario is even more
challenging due to the additional fact that the cloud provider
cannot install any software in the cloud consumer’s VMs
without her previous acknowledge. These properties cast aside
traditional monitoring solutions which: i) have not been design
to fit in the life cycle of virtual resources; and ii) are usually
based on monitoring agents installed inside the machines to
gather metrics. These facts make the traditional monitoring
solutions not fit for cloud infrastructures.
As a first step to address this issue, we developed IaaSMon
[3], a free and open-source monitoring solution. IaaSMon is a
monitoring architecture provides to the cloud provider an
overview the status of the complete cloud computing
infrastructure. Our contribution was based on the integration
between Nagios, a well-known enterprise-class open source
monitoring software and OpenStack, a well-known open
source cloud computing stack for infrastructures. This first
step was important to provide information about the
infrastructure to the cloud provider. However, that
contribution does not solve the problem of the lack of
information and control from the point of view of the
consumer of cloud infrastructures.
Now, we provide a significant step in the field with a novel
monitoring architecture, called henceforth MonPaaS.
MonPaaS complements perfectly our previous IaaSMon.
MonPaaS addressed monitoring solutions for both providers
and consumers of cloud infrastructures offering to the latters a
Monitoring Platform-as-a-Service. This monitoring platform
has been designed to fit in both public and private cloud
infrastructures scenarios. In the rest of this contribution, it is
MonPaaS: An Adaptive Monitoring Platform as a Service
for Cloud Computing Infrastructures and Services
Jose M. Alcaraz Calero, Senior IEEE, Juan Gutierrez Aguado
C
1939-1374 (c) 2013 IEEE. Personal use is permitted, but republication/redistribution requires IEEE permission. Seehttp://www.ieee.org/publications_standards/publications/rights/index.html for more information.
This article has been accepted for publication in a future issue of this journal, but has not been fully edited. Content may change prior to final publication. Citation information: DOI10.1109/TSC.2014.2302810, IEEE Transactions on Services Computing
IEEE TRANSACTIONS ON SERVICE COMPUTING 2
assumed a public cloud scenario which is the one that imposes
more challenges. Some well-known public cloud vendors like
Amazon and Rackspaces, among others, have started to
provide monitoring solutions over the rented cloud resources
like CPU usage, and I/O usage to the customers. However,
these metrics are, in all the cases, a closed and small set of
metrics which are not customizable by the cloud customer.
Moreover, the public cloud vendors have not published their
infrastructure enabling the customer to see the monitoring
architecture used.
So, the main contribution of this paper is to present a novel
monitoring Platform-as-a-Service to enable both cloud
provider and cloud consumer to monitor the cloud
infrastructure resources and services. The cloud provider is
able to see a complete overview of the infrastructure by means
of a distributed architecture automatically deployed in the
cloud infrastructure whereas the cloud consumer is able to see
automatically her cloud resources by means of the adaptive
capabilities of the monitoring architecture while she also can
define manually what other resources want to be monitored as
well. The cloud consumer can also configure and customize
what information is gathered over her resources and services
being monitored.
To cope with this monitoring architecture for cloud
computing infrastructures, we have extended the requirements
previously identified in IaaSMon, focused on the cloud
provider perspective, with new requirements to be fulfilled in
this new architecture from the cloud consumer perspective.
Requirements from the Perspective of the Cloud Provider
(already covered by IaaSMon)
Integration of Nagios and OpenStack.
Quick and automatic response against changes in the
physical and virtual infrastructure.
Tested enterprise-class monitoring architecture.
Monitoring virtual and physical resources.
Keep a mapping between virtual and physical
resources.
Perform transparent monitoring for the cloud
customer’s VMs (agent-less monitoring).
Rich and extensible set of metrics.
New Requirements from the Perspective of the Cloud
Consumer (covered in MonPaaS)
Distributed architecture for high scalability.
Allow cloud providers and consumers to monitor
resources independently.
Securely and privately provide monitoring
information to the correct party.
Disaster Recovery against failures.
Discover automatically all the resources to be
monitored (cold start).
Allows cloud customer to extend, configure and
customize the resources and services to be
monitored (Monitoring-as-a-Platform).
MonPaaS provides a distributed monitoring architecture
suitable for large deployments. Each cloud customer can
access to the monitoring information of the status of her
infrastructure, i.e. multi-tenancy support. The cloud provider
and the cloud consumer see different monitoring information.
The information monitored by the cloud consumer is private
so that it can be accessed neither by other cloud consumer nor
by the cloud provider. MonPaaS supports disaster recovery by
means of the synchronization of information between the
infrastructure and the monitoring software to be able to
recover against failures. The cloud customer can extend,
configure and customize the resources and services to be
monitored in the monitoring architecture. Such resources may
be both cloud and traditional (non-cloud) resources, i.e. the
monitoring architecture provides a monitoring platform-as-a-
service for the cloud consumer.
To explain the monitoring architecture that fulfils the above
requirements, this paper has been organized as follows. In
section II, the reader will see a complete state-of-the-art of
monitoring solutions for cloud computing infrastructures
together with our differentiating points with respect to such
solutions. After that, the monitoring architecture is carefully
described in section III. Section IV describes the sequence
diagrams of different monitoring actions in order to explain
how our architecture works internally. Then, section V
describes some details about the open-source implementation
released to the community. Section VI provides a detailed set
of statistics about performance and scalability of the
monitoring architecture proposed. Such statistics are gathered
from a real cloud computing test bed infrastructure. Finally,
section VII outlines some conclusions and future works.
II. RELATED WORK
There are many research works related to the monitoring of
cloud computing infrastructures. This revision of the state-of-
the-art is only focused on software used to monitor
infrastructures and their services leaving aside other
monitoring tools such as network traffic monitoring, QoS
monitoring, SLA-monitoring, security monitoring or any other
monitoring based on physical sensor devices.
There are some monitoring solutions for cloud computing
infrastructures already published in the literature despite of the
fact that the number of real downloadable applications is
really scarce. So, Shao et al [4], Huang & Wang [5] and Rak
et al [6] provide a centralized monitoring architecture for
cloud computing infrastructures only suitable for small size
deployments due to the lack of scalability associated to the
centralized monitoring approach. Tovarnak and Pitner [7],
Dhingra et al [8], Selvi & Govindarajan [9], Katsaos [10]
together with Shao et al [4], Huang & Wang [5] provide
monitoring solutions focused on the installation of a software
agent in the cloud customer’s VMs. While this installation is
acceptable for environments in which the cloud customer want
explicitly to perform monitoring solutions, it does not cover
the scenarios in which the cloud customer does not want to
perform explicitly the monitoring of her VMs but the cloud
provider needs to perform a non-intrusive monitoring of such
VMs in order to have an updated overview of the complete
infrastructure. We are particularly interested in offering a
solution for both customers and providers of cloud
1939-1374 (c) 2013 IEEE. Personal use is permitted, but republication/redistribution requires IEEE permission. Seehttp://www.ieee.org/publications_standards/publications/rights/index.html for more information.
This article has been accepted for publication in a future issue of this journal, but has not been fully edited. Content may change prior to final publication. Citation information: DOI10.1109/TSC.2014.2302810, IEEE Transactions on Services Computing
IEEE TRANSACTIONS ON SERVICE COMPUTING 3
infrastructures thus only architectures that consider monitoring
agents as optional are suitable to fulfil our requirements.
Andreolini et al [11] describe a distributed monitoring
architecture designed specifically for cloud computing.
However, they do not cover any particularity related to the
monitoring of virtualized infrastructures like the mapping
between virtual and physical resources and the management of
destructions of virtual resources, etc. Moreover, they focus
their design on the mandatory usage of software agents which
does not fit in our requirements.
VMDriver [12] is focused on implementing transparent
monitoring in which agents are not required and the
information is gathered by means of the hypervisor. This
feature enables the cloud provider to get basic information
about the cloud consumer resources. This is a very significant
step forward; however, it does not enable the customization
and extension of different monitoring metrics.
Sandoval et al [13] analyse a number of already available
monitoring architectures to determine the best choice in order
to be adapted to the new requirements imposed by cloud
computing infrastructures. As a result, they indicate Nagios as
the best alternative. There are a number of mature monitoring
tools for traditional IT infrastructures already available.
Nagios7, Zennoss
8, Icinga
9, Zabbix
10 and OpenNMS
11 are
good examples of free tools whereas LiveAction12
and Nimsoft
Monitoring Solution13
examples of commercial ones. We have
rapidly discarded all the software which imposes a monitoring
agent like Pandora FMS, Ganglia, and XyMon. Moreover, we
also discarded commercial solutions and solutions which do
not provide the source code. As a result, only the previously
indicated five distributed monitoring tools were identified as
good candidates from a list of more than 40 monitoring
solutions. Zabbix, Zenoss and OpenNMS come with auto-
discovery protocols which may not fit properly in
virtualization scenarios in which machines are continuously
being created and destroyed. So, we decided to select Nagios
as the monitoring tool in this work due to its maturity and
world-wide deployment and testing, due to the incredibly
number of plugins and extensions available and due to the fact
that auto discovery of new machines is customizable.
Aceto et al [14] have recently provided a complete survey
about monitoring architectures for cloud computing
infrastructures. This survey describes a number of commercial
solutions like CloudWatch14
, AzureWatch15
, CloudKick16
, and
7 Nagios tool is available at http://www.nagios.org/ 8 Zennos tool is available at http://www.zenoss.com/ 9 Icinga tool is available at https://www.icinga.org/ 10 Zabbix tool is available at http://www.zabbix.com/ 11 OpenNMS tool is available at http://www.opennms.org/ 12 Live action is available at http://www.actionpacked.com/products/qos-
monitor 13 Nimsoft Monitoring Solution is available at http://www.nimsoft.com
/solutions/nimsoft-monitor.html 14 Amazon EC2 Cloud Watch is accessible at http://aws.amazon.com/es/
cloudwatch/ 15 Azure Watch is accessible at http://www.paraleap.com/azurewatch 16 RackSpace CloudKick is accessible at http://www.rackspace.com/
cloudkick/
CloudStatus17
to name a few. However, these commercial
vendors have not published how they implement internally
their monitoring architecture. In fact, the main intention of this
paper is to describe an open-source prototype which possibly
provides most of the services available in such commercial
productions with the clear differentiating point of the
customization capability by the cloud customer. Aceto et al
[14] also describe several open-source and commercial
downloadable monitoring architectures like OpenNebula
Monitoring Subsystem [1], Nimbus Project18
, CloudStack
ZenPack19
, Hyperic-HQ20
, PCMONS [15], Sensu21
, Nagios22
and Dargos [16].
The OpenNebula monitoring software is very limited
providing only information about the physical machines, and
not about the virtual ones, of the cloud computing
infrastructure. Nimbus, CloudStack ZenPack, Hyperic-HQ,
Nagios and PCMONS [15] overcome this lack providing
monitoring information about virtual machines, however, they
do not support multi-tenancy for the different cloud consumers
and they only provide information for the cloud provider.
Sensu is an innovative monitoring architecture focused on the
inspection of the communication bus used by the cloud
computing stack. Our architecture also uses this approach to
achieve a quick response of the monitoring system against
changes in the cloud computing infrastructure. However, our
architecture also performs a complete set of monitoring tasks
over the rest of hardware resources and services available in
the cloud computing infrastructure and not only in the
communication bus.
Dargos and GMonE [17] are monitoring solutions
specifically designed for cloud computing infrastructures with
multi-tenant support. However, GMonE imposes the
installation of software agents in the VMs whereas Dargos
performs a transparent monitoring of the resources. In the case
of Dargos, it does not provide any service to the cloud
customer to enable her to customize and configure what are
the resources and services to be monitored. Also, the set of
metrics monitored by Dargos are really limited due to its early
development status. Besides, it has not been designed to scale
in large deployments due to the fact that all the monitoring
information is being sent to a central service which is a clear
bottleneck.
Koenig et al [18] provide a radically new approach focused
on the elasticity of the monitoring platform. This idea
complements perfectly with our architecture and can be
integrated. However, Koenig et al do not integrate the
monitoring architecture with the cloud computing stack so that
the architecture is not able to automatically be adapted against
changes in the infrastructure.
17 RackSpace CloudStatus is accessible at https://status.rackspace.com/ 18 Nimbus Project is available at http://www.nimbusproject.org/ 19 CloudStack ZenPack is available at http://wiki.zenoss.org/
ZenPack:CloudStack 20 Hyperic-HQ is available at http://www.hyperic.com/ 21 Sonian Sensu is available at http://www.sonian.com/about/sensu/ 22 Nagios is available at http://www.nagios.org/
1939-1374 (c) 2013 IEEE. Personal use is permitted, but republication/redistribution requires IEEE permission. Seehttp://www.ieee.org/publications_standards/publications/rights/index.html for more information.
This article has been accepted for publication in a future issue of this journal, but has not been fully edited. Content may change prior to final publication. Citation information: DOI10.1109/TSC.2014.2302810, IEEE Transactions on Services Computing
IEEE TRANSACTIONS ON SERVICE COMPUTING 4
Figure 1. MonPaaS Architecture
We have done a complementary analysis of the traditional
monitoring solutions. More than forty different monitoring
tools have been analysed, concluding with Nagios as the best
alternatives to be considered. Nagios itself does not fit well in
cloud computing infrastructures due to the fact that it has been
designed to monitor physical infrastructure rather than highly
changing virtual infrastructures. So, We would like to remark
that none of the above discussed monitoring architectures is
able to fulfil the requirements indicated in the introduction of
this paper. This fact together with the clear lack of monitoring
software which can be easily installed and integrated in a
cloud computing infrastructure to provide monitoring
capabilities to consumers and providers have been the main
reasons which have motivated this research work.
III. MONITORING PLATFORM-AS-A-SERVICE FOR CLOUD
COMPUTING
Figure 1 and Figure 2 show different perspectives of the
different components of the monitoring architecture proposed.
In order to explain each component in detail, this section has
been divided into different subsections.
A. Cloud Computing Architecture
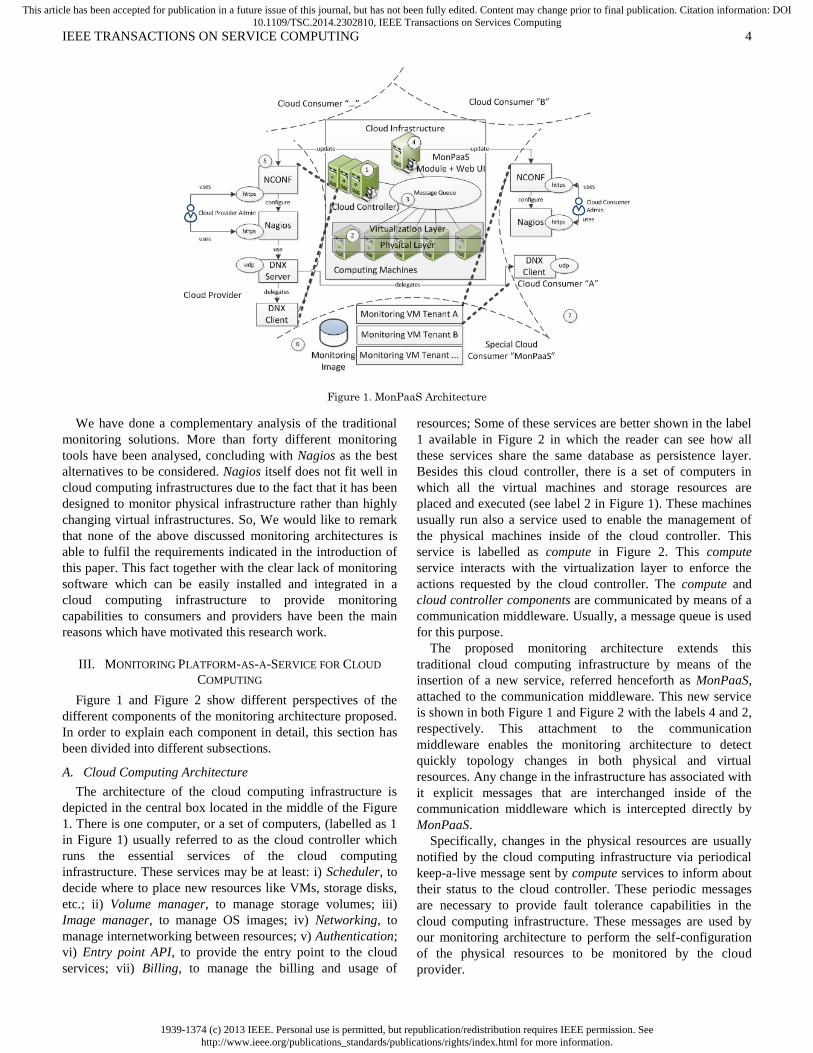
The architecture of the cloud computing infrastructure is
depicted in the central box located in the middle of the Figure
1. There is one computer, or a set of computers, (labelled as 1
in Figure 1) usually referred to as the cloud controller which
runs the essential services of the cloud computing
infrastructure. These services may be at least: i) Scheduler, to
decide where to place new resources like VMs, storage disks,
etc.; ii) Volume manager, to manage storage volumes; iii)
Image manager, to manage OS images; iv) Networking, to
manage internetworking between resources; v) Authentication;
vi) Entry point API, to provide the entry point to the cloud
services; vii) Billing, to manage the billing and usage of
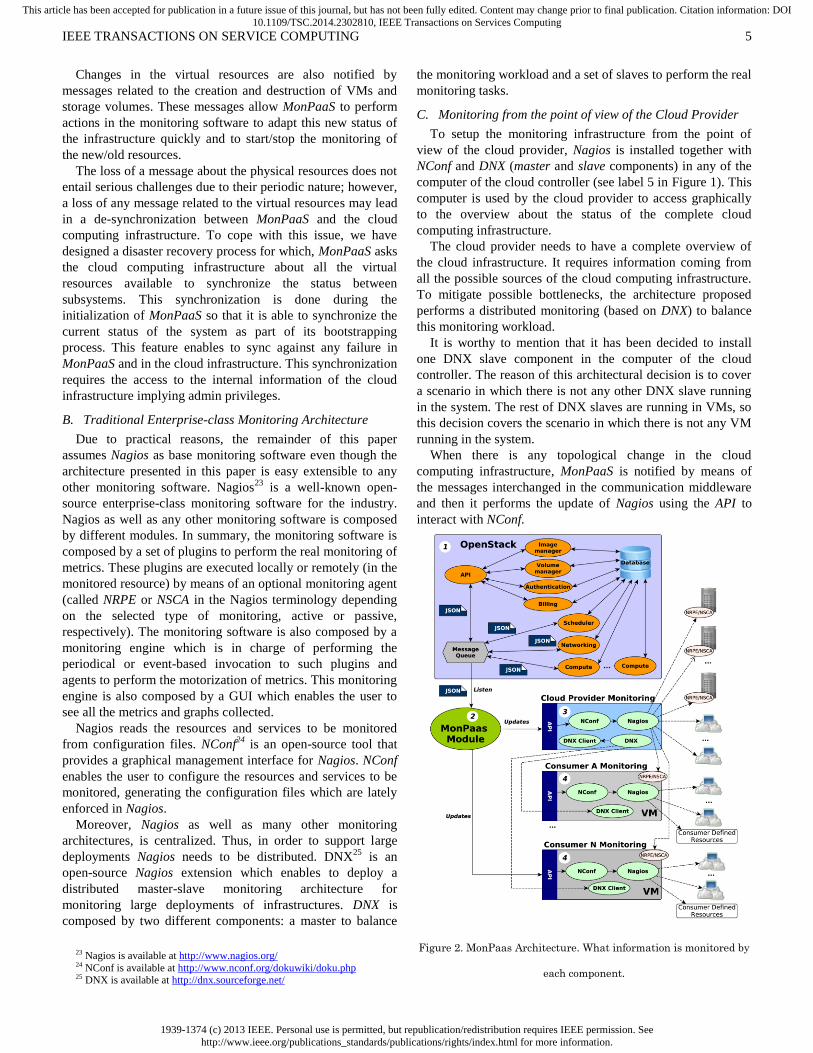
resources; Some of these services are better shown in the label
1 available in Figure 2 in which the reader can see how all
these services share the same database as persistence layer.
Besides this cloud controller, there is a set of computers in
which all the virtual machines and storage resources are
placed and executed (see label 2 in Figure 1). These machines
usually run also a service used to enable the management of
the physical machines inside of the cloud controller. This
service is labelled as compute in Figure 2. This compute
service interacts with the virtualization layer to enforce the
actions requested by the cloud controller. The compute and
cloud controller components are communicated by means of a
communication middleware. Usually, a message queue is used
for this purpose.
The proposed monitoring architecture extends this
traditional cloud computing infrastructure by means of the
insertion of a new service, referred henceforth as MonPaaS,
attached to the communication middleware. This new service
is shown in both Figure 1 and Figure 2 with the labels 4 and 2,
respectively. This attachment to the communication
middleware enables the monitoring architecture to detect
quickly topology changes in both physical and virtual
resources. Any change in the infrastructure has associated with
it explicit messages that are interchanged inside of the
communication middleware which is intercepted directly by
MonPaaS.
Specifically, changes in the physical resources are usually
notified by the cloud computing infrastructure via periodical
keep-a-live message sent by compute services to inform about
their status to the cloud controller. These periodic messages
are necessary to provide fault tolerance capabilities in the
cloud computing infrastructure. These messages are used by
our monitoring architecture to perform the self-configuration
of the physical resources to be monitored by the cloud
provider.
1939-1374 (c) 2013 IEEE. Personal use is permitted, but republication/redistribution requires IEEE permission. Seehttp://www.ieee.org/publications_standards/publications/rights/index.html for more information.
This article has been accepted for publication in a future issue of this journal, but has not been fully edited. Content may change prior to final publication. Citation information: DOI10.1109/TSC.2014.2302810, IEEE Transactions on Services Computing
IEEE TRANSACTIONS ON SERVICE COMPUTING 5
Changes in the virtual resources are also notified by
messages related to the creation and destruction of VMs and
storage volumes. These messages allow MonPaaS to perform
actions in the monitoring software to adapt this new status of
the infrastructure quickly and to start/stop the monitoring of
the new/old resources.
The loss of a message about the physical resources does not
entail serious challenges due to their periodic nature; however,
a loss of any message related to the virtual resources may lead
in a de-synchronization between MonPaaS and the cloud
computing infrastructure. To cope with this issue, we have
designed a disaster recovery process for which, MonPaaS asks
the cloud computing infrastructure about all the virtual
resources available to synchronize the status between
subsystems. This synchronization is done during the
initialization of MonPaaS so that it is able to synchronize the
current status of the system as part of its bootstrapping
process. This feature enables to sync against any failure in
MonPaaS and in the cloud infrastructure. This synchronization
requires the access to the internal information of the cloud
infrastructure implying admin privileges.
B. Traditional Enterprise-class Monitoring Architecture
Due to practical reasons, the remainder of this paper
assumes Nagios as base monitoring software even though the
architecture presented in this paper is easy extensible to any
other monitoring software. Nagios23
is a well-known open-
source enterprise-class monitoring software for the industry.
Nagios as well as any other monitoring software is composed
by different modules. In summary, the monitoring software is
composed by a set of plugins to perform the real monitoring of
metrics. These plugins are executed locally or remotely (in the
monitored resource) by means of an optional monitoring agent
(called NRPE or NSCA in the Nagios terminology depending
on the selected type of monitoring, active or passive,
respectively). The monitoring software is also composed by a
monitoring engine which is in charge of performing the
periodical or event-based invocation to such plugins and
agents to perform the motorization of metrics. This monitoring
engine is also composed by a GUI which enables the user to
see all the metrics and graphs collected.
Nagios reads the resources and services to be monitored
from configuration files. NConf24
is an open-source tool that
provides a graphical management interface for Nagios. NConf
enables the user to configure the resources and services to be
monitored, generating the configuration files which are lately
enforced in Nagios.
Moreover, Nagios as well as many other monitoring
architectures, is centralized. Thus, in order to support large
deployments Nagios needs to be distributed. DNX25
is an
open-source Nagios extension which enables to deploy a
distributed master-slave monitoring architecture for
monitoring large deployments of infrastructures. DNX is
composed by two different components: a master to balance
23 Nagios is available at http://www.nagios.org/ 24 NConf is available at http://www.nconf.org/dokuwiki/doku.php 25 DNX is available at http://dnx.sourceforge.net/
the monitoring workload and a set of slaves to perform the real
monitoring tasks.
C. Monitoring from the point of view of the Cloud Provider
To setup the monitoring infrastructure from the point of
view of the cloud provider, Nagios is installed together with
NConf and DNX (master and slave components) in any of the
computer of the cloud controller (see label 5 in Figure 1). This
computer is used by the cloud provider to access graphically
to the overview about the status of the complete cloud
computing infrastructure.
The cloud provider needs to have a complete overview of
the cloud infrastructure. It requires information coming from
all the possible sources of the cloud computing infrastructure.
To mitigate possible bottlenecks, the architecture proposed
performs a distributed monitoring (based on DNX) to balance
this monitoring workload.
It is worthy to mention that it has been decided to install
one DNX slave component in the computer of the cloud
controller. The reason of this architectural decision is to cover
a scenario in which there is not any other DNX slave running
in the system. The rest of DNX slaves are running in VMs, so
this decision covers the scenario in which there is not any VM
running in the system.
When there is any topological change in the cloud
computing infrastructure, MonPaaS is notified by means of
the messages interchanged in the communication middleware
and then it performs the update of Nagios using the API to
interact with NConf.
Figure 2. MonPaas Architecture. What information is monitored by
each component.
1939-1374 (c) 2013 IEEE. Personal use is permitted, but republication/redistribution requires IEEE permission. Seehttp://www.ieee.org/publications_standards/publications/rights/index.html for more information.
This article has been accepted for publication in a future issue of this journal, but has not been fully edited. Content may change prior to final publication. Citation information: DOI10.1109/TSC.2014.2302810, IEEE Transactions on Services Computing
IEEE TRANSACTIONS ON SERVICE COMPUTING 6
The type of information monitored by the cloud provider
can be seen in the arrows going out of the label 3 depicted in
Figure 2. In essence, it is the following one:
Detailed monitoring, using agent-based monitoring, of
the physical machines that compose the cloud computing
infrastructure.
Transparent monitoring, via information gathered
directly from the hypervisor and via agent-less
monitoring of the cloud consumers’ VMs like port
connections, ICMP requests, etc.
Detailed monitoring, using agent-based monitoring, of
the VMs available in the cloud infrastructure used
(explained in detail in section D)
The cloud provider is logged in both Nagios and NConf to
gain access to the monitoring information. Both systems have
been carefully designed taking seriously security into account.
This security includes security in the communication between
the monitoring agents and Nagios and also in the management
of the monitoring infrastructure. The access to the graphical
interface is restricted by https and user/password. This
cryptography information is configured during the installation
of the monitoring infrastructure.
D. Monitoring from the point of view of the Cloud Consumer
As an architectural decision, the monitoring architecture
creates and makes use of VMs to provide the monitoring
services to the cloud consumers. Concretely, one VM is
created per each cloud consumer to provide monitoring
services to such tenant. This approach implements the multi-
tenancy support of the monitoring architecture by means of a
multi-instantiation of monitoring architectures, one per each
consumer. This architectural design has been already taken by
other cloud computing stacks like HP Cells [19] and also by
Xen26
in which a management VM is created by each
consumer to provide her additional services. This architectural
choice has advantages and disadvantages.
As main disadvantage, this decision entails a significant use
of the hardware resources available to be offered to the cloud
customer. Notice that some of such research may now be used
for monitoring purposes rather than being rented to the
customers. As main advantage, the usage of VMs for internal
purposes enables the design of a cloud computing
infrastructure which is able to implement the services
provided therein in a real distributed approach. Thus, this
architecture is highly scalable due to the distributed nature of
the approach whereas it is also more extensible in terms of
services provided. Notice that such VMs are only required if
they are not already available in the cloud computing stack. In
fact, such VMs can be used not only to provide monitoring
services but also to provide to the cloud customer a myriad of
services inside of the same VM with a minimum extra
overhead. In fact, in this architecture, these VMs are used not
only for providing the monitoring services to the cloud
consumer but also as computing node used for performing the
workload balancing of the monitoring services of the cloud
26 Xen is available at http://www.xenproject.org/
provider (previously described in section C). This duality
confers a high scalability to the proposed architecture.
When a cloud consumer rents the first VM, this extra
internal VM is automatically created by MonPaaS, if not
already done. This VM offers a ready-to-use monitoring
platform to the consumer. Analogously, when the last VM of a
cloud consumer is deleted, MonPaaS automatically deletes the
internal VM in order to free hardware resources. This new
internal VM is henceforth referred as Monitoring VM (MVM).
For security and isolation purposes, the monitoring
architecture uses a special cloud consumer called “MonPaaS”.
This cloud consumer is the owner of all the VMs used for
monitoring purposes. See label 6 in Figure 1 where MonPaaS
cloud consumer can be seen as well as all the MVMs
available. This decision of creating a new cloud consumer for
owning all the MVMs is based on the following arguments:
The owner of a VM is the responsible of the management
of the VM life cycle. So, if we place the MVM in the
cloud consumer management space, she could potentially
destroy either intentionally or by accident the MVM with
the associated monitoring information. To deal with this
complex use case, it is required a special recovery
process against destructions of MVM which may be
complex to be implemented.
For the case in which MVMs are owned by each
consumer, VMs need to be directly accessed by
MonPaaS, which may be a source of security threats due
to the fact that any of these VMs could be an attacker
trying to gain access to MonPaaS.
MonPaaS cloud customer runs in non-privilege mode as
any other cloud customer minimizing possible security
threats. Note that otherwise, MonPaaS needs to
impersonate all the cloud consumers in order to be able
to create a VM on their behalf which the risks associated
to this kind of privileged action.
MonPaaS cloud consumer is also the owner of the OS
image used to run the MVMs. This MVM image is preloaded
in the cloud computing infrastructure as part of the installation
process of the monitoring architecture. This MVM image is a
clean OS installation with Apache, NConf, Nagios and DNX
slave configured and automatically run as part of the VM
bootstrapping process. These services enable the cloud
consumer to access by means of the web interface to her own
monitoring platform. Label 7 in Figure 1 shows these services
available for the cloud consumers by means of the public IP
associated to the MVM which runs in the special cloud
consumer MonPaaS. The MVM image has also installed the
monitoring agent (NRPE/NSCA) used by the cloud provider
monitoring service to perform a detailed monitoring of this
VM.
As part of the bootstrapping process of a new MVM
instance, MonPaaS injects inside of such MVM a randomly
generated password used to configure the access to both
NConf and Nagios. This password is generated at runtime and
is never stored.
1939-1374 (c) 2013 IEEE. Personal use is permitted, but republication/redistribution requires IEEE permission. Seehttp://www.ieee.org/publications_standards/publications/rights/index.html for more information.
This article has been accepted for publication in a future issue of this journal, but has not been fully edited. Content may change prior to final publication. Citation information: DOI10.1109/TSC.2014.2302810, IEEE Transactions on Services Computing
IEEE TRANSACTIONS ON SERVICE COMPUTING 7
Figure 3. Hierarchy of monitoring groups proposed to both cloud provider and cloud consumer
It hampers the cloud provider any possible attempt to access
to the monitoring information being gathered by the cloud
consumers. MonPaaS also injects the IP addresses of both
DNX master and the computer in which the cloud provider
monitoring services are running. The IP addresses are
required due to the existence of an extra security layer: the
MVM only accept tasks coming from a DNX master allocated
in such IP address. Analogously, this MVM only gather
metrics requests done by a monitoring service (Nagios)
running in such IP address. This information is injected using
SSH. The SSH keys used to access to such MVMs are
generated automatically during the installation process of
MonPaaS. These SSH keys are not necessarily known by the
cloud provider.
Other component of the monitoring architecture proposed is
MonPaaS Web UI. This is a web interface installed in the
cloud controller. This web interface is an entry point for the
cloud consumers in which they can retrieve the URLs, users
and passwords necessary to access to their respective Nagios
and NConfs. This web interface is integrated with the
authentication mechanism offered by the cloud computing
infrastructure in order to provide a secure access to such
sensible information. Then, if the authentication against the
cloud computing infrastructure is successful, the Web UI
established a secure communication with MonPaaS via the
message queue to retrieve the cryptographic information to be
shown to the cloud consumer. This decision about the
cryptographic information enables us to achieve a privacy-
aware monitoring architecture in which provider and
consumers have limited access to information about the others.
The information monitored by the MVM can be graphically
seen in label 4 shown in Figure 2 and it is:
Transparent monitoring of the VMs owned by this cloud
consumer
Any other used-defined extra monitoring service and
resource (explained in detailed in section 3.5)
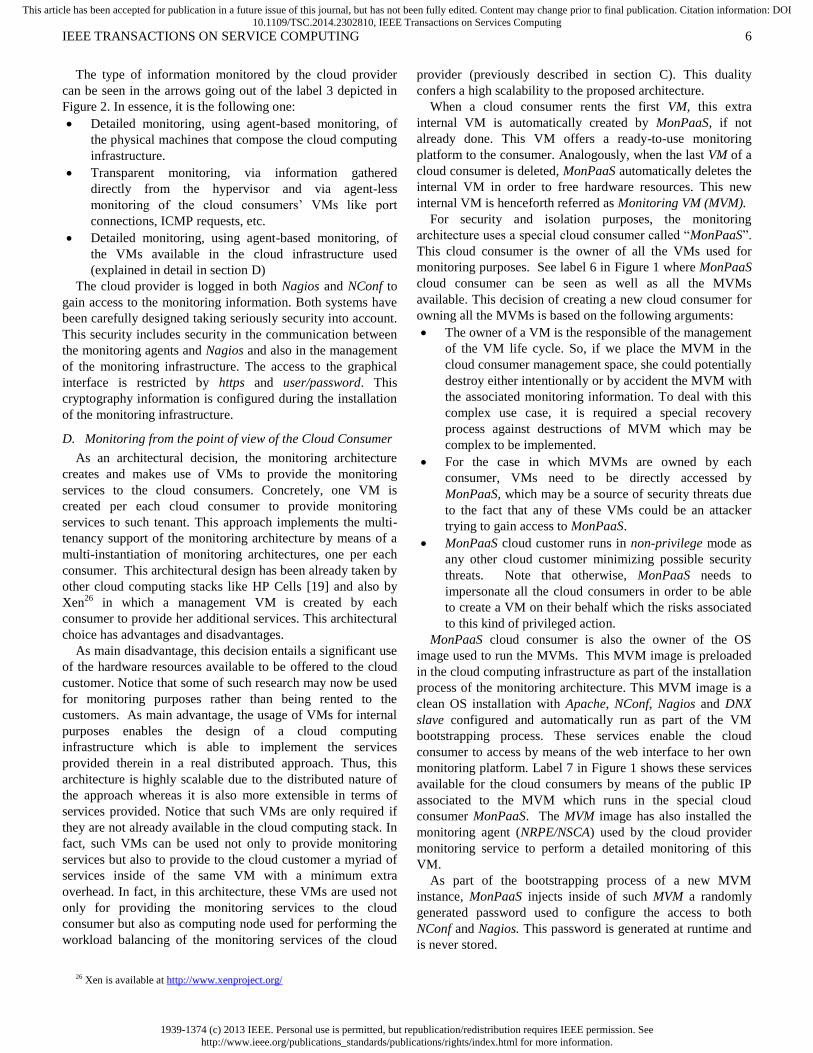
E. Logical grouping of services to be monitored
It is assumed that the monitoring service supports the
definition of hierarchy of groups on which are associated
monitoring services. The groups available in the hierarchy
inherit the monitoring services associated to the parent nodes
of the tree. The leaves of the tree correspond to the different
resources being monitored by the software. Figure 3 shows
two different hierarchies of groups. The left-side corresponds
to the tree defined in cloud provider monitoring service
whereas the right-side corresponds to the tree defined in the
cloud consumer monitoring service.
From the cloud provider perspective, all the resources are
monitored using an agent-less approach, i.e. transparent
monitoring. This approach monitors essential services like
Ping and SSH (see group “Total” in the left-side of Figure 3).
There are two different subgroups dividing the hardware
resources for the internal management of the cloud
infrastructure, i.e. “Management” group from the hardware
resources to be used by the cloud consumers, i.e. “User Plane”
group. The “Management” group can be associated to agent-
based monitoring whereas the “User Plane” must continue
being monitored using a transparent approach.
The “Management” group is subdivided into physical and
virtual resources in order to enable the differentiation of
services to be monitored. The physical resources are all the
physical hardware available in the cloud computing
infrastructure whereas the virtual resources are the VMs
related to the internal management like the MVMs. The “User
Plane” group is subdivided into as many subgroups as cloud
consumers are available in the infrastructure. It enables the
cloud provider to logically group VMs according to their
ownership. This hierarchical approach confers the cloud
provider total freedom to customize the monitoring of any of
the group available in the hierarchy establishing and
configuring the metrics to be monitored.
From the cloud consumer perspective, she can see a web
interface in which there is a pre-defined hierarchy of groups.
All the resources monitored by the cloud consumer are being
monitored using an agent-less approach by means of the group
“Total” in the right-side of Figure 3. There is also a well-
known group called “Infrastructure” where VMs are
automatically created and removed. This web interface is used
by the cloud consumer to define new services and metrics to
be monitored.
Total
Management User Plane
PHY Management
VMManagement Tenant A Tenant B Tenant ...
PHY A
PHY B
PHY C
VM A
VM B
VM C
VM A
VM B
VM C
VM A
VM B
VM C
MVM Tenant A
MVM Tenant B
MVM Tenant ...
PHY ... VM ...VM ...VM ...
Total
Infrastructure
VM A
VM B
VM C
VM ...
Agent MonitoringMetrics
Transparent Monitoring
Metrics (SSH, Ping) Transparent Monitoring
Metrics (SSH, Ping)
User-defined Group
Agent MonitoringMetrics
Agent MonitoringMetrics
Cloud Consumer Monitoring GroupsCloud Provider Monitoring Groups
1939-1374 (c) 2013 IEEE. Personal use is permitted, but republication/redistribution requires IEEE permission. Seehttp://www.ieee.org/publications_standards/publications/rights/index.html for more information.
This article has been accepted for publication in a future issue of this journal, but has not been fully edited. Content may change prior to final publication. Citation information: DOI10.1109/TSC.2014.2302810, IEEE Transactions on Services Computing
IEEE TRANSACTIONS ON SERVICE COMPUTING 8
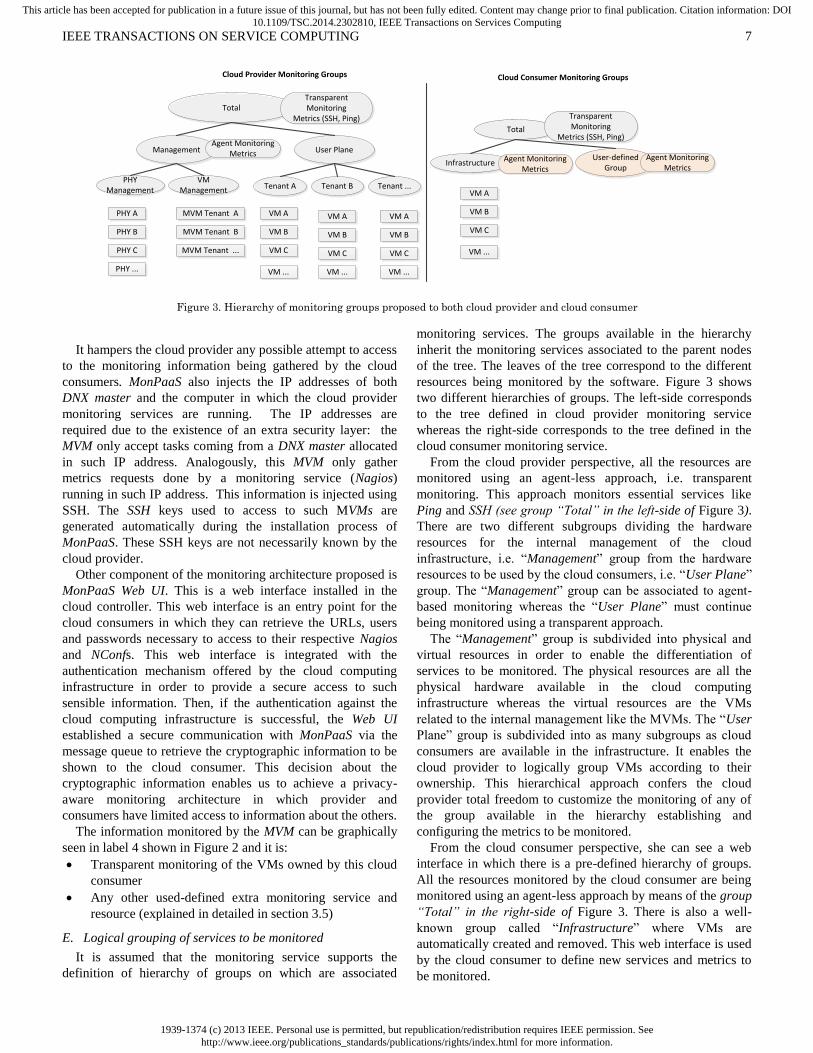
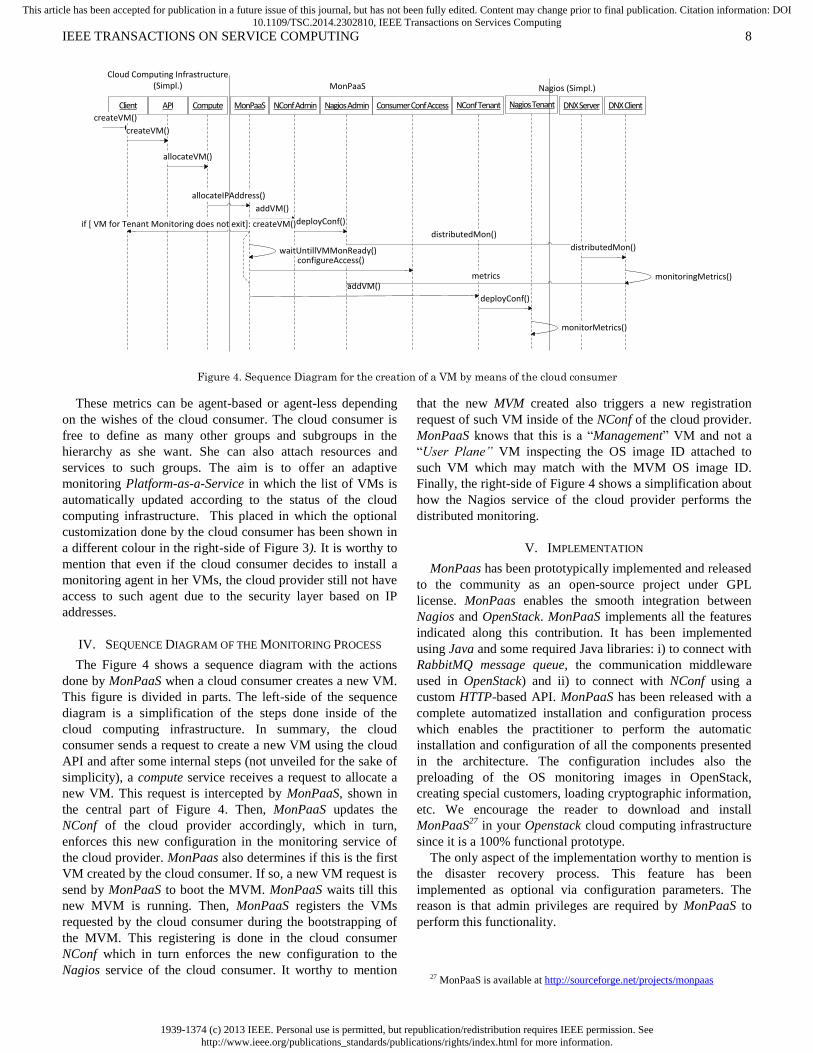
Figure 4. Sequence Diagram for the creation of a VM by means of the cloud consumer
These metrics can be agent-based or agent-less depending
on the wishes of the cloud consumer. The cloud consumer is
free to define as many other groups and subgroups in the
hierarchy as she want. She can also attach resources and
services to such groups. The aim is to offer an adaptive
monitoring Platform-as-a-Service in which the list of VMs is
automatically updated according to the status of the cloud
computing infrastructure. This placed in which the optional
customization done by the cloud consumer has been shown in
a different colour in the right-side of Figure 3). It is worthy to
mention that even if the cloud consumer decides to install a
monitoring agent in her VMs, the cloud provider still not have
access to such agent due to the security layer based on IP
addresses.
IV. SEQUENCE DIAGRAM OF THE MONITORING PROCESS
The Figure 4 shows a sequence diagram with the actions
done by MonPaaS when a cloud consumer creates a new VM.
This figure is divided in parts. The left-side of the sequence
diagram is a simplification of the steps done inside of the
cloud computing infrastructure. In summary, the cloud
consumer sends a request to create a new VM using the cloud
API and after some internal steps (not unveiled for the sake of
simplicity), a compute service receives a request to allocate a
new VM. This request is intercepted by MonPaaS, shown in
the central part of Figure 4. Then, MonPaaS updates the
NConf of the cloud provider accordingly, which in turn,
enforces this new configuration in the monitoring service of
the cloud provider. MonPaas also determines if this is the first
VM created by the cloud consumer. If so, a new VM request is
send by MonPaaS to boot the MVM. MonPaaS waits till this
new MVM is running. Then, MonPaaS registers the VMs
requested by the cloud consumer during the bootstrapping of
the MVM. This registering is done in the cloud consumer
NConf which in turn enforces the new configuration to the
Nagios service of the cloud consumer. It worthy to mention
that the new MVM created also triggers a new registration
request of such VM inside of the NConf of the cloud provider.
MonPaaS knows that this is a “Management” VM and not a
“User Plane” VM inspecting the OS image ID attached to
such VM which may match with the MVM OS image ID.
Finally, the right-side of Figure 4 shows a simplification about
how the Nagios service of the cloud provider performs the
distributed monitoring.
V. IMPLEMENTATION
MonPaas has been prototypically implemented and released
to the community as an open-source project under GPL
license. MonPaas enables the smooth integration between
Nagios and OpenStack. MonPaaS implements all the features
indicated along this contribution. It has been implemented
using Java and some required Java libraries: i) to connect with
RabbitMQ message queue, the communication middleware
used in OpenStack) and ii) to connect with NConf using a
custom HTTP-based API. MonPaaS has been released with a
complete automatized installation and configuration process
which enables the practitioner to perform the automatic
installation and configuration of all the components presented
in the architecture. The configuration includes also the
preloading of the OS monitoring images in OpenStack,
creating special customers, loading cryptographic information,
etc. We encourage the reader to download and install
MonPaaS27
in your Openstack cloud computing infrastructure
since it is a 100% functional prototype.
The only aspect of the implementation worthy to mention is
the disaster recovery process. This feature has been
implemented as optional via configuration parameters. The
reason is that admin privileges are required by MonPaaS to
perform this functionality.
27 MonPaaS is available at http://sourceforge.net/projects/monpaas
Client
createVM()
API Compute
createVM()
allocateVM()
MonPaaS
allocateIPAddress()
NConf Admin Nagios Admin NConf Tenant Nagios Tenant
addVM()
deployConf()if [ VM for Tenant Monitoring does not exit]: createVM()
waitUntillVMMonReady()
addVM()
Consumer Conf Access
configureAccess()
deployConf()
Cloud Computing Infrastructure (Simpl.) MonPaaS
DNX Server
distributedMon()
DNX Client
distributedMon()
monitorMetrics()
monitoringMetrics()metrics
Nagios (Simpl.)
1939-1374 (c) 2013 IEEE. Personal use is permitted, but republication/redistribution requires IEEE permission. Seehttp://www.ieee.org/publications_standards/publications/rights/index.html for more information.
This article has been accepted for publication in a future issue of this journal, but has not been fully edited. Content may change prior to final publication. Citation information: DOI10.1109/TSC.2014.2302810, IEEE Transactions on Services Computing
IEEE TRANSACTIONS ON SERVICE COMPUTING 9
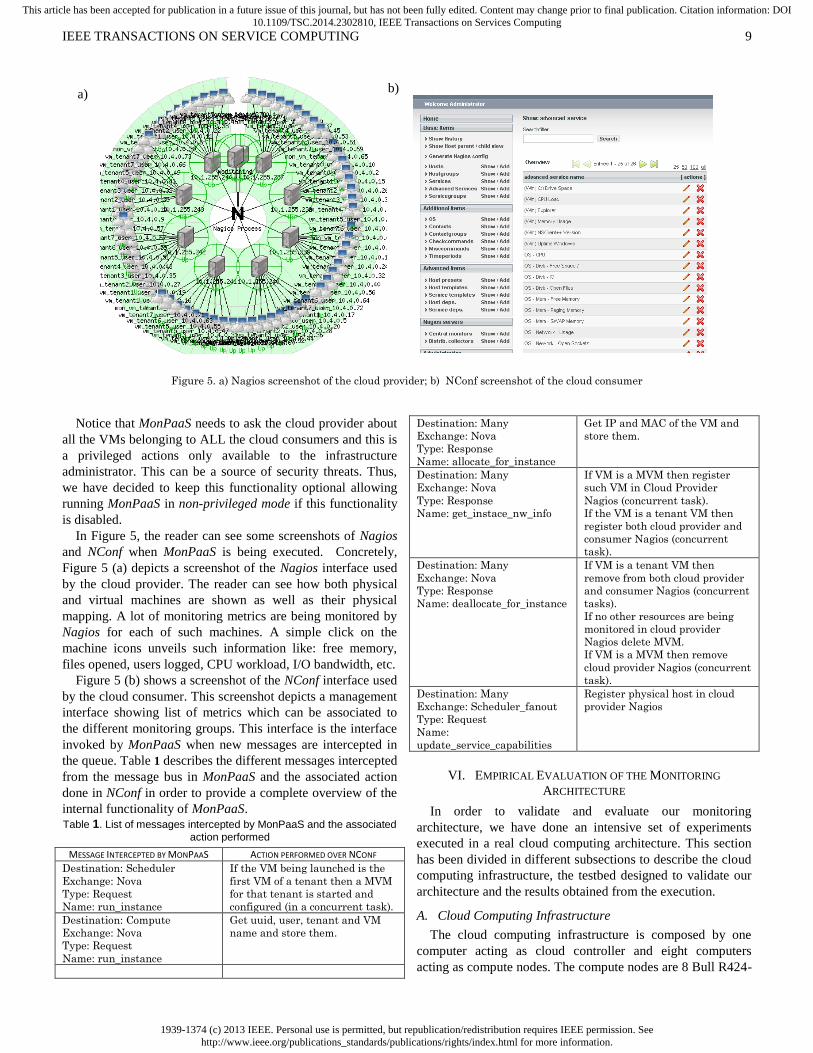
Figure 5. a) Nagios screenshot of the cloud provider; b) NConf screenshot of the cloud consumer
Notice that MonPaaS needs to ask the cloud provider about
all the VMs belonging to ALL the cloud consumers and this is
a privileged actions only available to the infrastructure
administrator. This can be a source of security threats. Thus,
we have decided to keep this functionality optional allowing
running MonPaaS in non-privileged mode if this functionality
is disabled.
In Figure 5, the reader can see some screenshots of Nagios
and NConf when MonPaaS is being executed. Concretely,
Figure 5 (a) depicts a screenshot of the Nagios interface used
by the cloud provider. The reader can see how both physical
and virtual machines are shown as well as their physical
mapping. A lot of monitoring metrics are being monitored by
Nagios for each of such machines. A simple click on the
machine icons unveils such information like: free memory,
files opened, users logged, CPU workload, I/O bandwidth, etc.
Figure 5 (b) shows a screenshot of the NConf interface used
by the cloud consumer. This screenshot depicts a management
interface showing list of metrics which can be associated to
the different monitoring groups. This interface is the interface
invoked by MonPaaS when new messages are intercepted in
the queue. Table 1 describes the different messages intercepted
from the message bus in MonPaaS and the associated action
done in NConf in order to provide a complete overview of the
internal functionality of MonPaaS. Table 1. List of messages intercepted by MonPaaS and the associated
action performed
MESSAGE INTERCEPTED BY MONPAAS ACTION PERFORMED OVER NCONF
Destination: Scheduler
Exchange: Nova
Type: Request
Name: run_instance
If the VM being launched is the
first VM of a tenant then a MVM
for that tenant is started and
configured (in a concurrent task).
Destination: Compute
Exchange: Nova
Type: Request
Name: run_instance
Get uuid, user, tenant and VM
name and store them.
Destination: Many
Exchange: Nova
Type: Response
Name: allocate_for_instance
Get IP and MAC of the VM and
store them.
Destination: Many
Exchange: Nova
Type: Response
Name: get_instace_nw_info
If VM is a MVM then register
such VM in Cloud Provider
Nagios (concurrent task).
If the VM is a tenant VM then
register both cloud provider and
consumer Nagios (concurrent
task).
Destination: Many
Exchange: Nova
Type: Response
Name: deallocate_for_instance
If VM is a tenant VM then
remove from both cloud provider
and consumer Nagios (concurrent
tasks).
If no other resources are being
monitored in cloud provider
Nagios delete MVM.
If VM is a MVM then remove
cloud provider Nagios (concurrent
task).
Destination: Many
Exchange: Scheduler_fanout
Type: Request
Name:
update_service_capabilities
Register physical host in cloud
provider Nagios
VI. EMPIRICAL EVALUATION OF THE MONITORING
ARCHITECTURE
In order to validate and evaluate our monitoring
architecture, we have done an intensive set of experiments
executed in a real cloud computing architecture. This section
has been divided in different subsections to describe the cloud
computing infrastructure, the testbed designed to validate our
architecture and the results obtained from the execution.
A. Cloud Computing Infrastructure
The cloud computing infrastructure is composed by one
computer acting as cloud controller and eight computers
acting as compute nodes. The compute nodes are 8 Bull R424-
a) b)
1939-1374 (c) 2013 IEEE. Personal use is permitted, but republication/redistribution requires IEEE permission. Seehttp://www.ieee.org/publications_standards/publications/rights/index.html for more information.
This article has been accepted for publication in a future issue of this journal, but has not been fully edited. Content may change prior to final publication. Citation information: DOI10.1109/TSC.2014.2302810, IEEE Transactions on Services Computing
IEEE TRANSACTIONS ON SERVICE COMPUTING 10
E3 blades, each one equipped by 2 processors Xeon ES-2650
2Ghz 20Mb/cache (8 cores each processor), 1TB SATA III, 32
GB @ 1600Mhz. The cloud controller is a SunFire X2100
node equipped by 1 Dual Core AMD Opteron 1’8Ghz
1Mb/cache (2 cores), 2x256 SATA II, 8GM @1333Mhz. All
the nodes have a clean installation of CentOS 6.3 as base OS.
This hardware is wired with two gigabit networks over which
an OpenStack Folsom 2012 2.4-stable single-host installation
is configured. Only nova -components are used in this
experiment. One gigabit network is used to communicate
physical machines whereas the other gigabit network is used
to communicate exclusively virtual machines. The cloud
controller has an extra gigabit interface to connect to Internet.
We have installed the prototype inside of the cloud controller.
The installation automatically installs Nagios 3.4.4, NConf
1.3.0 and DNX 0.20.1 master and slave in the cloud controller.
Moreover, the installation also creates the new MonPaaS
cloud consumer and uploads the MVM image to OpenStack.
B. Description of the Testbed
To evaluate the performance and scalability of the
monitoring architecture, we have setup a test bed in which 112
VMs are requested in each experiment. The image of the VMs
is a clean installation of a Linux Ubuntu 12.10 distribution.
Each VM creation request is arriving to the cloud computing
infrastructure with a given interval referred to as I and
measured in seconds. This interval is used to determine the
level of stress of the cloud computing infrastructure. The
interval we have been empirically setup in a range between 27
and 24 for our infrastructure because numbers lower than 24
produce errors in the creation of at least one the VMs, among
all the requests received.
In each experiment the physical machines, the user VMs,
and the Monitoring VMs are dynamically registered in the
cloud provider Nagios. The number of metrics for the physical
machines and Monitoring VMs has been fixed to 16: cpu,
diskio, freemem, freespace, network usage, open files, open
sockets, paging mem, ping, processes, ssh service, uptime,
swap, logged users, workload, zombie mem. The metrics for
the user VMs are: ssh service and ping. Note that the system is
performing a transparent (agent-less) monitoring of these
machines from the point of view of the provider. The user
VMs are also dynamically registered in the cloud consumer
Nagios (MVM). By default there are two metrics being
monitored by the MVM: ssh service and ping. Notice that we
do not want to measure the overhead associated to the
increasing of the number of services monitored in each VM
which has been already published in a wide number of
publications like [16] and do not impose any difference
between cloud and non-cloud environments.
The same 112 VMs can be requested by a different number
of cloud consumers (henceforth referred indistinctly also as
tenant). Thus, we can run scenarios in which 1 tenant requests
112 VMS, 2 tenants request 56 VMs each, 4 tenants request 28
VMs each, 8 tenants request 14 VMs each and 16 tenants
request 7 VMs. This ranging in the number of tenants is
important due to the fact that it affects the total number of
VMs created inside of the infrastructure. From the previous
numbers, the total number of real VMs creates are
respectively: 113 VMs (112 VMs + 1 MVM), 114VMs (56*2
VMs + 2 MVMs), 116 VMs (28*4 VMs + 4 MVMs), 120
VMs (14*8 VMs + 8 MVMs) and 128 VMs (7*16 + 16
MVM). Notice that 128 VMs is the maximum number of VMs
enabled in our infrastructure due to the fact that we have 128
cores available. In fact, we would like to remark that under
such circumstances; the cloud infrastructure is completely
overloaded having 16 VMs on each of the physical nodes.
The order of request arrival is also important to analyse the
behaviour of the monitoring architecture. We have defined
two different scenarios for this testbed. The first scenario
referred henceforth indistinctly as Monitoring exp. 1 or simply
ALLVMS is a scenario in which for each cloud consumer, all
the VMs creation requests of such tenants are sent before to
process the next cloud consumer. The second scenario referred
as Monitoring exp. 2 or simply ONEVM is a scenario in which
the first VM creation request for all the tenants is sent before
the processing of the next VM for all the tenants. These two
scenarios produce different stressing workloads due to the fact
that the MVM is created during the processing of the first VM
creation request. Thus, ALLVMs represents a scenario in
which the level of stress is equally distributed along the time
of the experiments while ONEVM represents a scenario where
the system is highly stressed at the beginning of the
experiment and then it remains linear till the end of the
experiment. Formally, Let Φ(r) the total number of virtual
machines (customer VMs and MVMs) created up to request r.
Let T denote the number of tenants and N the total number of
customers VMs creation requests. Thus,
( )
{
( ) ( ) (
)
( ) ( ) (
)
and,
( ) {
( )
( )
that can be simplified as
( ) {
( )
1939-1374 (c) 2013 IEEE. Personal use is permitted, but republication/redistribution requires IEEE permission. Seehttp://www.ieee.org/publications_standards/publications/rights/index.html for more information.
This article has been accepted for publication in a future issue of this journal, but has not been fully edited. Content may change prior to final publication. Citation information: DOI10.1109/TSC.2014.2302810, IEEE Transactions on Services Computing
IEEE TRANSACTIONS ON SERVICE COMPUTING 11
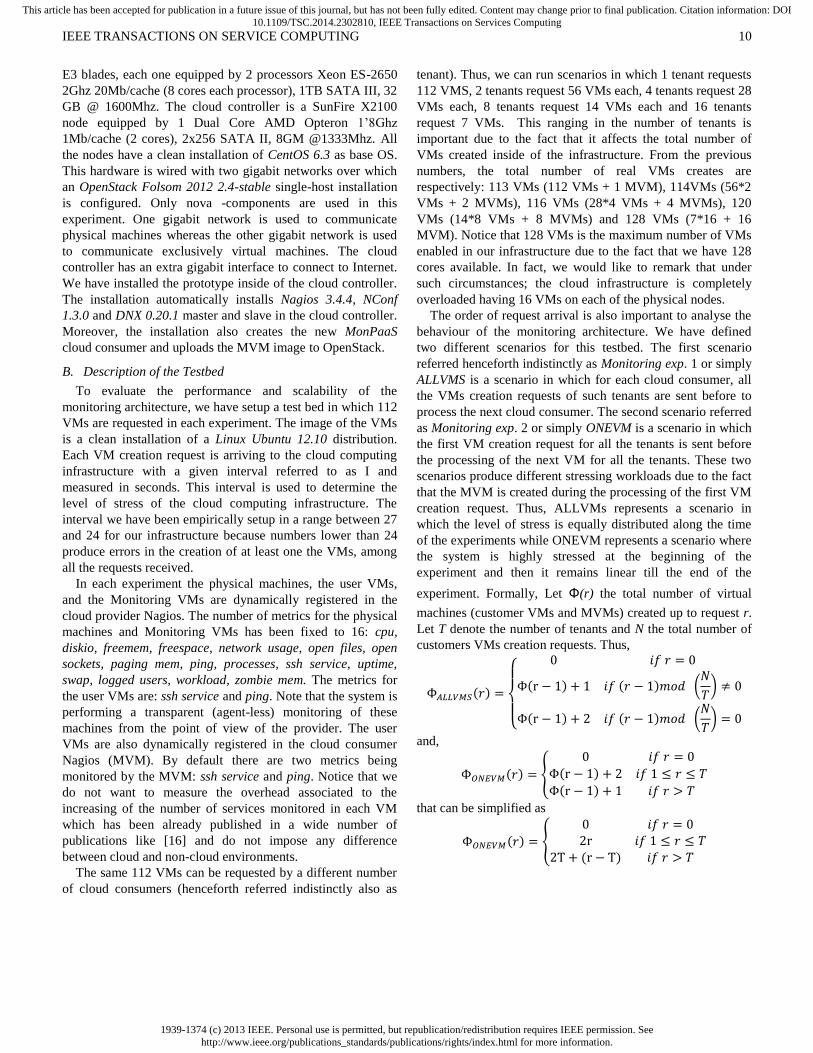
Figure 6. Comparison of overhead times for different orders of request arrivals. (a) ALLVMS order of request arrivals. (b) ONEVM order of
request arrivals.
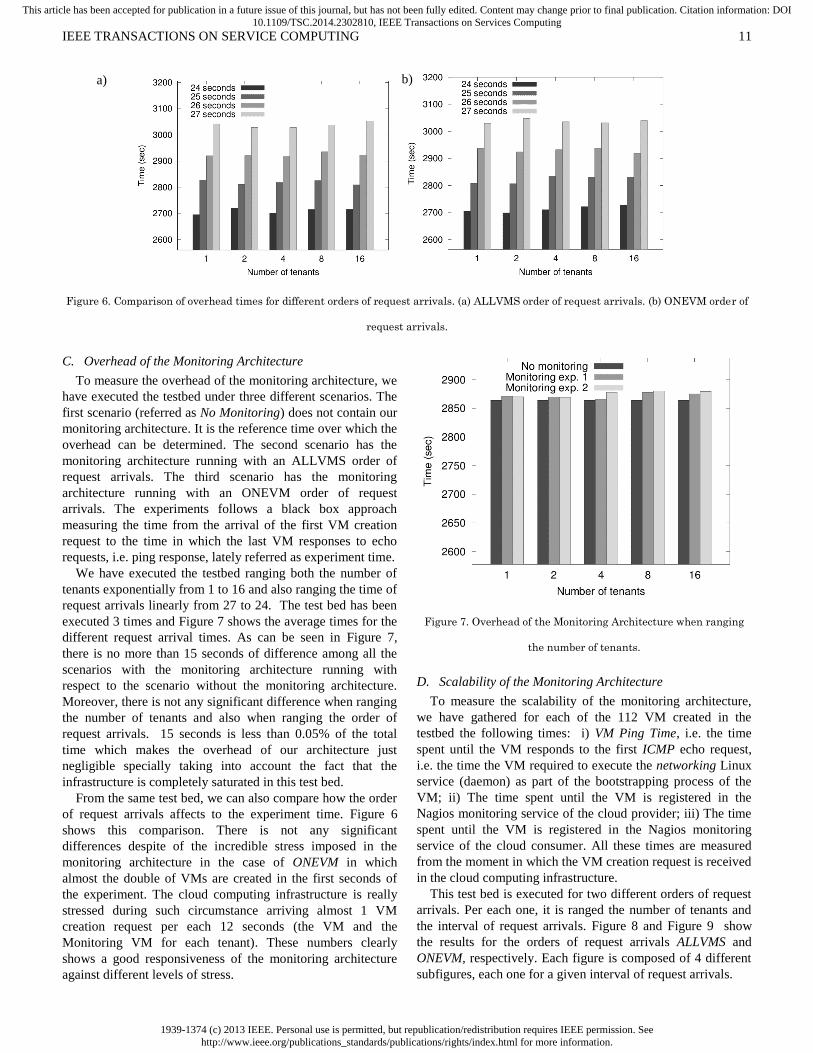
C. Overhead of the Monitoring Architecture
To measure the overhead of the monitoring architecture, we
have executed the testbed under three different scenarios. The
first scenario (referred as No Monitoring) does not contain our
monitoring architecture. It is the reference time over which the
overhead can be determined. The second scenario has the
monitoring architecture running with an ALLVMS order of
request arrivals. The third scenario has the monitoring
architecture running with an ONEVM order of request
arrivals. The experiments follows a black box approach
measuring the time from the arrival of the first VM creation
request to the time in which the last VM responses to echo
requests, i.e. ping response, lately referred as experiment time.
We have executed the testbed ranging both the number of
tenants exponentially from 1 to 16 and also ranging the time of
request arrivals linearly from 27 to 24. The test bed has been
executed 3 times and Figure 7 shows the average times for the
different request arrival times. As can be seen in Figure 7,
there is no more than 15 seconds of difference among all the
scenarios with the monitoring architecture running with
respect to the scenario without the monitoring architecture.
Moreover, there is not any significant difference when ranging
the number of tenants and also when ranging the order of
request arrivals. 15 seconds is less than 0.05% of the total
time which makes the overhead of our architecture just
negligible specially taking into account the fact that the
infrastructure is completely saturated in this test bed.
From the same test bed, we can also compare how the order
of request arrivals affects to the experiment time. Figure 6
shows this comparison. There is not any significant
differences despite of the incredible stress imposed in the
monitoring architecture in the case of ONEVM in which
almost the double of VMs are created in the first seconds of
the experiment. The cloud computing infrastructure is really
stressed during such circumstance arriving almost 1 VM
creation request per each 12 seconds (the VM and the
Monitoring VM for each tenant). These numbers clearly
shows a good responsiveness of the monitoring architecture
against different levels of stress.
Figure 7. Overhead of the Monitoring Architecture when ranging
the number of tenants.
D. Scalability of the Monitoring Architecture
To measure the scalability of the monitoring architecture,
we have gathered for each of the 112 VM created in the
testbed the following times: i) VM Ping Time, i.e. the time
spent until the VM responds to the first ICMP echo request,
i.e. the time the VM required to execute the networking Linux
service (daemon) as part of the bootstrapping process of the
VM; ii) The time spent until the VM is registered in the
Nagios monitoring service of the cloud provider; iii) The time
spent until the VM is registered in the Nagios monitoring
service of the cloud consumer. All these times are measured
from the moment in which the VM creation request is received
in the cloud computing infrastructure.
This test bed is executed for two different orders of request
arrivals. Per each one, it is ranged the number of tenants and
the interval of request arrivals. Figure 8 and Figure 9 show
the results for the orders of request arrivals ALLVMS and
ONEVM, respectively. Each figure is composed of 4 different
subfigures, each one for a given interval of request arrivals.
a) b)
1939-1374 (c) 2013 IEEE. Personal use is permitted, but republication/redistribution requires IEEE permission. Seehttp://www.ieee.org/publications_standards/publications/rights/index.html for more information.
This article has been accepted for publication in a future issue of this journal, but has not been fully edited. Content may change prior to final publication. Citation information: DOI10.1109/TSC.2014.2302810, IEEE Transactions on Services Computing
IEEE TRANSACTIONS ON SERVICE COMPUTING 12
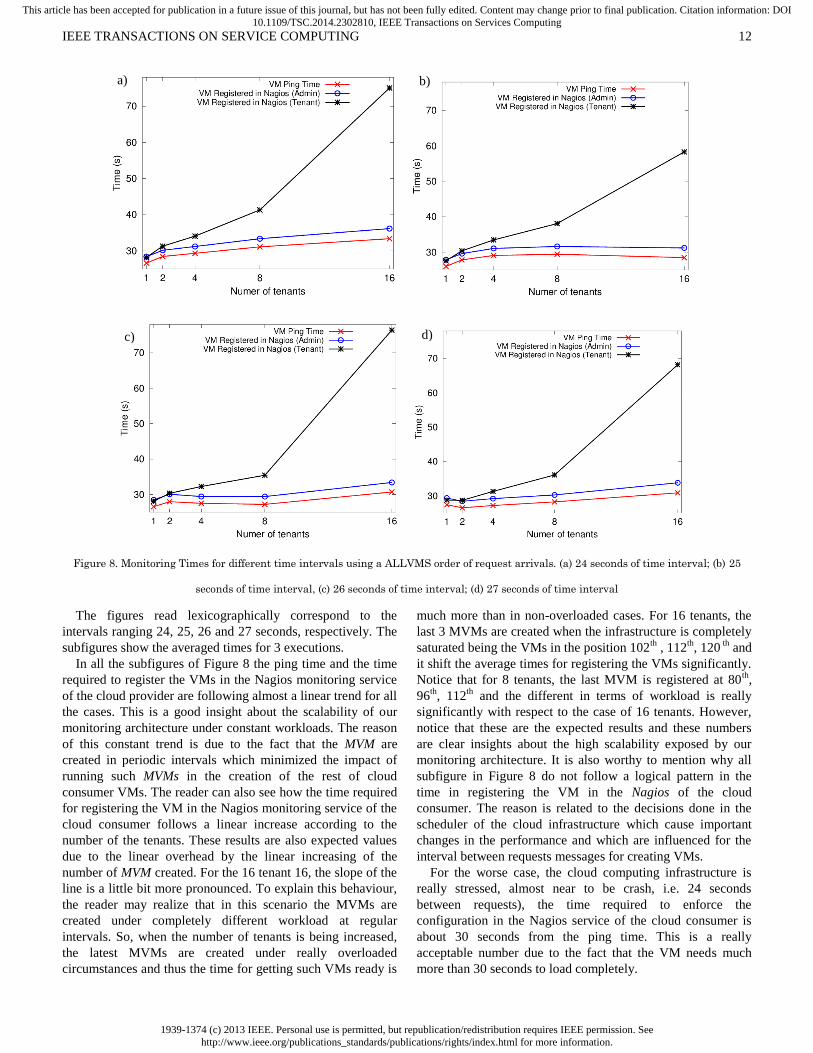
Figure 8. Monitoring Times for different time intervals using a ALLVMS order of request arrivals. (a) 24 seconds of time interval; (b) 25
seconds of time interval, (c) 26 seconds of time interval; (d) 27 seconds of time interval
The figures read lexicographically correspond to the
intervals ranging 24, 25, 26 and 27 seconds, respectively. The
subfigures show the averaged times for 3 executions.
In all the subfigures of Figure 8 the ping time and the time
required to register the VMs in the Nagios monitoring service
of the cloud provider are following almost a linear trend for all
the cases. This is a good insight about the scalability of our
monitoring architecture under constant workloads. The reason
of this constant trend is due to the fact that the MVM are
created in periodic intervals which minimized the impact of
running such MVMs in the creation of the rest of cloud
consumer VMs. The reader can also see how the time required
for registering the VM in the Nagios monitoring service of the
cloud consumer follows a linear increase according to the
number of the tenants. These results are also expected values
due to the linear overhead by the linear increasing of the
number of MVM created. For the 16 tenant 16, the slope of the
line is a little bit more pronounced. To explain this behaviour,
the reader may realize that in this scenario the MVMs are
created under completely different workload at regular
intervals. So, when the number of tenants is being increased,
the latest MVMs are created under really overloaded
circumstances and thus the time for getting such VMs ready is
much more than in non-overloaded cases. For 16 tenants, the
last 3 MVMs are created when the infrastructure is completely
saturated being the VMs in the position 102th
, 112th
, 120 th
and
it shift the average times for registering the VMs significantly.
Notice that for 8 tenants, the last MVM is registered at 80th
,
96th
, 112th
and the different in terms of workload is really
significantly with respect to the case of 16 tenants. However,
notice that these are the expected results and these numbers
are clear insights about the high scalability exposed by our
monitoring architecture. It is also worthy to mention why all
subfigure in Figure 8 do not follow a logical pattern in the
time in registering the VM in the Nagios of the cloud
consumer. The reason is related to the decisions done in the
scheduler of the cloud infrastructure which cause important
changes in the performance and which are influenced for the
interval between requests messages for creating VMs.
For the worse case, the cloud computing infrastructure is
really stressed, almost near to be crash, i.e. 24 seconds
between requests), the time required to enforce the
configuration in the Nagios service of the cloud consumer is
about 30 seconds from the ping time. This is a really
acceptable number due to the fact that the VM needs much
more than 30 seconds to load completely.
a) b)
c) d)
1939-1374 (c) 2013 IEEE. Personal use is permitted, but republication/redistribution requires IEEE permission. Seehttp://www.ieee.org/publications_standards/publications/rights/index.html for more information.
This article has been accepted for publication in a future issue of this journal, but has not been fully edited. Content may change prior to final publication. Citation information: DOI10.1109/TSC.2014.2302810, IEEE Transactions on Services Computing
IEEE TRANSACTIONS ON SERVICE COMPUTING 13
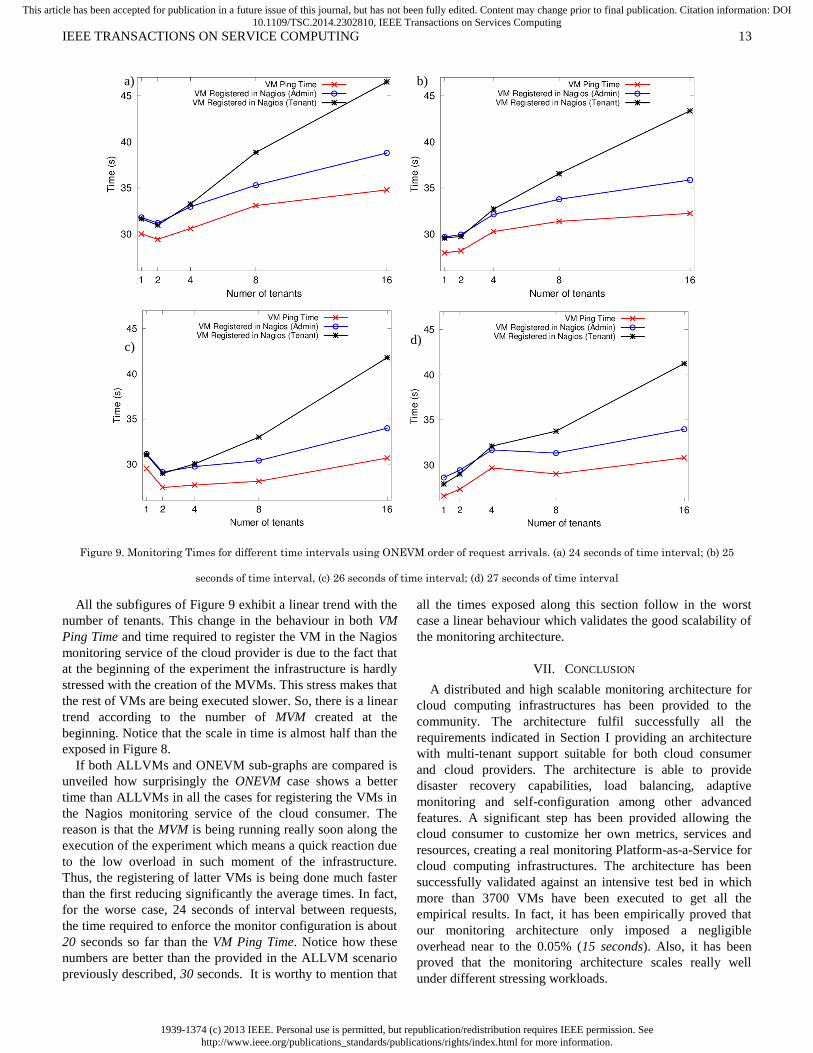
Figure 9. Monitoring Times for different time intervals using ONEVM order of request arrivals. (a) 24 seconds of time interval; (b) 25
seconds of time interval, (c) 26 seconds of time interval; (d) 27 seconds of time interval
All the subfigures of Figure 9 exhibit a linear trend with the
number of tenants. This change in the behaviour in both VM
Ping Time and time required to register the VM in the Nagios
monitoring service of the cloud provider is due to the fact that
at the beginning of the experiment the infrastructure is hardly
stressed with the creation of the MVMs. This stress makes that
the rest of VMs are being executed slower. So, there is a linear
trend according to the number of MVM created at the
beginning. Notice that the scale in time is almost half than the
exposed in Figure 8.
If both ALLVMs and ONEVM sub-graphs are compared is
unveiled how surprisingly the ONEVM case shows a better
time than ALLVMs in all the cases for registering the VMs in
the Nagios monitoring service of the cloud consumer. The
reason is that the MVM is being running really soon along the
execution of the experiment which means a quick reaction due
to the low overload in such moment of the infrastructure.
Thus, the registering of latter VMs is being done much faster
than the first reducing significantly the average times. In fact,
for the worse case, 24 seconds of interval between requests,
the time required to enforce the monitor configuration is about
20 seconds so far than the VM Ping Time. Notice how these
numbers are better than the provided in the ALLVM scenario
previously described, 30 seconds. It is worthy to mention that
all the times exposed along this section follow in the worst
case a linear behaviour which validates the good scalability of
the monitoring architecture.
VII. CONCLUSION
A distributed and high scalable monitoring architecture for
cloud computing infrastructures has been provided to the
community. The architecture fulfil successfully all the
requirements indicated in Section I providing an architecture
with multi-tenant support suitable for both cloud consumer
and cloud providers. The architecture is able to provide
disaster recovery capabilities, load balancing, adaptive
monitoring and self-configuration among other advanced
features. A significant step has been provided allowing the
cloud consumer to customize her own metrics, services and
resources, creating a real monitoring Platform-as-a-Service for
cloud computing infrastructures. The architecture has been
successfully validated against an intensive test bed in which
more than 3700 VMs have been executed to get all the
empirical results. In fact, it has been empirically proved that
our monitoring architecture only imposed a negligible
overhead near to the 0.05% (15 seconds). Also, it has been
proved that the monitoring architecture scales really well
under different stressing workloads.
b) a)
c) d)
1939-1374 (c) 2013 IEEE. Personal use is permitted, but republication/redistribution requires IEEE permission. Seehttp://www.ieee.org/publications_standards/publications/rights/index.html for more information.
This article has been accepted for publication in a future issue of this journal, but has not been fully edited. Content may change prior to final publication. Citation information: DOI10.1109/TSC.2014.2302810, IEEE Transactions on Services Computing
IEEE TRANSACTIONS ON SERVICE COMPUTING 14
As future work, we would like to analyse bigger scenarios
in which the Nagios monitoring services of the cloud
consumer may be a potential bottleneck due to the creation of
an incredibly number of VMs under the same cloud consumer.
We would like to extend the monitoring architecture using
workload balancing capabilities for the monitoring services of
the cloud consumer as well. We also would like to design
novel disaster recovery methods in which not only the Nagios
monitoring service of the cloud provider is recovered but also
the Nagios monitoring service of the cloud consumer can take
advantage of this feature.
REFERENCES
[1] D. Milojičić, I. Llorente y R. S. Montero, «OpenNebula: A Cloud Management Tool,» IEEE Internet Computing, vol. 15, nº 2, pp.
11-14, 2011.
[2] D. Nurmi, R. Wolski, C. Grzegorczyk, G. Obertelli, S. Soman, L. Youseff y D. Zagorodnov, «The Eucalyptus Open-Source Cloud-
Computing System,» de 9th IEEE/ACM International Symposium
on Cluster Computing and the Grid, Shanghai, 2009.
[3] J. M. Alcaraz Calero, J. Gutierrez Aguado y W. Diaz, «IaaSMon:
Framework for Monitoring Cloud Computing Data Centers,»
IEEE Internet Computing, p. (in reviewing process), 2013.
[4] J. Shao, H. Wei, Q. Wang y H. Mei, «A Runtime Model Based
Monitoring Approach for Cloud,» de 2010 IEEE 3rd International
Conference on Cloud Computing, Miami, USA, 2010.
[5] H. Huang y L. Wang, «P&P: a Combined Push-Pull Model for
Resource Monitoring in Cloud Computing Environment,» de 2010
IEEE 3rd International Conference on Cloud Computing, Miami, USA, 2010.
[6] M. Rak, S. Venticinque y T. Mahr, «Cloud Application Monitoring: the
mOSAIC Approach,» de Third IEEE International Conference on Coud Computing Technology and Science, Athens, Greece, 2011.
[7] D. Tovarnak y T. Pitner, «Towards Multi-Tenant and Interoperable
Monitoring of Virtual Machines in Cloud,» de 2012 14th International Symposium on Symbolic and Numeric Algorithms
for Scientific Computing, Timisoara, Romania, 2012.
[8] M. Dhingra, J. Lakshmi y S. K. Nandy, «Resource Usage Monitoring in Clouds,» de ACM/IEEE 13th International Conference on Grid
Computing, Beijing, China, 2012.
[9] T. Selvi y K. Govindarajan, «Cloud Monitoring and Discovery Service (CMDS) for IaaS resources,» de Cloud Monitoring and Discovery
Service (CMDS) for IaaS resources, Chrometet, Chennai, 2011.
[10] G. Katsaros, G. Kousiouris, S. V. Gogouvitis, D. Kyriazis, A. Menychtas y T. Varvarigou, «A Self-adaptive hierarchical
monitoring mechanism for Clouds,» Journal of Systems and
Software, vol. 85, pp. 1029-1041, 2012.
[11] M. Andreolini, M. Colajanni y M. Piet, «A Scalable Architecture for
Real-Time Monitoring of Large Information Systems,» de Second
Symposium on Network Cloud Computing and Applications, London, UK, 2012.
[12] G. Xiang, H. Jin, D. Zou y X. Zhang, «VMDriver: A Driver-based
Monitoring Mechanism for Virtualization,» de 29th IEEE International Symposium on Reliable Distributed Systems, Delhi,
India, 2010.
[13] Y. Sandoval, G. Gallizo y M. Curiel, «Evaluation of Monitoring Tools for Cloud Computing,» de XXXVIII Conferencia Latinoamericana
en Informatica (CLEI), Medellin, Colombia, 2012.
[14] G. Aceto, A. Botta, W. de Donato y A. Pescapè, «Cloud monitoring: A survey,» Computer Networks, vol. 57, p. 2093–2115, 2013.
[15] S. Aparecida de Chaves, R. Brundo Uriarte y C. Becker Westphall, «Toward an Architecture for Monitoring Private Clouds,» IEEE
Communication Maganize, vol. 49, nº 12, pp. 130-137, 2009.
[16] J. Povedano-Molina, J. M. Lopez-Vega, J. M. Lopez-Soler, A. Corradi y
L. Foschini, «DARGOS: A highly adaptable and scalable
monitoring architecture for multi-tenant Clouds,» Future
Generation Computer Systems, p. (in press), 2013.
[17] J. Montesa, A. Sánchez, B. Memishic, M. S. Pérez y G. Antoniu,
«GMonE: A complete approach to cloud monitoring,» Future
Generation Compute System, p. (in press), 2013.
[18] B. Koenig, J. M. Alcaraz Calero y J. Kirchnick, «Elastic Monitoring
Framework for Cloud Infrastructures,» IET Communications, vol.
6, nº 10, pp. 1306-1315 , 2011.
[19] A. Coles, E. Deliot, A. Edwards, A. Fischer, P. Goldsack, J. Guijarro, R.
Hawkes, J. Kirschnick, S. Loughran, P. Murray y L. Wilcock,
«Cells: a Self-hosting Virtual Infrastructure Service,» de 5th IEEE/ACM International Conference on Utility and Cloud
Computing., Chicago, Illinois, USA, 2012.
Dr. Jose M. Alcaraz Calero
is Lecturer on Networks at
University of the West of
Scotland, United Kingdom.
His research interests include
security and management in
distributed and heterogeneous
systems, cloud computing and
big data. He holds an MSc
and PhD in computer
engineering from the
University of Murcia.
Dr. Juan Gutiérrez Aguado
obtained his Phd degree from
University of Valencia (Spain)
where he is an Assistant
Professor. He has coauthored
journal papers in Computer
Vision and Image Processing.
His current research focuses on
Distributed and Cloud
Computing.


![1257653 11 Z-6240 [CE] LV Pub Final · 2015. 3. 23. · platformas pagarinājuma maksimālo platformas kravnesību. Maksim āl platformas celtspēja 227 kg Maksimālais darbinieku](https://img.pdfslide.net/doc/110x75/60e316258834c06e732fb485/1257653-11-z-6240-ce-lv-pub-2015-3-23-platformas-pagarinjuma-maksimlo.jpg)