Embed Size (px)
Citation preview
MONTHLY FINANCIAL REPORTS
Northwestern Local School District
April, 2014
Monthly Financial Report
Table of Contents
Cash Reconciliation …………………………………………… 1 Investment Reports …………………………………………… 2 Fund Balance Reports …………………………………………… 4 Monthly Revenue/Expend Summary …………………………………………… 7 Monthly Revenue/Expenditures …………………………………………… 8 Year to Date Revenue/Expenditures …………………………………………… 9 Month End Cash Balances …………………………………………… 10 Cafeteria Reports …………………………………………… 11 Latchkey Reports …………………………………………… 14 Appropriations …………………………………………… 16
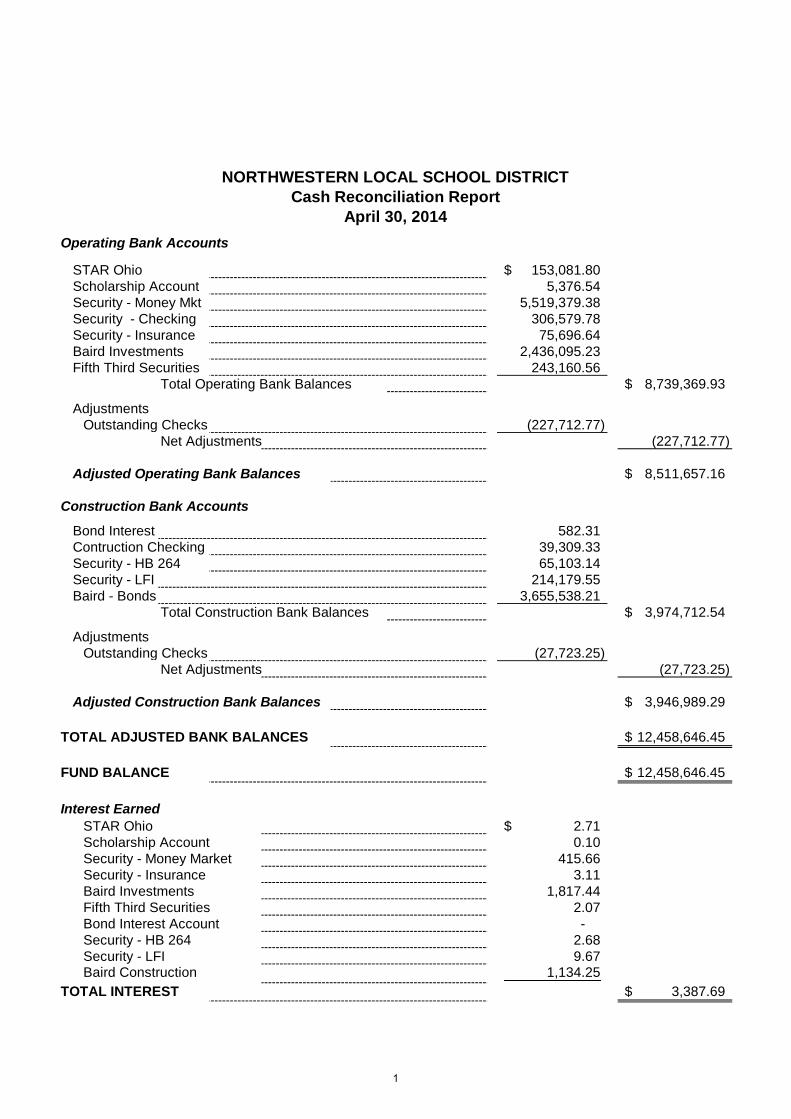
Operating Bank Accounts
STAR Ohio 153,081.80$Scholarship Account 5,376.54Security - Money Mkt 5,519,379.38Security - Checking 306,579.78Security - Insurance 75,696.64Baird Investments 2,436,095.23Fifth Third Securities 243,160.56
Total Operating Bank Balances 8,739,369.93$
AdjustmentsOutstanding Checks (227,712.77)
Net Adjustments (227,712.77)
Adjusted Operating Bank Balances 8,511,657.16$
Construction Bank Accounts
Bond Interest 582.31Contruction Checking 39,309.33Security - HB 264 65,103.14Security - LFI 214,179.55Baird - Bonds 3,655,538.21
Total Construction Bank Balances 3,974,712.54$
AdjustmentsOutstanding Checks (27,723.25)
Net Adjustments (27,723.25)
Adjusted Construction Bank Balances 3,946,989.29$
TOTAL ADJUSTED BANK BALANCES 12,458,646.45$
FUND BALANCE 12,458,646.45$
Interest Earned
STAR Ohio 2.71$Scholarship Account 0.10Security - Money Market 415.66Security - Insurance 3.11Baird Investments 1,817.44Fifth Third Securities 2.07Bond Interest Account -Security - HB 264 2.68Security - LFI 9.67Baird Construction 1,134.25
TOTAL INTEREST 3,387.69$
NORTHWESTERN LOCAL SCHOOL DISTRICTCash Reconciliation Report
April 30, 2014
1
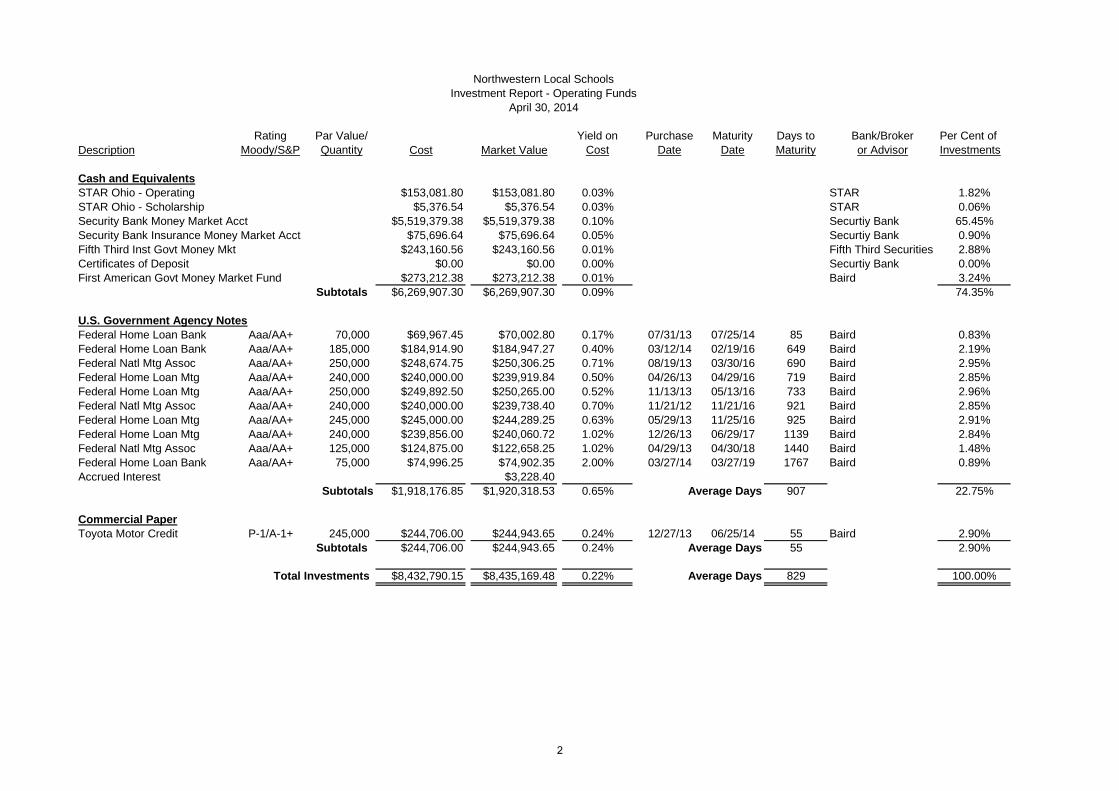
Description
Rating
Moody/S&P
Par Value/
Quantity Cost Market Value
Yield on
Cost
Purchase
Date
Maturity
Date
Days to
Maturity
Bank/Broker
or Advisor
Per Cent of
Investments
Cash and Equivalents
STAR Ohio - Operating $153,081.80 $153,081.80 0.03% STAR 1.82%
STAR Ohio - Scholarship $5,376.54 $5,376.54 0.03% STAR 0.06%
Security Bank Money Market Acct $5,519,379.38 $5,519,379.38 0.10% Securtiy Bank 65.45%
Security Bank Insurance Money Market Acct $75,696.64 $75,696.64 0.05% Securtiy Bank 0.90%
Fifth Third Inst Govt Money Mkt $243,160.56 $243,160.56 0.01% Fifth Third Securities 2.88%
Certificates of Deposit $0.00 $0.00 0.00% Securtiy Bank 0.00%
First American Govt Money Market Fund $273,212.38 $273,212.38 0.01% Baird 3.24%
Subtotals $6,269,907.30 $6,269,907.30 0.09% 74.35%
U.S. Government Agency Notes
Federal Home Loan Bank Aaa/AA+ 70,000 $69,967.45 $70,002.80 0.17% 07/31/13 07/25/14 85 Baird 0.83%
Federal Home Loan Bank Aaa/AA+ 185,000 $184,914.90 $184,947.27 0.40% 03/12/14 02/19/16 649 Baird 2.19%
Federal Natl Mtg Assoc Aaa/AA+ 250,000 $248,674.75 $250,306.25 0.71% 08/19/13 03/30/16 690 Baird 2.95%
Federal Home Loan Mtg Aaa/AA+ 240,000 $240,000.00 $239,919.84 0.50% 04/26/13 04/29/16 719 Baird 2.85%
Federal Home Loan Mtg Aaa/AA+ 250,000 $249,892.50 $250,265.00 0.52% 11/13/13 05/13/16 733 Baird 2.96%
Federal Natl Mtg Assoc Aaa/AA+ 240,000 $240,000.00 $239,738.40 0.70% 11/21/12 11/21/16 921 Baird 2.85%
Federal Home Loan Mtg Aaa/AA+ 245,000 $245,000.00 $244,289.25 0.63% 05/29/13 11/25/16 925 Baird 2.91%
Federal Home Loan Mtg Aaa/AA+ 240,000 $239,856.00 $240,060.72 1.02% 12/26/13 06/29/17 1139 Baird 2.84%
Federal Natl Mtg Assoc Aaa/AA+ 125,000 $124,875.00 $122,658.25 1.02% 04/29/13 04/30/18 1440 Baird 1.48%
Federal Home Loan Bank Aaa/AA+ 75,000 $74,996.25 $74,902.35 2.00% 03/27/14 03/27/19 1767 Baird 0.89%
Accrued Interest $3,228.40
Subtotals $1,918,176.85 $1,920,318.53 0.65% Average Days 907 22.75%
Commercial Paper
Toyota Motor Credit P-1/A-1+ 245,000 $244,706.00 $244,943.65 0.24% 12/27/13 06/25/14 55 Baird 2.90%
Subtotals $244,706.00 $244,943.65 0.24% Average Days 55 2.90%
Total Investments $8,432,790.15 $8,435,169.48 0.22% Average Days 829 100.00%
Northwestern Local Schools
Investment Report - Operating Funds
April 30, 2014
2
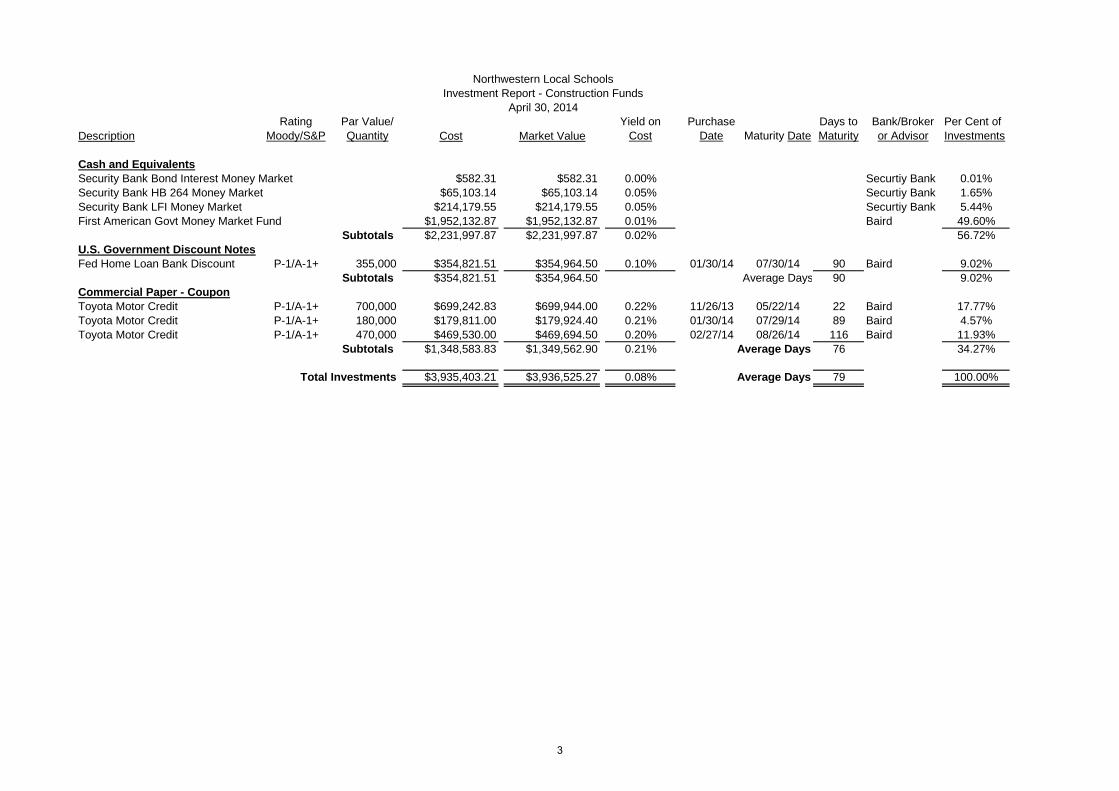
Description
Rating
Moody/S&P
Par Value/
Quantity Cost Market Value
Yield on
Cost
Purchase
Date Maturity Date
Days to
Maturity
Bank/Broker
or Advisor
Per Cent of
Investments
Cash and Equivalents
Security Bank Bond Interest Money Market $582.31 $582.31 0.00% Securtiy Bank 0.01%
Security Bank HB 264 Money Market $65,103.14 $65,103.14 0.05% Securtiy Bank 1.65%
Security Bank LFI Money Market $214,179.55 $214,179.55 0.05% Securtiy Bank 5.44%
First American Govt Money Market Fund $1,952,132.87 $1,952,132.87 0.01% Baird 49.60%
Subtotals $2,231,997.87 $2,231,997.87 0.02% 56.72%
U.S. Government Discount Notes
Fed Home Loan Bank Discount P-1/A-1+ 355,000 $354,821.51 $354,964.50 0.10% 01/30/14 07/30/14 90 Baird 9.02%
Subtotals $354,821.51 $354,964.50 Average Days 90 9.02%
Commercial Paper - Coupon
Toyota Motor Credit P-1/A-1+ 700,000 $699,242.83 $699,944.00 0.22% 11/26/13 05/22/14 22 Baird 17.77%
Toyota Motor Credit P-1/A-1+ 180,000 $179,811.00 $179,924.40 0.21% 01/30/14 07/29/14 89 Baird 4.57%
Toyota Motor Credit P-1/A-1+ 470,000 $469,530.00 $469,694.50 0.20% 02/27/14 08/26/14 116 Baird 11.93%
Subtotals $1,348,583.83 $1,349,562.90 0.21% Average Days 76 34.27%
Total Investments $3,935,403.21 $3,936,525.27 0.08% Average Days 79 100.00%
Northwestern Local Schools
Investment Report - Construction Funds
April 30, 2014
3
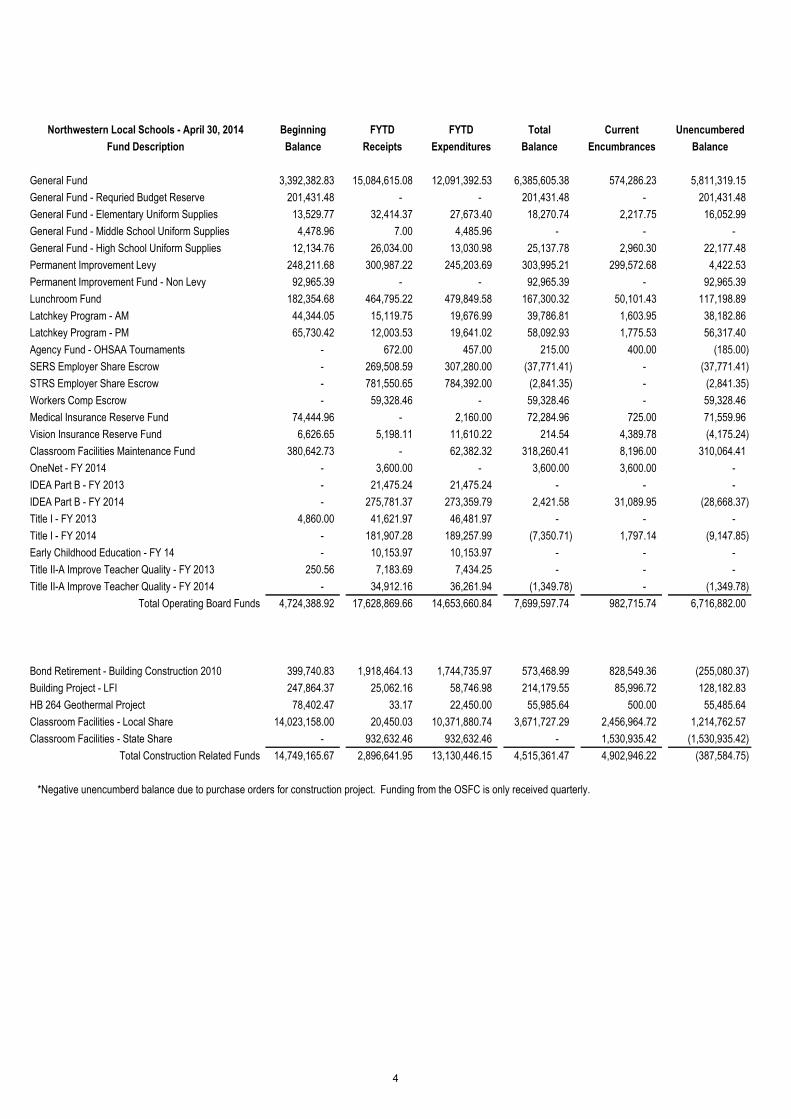
Northwestern Local Schools - April 30, 2014 Beginning FYTD FYTD Total Current Unencumbered
Fund Description Balance Receipts Expenditures Balance Encumbrances Balance
General Fund 3,392,382.83 15,084,615.08 12,091,392.53 6,385,605.38 574,286.23 5,811,319.15
General Fund - Requried Budget Reserve 201,431.48 - - 201,431.48 - 201,431.48
General Fund - Elementary Uniform Supplies 13,529.77 32,414.37 27,673.40 18,270.74 2,217.75 16,052.99
General Fund - Middle School Uniform Supplies 4,478.96 7.00 4,485.96 - - -
General Fund - High School Uniform Supplies 12,134.76 26,034.00 13,030.98 25,137.78 2,960.30 22,177.48
Permanent Improvement Levy 248,211.68 300,987.22 245,203.69 303,995.21 299,572.68 4,422.53
Permanent Improvement Fund - Non Levy 92,965.39 - - 92,965.39 - 92,965.39
Lunchroom Fund 182,354.68 464,795.22 479,849.58 167,300.32 50,101.43 117,198.89
Latchkey Program - AM 44,344.05 15,119.75 19,676.99 39,786.81 1,603.95 38,182.86
Latchkey Program - PM 65,730.42 12,003.53 19,641.02 58,092.93 1,775.53 56,317.40
Agency Fund - OHSAA Tournaments - 672.00 457.00 215.00 400.00 (185.00)
SERS Employer Share Escrow - 269,508.59 307,280.00 (37,771.41) - (37,771.41)
STRS Employer Share Escrow - 781,550.65 784,392.00 (2,841.35) - (2,841.35)
Workers Comp Escrow - 59,328.46 - 59,328.46 - 59,328.46
Medical Insurance Reserve Fund 74,444.96 - 2,160.00 72,284.96 725.00 71,559.96
Vision Insurance Reserve Fund 6,626.65 5,198.11 11,610.22 214.54 4,389.78 (4,175.24)
Classroom Facilities Maintenance Fund 380,642.73 - 62,382.32 318,260.41 8,196.00 310,064.41
OneNet - FY 2014 - 3,600.00 - 3,600.00 3,600.00 -
IDEA Part B - FY 2013 - 21,475.24 21,475.24 - - -
IDEA Part B - FY 2014 - 275,781.37 273,359.79 2,421.58 31,089.95 (28,668.37)
Title I - FY 2013 4,860.00 41,621.97 46,481.97 - - -
Title I - FY 2014 - 181,907.28 189,257.99 (7,350.71) 1,797.14 (9,147.85)
Early Childhood Education - FY 14 - 10,153.97 10,153.97 - - -
Title II-A Improve Teacher Quality - FY 2013 250.56 7,183.69 7,434.25 - - -
Title II-A Improve Teacher Quality - FY 2014 - 34,912.16 36,261.94 (1,349.78) - (1,349.78)
Total Operating Board Funds 4,724,388.92 17,628,869.66 14,653,660.84 7,699,597.74 982,715.74 6,716,882.00
Bond Retirement - Building Construction 2010 399,740.83 1,918,464.13 1,744,735.97 573,468.99 828,549.36 (255,080.37)
Building Project - LFI 247,864.37 25,062.16 58,746.98 214,179.55 85,996.72 128,182.83
HB 264 Geothermal Project 78,402.47 33.17 22,450.00 55,985.64 500.00 55,485.64
Classroom Facilities - Local Share 14,023,158.00 20,450.03 10,371,880.74 3,671,727.29 2,456,964.72 1,214,762.57
Classroom Facilities - State Share - 932,632.46 932,632.46 - 1,530,935.42 (1,530,935.42)
Total Construction Related Funds 14,749,165.67 2,896,641.95 13,130,446.15 4,515,361.47 4,902,946.22 (387,584.75)
*Negative unencumberd balance due to purchase orders for construction project. Funding from the OSFC is only received quarterly.
4
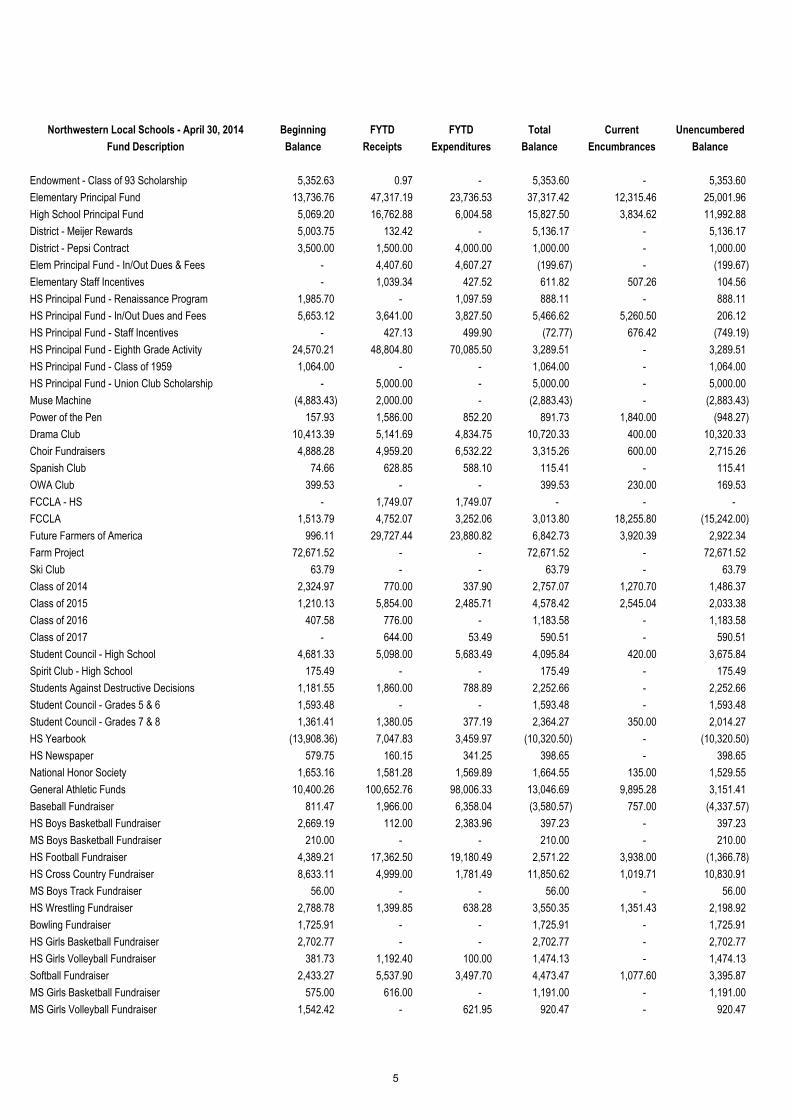
Northwestern Local Schools - April 30, 2014 Beginning FYTD FYTD Total Current Unencumbered
Fund Description Balance Receipts Expenditures Balance Encumbrances Balance
Endowment - Class of 93 Scholarship 5,352.63 0.97 - 5,353.60 - 5,353.60
Elementary Principal Fund 13,736.76 47,317.19 23,736.53 37,317.42 12,315.46 25,001.96
High School Principal Fund 5,069.20 16,762.88 6,004.58 15,827.50 3,834.62 11,992.88
District - Meijer Rewards 5,003.75 132.42 - 5,136.17 - 5,136.17
District - Pepsi Contract 3,500.00 1,500.00 4,000.00 1,000.00 - 1,000.00
Elem Principal Fund - In/Out Dues & Fees - 4,407.60 4,607.27 (199.67) - (199.67)
Elementary Staff Incentives - 1,039.34 427.52 611.82 507.26 104.56
HS Principal Fund - Renaissance Program 1,985.70 - 1,097.59 888.11 - 888.11
HS Principal Fund - In/Out Dues and Fees 5,653.12 3,641.00 3,827.50 5,466.62 5,260.50 206.12
HS Principal Fund - Staff Incentives - 427.13 499.90 (72.77) 676.42 (749.19)
HS Principal Fund - Eighth Grade Activity 24,570.21 48,804.80 70,085.50 3,289.51 - 3,289.51
HS Principal Fund - Class of 1959 1,064.00 - - 1,064.00 - 1,064.00
HS Principal Fund - Union Club Scholarship - 5,000.00 - 5,000.00 - 5,000.00
Muse Machine (4,883.43) 2,000.00 - (2,883.43) - (2,883.43)
Power of the Pen 157.93 1,586.00 852.20 891.73 1,840.00 (948.27)
Drama Club 10,413.39 5,141.69 4,834.75 10,720.33 400.00 10,320.33
Choir Fundraisers 4,888.28 4,959.20 6,532.22 3,315.26 600.00 2,715.26
Spanish Club 74.66 628.85 588.10 115.41 - 115.41
OWA Club 399.53 - - 399.53 230.00 169.53
FCCLA - HS - 1,749.07 1,749.07 - - -
FCCLA 1,513.79 4,752.07 3,252.06 3,013.80 18,255.80 (15,242.00)
Future Farmers of America 996.11 29,727.44 23,880.82 6,842.73 3,920.39 2,922.34
Farm Project 72,671.52 - - 72,671.52 - 72,671.52
Ski Club 63.79 - - 63.79 - 63.79
Class of 2014 2,324.97 770.00 337.90 2,757.07 1,270.70 1,486.37
Class of 2015 1,210.13 5,854.00 2,485.71 4,578.42 2,545.04 2,033.38
Class of 2016 407.58 776.00 - 1,183.58 - 1,183.58
Class of 2017 - 644.00 53.49 590.51 - 590.51
Student Council - High School 4,681.33 5,098.00 5,683.49 4,095.84 420.00 3,675.84
Spirit Club - High School 175.49 - - 175.49 - 175.49
Students Against Destructive Decisions 1,181.55 1,860.00 788.89 2,252.66 - 2,252.66
Student Council - Grades 5 & 6 1,593.48 - - 1,593.48 - 1,593.48
Student Council - Grades 7 & 8 1,361.41 1,380.05 377.19 2,364.27 350.00 2,014.27
HS Yearbook (13,908.36) 7,047.83 3,459.97 (10,320.50) - (10,320.50)
HS Newspaper 579.75 160.15 341.25 398.65 - 398.65
National Honor Society 1,653.16 1,581.28 1,569.89 1,664.55 135.00 1,529.55
General Athletic Funds 10,400.26 100,652.76 98,006.33 13,046.69 9,895.28 3,151.41
Baseball Fundraiser 811.47 1,966.00 6,358.04 (3,580.57) 757.00 (4,337.57)
HS Boys Basketball Fundraiser 2,669.19 112.00 2,383.96 397.23 - 397.23
MS Boys Basketball Fundraiser 210.00 - - 210.00 - 210.00
HS Football Fundraiser 4,389.21 17,362.50 19,180.49 2,571.22 3,938.00 (1,366.78)
HS Cross Country Fundraiser 8,633.11 4,999.00 1,781.49 11,850.62 1,019.71 10,830.91
MS Boys Track Fundraiser 56.00 - - 56.00 - 56.00
HS Wrestling Fundraiser 2,788.78 1,399.85 638.28 3,550.35 1,351.43 2,198.92
Bowling Fundraiser 1,725.91 - - 1,725.91 - 1,725.91
HS Girls Basketball Fundraiser 2,702.77 - - 2,702.77 - 2,702.77
HS Girls Volleyball Fundraiser 381.73 1,192.40 100.00 1,474.13 - 1,474.13
Softball Fundraiser 2,433.27 5,537.90 3,497.70 4,473.47 1,077.60 3,395.87
MS Girls Basketball Fundraiser 575.00 616.00 - 1,191.00 - 1,191.00
MS Girls Volleyball Fundraiser 1,542.42 - 621.95 920.47 - 920.47
5
Northwestern Local Schools - April 30, 2014 Beginning FYTD FYTD Total Current Unencumbered
Fund Description Balance Receipts Expenditures Balance Encumbrances Balance
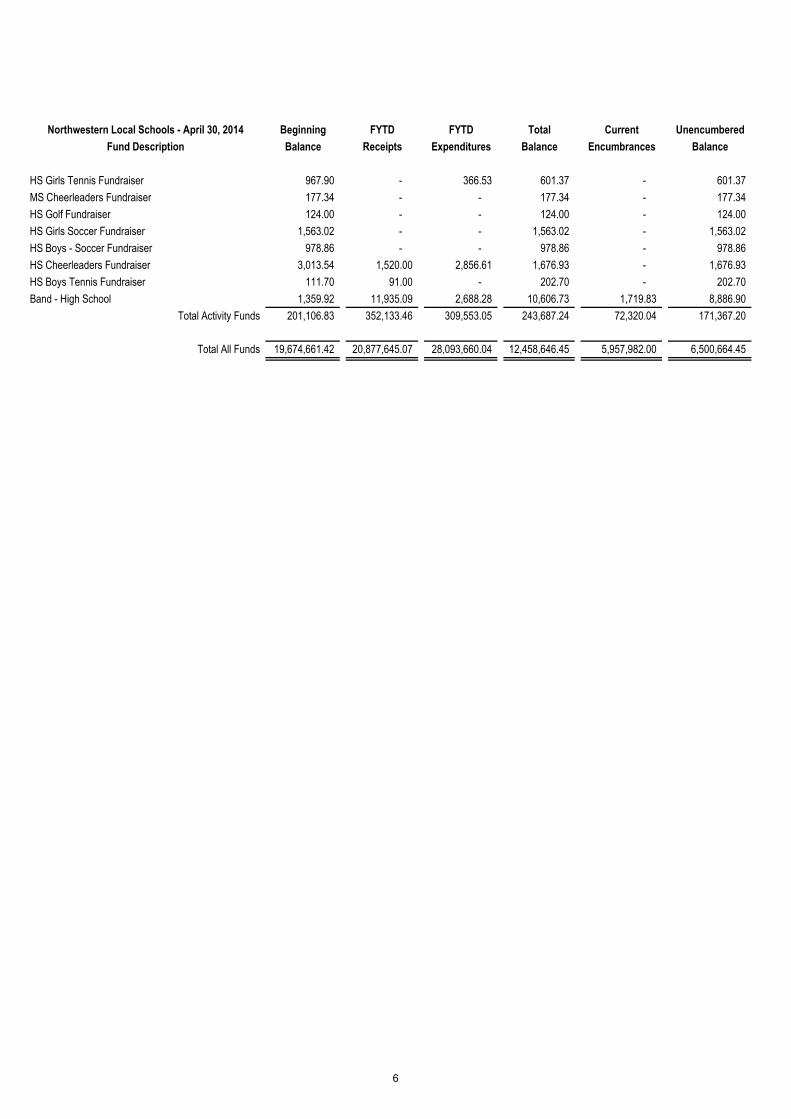
HS Girls Tennis Fundraiser 967.90 - 366.53 601.37 - 601.37
MS Cheerleaders Fundraiser 177.34 - - 177.34 - 177.34
HS Golf Fundraiser 124.00 - - 124.00 - 124.00
HS Girls Soccer Fundraiser 1,563.02 - - 1,563.02 - 1,563.02
HS Boys - Soccer Fundraiser 978.86 - - 978.86 - 978.86
HS Cheerleaders Fundraiser 3,013.54 1,520.00 2,856.61 1,676.93 - 1,676.93
HS Boys Tennis Fundraiser 111.70 91.00 - 202.70 - 202.70
Band - High School 1,359.92 11,935.09 2,688.28 10,606.73 1,719.83 8,886.90
Total Activity Funds 201,106.83 352,133.46 309,553.05 243,687.24 72,320.04 171,367.20
Total All Funds 19,674,661.42 20,877,645.07 28,093,660.04 12,458,646.45 5,957,982.00 6,500,664.45
6
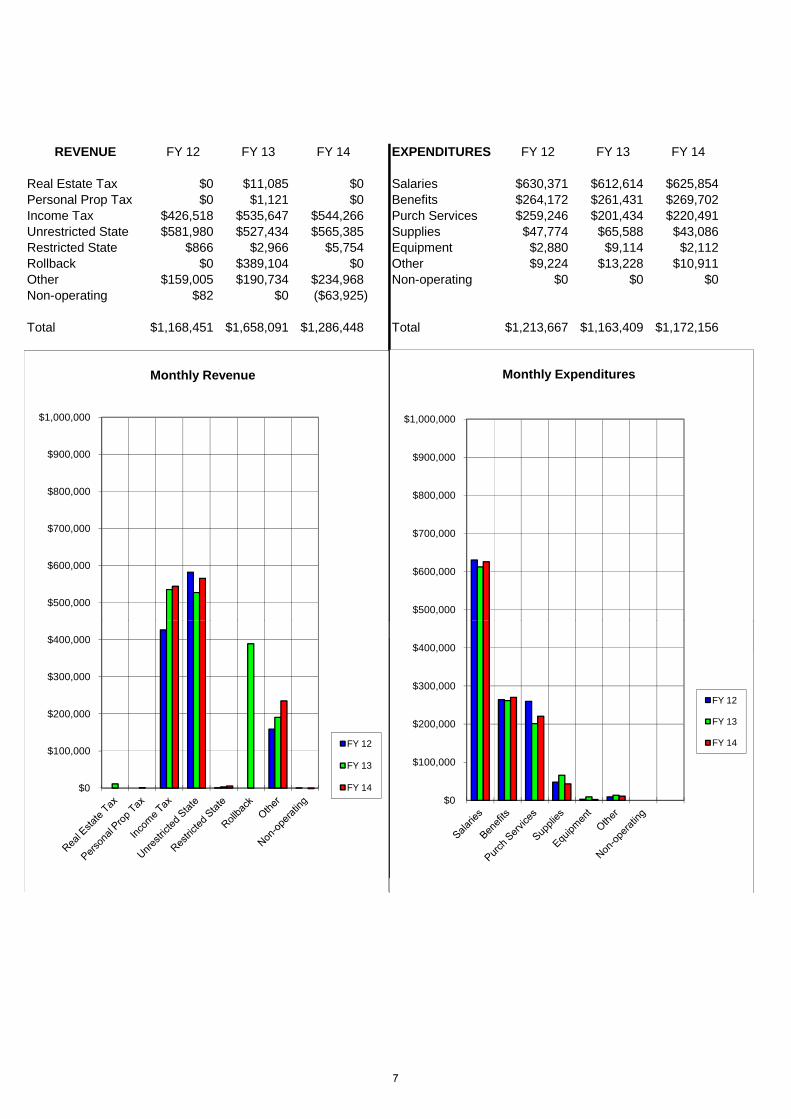
REVENUE FY 12 FY 13 FY 14 EXPENDITURES FY 12 FY 13 FY 14
Real Estate Tax $0 $11,085 $0 Salaries $630,371 $612,614 $625,854Personal Prop Tax $0 $1,121 $0 Benefits $264,172 $261,431 $269,702Income Tax $426,518 $535,647 $544,266 Purch Services $259,246 $201,434 $220,491Unrestricted State $581,980 $527,434 $565,385 Supplies $47,774 $65,588 $43,086Restricted State $866 $2,966 $5,754 Equipment $2,880 $9,114 $2,112Rollback $0 $389,104 $0 Other $9,224 $13,228 $10,911Other $159,005 $190,734 $234,968 Non-operating $0 $0 $0Non-operating $82 $0 ($63,925)
Total $1,168,451 $1,658,091 $1,286,448 Total $1,213,667 $1,163,409 $1,172,156
$400,000
$500,000
$600,000
$700,000
$800,000
$900,000
$1,000,000
Monthly Revenue
$400,000
$500,000
$600,000
$700,000
$800,000
$900,000
$1,000,000
Monthly Expenditures
$0
$100,000
$200,000
$300,000
$400,000
FY 12
FY 13
FY 14
$0
$100,000
$200,000
$300,000
$400,000
FY 12
FY 13
FY 14
7
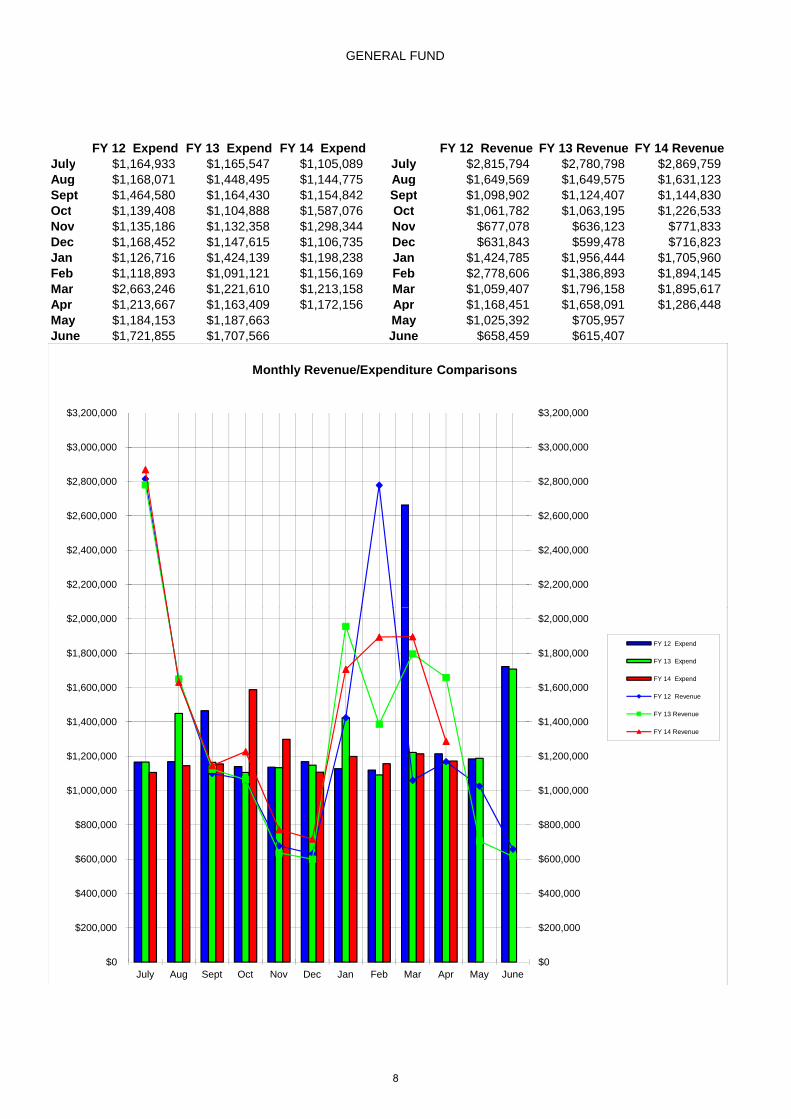
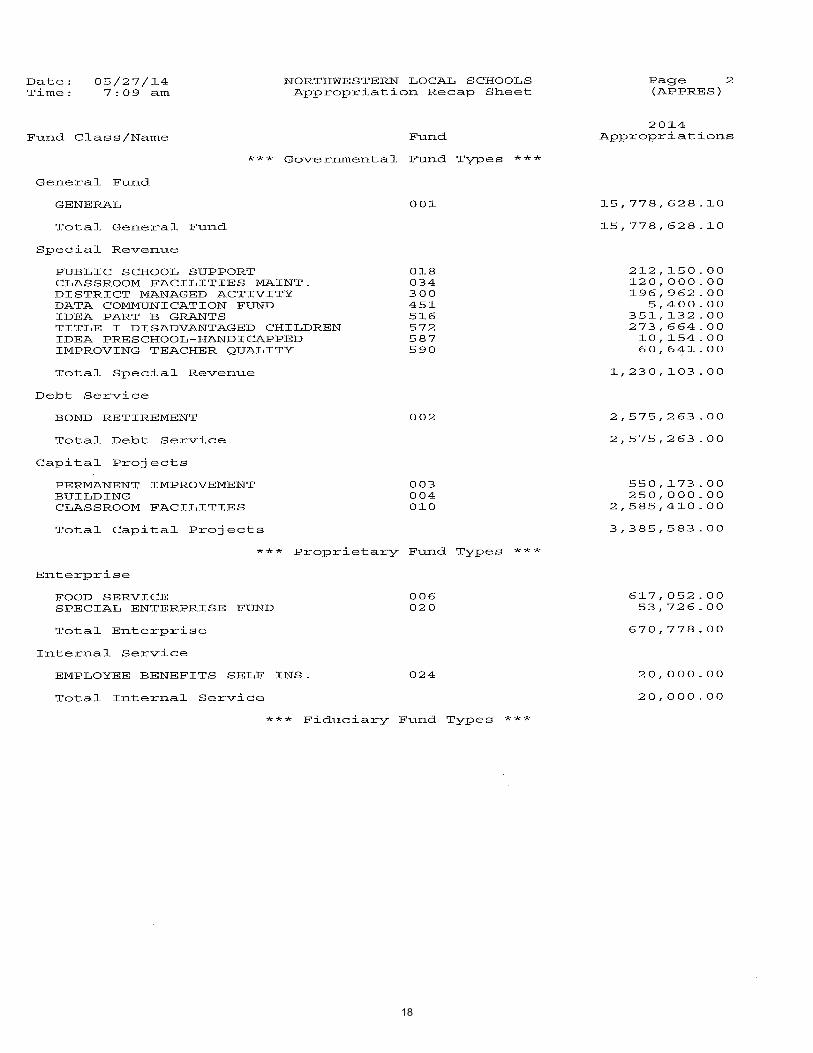
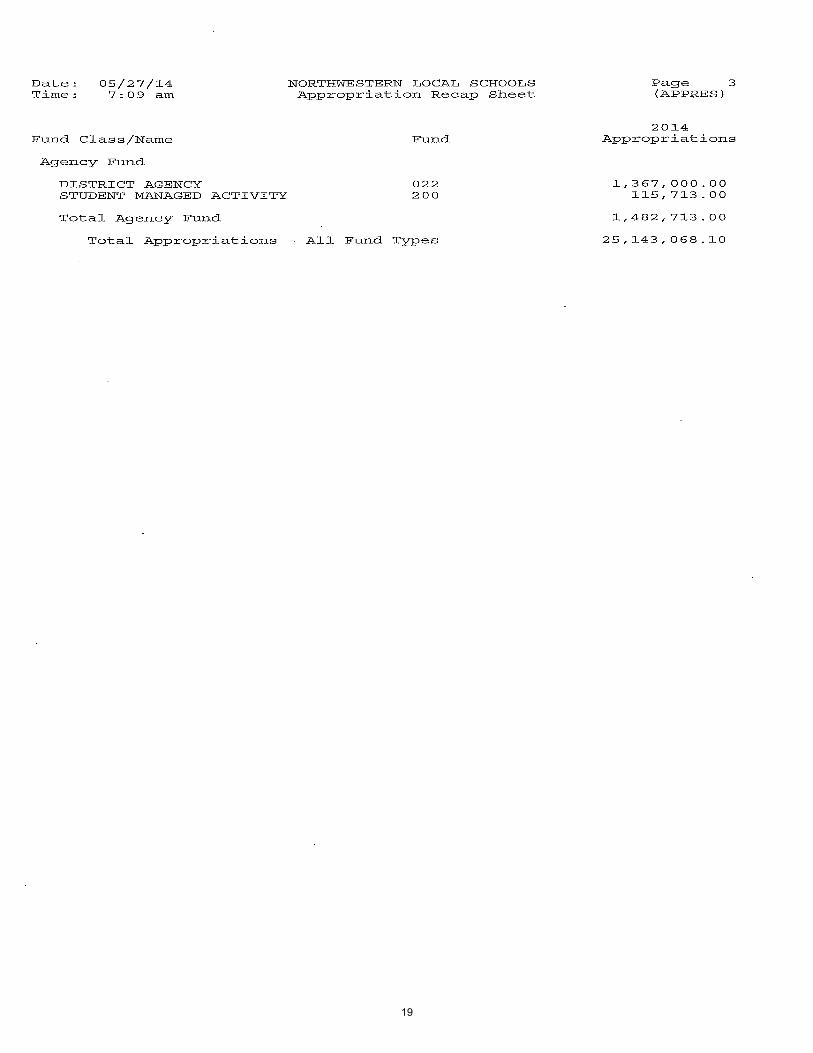
GENERAL FUND
FY 12 Expend FY 13 Expend FY 14 Expend FY 12 Revenue FY 13 Revenue FY 14 RevenueJuly $1,164,933 $1,165,547 $1,105,089 July $2,815,794 $2,780,798 $2,869,759Aug $1,168,071 $1,448,495 $1,144,775 Aug $1,649,569 $1,649,575 $1,631,123Sept $1,464,580 $1,164,430 $1,154,842 Sept $1,098,902 $1,124,407 $1,144,830Oct $1,139,408 $1,104,888 $1,587,076 Oct $1,061,782 $1,063,195 $1,226,533Nov $1,135,186 $1,132,358 $1,298,344 Nov $677,078 $636,123 $771,833Dec $1,168,452 $1,147,615 $1,106,735 Dec $631,843 $599,478 $716,823Jan $1,126,716 $1,424,139 $1,198,238 Jan $1,424,785 $1,956,444 $1,705,960Feb $1,118,893 $1,091,121 $1,156,169 Feb $2,778,606 $1,386,893 $1,894,145Mar $2,663,246 $1,221,610 $1,213,158 Mar $1,059,407 $1,796,158 $1,895,617Apr $1,213,667 $1,163,409 $1,172,156 Apr $1,168,451 $1,658,091 $1,286,448May $1,184,153 $1,187,663 May $1,025,392 $705,957June $1,721,855 $1,707,566 June $658,459 $615,407
$2,000,000
$2,200,000
$2,400,000
$2,600,000
$2,800,000
$3,000,000
$3,200,000
$2,000,000
$2,200,000
$2,400,000
$2,600,000
$2,800,000
$3,000,000
$3,200,000
Monthly Revenue/Expenditure Comparisons
FY 12 Expend
$0
$200,000
$400,000
$600,000
$800,000
$1,000,000
$1,200,000
$1,400,000
$1,600,000
$1,800,000
$2,000,000
$0
$200,000
$400,000
$600,000
$800,000
$1,000,000
$1,200,000
$1,400,000
$1,600,000
$1,800,000
$2,000,000
July Aug Sept Oct Nov Dec Jan Feb Mar Apr May June
FY 12 Expend
FY 13 Expend
FY 14 Expend
FY 12 Revenue
FY 13 Revenue
FY 14 Revenue
8
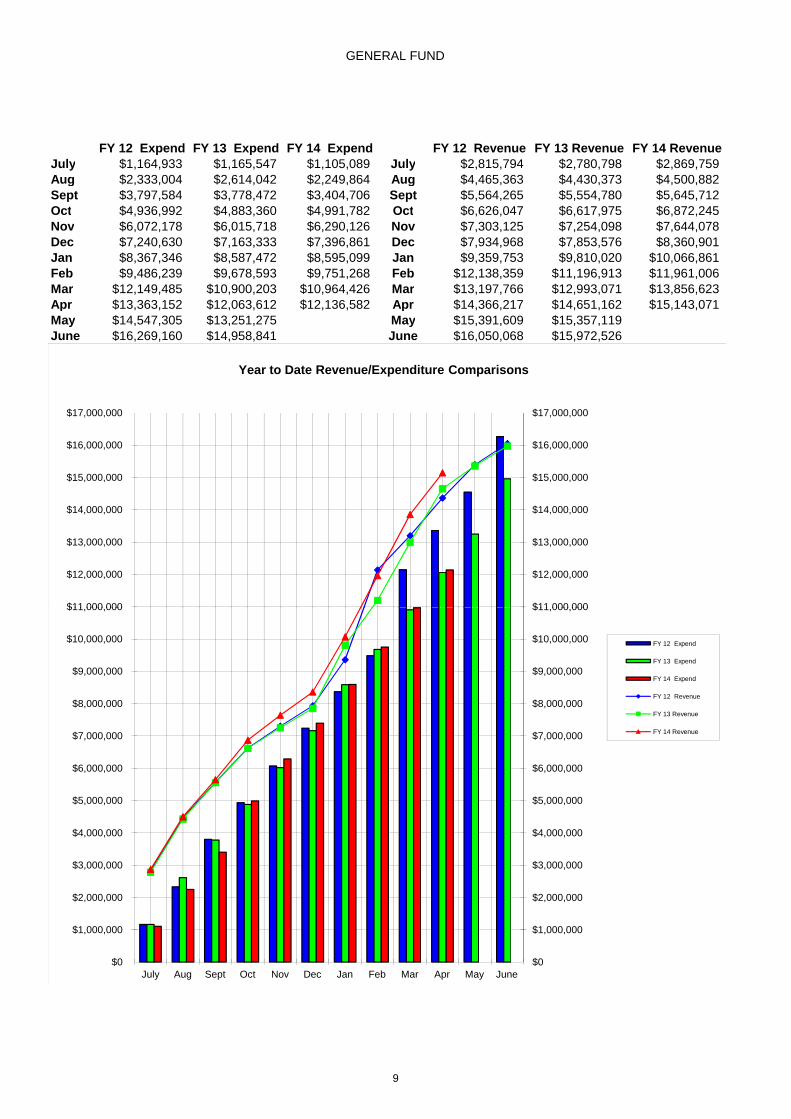
GENERAL FUND
FY 12 Expend FY 13 Expend FY 14 Expend FY 12 Revenue FY 13 Revenue FY 14 RevenueJuly $1,164,933 $1,165,547 $1,105,089 July $2,815,794 $2,780,798 $2,869,759Aug $2,333,004 $2,614,042 $2,249,864 Aug $4,465,363 $4,430,373 $4,500,882Sept $3,797,584 $3,778,472 $3,404,706 Sept $5,564,265 $5,554,780 $5,645,712Oct $4,936,992 $4,883,360 $4,991,782 Oct $6,626,047 $6,617,975 $6,872,245Nov $6,072,178 $6,015,718 $6,290,126 Nov $7,303,125 $7,254,098 $7,644,078Dec $7,240,630 $7,163,333 $7,396,861 Dec $7,934,968 $7,853,576 $8,360,901Jan $8,367,346 $8,587,472 $8,595,099 Jan $9,359,753 $9,810,020 $10,066,861Feb $9,486,239 $9,678,593 $9,751,268 Feb $12,138,359 $11,196,913 $11,961,006Mar $12,149,485 $10,900,203 $10,964,426 Mar $13,197,766 $12,993,071 $13,856,623Apr $13,363,152 $12,063,612 $12,136,582 Apr $14,366,217 $14,651,162 $15,143,071May $14,547,305 $13,251,275 May $15,391,609 $15,357,119June $16,269,160 $14,958,841 June $16,050,068 $15,972,526
$10,000,000
$11,000,000
$12,000,000
$13,000,000
$14,000,000
$15,000,000
$16,000,000
$17,000,000
$10,000,000
$11,000,000
$12,000,000
$13,000,000
$14,000,000
$15,000,000
$16,000,000
$17,000,000
Year to Date Revenue/Expenditure Comparisons
FY 12 Expend
$0
$1,000,000
$2,000,000
$3,000,000
$4,000,000
$5,000,000
$6,000,000
$7,000,000
$8,000,000
$9,000,000
$10,000,000
$11,000,000
$0
$1,000,000
$2,000,000
$3,000,000
$4,000,000
$5,000,000
$6,000,000
$7,000,000
$8,000,000
$9,000,000
$10,000,000
$11,000,000
July Aug Sept Oct Nov Dec Jan Feb Mar Apr May June
FY 12 Expend
FY 13 Expend
FY 14 Expend
FY 12 Revenue
FY 13 Revenue
FY 14 Revenue
9
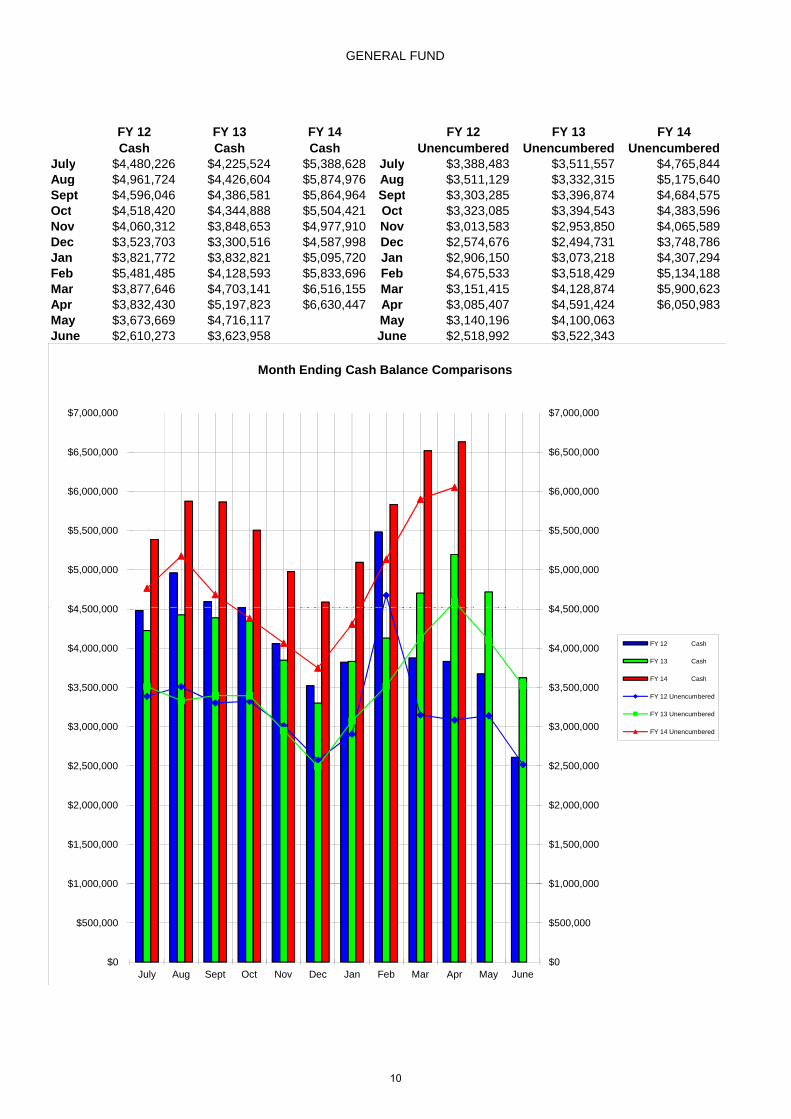
GENERAL FUND
FY 12
Cash
FY 13
Cash
FY 14
Cash
FY 12
Unencumbered
FY 13
Unencumbered
FY 14
UnencumberedJuly $4,480,226 $4,225,524 $5,388,628 July $3,388,483 $3,511,557 $4,765,844Aug $4,961,724 $4,426,604 $5,874,976 Aug $3,511,129 $3,332,315 $5,175,640Sept $4,596,046 $4,386,581 $5,864,964 Sept $3,303,285 $3,396,874 $4,684,575Oct $4,518,420 $4,344,888 $5,504,421 Oct $3,323,085 $3,394,543 $4,383,596Nov $4,060,312 $3,848,653 $4,977,910 Nov $3,013,583 $2,953,850 $4,065,589Dec $3,523,703 $3,300,516 $4,587,998 Dec $2,574,676 $2,494,731 $3,748,786Jan $3,821,772 $3,832,821 $5,095,720 Jan $2,906,150 $3,073,218 $4,307,294Feb $5,481,485 $4,128,593 $5,833,696 Feb $4,675,533 $3,518,429 $5,134,188Mar $3,877,646 $4,703,141 $6,516,155 Mar $3,151,415 $4,128,874 $5,900,623Apr $3,832,430 $5,197,823 $6,630,447 Apr $3,085,407 $4,591,424 $6,050,983May $3,673,669 $4,716,117 May $3,140,196 $4,100,063June $2,610,273 $3,623,958 June $2,518,992 $3,522,343
$6,000,000
$7,000,000
$8,000,000
$9,000,000
$10,000,000
$6,000,000
$7,000,000
$8,000,000
$9,000,000
$10,000,000
Year to Date Revenue/Expenditure Comparisons
FY 12 Expend
$4,500,000
$5,000,000
$5,500,000
$6,000,000
$6,500,000
$7,000,000
$4,500,000
$5,000,000
$5,500,000
$6,000,000
$6,500,000
$7,000,000
Month Ending Cash Balance Comparisons
FY 12 Cash
$0
$1,000,000
$2,000,000
$3,000,000
$4,000,000
$5,000,000
$6,000,000
$0
$1,000,000
$2,000,000
$3,000,000
$4,000,000
$5,000,000
$6,000,000
July Aug Sept Oct Nov Dec Jan Feb Mar Apr May June
FY 12 Expend
FY 13 Expend
FY 14 Expend
FY 12 Revenue
FY 13 Revenue
FY 14 Revenue
$0
$500,000
$1,000,000
$1,500,000
$2,000,000
$2,500,000
$3,000,000
$3,500,000
$4,000,000
$4,500,000
$0
$500,000
$1,000,000
$1,500,000
$2,000,000
$2,500,000
$3,000,000
$3,500,000
$4,000,000
$4,500,000
July Aug Sept Oct Nov Dec Jan Feb Mar Apr May June
FY 12 Cash
FY 13 Cash
FY 14 Cash
FY 12 Unencumbered
FY 13 Unencumbered
FY 14 Unencumbered
10
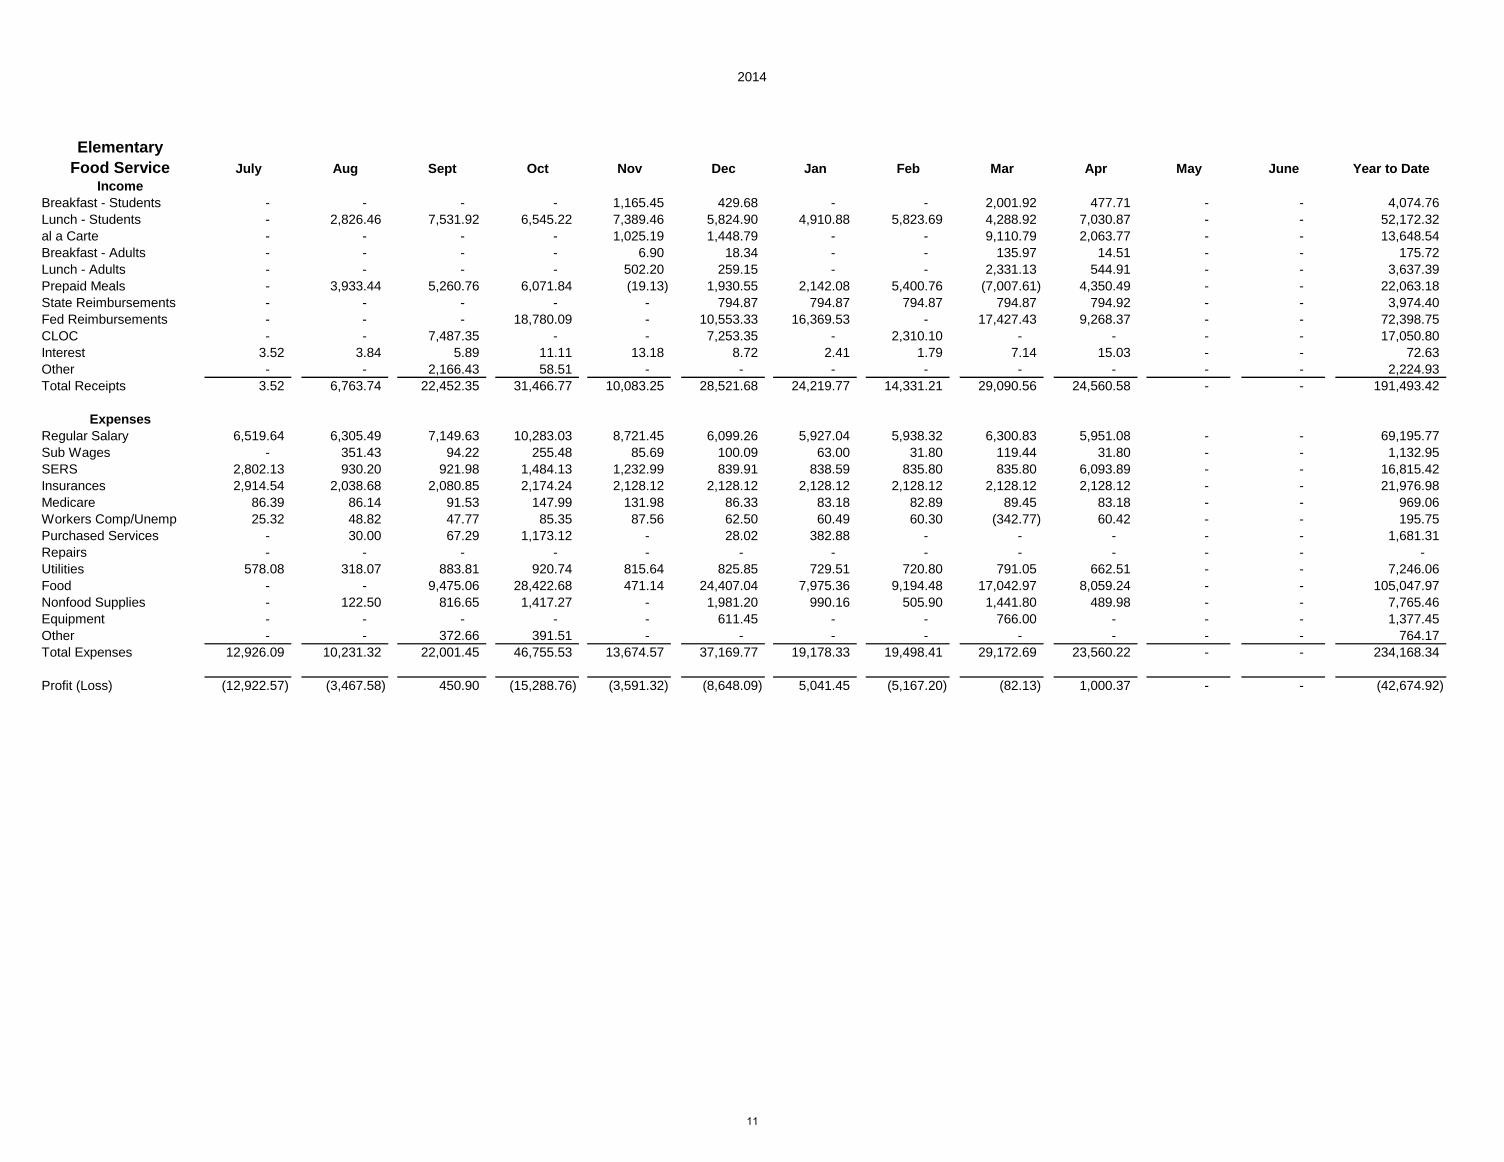
2014
Elementary
Food Service July Aug Sept Oct Nov Dec Jan Feb Mar Apr May June Year to Date
Income
Breakfast - Students - - - - 1,165.45 429.68 - - 2,001.92 477.71 - - 4,074.76
Lunch - Students - 2,826.46 7,531.92 6,545.22 7,389.46 5,824.90 4,910.88 5,823.69 4,288.92 7,030.87 - - 52,172.32
al a Carte - - - - 1,025.19 1,448.79 - - 9,110.79 2,063.77 - - 13,648.54
Breakfast - Adults - - - - 6.90 18.34 - - 135.97 14.51 - - 175.72
Lunch - Adults - - - - 502.20 259.15 - - 2,331.13 544.91 - - 3,637.39
Prepaid Meals - 3,933.44 5,260.76 6,071.84 (19.13) 1,930.55 2,142.08 5,400.76 (7,007.61) 4,350.49 - - 22,063.18
State Reimbursements - - - - - 794.87 794.87 794.87 794.87 794.92 - - 3,974.40
Fed Reimbursements - - - 18,780.09 - 10,553.33 16,369.53 - 17,427.43 9,268.37 - - 72,398.75
CLOC - - 7,487.35 - - 7,253.35 - 2,310.10 - - - - 17,050.80
Interest 3.52 3.84 5.89 11.11 13.18 8.72 2.41 1.79 7.14 15.03 - - 72.63
Other - - 2,166.43 58.51 - - - - - - - - 2,224.93
Total Receipts 3.52 6,763.74 22,452.35 31,466.77 10,083.25 28,521.68 24,219.77 14,331.21 29,090.56 24,560.58 - - 191,493.42
Expenses
Regular Salary 6,519.64 6,305.49 7,149.63 10,283.03 8,721.45 6,099.26 5,927.04 5,938.32 6,300.83 5,951.08 - - 69,195.77
Sub Wages - 351.43 94.22 255.48 85.69 100.09 63.00 31.80 119.44 31.80 - - 1,132.95
SERS 2,802.13 930.20 921.98 1,484.13 1,232.99 839.91 838.59 835.80 835.80 6,093.89 - - 16,815.42
Insurances 2,914.54 2,038.68 2,080.85 2,174.24 2,128.12 2,128.12 2,128.12 2,128.12 2,128.12 2,128.12 - - 21,976.98
Medicare 86.39 86.14 91.53 147.99 131.98 86.33 83.18 82.89 89.45 83.18 - - 969.06
Workers Comp/Unemp 25.32 48.82 47.77 85.35 87.56 62.50 60.49 60.30 (342.77) 60.42 - - 195.75
Purchased Services - 30.00 67.29 1,173.12 - 28.02 382.88 - - - - - 1,681.31
Repairs - - - - - - - - - - - - -
Utilities 578.08 318.07 883.81 920.74 815.64 825.85 729.51 720.80 791.05 662.51 - - 7,246.06
Food - - 9,475.06 28,422.68 471.14 24,407.04 7,975.36 9,194.48 17,042.97 8,059.24 - - 105,047.97
Nonfood Supplies - 122.50 816.65 1,417.27 - 1,981.20 990.16 505.90 1,441.80 489.98 - - 7,765.46
Equipment - - - - - 611.45 - - 766.00 - - - 1,377.45
Other - - 372.66 391.51 - - - - - - - - 764.17
Total Expenses 12,926.09 10,231.32 22,001.45 46,755.53 13,674.57 37,169.77 19,178.33 19,498.41 29,172.69 23,560.22 - - 234,168.34
Profit (Loss) (12,922.57) (3,467.58) 450.90 (15,288.76) (3,591.32) (8,648.09) 5,041.45 (5,167.20) (82.13) 1,000.37 - - (42,674.92)
11
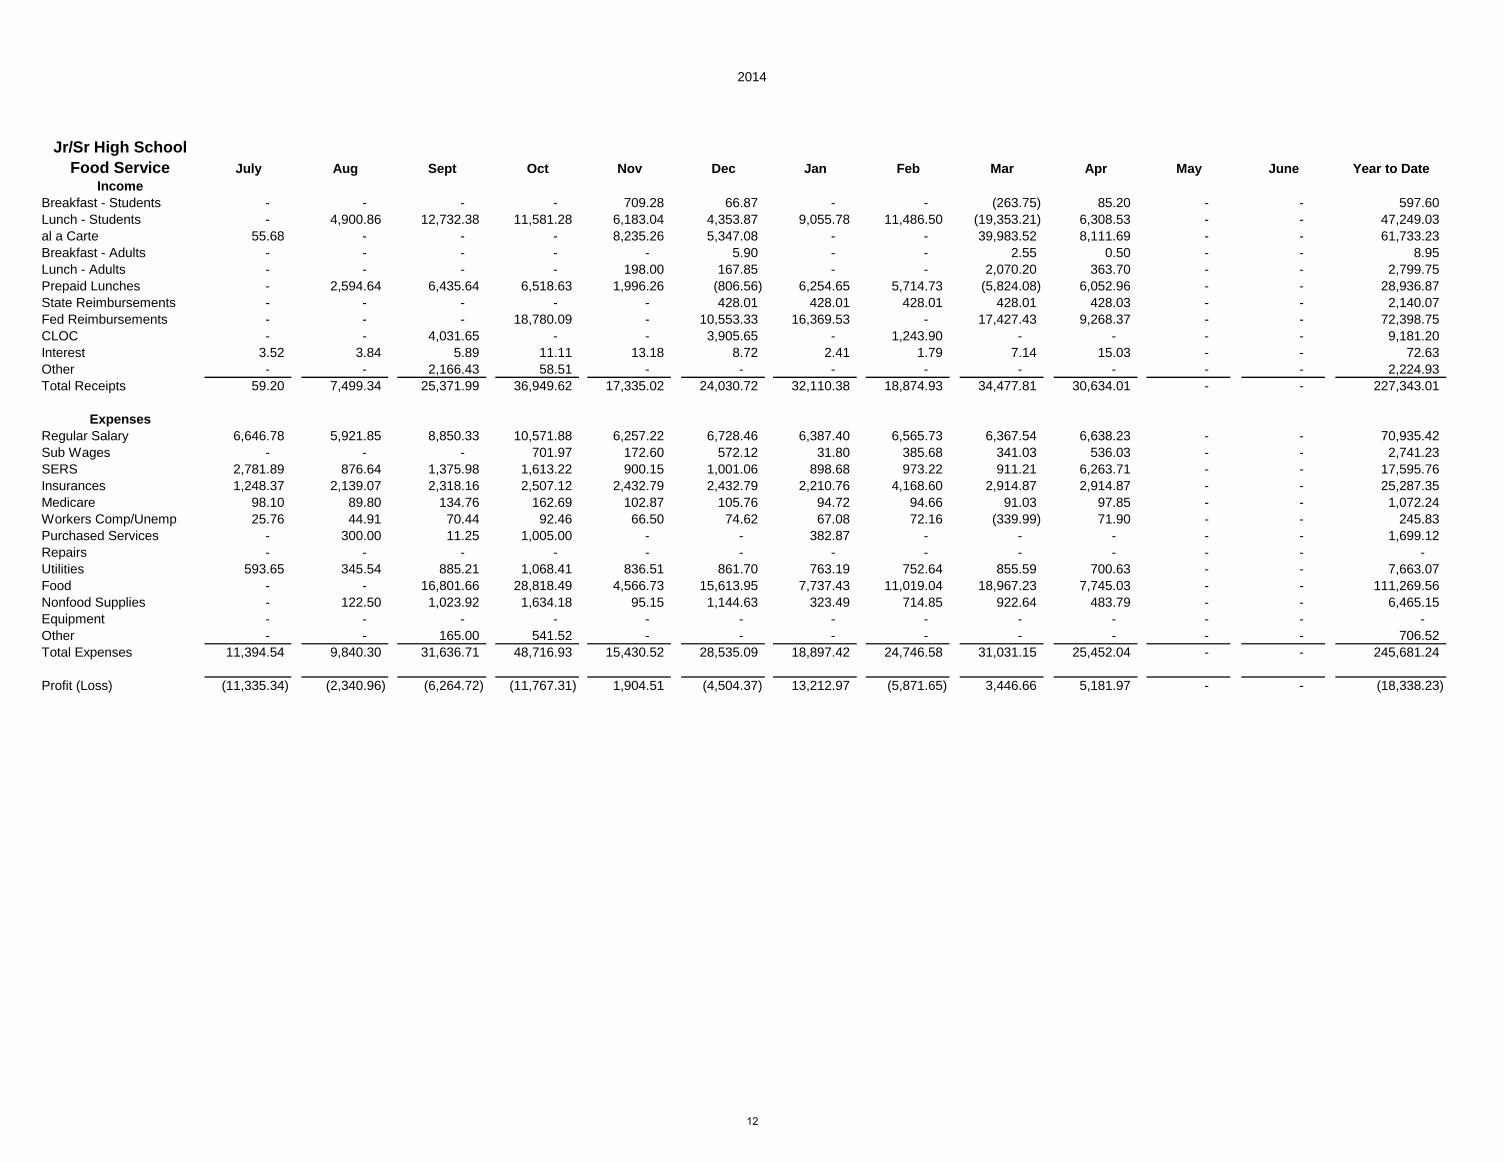
2014
Jr/Sr High School
Food Service July Aug Sept Oct Nov Dec Jan Feb Mar Apr May June Year to Date
Income
Breakfast - Students - - - - 709.28 66.87 - - (263.75) 85.20 - - 597.60
Lunch - Students - 4,900.86 12,732.38 11,581.28 6,183.04 4,353.87 9,055.78 11,486.50 (19,353.21) 6,308.53 - - 47,249.03
al a Carte 55.68 - - - 8,235.26 5,347.08 - - 39,983.52 8,111.69 - - 61,733.23
Breakfast - Adults - - - - - 5.90 - - 2.55 0.50 - - 8.95
Lunch - Adults - - - - 198.00 167.85 - - 2,070.20 363.70 - - 2,799.75
Prepaid Lunches - 2,594.64 6,435.64 6,518.63 1,996.26 (806.56) 6,254.65 5,714.73 (5,824.08) 6,052.96 - - 28,936.87
State Reimbursements - - - - - 428.01 428.01 428.01 428.01 428.03 - - 2,140.07
Fed Reimbursements - - - 18,780.09 - 10,553.33 16,369.53 - 17,427.43 9,268.37 - - 72,398.75
CLOC - - 4,031.65 - - 3,905.65 - 1,243.90 - - - - 9,181.20
Interest 3.52 3.84 5.89 11.11 13.18 8.72 2.41 1.79 7.14 15.03 - - 72.63
Other - - 2,166.43 58.51 - - - - - - - - 2,224.93
Total Receipts 59.20 7,499.34 25,371.99 36,949.62 17,335.02 24,030.72 32,110.38 18,874.93 34,477.81 30,634.01 - - 227,343.01
Expenses
Regular Salary 6,646.78 5,921.85 8,850.33 10,571.88 6,257.22 6,728.46 6,387.40 6,565.73 6,367.54 6,638.23 - - 70,935.42
Sub Wages - - - 701.97 172.60 572.12 31.80 385.68 341.03 536.03 - - 2,741.23
SERS 2,781.89 876.64 1,375.98 1,613.22 900.15 1,001.06 898.68 973.22 911.21 6,263.71 - - 17,595.76
Insurances 1,248.37 2,139.07 2,318.16 2,507.12 2,432.79 2,432.79 2,210.76 4,168.60 2,914.87 2,914.87 - - 25,287.35
Medicare 98.10 89.80 134.76 162.69 102.87 105.76 94.72 94.66 91.03 97.85 - - 1,072.24
Workers Comp/Unemp 25.76 44.91 70.44 92.46 66.50 74.62 67.08 72.16 (339.99) 71.90 - - 245.83
Purchased Services - 300.00 11.25 1,005.00 - - 382.87 - - - - - 1,699.12
Repairs - - - - - - - - - - - - -
Utilities 593.65 345.54 885.21 1,068.41 836.51 861.70 763.19 752.64 855.59 700.63 - - 7,663.07
Food - - 16,801.66 28,818.49 4,566.73 15,613.95 7,737.43 11,019.04 18,967.23 7,745.03 - - 111,269.56
Nonfood Supplies - 122.50 1,023.92 1,634.18 95.15 1,144.63 323.49 714.85 922.64 483.79 - - 6,465.15
Equipment - - - - - - - - - - - - -
Other - - 165.00 541.52 - - - - - - - - 706.52
Total Expenses 11,394.54 9,840.30 31,636.71 48,716.93 15,430.52 28,535.09 18,897.42 24,746.58 31,031.15 25,452.04 - - 245,681.24
Profit (Loss) (11,335.34) (2,340.96) (6,264.72) (11,767.31) 1,904.51 (4,504.37) 13,212.97 (5,871.65) 3,446.66 5,181.97 - - (18,338.23)
12
2014
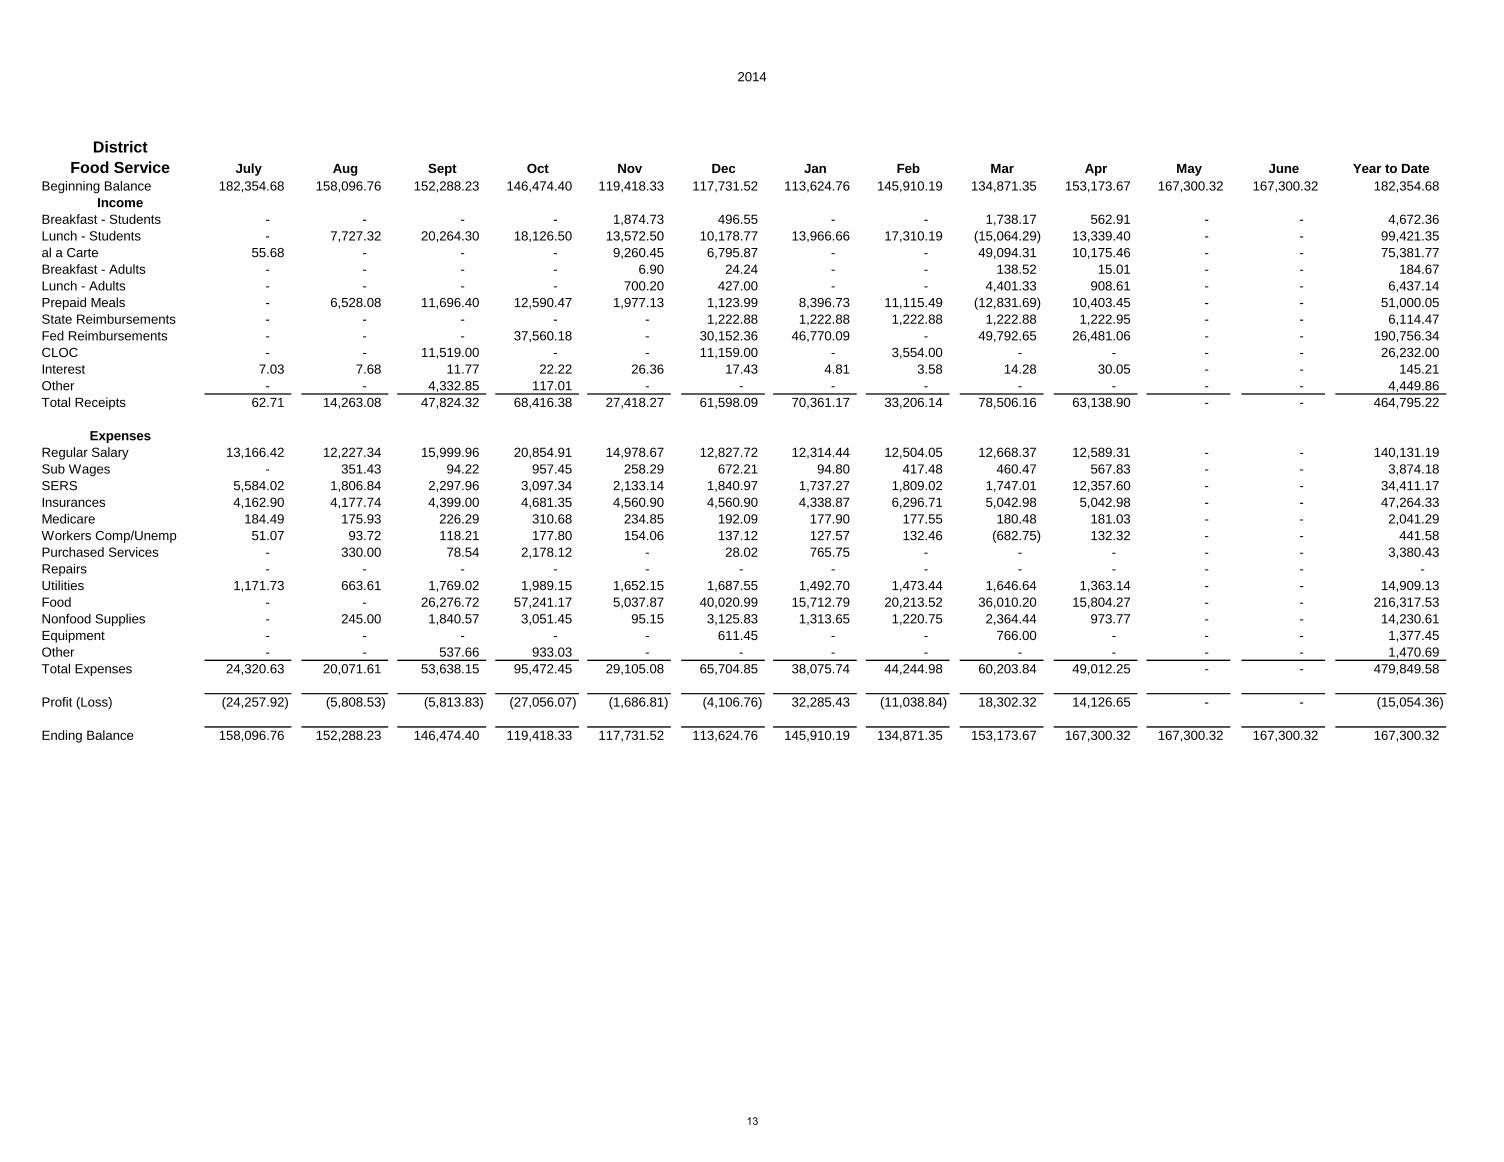
District
Food Service July Aug Sept Oct Nov Dec Jan Feb Mar Apr May June Year to Date
Beginning Balance 182,354.68 158,096.76 152,288.23 146,474.40 119,418.33 117,731.52 113,624.76 145,910.19 134,871.35 153,173.67 167,300.32 167,300.32 182,354.68
Income
Breakfast - Students - - - - 1,874.73 496.55 - - 1,738.17 562.91 - - 4,672.36
Lunch - Students - 7,727.32 20,264.30 18,126.50 13,572.50 10,178.77 13,966.66 17,310.19 (15,064.29) 13,339.40 - - 99,421.35
al a Carte 55.68 - - - 9,260.45 6,795.87 - - 49,094.31 10,175.46 - - 75,381.77
Breakfast - Adults - - - - 6.90 24.24 - - 138.52 15.01 - - 184.67
Lunch - Adults - - - - 700.20 427.00 - - 4,401.33 908.61 - - 6,437.14
Prepaid Meals - 6,528.08 11,696.40 12,590.47 1,977.13 1,123.99 8,396.73 11,115.49 (12,831.69) 10,403.45 - - 51,000.05
State Reimbursements - - - - - 1,222.88 1,222.88 1,222.88 1,222.88 1,222.95 - - 6,114.47
Fed Reimbursements - - - 37,560.18 - 30,152.36 46,770.09 - 49,792.65 26,481.06 - - 190,756.34
CLOC - - 11,519.00 - - 11,159.00 - 3,554.00 - - - - 26,232.00
Interest 7.03 7.68 11.77 22.22 26.36 17.43 4.81 3.58 14.28 30.05 - - 145.21
Other - - 4,332.85 117.01 - - - - - - - - 4,449.86
Total Receipts 62.71 14,263.08 47,824.32 68,416.38 27,418.27 61,598.09 70,361.17 33,206.14 78,506.16 63,138.90 - - 464,795.22
Expenses
Regular Salary 13,166.42 12,227.34 15,999.96 20,854.91 14,978.67 12,827.72 12,314.44 12,504.05 12,668.37 12,589.31 - - 140,131.19
Sub Wages - 351.43 94.22 957.45 258.29 672.21 94.80 417.48 460.47 567.83 - - 3,874.18
SERS 5,584.02 1,806.84 2,297.96 3,097.34 2,133.14 1,840.97 1,737.27 1,809.02 1,747.01 12,357.60 - - 34,411.17
Insurances 4,162.90 4,177.74 4,399.00 4,681.35 4,560.90 4,560.90 4,338.87 6,296.71 5,042.98 5,042.98 - - 47,264.33
Medicare 184.49 175.93 226.29 310.68 234.85 192.09 177.90 177.55 180.48 181.03 - - 2,041.29
Workers Comp/Unemp 51.07 93.72 118.21 177.80 154.06 137.12 127.57 132.46 (682.75) 132.32 - - 441.58
Purchased Services - 330.00 78.54 2,178.12 - 28.02 765.75 - - - - - 3,380.43
Repairs - - - - - - - - - - - - -
Utilities 1,171.73 663.61 1,769.02 1,989.15 1,652.15 1,687.55 1,492.70 1,473.44 1,646.64 1,363.14 - - 14,909.13
Food - - 26,276.72 57,241.17 5,037.87 40,020.99 15,712.79 20,213.52 36,010.20 15,804.27 - - 216,317.53
Nonfood Supplies - 245.00 1,840.57 3,051.45 95.15 3,125.83 1,313.65 1,220.75 2,364.44 973.77 - - 14,230.61
Equipment - - - - - 611.45 - - 766.00 - - - 1,377.45
Other - - 537.66 933.03 - - - - - - - - 1,470.69
Total Expenses 24,320.63 20,071.61 53,638.15 95,472.45 29,105.08 65,704.85 38,075.74 44,244.98 60,203.84 49,012.25 - - 479,849.58
Profit (Loss) (24,257.92) (5,808.53) (5,813.83) (27,056.07) (1,686.81) (4,106.76) 32,285.43 (11,038.84) 18,302.32 14,126.65 - - (15,054.36)
Ending Balance 158,096.76 152,288.23 146,474.40 119,418.33 117,731.52 113,624.76 145,910.19 134,871.35 153,173.67 167,300.32 167,300.32 167,300.32 167,300.32
13
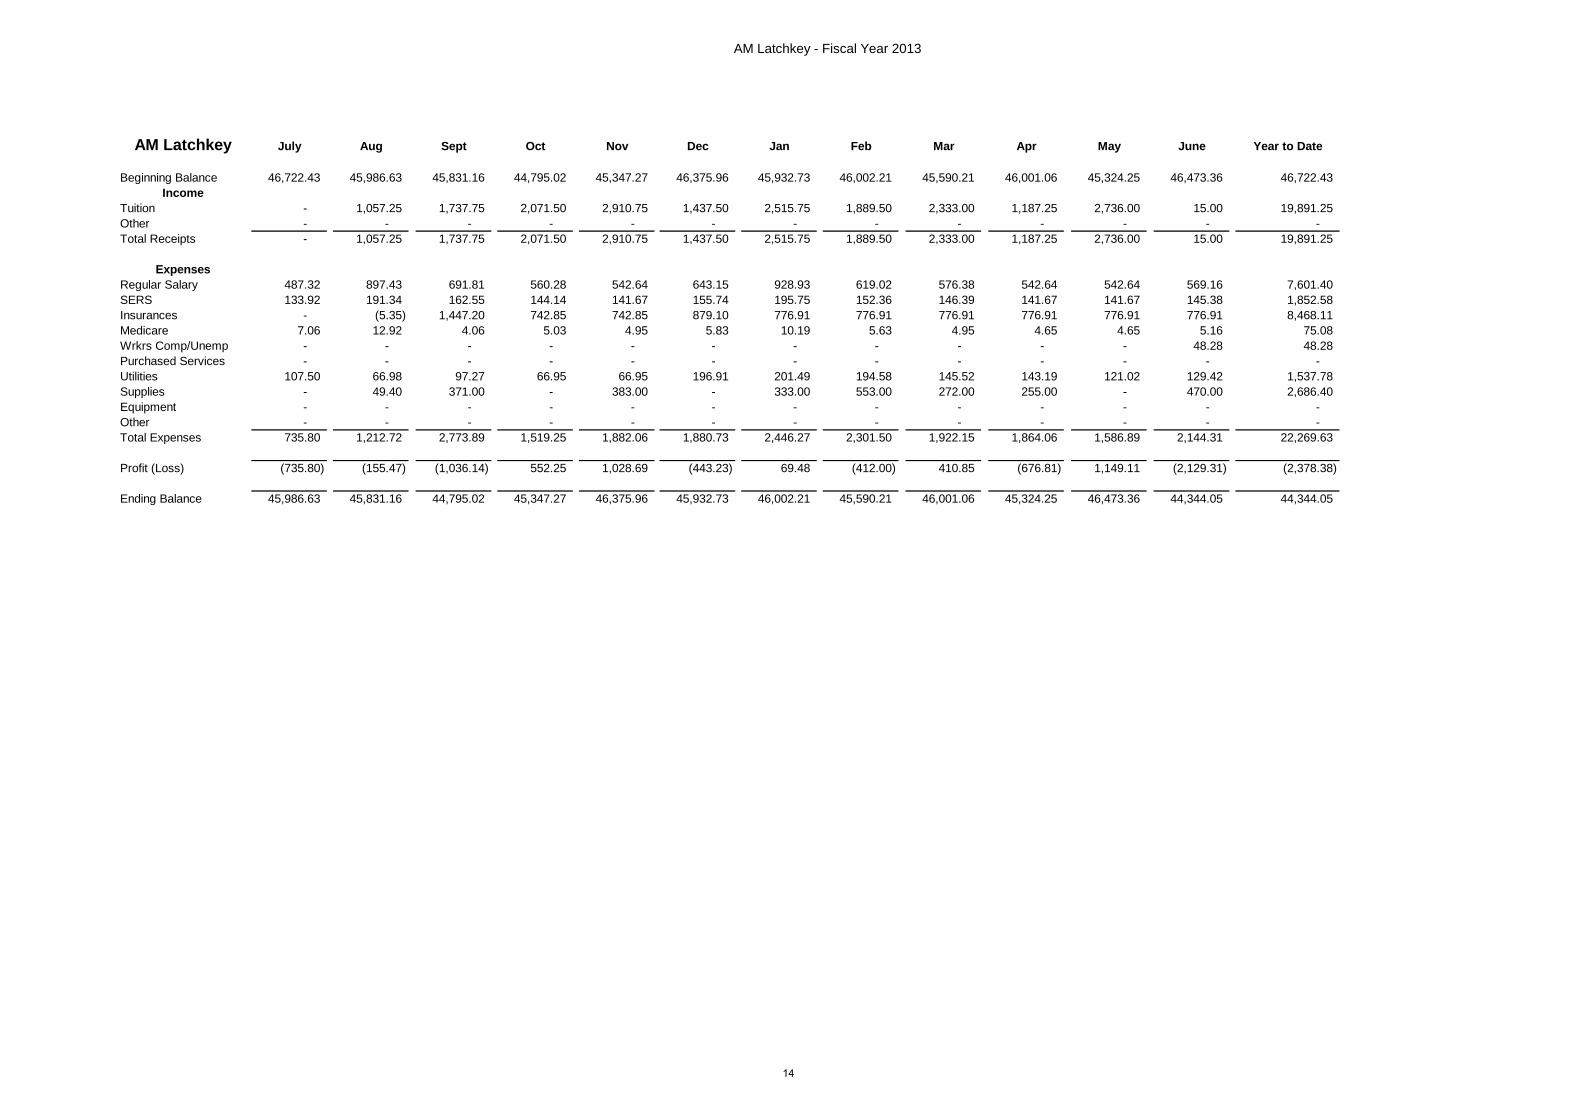
AM Latchkey - Fiscal Year 2013
AM Latchkey July Aug Sept Oct Nov Dec Jan Feb Mar Apr May June Year to Date
Beginning Balance 46,722.43 45,986.63 45,831.16 44,795.02 45,347.27 46,375.96 45,932.73 46,002.21 45,590.21 46,001.06 45,324.25 46,473.36 46,722.43
Income
Tuition - 1,057.25 1,737.75 2,071.50 2,910.75 1,437.50 2,515.75 1,889.50 2,333.00 1,187.25 2,736.00 15.00 19,891.25
Other - - - - - - - - - - - - -
Total Receipts - 1,057.25 1,737.75 2,071.50 2,910.75 1,437.50 2,515.75 1,889.50 2,333.00 1,187.25 2,736.00 15.00 19,891.25
Expenses
Regular Salary 487.32 897.43 691.81 560.28 542.64 643.15 928.93 619.02 576.38 542.64 542.64 569.16 7,601.40
SERS 133.92 191.34 162.55 144.14 141.67 155.74 195.75 152.36 146.39 141.67 141.67 145.38 1,852.58
Insurances - (5.35) 1,447.20 742.85 742.85 879.10 776.91 776.91 776.91 776.91 776.91 776.91 8,468.11
Medicare 7.06 12.92 4.06 5.03 4.95 5.83 10.19 5.63 4.95 4.65 4.65 5.16 75.08
Wrkrs Comp/Unemp - - - - - - - - - - - 48.28 48.28
Purchased Services - - - - - - - - - - - - -
Utilities 107.50 66.98 97.27 66.95 66.95 196.91 201.49 194.58 145.52 143.19 121.02 129.42 1,537.78
Supplies - 49.40 371.00 - 383.00 - 333.00 553.00 272.00 255.00 - 470.00 2,686.40
Equipment - - - - - - - - - - - - -
Other - - - - - - - - - - - - -
Total Expenses 735.80 1,212.72 2,773.89 1,519.25 1,882.06 1,880.73 2,446.27 2,301.50 1,922.15 1,864.06 1,586.89 2,144.31 22,269.63
Profit (Loss) (735.80) (155.47) (1,036.14) 552.25 1,028.69 (443.23) 69.48 (412.00) 410.85 (676.81) 1,149.11 (2,129.31) (2,378.38)
Ending Balance 45,986.63 45,831.16 44,795.02 45,347.27 46,375.96 45,932.73 46,002.21 45,590.21 46,001.06 45,324.25 46,473.36 44,344.05 44,344.05
14
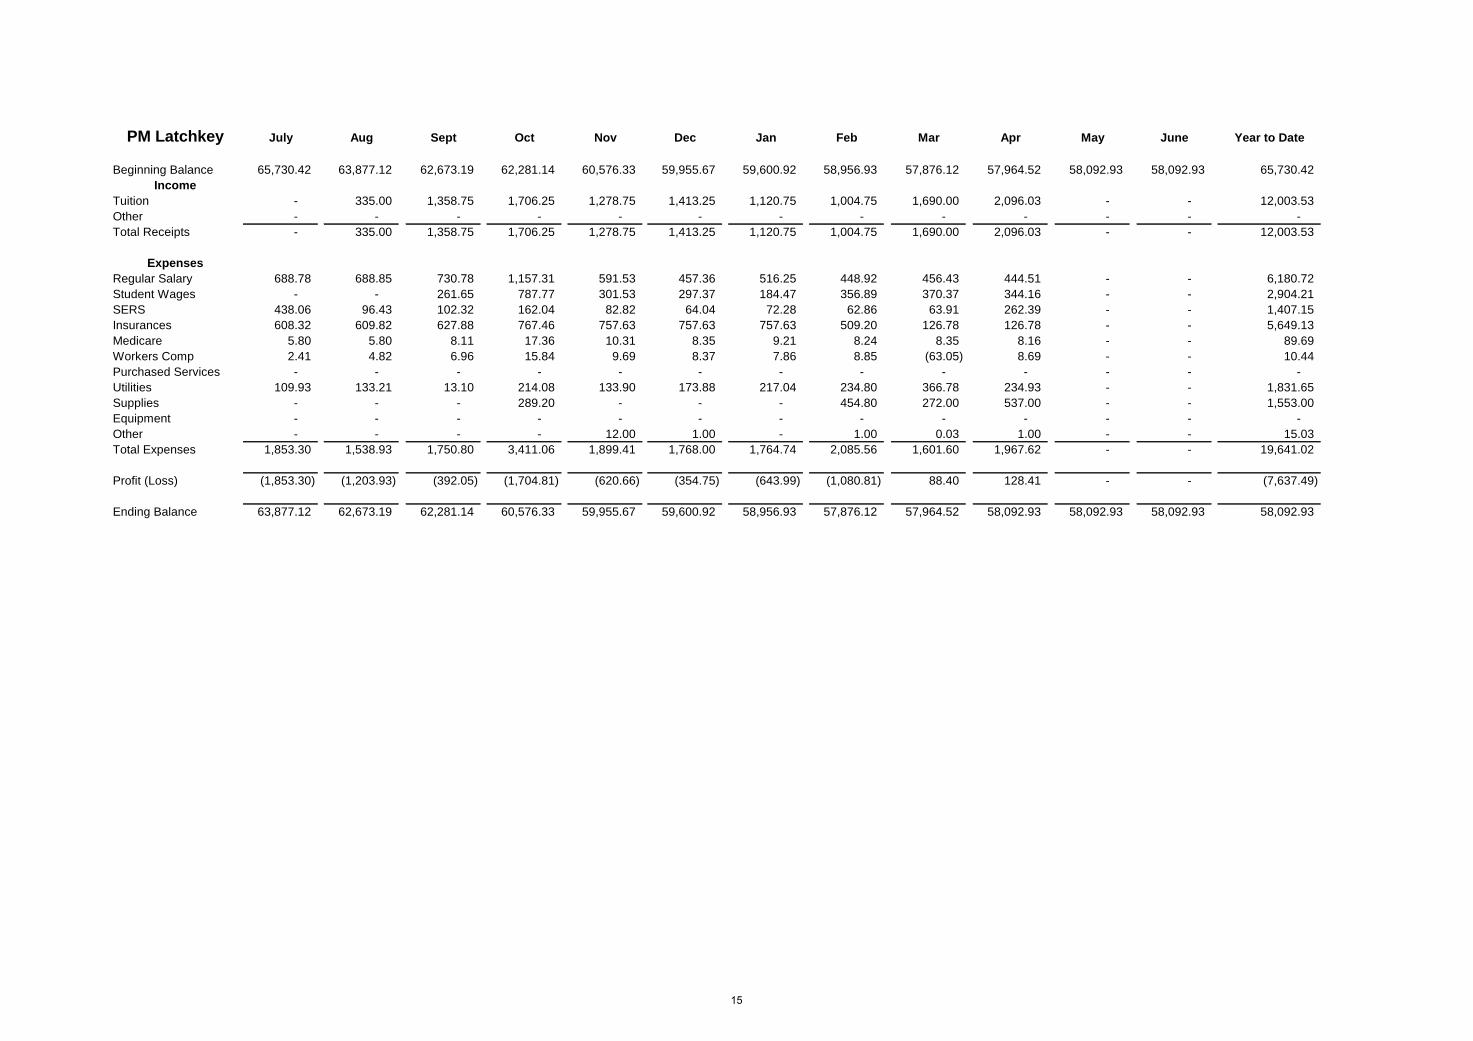
PM Latchkey July Aug Sept Oct Nov Dec Jan Feb Mar Apr May June Year to Date
Beginning Balance 65,730.42 63,877.12 62,673.19 62,281.14 60,576.33 59,955.67 59,600.92 58,956.93 57,876.12 57,964.52 58,092.93 58,092.93 65,730.42
Income
Tuition - 335.00 1,358.75 1,706.25 1,278.75 1,413.25 1,120.75 1,004.75 1,690.00 2,096.03 - - 12,003.53
Other - - - - - - - - - - - - -
Total Receipts - 335.00 1,358.75 1,706.25 1,278.75 1,413.25 1,120.75 1,004.75 1,690.00 2,096.03 - - 12,003.53
Expenses
Regular Salary 688.78 688.85 730.78 1,157.31 591.53 457.36 516.25 448.92 456.43 444.51 - - 6,180.72
Student Wages - - 261.65 787.77 301.53 297.37 184.47 356.89 370.37 344.16 - - 2,904.21
SERS 438.06 96.43 102.32 162.04 82.82 64.04 72.28 62.86 63.91 262.39 - - 1,407.15
Insurances 608.32 609.82 627.88 767.46 757.63 757.63 757.63 509.20 126.78 126.78 - - 5,649.13
Medicare 5.80 5.80 8.11 17.36 10.31 8.35 9.21 8.24 8.35 8.16 - - 89.69
Workers Comp 2.41 4.82 6.96 15.84 9.69 8.37 7.86 8.85 (63.05) 8.69 - - 10.44
Purchased Services - - - - - - - - - - - - -
Utilities 109.93 133.21 13.10 214.08 133.90 173.88 217.04 234.80 366.78 234.93 - - 1,831.65
Supplies - - - 289.20 - - - 454.80 272.00 537.00 - - 1,553.00
Equipment - - - - - - - - - - - - -
Other - - - - 12.00 1.00 - 1.00 0.03 1.00 - - 15.03
Total Expenses 1,853.30 1,538.93 1,750.80 3,411.06 1,899.41 1,768.00 1,764.74 2,085.56 1,601.60 1,967.62 - - 19,641.02
Profit (Loss) (1,853.30) (1,203.93) (392.05) (1,704.81) (620.66) (354.75) (643.99) (1,080.81) 88.40 128.41 - - (7,637.49)
Ending Balance 63,877.12 62,673.19 62,281.14 60,576.33 59,955.67 59,600.92 58,956.93 57,876.12 57,964.52 58,092.93 58,092.93 58,092.93 58,092.93
15
16
17
18
19
20